Islanding Detection Method Based on Injecting Perturbation Signal and Rate of Change of Output Power in DC Grid-Connected Photovoltaic System


1
Graduate School of Engineering and Science, Shibaura Institute of Technology, Tokyo 135-8548, Japan
2
National Institute of Advanced Industrial Science and Technology (AIST), Ibaraki 305-8560, Japan
3
Department of Electrical Engineering, Shibaura Institute of Technology, Tokyo 135-8548, Japan
*
Author to whom correspondence should be addressed.
Energies 2018, 11(5), 1313; https://doi.org/10.3390/en11051313
Submission received: 19 April 2018
/
Revised: 11 May 2018
/
Accepted: 18 May 2018
/
Published: 21 May 2018
(This article belongs to the Section F: Electrical Engineering)
Abstract
:The emergence of Distributed Generation (DG) in the electric system has brought about the appearance of the islanding phenomenon. In AC networks, there are a lot of Islanding Detection Methods (IDMs) have been studied. However, not too much IDMs in DC networks have been published because of the absence of frequency and reactive power. The hybrid IDM based on injected perturbation signal and rate of change of power output is proposed. This IDM can detect islanding condition not only in the worst case (the power of load and PV are equal) but also in another case (the power of load is greater than the power of PV). It can be applicable to both single and multi-PV operation scenarios. Besides, the effectiveness of the proposed method is verified by simulation in Matlab/Simulink.
1. Introduction
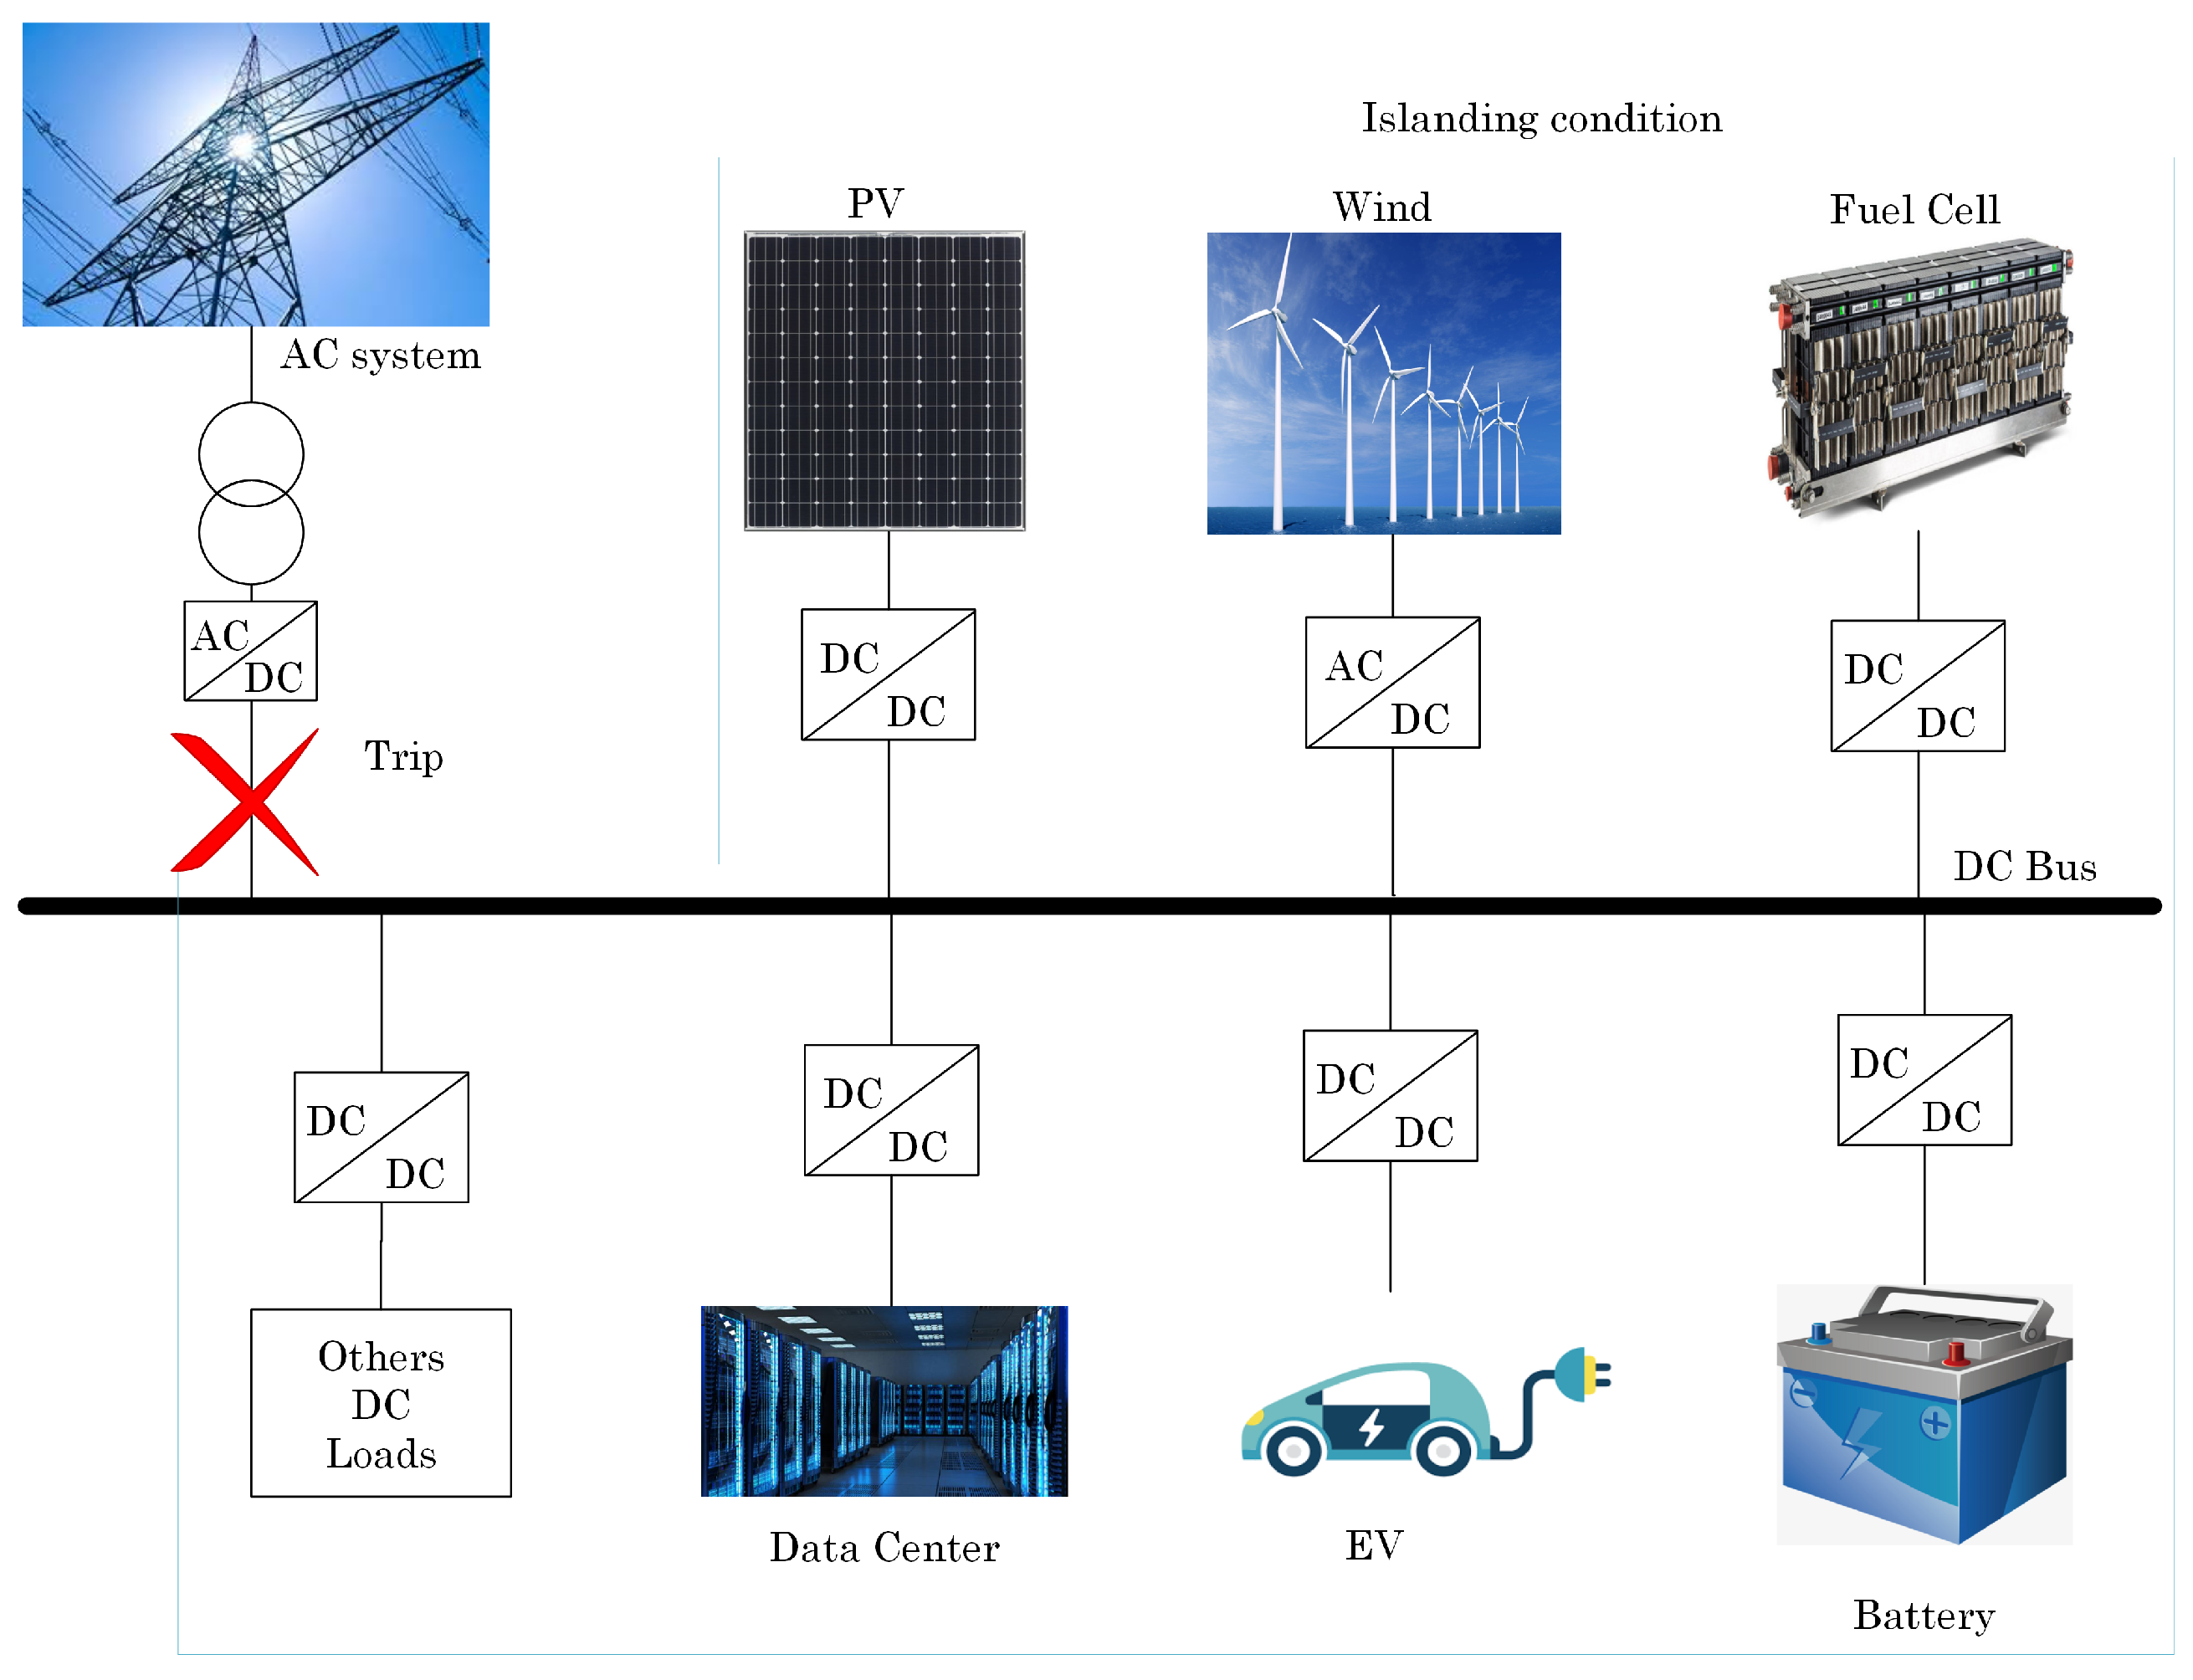
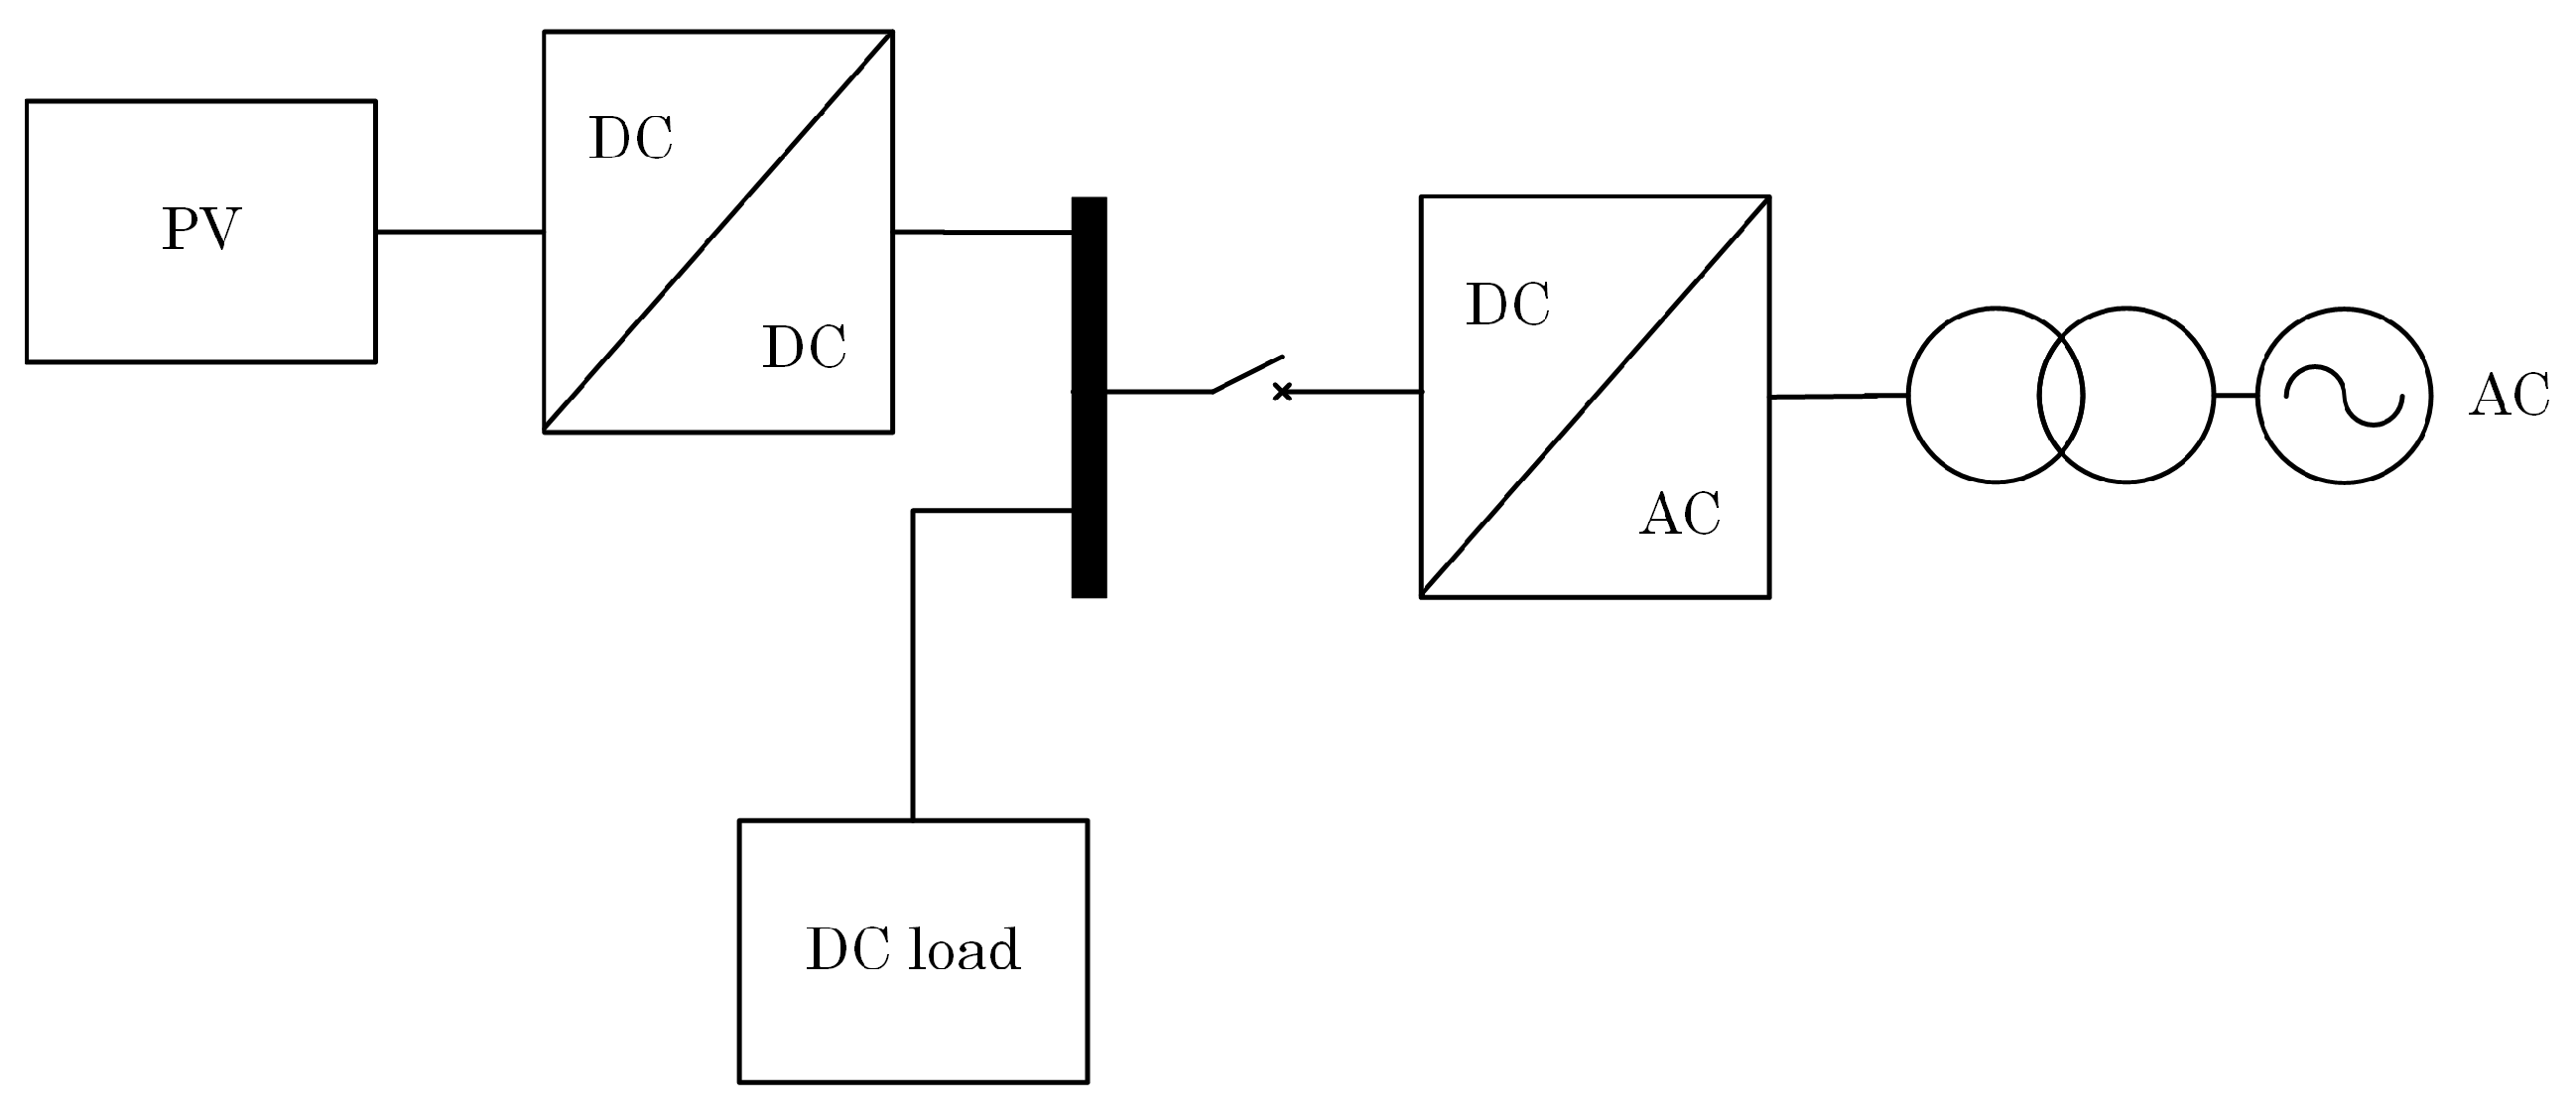
Nowadays, energy faces some serious problems, such as it is one of the reasons causing environmental pollution and the lack of energy when the traditional energies are going exhausted. Therefore, distributed energy resources (the wind, solar, ocean wave, fuel-cell, etc.) and some of them are natively DC which become considerably penetration in power system as a potential solution. Distributed Generations (DGs) have much lower energy density than fossil fuels, and so the generators are smaller and geographically widely spread. All types of power sources connected to the distribution system at a voltage level from 120/230 V to 150 kV [1] are DGs, for example in Figure 1: PV, Wind turbine, fuel-cell, and battery are the DGs. All DGs connect with DC bus and supply to DC loads such as data center, electric vehicles, and others DC loads. Besides, the development of fullness DC as storage technologies (batteries, ultra-capacitors, etc.) and DC loads (Data centers, electronic-based office, home appliances, plug-in electric vehicles, variable speed drives and DC electric arc furnaces) are significantly increased [2].
In addition, DC networks in Figure 1 have some advantages compared with AC networks: (1) Simpler system (easier integration of DC DGs to the common bus, eliminating the need for synchronizing generators); (2) Higher system efficiency, lower losses and voltage drops in lines because of reduction of conversion loss by reducing inverters; (3) More efficient supply of DC loads (Data centers, electric vehicles,electronic-based office, etc.) [3,4,5,6]. For those reasons, DC grid has been increasing significantly in power system.
However, one severe phenomenon frequently occurs in the DG grid is islanding. In Figure 1, when AC grid disconnects, all load are fed by only DGs, so islanding problem occurs.
This issue causes some problems such as:
- Safety: This may confuse the utility workers and expose them to hazards such as electric shocks.
- Damage to load: This may cause severe damage to electrical equipment, appliances and devices. Some devices are more sensitive to voltage fluctuations than others.
- Inverter confusion: : Reclosing onto an active island may confuse the operation of inverters.
- Delay of restoration: If the islanding phenomenon repeatedly occurs in power system, the restoration of the power system from the failure will be delayed because of asynchronous closing.
Due to the absence of the frequency in DC system, the islanding detection methods in DC grid are more complicated than that in AC networks. Together with the development of DGs in power system, DG interconnection protection is becoming more important. In Figure 1, islanding problem occurs when AC system disconnects, DC grid will operate in islanded operation. Therefore, islanding phenomenon becomes one important issue should be solved not only in AC system but also in DC networks. According to the IEEE standard 929–2000, this network must detect the condition issue and disconnect within 2 s at maximum [7]. This standard is necessary to prevent damage to electrical equipment and safety for maintenance staffs. Moreover, with the quick development of DC networks including renewable energy resources, information technology, power electronic technology, semiconductor technology and the requirement of higher power quality, reliability and economy, the islanding detection schemes in DC grid increasingly become necessary. Many islanding detection strategies in AC networks has been proposed in the literature. In recent years, several studies about islanding detection methods in DC system has been conducted.
Among those methods, a very promising IDM was proposed in [8]. This method based on the reflection of frequency and voltage deflections of the AC side on the DC side through the DC-AC converter. That method was tested under various load conditions, load switching, multiple DGs operation, and different load quality factors. However, that IDM was for islanding detection of AC system, not for DC system. Moreover, due to the disturbances of frequency and voltage at AC side affect the DC voltage insignificantly. So that the effectiveness of the method is limited. Also, maximum power point tracking (MPPT) is not discussed in the paper.
The active detection technique, positive feedback islanding methods were proposed in [9]. The technique was introduced to reduce the non-detection zone (NDZ) in a worst case when the power of the load is matched with the power of the DG. The idea of this method is to inject disturbance signal by using an inner loop or outer loop feedback signal in islanded condition. That signal will make the system unstable by using the Routh-Hurwitz stability criterion. The main challenge in this method is how to select a gain that guarantees the DG instability while islanding occurs and keep the DG stability in normal condition. The paper proposed four different methods to realize this technique, comparing and evaluating the performance of this method. Nevertheless, the system under analysis in this paper has only one DG source. In case of multi-DG sources, the challenge of that method becomes more and more difficult.
The active method in [10] based on the insertion of a controllable load, connected in parallel with the DC microgrid central switch. The parameters of the controllable load depend on the characteristics of the measuring component. The IDM was simple and easy to implement. However, that method only applies in case of constant DG source and loads.
In [11], the harmonic injection capability is incorporated into the interleaved flyback inverter for detect islanding condition. This technique is proposed that bypasses the unfolding H-bridge, without affecting the active power generation of the inverter and without requiring any hardware modification. In addition, the anti-islanding technique based on the harmonic injection technique is presented and implemented into the flyback micro-inverter. However, this anti-islanding technique uses in AC grid.
The passive islanding technique in [12] was proposed. The method based on autocorrelation function (ACF) of modal current envelope to extract the transient content. After that, the variation of the ACF is calculated, called criterion variance in the autocorrelation of the modal curent envelope to define between islanding and normal conditions. By using the method, the islanding condition can detect effectively. However, this technique uses in AC grid.
In [13], the active technique is used to detect islanding phenomenon in DC grid. In the paper, a current perturbation was injected to make current imbalance for a certain period at a scheduled frequency and observing the response. In normal condition, the fluctuation of DC voltage is small when the injected current changed. When islanding occurs, the DC voltage will change much more than the normal one. After that, the injected current continuously decreases to increase the DC voltage drop speed. So that, it has a shorter detection time than others IDMs. However, the system under analysis is relatively simple.
This system considered in this paper focuses on PV source with maximum power point tracking (MPPT) connected with DC grid. The proposed method depend on injecting perturbation signal and rate of change of output power is used to detect islanding issue in PV system. According to the proposed method, the islanding problem can detect faster than the others methods. Moreover, this method can cover both hardest and another islanding condition. In addition, this method is testing not only in single but also in multi-PV operation scenarios. The rest of this paper is organized as follows. In Section 2, the islanding detection methods for AC grid are investigated and the difference between islanding detection in AC and DC grid is described. Section 3 explains the DC testing grid and the inject perturbation signal method. In Section 4, the simulation results are described and analyzed. The paper is concluded in the final section.
2. Islanding Detection in AC and DC System
2.1. AC System
Islanding detection in AC network has been studied in many published papers. They can be classified into three groups: Passive, Active and Remote Detection IDMs are shown in Table 1 [14,15,16,17,18].
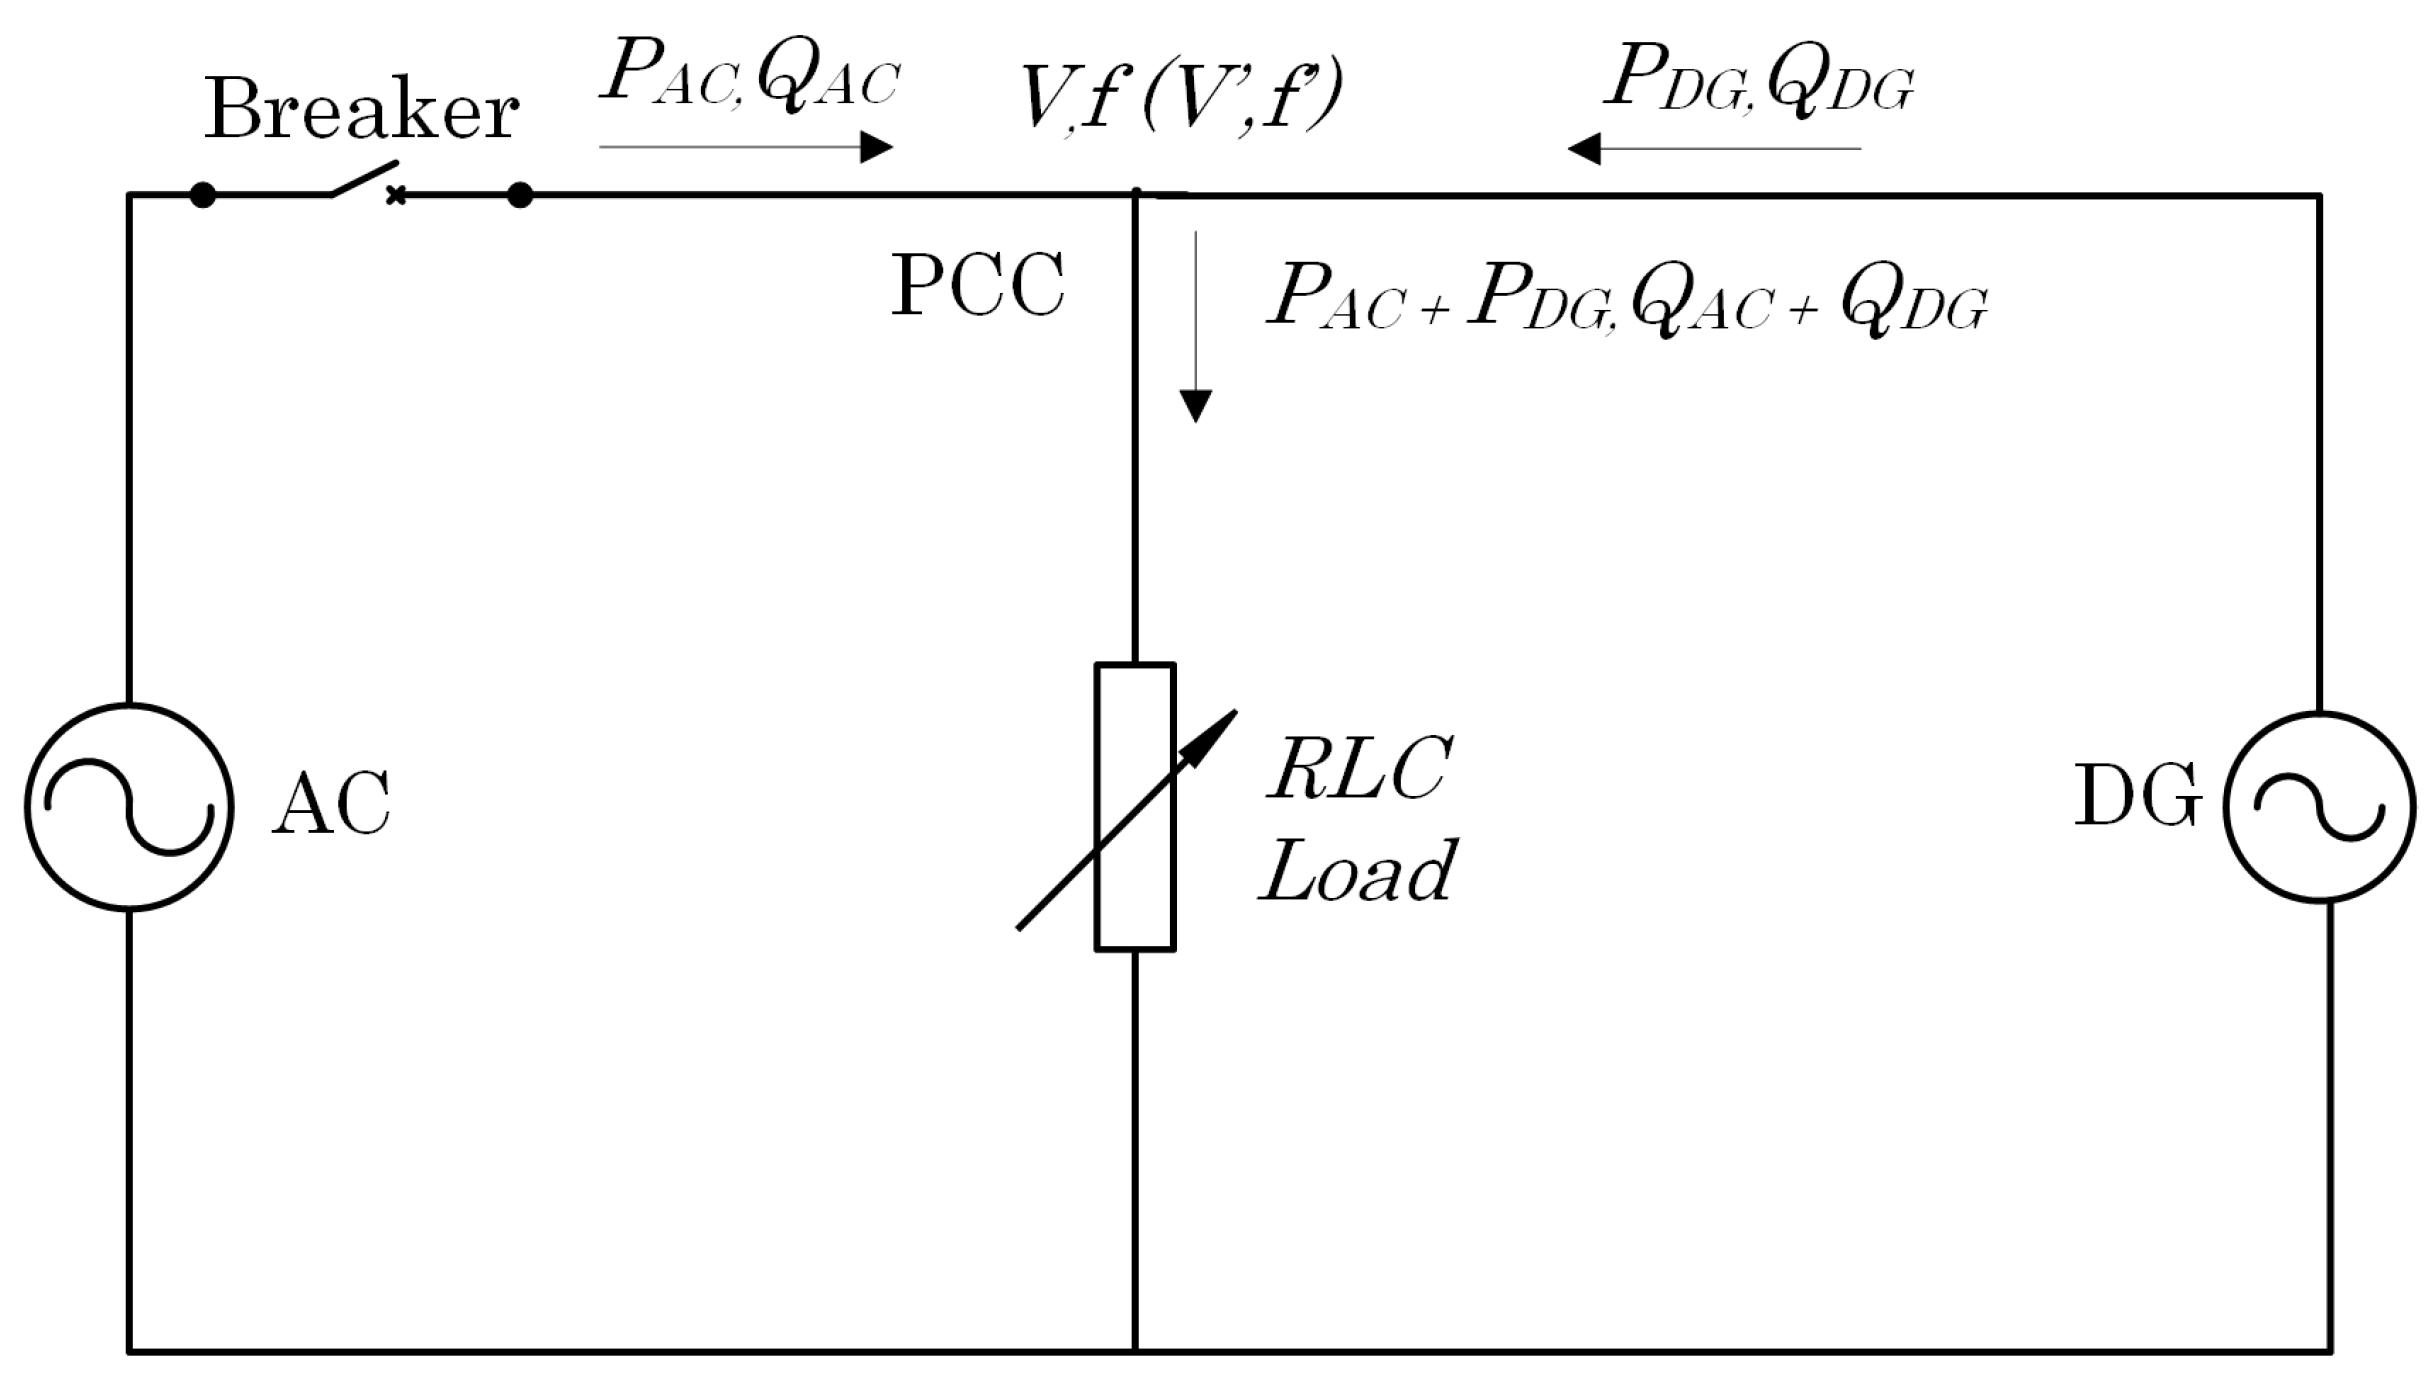
A structure of AC grid in normal and islanding condition is shown in Figure 2. In normal condition, the breaker closes, RLC load is supplied by both DG and AC grid. When the breaker opens, only DG supplies power with the RLC load grid. Assuming the resonant frequency of the RLC load is the same as the grid frequency.
Mathematically, the voltage and frequency at point of common coupling (PCC) can be represented as
where V, f, P, R, C, L are the PCC voltage, PCC frequency, active power, load resistance, load capacitance and load inductance.
In normal condition, load is supplied by both AC grid and DG.
In islanding condition, AC grid is disconnected, only DG supplies the load.
where
- is the active power of DC load.
- is the active power supplied by AC grid.
- is the active DG power.
- is the reactive power of DC load.
- is the reactive power supplied by AC grid.
- is the reactive DG power.
2.2. DC System
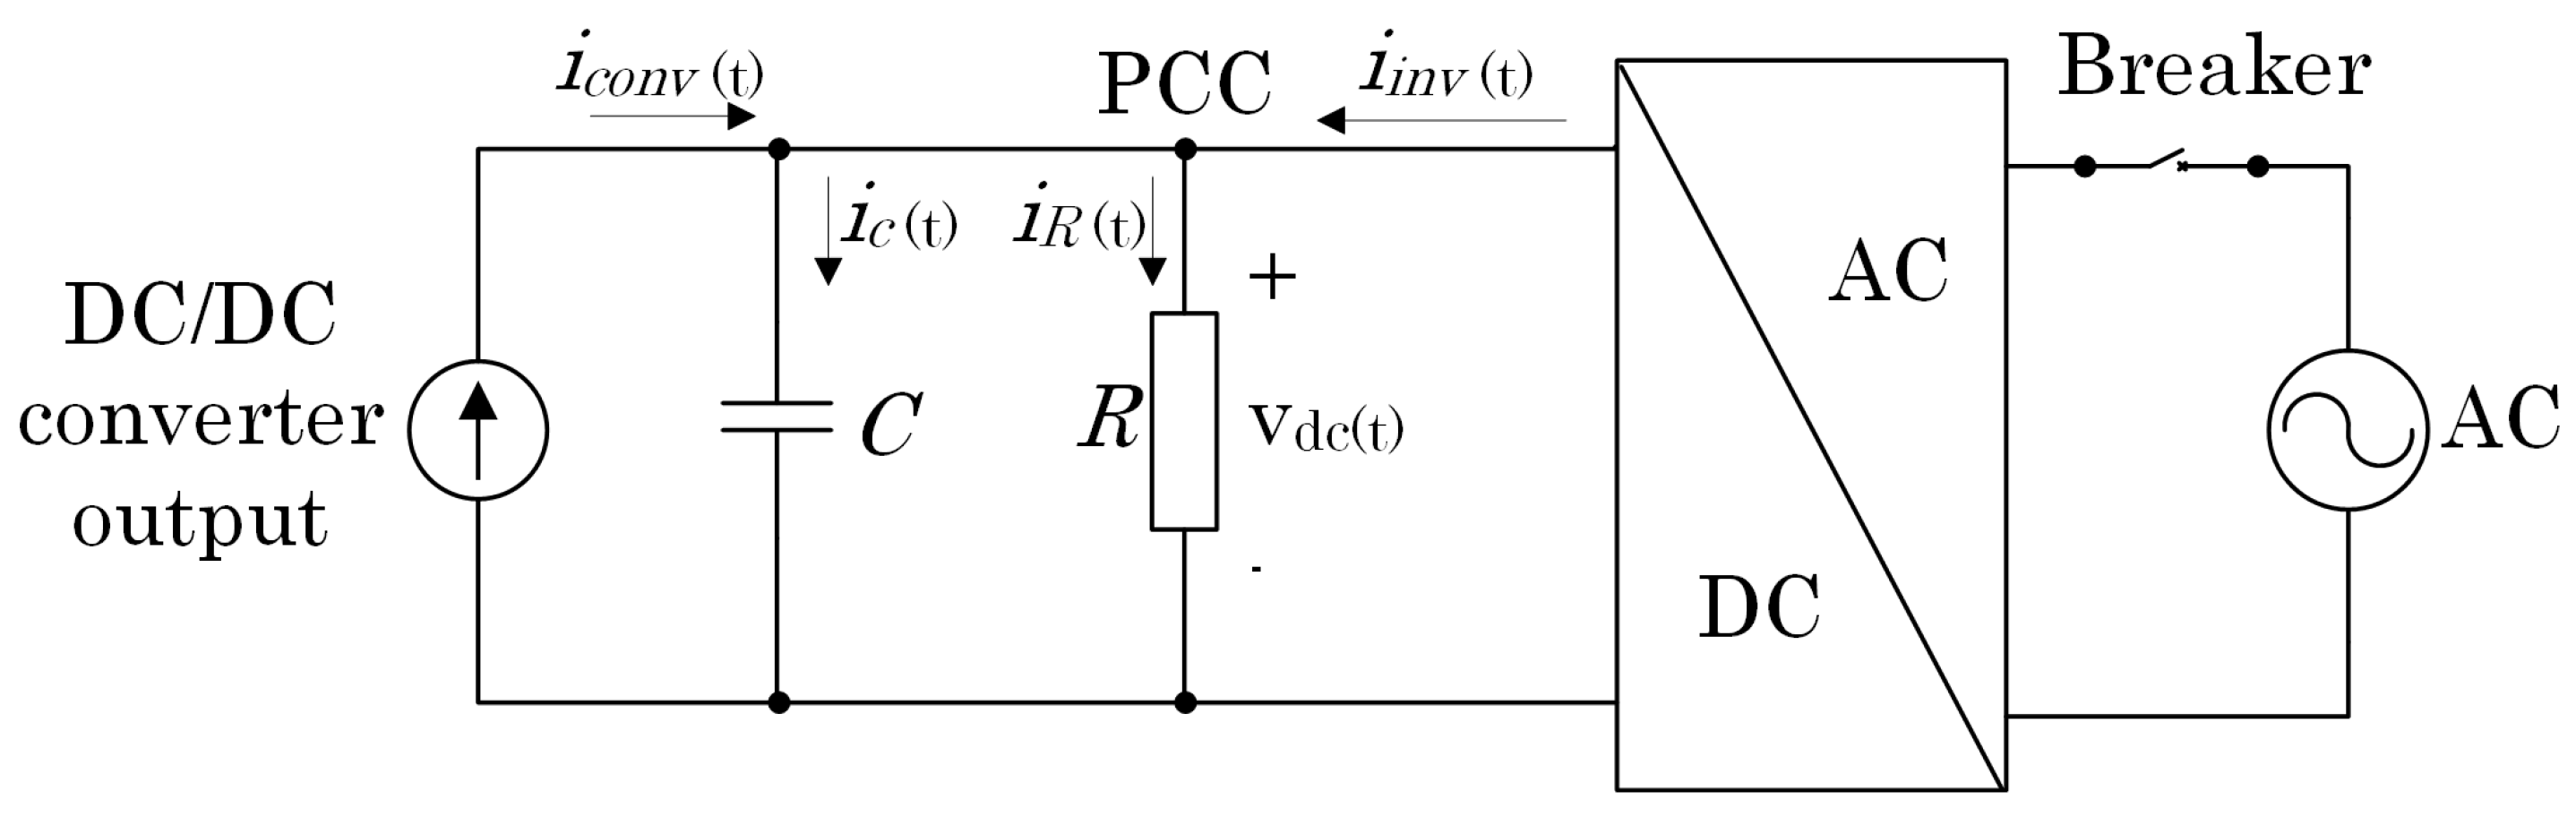
The DC grid model in normal and islanding condition are shown in Figure 3. When the breaker closes, the figure shows normal condition, DC load receives power from both DC and AC system. When islanding occurs, the breaker opens, DC load is supplied by only DC grid.
In normal condition, the load is supplied by both AC and DC grid.
In islanding condition, AC grid is disconnected is:
where
- is the active power of DC load.
- is the active power of DC grid.
- is the active power supplied by AC system.
- V is the DC bus voltage in normal condition.
- is the DC bus voltage in islanding condition.
- R is the DC load resistance.
Due to Equations (7)–(10), in practical conditions, there is always unbalance power because of some power mismatch between the DG and load. Before the islanding, the power mismatch will be supplied by the main grid. After AC grid is disconnected, the power of DC load will be compensated by the DC grid. Different from AC system, only the voltage signal can be used to detect islanding condition due to the absence of the frequency in DC system when the grid is disconnected. Therefore, almost IDMs in AC grid cannot be used to detect islanding condition in DC system.
In next section, the system description and scheme explanation are illustrated.
3. System Description and Proposed Islanding Detection Method (IDM)
3.1. System Description
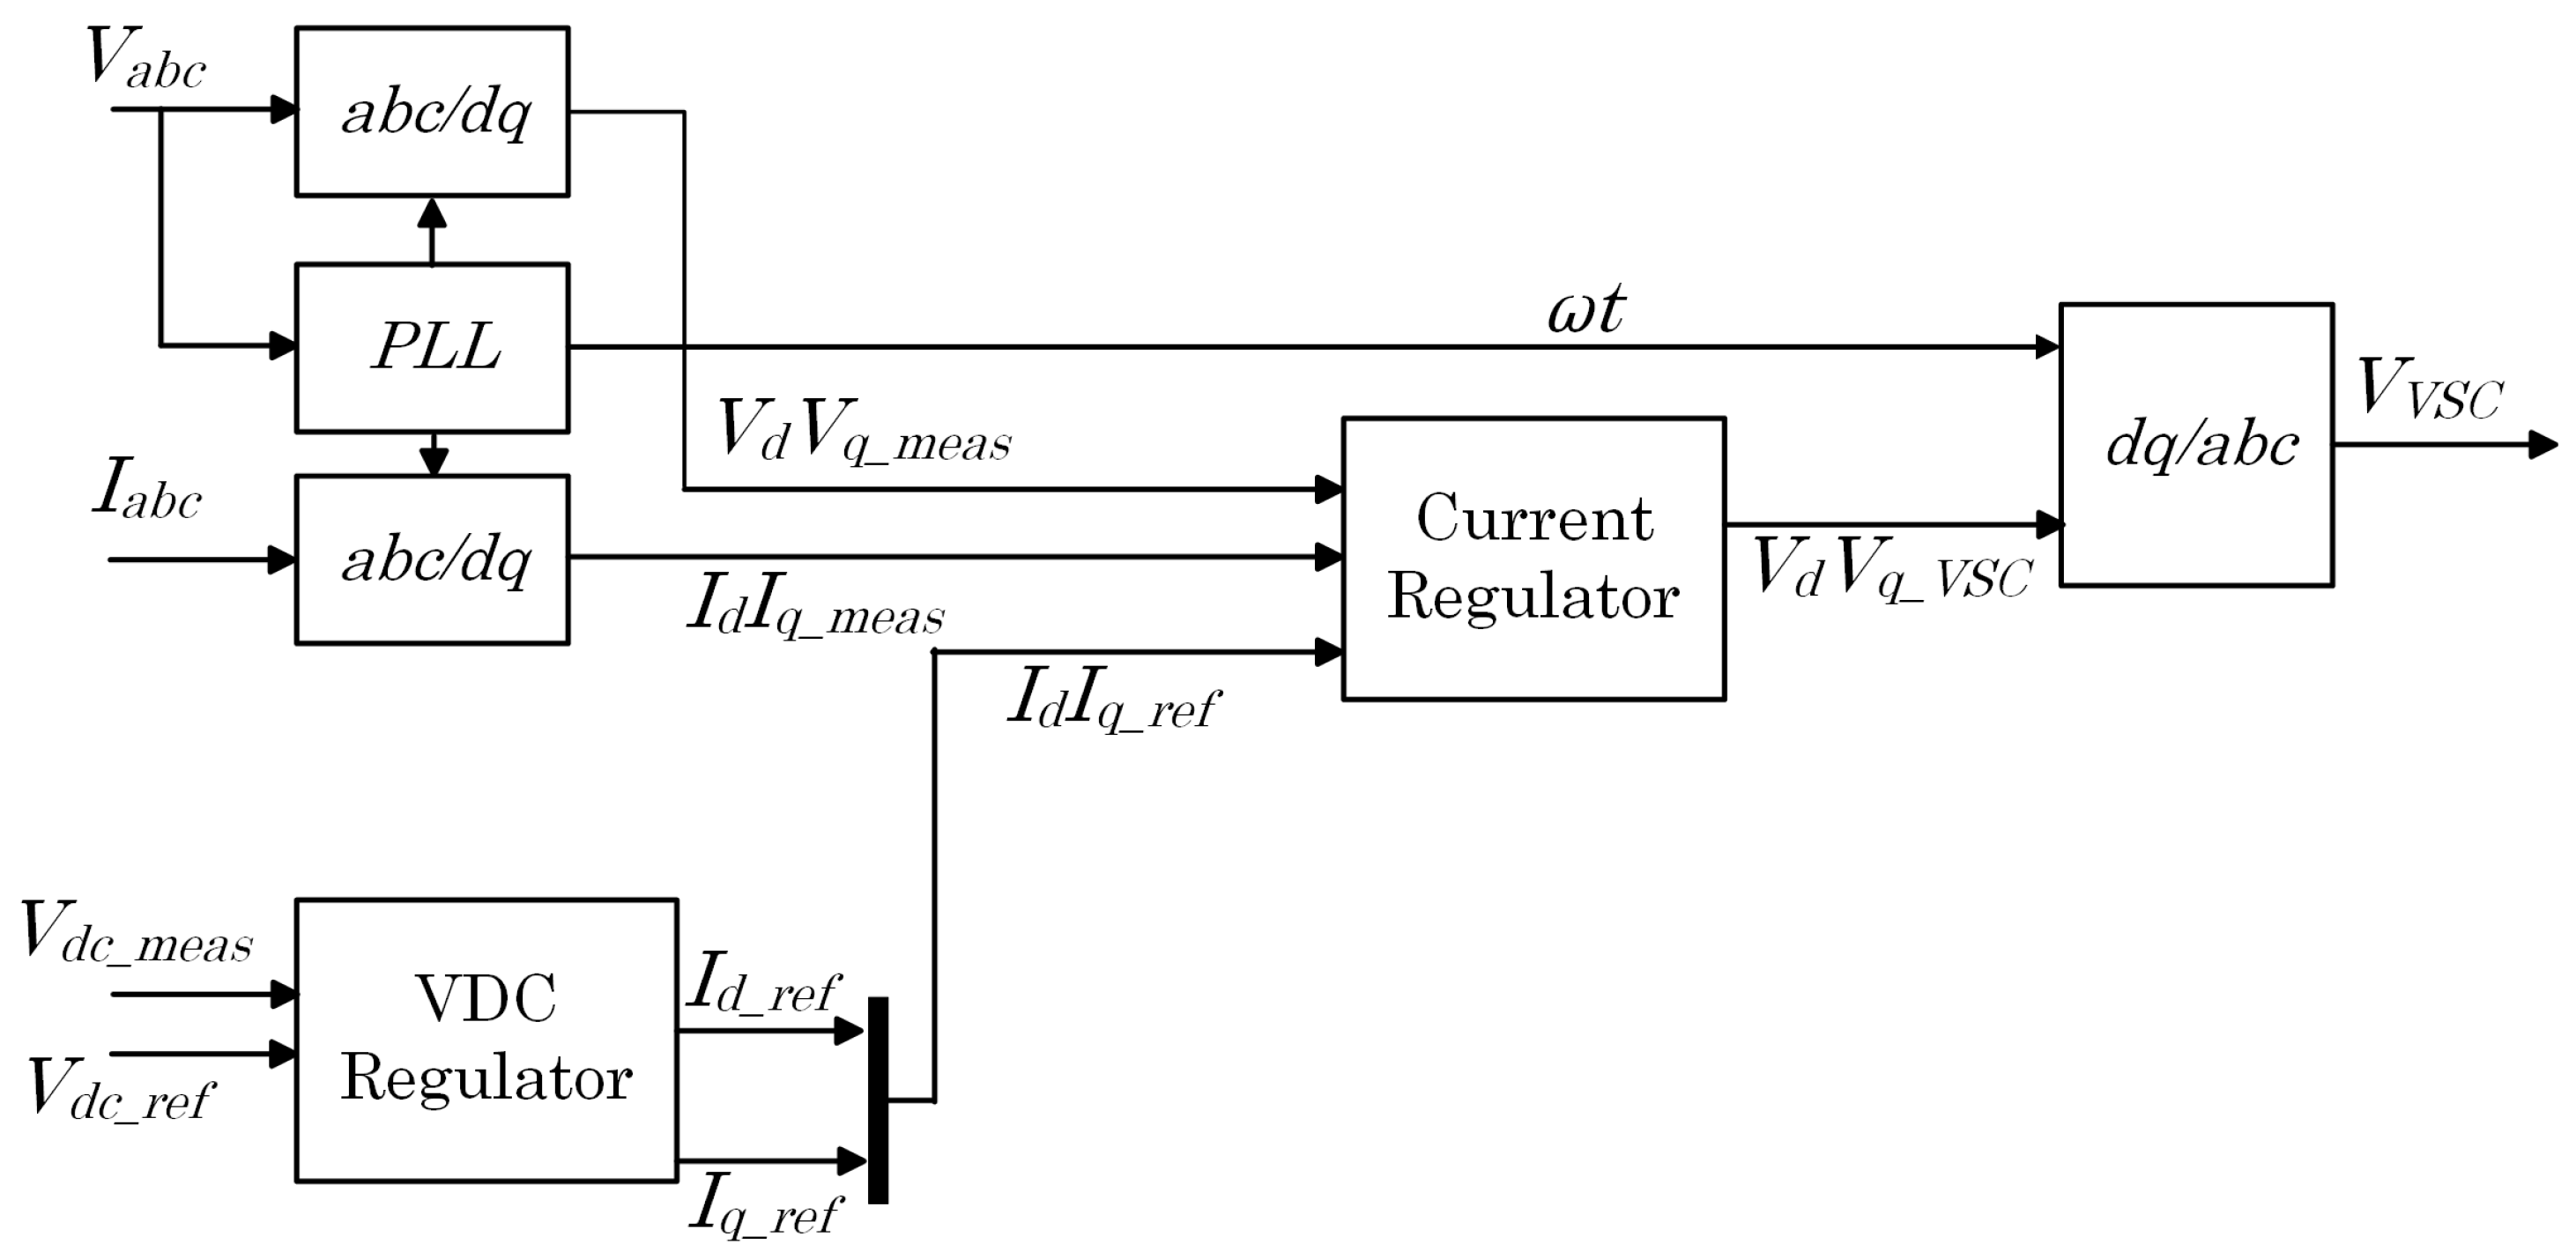
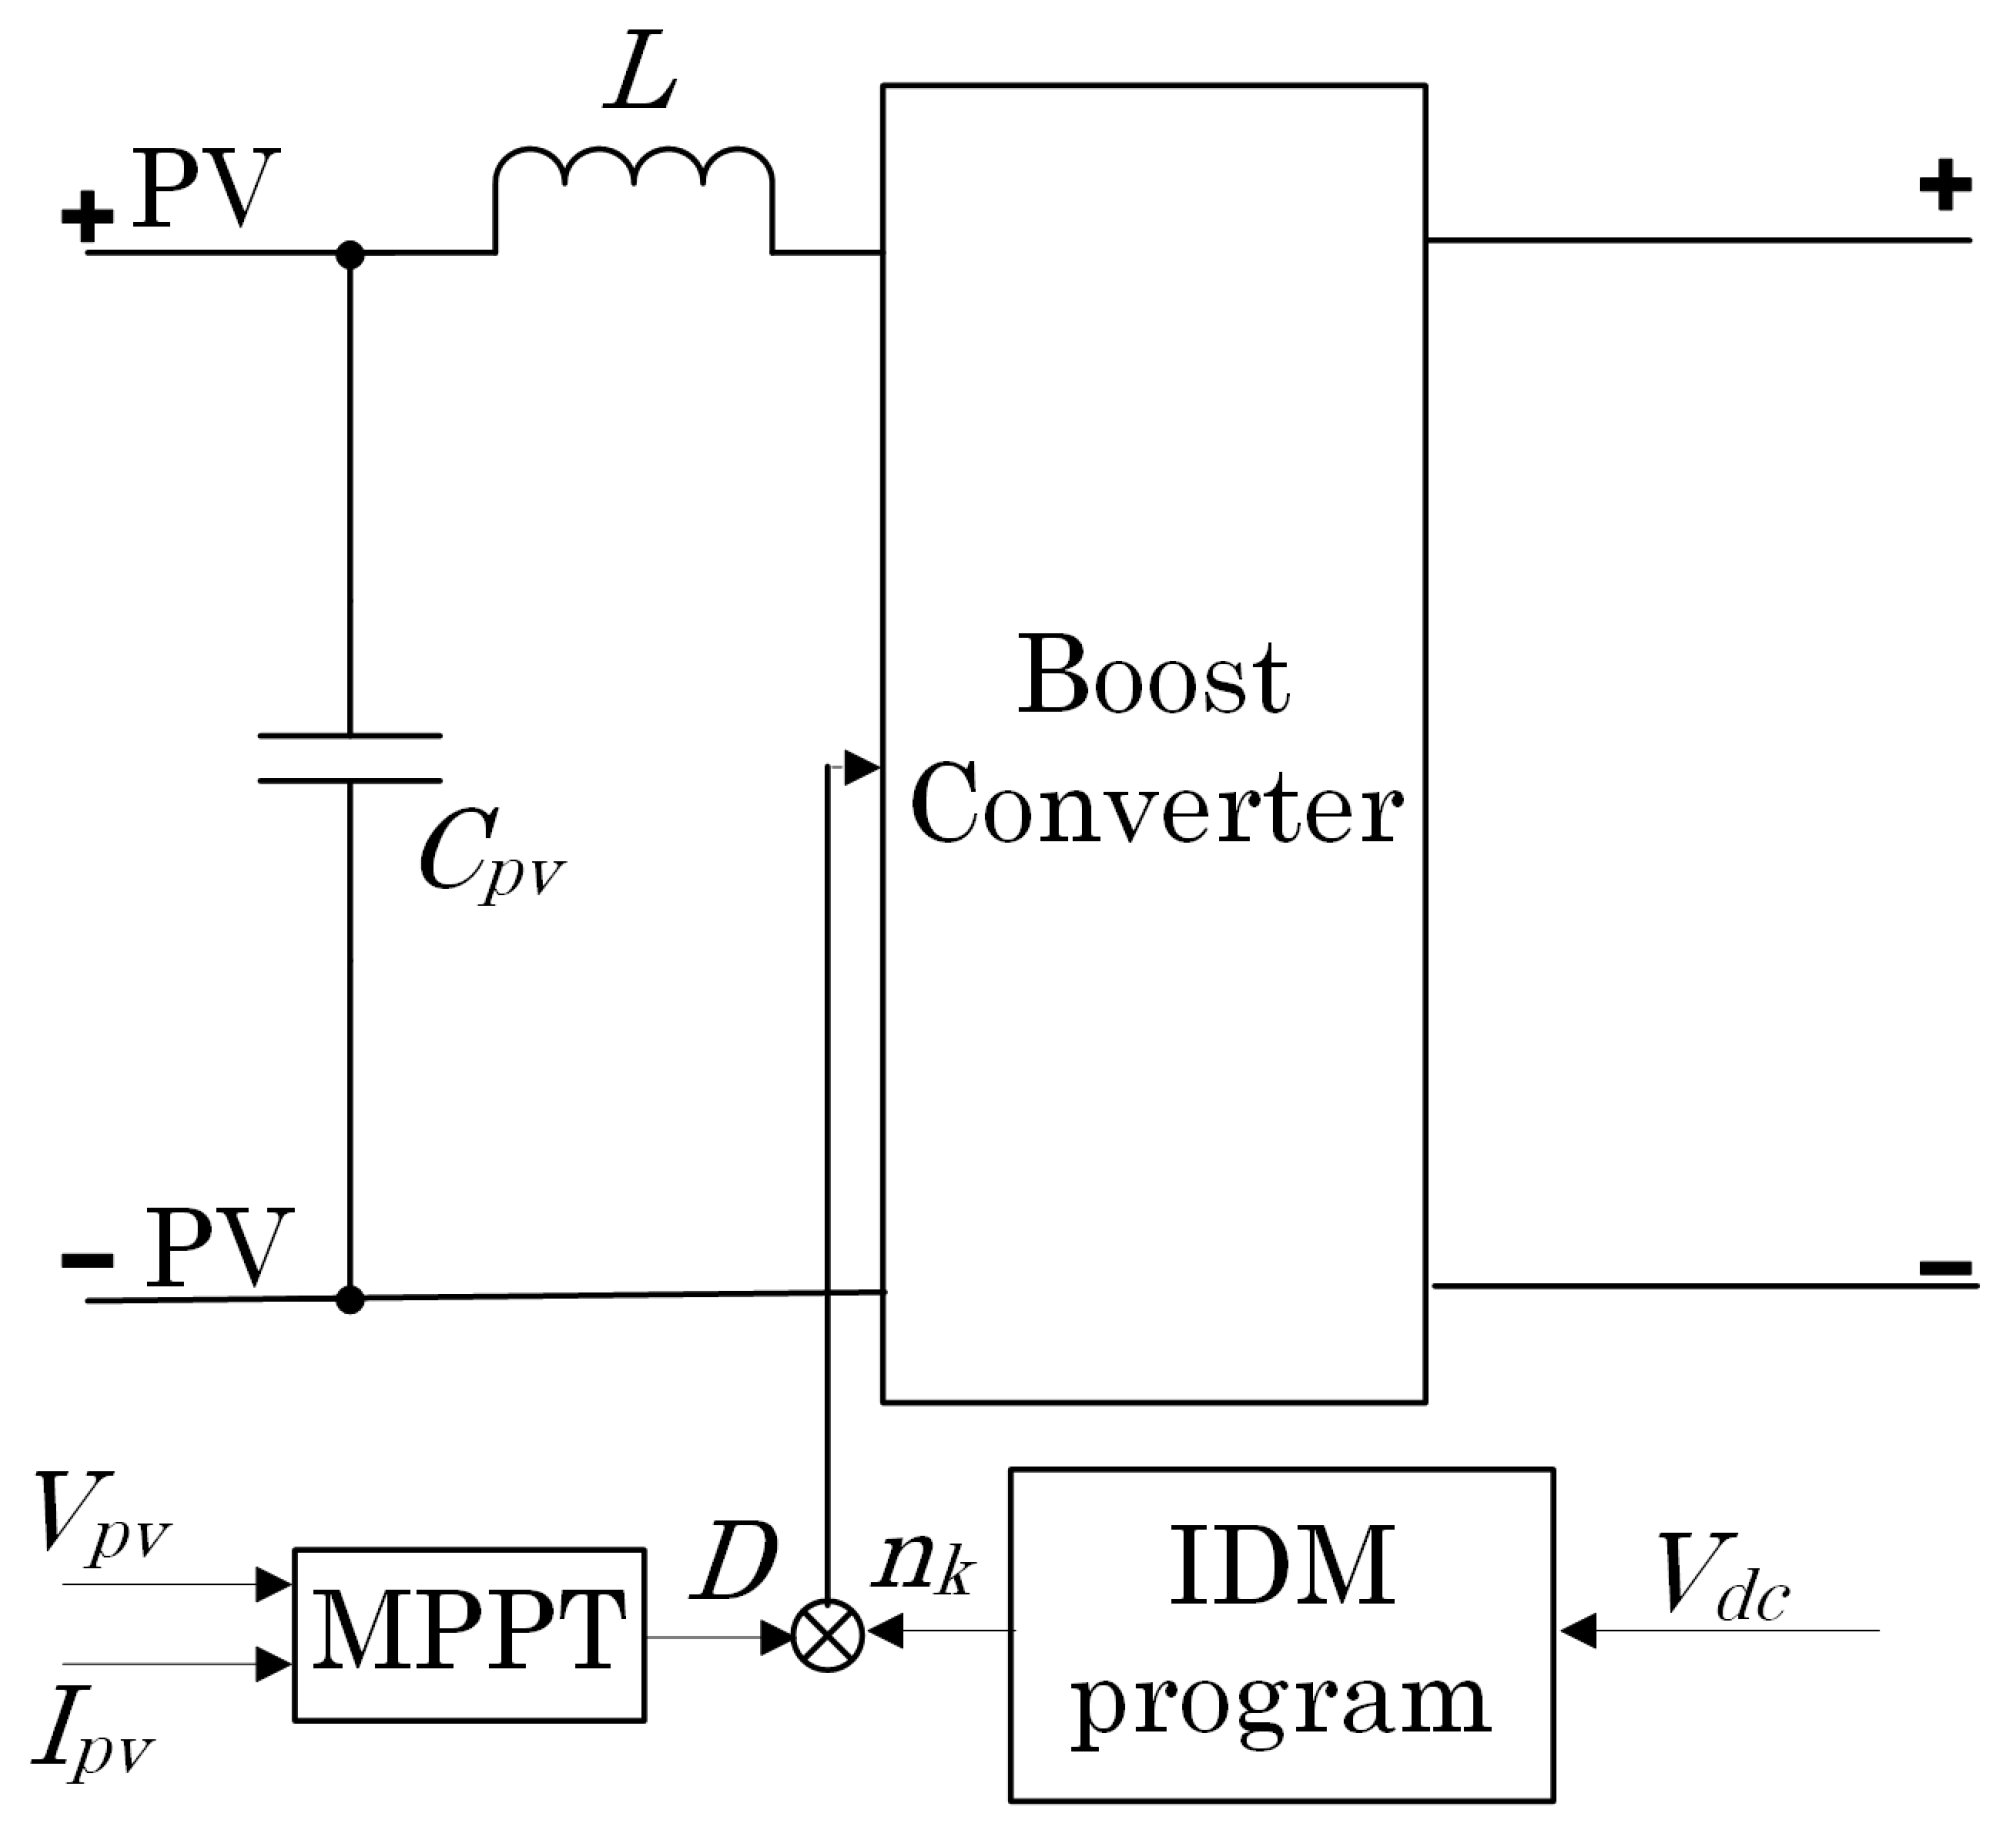
Figure 4 shows the diagram of the system under analysis. This system consists of a 50 kW PV array, output capacitor C, DC/DC converter with maximum power point tracking (MPPT) and islanding detection program. The DC load is shown as an equivalent resistance and DC bus is modeled as a constant voltage source. The specifications of PV module are introduced in Table 2. The inverter is used to connect AC grid and DC grid. In Figure 5, VSC controller is modeled as a voltage source converter (VSC) average model to regulate DC bus voltage (keep DC bus voltage stable at 500 V).
3.2. Proposed IDM
Because only DC voltage signal can be used to detect islanding condition in DC grid when islanding occurs. So that, the idea for IDM in DC grid focus on how to make the change of DC voltage is large enough and faster than without IDM. Based on this idea, the IDM injects the perturbation signal to the output of MPPT block to change the value of duty cycle before supply to boost converter is proposed. By using this IDM, the islanding condition can detect easier and faster than without IDM. Figure 6 describes in detail how to inject perturbation signal.
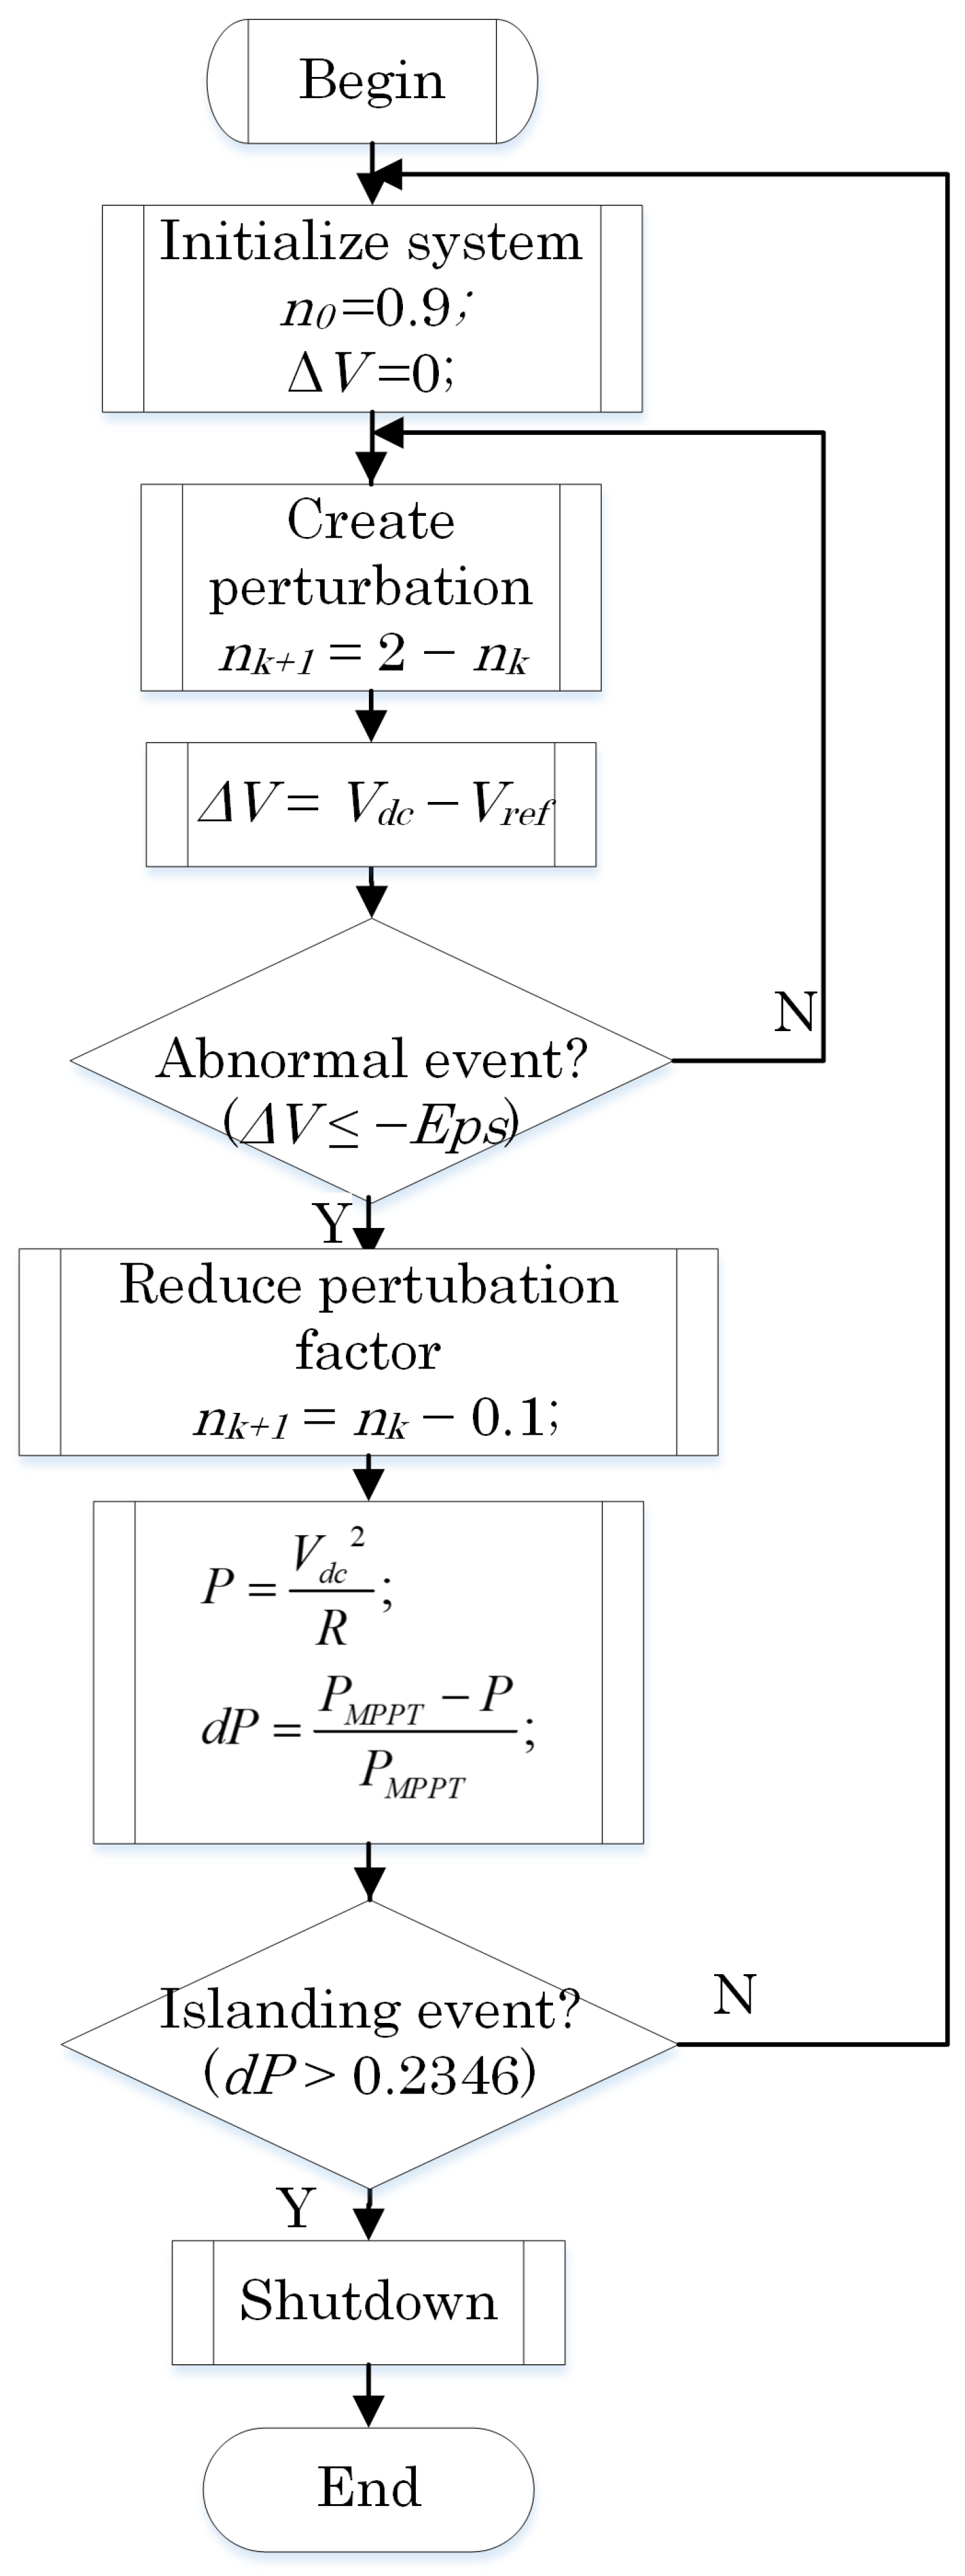
The flowchart in Figure 7 explains the detailed procedure of the proposed method. The IDM is verified step by step simulation. The simulation is executed in two main cases: single PV operation and multi-PV operation. In both cases, the proposed IDM is tested in two condition: hardest islanding condition (the power of load and PV are equal) and another islanding condition (the power of load is greater than the power of PV). The sampling time is = 5× 10. The simulation time of each specific condition is 3 (s) and is performed with two following steps:
- Step 1: Start inject perturbation signal at 0.4 (s) from the system startup.
- Step 2: The islanding event is activated at 1.5 (s) from the system startup by disconnect the AC grid.
The simulation results show that proposed IDM is able to detect the islanding event in all conditions.
The equivalent circuit in normal and islanding condition is illustrated in Figure 8. The main idea of this method is to inject a perturbation signal into boost converter to make the fluctuation of and the DC/DC input current as well. In normal condition, with the compensated by the inverter, the fluctuation of is small. However, when AC grid disconnected, without the DC bus regulation by the inverter, the fluctuation is affected by n. If the fluctuation exceeds the abnormal threshold value, the n value will decrease to make the rate of change of output power reach the threshold value faster than without IDM.
For the analysis of the hardest islanding condition, the DC load power is perfectly matched with the power generated by PV. The assumptions are constant DC load and PV power. The explanation of the inject perturbation signal method is presented in Equations (11)–(26).
Based on the equivalent circuit, the Kirchhoff’s law for the capacitor node after islanding:
where
- is the current of DC load.
- is the current of DC/DC converter output capacitance.
- is the DC/DC converter output current.
- is the DC bus voltage in islanding condition.
- R is the DC load resistance.
- C is the DC/DC converter output capacitance.
Because is unit step function
where
- is the DC/DC converter output current before time .
- is the DC/DC converter output current after time .
- is the initial DC voltage before islanding condition.
- s is the Laplace operator.
From Equation (16), we can find the inverse transformation
The DC/DC converter output current can be rewritten
where
- is the injected perturbation factor at step k.
- is the current of the PV module.
- D is the duty cycle.
- is the DC/DC output current perturbation factor at step k.
Therefore, Equation (19) becomes
According to Equation (20), when islanding occurs, the decrease of output current perturbation factor makes DC bus voltage drop. In general, the result is correct in the time domain.
In this paper, the rate of change of output power is used to decide whether islanding has occurred or not. This threshold value is explained in Equations (21)–(28).
Before islanding, the DC load power is
- is the PV maximum power.
- is the change of active power.
- is the DC bus voltage in normal condition ().
- is the DC bus voltage reference (500 V).
After islanding occurs, the DC load power is
where
- is the change of DC bus voltage in islanding condition.
Assuming PV is in constant power control, so, the active power supplied by AC grid is
Normalizing
where
- is the over voltage threshold.
- is the under voltage threshold.
The voltage threshold of islanding is selected according to EN50160 standard
Therefore, the rate of change of output power threshold is given by
All results are shown and discussed in the next section.
4. Simulation Results
The testing proceduce is following:
- The perturbation signal injected to PV converter at t = 0.4 s from the system startup.
- The islanding condition occurs at t = 1.5 s from the system startup.
The model parameters are shown as below:
- DC bus voltage is = 500 V.
- Under voltage threshold is = 450 V.
- Rate of change of output power threshold is 0.2346.
- The perturbation duration is T = 8 ms.
- The perturbation factor at normal condition is n = 0.9 to 1.1.
In this test, the result gives the difference of detection time between the original inject perturbation method in [13] and the improvement method proposed in this paper.
4.1. Single PV Operation
In single PV operation scenario, PV module power is 50 kW and the diagram is shown in Figure 9.
In single PV operation scenarios, the IDM is tested in two cases are displayed in Table 3.
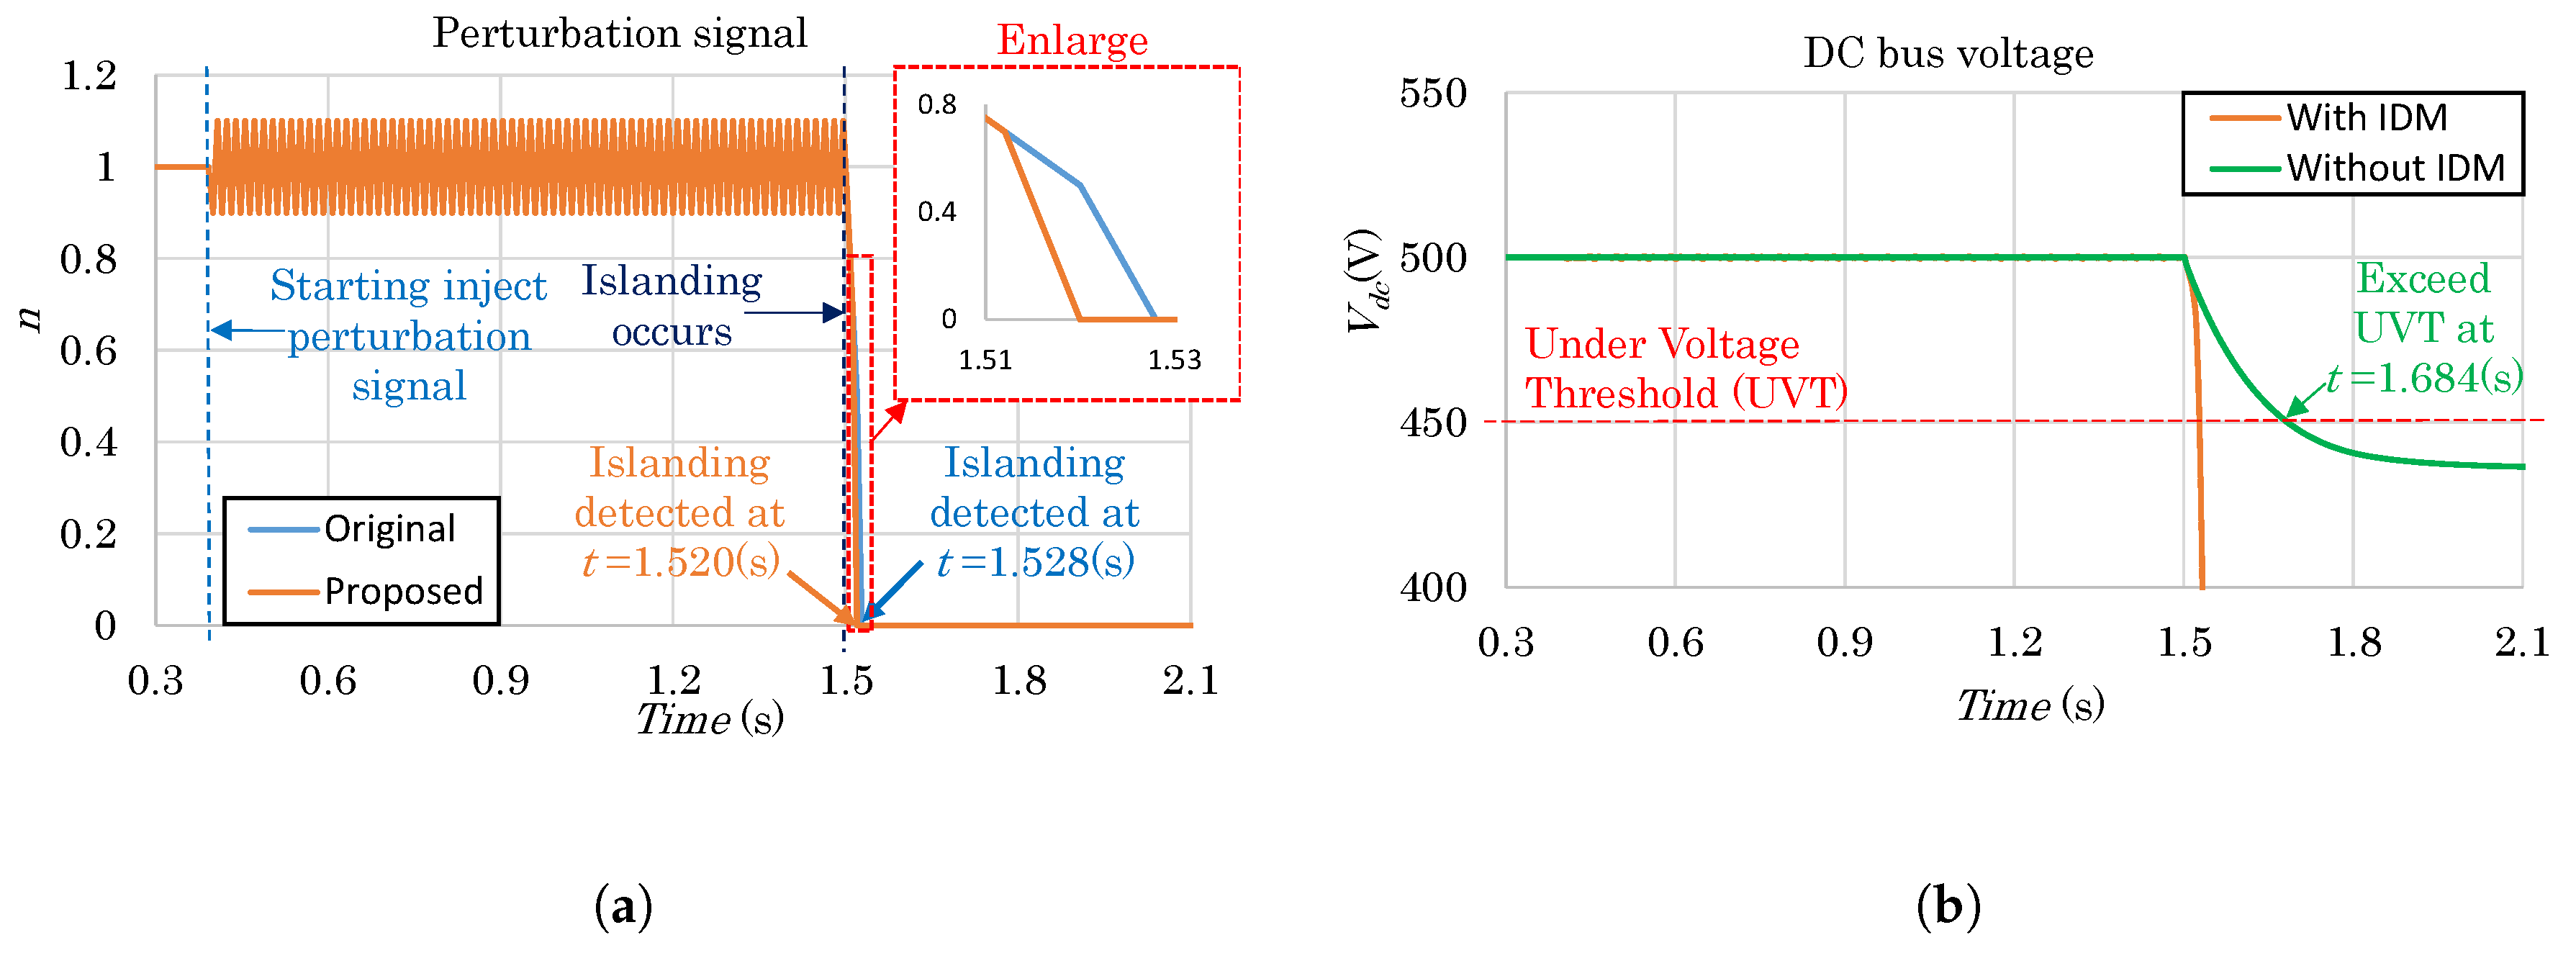
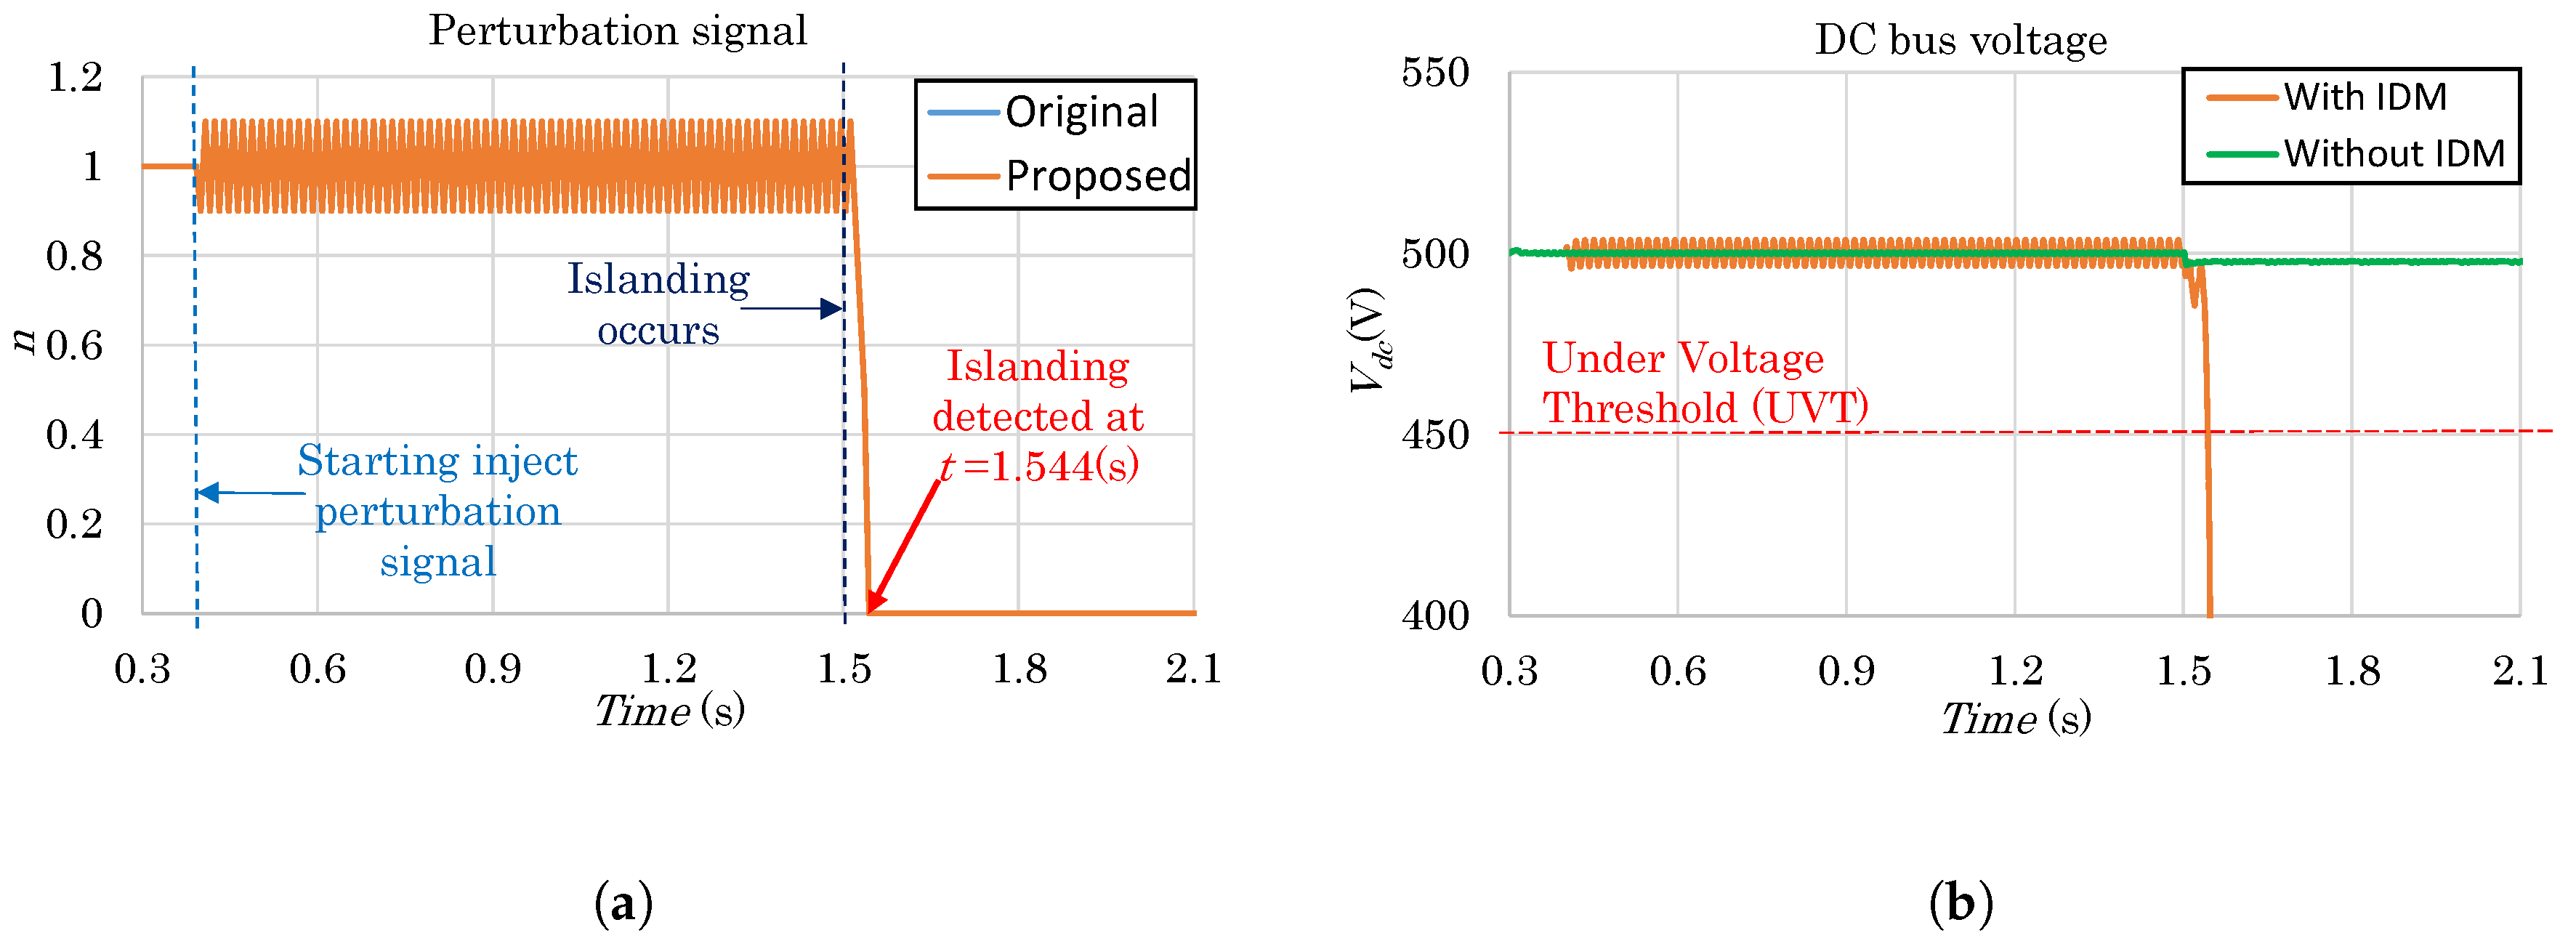
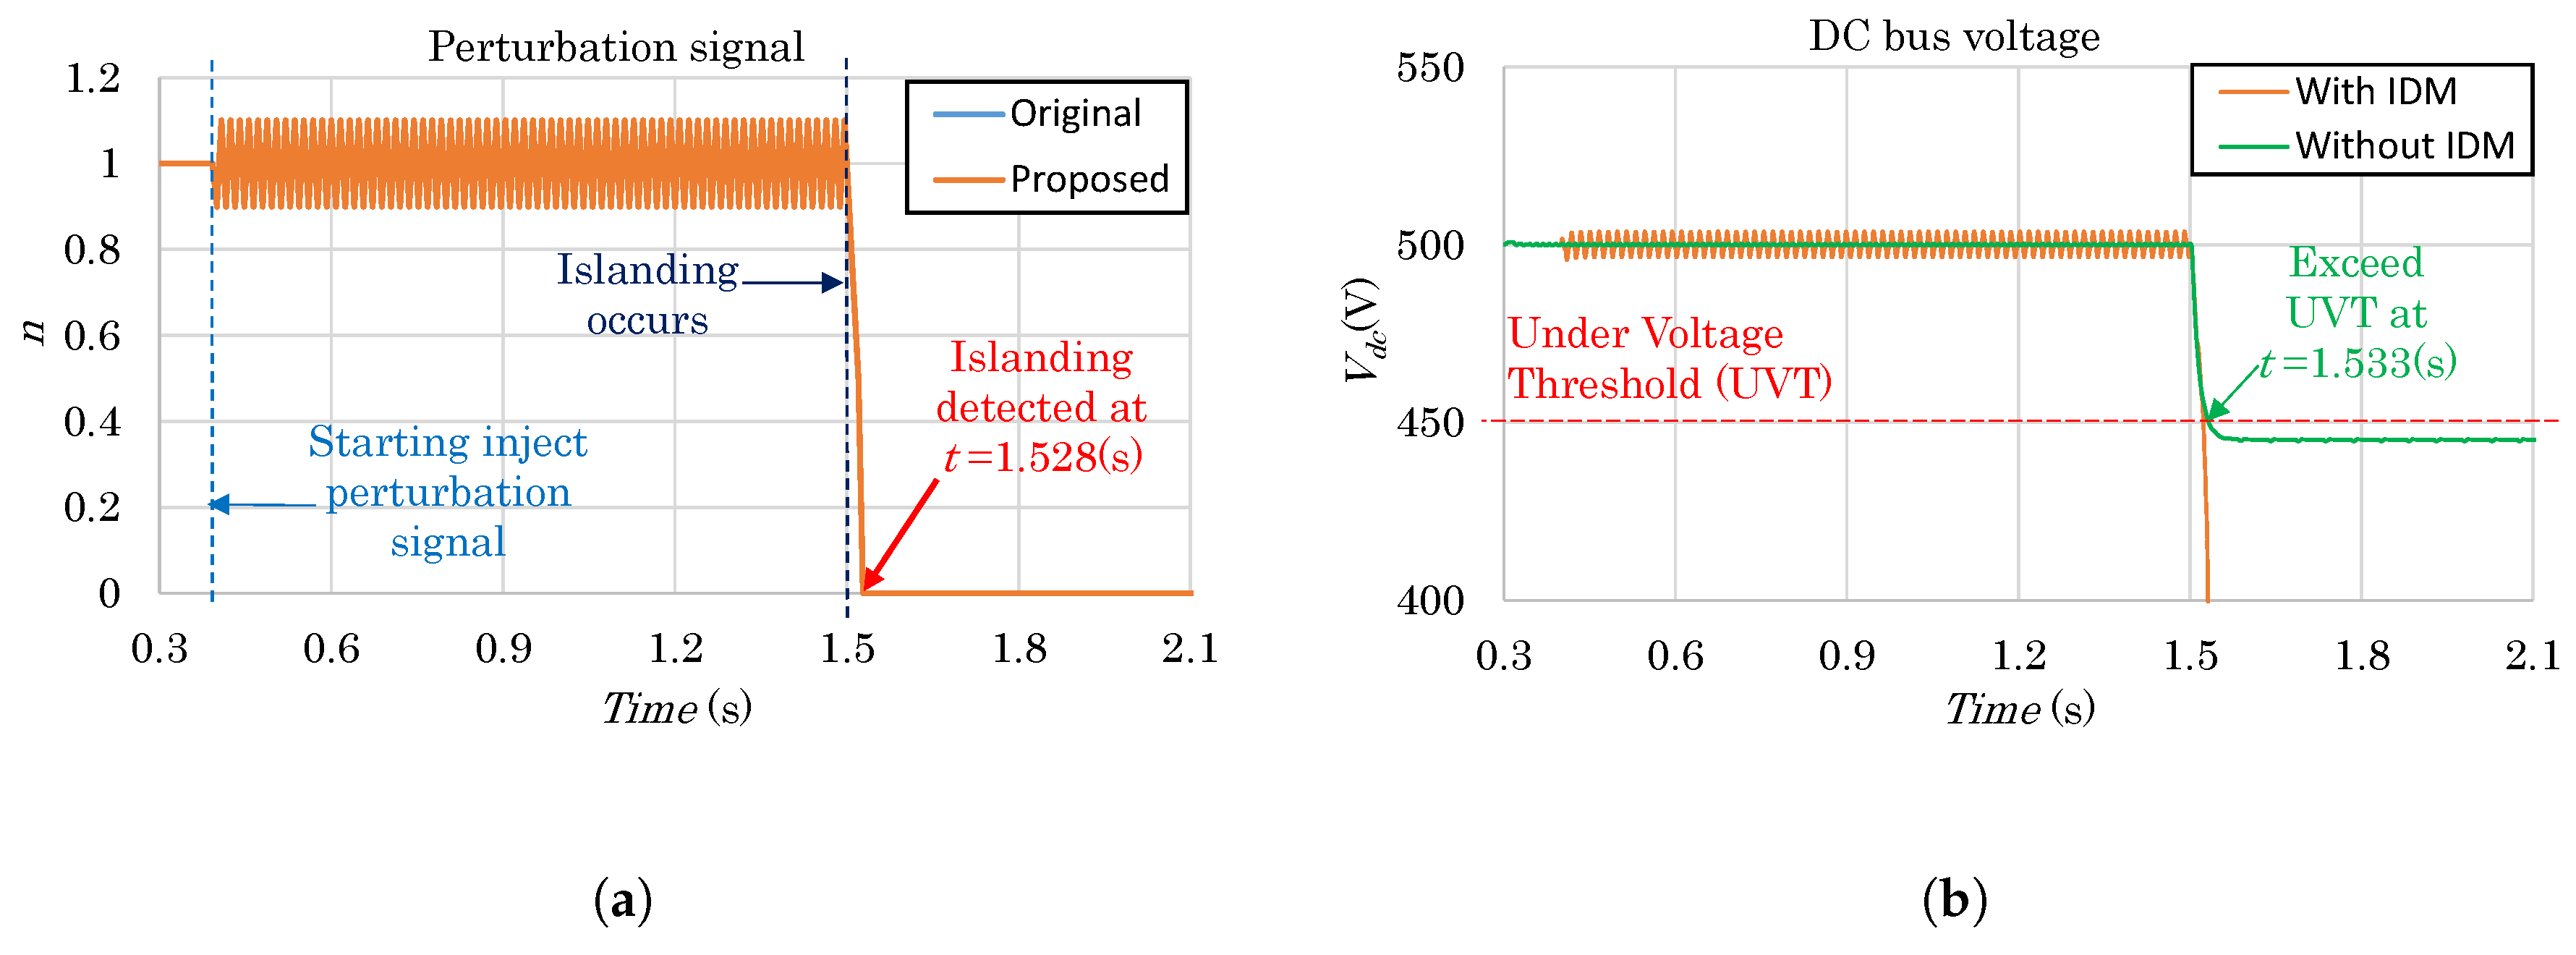
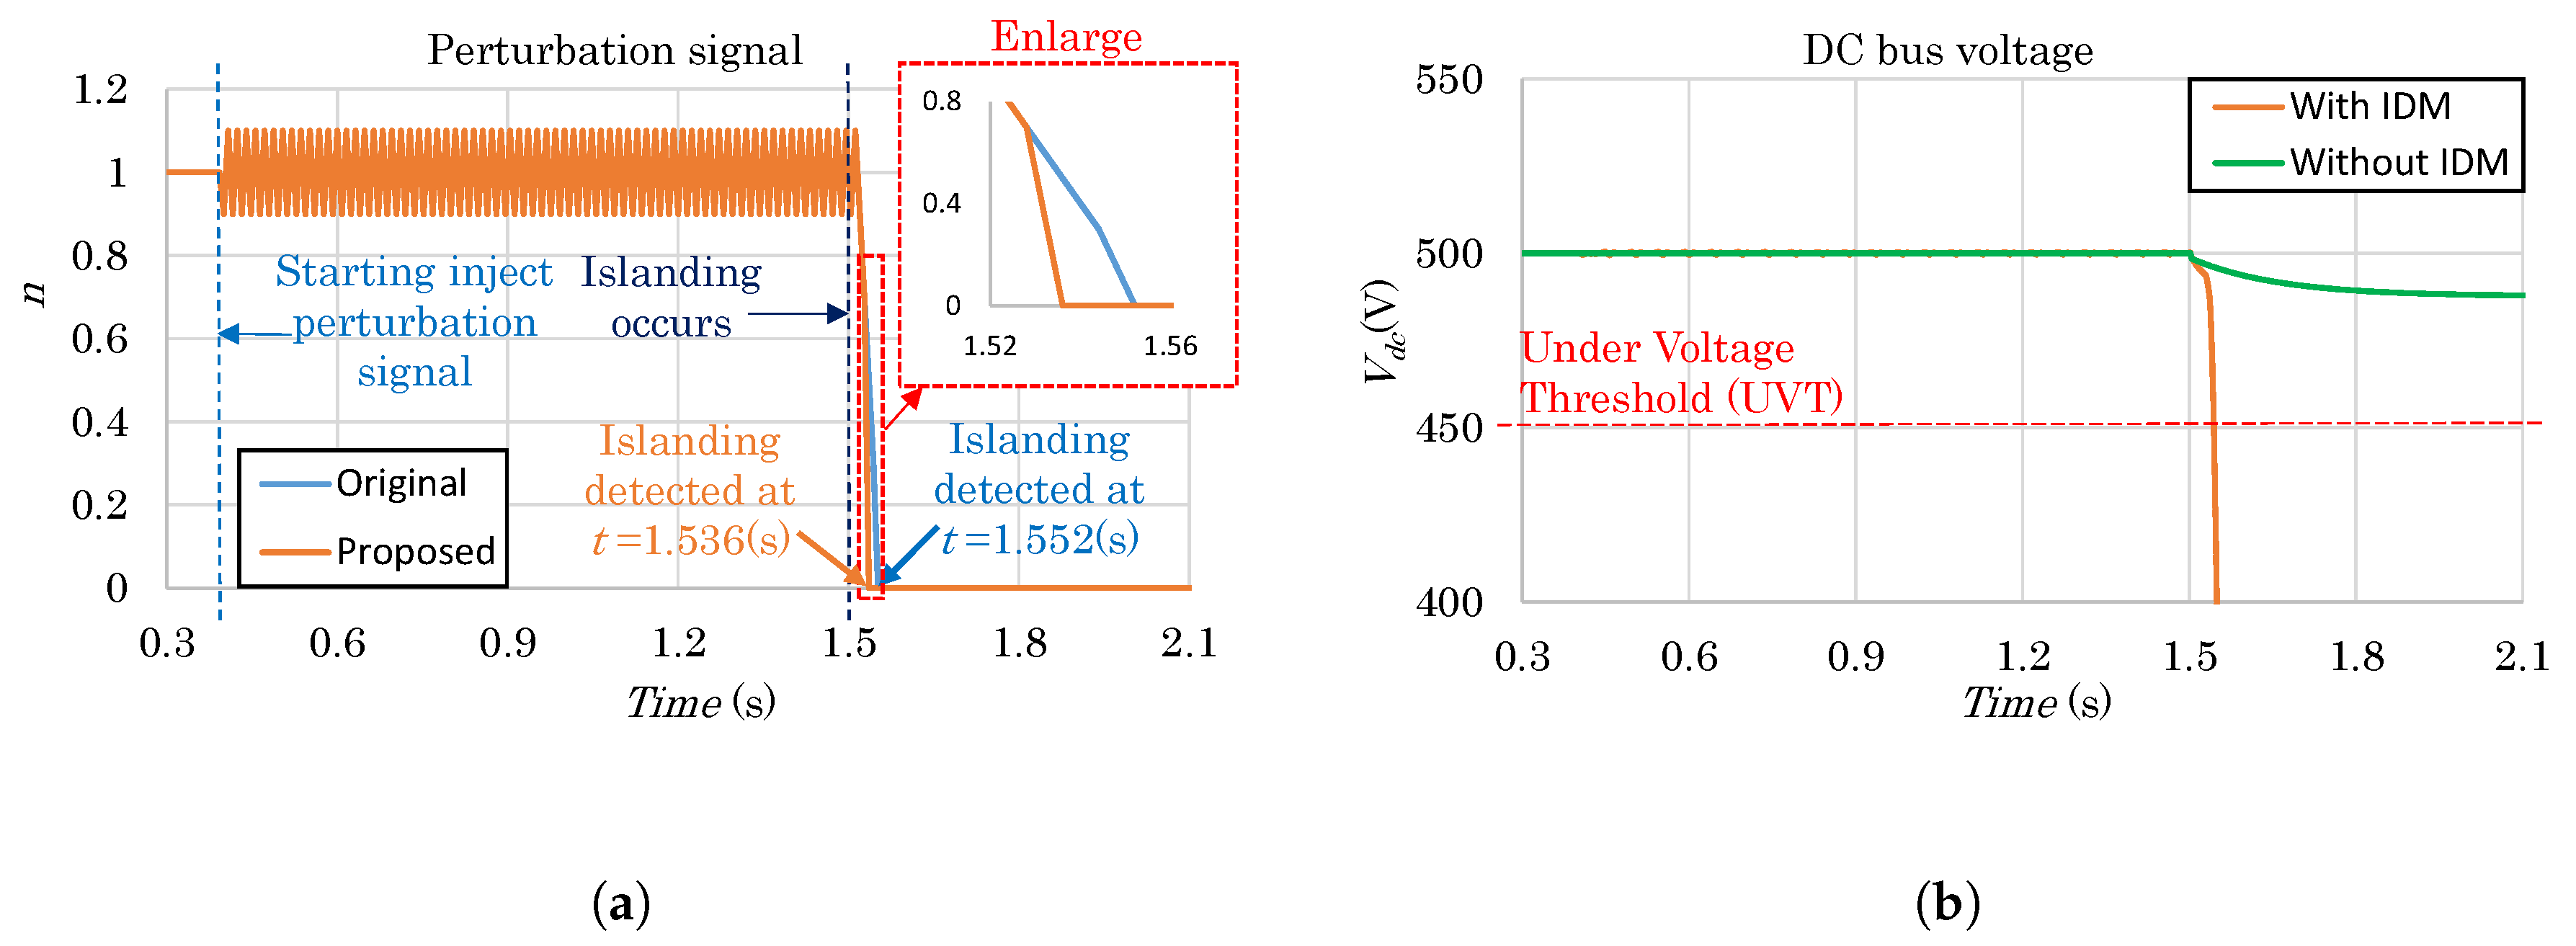
The result in the first case is shown in Figure 10, and in the second case is shown in Figure 11. Figure 10 shows the islanding detection times of original and improved IDM in the worst case are same t = 44 ms. Meanwhile, the islanding condition cannot be detected by OV/UV passive method because the DC voltage does not exceed UV threshold in the worst case. In another case, without IDM, Figure 11 shows that islanding condition can detect when the DC voltage reaches UV threshold in t = 33 ms, slower than the detection time t = 28 ms when applied both original and improved IDM. In single PV operation scenario, there is no difference between the original method and proposed method. Besides, there is significantly different between with and without IDM.
In addition, the proposed IDM almost neither affect the power quality nor the MPPT efficiency. This conclusion based on the following explanation.
First, for the power quality. Due to the system under analysis is DC grid, the power quality degradation depends on the fluctuation of DC voltage () when proposed IDM is applied. The DC voltage is regulated by DC/AC inverter to stabilize at 500 V in normal condition. Meanwhile, the measurement value fluctuation is 496.5 V 503.6 V or 99.3% 100.7% while the normal voltage threshold is 90% 110%. Therefore, our proposed method does not significantly affect the power quality.
Furthermore, for the issue of MPPT affection raised by the proposed method. The MPPT affection can represent by MPPT efficiency and its calculation based on the equation below:
where
- is the MPPT efficiency.
- = 270.5 V is the PV array voltage measurement at maximum power point.
- is the PV array voltage reference at maximum power point (manufacturer value).
The PV array voltage reference at maximum power point calculation based on the under equation:
where
- = 54.7 V is the PV module voltage reference at maximum power point.
- m = 5 is the series-connected modules per string.
Consequently, the MPPT efficiency when the proposed IDM is applied is:
For that reason, the proposed IDM does not significantly affect the MPPT efficiency.
4.2. Multi-PV Operation
In this scenario, IDM is tested in both the worst case and another case with different total PV power in Table 4.
The multi-PV operation scenario diagram is displayed in Figure 12.
In this scenario, there is a considerable difference not only between with and without IDM but also between original and proposed methods. The results of six cases are discussed as follows.
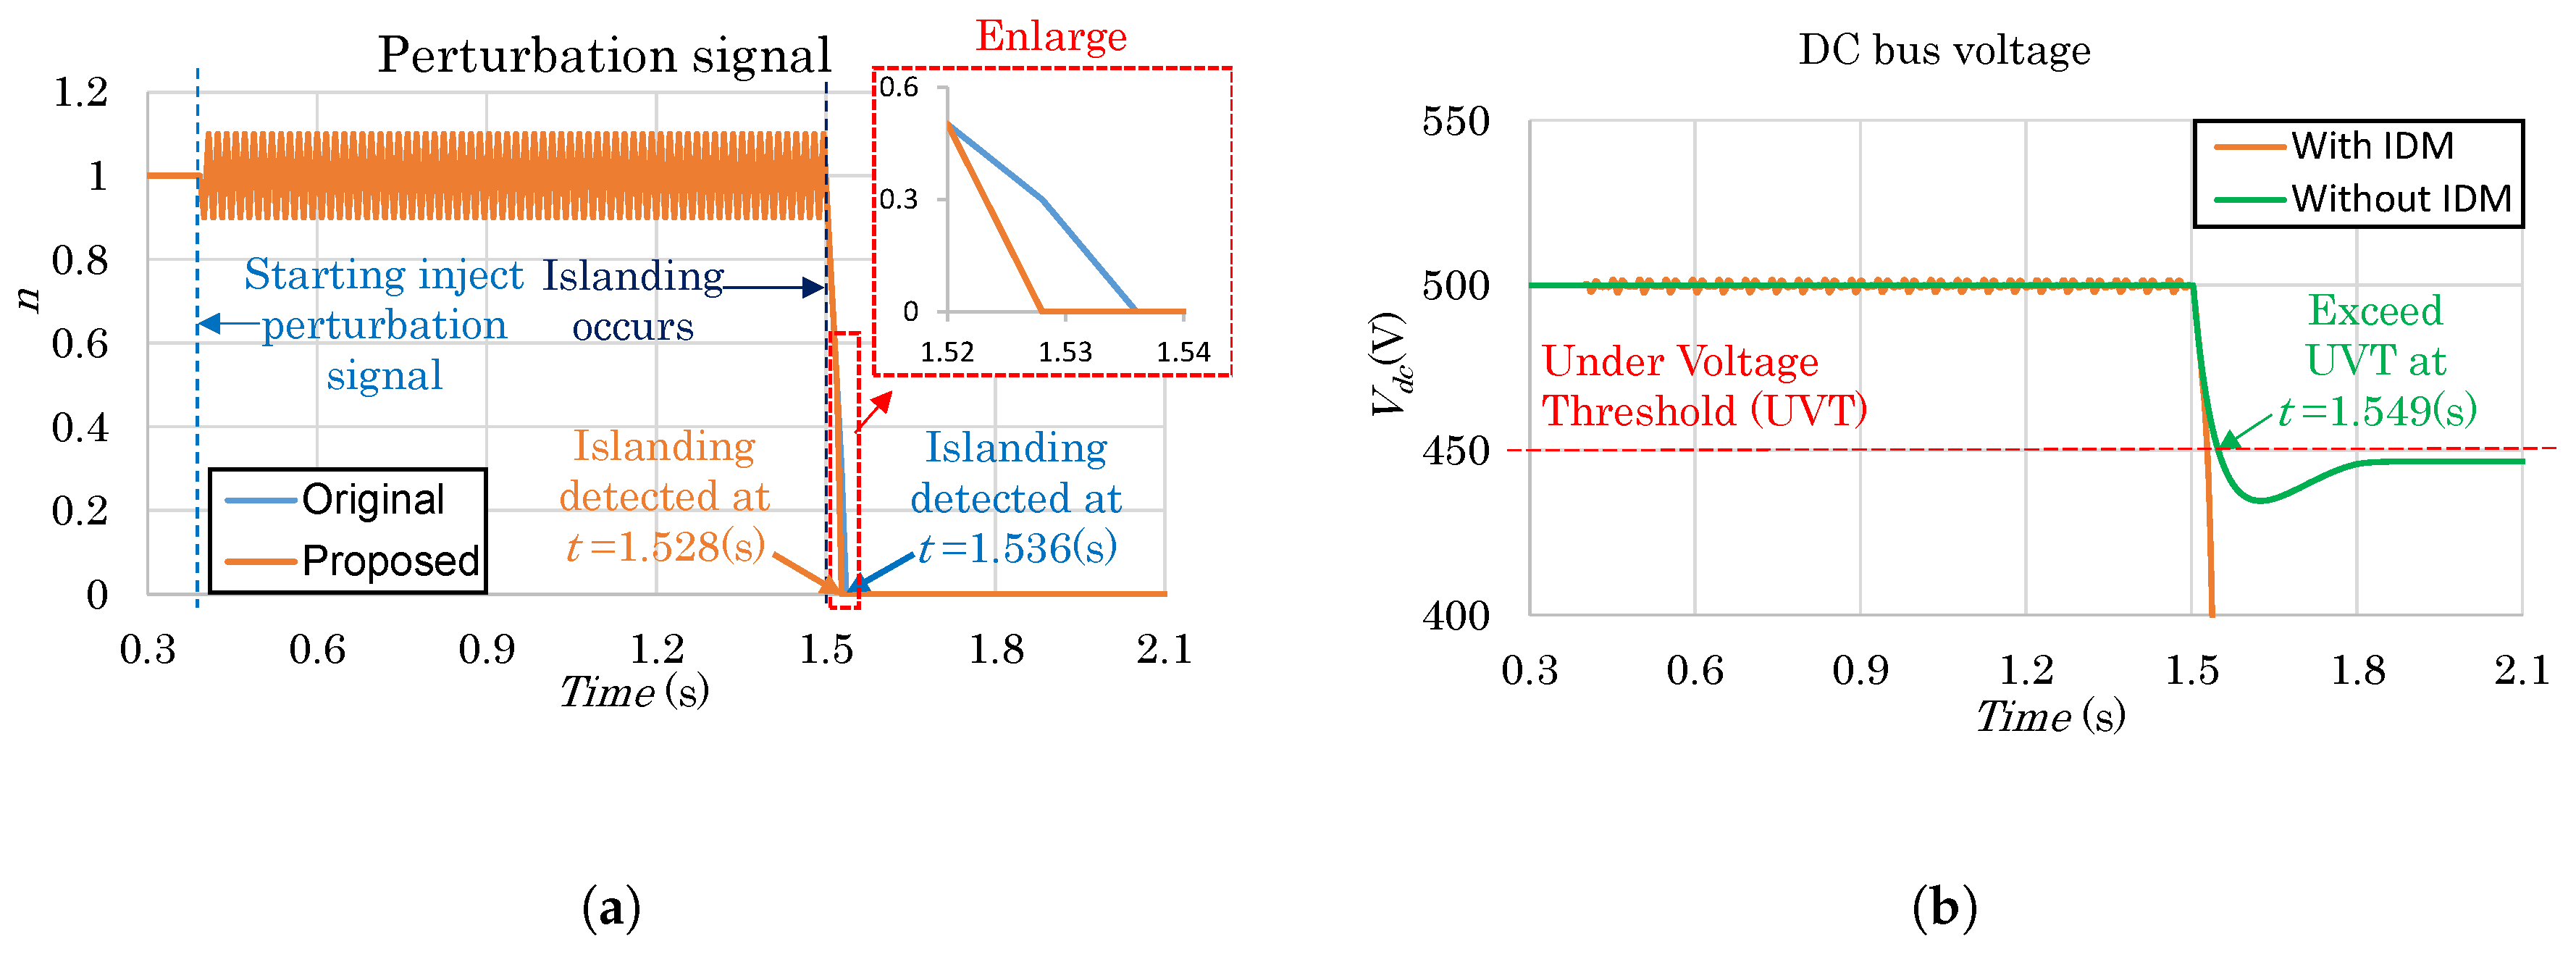
In the first and second cases, the total PV power is 200kW, the results are shown in Figure 13 and Figure 14. In Figure 13, the original method can detect islanding condition in the worst case after t = 52 ms. Meanwhile, after t = 36 ms, the proposed method can detect the same condition. The detection time decreases more than 30%. Of course, if IDM is not applied, the islanding problem cannot be detected.
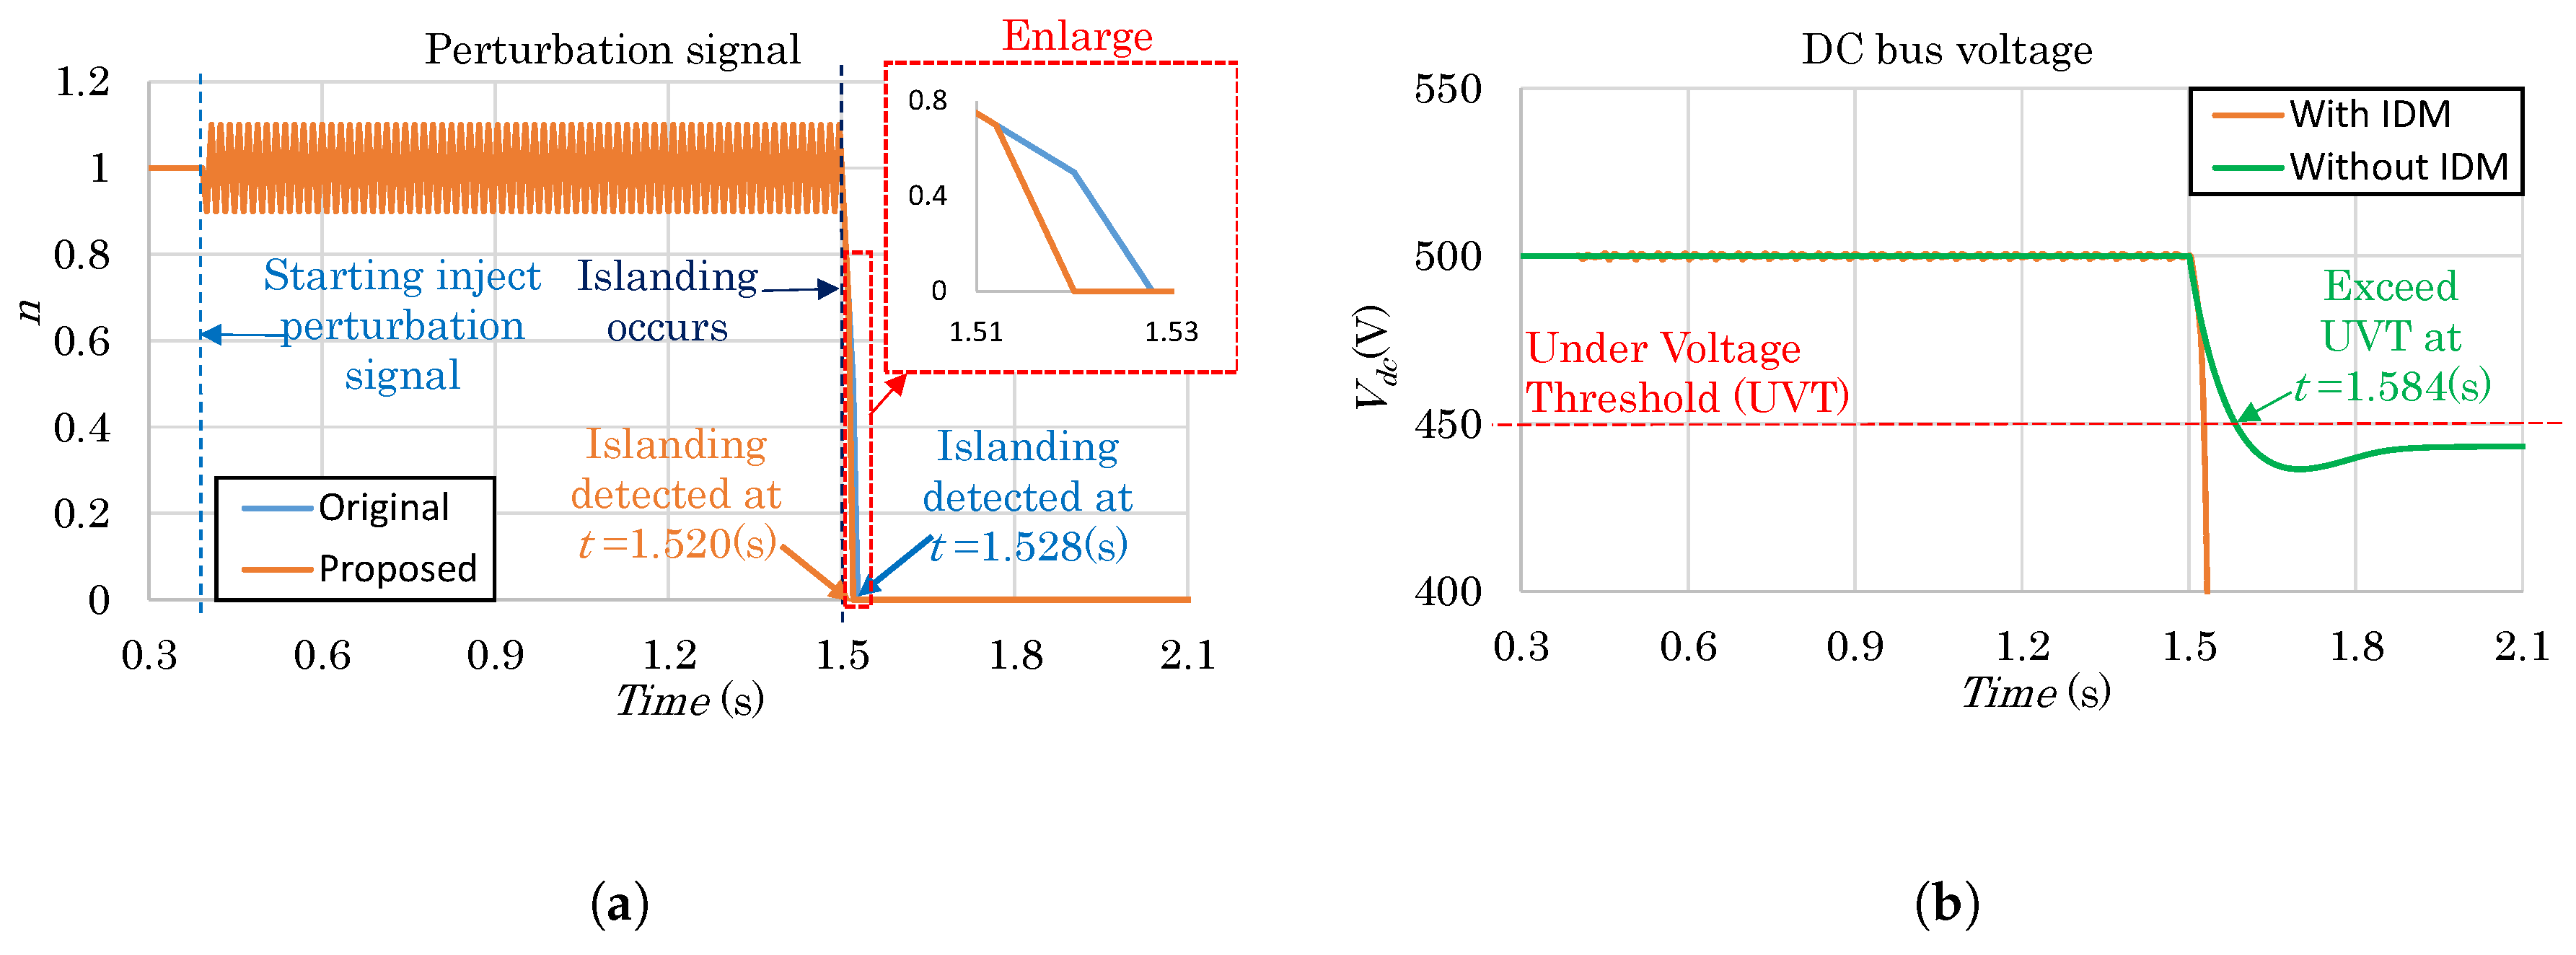
With different DC load condition, the results are shown in Figure 14. By applying the proposed method, the detection time is t = 28 ms, 22% faster than the original method and 43% faster than without IDM.
Similarly, in next two cases, the total PV power is 100 kW. In the hardest islanding condition case, the difference of detection time is still more than 30% between original IDM and proposed IDM. Without IDM, the islanding issue cannot be detected because the DC bus voltage does not reach the threshold value.
When the unbalance between DC load and PV source occurs (the unbalance case), the disparity is different from the previous two cases. The detection time of proposed method is t = 28 ms, 28% faster than the original method. Without IDM, the detection time is 76% slower than the proposed method. The results are shown in Figure 15 and Figure 16.
In the last two cases, the total PV power is 40 kW, the results are the same with the previous one in the worst case are illustrated in Figure 17. In the unbalanced case, with proposed IDM, the time detection is 89% faster than without IDM, the results are displayed in Figure 18.
Based on the above discussion, the proposed method can detect faster at least 22% than the original one and minimum 43% faster than without IDM.
5. Conclusions
In this paper, the development of DC grid was introduced based on some advantages of DC system compared with AC system. Besides, the islanding detection must be studied not only in AC grid but also in DC network due to the penetration development of DC grid. Moreover, the differences between islanding in AC and DC grid were investigated to show the difficulty of the islanding detection in DC grid.
The main contribution of proposed IDM can detect faster than the others IDM. In addition, it is capable of detecting not only in hardest but also another islanding condition. Furthermore, the proposed method can detect in both single and multi-PV operation cases. In case power of PV is greater than the power of load, this IDM cannot be applied. Changing perturbation factor can decrease but cannot increase PV power, because the power of PV is limited. This unsolved case will research in the future work.
However, the main problem with multi-PV operation is the cancellation effect on the injected perturbation signal of the proposed IDM. This issue can occur when it has a phase shift between each perturbation signals. In this paper, the fixed frequency is used to inject perturbation signal. So, the cancellation effect can easily happen. Consequently, the different converters are injected with different frequencies can be reduced this problem. With the increase in the number of PV modules, the probability of the cancellation effect on the injected perturbation signal of the proposed IDM is getting smaller and the effectiveness of this IDM is becoming better. The solution for this problem will be researched in the future work.
Author Contributions
T.T.S. and N.D.T. conceived of the methodology. T.T.S. developed the theory and performed the computations. F.G. led the research efforts and led the preparation of this paper. All authors provided critical feedback and helped shape the research, analysis and manuscript. Besides, all authors discussed the results and contributed to the final manuscript.
Conflicts of Interest
The authors declare no conflict of interest.
References
- Jenkins, N.; Ekanayake, J.B.; Strbac, G. Distributed Generation; Institution of Engineering and Technology: London, UK, 2010; p. 272. [Google Scholar]
- Elsayed, A.T.; Mohamed, A.A.; Mohammed, O.A. Review DC microgrids and distribution systems: An overview. Electr. Power Syst. Res. 2015, 119, 407–417. [Google Scholar] [CrossRef]
- Hammerstrom, D.J. AC Versus DC Distribution Systems: Did We Get it Right? In Proceedings of the IEEE Power Engineering Society General Meeting, Tampa, FL, USA, 24–28 June 2007; pp. 1–5. [Google Scholar]
- Seo, G.-S.; Baek, J.; Choi, K.; Bae, H.; Cho, B. Modeling and analysis of DC distribution systems. In Proceedings of the IEEE 8th International Conference on Power Electronics and ECCE Asia, Jeju, Korea, May 30–June 3 2011; pp. 223–227. [Google Scholar]
- Starke, M.R.; Tolbert, L.M.; Ozpineci, B. AC vs. DC distribution: A loss comparison. In Proceedings of the IEEE PES Transmission and Distribution Conference and Exposition, Chicago, IL, USA, 21–24 April 2008; pp. 1–7. [Google Scholar]
- Sannino, A.; Postiglione, G.; Bollen, M. Feasibility of a DC Network for Commercial Facilities. IEEE Trans. Ind. Appl. 2003, 39, 1499–1507. [Google Scholar] [CrossRef]
- IEEE Application Guide for IEEE Std 1547TM, IEEE Standard for Interconnecting Distributed Resources with Electric Power Systems; IEEE Standard 1547.2TM; IEEE Press: New York, NY, USA, 2008.
- Papadimitriou, C.N.; Kleftakis, V.A.; Hatziargyriou, N.D. A Novel Method for Islanding Detection in DC Networks. IEEE Trans. Sustain. Energy 2017, 8, 441–448. [Google Scholar] [CrossRef]
- Mohamad, A.M.I.; Mohamed, A.-R.I. Assessment and Performance Comparison of Positive Feedback Islanding Detection Methods in DC Distribution Systems. IEEE Trans. Power Electron. 2016, 32, 6577–6594. [Google Scholar] [CrossRef]
- Kleftakis, V.A.; Lagos, D.T.; Papadimitriou, C.N.; Hatziargyriou, N.D. Seamless transition between interconnected and islanded operation of DC Microgrids. IEEE Trans. Smart Grid 2017. [Google Scholar] [CrossRef]
- Voglitsis, D.; Papanikolaou, N.; Kyritsis, A.C. Incorporation of Harmonic Injection in an Interleaved Flyback Inverter for the Implementation of an Active Anti-Islanding Technique. IEEE Trans. Power Electron. 2016, 32, 8526–8543. [Google Scholar] [CrossRef]
- Haider, R.; Kim, C.H.; Ghanbari, T.; Bukhari, S.B.A.; Zaman, M.S.U.; Baloch, S.; Oh, Y.S. Passive islanding detection scheme based on autocorrelation function of modal current envelope for photovoltaic units. IET Gener. Transm. Distrib. 2018, 12, 726–736. [Google Scholar] [CrossRef]
- Seo, G.-S.; Lee, K.-C.; Cho, B.-H. A new DC anti-islanding technique of electrolytic capacitor-less photovoltaic interface in DC distribution systems. IEEE Trans. Power Electron. 2013, 28, 1632–1641. [Google Scholar] [CrossRef]
- Mahat, P.; Chen, Z.; Bak-Jensen, B. Review of Islanding Detection Methods for Distributed Generation. In Proceedings of the Third International Conference on Electric Utility Deregulation and Restructuring and Power Technologies, Nanjing, China, 6–9 April 2008. [Google Scholar]
- Funabashi, T.; Koyanagi, K.; Yokoyama, R. A review of islanding detection methods for distributed resources. In Proceedings of the IEEE Power Tech Conference, Bologna, Italy, 23–26 June 2003. [Google Scholar]
- Mulhausen, J.; Schaefer, J.; Mynam, M.; Guzmán, A.; Donolo, M. Anti-Islanding Today, Successful Islanding in the Future. In Proceedings of the 2010 63rd Annual Conference for Protective Relay Engineers, College Station, TX, USA, 29 March–1 April 2010. [Google Scholar]
- Samuelsson, O.; Strath, N. Islanding detection and connection requirements. In Proceedings of the IEEE Power Engineering Society General Meeting, Tampa, FL, USA, 24–28 June 2007; pp. 1–6. [Google Scholar]
- Kunte, R.S.; Gao, W. Comparison and Review of Islanding Detection Techniques for Distributed Energy Resources. In Proceedings of the 40th North American Power Symposium, Calgary, AB, Canada, 28–30 September 2008. [Google Scholar]
Figure 1.
Typical DC system diagram.

Figure 2.
AC grid in normal and islanding condition.

Figure 3.
DC grid in normal and islanding condition.

Figure 4.
System model under analysis.
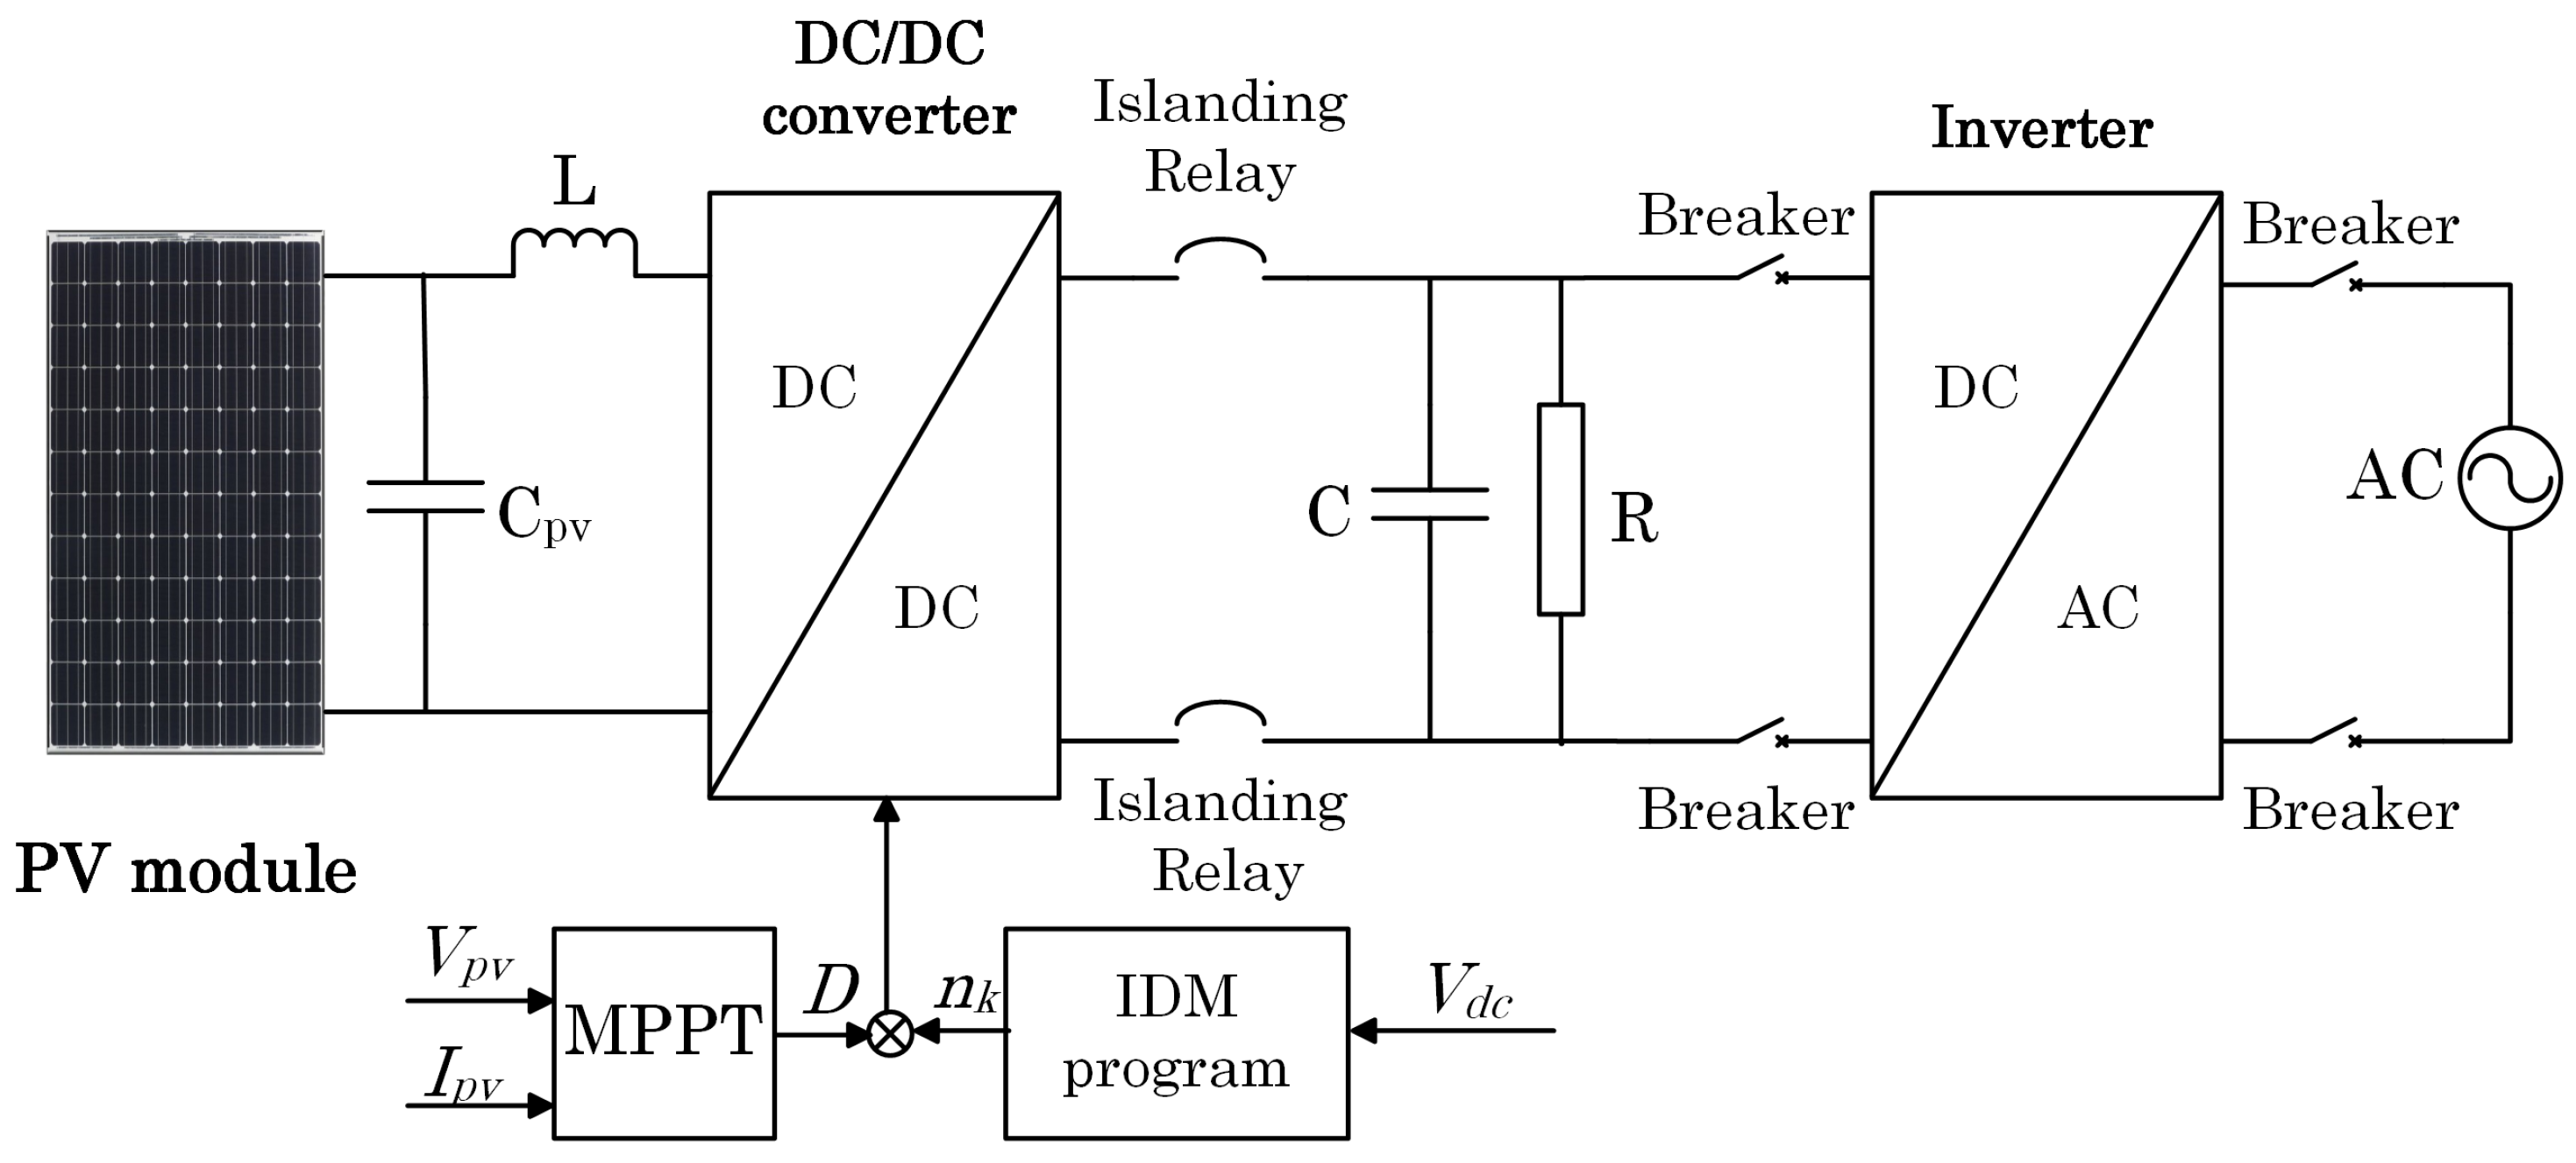
Figure 5.
Diagram of voltage source converter (VSC) controller.

Figure 6.
Controller perturbation signal circuit ( is the measurement DC bus voltage, is the PV voltage and is the PV current, is the perturbation factor, D is the duty cycle).
Figure 6.
Controller perturbation signal circuit ( is the measurement DC bus voltage, is the PV voltage and is the PV current, is the perturbation factor, D is the duty cycle).

Figure 7.
Flow chart of the IDM program ( is perturbation factor at the beginning, is voltage deviation, is abnormal event value, is the rate of change of output power).
Figure 7.
Flow chart of the IDM program ( is perturbation factor at the beginning, is voltage deviation, is abnormal event value, is the rate of change of output power).

Figure 8.
Equivalent circuit in normal and islanding conditions.

Figure 9.
Single PV operation.

Figure 10.
Result in case of single PV operation, 50 kW PV, hardest islanding condition: (a) Perturbation signal and (b) DC bus voltage (with and without IDM).
Figure 10.
Result in case of single PV operation, 50 kW PV, hardest islanding condition: (a) Perturbation signal and (b) DC bus voltage (with and without IDM).

Figure 11.
Result in case of single PV operation, 50 kW PV, another islanding condition: (a) Perturbation signal and (b) DC bus voltage (with and without IDM).
Figure 11.
Result in case of single PV operation, 50 kW PV, another islanding condition: (a) Perturbation signal and (b) DC bus voltage (with and without IDM).

Figure 12.
Multi-PV operation.
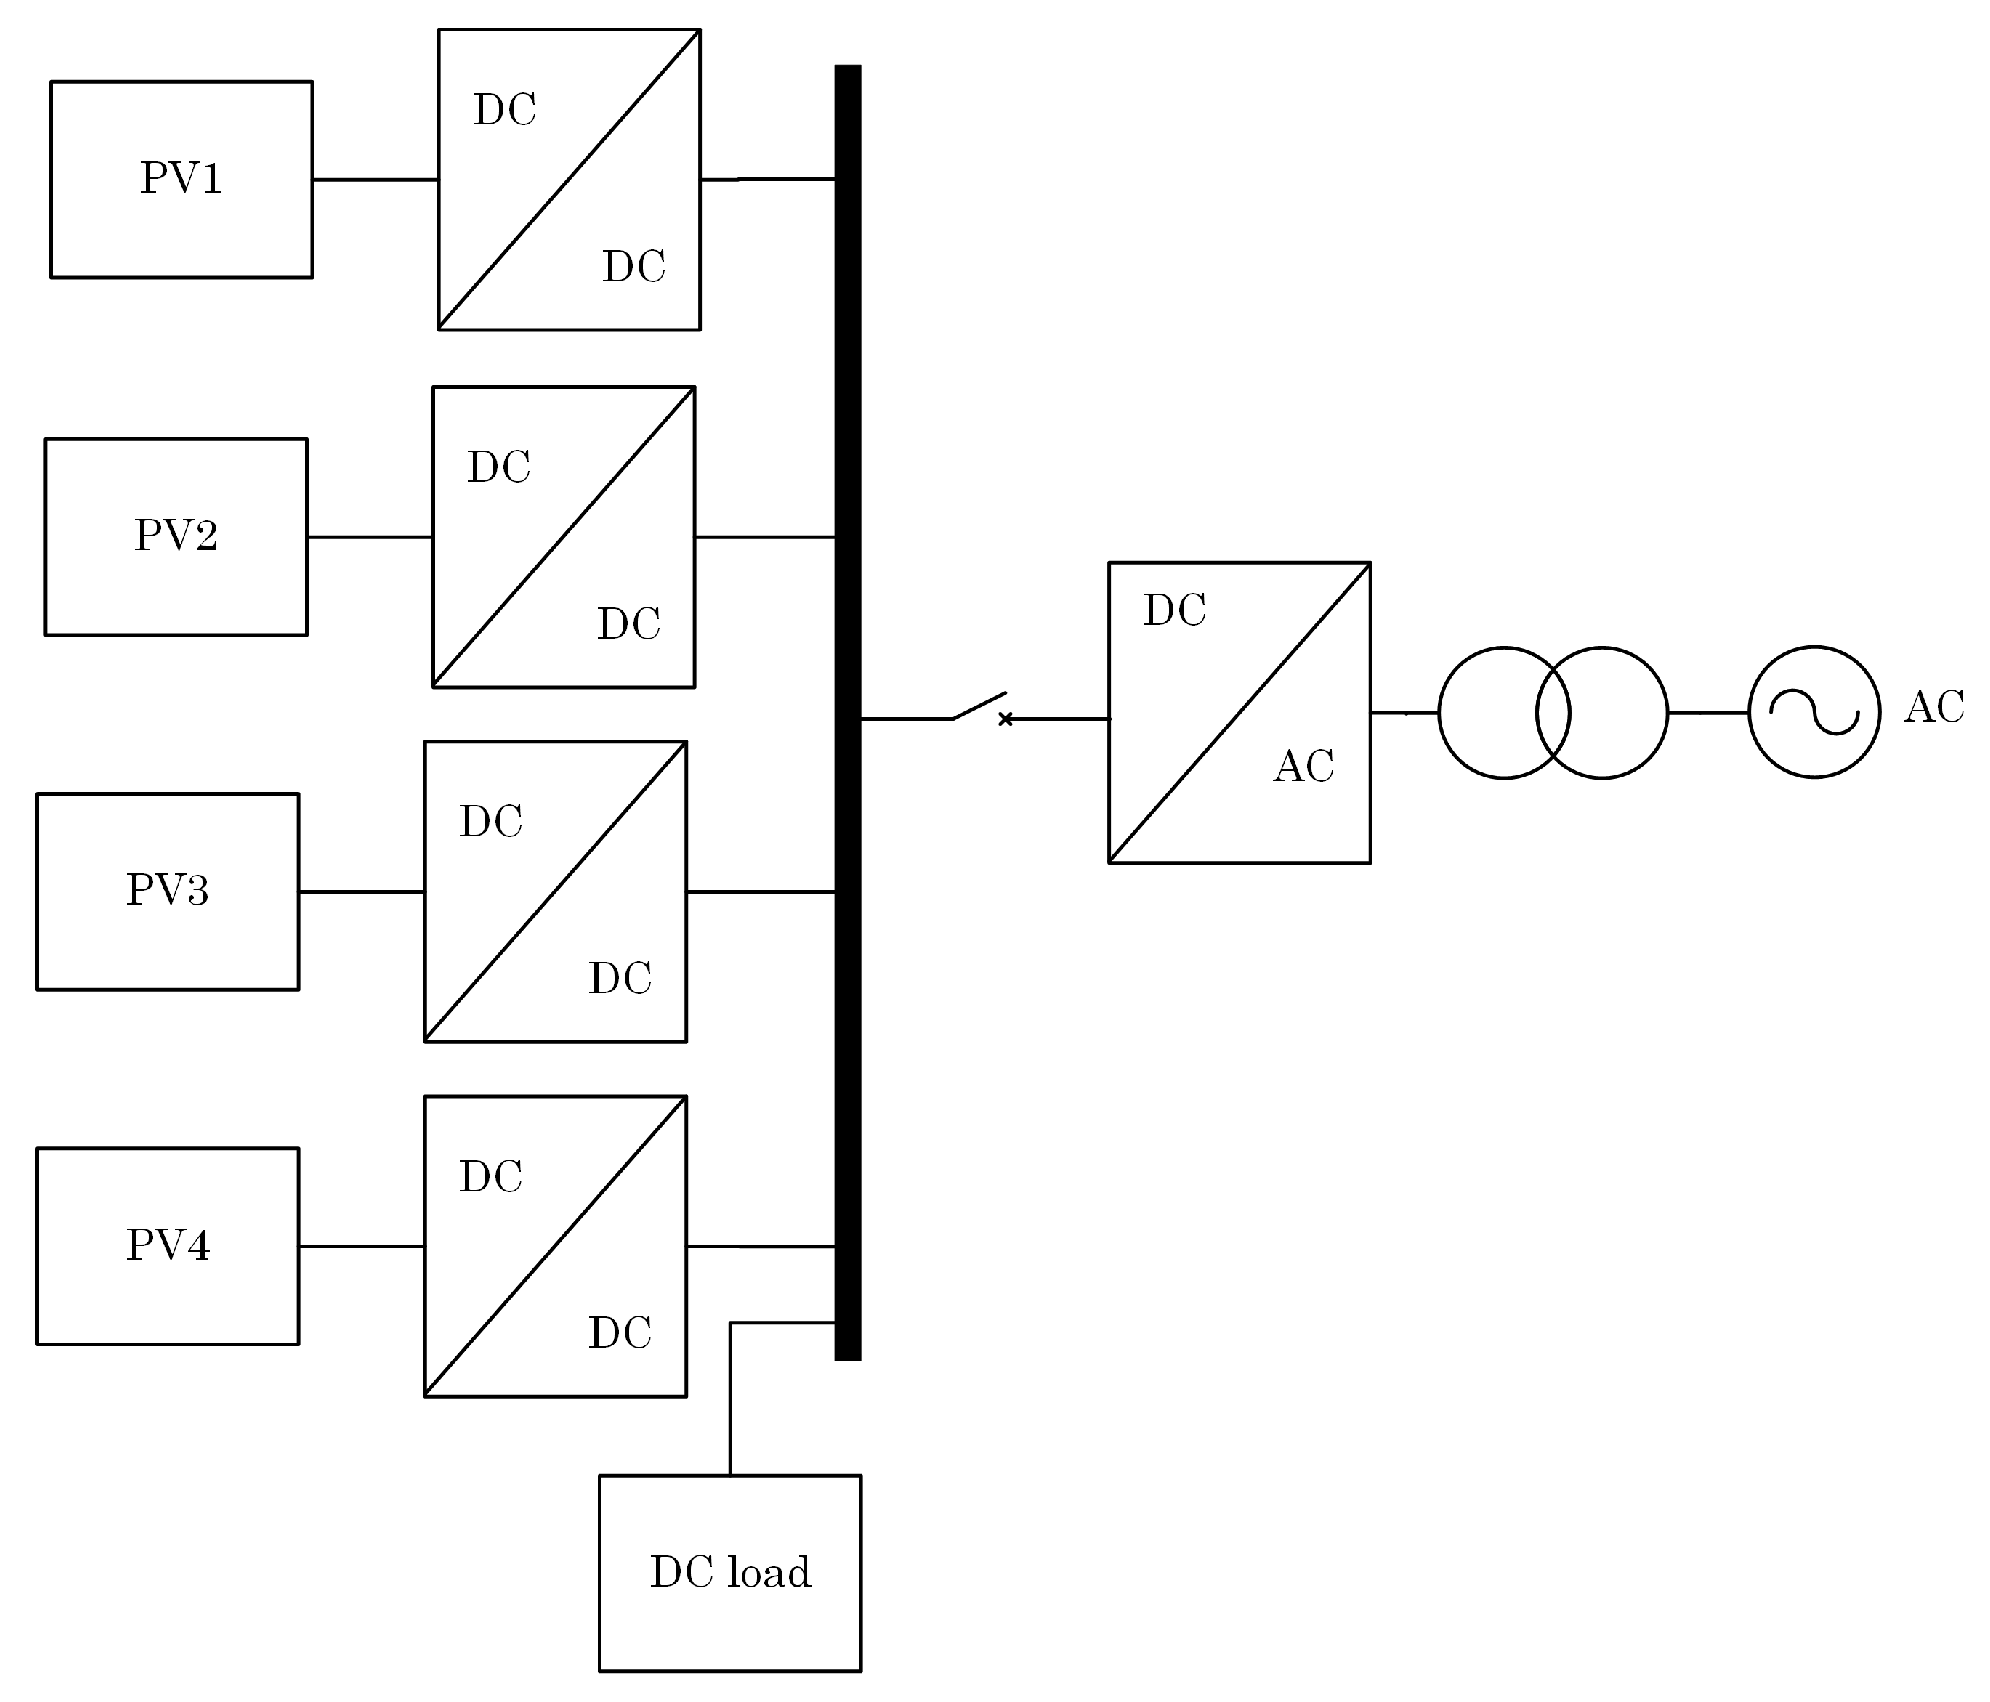
Figure 13.
Result in case of multi-PV operation, 200 kW PV, hardest islanding condition (case 1): (a) Perturbation signal and (b) DC bus voltage (with and without IDM).
Figure 13.
Result in case of multi-PV operation, 200 kW PV, hardest islanding condition (case 1): (a) Perturbation signal and (b) DC bus voltage (with and without IDM).
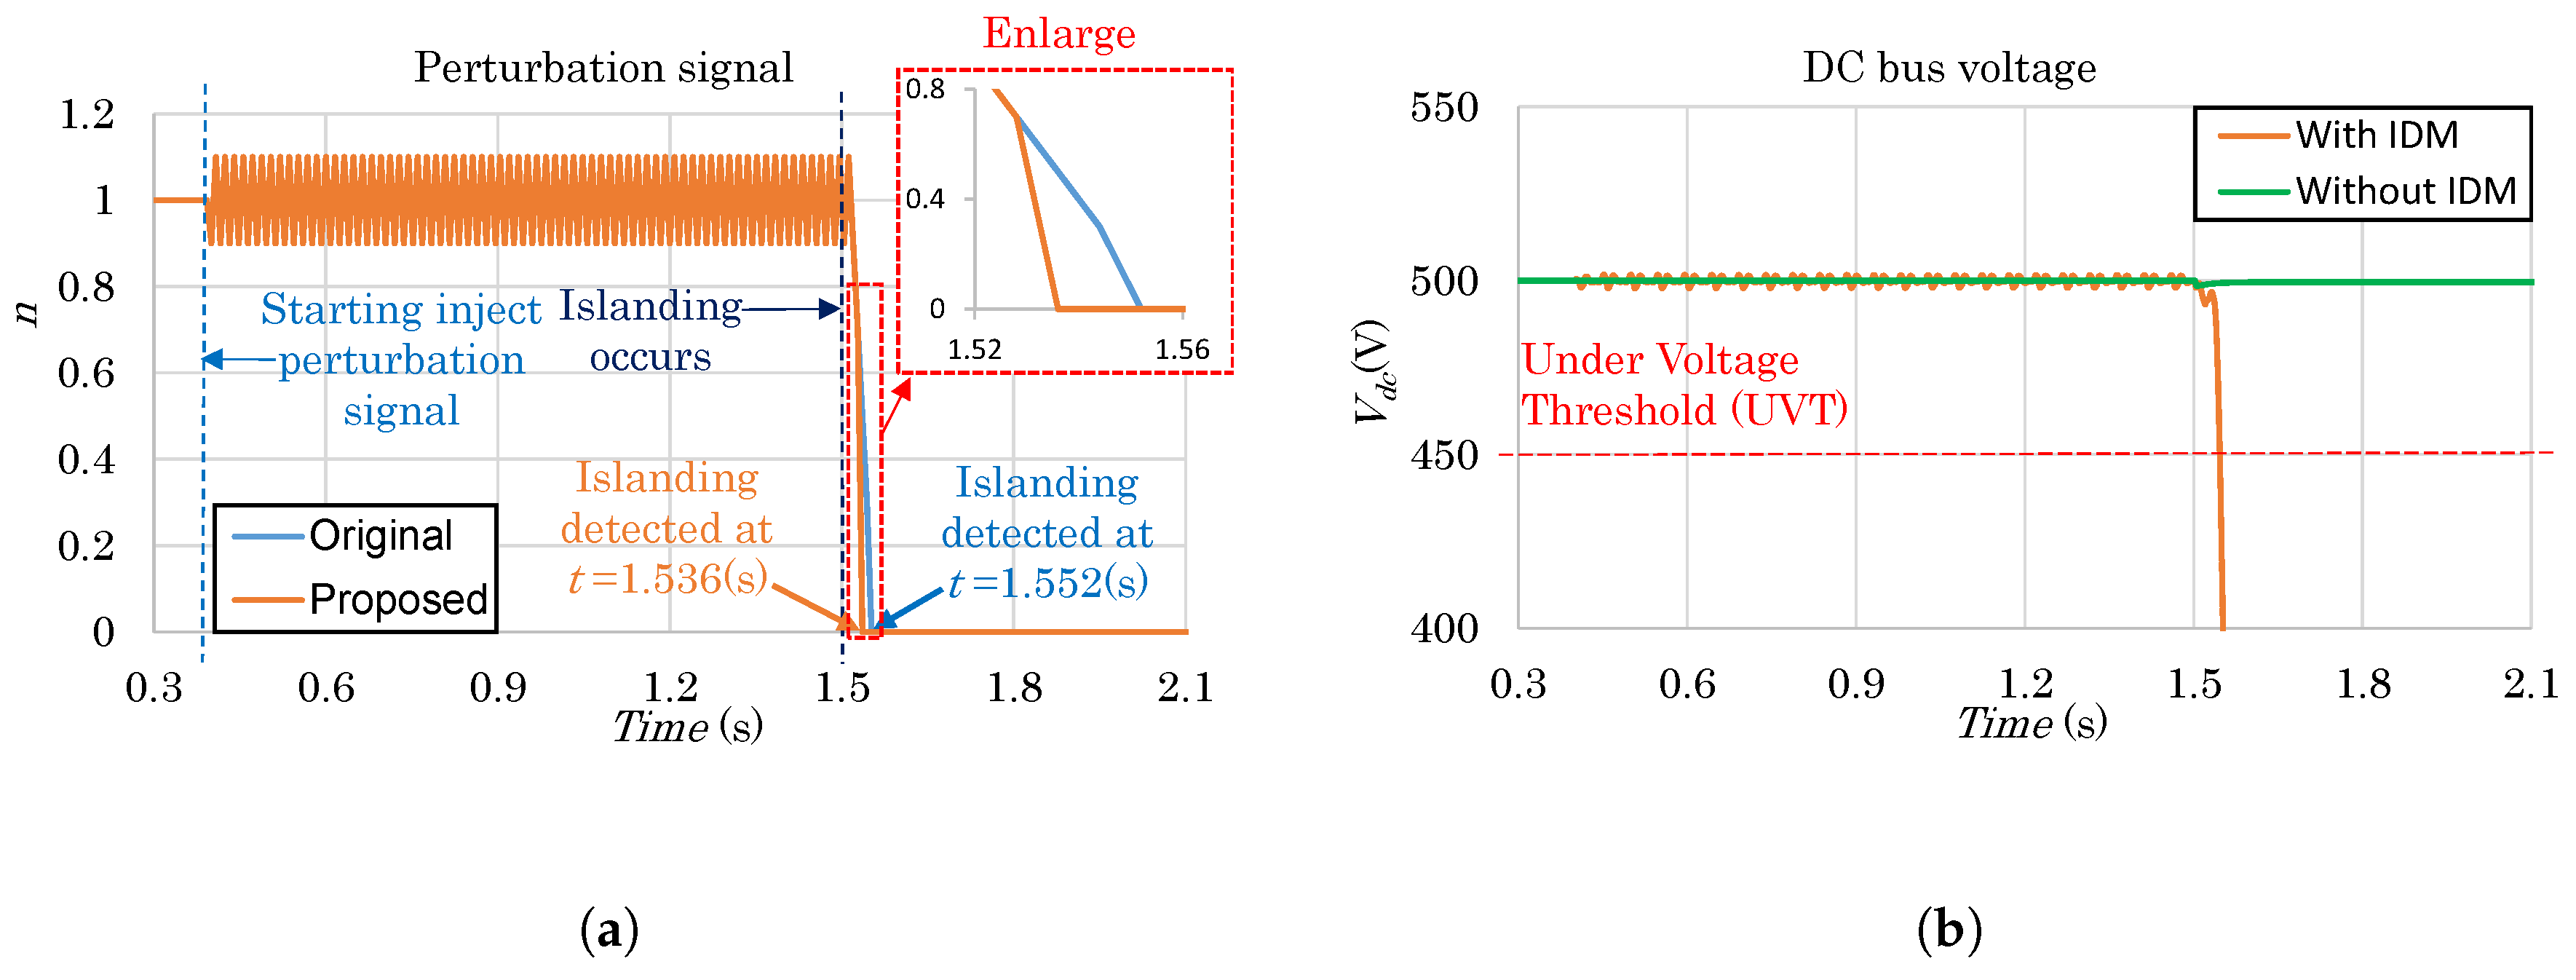
Figure 14.
Result in case of multi-PV operation, 200 kW PV, another islanding condition (case 2): (a) Perturbation signal and (b) DC bus voltage (with and without IDM).
Figure 14.
Result in case of multi-PV operation, 200 kW PV, another islanding condition (case 2): (a) Perturbation signal and (b) DC bus voltage (with and without IDM).

Figure 15.
Result in case of multi-PV operation, 100 kW PV, hardest islanding condition (case 3): (a) Perturbation signal and (b) DC bus voltage (with and without IDM).
Figure 15.
Result in case of multi-PV operation, 100 kW PV, hardest islanding condition (case 3): (a) Perturbation signal and (b) DC bus voltage (with and without IDM).
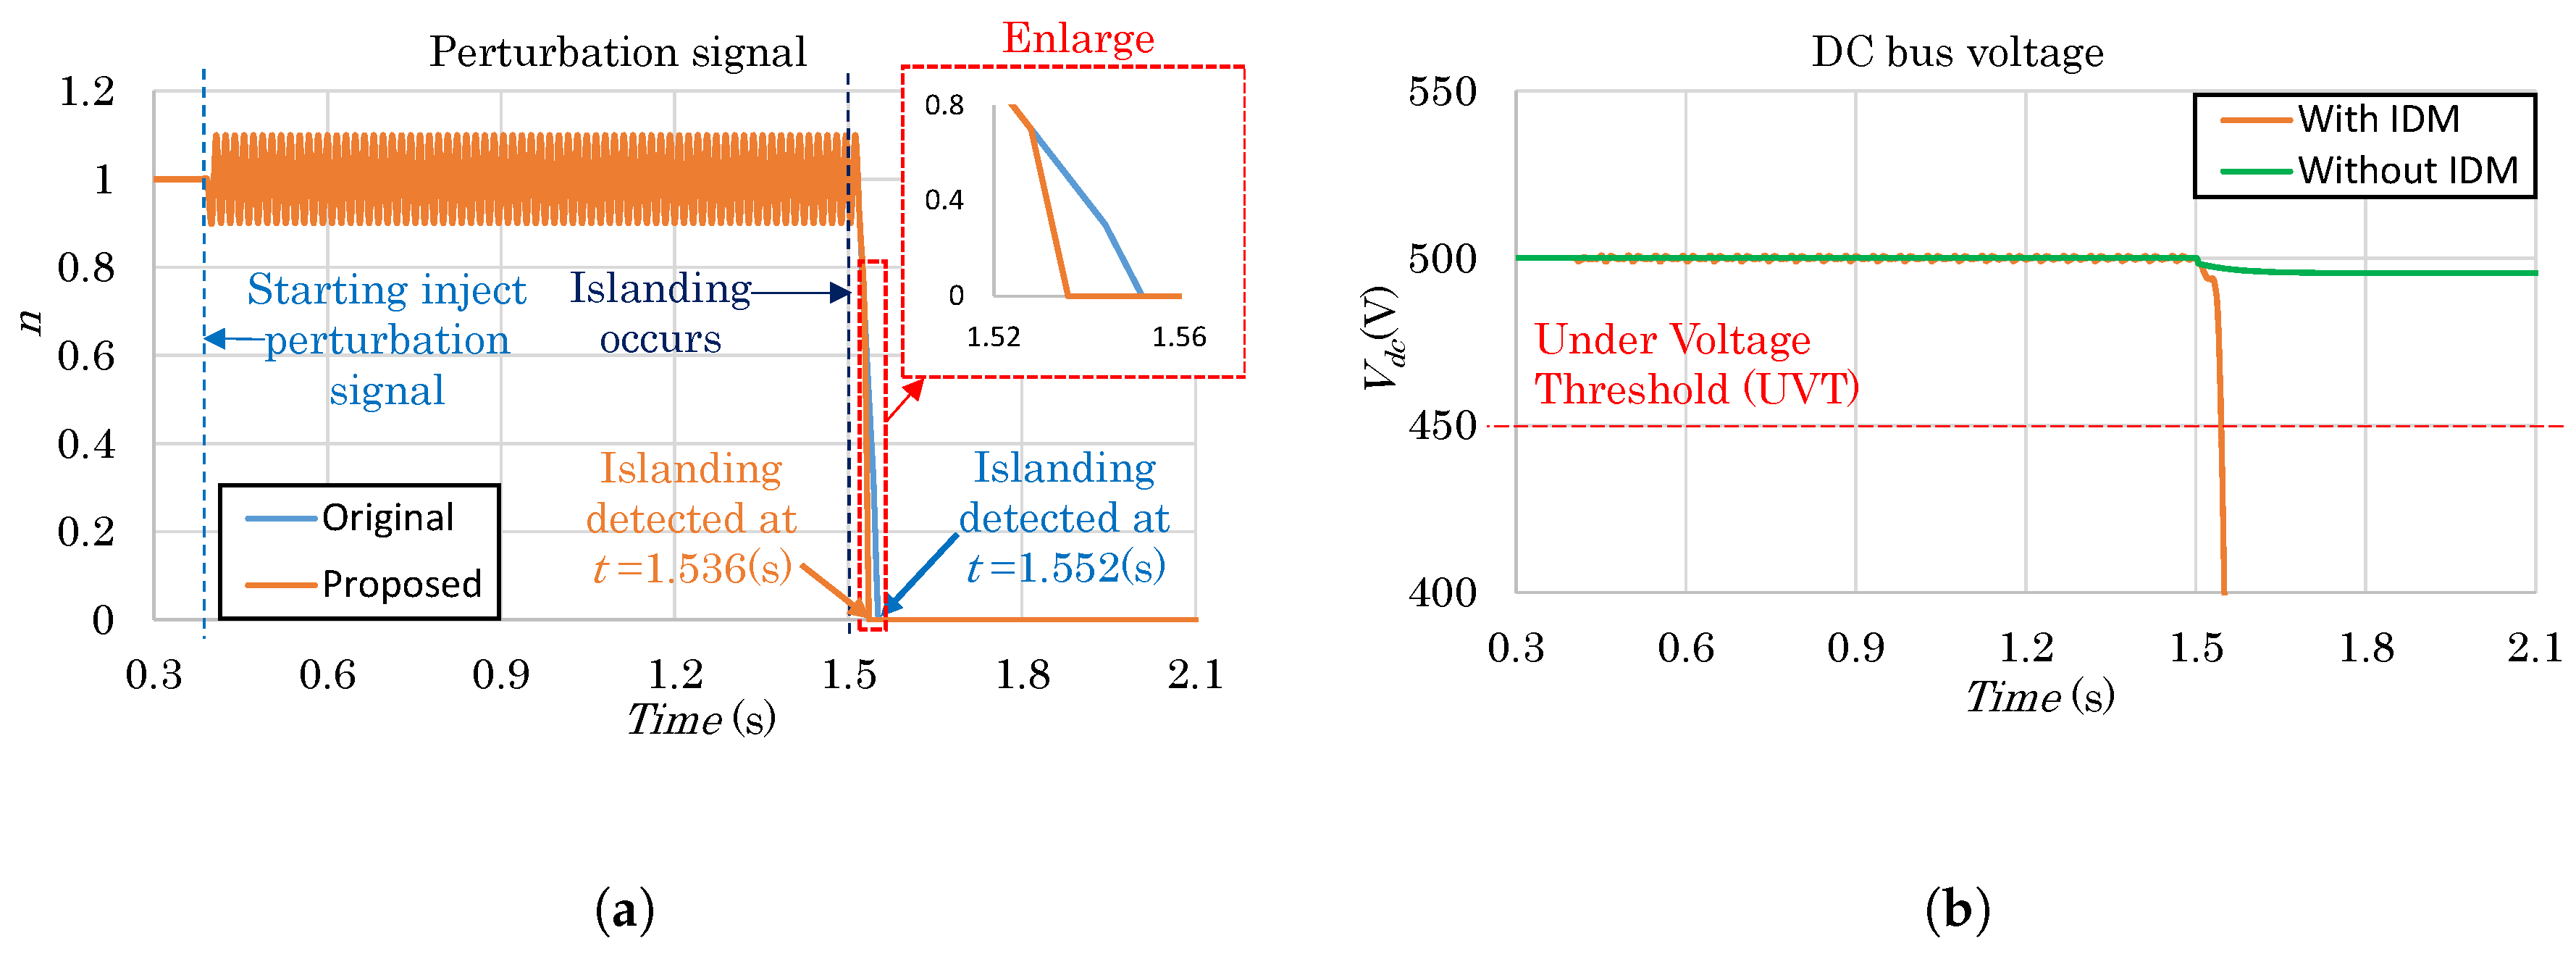
Figure 16.
Result in case of multi-PV operation, 100 kW PV, another islanding condition (case 4): (a) Perturbation signal and (b) DC bus voltage (with and without IDM).
Figure 16.
Result in case of multi-PV operation, 100 kW PV, another islanding condition (case 4): (a) Perturbation signal and (b) DC bus voltage (with and without IDM).

Figure 17.
Result in case of multi-PV operation, 40 kW PV, hardest islanding condition (case 5): (a) Perturbation signal and (b) DC bus voltage (with and without IDM).
Figure 17.
Result in case of multi-PV operation, 40 kW PV, hardest islanding condition (case 5): (a) Perturbation signal and (b) DC bus voltage (with and without IDM).

Figure 18.
Result in case of multi-PV operation, 40 kW PV, another islanding condition (case 6): (a) Perturbation signal and (b) DC bus voltage (with and without IDM).
Figure 18.
Result in case of multi-PV operation, 40 kW PV, another islanding condition (case 6): (a) Perturbation signal and (b) DC bus voltage (with and without IDM).

Table 1.
Islanding detection methods classification.
| Islanding Detection Techniques | ||
|---|---|---|
| Passive | Active | Remote |
| Under/Over Voltage | Impedance measurement | Power line carrier |
| Under/Over Frequency | Reactive power fluctuation | Disconnect signal |
| Voltage harmonics | QC-mode frequency shift | SCADA |
| Voltage phase shift | Reactive power compensation | PMU |
| Voltage unbalance | Load fluctuation | Comparison of rate of change of frequency |
| Total harmonic distortion | Inter-harmonic injection | |
| Rate of change of output power | Sandia frequency shift | |
| Rate of change of frequency | Sandia voltage shift | |
| Frequency bias |
Table 2.
Specifications of SunPower SPR-305E-WHT-D (SunPower, San Jose, CA, USA) PV module.
| Information | Value |
|---|---|
| Open circuit voltage | 64.2 V |
| Short circuit current | 5.96 A |
| Voltage at maximum power point | 54.7 V |
| Current at maximum power point | 5.58 A |
| Maximum power | 305.226 W |
| Parallel strings | 66 |
| Series-connected modules per string | 5 |
| Active PV power at 1000 () and 25 C | 100 kW |
| Active PV power at 500 () and 25 C | 50 kW |
| Active PV power at 250 () and 25 C | 25 kW |
| Active PV power at 100 () and 25 C | 10 kW |
Table 3.
Single PV operation scenario.
| Cases | Total PV (kW) | Total Load (kW) | Vdc (V) |
|---|---|---|---|
| 1 | 50 | 50 | 500 |
| 2 | 50 | 62.5 | 500 |
Table 4.
Multi-PV operation scenario
| Cases | PV1 (kW) | PV2 (kW) | PV3 (kW) | PV4 (kW) | Total PV (kW) | Total Load (kW) | Vdc (V) |
|---|---|---|---|---|---|---|---|
| 1 | 50 | 50 | 50 | 50 | 200 | 200 | 500 |
| 2 | 50 | 50 | 50 | 50 | 200 | 250 | 500 |
| 3 | 25 | 25 | 25 | 25 | 100 | 100 | 500 |
| 4 | 25 | 25 | 25 | 25 | 100 | 125 | 500 |
| 5 | 10 | 10 | 10 | 10 | 40 | 40 | 500 |
| 6 | 10 | 10 | 10 | 10 | 40 | 50 | 500 |
© 2018 by the authors. Licensee MDPI, Basel, Switzerland. This article is an open access article distributed under the terms and conditions of the Creative Commons Attribution (CC BY) license (http://creativecommons.org/licenses/by/4.0/).
Share and Cite
MDPI and ACS Style
Tran, T.S.; Nguyen, D.T.; FUJITA, G. Islanding Detection Method Based on Injecting Perturbation Signal and Rate of Change of Output Power in DC Grid-Connected Photovoltaic System. Energies 2018, 11, 1313. https://doi.org/10.3390/en11051313
AMA Style
Tran TS, Nguyen DT, FUJITA G. Islanding Detection Method Based on Injecting Perturbation Signal and Rate of Change of Output Power in DC Grid-Connected Photovoltaic System. Energies. 2018; 11(5):1313. https://doi.org/10.3390/en11051313
Chicago/Turabian StyleTran, Thanh Son, Duc Tuyen Nguyen, and Goro FUJITA. 2018. "Islanding Detection Method Based on Injecting Perturbation Signal and Rate of Change of Output Power in DC Grid-Connected Photovoltaic System" Energies 11, no. 5: 1313. https://doi.org/10.3390/en11051313
Note that from the first issue of 2016, this journal uses article numbers instead of page numbers. See further details here.