Risk Assessment and Reduction for an Innovative Subsurface Well Completion System


1
School of Naval Architecture and Ocean Engineering, Dalian University of Technology (DUT), Dalian 116024, China
2
Department of Marine Technology, Norwegian University of Science and Technology (NTNU), 7491 Trondheim, Norway
3
Centre for Autonomous Marine Operations and Systems (SFF AMOS), Norwegian University of Science and Technology (NTNU), 7491 Trondheim, Norway
4
Center for Research-Based Innovation of Marine Operations (SFI MOVE), Norwegian University of Science and Technology (NTNU), 7491 Trondheim, Norway
5
State Key Laboratory of Structural Analysis of Industrial Equipment, Dalian University of Technology (DUT), Dalian 116024, China
*
Author to whom correspondence should be addressed.
Energies 2018, 11(5), 1306; https://doi.org/10.3390/en11051306
Submission received: 4 April 2018
/
Revised: 3 May 2018
/
Accepted: 14 May 2018
/
Published: 20 May 2018
Abstract
:In recent years, many oil and gas fields have been discovered in ultra-deep sea (UDS). Some of these fields are evaluated to have no commercial value if existing oil field development approaches are used, especially while the oil prices remain low. A new alternative field development solution, termed as Subsurface Well Completion (SWC) system, is proposed with the aim to produce oil and gas in a cost-effective manner in UDS. This system primarily consists of four parts: a tethered subsurface platform, the rigid riser, SWC equipment and flexible jumper. Obviously, central to the evaluation and application of the new SWC technology is the inherent risk relative to acceptance level. In particular, an uncontrolled release of hydrocarbons to sea, which may lead to catastrophical consequences involving personnel risk, environmental damage and economic losses, is a main contributor to the total risk and of great concern to the offshore petroleum industry. As for the new SWC system, any failure will not be a direct source of risk for the personnel on the surface installation due to its offset feature. In this context, this paper proposes a quantitative risk assessment (QRA) framework to assess such uncontrolled releases to sea with regard to the SWC system for an oil field in the production phase based on the new Subsurface Tension Leg Production (STLP) facility. According to the QRA results presented in this paper, the identified scenarios representing uncontrolled releases to sea are subsea wellhead leaks, rigid riser leaks, subsurface wellhead leaks, releases from X-mas tree and flexible jumper leaks. Among these scenarios, subsea wellhead is found to be the high-risk area. Compared with the established risk acceptance criteria (RAC), the environmental risk levels for the subsea wellhead’s leak lie within the As Low As Reasonably Practicable (ALARP) region while other risks are all below ALARP limits, which means that there is a need for improved consideration of the existing design with regard to the subsea wellhead area, and the corresponding risk reduction measures are proposed. Furthermore, the sources and effects of uncertainties are reviewed and sensitivity studies are carried out to illustrate the effect of some of the important assumptions in the risk model. It can be found that some assumptions made are conservative or optimistic while others are unknown. However, the final QRA results can be regarded as somewhat conservative. This paper concludes that the new SWC technology has a distinct advantage with respect to the leakage duration time in UDS, and thus mitigates the environmental and commercial impacts to a large extent. Besides, relaxed design requirements for the X-mas tree and flexible jumper can be accepted. It is also concluded that there are no serious and major commercial losses for all the identified accidental release scenarios, which is of great importance and attractiveness to oil producers.
1. Introduction
1.1. Background
In recent years, hundreds of UDS oil and gas fields have been discovered. Some of these fields are evaluated to have no commercial value using existing conventional oil field development approaches [1] (dry tree units or subsea developments, or a combination of both [2]), especially while oil prices remain low.
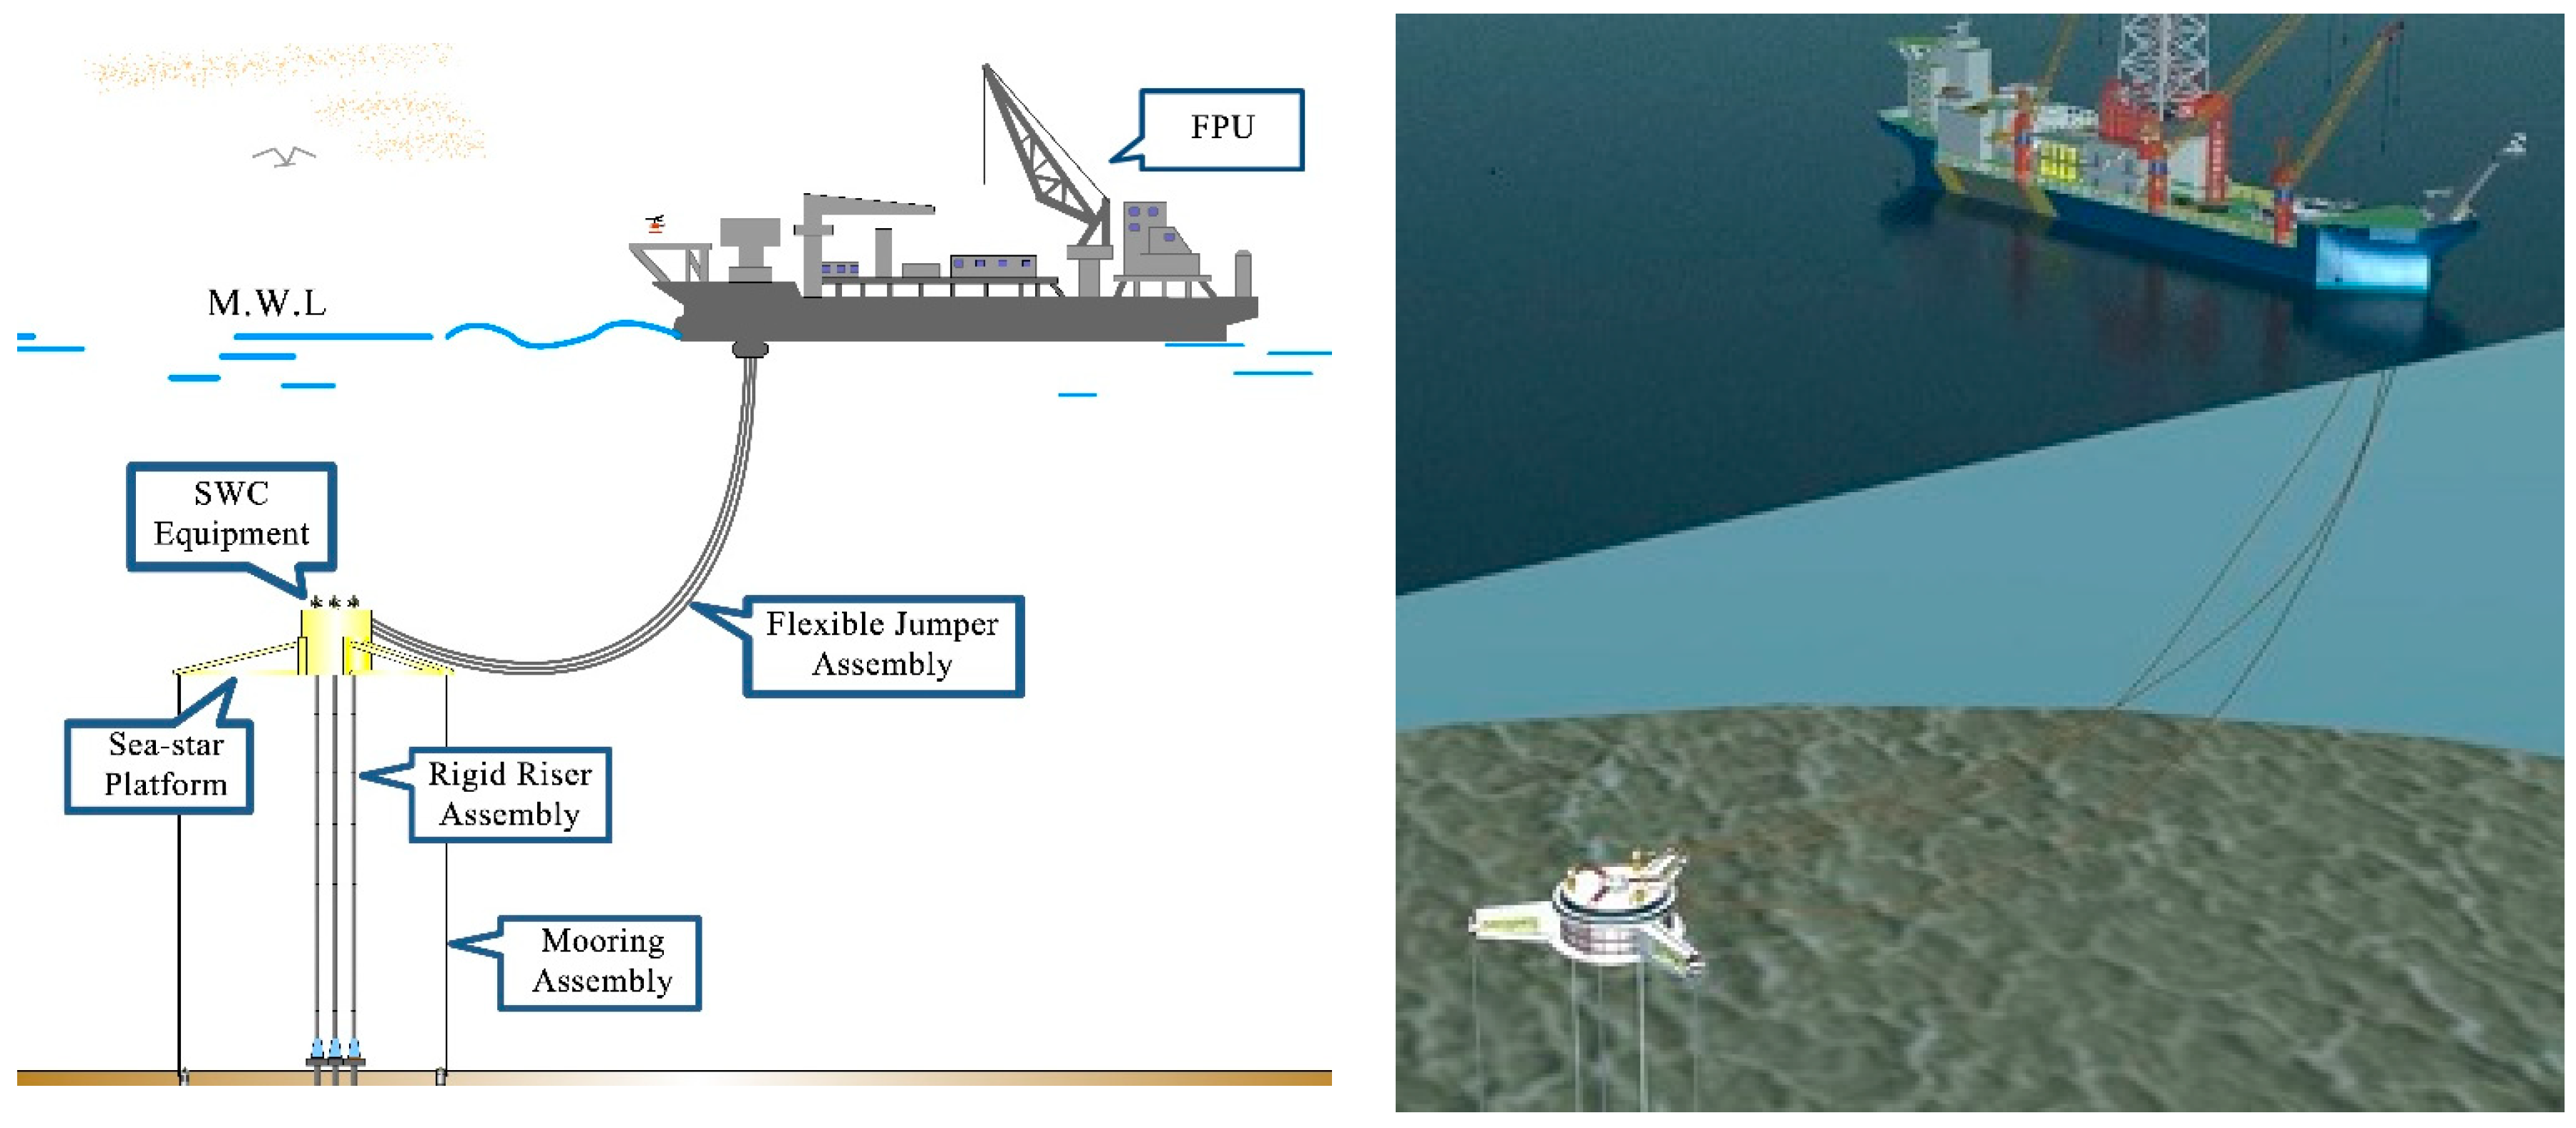
In this context, the STLP system concept [3,4], as illustrated in Figure 1, is proposed and can be regarded as a subsurface development, which is a totally new oil field development approach. The STLP facility aims at producing oil and gas in a cost-effective manner in UDS and primarily consists of four parts: a tethered subsurface Sea-star platform (SSP), rigid risers, SWC equipment and flexible jumpers. The top of SSP is positioned some distances below Mean Water Level (M.W.L) to minimize the effects of direct loads from waves and strong surface currents.
With respect to the new SWC technology, shallow-water rated X-mas trees are installed on top of the subsurface wellheads while shallow-water rated flexible jumpers are used to connect these X-mas trees to the Floating Production Unit (FPU). The following key advantages of the STLP facility in UDS [5,6] are envisaged:
- (1)
- In place riser fatigue is low due to the location of SSP away from the wave zone.
- (2)
- Compared with the conventional dry tree production vessels, light weighted FPU can be considered in service as the SWC equipment, rigid risers and SSP are all decoupled from the FPU motions.
- (3)
- Direct access to local subsea wells is provided, and thus demanding flow assurance requirements can be met.
- (4)
- Field layout is optimized and allows large offshore developments and unforeseen future field expansion, as a large number of subsurface wells can be supported.
- (5)
- Shallow-water rated SWC technology offers improved technical and commercial performance in UDS.
- (6)
- Pre-installation of SSP, rigid risers and SWC equipment provides flexibility to the installation schedule.
1.2. Motivation and Objective
Aiming to drill deep sea exploration and appraisal wells, China Oilfield Services Ltd. (COSL), as the major offshore oilfield service company in China, selected two ways stepping into deep sea [7]. One way is to build a totally new deep-water semi-submersible and the other way is to modify existing semi-submersibles to the deep-water drilling rigs. As it would take a long time to construct a totally new deep-water semi-submersible, COSL finally decided to utilize proper facilities for improving existing semi-submersibles’ drilling capacity at various water depths. Be aware of the attractive technical features of subsurface wells in deep water, COSL has, since June 2004, carried out a series of laboratory tests and sea trials to prove the technical feasibility of the subsurface well for deep-water drilling activities based on the Artificial Seabed Deep-water Drilling system (ASDD system) [7,8,9,10]. Large trial subsurface well operations had been performed in the South China Sea (SCS) in the period of 2008 to 2009 with successful results. Nevertheless, ASDD technology is still not field proven and its safety is questioned [1]. In 2011, Dalian University of Technology (DUT) initiated related research activities to further develop the subsurface well technology in UDS. Then, a new STLP system concept was proposed and developed. The STLP facility utilizes the new SWC technology and meets large offshore developments successfully as a large number of subsurface wells can be supported. It is noted that central to the evaluation of both the ASDD and STLP facility is the question of risk in relation to the subsurface well application. In the light of this, a study of the subsurface well safety in drilling, completion, production, workover, and abandonment activities was carried out by DUT in collaboration with the Norwegian University of Science and Technology (NTNU).
An uncontrolled release of hydrocarbons to sea, which may have catastrophical consequences involving personnel risk, environmental damage and economic loss, is a main contributor to the total risk and of great concern to the offshore petroleum industry. The main objective of this paper is to propose and apply a QRA framework [11] for such uncontrolled releases to sea in the production phase with regard to the SWC system of the STLP facility. The paper hence deals with the identification of the area or the equipment that needs further improvements. Moreover, the corresponding risk reduction measures are focused in order to improve the safety of the present SWC system.
1.3. Structure of the Paper
The content of this paper is structured as follows: Section 2 describes the main characteristics of the studied SWC system in the STLP facility. In Section 3, appropriate RAC incorporating the environmental risk acceptance criteria (ERAC) and commercial risk acceptance criteria (CRAC) are established. Section 4 identifies typical scenarios representing uncontrolled releases to sea for the specific SWC system. In Section 5, the overall risk model is developed. The probabilities and consequences associated with each of the risk sub-models are investigated. Section 6 evaluates the calculated risks against the established RAC. In addition, recommended risk reduction measures are proposed. Section 7 carries out the uncertainty assessment while the critical topic for further research is also suggested. Conclusions are summarized in the final section.
2. SWC System Characteristics
The main characteristics of a SWC system are described in this section. In particular, the SWC process and the specific subsurface well configuration in the production phase are introduced. The aim is to define and establish boundary conditions for the QRA of the SWC system. The design basis is presented for the further study and discussions in this paper.
2.1. Subsurface Well Types and Life Cycle
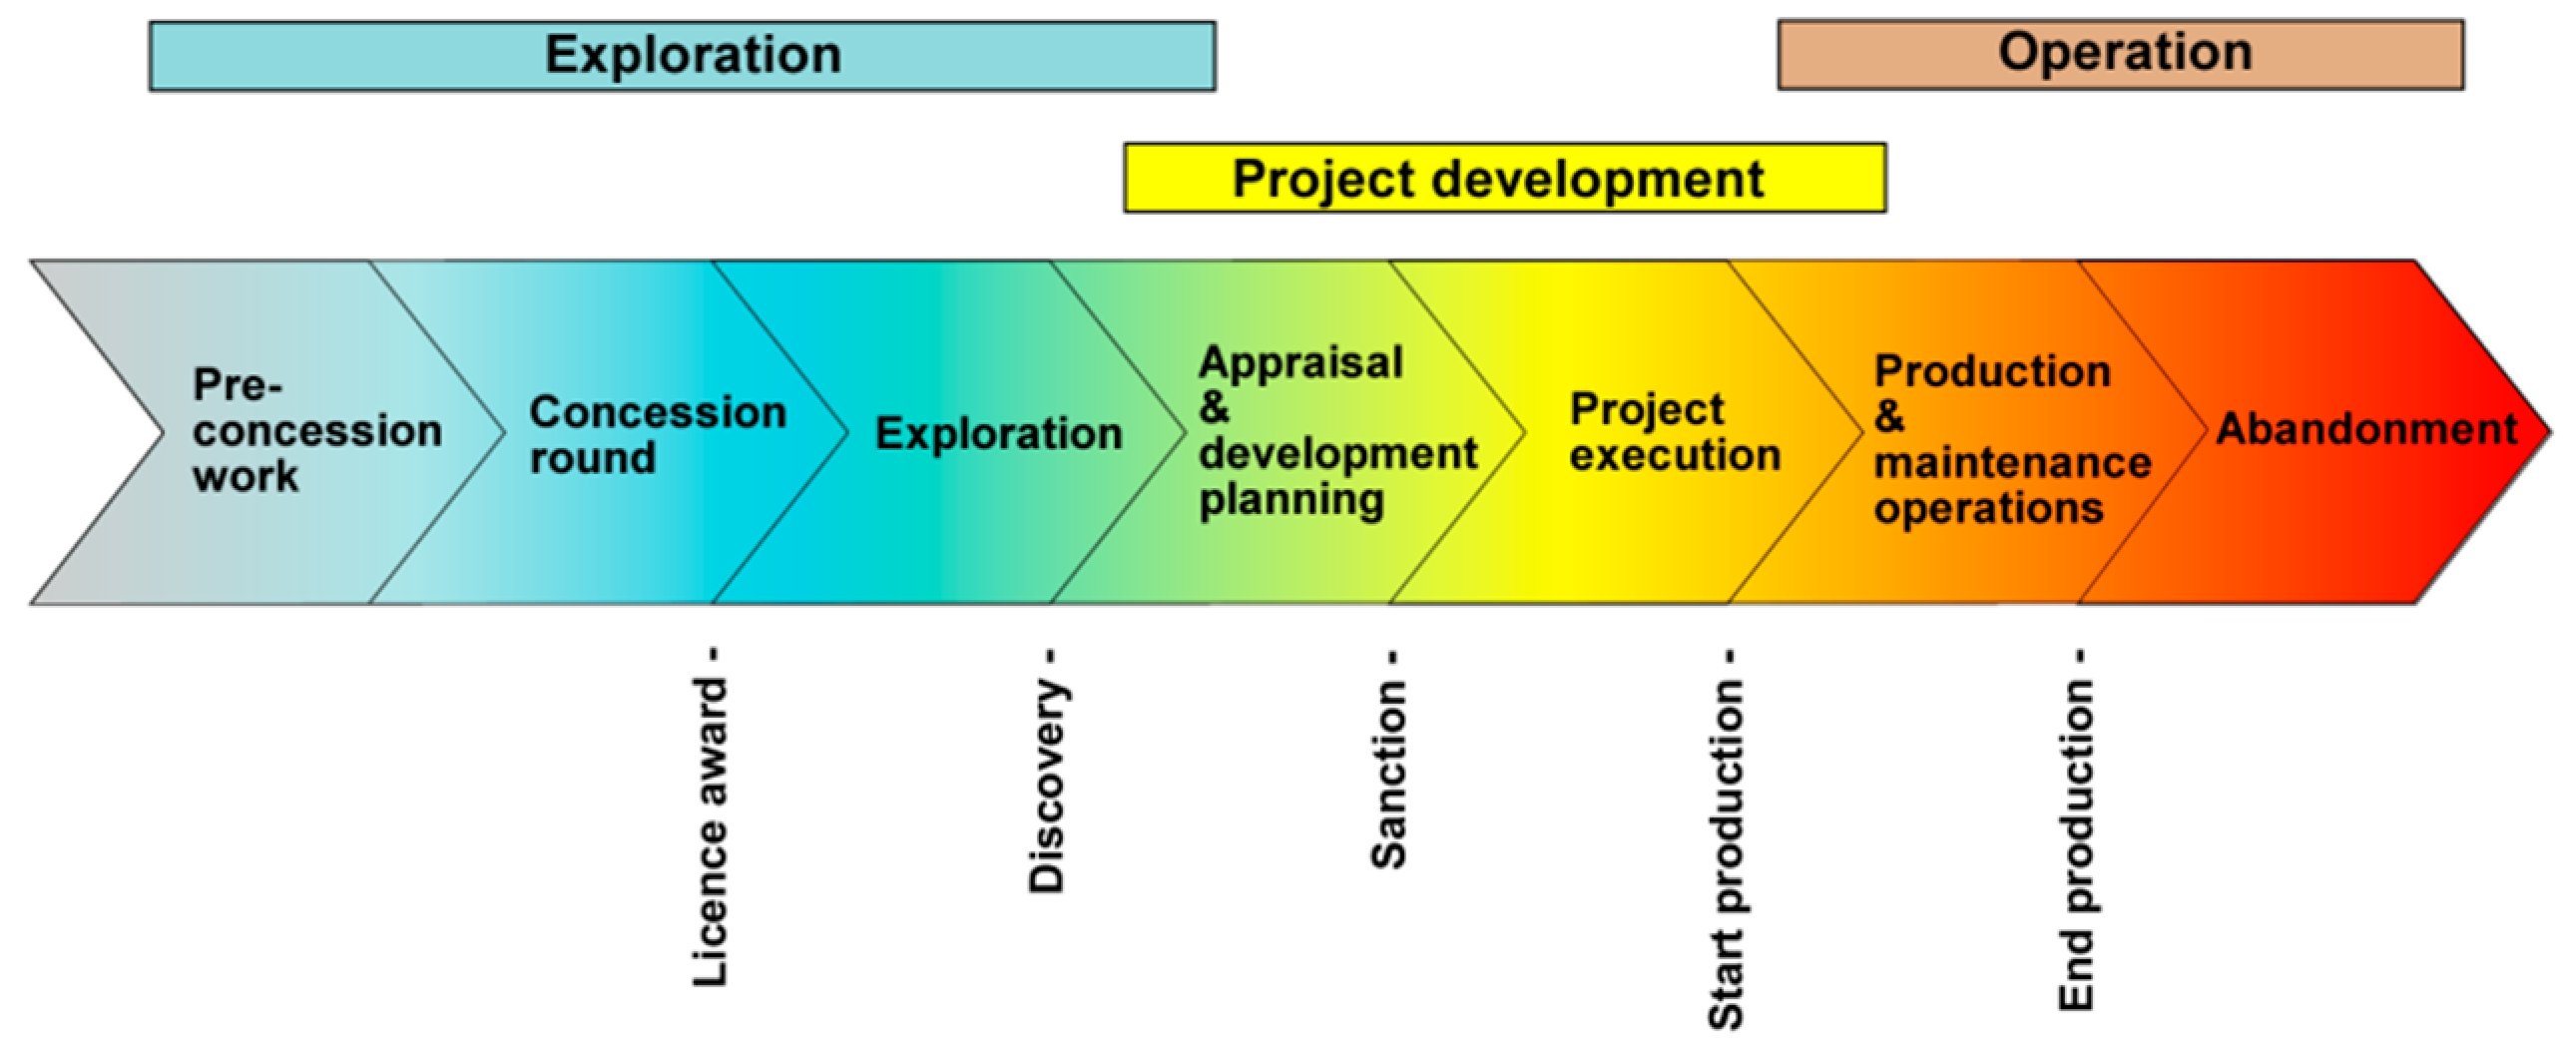
There can be different types of subsurface wells that are used for offshore field developments: exploration well, appraisal and delineating well, production well, injection well. After drilling, subsurface wells may be completed for production and/or injection. Production wells transport well fluids from the reservoir to the process facilities, while injection wells are normally used to inject water or gas to the reservoir to maintain pressure. Figure 2 illustrates the entire life cycle of a subsurface well in different stages [12]. As has been noted, this paper is concerned with the production phase of an oil field.
2.2. SWC Process and Configuration
SWC takes place in order to prepare the subsurface well for production when the subsurface wellhead makes connection with the subsea wellhead via the rigid riser. Typical steps are as follows:
- (1)
- A production tubing is run in hole, tubing hanger landed on the subsurface wellhead and production packer is set.
- (2)
- A vertical X-mas tree is installed on top of the subsurface wellhead.
- (3)
- A control umbilical coming from FPU is used to control the X-mas tree and downhole function.
- (4)
- A flexible jumper is connected to the X-mas tree for production, as shown in Figure 1.
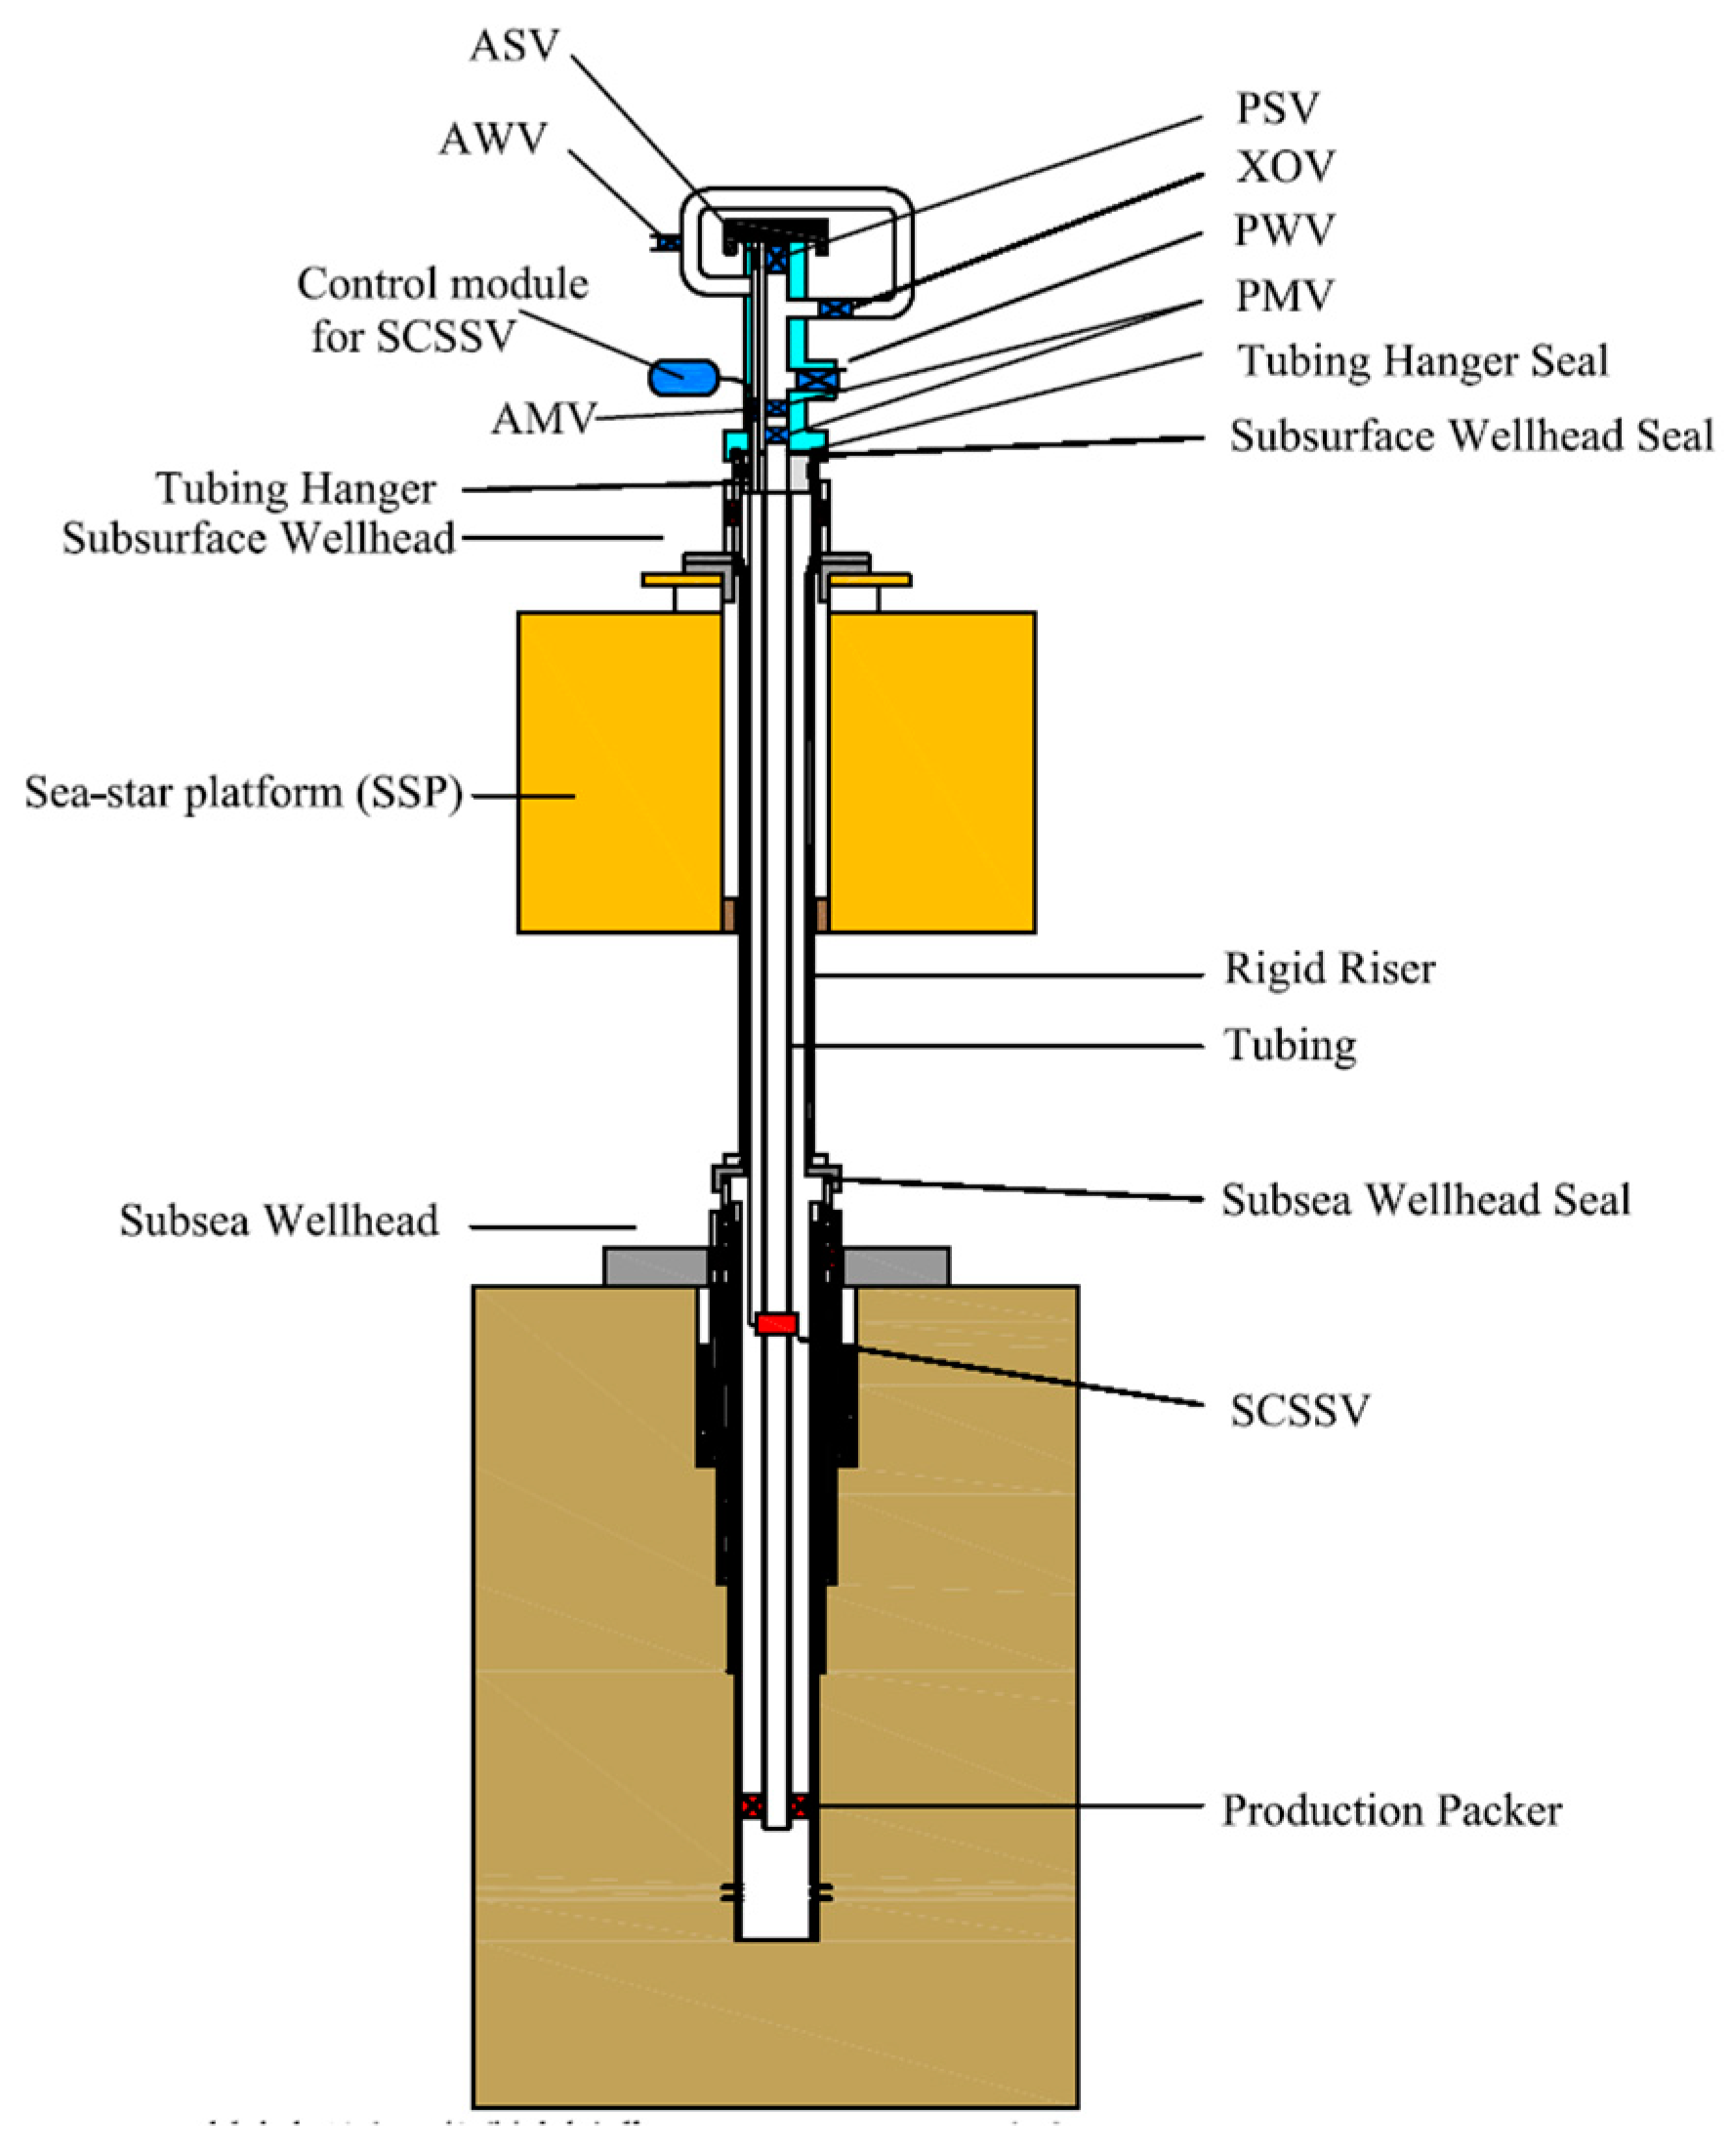
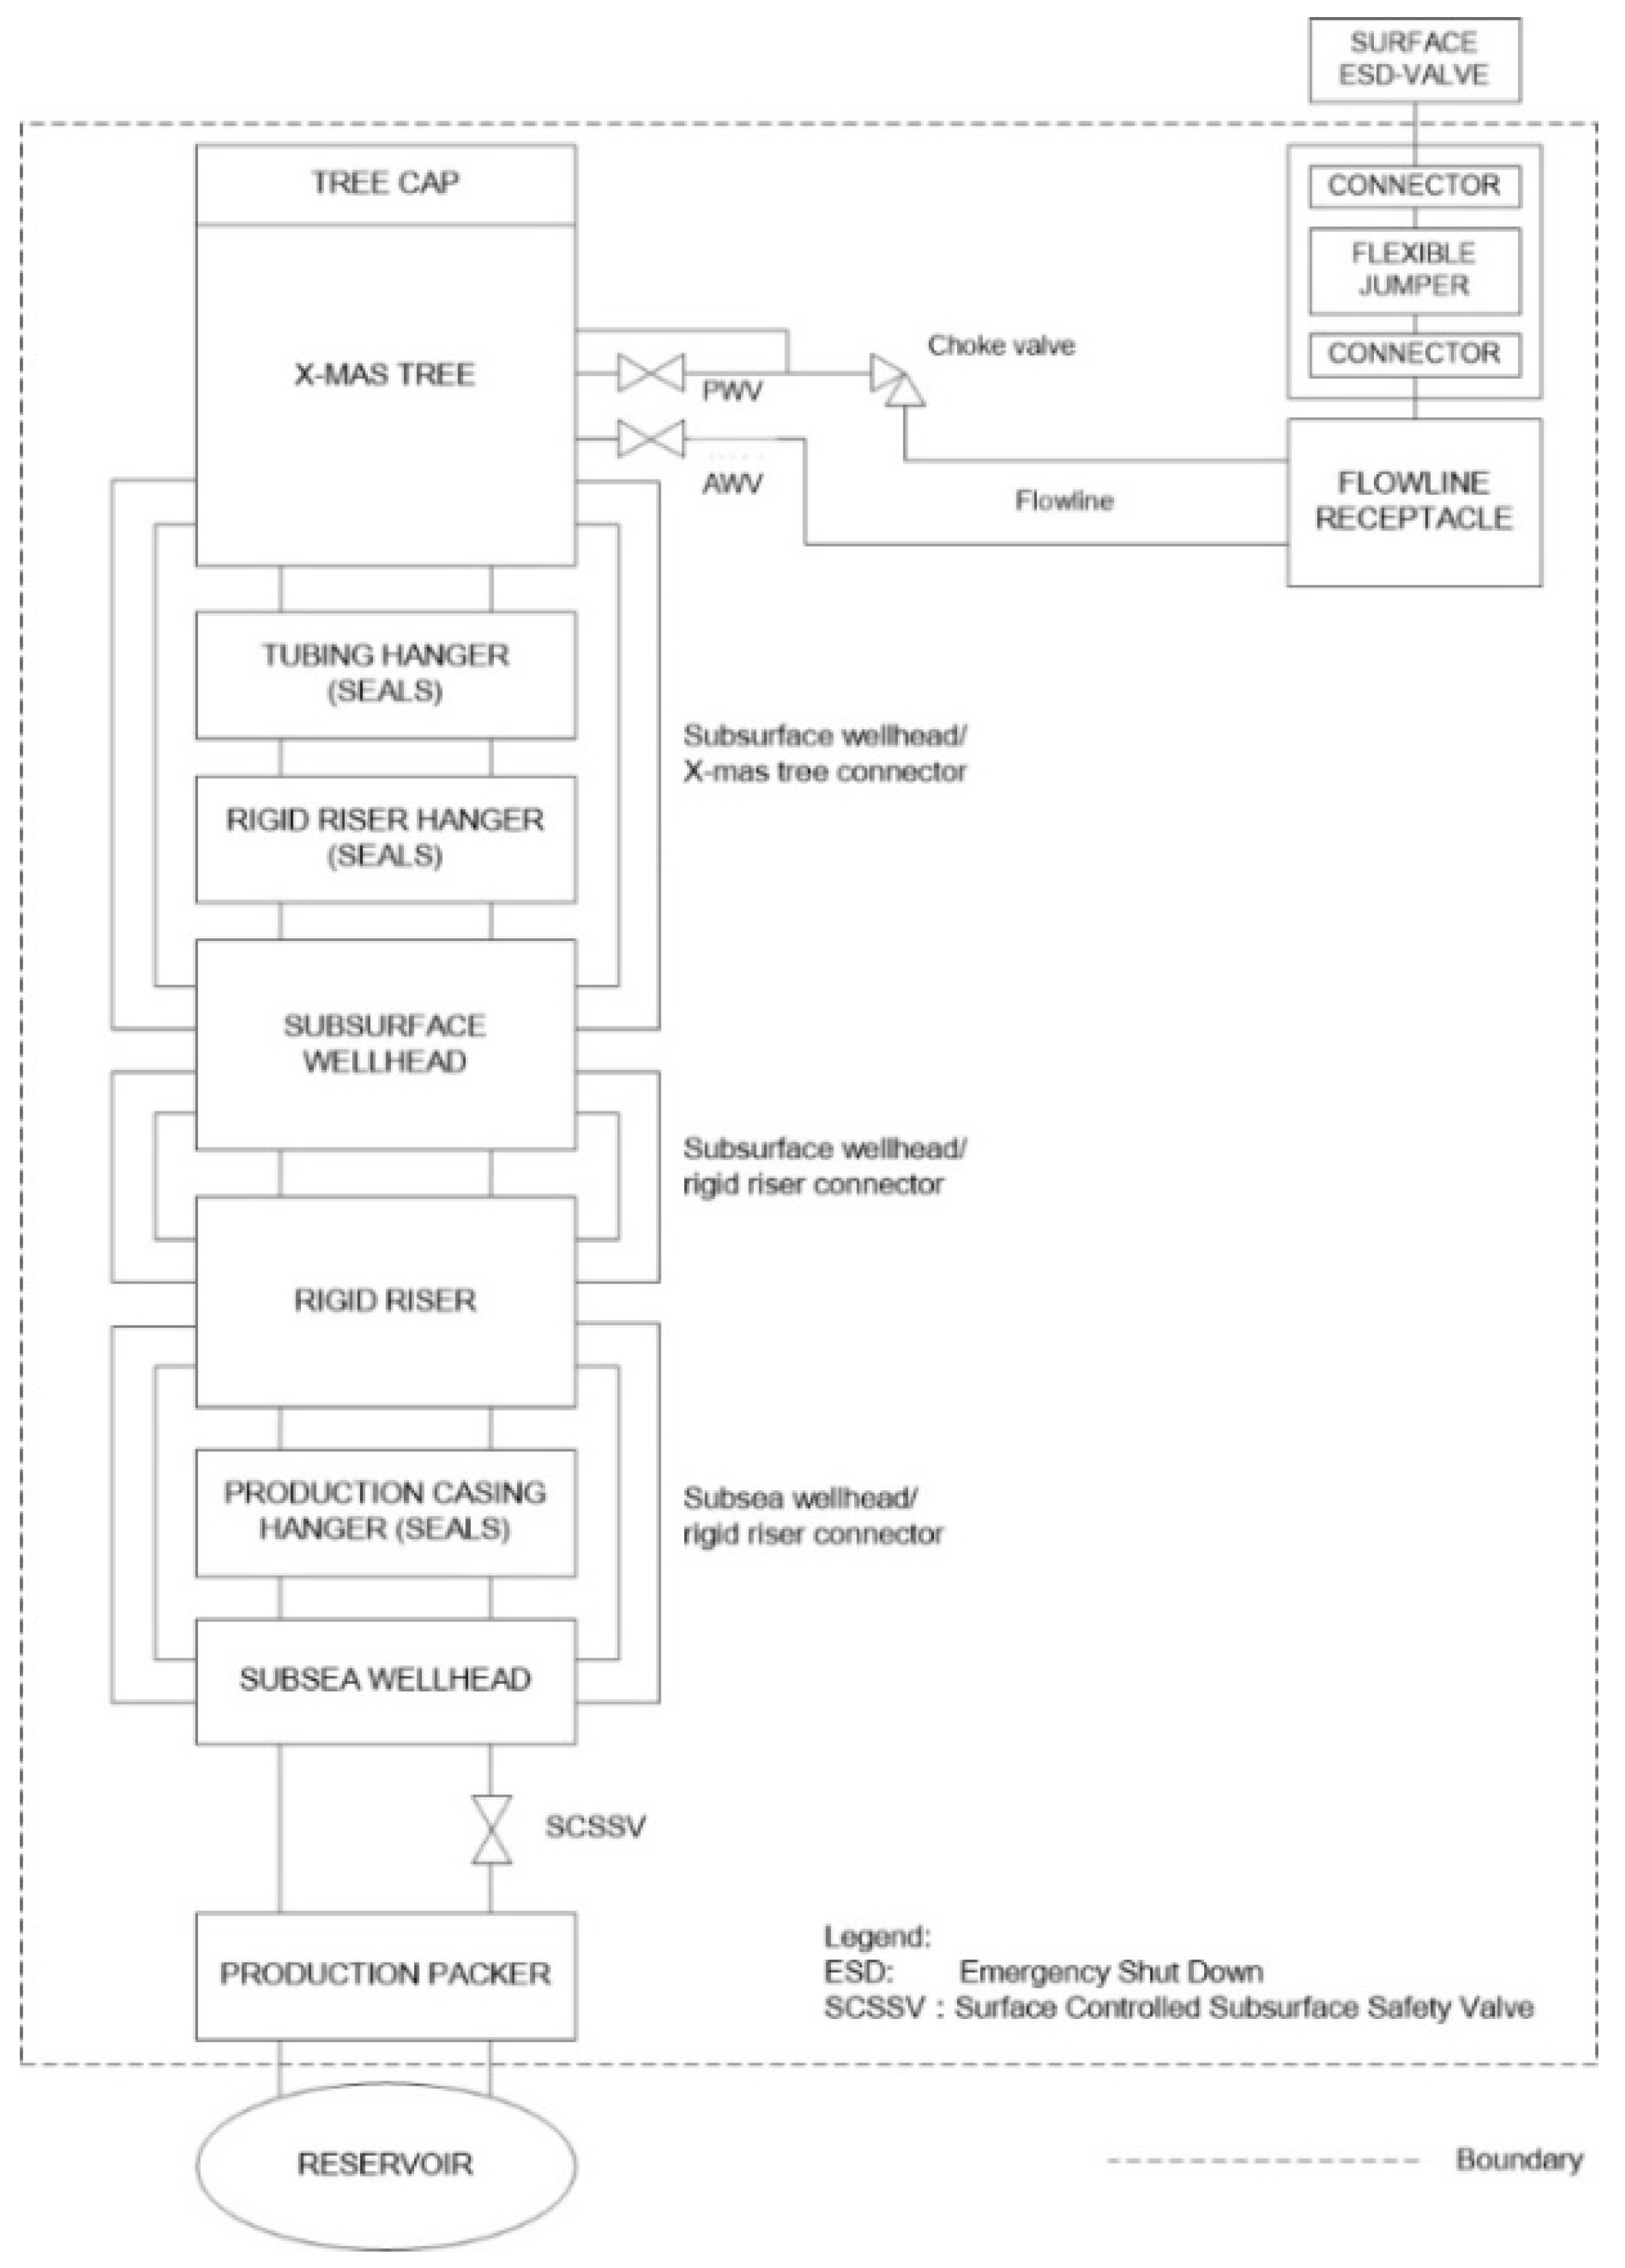
Figure 3 shows a specific subsurface production well of the STLP facility. The detailed working principle and technical feasibility of the STLP facility have been presented in the granted patents and different academic papers [2,3,4,5]. The scope of the study is limited to the system from the downhole to the flexible jumper, while the control system and other topside equipment are not included, as shown in Figure 4.
The studied SWC system consists of the following main items: (1) Annulus master valve (AMV); (2) Annulus swab valve (ASV); (3) Annulus wing valve (AWV); (4) Choke valve (CV); (5) Crossover valve (XOV); (6) Flexible jumper; (7) Production master valve (PMV); (8) Production packer; (9) Production swab valve (PSV); (10) Production wing valve (PWV); (11) Rigid riser; (12) Rigid riser hanger seal; (13) Surface controlled subsurface safety valve (SCSSV); (14) Subsea wellhead seal; (15) Subsurface wellhead seal; (16) Tubing; (17) Tubing hanger seal.
2.3. Design Basis
The primary design basis and main characteristics of the STLP facility are tabulated, as shown in Table 1.
3. Risk Acceptance Criteria
In view of the special characteristics of the SWC system in the production phase, subsurface well is at a significant distance from FPU. Thus, any failure of the SWC facilities will not have a significant and direct risk for the personnel on the FPU. Nonetheless, such failures can cause environmental damage and economic loss. Based on a thorough review of alternative RAC [13,14,15], specific ERAC and CRAC are established, as shown in Table 2 and Table 3. Both ERAC and CRAC values are focused on the maximum acceptable annual probability and corresponding release quantity of oil to sea.
Normally, the costs of a technical system failure can be divided into three main parts: (1) material damage and production delay; (2) global cleanup cost; (3) compensation of damages. In this study, as the expected value of material damage and production delay are, as for the expected amount spilled, entirely artificial values [16], the failure costs are focused on the last two cost components-global cleanup cost and the compensation of damages. Generic values for the compensation of damages are also hard to estimate. However, it can be assumed that the compensation costs are related to the environmental & socioeconomic costs [15]. It is acknowledged that the relationship between cleanup costs and environmental & socioeconomic costs will be strongly dependent on the accident type, location, etc. However, for the purpose of this general study, environmental and socioeconomic costs are assumed to be 150% of the global cleanup cost [14]. As the weighted global average worldwide cleanup cost per ton oil spilled is 15,900 USD [14], it can be noted from Table 3 that the CRAC has also used the corresponding released amount of oil to sea to define the equivalent consequence class. Nonetheless, risk reduction measures should be further investigated according to the ALARP principle even though the RAC is fulfilled. Here, the ALARP area is defined as the risk from 20 to 100% of the acceptance criterion, which means that risk reduction measures should be considered if the estimated risk level exceeds 20% of the acceptance criterion.
4. Hazard Identification
The hazards considered in this paper refer to consequences in terms of uncontrolled releases to sea. The scenarios that may lead to such hazardous events are identified as follows:
- (1)
- Subsea wellhead leaks
- (2)
- Rigid riser leaks
- (3)
- Subsurface wellhead leaks
- (4)
- Release from X-mas tree
- (5)
- Flexible jumper leaks
5. Risk Models
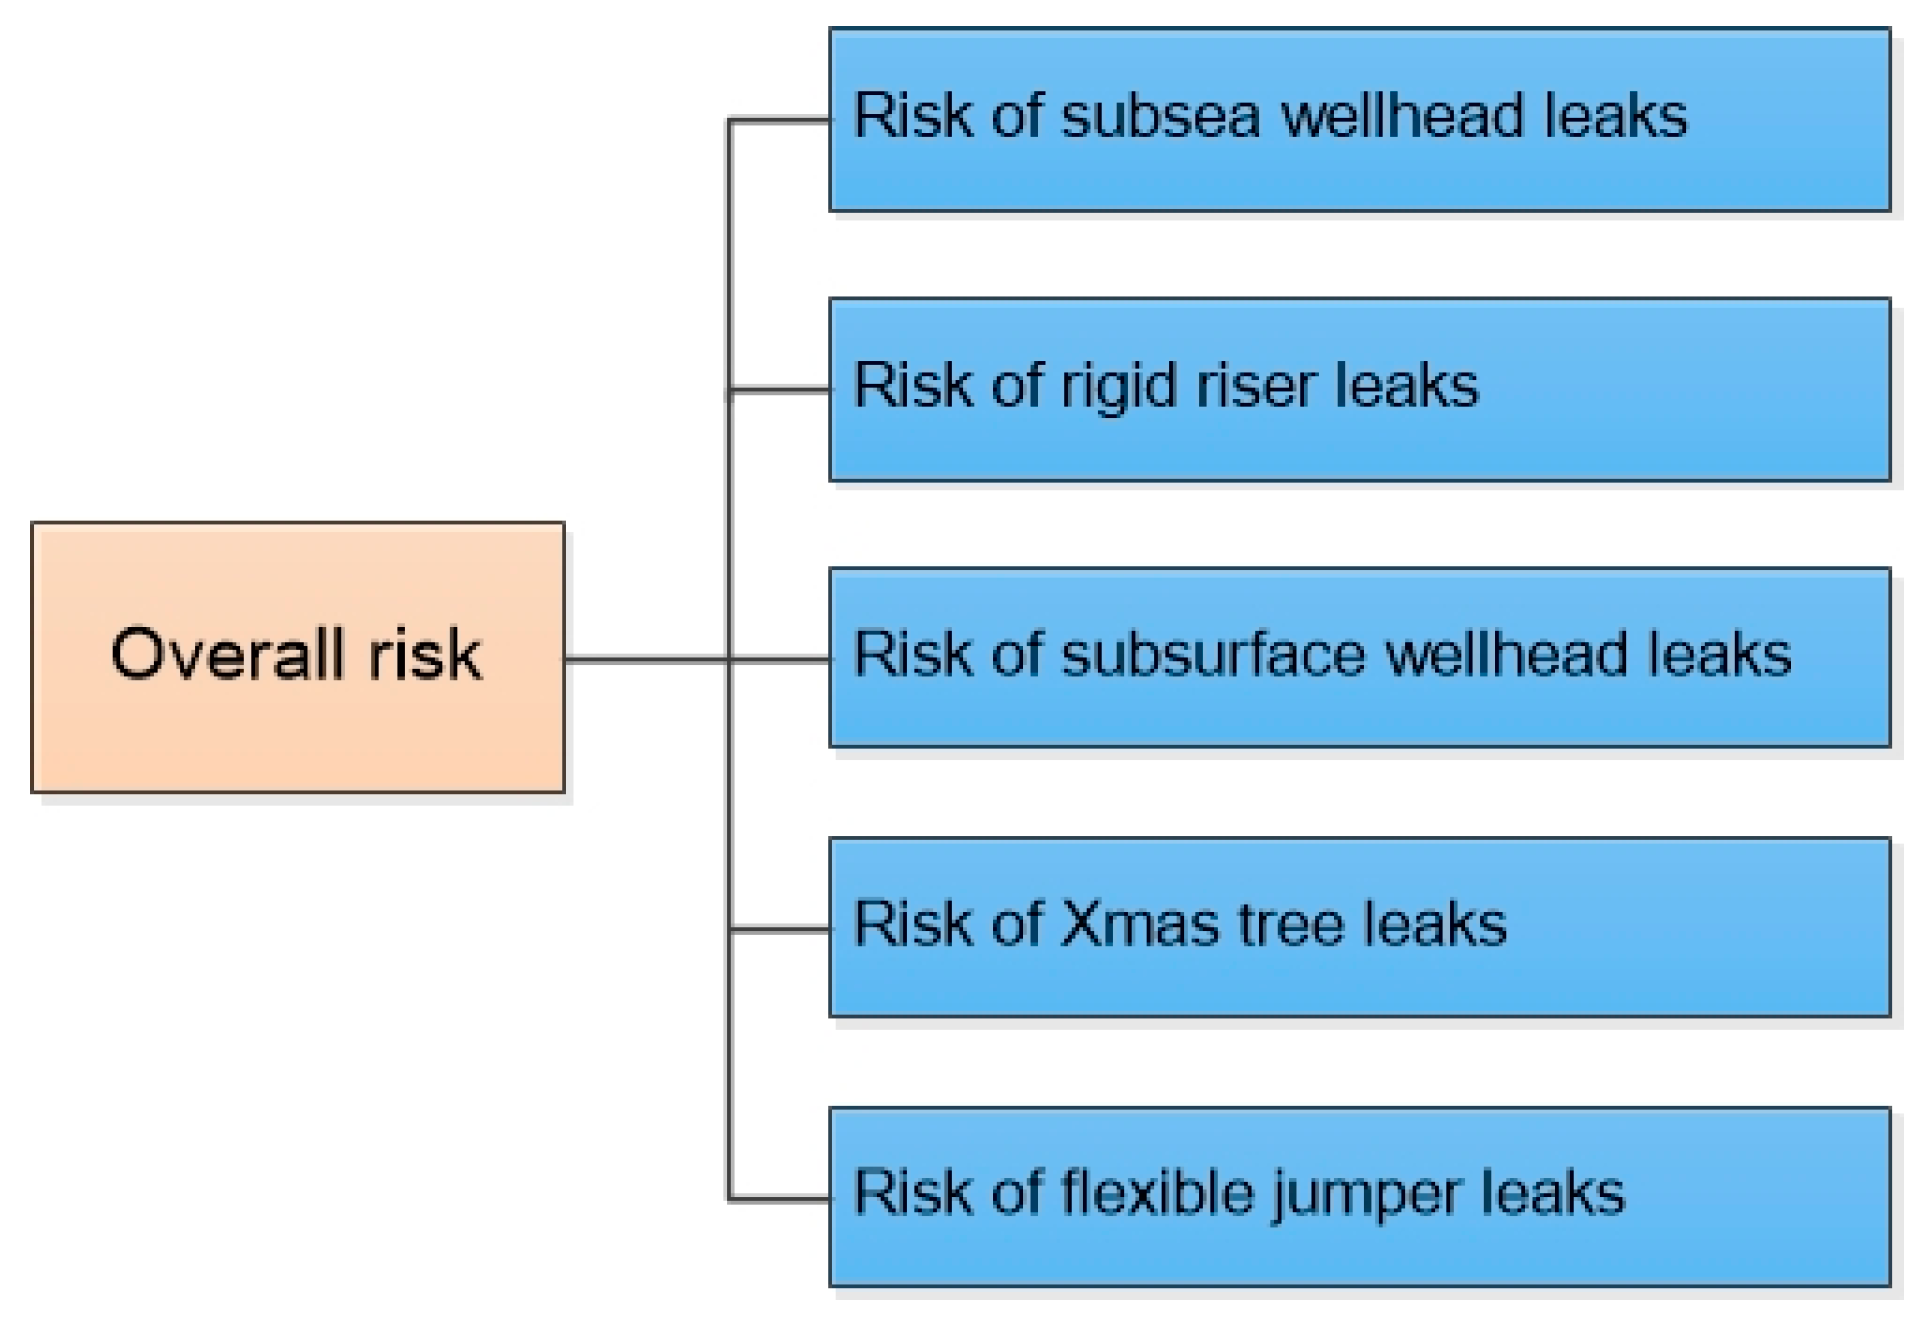
The overall risk model with respect to uncontrolled releases to sea is developed and illustrated in Figure 5. In the following, probabilities and consequences associated with each of the risk sub-models are investigated. The probabilities are determined based on the existing data dossiers and the consequences are calculated by means of the analytical method.
5.1. Probability Assessment
5.1.1. Well Barrier Concept
NORSOK D-010 [17] defines the well barrier as “envelope of one or several well barrier elements preventing fluids from flowing unintentionally from the formation into the wellbore, into another formation or the external environment”. Well barriers are used to prevent leaks and reduce the risk associated with well activities. A well barrier has one or more well barrier elements (WBEs). NORSOK D-010 defines WBE as “a physical element which itself does not prevent flow but in combination with other WBEs forms a well barrier”.
The two barrier principle, which is followed in most oil producing countries, is also available for the studied SWC system. This means that there will be at least two well barriers in the SWC system and the two independent barriers are referred to as the primary and the secondary barriers respectively.
5.1.2. Well Barrier Diagram
The barrier diagram has been constructed for modeling the situation of preventing uncontrolled releases to sea during temporary shut-in of the specific SWC system. The barrier diagram is also constructed for calculating the leak probability of each of the risk sub-models.
A set of assumptions are made for the well barrier diagram’s construction:
- (1)
- The SWC system is shut-in.
- (2)
- The PMV, PWV, and SCSSV have been given a close command.
- (3)
- CV in the full closed position can shut-off flow.
- (4)
- Uncontrolled releases to the sea through the casings and cement are not taken into account as these probabilities are relatively very low [18].
- (5)
- Failures of the control system and other topside equipment are not taken into consideration.
- (6)
- Only the failure mode “external leakage” for the subsea/subsurface wellhead, rigid riser, X-mas tree and flexible jumper is considered while other failure modes are not assumed to result in environmental and commercial impacts.
The well barrier diagram for the specific SWC system is illustrated in Figure 6. It is worth noting that the X-mas tree is not considered as a single barrier while its main safety valves are regarded as independent barriers. Further, it can be seen from Figure 6 that all the paths from the reservoir to the surroundings are possible flow leakage paths (FLPs). Then, the minimal cut sets of the SWC system can be identified from the well barrier diagram by following different FLPs, as given in Table 5. The minimal cut sets will be used as the basis for quantitative reliability analysis. It can be seen that the minimal cut set with the lowest failure tolerance is the leak from the reservoir to the surroundings via A-annulus merely.
5.1.3. Probability Calculation Model
From the minimal cut sets presented in Table 5, approximate formulas are used to calculate the leak probabilities. It should be noted that the formulas given in this section are based on the assumption that all the basic events are statistically independent.
Let the top event denote the uncontrolled releases to sea for the specific SWC system. The probability that the top event occurs at time t is denoted , which can be approximated by:
where denotes the probability that minimal cut set j fails at time t, is the basic event i occurs at time t.
With regard to the Equation (1), it is assumed that the products of all the s are so small that they can be disregarded.
The probabilities of all the basic events depend on the type of the basic event, and three basic event types are distinguished as follows:
- (1)
- Non-repairable unit. Non-repairable component failures are not detected and repaired. An approximate formula can be given as:where is the failure rate.
- (2)
- Repairable unit. Unit i is repaired when a failure occurs. The unit is assumed to be “as good as new” after a repair. Basic event probability:where is the mean time to repair.
- (3)
- Periodic testing. Unit i is tested periodically with test interval . After a test/repair, the unit is assumed to be “as good as new”. In this case, the probability of the basic event is:
5.1.4. Probability Calculation Results
The following list presents the data dossiers, which form a basis for the input to the failure probability calculations.
- (1)
- Offshore and Onshore Reliability Data (OREDA) handbook (Sintef) [19]
- (2)
- Reliability of well completion equipment (Sintef) [20]
- (3)
- Pipeline and Riser Loss of Containment (PARLOC) 2001 [21]
Based on the identified minimal cut sets in combination with the approximate formulas, the results of annual leak probability for each of the risk sub-models are obtained, as presented in Table 6. The periodic testing unit is given a test interval of 6 months.
5.2. Consequence Assessment
As has been noted in the Section 5, the total oil spill amount will be assessed in order to measure the environmental and commercial impacts.
5.2.1. Oil Spill Calculation Model
The equation for the total oil spill amount takes the form as follows:
where is the mass release rate, is the effective duration of the release event.
The oil spill characteristics are discussed below.
(1) Mass release rate. The mass release rate in the liquid phase is calculated by the Bernoulli equation [15].
where is the contraction coefficient varying range 0.6–1.0, is the size of damage area, is the density of oil, is the differential pressure between internal pressure and external pressure.
Note that the size of damage area will be classified according to the equivalent hole diameter based on details of the incident record [21]. However, there is a scarcity of information for developing estimates of hole size distributions of the subsea production facilities. In order to facilitate hole size characterization, it is assumed that the hole size distributions for offshore pipelines are used to infer hole size distributions for subsea production facilities in this study. Furthermore, the hole size distributions for the flexible riser and subsea steel riser are used to infer hole size distributions for flexible jumper and rigid riser respectively [22]. Table 7 shows the recommended hole size distributions for the specific SWC system.
(2) Release duration time. The release duration time is assumed to be a function of the active repair time. However, the active repair time will vary to a large extent because of the difficult accessibility, available emergency response equipment, etc. A correction factor in relation to the accessibility (water depth) is applied for the purpose of adjusting the effective duration time. Thus, the effective duration time of the release event is calculated as follows:
where is the active repair time, is the time correction factor (TCF).
5.2.2. Oil Spill Calculation Results
The release rate for a large hole size in the production phase is set to 1000 m3/day [23], and the contraction coefficient is set to 0.8. With respect to the statistical data and expert judgments, the hole diameter is set to 20 mm for the small hole size, 50 mm for the medium hole size, 80 mm for the large hole size. On this basis. The release rate for the large hole size (80 mm), the medium hole size (50 mm) and the small hole size (20 mm) is 35.00 tons/h, 13.68 tons/h and 2.19 tons/h, respectively. The active repair time based on the data dossier is shown in Table 9. Table 10 presents the specific oil spill amount calculation results.
6. Risk Evaluation and Risk Reduction Measures
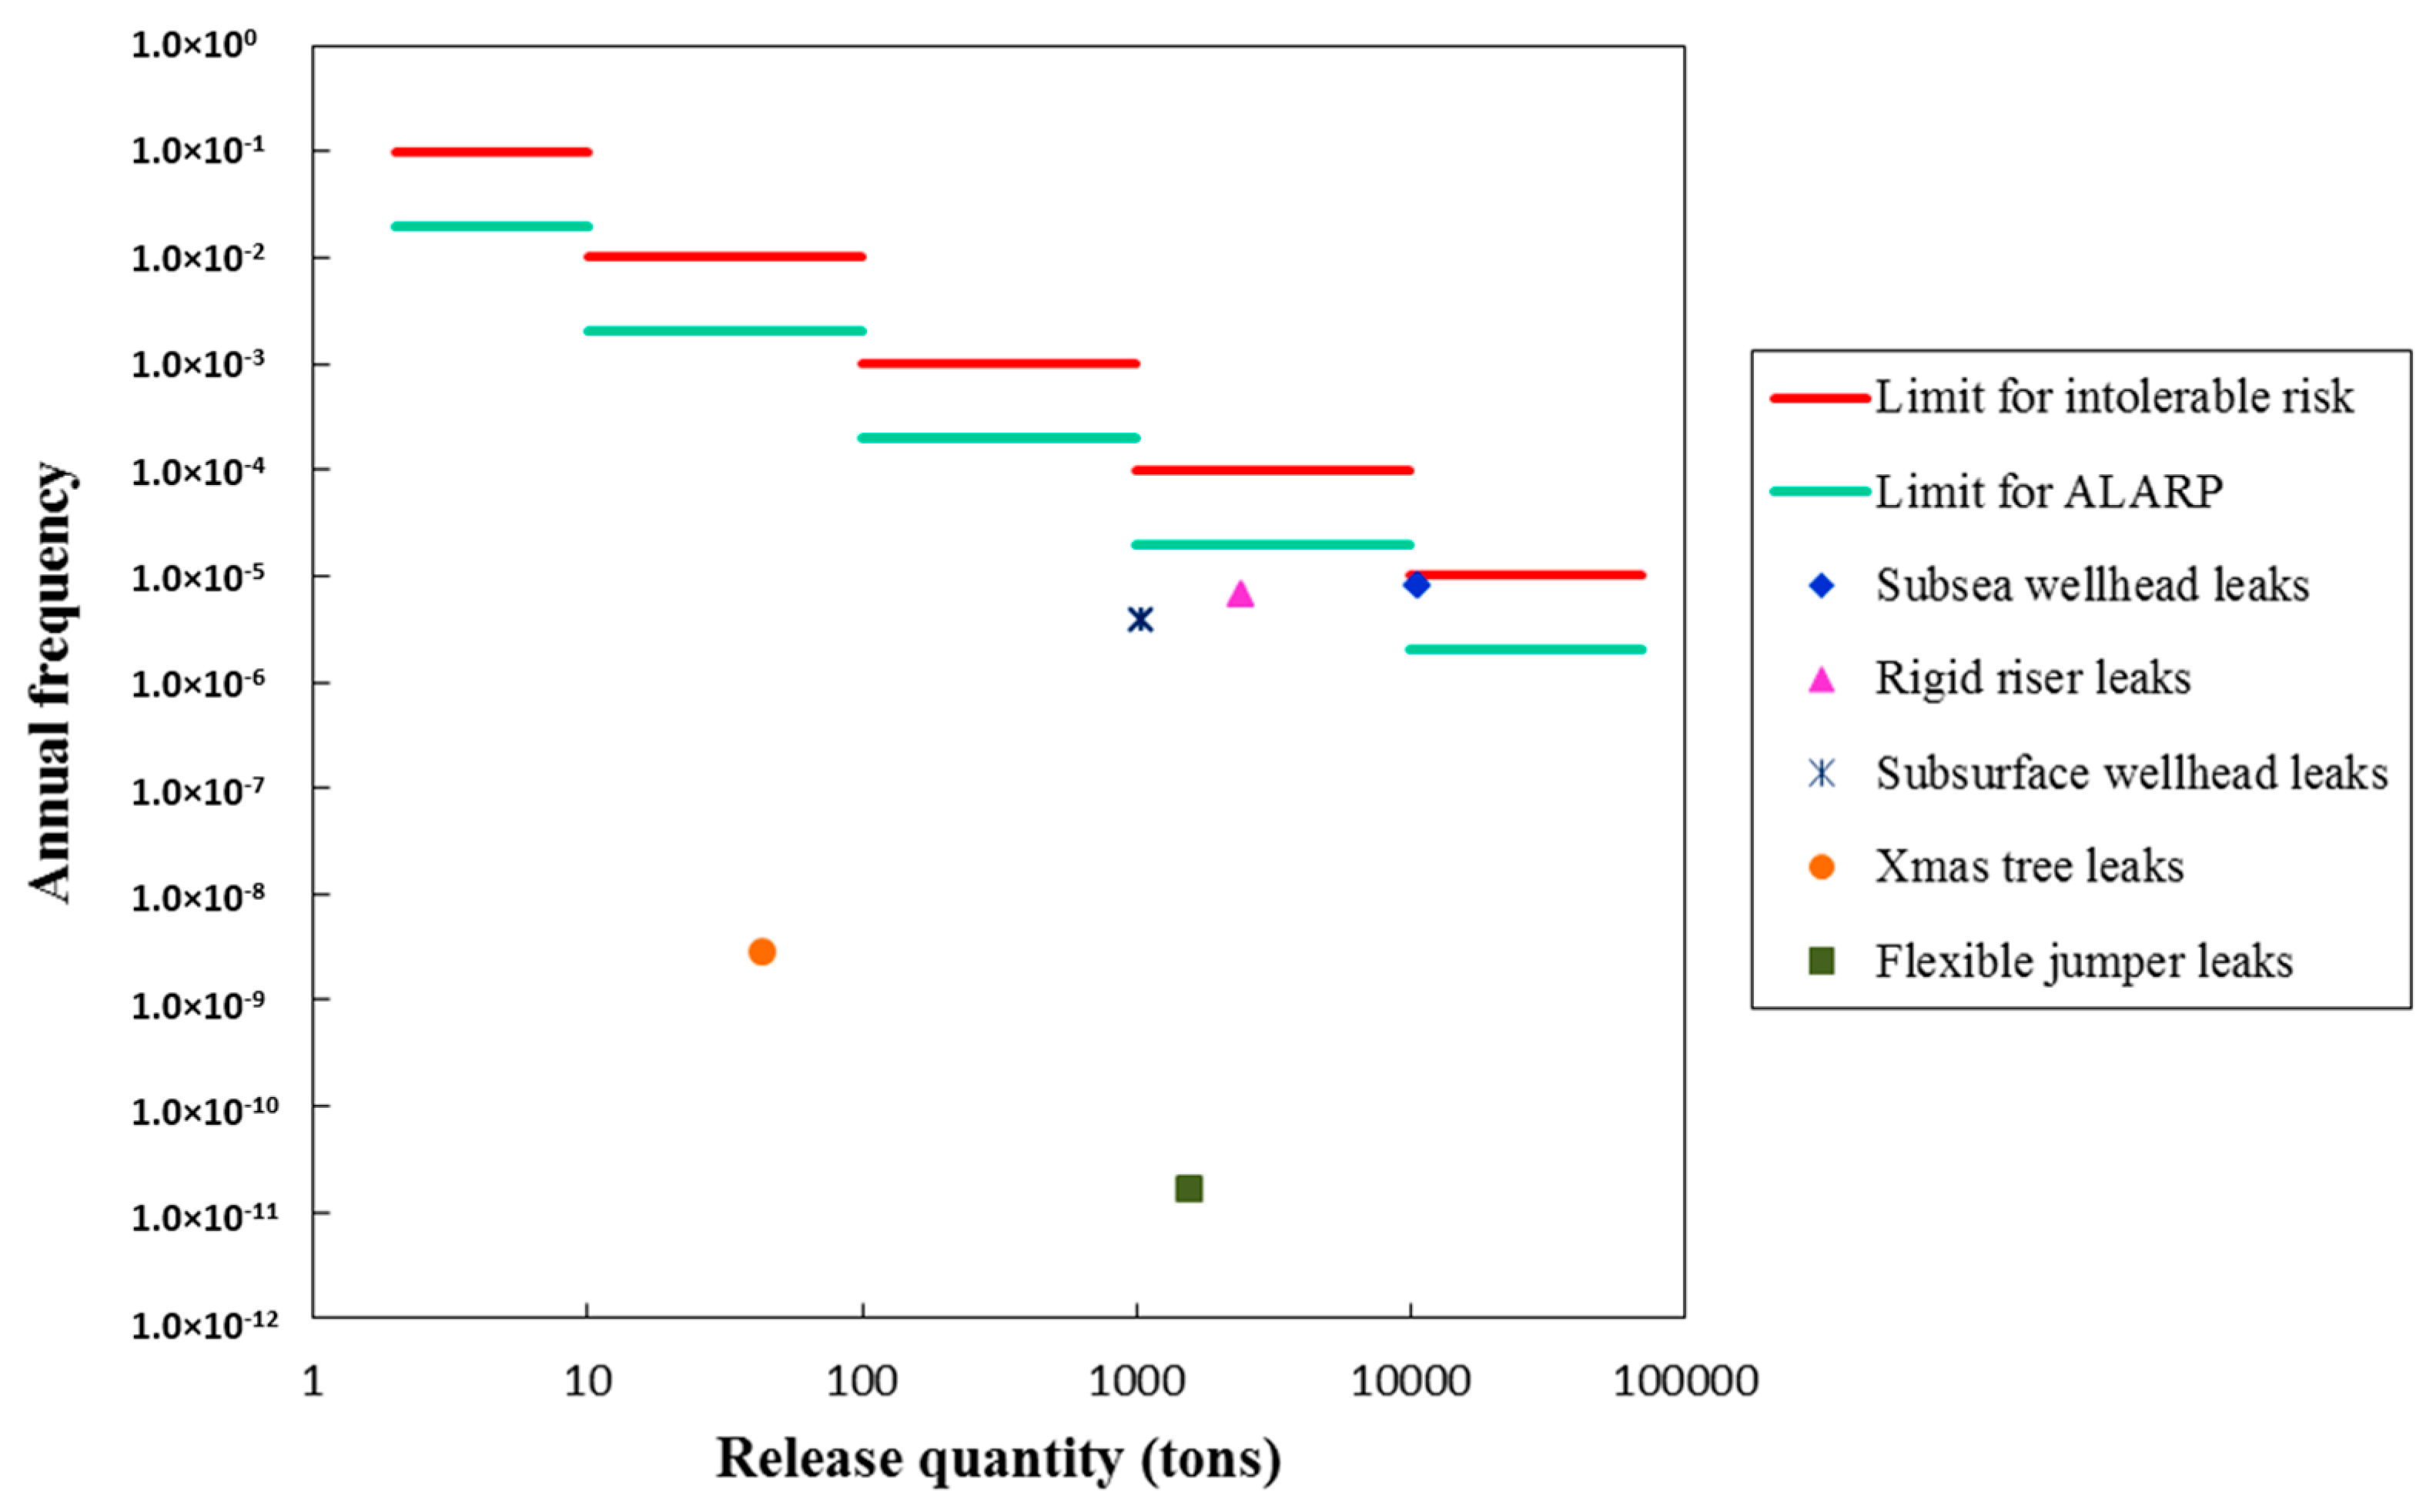
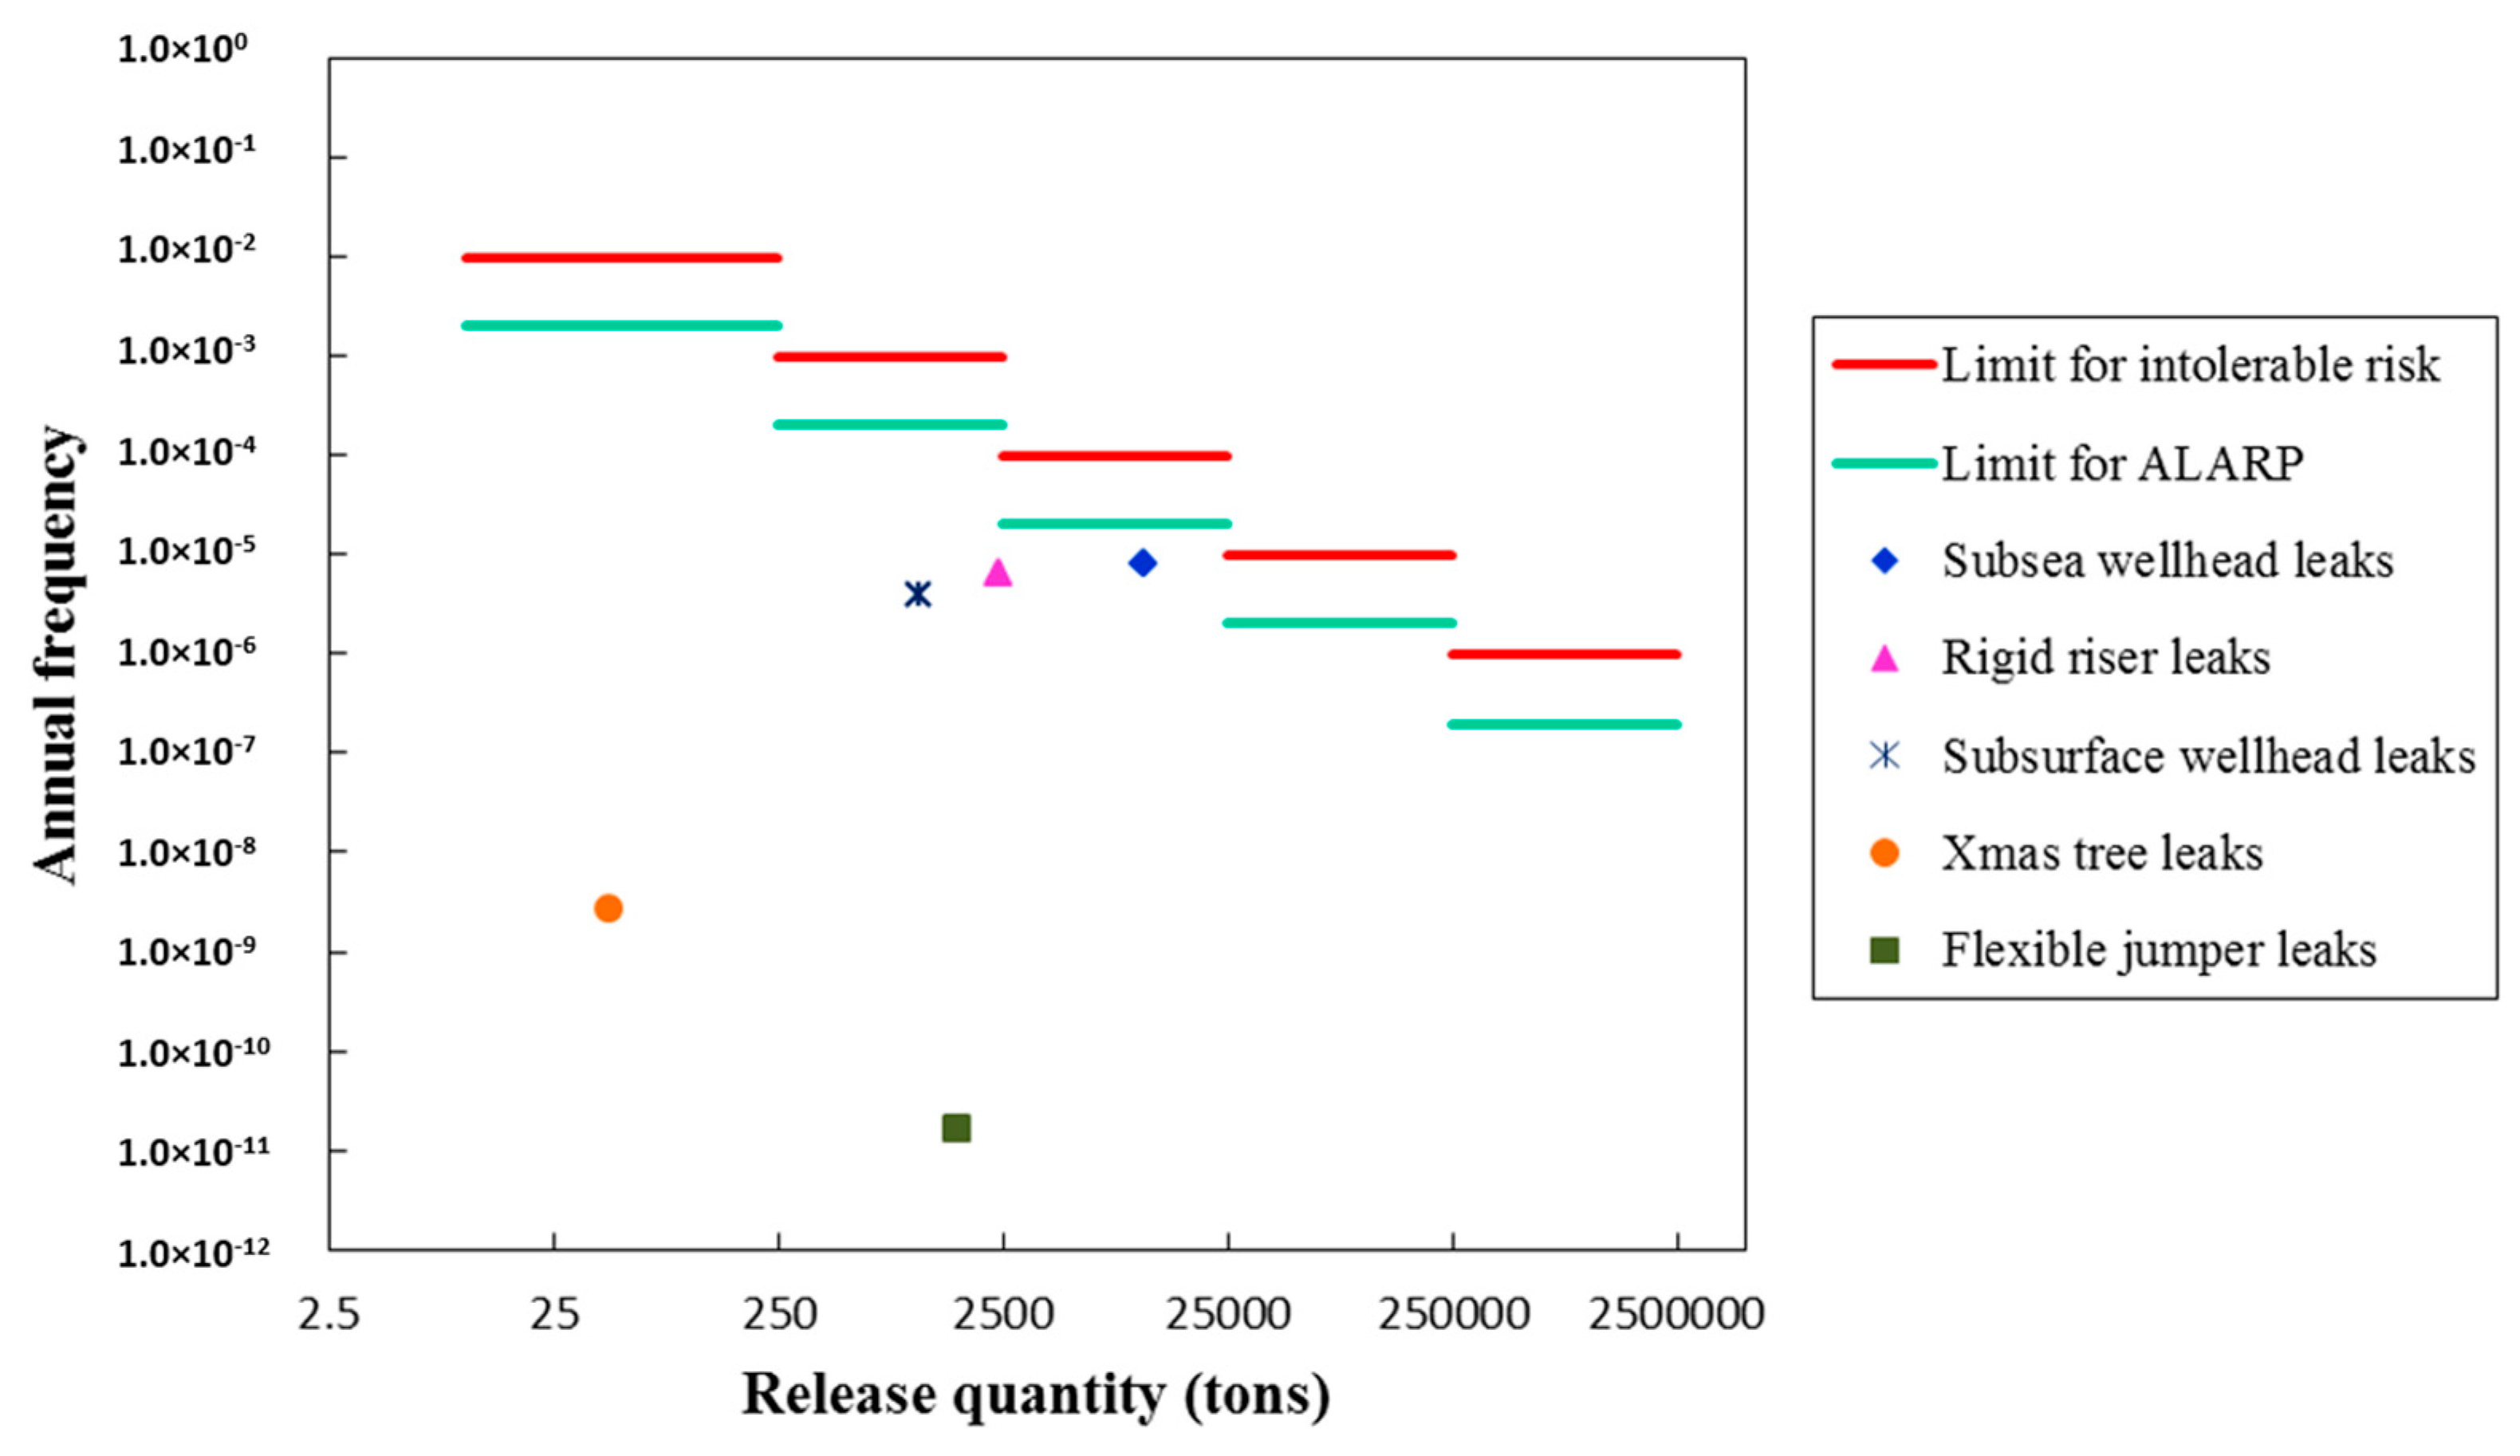
The risk relating to the environmental and commercial impacts resulting from various accidental scenarios are shown in Figure 7 and Figure 8. It can be seen that the overall risk level is dominated by the subsea wellhead leak scenario. Further, compared with the established RAC, it can be found that the environmental risk level for the subsea wellhead’s leak lies within the ALARP region while the other environmental and commercial risks are all below the ALARP limits. Thus, risk reduction measures should be considered for the subsea wellhead area. It can also be noted that there are no serious and major commercial losses for all the identified accidental release scenarios, which is of great importance and attractiveness for oil producers. In addition, both the environmental and commercial risk levels for the X-mas tree and flexible jumper are so low that the relaxed design requirements may be accepted with respect to the SWC technology.
As the risk is often expressed in terms of a combination of the consequences of an event and the associated likelihood of occurrence, risk reduction measures thus can be grouped into two main categories: probability reducing measures and consequence mitigation measures. It should be noted that the Petroleum Safety Authority (PSA) guidelines [13] state that probability reducing measures should be prioritized before consequence reducing measures.
Recommended risk reduction measures are proposed and considered in the following areas:
- (1)
- Design of the additional safety valve with respect to riser/subsea wellhead connection.
- (2)
- Design of the inner casing between rigid riser and production tubing.
- (3)
- Design of the sealed tubing hanger between production tubing and casing.
- (4)
- Configuration of special leakage alarm system including leakage detection and alarm generation for the subsea wellhead connection.
- (5)
- Adequate preparedness measures for the uncontrolled subsea wellhead leaks.
7. Uncertainty Assessment and Sensitivity Study
Even though the QRA in this study is believed to be based on the best available information and consideration, there are still a number of uncertainties affecting the results of this study. Table 11 lists the assumptions and their possible effects as well as uncertainty sources in this study. It can be found that some assumptions made are conservative or optimistic while the others are unknown. In many cases, a conservative approach including conservative model approximations and conservative values of input parameters to QRA is applied. Thus, the QRA results presented in this paper can be regarded as somewhat conservative.
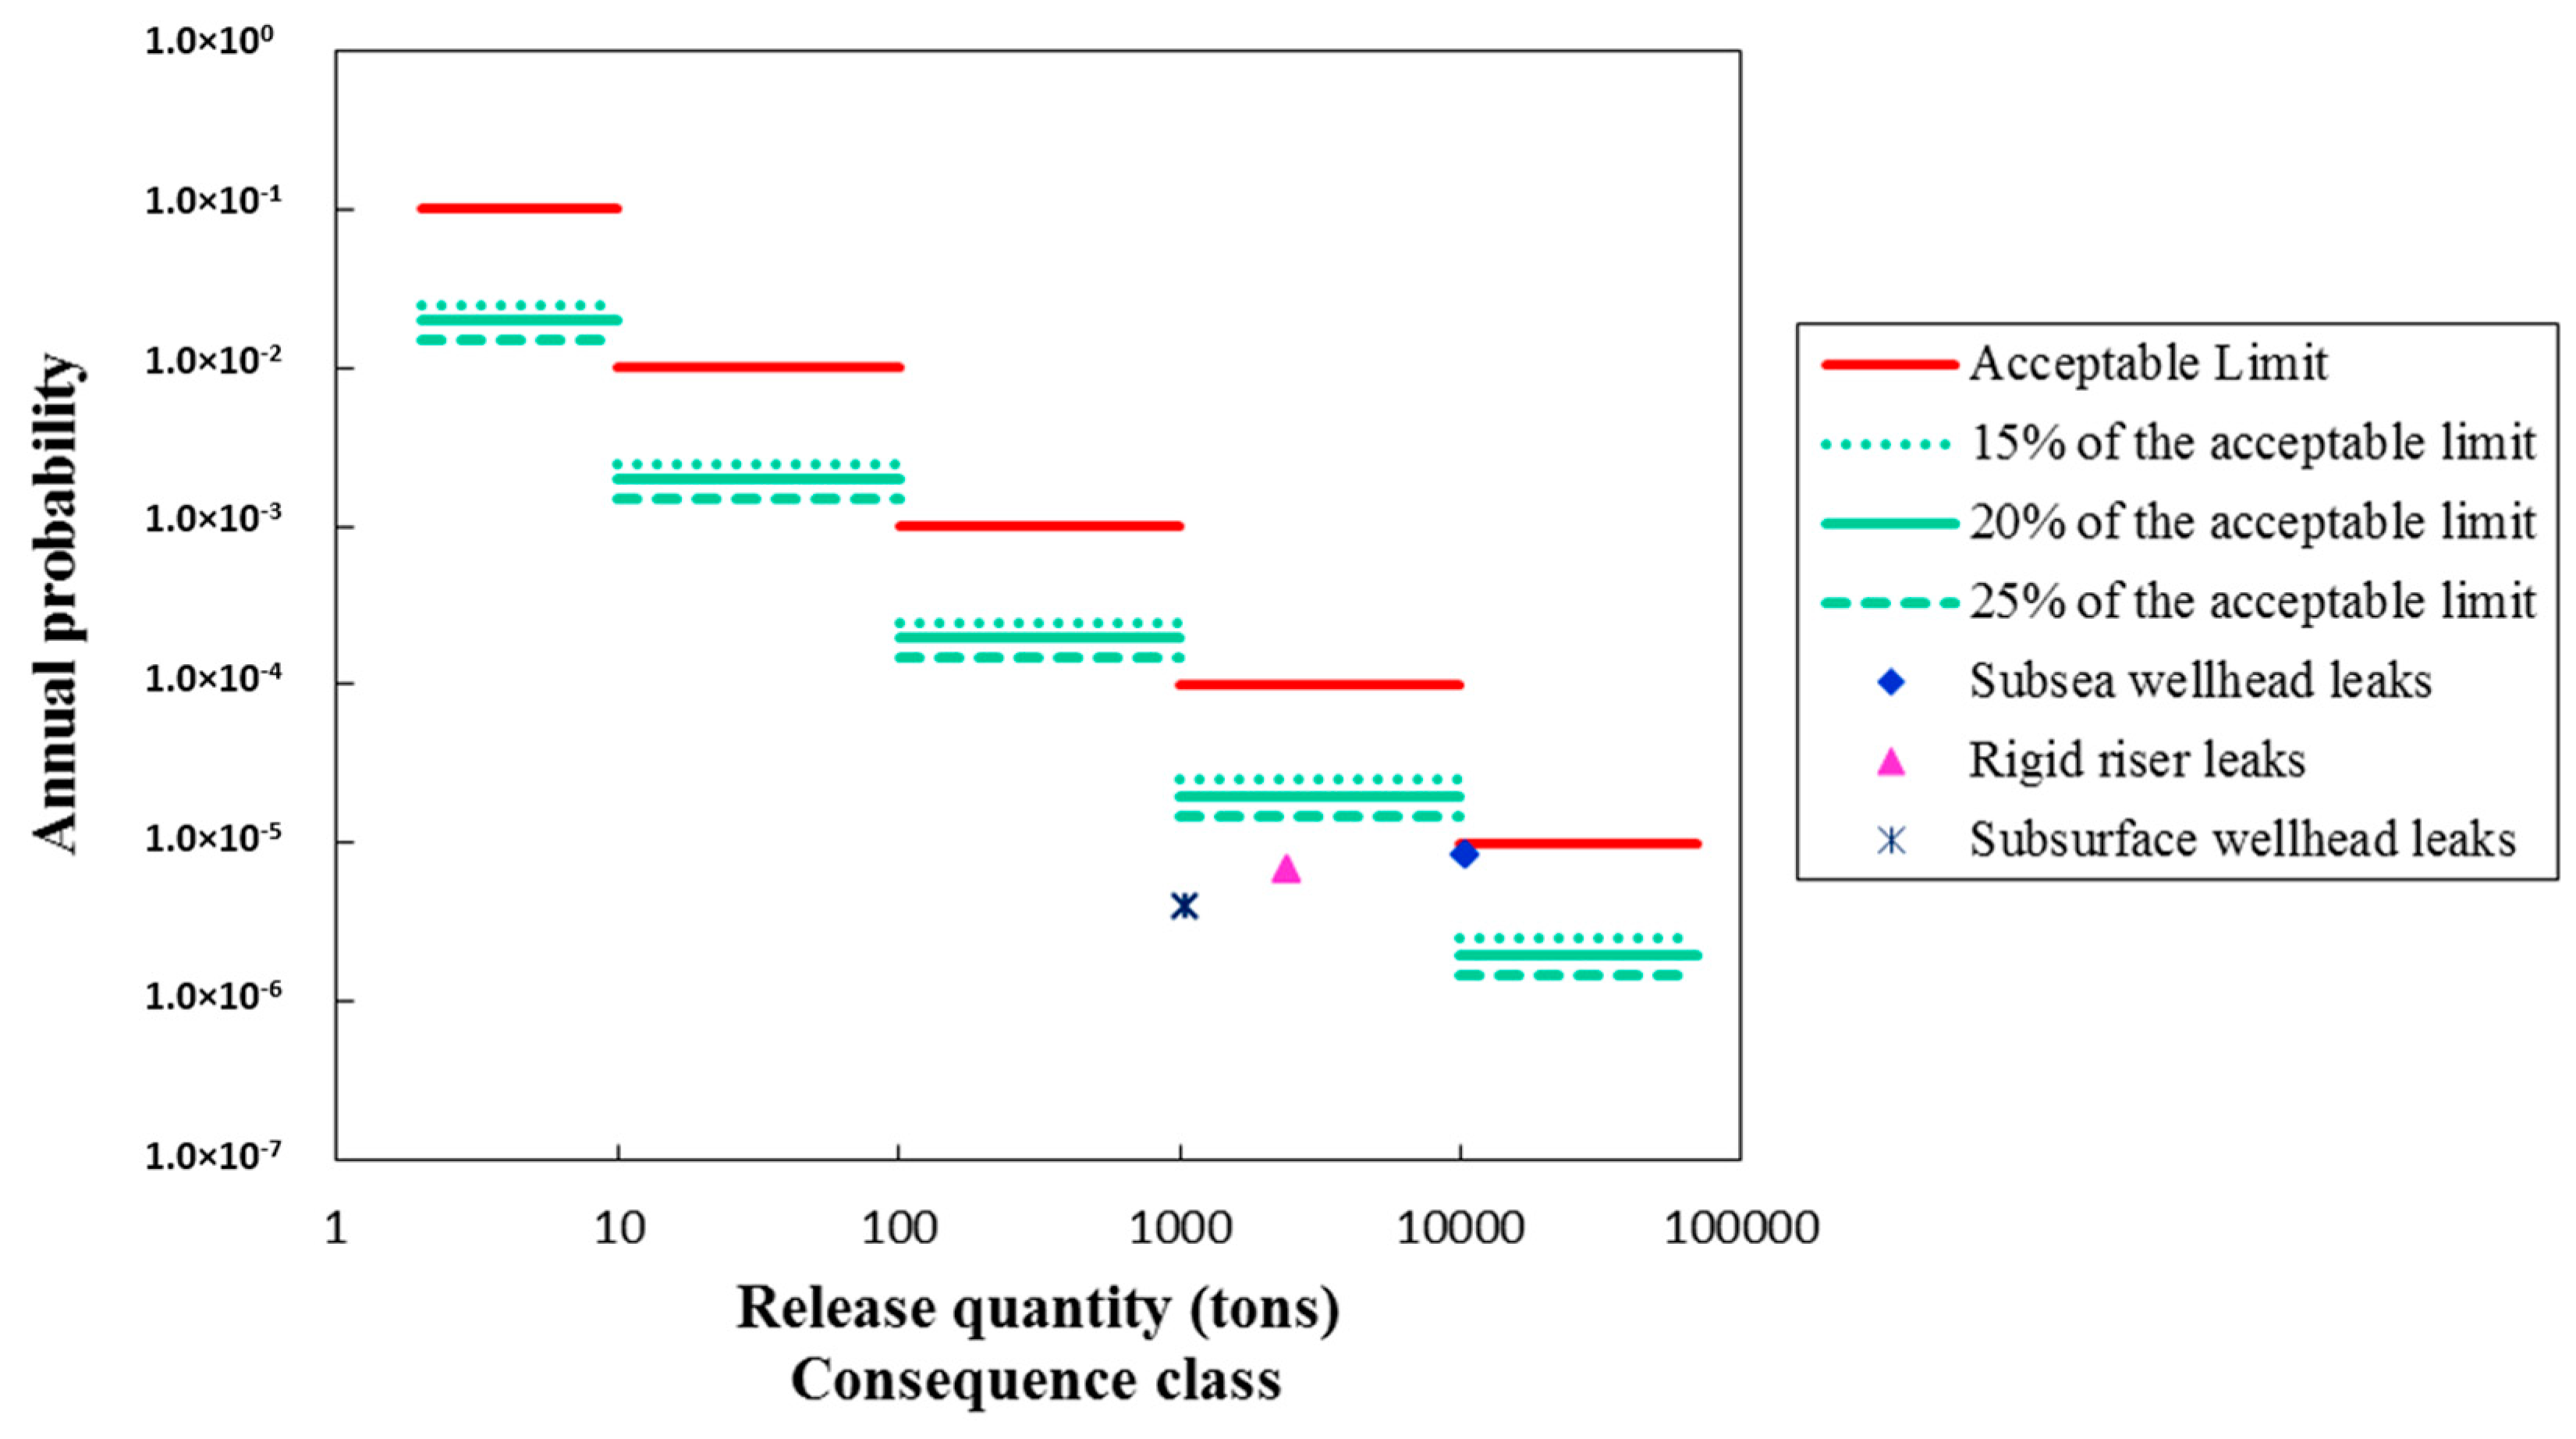
Sensitivity studies are carried out in order to illustrate some of important uncertainties in Table 11, in relation to critical assumptions for QRA. Here, only the risk levels for subsea wellhead leaks, rigid riser leaks and subsurface wellhead leaks are shown as other risk levels are far below the RAC.
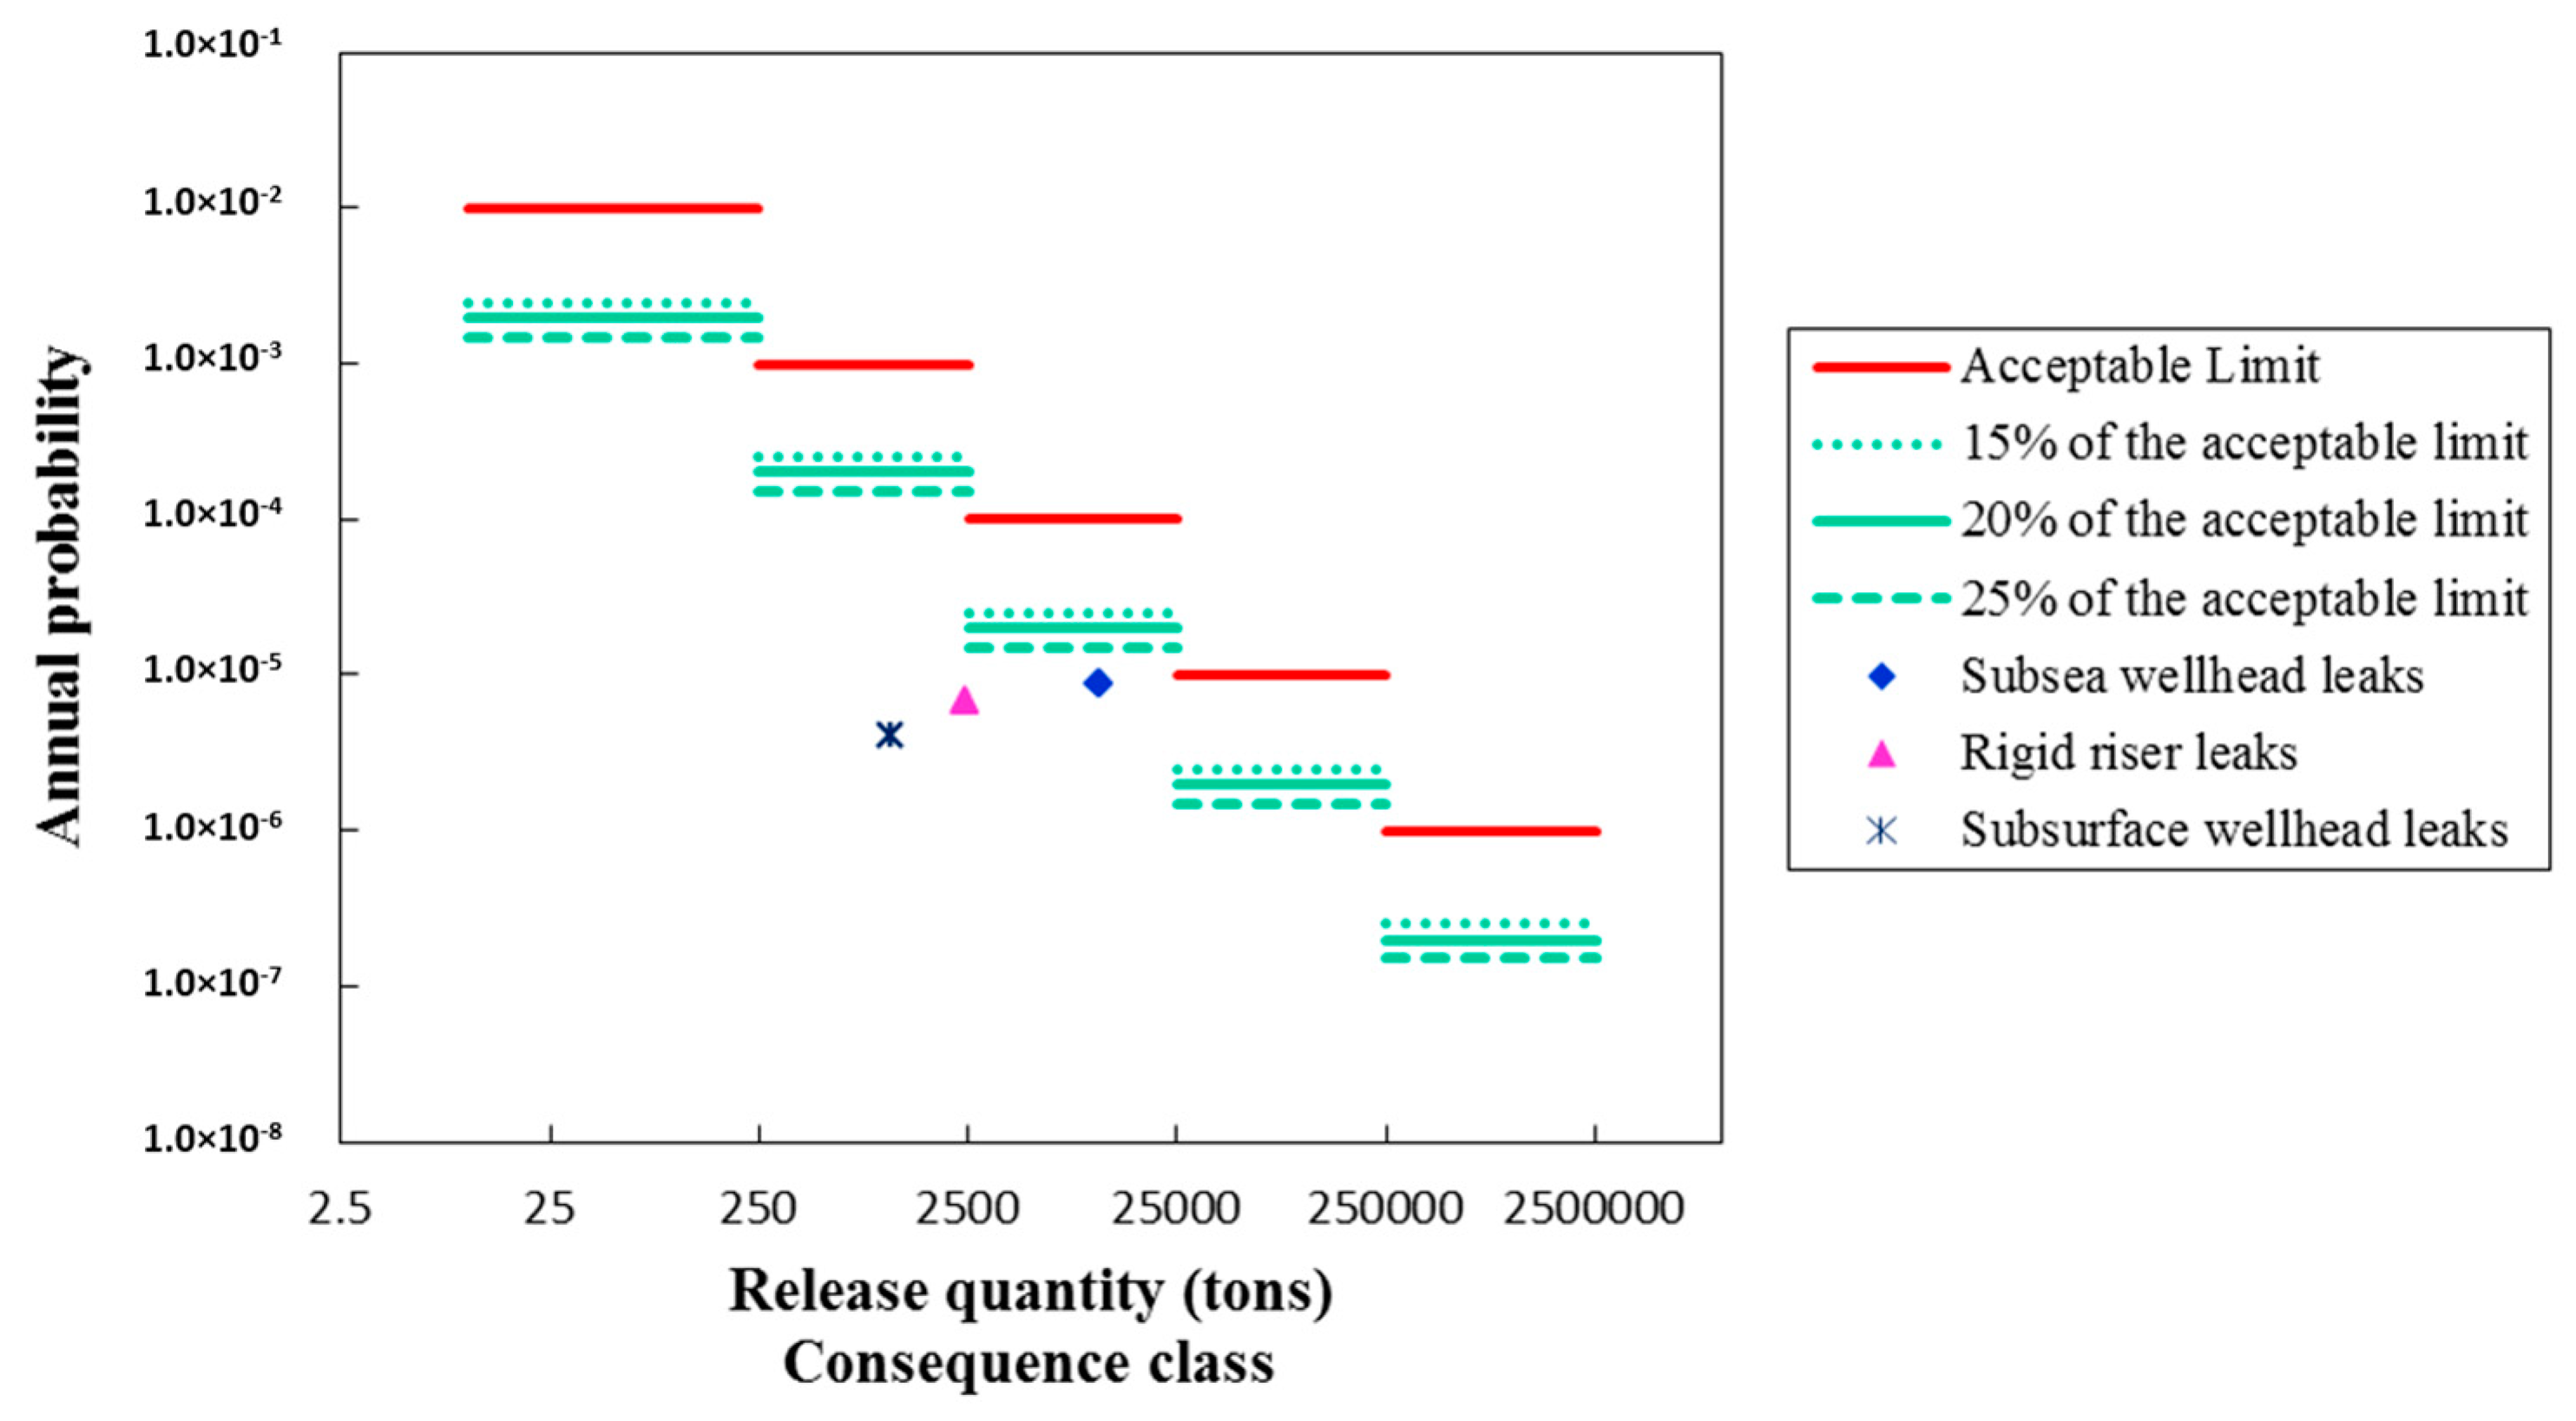
Figure 9 and Figure 10 illustrate the effects of limit variations for ALARP on the environmental risk and commercial risk respectively. It can be found that limit variations for ALARP ranging from 15 to 25% of the acceptable limit have little influence on the risk levels of the identified hazardous events. This is because that the environmental risk level for the subsea wellhead leaks is above 25% of the acceptable limit while the other risk levels are all below the 15% of the acceptable limit. Nonetheless, the operator should be deliberative when a strict limit for ALARP will be required and determined.
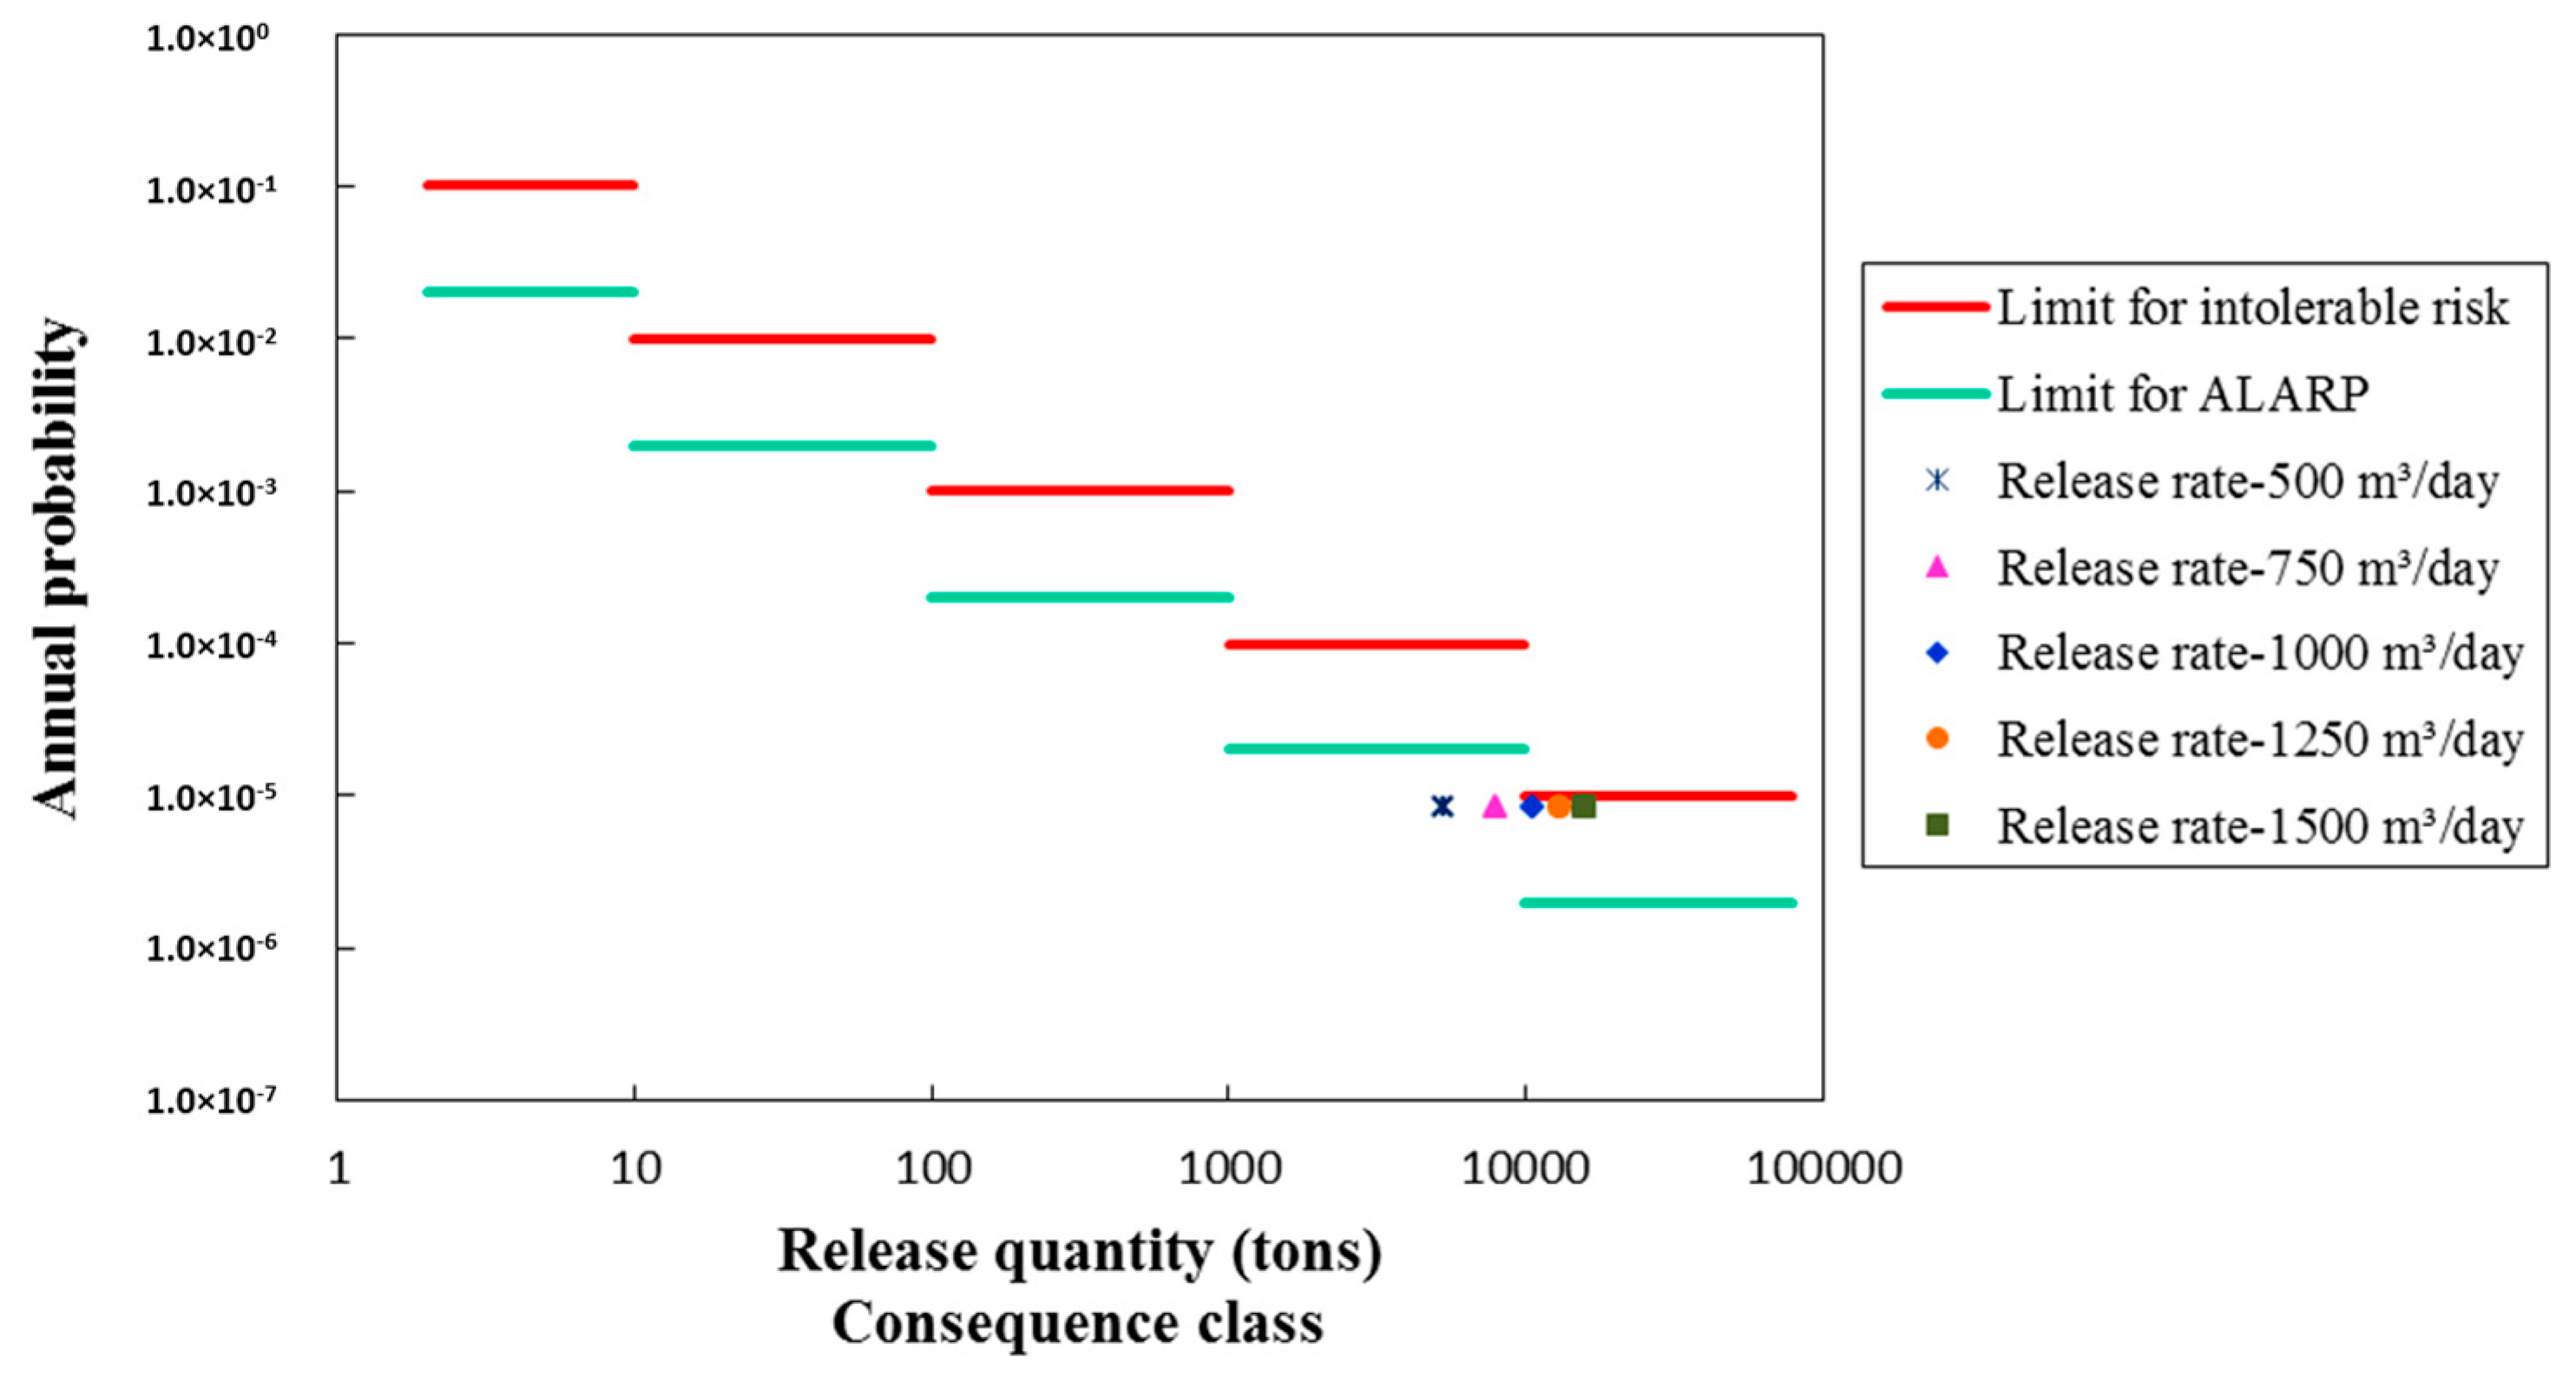
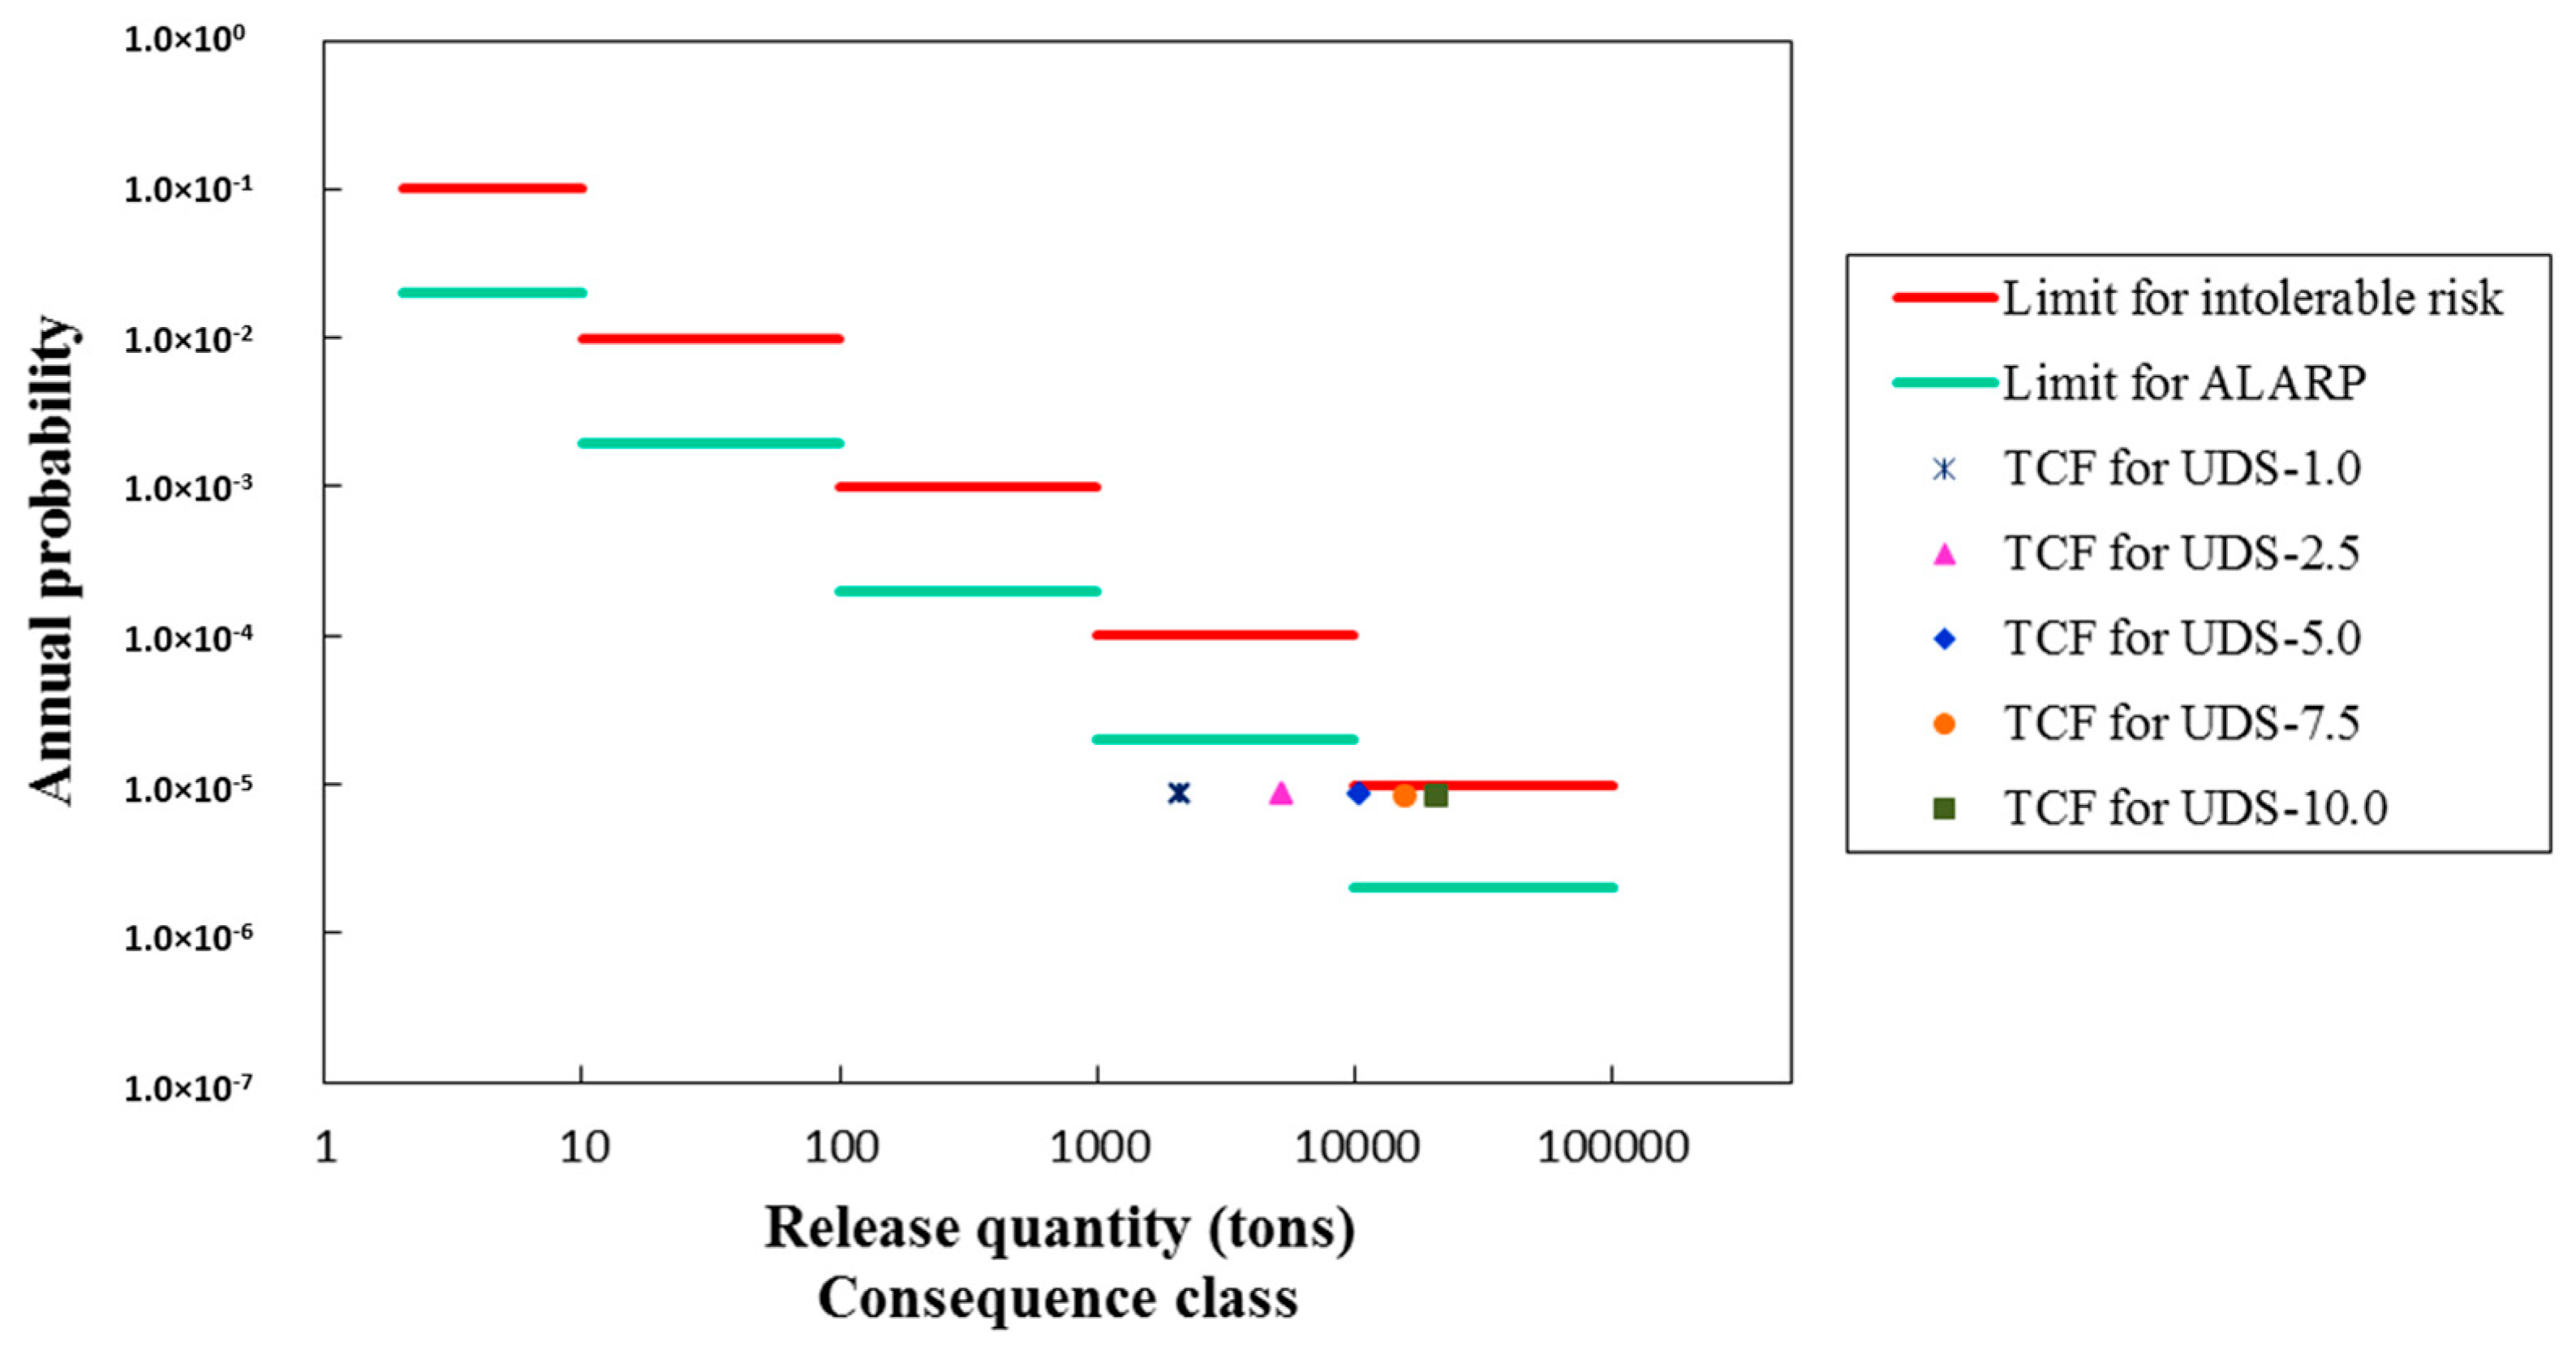
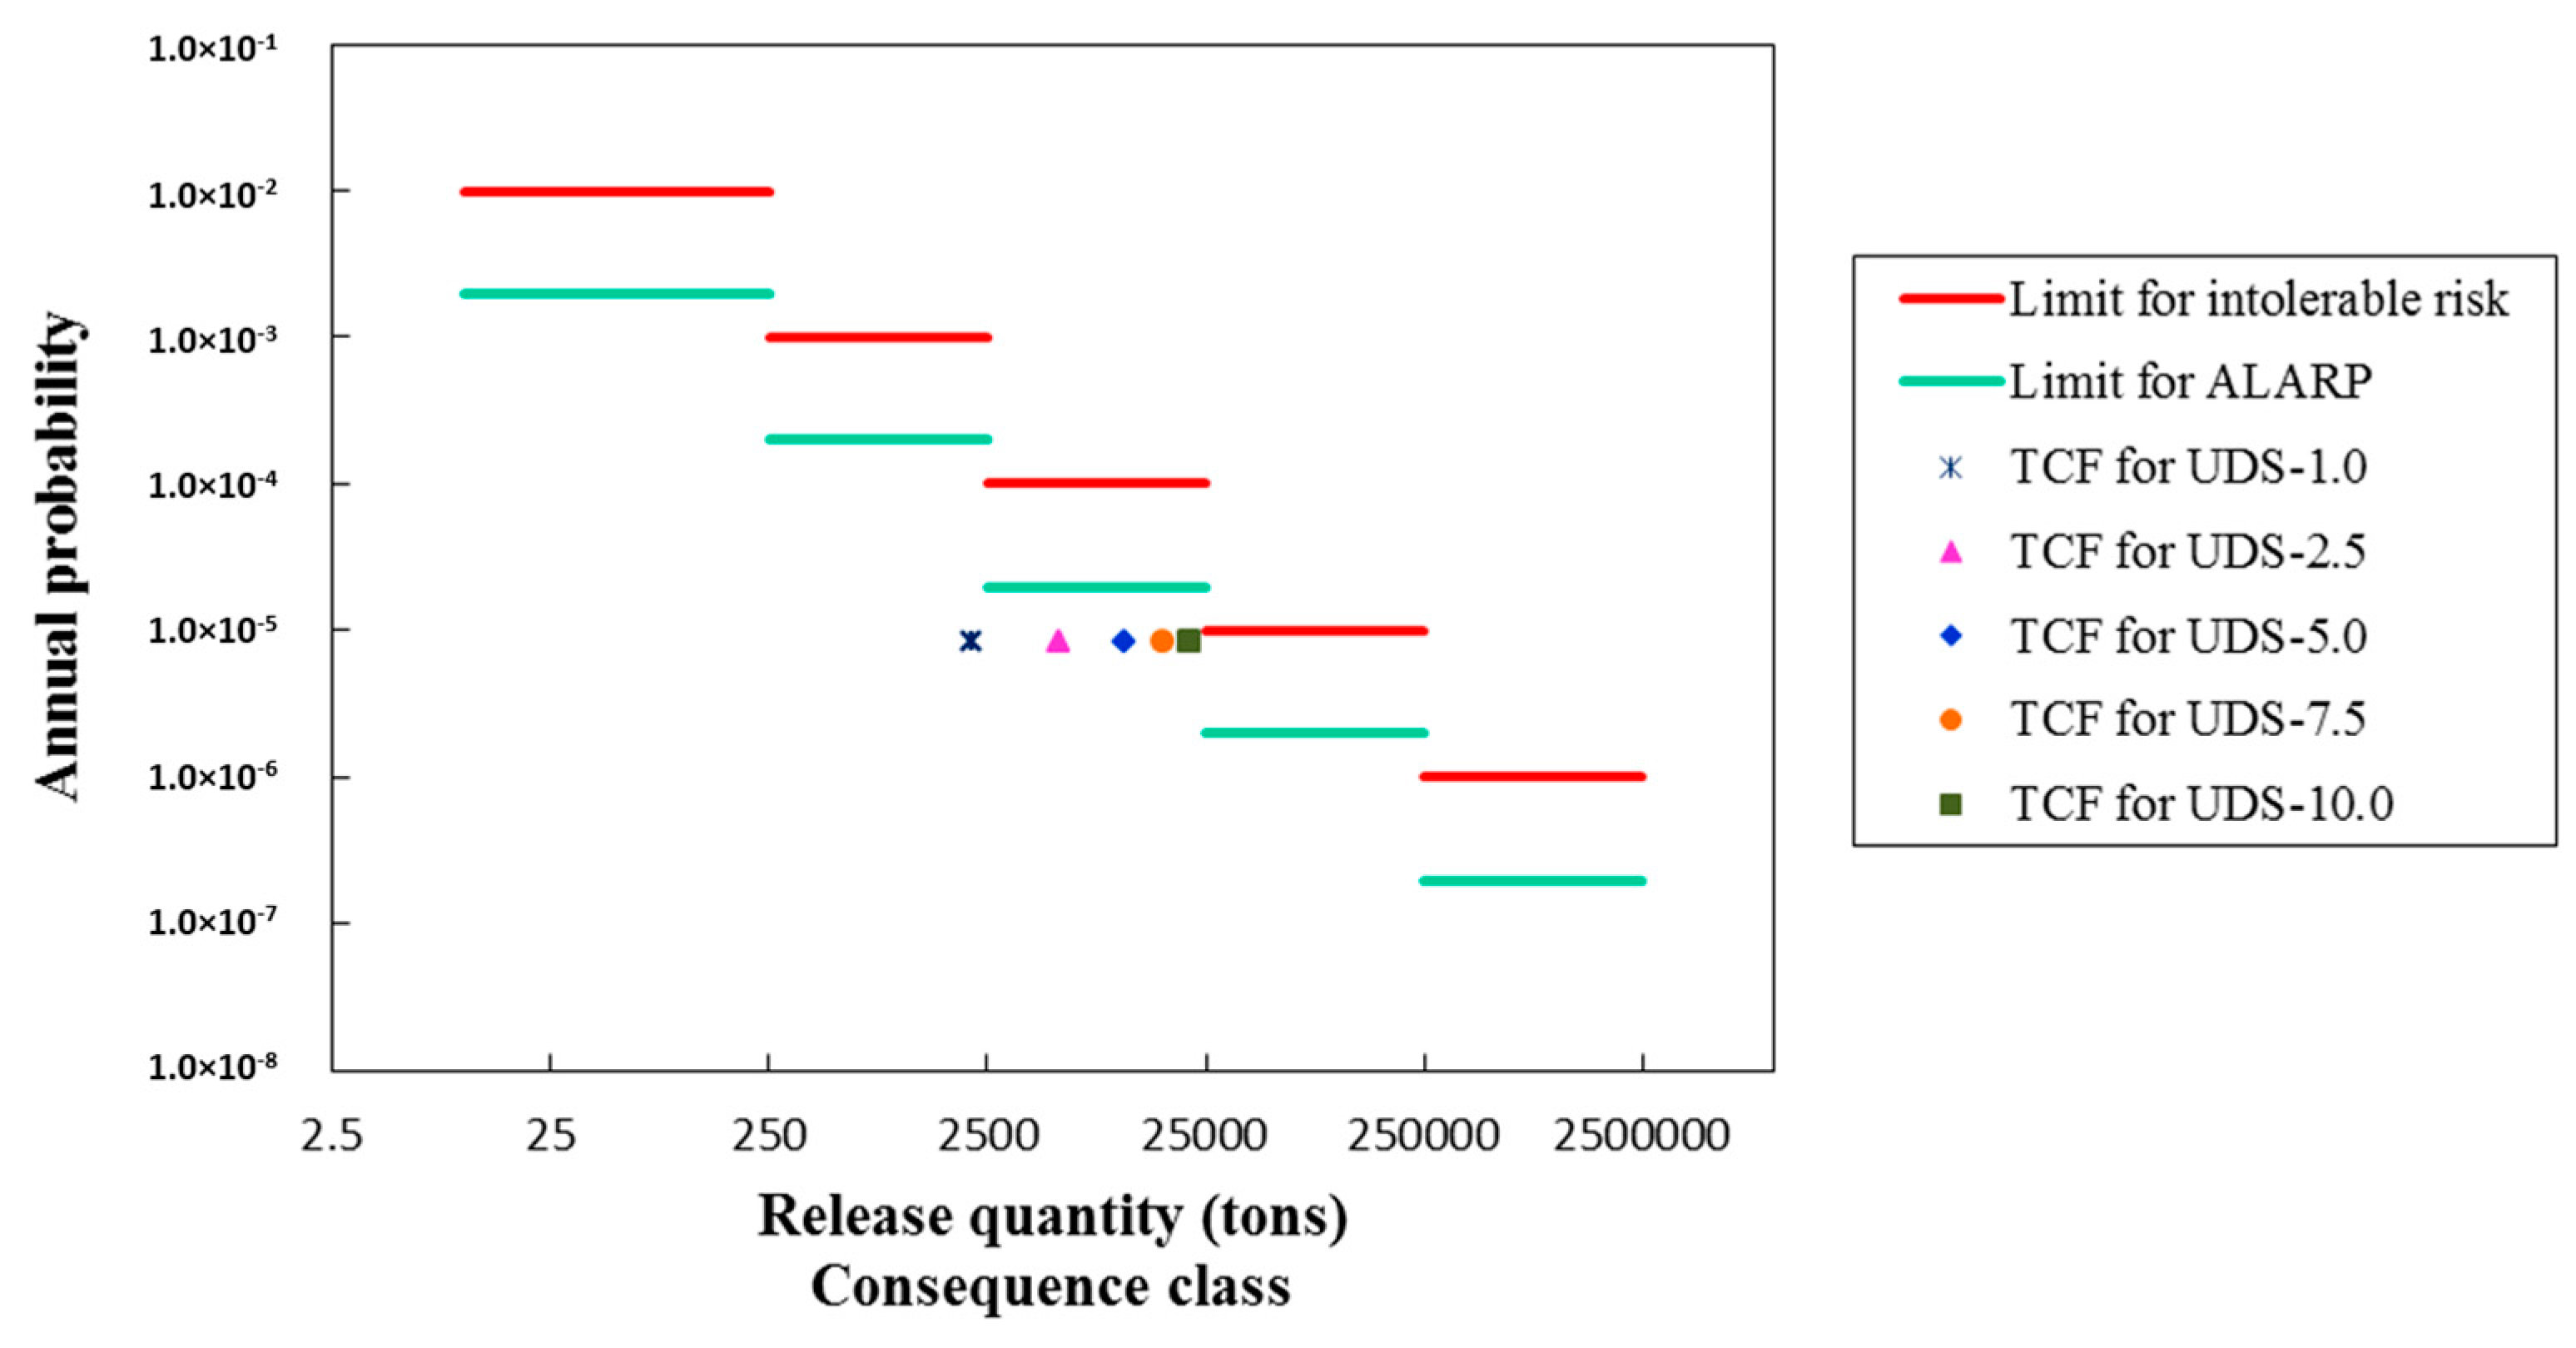
Figure 11 and Figure 12 illustrate the effects of release rate variations for the subsea wellhead leaks on the environmental risk and commercial risk respectively. Figure 13 and Figure 14 illustrate the effects of TCF variations for the subsea wellhead leaks on the environmental risk and commercial risk respectively. It can be observed from Figure 11, Figure 12, Figure 13 and Figure 14 that the risk level changes horizontally with regard to consequence class variations while the corresponding annual probability keeps constant.
It can be found from Figure 12 and Figure 14 that the release rate variations between −50% and 50% and TCF variations from 1.0 to 10.0 have little influence on the commercial risk evaluation and thus have no influence on the final decision-making. However, if the assumptions for the release rate and TCF are too optimistic, total different conclusions from the environmental risk evaluation may be drawn. It can be found from Figure 11 that when the release rate for a large hole size is set to 25% or 50% lower than the pre-defined release rate, the environmental risk level for the subsea wellhead leaks is negligible. Likewise, it can be found from Figure 13 that when the TCF for UDS is assumed 1.0 or 2.5, the environmental risk level for the subsea wellhead leaks is negligible. It means that if the over optimistic release rate and TCF are set, the environmental risk level for the subsea wellhead leaks may not lie within the ALARP region anymore. Thus, no further risk reduction measures are required and a completely opposite conclusion may be reached.
Here, it is emphasized that the QRA should be considered as an on-going process. The QRA results can be continuously updated when the latest data and relevant information become available.
As some of the uncertainties may have significant influence on the QRA results of some accidental scenarios, it is suggested that further studies should be carried out in relation to the quantitative risk model of release characteristics including the release rate, hole size, TCF, etc.
8. Conclusions
The following conclusions can be drawn in this paper:
- (1)
- Any failure of the new SWC system is not a direct and significant source of risk for the personnel on the surface installations with regard to its offset feature.
- (2)
- The overall risk level is dominated by the failure event of the subsea wellhead leaks. Compared with the established RAC, only the environmental risk level for the subsea wellhead’s leak lies within the ALARP area, and thus risk reduction measures should be considered for the subsea wellhead area. The rest risk levels are all below the corresponding ALARP limit and thus negligible.
- (3)
- The new SWC technology has a distinct advantage for the leakage duration time in UDS, and hence can mitigate the environmental and commercial impacts as much as possible.
- (4)
- There are no serious and major commercial losses for all the identified accidental release scenarios, which is of great importance and attractiveness to oil producers.
- (5)
- Corresponding design alternatives are proposed and can be considered to apply to improving the design deficiencies of the current SWC system.
- (6)
- With respect to the SWC technology, relaxed design requirements for the X-mas tree and flexible jumper may be accepted.
All in all, in spite of the inevitable uncertainties, it is believed that the QRA results in this study are meaningful and of value for improving the engineering design of the future SWC system as well as pushing its industrialization progress.
Author Contributions
X.Z., T.M., Z.G. and Y.H. conceived and designed the research work. X.Z. performed the analytical calculations and analyzed the data. All the authors reviewed the results, drew conclusions, and wrote the paper.
Acknowledgments
The authors acknowledge and express profound thanks to Haibo Chen in Lloyd’s Register Consulting for his valuable advice for this research work. This research is financially supported by the National Natural Science Foundation of China (No. 51709041), China Postdoctoral Science Foundation (2017M610178) and the Fundamental Research Funds for the Central Universities.
Conflicts of Interest
The authors declare they have no conflict of interest.
Nomenclature
| Abbreviations | |
| AMV | Annulus master valve |
| ASV | Annulus swab valve |
| AWV | Annulus wing valve |
| ASDD | Artificial Seabed Deep-water Drilling |
| ALARP | As Low As Reasonably Practicable |
| CV | Choke valve |
| CRAC | Commercial risk acceptance criteria |
| DUT | Dalian University of Technology |
| EXL | External leakage |
| ERAC | Environmental risk acceptance criteria |
| FLP | Flow leakage path |
| FPU | Floating Production Unit |
| FTC | Fail to close |
| FMECA | Failure modes, effects, and criticality analysis |
| LCP | Leakage in closed position |
| LTA | Leak to annulus |
| MWL | Mean water level |
| MTTR | Mean time to repair |
| NTNU | Norwegian University of Science and Technology |
| PMV | Production master valve |
| PSA | Petroleum Safety Authority |
| PSV | Production swab valve |
| PWV | Production wing valve |
| QRA | Quantitative risk assessment |
| RAC | Risk acceptance criteria |
| SCS | South China Sea |
| SSP | Sea-star platform |
| SWC | Subsurface well completion |
| STLP | Subsurface Tension Leg Production |
| SCSSV | Surface controlled subsurface safety valve |
| TCF | Time correction factor |
| UDS | Ultra-deep sea |
| WD | Water depth |
| WBE | Well barrier element |
| XOV | Crossover valve |
| Variables | |
| The hole size area | |
| The contraction coefficient | |
| The total oil spill amount | |
| The mass release rate | |
| / | Internal/External pressure |
| The basic event i occurs at time t | |
| The probability that the top event occurs at time t | |
| The probability that minimal cut set j fails at time t | |
| The active time | |
| Time correction factor | |
| The effective duration of the release event | |
| Failure rate of the basic event | |
| Test interval | |
| Oil density | |
References
- Millheim, K.K. The next major challenge for deep water: Developing marginal fields. In Proceedings of the Offshore Technology Conference, Houston, TX, USA, 5–8 May 2008. [Google Scholar]
- Lim, F. Dry or wet trees in deepwater developments from a riser system perspective. In Proceedings of the Third International Deep-Ocean Technology Symposium, Beijing, China, 28 June–1 July 2009. [Google Scholar]
- Huang, Y.; Zhen, X.W.; Zhang, Q. A Subsurface Oil Production System in Ultra-Deep Sea. China Patent ZL 201110439619.9, 2014. [Google Scholar]
- Huang, Y.; Zhen, X.W.; Zhang, Q.; Wang, W.H. Concept design of an innovative ultra-deep water oil production device. J. Dalian Univ. Technol. 2013, 53, 851–857. [Google Scholar]
- Huang, Y.; Zhen, X.W.; Zhang, Q.; Wang, W.H. Optimum design and global analysis of flexible jumper for an innovative subsurface production system in ultra-deep water. China Ocean Eng. 2014, 28, 239–247. [Google Scholar] [CrossRef]
- Zhen, X.W.; Huang, Y.; Zhang, Q.; Wang, W.H. Parametric study on the effects of flexible jumpers on the global behavior of the rigid riser based on an innovative subsurface tension leg platform. J. Ship Mech. 2014, 18, 711–723. [Google Scholar]
- Guo, Y.F.; Ji, S.J.; Tang, C.Q. Feasibility of deepwater drilling in South China Sea by applying ABS unit. In Proceedings of the 17th International Offshore and Polar Engineering Conference, Lisbon, Portugal, 1–6 July 2007. [Google Scholar]
- Guo, Y.F.; Ji, S.J.; Tang, C.Q. Development of the artificial seabed technology and implementation pretrial well in the South China Sea. J. Mar. Sci. Appl. 2009, 8, 246–251. [Google Scholar] [CrossRef]
- Guo, Y.F.; Ji, S.J.; Tang, C.Q. ASDD Technology in deepwater drilling and its process of commercialization. In Proceedings of the ASME 2010 29th International Conference on Ocean, Offshore and Arctic Engineering, Shanghai, China, 6–11 June 2010. [Google Scholar]
- Workteam of Trial Well of ASDD. Operation Summary on Trial Well of ASDD in South China Sea; China Oilfield Services Limited: Beijing, China, 2009. [Google Scholar]
- Rausand, M. Risk Assessment: Theory, Methods, and Applications; John Wiley & Sons: Hoboken, NJ, USA, 2011. [Google Scholar]
- Gudmestad, O.T.; Zolotukhin, A.B.; Jarlsby, E.T. Petrolem Resourcs with Emphasis on Offshore Fields; WIT Press: Southamptonm, UK, 2010. [Google Scholar]
- SINTEF. Barriers to Prevent and Limit Acute Releases to Sea; Technical Report NO. A20727; SINTEF: Trondheim, Norway, 2011. [Google Scholar]
- Vanem, E.; Endresen, Ø.; Skjong, R. Cost-effectiveness criteria for marine oil spill preventive measures. Reliab. Eng. Syst. Saf. 2008, 93, 354–368. [Google Scholar] [CrossRef]
- Clarin, C. Application of Layers of Protection Analysis (LOPA) for Subsea Production Systems—A Risk Based Model for Determination of Integrity Levels in a Global Perspective. Master’s Thesis, Lund University, Lund, Sweden, 2013. [Google Scholar]
- Vinnem, J.E. Offshore Risk Assessment: Principles, Modeling and Application of QRA Studies, 3rd ed.; Springer: London, UK, 2014. [Google Scholar]
- Det Norske Veritas. NORSOK D-010: Well Integrity in Drilling and Well Operations; Det Norske Veritas: Oslo, Norway, 2013. [Google Scholar]
- Vesterkjar, R. Is it Necessary to Install a Downhole Safety Valve in a Subsea Oil/Gas Well? A Comparison of the Risk Level of a Well with, and without a Safety Valve. Master’s Thesis, Norwegian University of Science and Technology, Trondheim, Norway, 2002. [Google Scholar]
- Sintef Industrial Management. Offshore Reliability Data: Vol.2—Subsea Equipment, 5th ed.; Sintef Industrial Management: Trondheim, Norway, 2009. [Google Scholar]
- Molnes, E.; Sundet, I. Reliability of Well Completion Equipment. In Offshore Europe; Technical Report NO. STF75F95051; SINTEF: Trondheim, Norway, 1996. [Google Scholar]
- Mott Mac Donald Ltd. The Update of Loss of Containment Data for Offshore Pipelines, 5th ed.; PARLOC 2001; Mott Mac Donald Ltd.: Croydon, UK, 2003. [Google Scholar]
- Det Norske Veritas AS. Recommended Failure Rates for Pipelines; Technical Report NO. 2009-1115; Det Norske Veritas AS: Høvik, Norway, 2010. [Google Scholar]
- Roald, T.H. New risk assessment approach shows significant reduction in oil spill blowout risk. In Proceedings of the SPE International Conference on Health, Safety and Environment in Oil and Gas Exploration and Production, Stavanger, Norway, 26–28 June 2000. [Google Scholar]
Figure 1.
Sketch of the Subsurface Tension Leg Production (STLP) system concept.

Figure 2.
Life cycle of a subsurface well.

Figure 3.
Specific subsurface production well.

Figure 4.
The boundary definition of the Subsurface Well Completion (SWC) system.

Figure 5.
Overall risk model for the specific SWC system.

Figure 6.
Well barrier diagram for the specific SWC system.

Figure 7.
Environmental risk for the SWC system.

Figure 8.
Commercial risk for the SWC system.

Figure 9.
Effects of limit variations for ALARP on the environmental risk.

Figure 10.
Effects of limit variations for ALARP on the commercial risk.

Figure 11.
Effects of release rate variations on the environmental risk for subsea wellhead leaks.

Figure 12.
Effects of release rate variations on the commercial risk for subsea wellhead leaks.

Figure 13.
Effects of TCF variations on the environmental risk for subsea wellhead leaks.

Figure 14.
Effects of TCF variations on the commercial risk for subsea wellhead leaks.


Table 1.
Design basis of the STLP facility.
| Parameters | Value | Unit |
|---|---|---|
| Water depth | 3000 | m |
| Design field life | 20 | yrs |
| Depth of SSP | 200 | m |
| FPU offset (mean) | 350 | m |
| Maximum FPU excursion | 8% | WD |
| Number of oil wells | 5 | - |
| Number of rigid risers | 5 | - |
| Oil mass density | 840.3 | kg/m3 |
Table 2.
Environmental risk acceptance criteria (ERAC) for the specific scenario.
| Consequence Class | Released Quantity of Oil to Sea (tons) | Accepted Annual Probability |
|---|---|---|
| Minor harm | <10 | 10−1 |
| Moderate harm | 10–100 | 10−2 |
| Significant harm | 100–1000 | 10−3 |
| Serious harm | 1000–10,000 | 10−4 |
| Major harm | >10,000 | 10−5 |
Table 3.
Commercial risk acceptance criteria (CRAC) for the specific scenario.
| Consequence Class | Failure Losses (MUSD) | Corresponding Released Quantity of Oil to Sea (Weighted Global Average) (tons) | Accepted Annual Probability |
|---|---|---|---|
| Minor cost | <10 | <250 | 10−2 |
| Moderate cost | 10–100 | 250–2500 | 10−3 |
| Significant cost | 100–1000 | 2500–25,000 | 10−4 |
| Serious cost | 1000–10,000 | 25,000–250,000 | 10−5 |
| Major cost | >10,000 | >250,000 | 10−6 |
Table 4.
Main causes to the specific SWC system which resulted in uncontrolled releases to sea.
| Causes of Incidents | Subsea Wellhead | Rigid Riser | Subsurface Wellhead | X-mas Tree | Flexible Jumper | |
|---|---|---|---|---|---|---|
| Corrosion threats | Internal | √ | √ | √ | √ | √ |
| External | √ | √ | √ | √ | √ | |
| Structural threats | Excessive mechanical loads | √ | √ | √ | √ | √ |
| Excessive pressure loads | √ | √ | √ | √ | √ | |
| Excessive thermal loads | √ | √ | √ | √ | √ | |
| Fatigue | √ | √ | √ | - | √ | |
| Buckling | - | √ | - | - | √ | |
| Third party threats | Anchoring | - | - | - | √ | √ |
| Dropped object | - | - | - | √ | √ | |
| ROV impact | √ | √ | √ | √ | √ | |
| Material defects | Weld defect | - | √ | - | √ | - |
| Steel defect | √ | √ | √ | √ | - | |
| Flexible defect | - | - | - | - | √ | |
| Control system threats | Loss of power | - | - | - | √ | - |
| Sensor failure | - | - | - | √ | - | |
| Communication error | - | - | - | √ | - | |
| Software failure | - | - | - | √ | - | |
| Obsolescence | - | - | - | √ | - | |
| Natural hazard threats | Extreme weather | - | - | - | - | √ |
| Earthquakes | √ | - | - | - | - | |
| Landslides | √ | - | - | - | - | |
| Volcanic activity | √ | - | - | - | - | |
Table 5.
Minimal cut sets of the specific SWC system.
| FLP1 = {R-1, 1-2, 2-3, 3-S} |
| FLP2 = {R-1, 1-2, 2-3, 3-4, 4-S} |
| FLP3 = {R-1, 1-2, 2-3, 3-4, 4-5, 5-S} |
| FLP4 = {R-1, 1-2, 2-3, 3-7, 7-6, 6-S} |
| FLP5 = {R-1, 1-2, 2-3, 3-7, 7-S} |
| FLP6 = {R-1, 1-10, 10-8, 8-6, 6-S} |
| FLP7 = {R-1, 1-10, 10-8, 8-S} |
| FLP8 = {R-1, 1-10, 10-9, 9-S} |
| FLP9 = {R-1, 1-10, 10-S} |
| FLP10 = {R-10, 10-8, 8-6, 6-S} |
| FLP11 = {R-10, 10-8, 8-S} |
| FLP12 = {R-10, 10-9, 9-S} |
| FLP13 = {R-10, 10-S} |
Table 6.
Results of annual leak probabilities for the risk sub-models.
| Release Point | Annual Leak Probability |
|---|---|
| Subsea wellhead | 8.32 × 10⁻⁶ |
| Rigid riser | 6.65 × 10⁻⁶ |
| Subsurface wellhead | 3.85 × 10⁻⁶ |
| X-mas tree | 2.75 × 10⁻⁹ |
| Flexible jumper | 1.65 × 10⁻¹¹ |
| Total | 1.88 × 10⁻⁵ |
Table 7.
Recommended hole size distributions .
| Hole Size Category | Equivalent Hole Diameter (mm) | Wellhead/X-Mas Tree | Rigid Riser | Flexible Jumper |
|---|---|---|---|---|
| Small | 0–20 | 74% | 50% | 26% |
| Medium | 20–80 | 16% | 20% | 37% |
| Large | >80 | 10% | 30% | 37% |
Table 8.
Recommended time correction factors due to accessibility.
| Category | Water Depth (m) | TCF |
|---|---|---|
| Shallow sea | ≤200 | 0.5 |
| Deep sea | 200~1500 | 1.0 |
| Ultra-deep sea | ≥1500 | 5.0 |
Table 9.
Release duration time.
| Category | Active Repair Time (hour) | Time Correction Factor |
|---|---|---|
| Subsea wellhead | 288 | 5.0 |
| Rigid riser | 168 | 1.0 |
| Subsurface wellhead | 288 | 0.5 |
| X-mas tree | 12 | 0.5 |
| Flexible jumper | 168 | 0.5 |
Table 10.
Specific oil spill amount.
| Category | Average Annual Probability | Average Annual Oil Spill Amount (tons) |
|---|---|---|
| Subsea wellhead | 8.32 10−6 | 10,524.6 |
| Rigid riser | 6.65 10−6 | 2408.0 |
| Subsurface wellhead | 3.85 10−6 | 1052.5 |
| X-mas tree | 2.75 10−9 | 43.9 |
| Flexible jumper | 1.65 10−11 | 1561.0 |
| Total | 1.88 10−5 | 15,589.9 |
Table 11.
Assumption effects and uncertainty sources in this study.
| Assumption | Effect | Uncertainty Source |
|---|---|---|
| Limit for ALARP is set to 20% | Conservative | No unified risk acceptance criteria available |
| Reliability of well completion equipment | Conservative | No latest relevant data available |
| The release rate for a large hole size is 1000 m3/day | Conservative | Relevant data unavailable |
| Different release points have the same release rate | Conservative | Relevant data unavailable |
| Recommended TCF for UDS | Conservative | Relevant data unavailable |
| Only critical failure are considered for the hazard identification | Optimistic | Simplification made in the modeling |
| No leakages coming from casing and cement | Optimistic | Simplification made in the modeling |
| No failures of the control system and other topside equipment | Optimistic | Simplification made in the modeling |
| Products of all the s are disregarded | Optimistic | Simplification made in the modeling |
| Equipment deterioration | Optimistic | Incompleteness of the knowledge |
| Equivalent hole size estimates for subsea production facilities | Unknown | Relevant data unavailable |
| A ratio of 1.5 assumed for environmental and socioeconomic costs compared with cleanup costs | Unknown | Relevant data unavailable |
© 2018 by the authors. Licensee MDPI, Basel, Switzerland. This article is an open access article distributed under the terms and conditions of the Creative Commons Attribution (CC BY) license (http://creativecommons.org/licenses/by/4.0/).
Share and Cite
MDPI and ACS Style
Zhen, X.; Moan, T.; Gao, Z.; Huang, Y. Risk Assessment and Reduction for an Innovative Subsurface Well Completion System. Energies 2018, 11, 1306. https://doi.org/10.3390/en11051306
AMA Style
Zhen X, Moan T, Gao Z, Huang Y. Risk Assessment and Reduction for an Innovative Subsurface Well Completion System. Energies. 2018; 11(5):1306. https://doi.org/10.3390/en11051306
Chicago/Turabian StyleZhen, Xingwei, Torgeir Moan, Zhen Gao, and Yi Huang. 2018. "Risk Assessment and Reduction for an Innovative Subsurface Well Completion System" Energies 11, no. 5: 1306. https://doi.org/10.3390/en11051306
Note that from the first issue of 2016, this journal uses article numbers instead of page numbers. See further details here.