Decomposing Air Pollutant Emissions in Asia: Determinants and Projections

International Institute for Applied Systems Analysis (IIASA), Air Quality and Greenhouse Gases Program, Schlossplatz 1, 2361 Laxenburg, Austria
*
Author to whom correspondence should be addressed.
Energies 2018, 11(5), 1299; https://doi.org/10.3390/en11051299
Submission received: 26 April 2018
/
Revised: 17 May 2018
/
Accepted: 17 May 2018
/
Published: 19 May 2018
(This article belongs to the Special Issue Energy and Environment)
Abstract
:High levels of air pollution pose an urgent social and public health challenge in many Asian regions. This study evaluates the role of key factors that determined the changes in emission levels in China, India and Japan over the past 25 years. While emissions of air pollutants have been declining in Japan since the 1990s, China and India have experienced a rapid growth in pollution levels in recent years. Around 2005, control measures for sulfur emissions started to deliver expected reductions in China, followed by cuts in nitrogen oxides ten years later. Despite recent policy interventions, growing emission trends in India persist. A decomposition analysis of emission-driving factors indicates that emission levels would have been at least two-times higher without the improvements in energy intensity and efficiency, combined with end-of-pipe measures. Due to the continuous reliance on fossil fuels, the abatement effect of a cleaner fuel mix was in most cases significantly smaller than other factors. A reassessment of emission projections developed in the past suggests a decisive impact of energy and environmental policies. It is expected that targeted legislative instruments will play a dominant role in achieving future air-quality goals in Asia.
1. Introduction
According to the World Health Organization (WHO), air pollution ranks as the greatest environmental risk factor for human health worldwide. Each year, more than six million people die prematurely from the impacts of air pollution. Around three million premature deaths are linked to outdoor (ambient) air pollution emitted by power plants, industrial facilities, vehicles and ships, while the use of polluting fuels for indoor cooking and heating causes an additional three million premature deaths from household air pollution [1]. The latter is primarily linked to energy poverty and the traditional use of solid biomass for cooking [2]. In addition, air pollution causes substantial damage to crops and ecosystems [3].
The rapid growth in emerging economies over the last decades has led to dangerous levels of air pollution throughout Asia, causing social, public health, and environmental problems that add to the challenges of sustainable development [4,5]. As a result, more than 50% of people living in Asia are exposed to concentrations of fine particles that do not comply with the least-stringent WHO air-quality standards (35 μg/m3). In fact, less than 10% of the Asian population experience air quality that complies with WHO guideline values (10 μg/m3). Although many Asian countries have initiated actions to reduce emissions of air pollutants, their benefits are often counteracted by national development targets focusing on further economic growth, and are therefore not always visible [6].
Worldwide experience clearly demonstrates that clean air can be achieved without compromising social and economic development (e.g., [7,8,9]). This requires well-designed policies that prioritize cost-effective interventions for specific conditions at the sources that deliver the largest benefits, and their integration with other development targets. While there is ample evidence for positive policy impacts—also from wealthy Asian countries [10]—this cannot be directly transferred to all states in Asia due to differences in economic development, social conditions, meteorological factors and institutional settings.
With a focus on three major economies in Asia—China, India and Japan—this paper presents a comprehensive analysis of key determining factors that contributed to the evolution of air pollutant emissions over the past 25 years. Using the latest available energy and emissions statistics, we identify and quantify in a consistent way the role of individual driving forces behind emission changes, and associate the observed emission trends with various policy interventions described in the literature and legislative documents. This empirical analysis contributes to the interpretation of the past emission trajectories under three very different economic and policy contexts, and extends our understanding of the importance of dedicated air-quality strategies.
The quantification of air-pollution levels in Asia has been a subject of scientific examination since the early 1990s [11,12]. At that time, the first emission projections had been developed using the scenario approach, and implemented within modeling tools such as Regional Air Pollution INformation and Simulation (RAINS)-Asia [13,14]. Since then, the scenario literature about air emissions in Asia has become sizeable, reflecting the past anticipations and various expectations of socioeconomic drivers, development of the energy sector, technological progress and implications of policy measures. In this paper, we look back for the first time at a set of selected emission scenarios from the past, and reexamine how different determinants have influenced the earlier projections.
The structure of the paper is as follows: In the next section, the data sources and the evolution of the driving forces behind the observed emission changes of sulfur dioxide (SO2), nitrogen oxides (NOx) and fine particulate matter (PM2.5) are presented. Subsequently, air-quality policies and their timing are summarized for three countries. The quantitative results of a decomposition analysis are provided in the following chapter, with a focus on the roles of energy intensity, fuel mix and pollution control for the observed emission trends. The past scenarios of the key pollutants are compared and assessed for China and India. Finally, policy insights and conclusions are drawn based on the numerical results.
2. Materials and Methods
2.1. Data Sources
The statistical information used in this work has been extracted from the 2017 edition of databases published by the International Energy Agency (IEA): IEA World Energy Statistics and Balances, sections “Extended world energy balances” and “World indicators” [15]. Data on air pollutant emissions originate from the inventories available from the GAINS model (Greenhouse Gas—Air Pollution Interactions and Synergies) developed by the International Institute for Applied Systems Analysis (IIASA) [16].
2.2. Socioeconomic Drivers
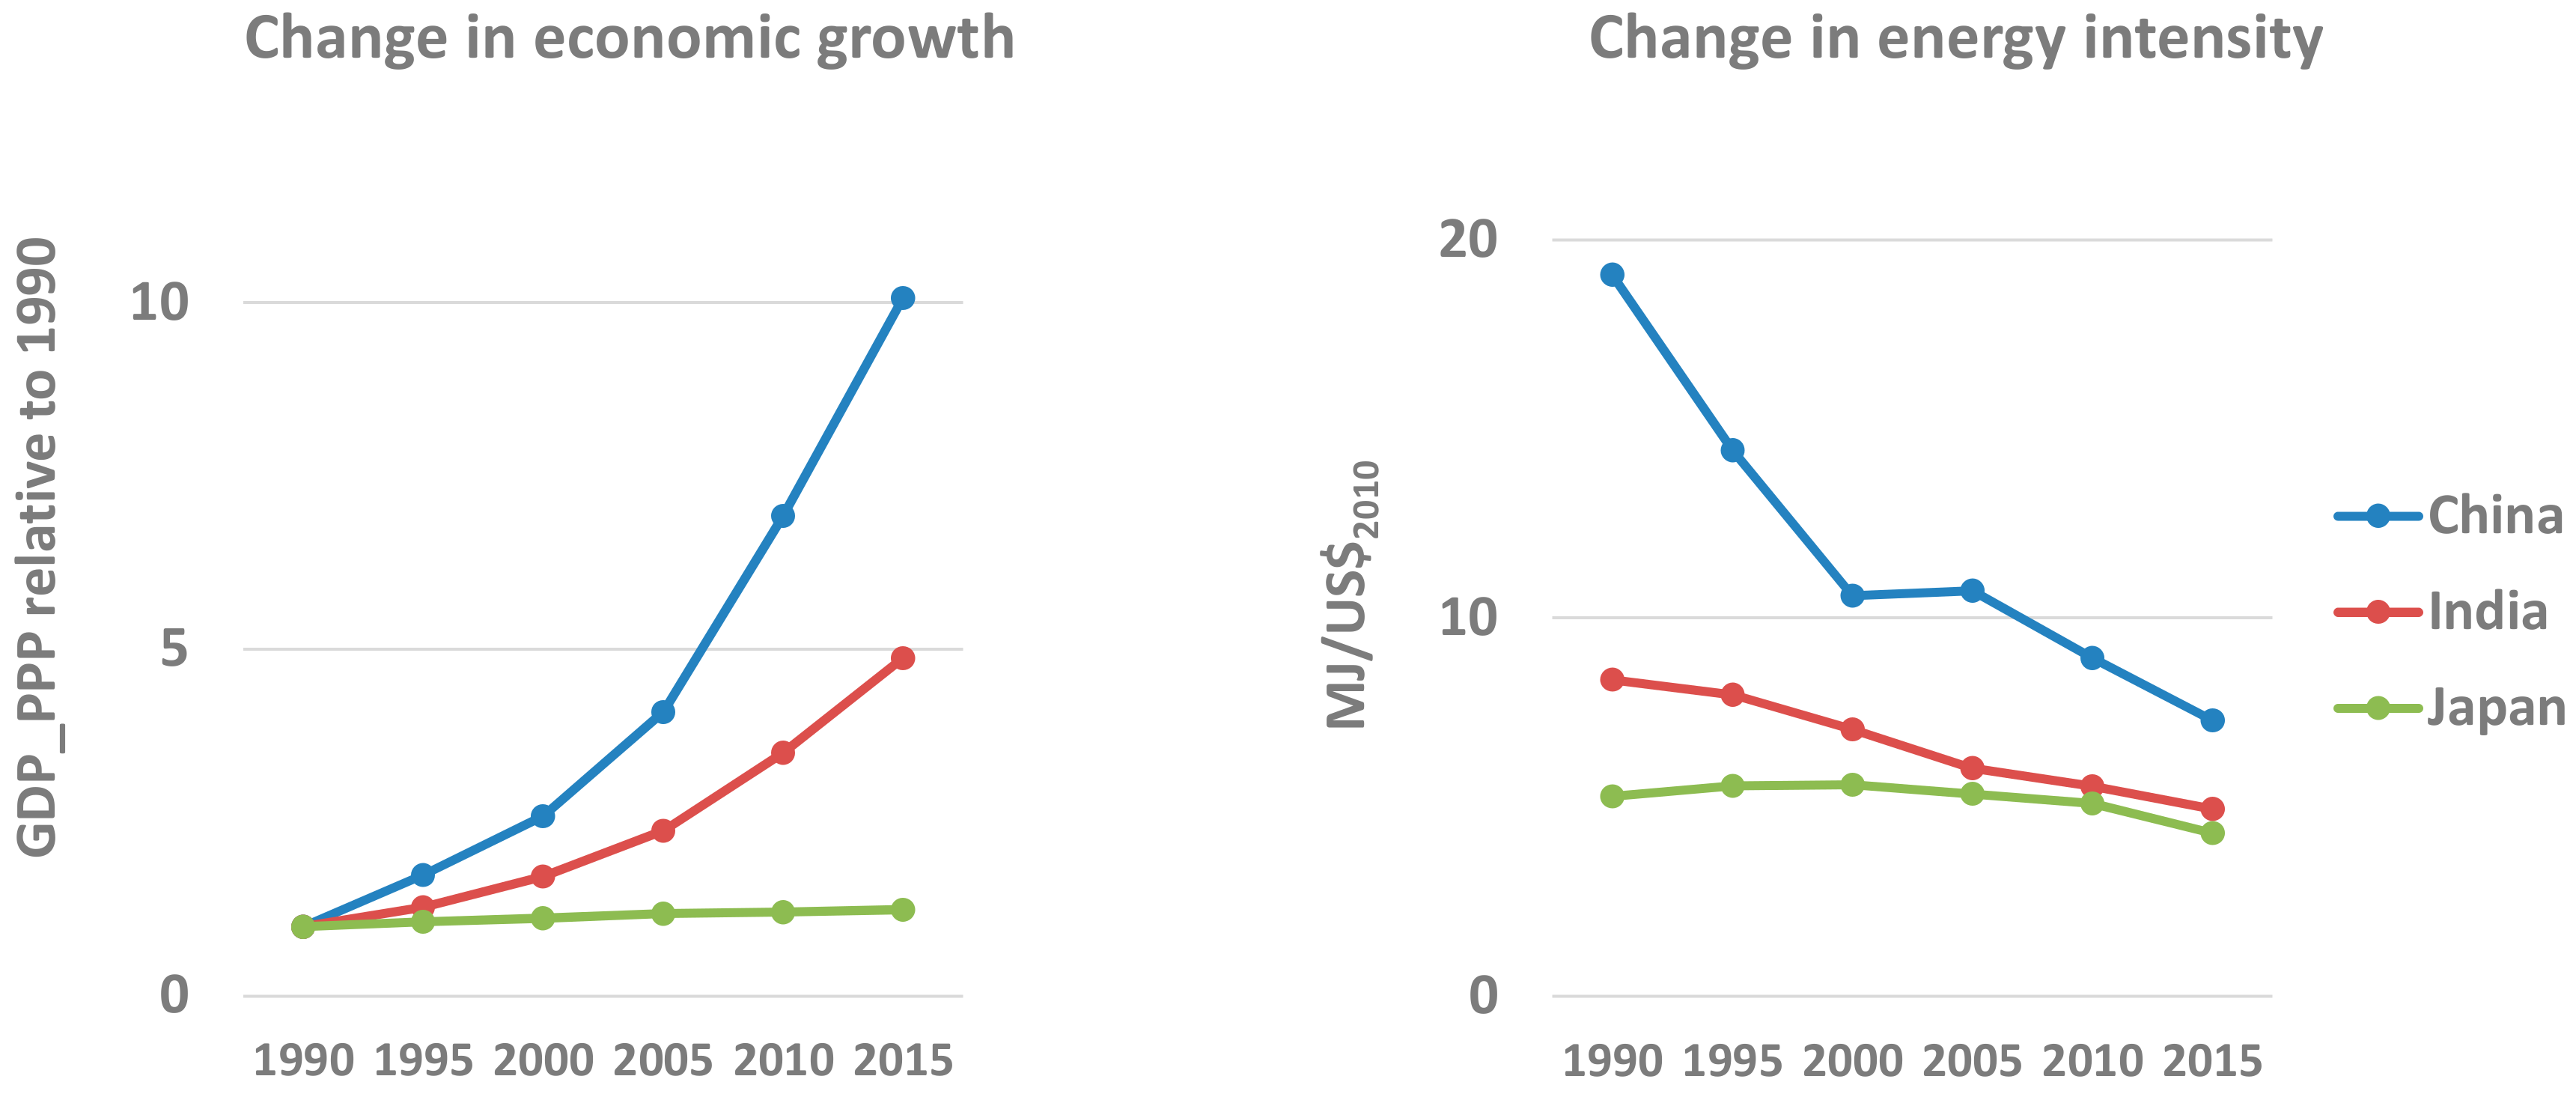
It has been pointed out in the literature that there is a relationship between economic growth and environmental quality [17]. Indeed, the varying stages of socioeconomic and political development across countries determine the structure of the production and consumption patterns, as well as the access and quality of energy services, which in turn has consequences for air pollution [18,19,20]. Two countries examined in this study—China and India—are characterized by very steep economic growth over the studied period, with annual growth rates of 9% and 6%, respectively, while the increase in gross domestic product (GDP) in Japan was about 1% per annum. By 2015, on a per-capita basis, the annual income in Japan was more than twice as high as in China, and a factor of six higher than in India.
At the same time, it has been observed that energy intensity (measured as energy needs per unit of economic output) in China and India did not follow the GDP trend. This decoupling effect was driven by two factors: (a) the restructuring of the economy by shifting energy demand from energy-intensive industries to lighter sectors and services; and (b) the increase in energy efficiencies on the supply and demand sides of the energy sector. A large portion of the improved energy intensity and demand reductions was not autonomous, but rather was achieved through targeted policy instruments, such as efficiency standards, building energy codes and sectorial targets [6]. In addition, fuel price changes, technological progress and innovative energy management stimulated efficiency gains.
In total, energy intensity in China was 2.5-times lower in 2015 than in 1990, and in India, it nearly halved during the past 2.5 decades. In an advanced economy such as Japan, energy intensity improvements did not continue at the same pace as in the emerging economies, because many of the structural and efficiency measures were realized earlier (or before 1990). It is noted that from 1990 to 2000, a temporary increase in energy intensity was observed, which will be discussed in the sections below. On average, Japan achieved a −0.8% annual decline rate over the last 25 years, with a part of this reduction attributed to the reallocation of heavy industry abroad. The diverging trends in GDP growth and the convergence in energy intensity are depicted in Figure 1.
Between 1990 and 2015, total energy consumption in China increased nearly four times and almost tripled in India, while it stagnated in Japan (2% increase on the 1990’s levels). Observed changes in the fuel mix have been significant. The evolution of the shares of key fuel categories to the overall energy demand is shown in Figure 2. The fuel mix in China has been dominated by coal, with this fuel source accounting for more than half of total energy use. In relative terms, however, the contribution of less emission-intensive fuels, that is, natural gas and noncombustion-energy forms, increased from 10% to 30%. The rapid growth in the relative shares of coal in the Indian fuel mix was driven by the demand in the power sector. In both China and India, the overall importance of biomass has gradually declined, although biofuels still constitute the second-largest energy source in India. The Japanese energy system has been characterized by a large portion of nuclear energy in the fuel balance, which has changed in recent years as a consequence of the Fukushima accident. By 2015, oil and gas became dominant energy carriers in Japan, while the share of coal has also been growing gradually.
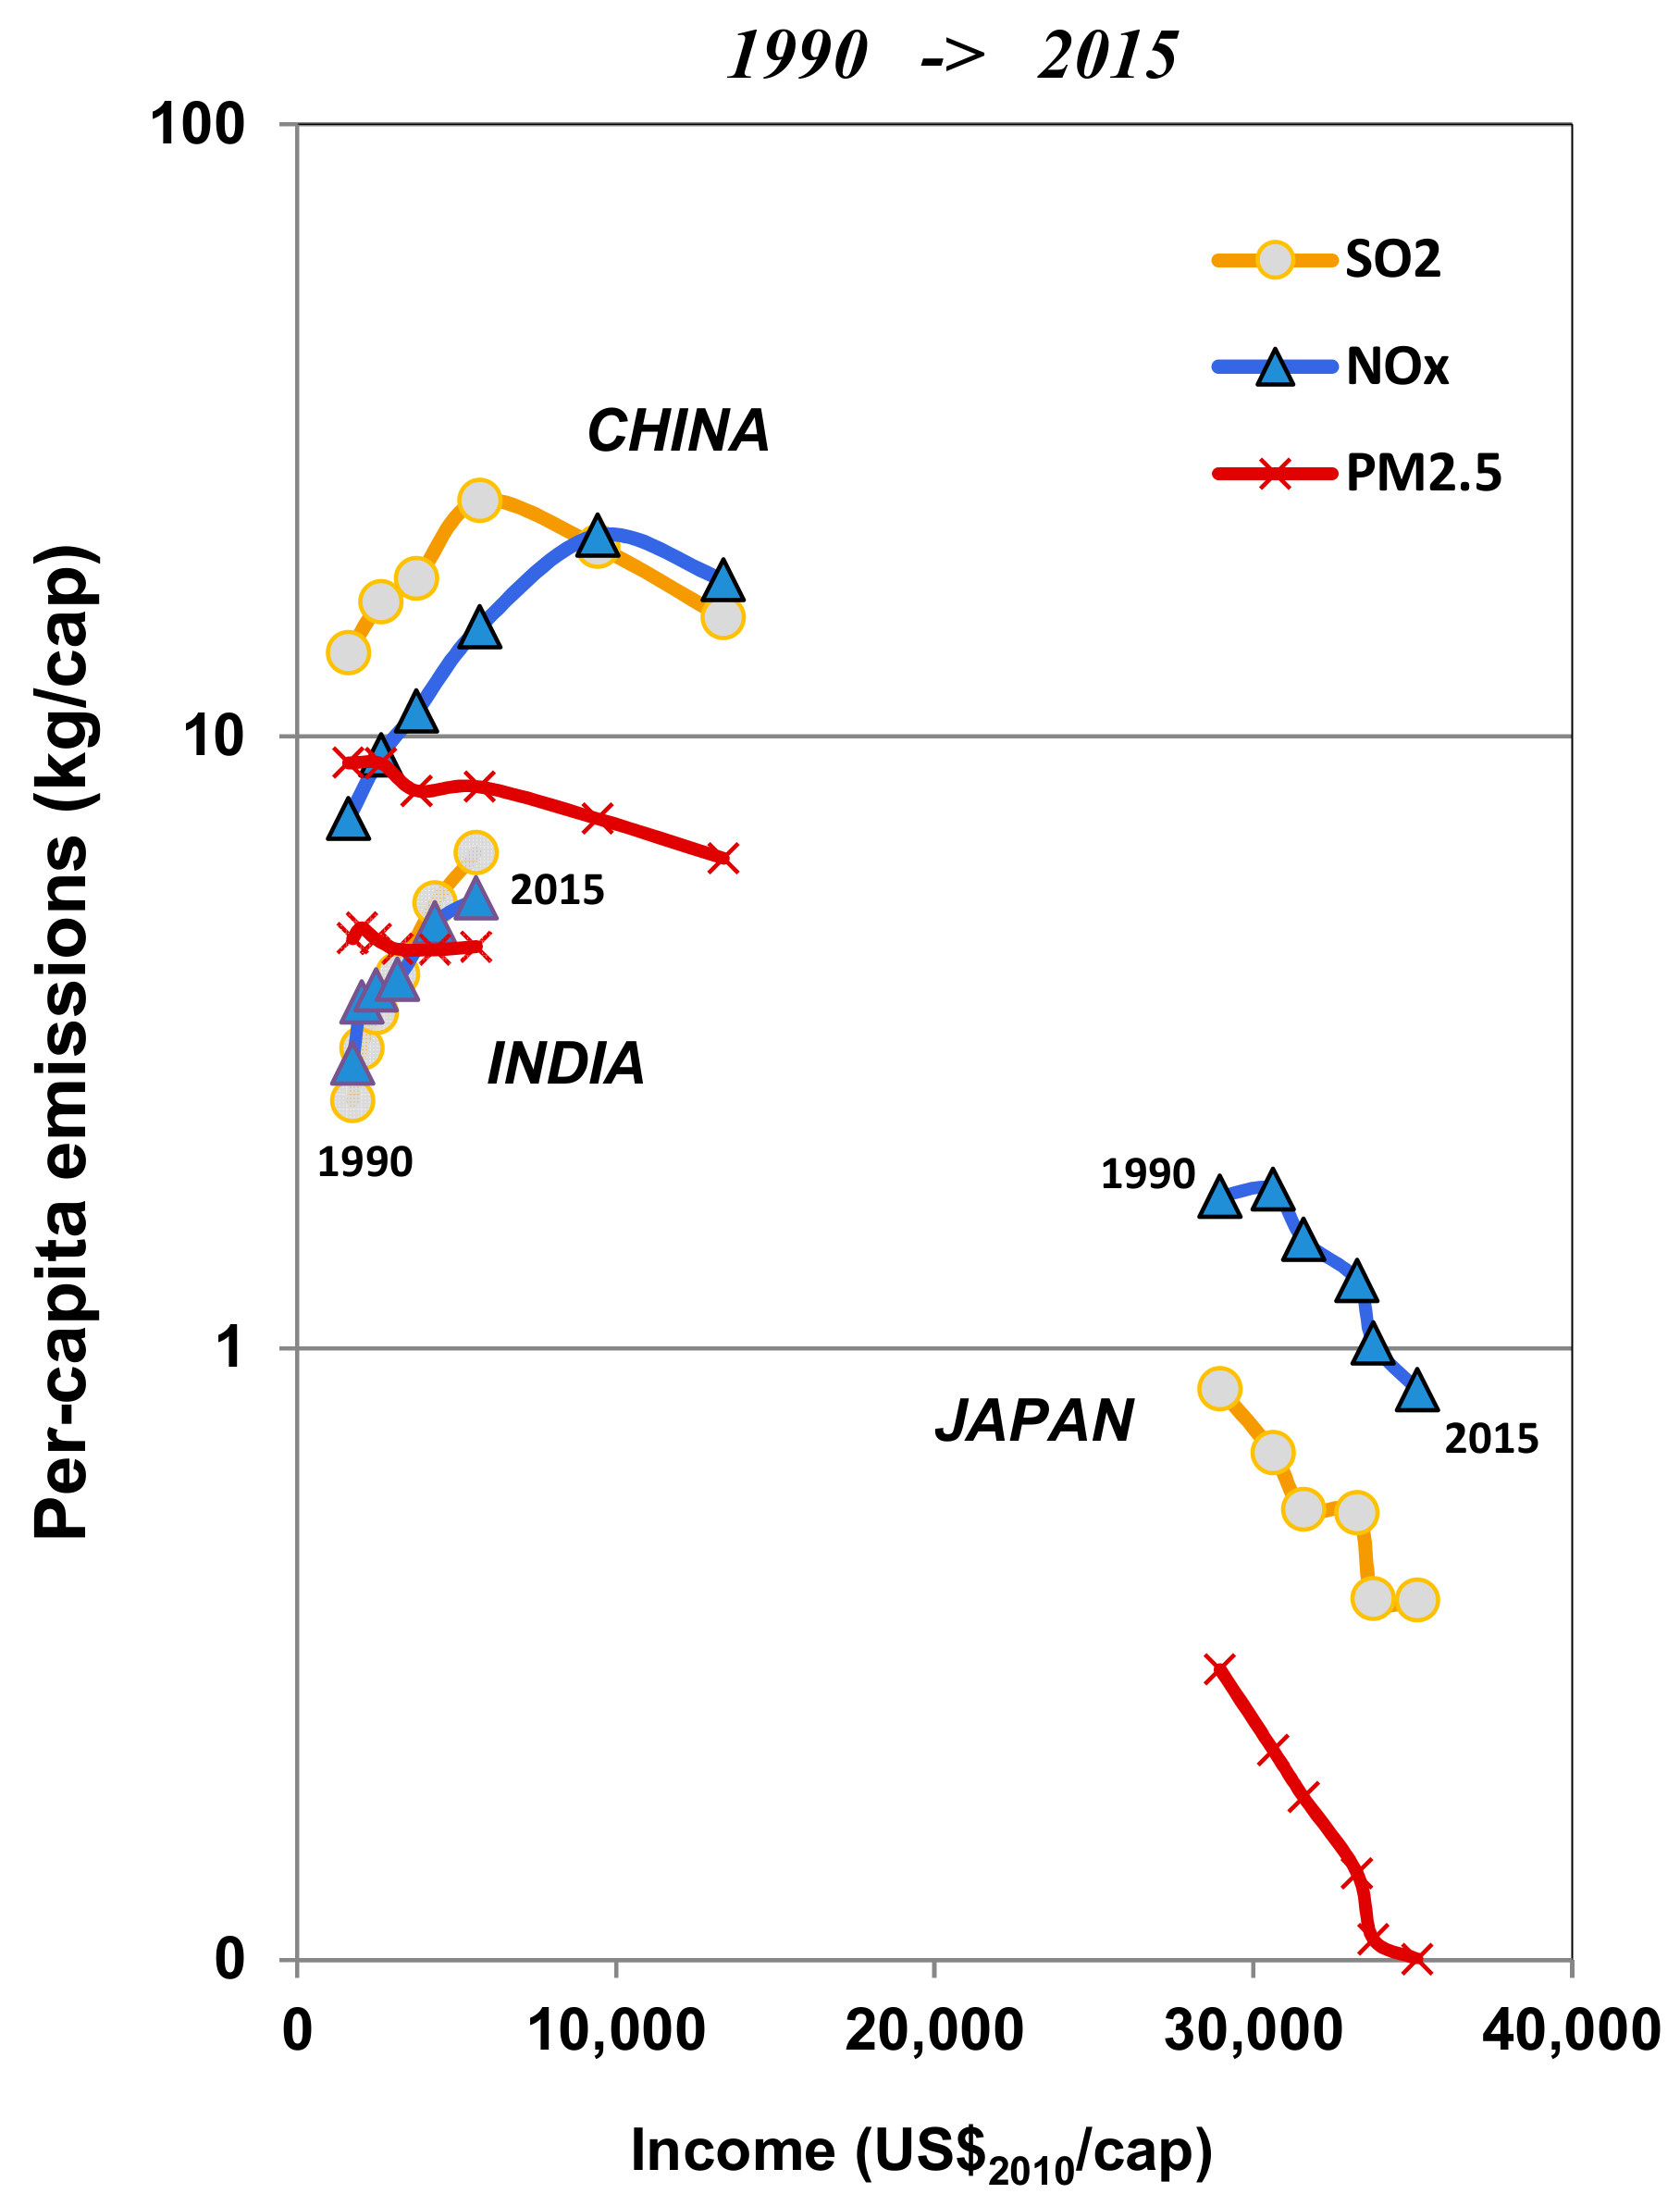
The link between economic development and emissions is further illustrated in Figure 3, where the observed changes in emissions of SO2, NOx and PM2.5 in the period 1990–2015 are expressed as a function of annual income per capita. There are significant differences in the trends between the selected pollutants and countries: Different economy structures and energy mixes, together with the implementation (or lack) of air-quality policies, determine these variations, as will be discussed below.
For PM2.5, a declining trend is reported for all three countries from 1990 to 2015, suggesting a correlation between increasing welfare and transition from solid fuels to cleaner energy forms and more efficient devices. The trends for SO2 indicate that coal-based power and industry sectors supported the strong push for economic growth, and led to increasing sulfur emissions, however, the impact of regulations induced a reverted/downward trend in China from 2005 to 2015. Similarly, rising incomes are likely to accelerate growth in NOx emissions, mainly because of an increase in transport services. The example of China suggests that emission reductions can be achieved at lower income levels when compared to, for example, Japan, where the declining emission trends in recent years are dominated by devoted control measures. A turning point for Indian emissions has not been observed yet.
2.3. Policy Context
Since the 1980s, growing awareness and scientific evidence about the extent and impacts of air pollution in Asia have led to the development of initial emission standards and air-protection laws in many countries [21,22]. In general, over the past 25 years these standards have been updated and made more and more stringent, depending on the environmental goals of individual countries, considerations about economic development, and the competitiveness and evolution of the structure of economies. There are various obstacles reported in the literature that, in many cases, have had negative impacts on the effectiveness of policies and delayed their implementation, such as an underdeveloped institutional capacity, fragmented policy-making regime, lack of enforcement mechanisms, or moderate public pressure [23].
It is beyond the scope of this paper to analyze the complex policy-development procedures in the three selected countries. Therefore, we focus here on the evolution of emission standards in two key emitting sectors in the past, namely, coal-based power generation and passenger transport. A common pattern has been observed—the control of PM in the power sector occurs as a first policy target, followed by emission standards for SO2 and NOx emissions (Table 1). Furthermore, the very first (quantitative) emission limits were frozen (and sometimes relaxed) during the first one-and-a-half decades, and only substantially tightened later on. The current standards for coal power plants in China and India are comparably as stringent as those in Japan, Europe or in the USA [2].
The urgency to control emissions from land-based mobile sources has been growing in Asia as a result of increasing urbanization, car ownership rates (directly linked with wealth and changing preferences), and infrastructure development. Table 2 provides an example of the time evolution of PM and NOx emission limits for passenger light-duty vehicles. In contrast to the stationary sources, NOx standards were introduced earlier than PM limits, which is associated with the later uptake of diesel cars that needed to be equipped with particulate filters. In Japan, standards for passenger cars were introduced around 20 years earlier than in China and India. Although both countries have recently been catching up on implementing more stringent regulations, Japanese norms are currently still more stringent for both gasoline and diesel vehicles [2].
2.4. Computation Method
The various driving forces and policy interventions described in previous sections were responsible for the changes in emissions in the selected Asian countries. To disentangle the impacts of autonomous changes in economic growth, structural shifts, or technical innovations from dedicated energy and air-quality policies, we present the results of a simplified additive form of the index decomposition analysis elaborated by Hoekstra and van den Bergh [29], adopted for decomposing past air-emissions changes in Europe by Rafaj et al. [30]. Similar methods used here for China, India and Japan have been applied for various European assessments [31,32], as well as for China [33].
To quantify the relative importance of key determinants of changes in emission levels, we apply the identity defined in Rafaj et al. [30] following the evolution of three driving factors: (a) energy intensity; (b) fuel mix; and (c) air-pollution abatement measures. Formally, emission changes relative to the selected base year (1990) can be described as a result of:
where the three factors under examination represent:
- (a)
- Temporal change in energy intensity, that is, the Energy consumed per unit of economic output (GDP), which determines the size of energy demand, structure of energy services, and reflects differences in socioeconomic structures, as well as in behavioral patterns. Energy intensity is complemented by the impacts of efficiency improvements of the energy system (Δη), in other words, the efficiency at which primary energy is converted into secondary and final energy.
- (b)
- The evolution of the fuel mix of different energy forms affects emission intensities, comprising inter-fossil-fuel switch and changes in the fraction of non-fossil fuels in energy supply. Substitution of traditional/combustible fuels by electricity and district heating contributes to this mitigation component on the demand side of the energy system.
- (c)
- The changes in aggregated emission factors over time—or the amount of pollutants emitted per unit of energy—which typically follow the implementation of end-of-pipe measures and fuel quality standards. The resulting emission coefficient reflects the removal efficiency (eff) of a given abatement measure adopted at a specific rate (ΔX).
In our approach, which is described in additional details by Rafaj et al. [30] and Åström et al. [31], we construct four counterfactual comparative emission scenarios by sequentially adding the impact of the factors listed above. First, an upper limit for emissions is calculated for the hypothetical case in which emission-reduction components are kept at the base-year levels, so that the emission path follows GDP growth. The observed development in energy intensity and efficiency improvements are accounted for in the second scenario, where fuel mix and emission controls are kept unchanged. The third scenario reflects actual trends in the share of fuels in key sectors. The fuel-mix component is not considered here for fugitive and industrial process emissions from cement, iron and steel production. Finally, the contribution of control measures in the fourth scenario is based on reported observations. In most cases, the ordering of factors in our analysis follows the sequence in which the determinants appear in the real world [32].
3. Results and Discussion
3.1. Decomposition Analysis
3.1.1. China
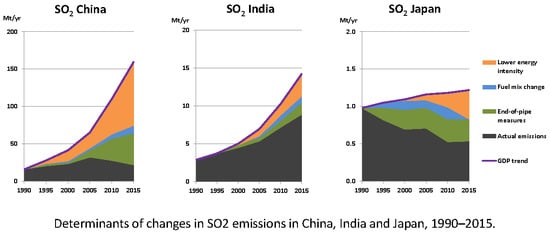
Similar to energy intensity, emissions of the three pollutants—SO2, NOx and PM2.5—did not follow the rapid GDP growth in China from 1990 to 2015. After the period of gradual increase, emission levels were peaking at different times: SO2 around 2005, NOx declined after 2010, and PM2.5 has been on a declining trajectory since the end of the 1990s. As shown in Figure 4, the combined effect of improved energy intensity and efficiency gains is identified as the dominant factor behind the observed emission trends, and is most pronounced for fine particles. The evolution of Chinese energy intensity is analyzed in detail by the IEA [6], which associates the large improvements with high rates of capital stock turnover and related investments in modern technologies. It is reported that the energy intensity of heavy industries, such as cement and steel production, declined by 30–50% since the 2000s, while the efficiency of the service sector improved by more than 25%, suggesting a large additional energy-saving potential [34].
The Chinese government enforced the closure of inefficient small-scale industrial installations within the past five-year plans. However, coal remains the dominant energy source in industry and in the power sector. This is the main reason why the contribution of fuel-mix changes towards air pollution abatement has been significantly smaller compared to energy-intensity improvements. Investments into pollution controls, on the other hand, have been immense. The share of coal-fired power plants equipped with sulfur scrubbers, for example, increased from 10% in 2005 to 85% in 2015, and nearly 1.5% of GDP in China has been spent on investments in pollution control over this period. However, the overall policy framework suffered from numerous flaws and deficiencies [23,35] and did not prevent the repeated haze pollution crisis in 2013 and beyond [36,37].
We estimate that by 2015, end-of-pipe measures for SO2 and NOx contributed around one third to overall emissions reductions. This share is significantly smaller for the reductions of PM2.5, where the overall decline in emissions resulted from structural changes in industry and in the domestic sectors. Our results are in line with the decomposition exercise reported by Xu et al. [38], which identifies improved energy intensity as the decisive factor behind the air-emission changes from 2005 to 2012. Other studies [39,40], based on national and provincial statistical yearbooks of China, highlight the growing role of end-of-pipe measures, especially in recent years.
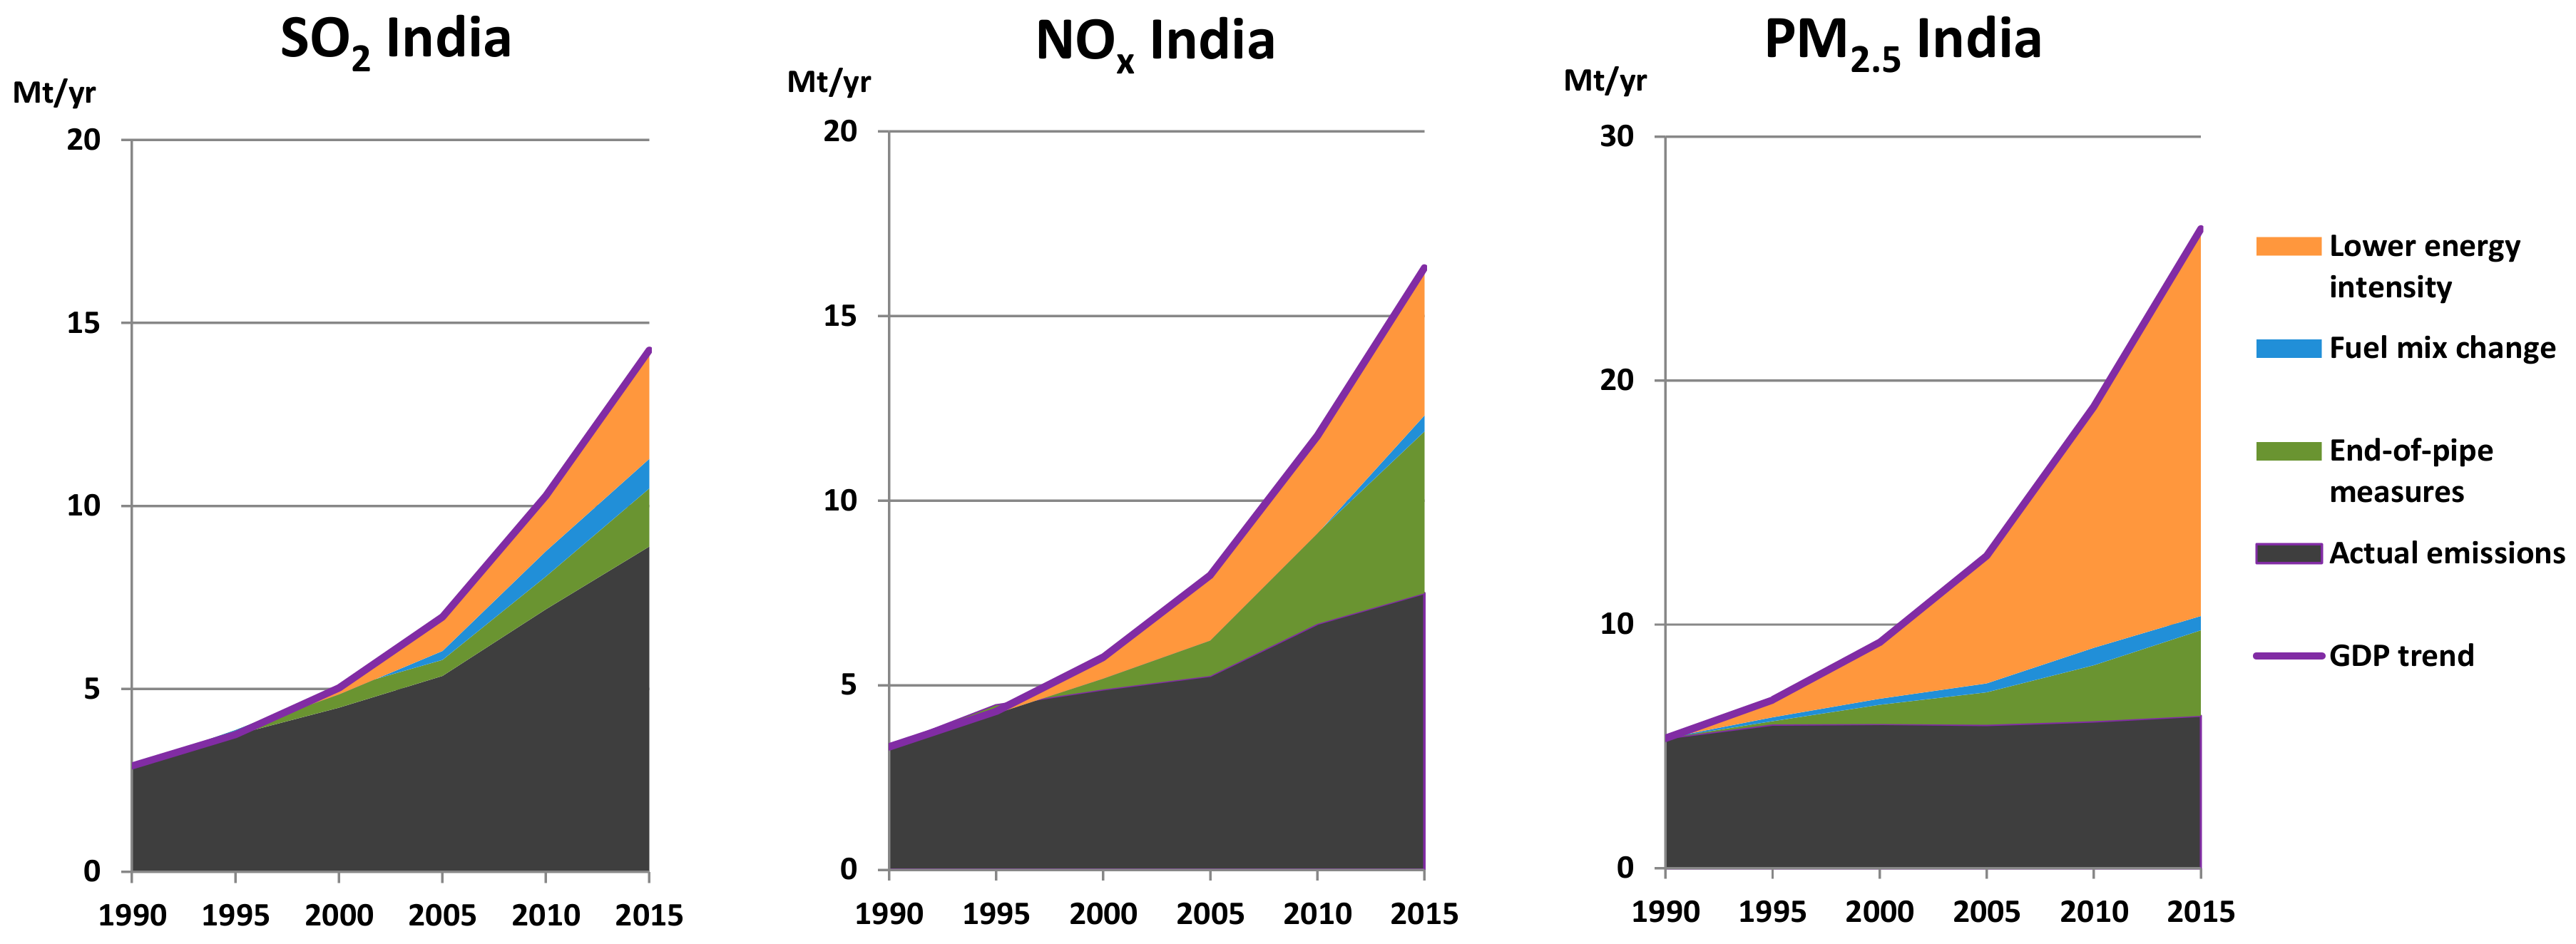
3.1.2. India
Since 1990, SO2 emissions in India have increased by a factor of three, driven mostly by coal consumption in the power sector. This growth would have been even stronger without the energy-efficiency improvements and fuel-mix changes that by 2015 contributed 55% and 15%, respectively, to lower sulfur emissions. Although many plants and industrial facilities were equipped with emission controls, they were not sufficient to revert the increasing trend. By 2015, NOx emissions had more than doubled compared to 1990 levels, mainly from the transportation and power plant sectors. The majority of NOx emissions in transport originated from land-based road transport, such as diesel-driven trucks and buses. The increased relative share of diesel vehicles has counteracted the mitigation effect of the emission standards introduced as of the 2000s.
Emissions of PM2.5 did not grow as rapidly as SO2 or NOx, although a 20% increase has been observed in India since 1990 (Figure 5). The strong decoupling between GDP and emissions can be attributed to several factors. Most important are structural shifts, energy intensity, and efficiency improvements in key emission sources, that is, the use of traditional solid fuels in households and the penetration of improved devices, as well as transitions in industry [2]. Fuel-mix changes had lesser impacts than SO2 and delivered a 3% emission reduction in 2015. Without the combined impact of control technologies in the power sector, industry, and transport, current PM2.5 levels in India would be 50% higher.
3.1.3. Japan
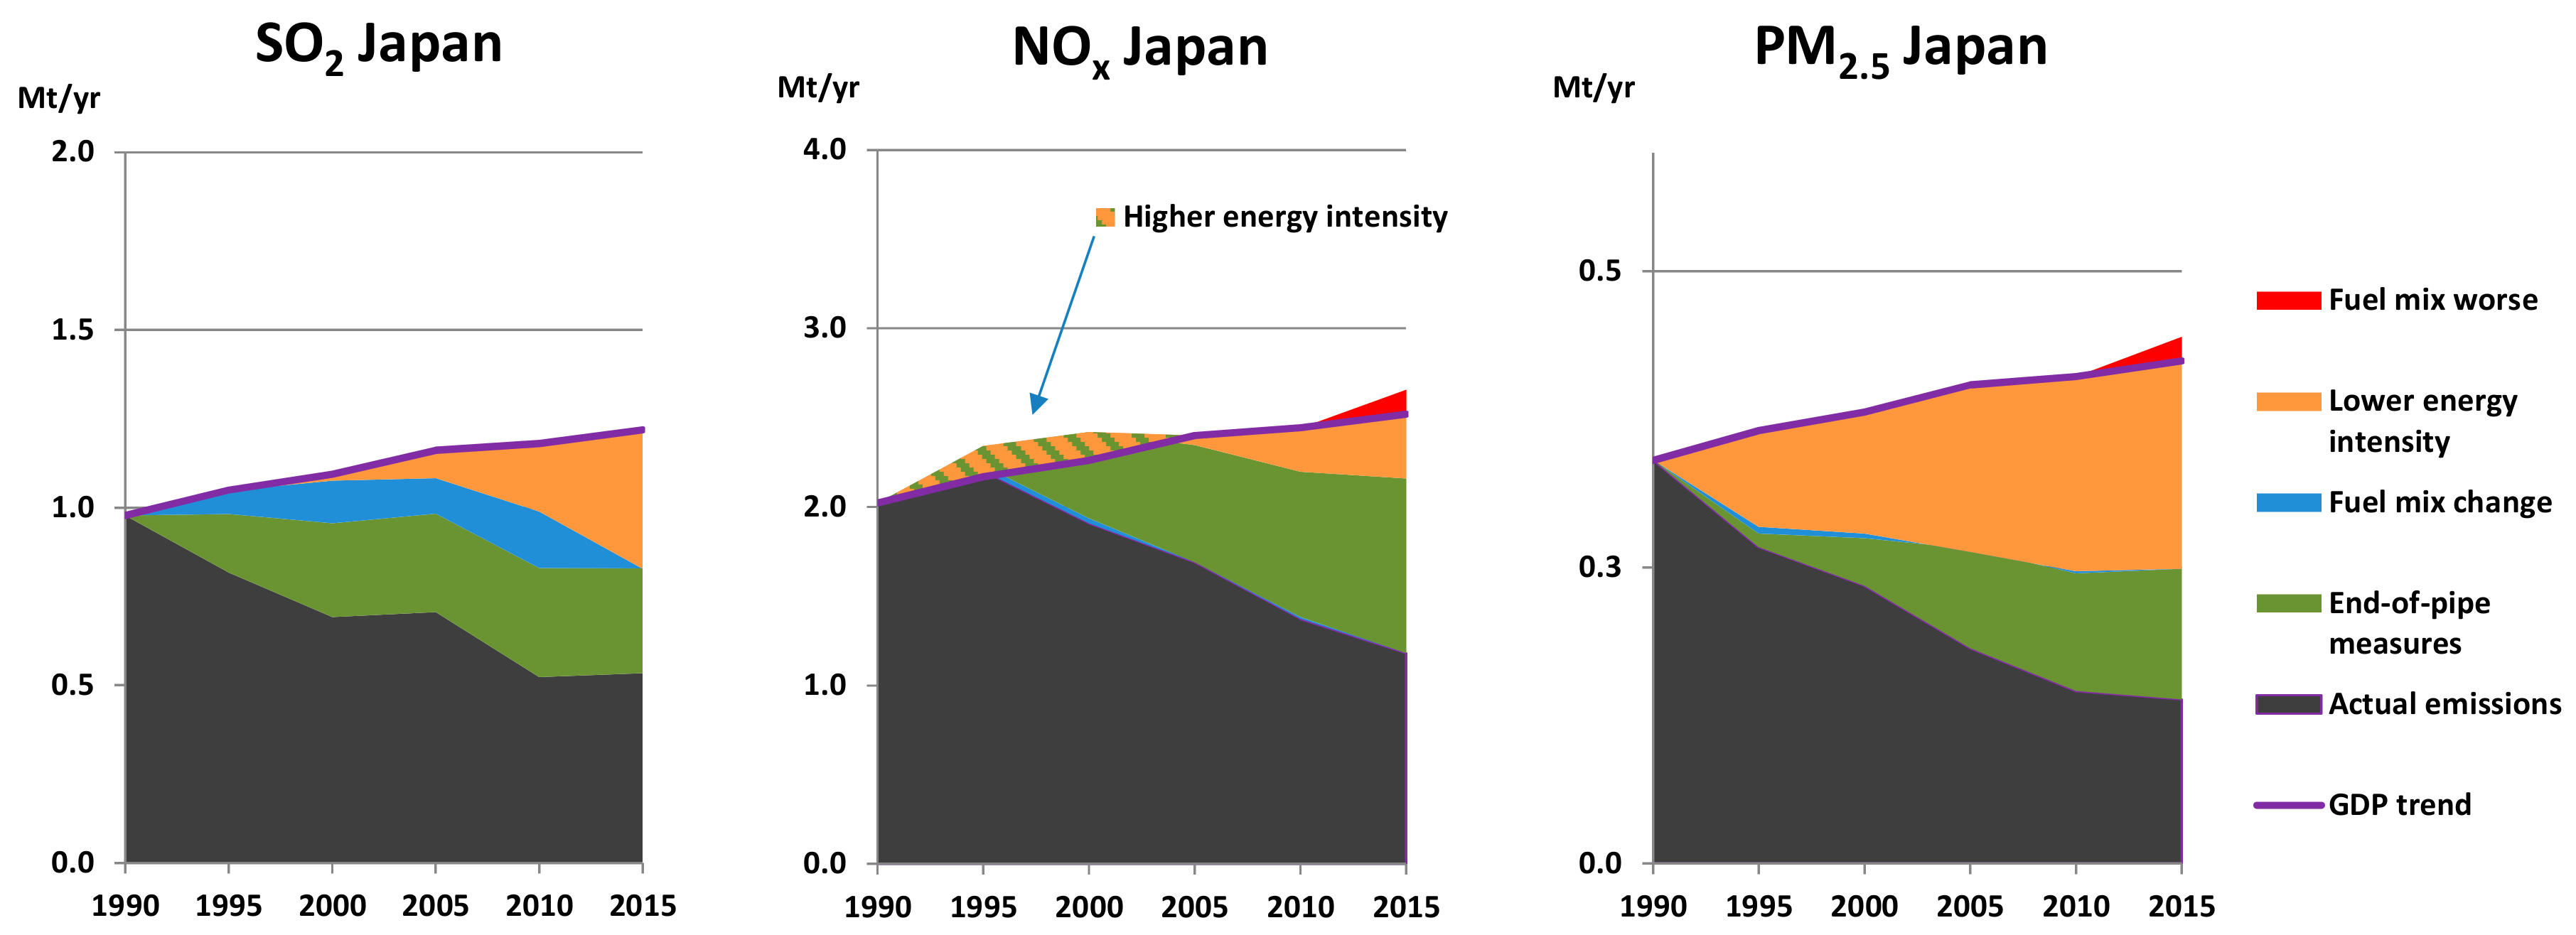
In Japan, emissions of all three air pollutants have declined since 1990. Among industrialized countries, the Japanese energy sector is one of the least emission intensive, and air-quality standards are among the most stringent. The role of key determinants, however, has changed during the computation period. For SO2, end-of-pipe measures were the dominant abatement component. The contribution of fuel-mix changes has been significant, and resulted from the increased non-fossil fraction in the power generation mix and in industry. Due to the temporary closure of nuclear power plants following the 2011 earthquake, the potential negative impacts from higher coal and oil consumption were ameliorated through additional energy-efficiency and intensity improvements.
Changes in the fuel mix played only a marginal role in the abatement of NOx and PM2.5 (Figure 6). On the contrary, the enhanced use of combustible fuels in recent years resulted in a growing trend for both pollutants, particularly in the power sector. Furthermore, NOx emissions increased in Japan during the 1990s from passenger and freight transport, which has been experiencing a growth in overall energy intensity since the base year (1990). Worsening energy intensity in transport before 2005 was analyzed in detail by Lipscy and Schipper [41], who attributed it to changes in Japanese consumer preferences, local reforms that resulted in a larger fuel use by kei-cars, as well as to tax policies favoring larger vehicles. As shown in the middle panel of Figure 6, the deteriorated energy intensity of the transport sector between 1990 up to 2005 has been counteracting the positive NOx-reduction impacts of the adoption of emission-control technologies.
3.2. Reassessment of Air Pollutant Scenarios for Asia
In this section, we compare the evolution of projections of SO2 and NOx emissions for China and India, as they were developed and published over time, with a focus on past expectations for key driving forces. In order to achieve methodological consistency, we have selected five scenarios implemented in the RAINS model, or in its later expanded variant, GAINS:
RAINS_1995—based on the initial modeling results for SO2 reported by Amann and Cofala [11] and Shah et al. [14].
WASP_2001—based on the central scenario implemented in the extended RAINS-Asia model and presented by Klimont et al. [42].
TELLUS_2009—an application of the GAINS-Asia tool based on national activity projections as reported by Klimont et al. [43].
ACP_2014—a business-as-usual type of scenario for China, developed by Wang et al. [44] using information on pollution controls from GAINS.
GAINS_2017—recent emission projections based on the latest projections by the International Energy Agency [6].
In the RAINS_1995 and WASP_2001 projections, we can see a nearly linear relationship between the projected energy consumption and emission trends in China. Only SO2 trends of WASP_2001 after 2000 decouple from the growth in energy use, due to assumptions made for control technologies. Furthermore, the activity projections (e.g., energy use) developed by national energy planners at the time did not anticipate the accelerated growth in GDP and in fossil-fuel consumption (Figure 7). While RAINS_1995 did not foresee any policy interventions in the baseline scenario storyline, WASP_2001 already considered the newly adopted legislation on SO2 and NOx, which made an impact on the flattened SO2 trajectory.
More recent scenarios—TELLUS_2009 and ACP_2014—captured the steeper growth in energy use and associated emission increases. Still, both scenarios—based on information available in the 2000s—were too pessimistic when projecting the actual impacts of the combined effects of structural changes and control legislation on SO2 and NOx emissions. In contrast, the downward trend for both pollutants in China after 2005/2010 is projected to continue in the newest GAINS_2017 scenario.
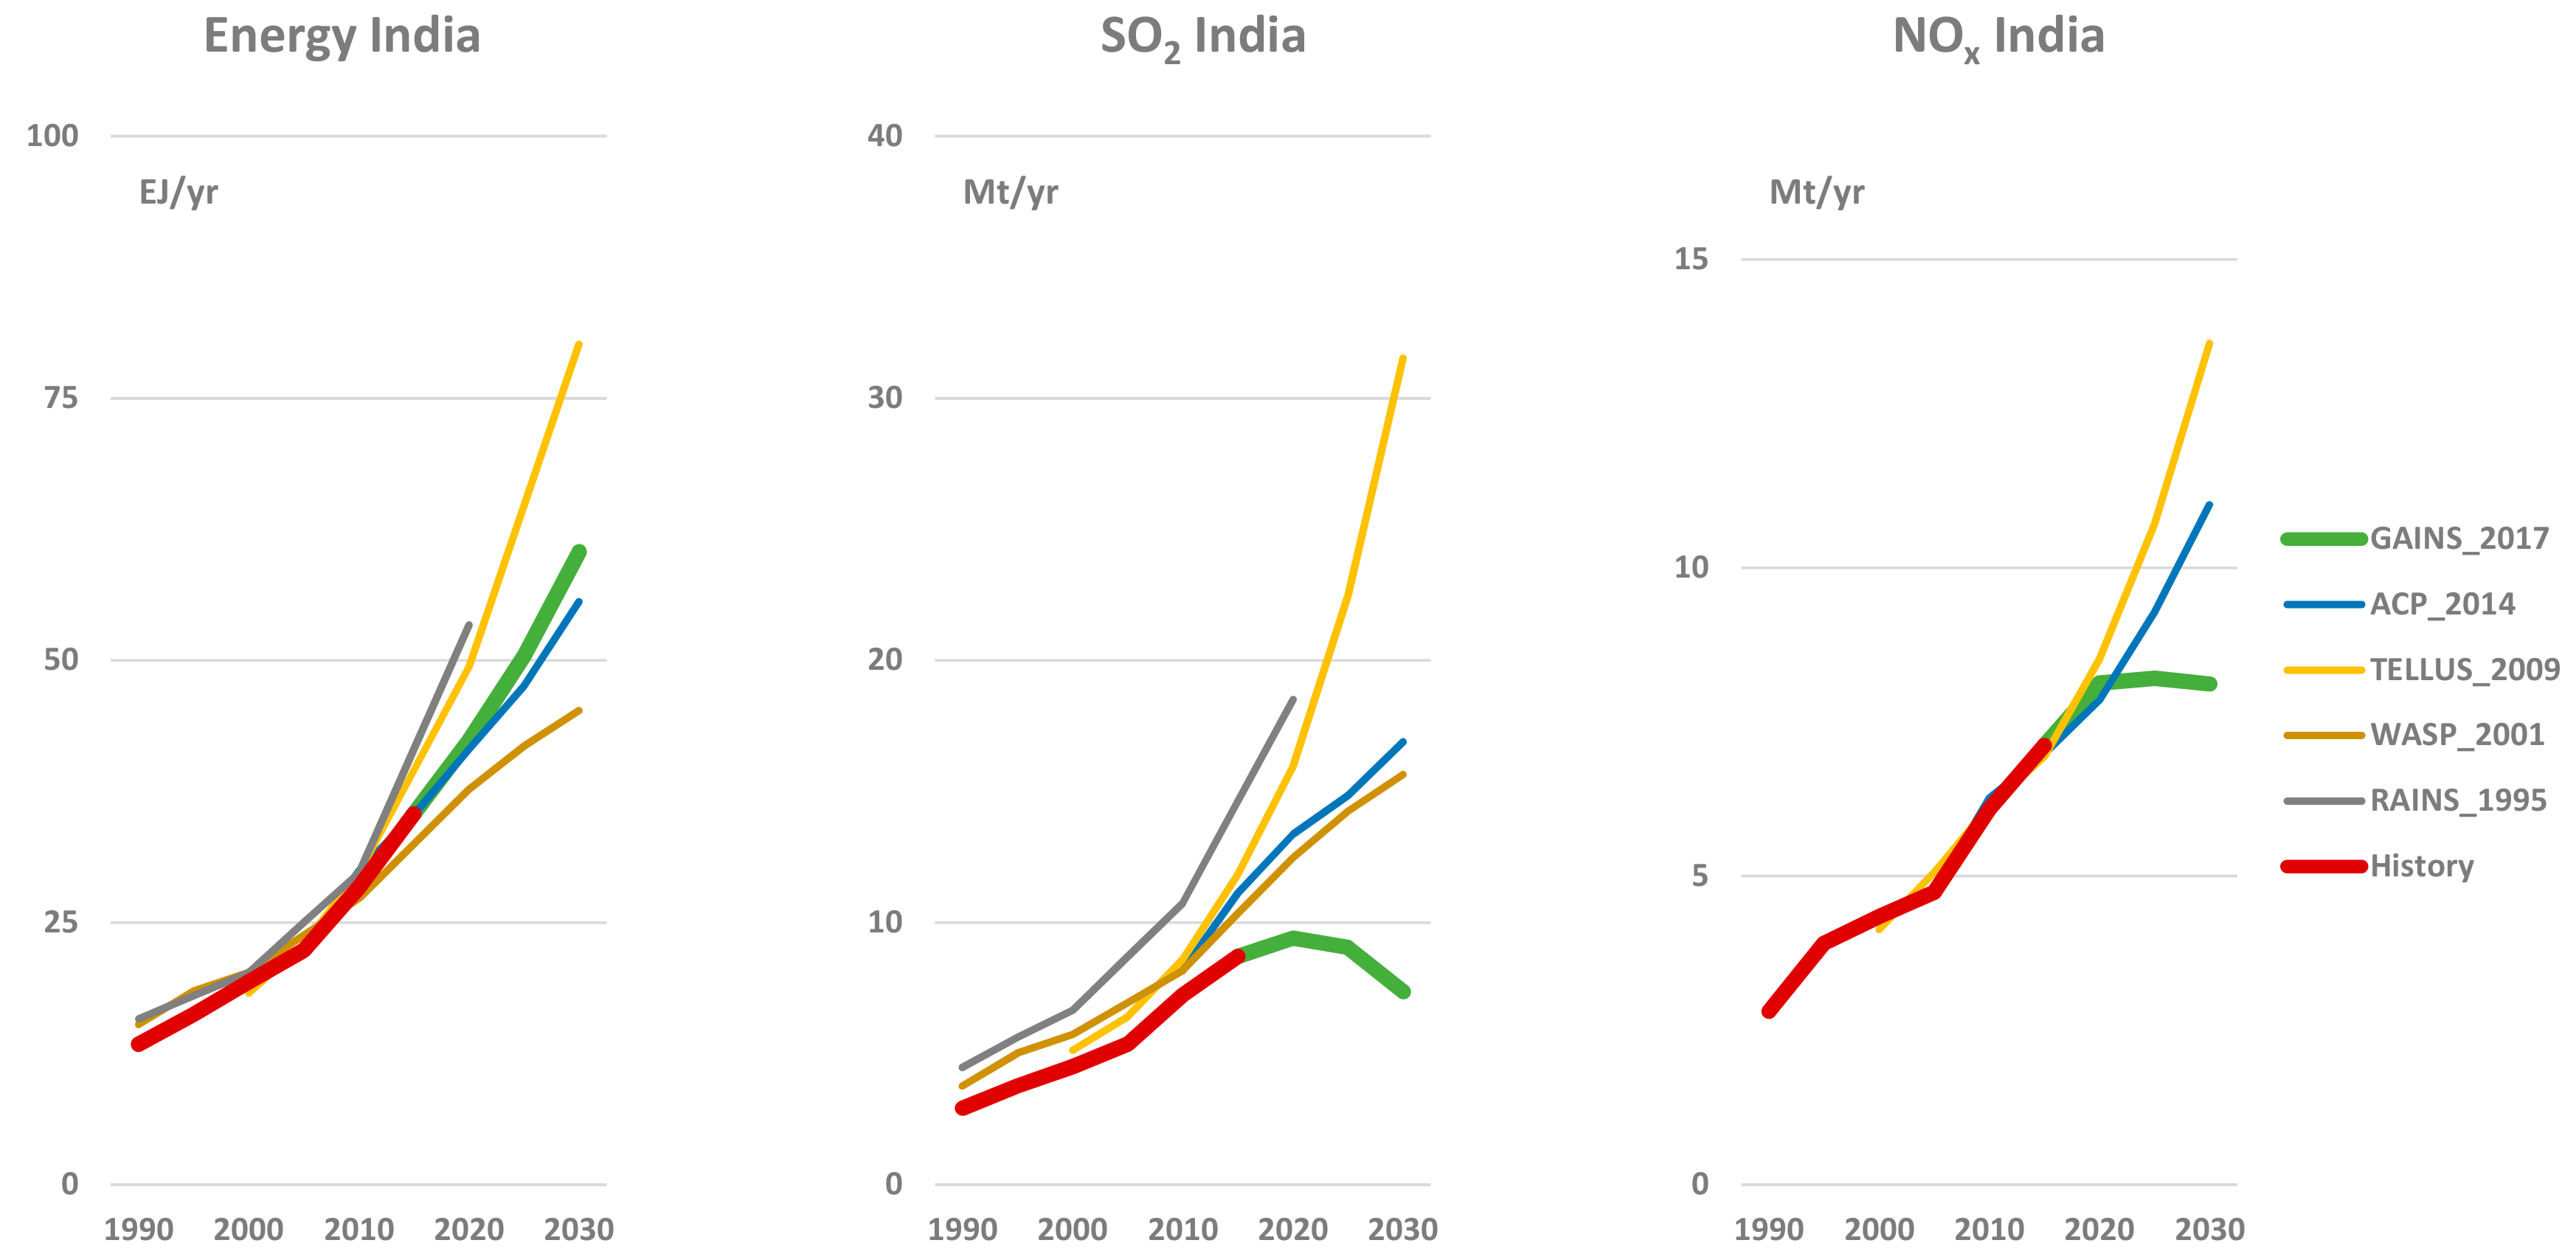
In India, due to the absence or lower effectiveness of end-of-pipe control measures, SO2 and NOx emissions closely followed the projections of GDP-driven energy consumption. For energy use, larger variations across scenarios, and relative to the historic data, occur only after the year 2010 (Figure 8). The same can be said for emission projections in the set of past estimates, where the most recent scenario (GAINS_2017) suggests that the currently proposed and adopted policies might deliver substantial reduction impacts that would ultimately lead to a slowdown, or even to a decline of air pollution levels in India around 2020.
4. Conclusions
At present, environmental pollution causes about nine million deaths worldwide, with inadequate air quality linked to two-thirds of this number. The majority of these deaths occur in low- and middle-income countries such as India, where the current share of pollution-related deaths reaches nearly 25% of total mortality [46]. With a focus on three Asian countries, this paper presents an analysis of the key factors responsible for changes in the most important air pollutants—SO2, NOx and PM2.5—over the past 25 years.
From 1990 onwards, emissions in China and India showed a steady increase. Particularly large increases occurred for SO2 and NOx until 2005–2010, which closely followed the growth in economic activities (measured in GDP), while PM2.5 emissions, for which nonindustrial sources are more important (e.g., waste sector, agriculture, residential combustion of biomass), developed along a less-steep growth path. However, after 2005, policy interventions, especially the sulfur controls for power plants and the introduction of emission standards for vehicles, led to a distinct decoupling of SO2 and NOx emissions from economic growth in China. Policy interventions in India helped to slow down the growth rates of emissions, although the linkage to economic growth persists. Air protection has been a priority in Japan since the 1970s, and the stringent control measures have been essential in maintaining the declining emission trajectory.
Our decomposition analysis shows that the three Asian countries have experienced significant reductions in the energy intensity of their economies through dedicated energy-efficiency policies and a restructuring of production towards less energy-intensive products, meaning that energy-consumption trends decoupled from economic growth. Without the positive effect of improved energy intensity and efficiency gains, air pollutant emissions would have been higher by 30% to a factor of 10, depending on the country and pollutant. At the same time, the emerging Asian economies showed a strong reliance on fossil fuels like coal and oil, and therefore the mitigation effect of a cleaner fuel mix has been much less pronounced than other factors. Using the example of Japan, we demonstrated that in the past some driving forces counteracted the aforementioned positive abatement effects: (a) Due to a combination of fiscal and behavioral factors, the energy intensity of the Japanese transport sector actually worsened until the middle 2000s; and (b) the Fukushima accident induced an abrupt fuel-mix change toward fossil fuels. The reassessment of the past emission scenarios for China and India confirms that emission projections were determined by the assumptions on future energy policies and the effective implementation of emission-control legislation. In the fast-growing Asian economies, air pollution has been strongly influenced by the stringency of policy interventions and enforcement. These human/societal factors are often hard to predict. However, our analysis strongly indicates that the likelihood for strengthened policies increases with improved public understanding of the benefits of clean air. At the same time, it has to be noted that demographic trends, urbanization, rebound effects and rising energy demand might counteract the benefits of intensified policy efforts.
As pointed out by empirical studies of past developments (e.g., [47]), projections of future energy (and resource) consumption should not assume autonomous decoupling from economic growth. The same is valid for projecting future emission trends—an effective and timely enforcement of dedicated legislation will form a firm basis for controlling air pollution in the future. Other policy efforts can add to the positive effects of environmental legislation, such as targets for energy efficiency and intensity improvements, and a climate-mitigation-driven transformation of Asian energy systems where fossil fuels have a less-prominent role. Systems science and suitable integrated assessment tools can help to strengthen the role of air-quality management by providing relevant information to enhance public pressure and by indicating cost-effective policy intervention options.
Author Contributions
Both authors have read and approved the final manuscript. P.R. and M.A. designed and performed the experiments, analyzed the data, and wrote the paper.
Acknowledgments
The authors acknowledge funding provided by the UNEP project, ‘Regional assessment of air pollution in Asia’, under contract Nr. S1-32SLP-000010, and the European Union Horizon 2020 research and innovation programme under grant agreement No 642147 (‘CD-LINKS’ project).
Conflicts of Interest
The authors declare no conflict of interest.
References
- WHO. Ambient Air Pollution: A Global Assessment of Exposure and Burden of Disease; World Health Organization (WHO): Geneva, Switzerland, 2016. [Google Scholar]
- IEA. World Energy Outlook Special Report: Energy and Air Pollution; International Energy Agency (IEA): Paris, France, 2016. [Google Scholar]
- Emberson, L.D.; Ashmore, M.R.; Murray, F.; Kuylenstierna, J.C.I.; Percy, K.E.; Izuta, T.; Zheng, Y.; Shimizu, H.; Sheu, B.H.; Liu, C.P.; et al. Impacts of Air Pollutants on Vegetation in Developing Countries. Water Air Soil Pollut. 2001, 130, 107–118. [Google Scholar] [CrossRef]
- Chan, C.K.; Yao, X. Air pollution in mega cities in China. Atmos. Environ. 2008, 42, 1–42. [Google Scholar] [CrossRef]
- Cohen, A.J.; Brauer, M.; Burnett, R.; Anderson, H.R.; Frostad, J.; Estep, K.; Balakrishnan, K.; Brunekreef, B.; Dandona, L.; Dandona, R.; et al. Estimates and 25-year trends of the global burden of disease attributable to ambient air pollution: An analysis of data from the Global Burden of Diseases Study 2015. Lancet 2017, 389, 1907–1918. [Google Scholar] [CrossRef]
- IEA. World Energy Outlook 2017; International Energy Agency: Paris, France, 2017. [Google Scholar]
- Vrontisi, Z.; Abrell, J.; Neuwahl, F.; Saveyn, B.; Wagner, F. Economic impacts of EU clean air policies assessed in a CGE framework. Environ. Sci. Policy 2016, 55, 54–64. [Google Scholar] [CrossRef] [Green Version]
- Matus, K.; Yang, T.; Paltsev, S.; Reilly, J.; Nam, K.-M. Toward integrated assessment of environmental change: Air pollution health effects in the USA. Clim. Chang. 2008, 88, 59–92. [Google Scholar] [CrossRef]
- Charfeddine, L.; Yousef Al-Malk, A.; Al Korbi, K. Is it possible to improve environmental quality without reducing economic growth: Evidence from the Qatar economy. Renew. Sustain. Energy Rev. 2018, 82, 25–39. [Google Scholar] [CrossRef]
- Wakamatsu, S.; Morikawa, T.; Ito, A. Air pollution trends in Japan between 1970 and 2012 and impact of urban air pollution countermeasures. Asian J. Atmos. Environ. 2013, 7, 177–190. [Google Scholar] [CrossRef]
- Amann, M.; Cofala, J. Scenarios of future acidification in Asia: Exploratory calculations. In RAINS-Asia Technical Report: The Development of An Integrated Model for Sulfur Deposition; World Bank, Asia Technical Group: Washington, DC, USA, 1995. [Google Scholar]
- Downing, R.J.; Ramankutty, R.; Shah, J.J. RAINS-ASIA: An Assessment Model for Acid Deposition in Asia; Directions in Development, No. 17108; The World Bank: Washington, DC, USA, 1997. [Google Scholar]
- Foell, W.; Green, C.; Amann, M.; Bhattacharya, S.; Carmichael, G.; Chadwick, M.; Cinderby, S.; Haugland, T.; Hettelingh, J.-P.; Hordijk, L.; et al. Energy use, emissions, and air pollution reduction strategies in Asia. Water Air Soil Pollut. 1995, 85, 2277–2282. [Google Scholar] [CrossRef]
- Shah, J.; Nagpal, T.; Johnson, T.; Amann, M.; Carmichael, G.; Foell, W.; Green, C.; Hettelingh, J.-P.; Hordijk, L.; Li, J.; et al. Integrated analysis for acid rain in Asia: Policy implications and results of RAINS-ASIA model. Annu. Rev. Energy Environ. 2000, 25, 339–375. [Google Scholar] [CrossRef]
- IEA. IEA World Energy Statistics and Balances (Database); International Energy Agency (IEA): Paris, France, 2017; Available online: http://dx.doi.org/10.1787/enestats-data-en (accessed on 1 December 2017).
- GAINS. Greenhouse Gas—Air Pollution Interactions and Synergies—Model Database; International Institute for Applied Systems Analysis (IIASA): Laxenburg, Austria, 2017; Available online: http://gains.iiasa.ac.at (accessed on 1 December 2017).
- Stern, D.I. The environmental Kuznets curve after 25 years. J. Bioecon. 2017, 19, 7–28. [Google Scholar] [CrossRef]
- Amann, M.; Klimont, Z.; Wagner, F. Regional and Global Emissions of Air Pollutants: Recent Trends and Future Scenarios. Annu. Rev. Environ. Resour. 2013, 38, 31–55. [Google Scholar] [CrossRef]
- De Bruyn, S.M.; van den Bergh, J.C.J.M.; Opschoor, J.B. Economic growth and emissions: Reconsidering the empirical basis of environmental Kuznets curves. Ecol. Econ. 1998, 25, 161–175. [Google Scholar] [CrossRef]
- Henneman, L.R.; Chang, H.H.; Liao, K.-J.; Lavoué, D.; Mulholland, J.A.; Russell, A.G. Accountability assessment of regulatory impacts on ozone and PM2.5 concentrations using statistical and deterministic pollutant sensitivities. Air Qual. Atmos. Health 2017, 10, 695–711. [Google Scholar] [CrossRef]
- Kawamoto, T.; Pham, T.-T.-P.; Matsuda, T.; Oyama, T.; Tanaka, M.; Yu, H.-S.; Uchiyama, I. Historical review on development of environmental quality standards and guideline values for air pollutants in Japan. Int. J. Hyg. Environ. Health 2011, 214, 296–304. [Google Scholar] [CrossRef] [PubMed]
- Zhao, B.; Su, Y.; He, S.; Zhong, M.; Cui, G. Evolution and comparative assessment of ambient air quality standards in China. J. Integr. Environ. Sci. 2016, 13, 85–102. [Google Scholar] [CrossRef]
- Jin, Y.; Andersson, H.; Zhang, S. Air Pollution Control Policies in China: A Retrospective and Prospects. Int. J. Environ. Res. Public Health 2016, 13, 1219. [Google Scholar] [CrossRef] [PubMed]
- Hashimoto, M. Chapter 1 History of Air Pollution Control in Japan. In Studies in Environmental Science, How to Conquer Air Pollution a Japanese Experience; Nishimura, H., Ed.; Elsevier: New York, NY, USA, 1989; pp. 1–93. [Google Scholar] [CrossRef]
- IEA CCC. Emission Standards by Country–Online Database; IEA Clean Coal Centre: London, UK, 2017; Available online: http://www.iea-coal.org.uk/site/2010/database-section/emission-standards (accessed on 1 December 2017).
- McConville, A. Emission Standards Handbook; IEA Clean Research–The Clean Coal Centre: London, UK, 1997. [Google Scholar]
- DieselNet. Emission Standards—Summary of World’s Engine and Vehicle Emission Standards; DieselNet—Online Information Service; Ecopoint Inc.: Mississauga, ON, Canada, 2017; Available online: https://www.dieselnet.com/standards/ (accessed on 1 December 2017).
- MoE Japan. Japan’s Regulations and Environmental Law; Ministry of Environment, Government of Japan: Tokio, Japan, 2017. Available online: http://www.env.go.jp/en/coop/pollution.html (accessed on 1 December 2017).
- Hoekstra, R.; van den Bergh, J.C.J.M. Comparing structural and index decomposition analysis. Energy Econ. 2003, 25, 39–64. [Google Scholar] [CrossRef]
- Rafaj, P.; Amann, M.; Siri, J.; Wuester, H. Changes in European greenhouse gas and air pollutant emissions 1960–2010: Decomposition of determining factors. Clim. Chang. 2014, 124, 477–504. [Google Scholar] [CrossRef]
- Åström, S.; Yaramenka, K.; Mawdsley, I.; Danielsson, H.; Grennfelt, P.; Gerner, A.; Ekvall, T.; Ahlgren, E.O. The impact of Swedish SO2 policy instruments on SO2 emissions 1990–2012. Environ. Sci. Policy 2017, 77, 32–39. [Google Scholar] [CrossRef]
- Rafaj, P.; Amann, M.; Siri, J.G. Factorization of air pollutant emissions: Projections versus observed trends in Europe. Sci. Total Environ. 2014, 494–495, 272–282. [Google Scholar] [CrossRef] [PubMed]
- Mao, X.; Zhou, J.; Corsetti, G. How Well Have China’s Recent Five-Year Plans Been Implemented for Energy Conservation and Air Pollution Control? Environ. Sci. Technol. 2014, 48, 10036–10044. [Google Scholar] [CrossRef] [PubMed]
- Tong, Z.; Chen, Y.; Malkawi, A.; Liu, Z.; Freeman, R.B. Energy saving potential of natural ventilation in China: The impact of ambient air pollution. Appl. Energy 2016, 179, 660–668. [Google Scholar] [CrossRef]
- Feng, L.; Liao, W. Legislation, plans, and policies for prevention and control of air pollution in China: Achievements, challenges, and improvements. J. Clean. Prod. 2016, 112, 1549–1558. [Google Scholar] [CrossRef]
- Fu, H.; Chen, J. Formation, features and controlling strategies of severe haze-fog pollutions in China. Sci. Total Environ. 2017, 578, 121–138. [Google Scholar] [CrossRef] [PubMed]
- Gao, J.; Woodward, A.; Vardoulakis, S.; Kovats, S.; Wilkinson, P.; Li, L.; Xu, L.; Li, J.; Yang, J.; Li, J.; et al. Haze, public health and mitigation measures in China: A review of the current evidence for further policy response. Sci. Total Environ. 2017, 578, 148–157. [Google Scholar] [CrossRef] [PubMed]
- Xu, S.; Zhang, W.; Li, Q.; Zhao, B.; Wang, S.; Long, R. Decomposition Analysis of the Factors that Influence Energy Related Air Pollutant Emission Changes in China Using the SDA Method. Sustainability 2017, 9, 1742. [Google Scholar] [CrossRef]
- Fujii, H.; Managi, S.; Kaneko, S. Decomposition analysis of air pollution abatement in China: Empirical study for ten industrial sectors from 1998 to 2009. J. Clean. Prod. 2013, 59, 22–31. [Google Scholar] [CrossRef]
- Liu, Q.; Wang, Q. Pathways to SO2 emissions reduction in China for 1995–2010: Based on decomposition analysis. Environ. Sci. Policy 2013, 33, 405–415. [Google Scholar] [CrossRef]
- Lipscy, P.Y.; Schipper, L. Energy efficiency in the Japanese transport sector. Energy Policy 2013, 56, 248–258. [Google Scholar] [CrossRef]
- Klimont, Z.; Cofala, J.; Schöpp, W.; Amann, M.; Streets, D.G.; Ichikawa, Y.; Fujita, S. Projections of SO2, NOx, NH3 and VOC emissions in East Asia up to 2030. Water Air Soil Pollut. 2001, 130, 193–198. [Google Scholar] [CrossRef]
- Klimont, Z.; Cofala, J.; Xing, J.; Wei, W.; Zhang, C.; Wang, S.; Kejun, J.; Bhandari, P.; Mathur, R.; Purohit, P.; et al. Projections of SO2, NOx, and carbonaceous aerosols emissions in Asia. Tellus B 2009, 61, 602–617. [Google Scholar] [CrossRef] [Green Version]
- Wang, S.X.; Zhao, B.; Cai, S.Y.; Klimont, Z.; Nielsen, C.P.; Morikawa, T.; Woo, J.H.; Kim, Y.; Fu, X.; Xu, J.Y.; et al. Emission trends and mitigation options for air pollutants in East Asia. Atmos. Chem. Phys. 2014, 14, 6571–6603. [Google Scholar] [CrossRef] [Green Version]
- Stohl, A.; Aamaas, B.; Amann, M.; Baker, L.H.; Bellouin, N.; Berntsen, T.K.; Boucher, O.; Cherian, R.; Collins, W.; Daskalakis, N.; et al. Evaluating the climate and air quality impacts of short-lived pollutants. Atmos. Chem. Phys. 2015, 15, 10529–10566. [Google Scholar] [CrossRef] [Green Version]
- Landrigan, P.J.; Fuller, R.; Acosta, N.J.R.; Adeyi, O.; Arnold, R.; Basu, N.; Baldé, A.B.; Bertollini, R.; Bose-O’Reilly, S.; Boufford, J.I.; et al. The Lancet Commission on pollution and health. Lancet 2017, 391, 462–512. [Google Scholar] [CrossRef]
- Csereklyei, Z.; Stern, D.I. Global energy use: Decoupling or convergence? Energy Econ. 2015, 51, 633–641. [Google Scholar] [CrossRef]
Figure 1.
Evolution of economic growth and energy intensity in China, India and Japan from 1990 to 2015. (Left panel) Change in GDP (adjusted by purchasing power parity—GDP_PPP) relative to the year 1990. (Right panel) Energy use (in megajoules—MJ) per unit of GDP_PPP per year. Source: [15].
Figure 1.
Evolution of economic growth and energy intensity in China, India and Japan from 1990 to 2015. (Left panel) Change in GDP (adjusted by purchasing power parity—GDP_PPP) relative to the year 1990. (Right panel) Energy use (in megajoules—MJ) per unit of GDP_PPP per year. Source: [15].

Figure 2.
Change in fuel mix in China, India and Japan from 1990 to 2015. Source: [15].
Figure 2.
Change in fuel mix in China, India and Japan from 1990 to 2015. Source: [15].
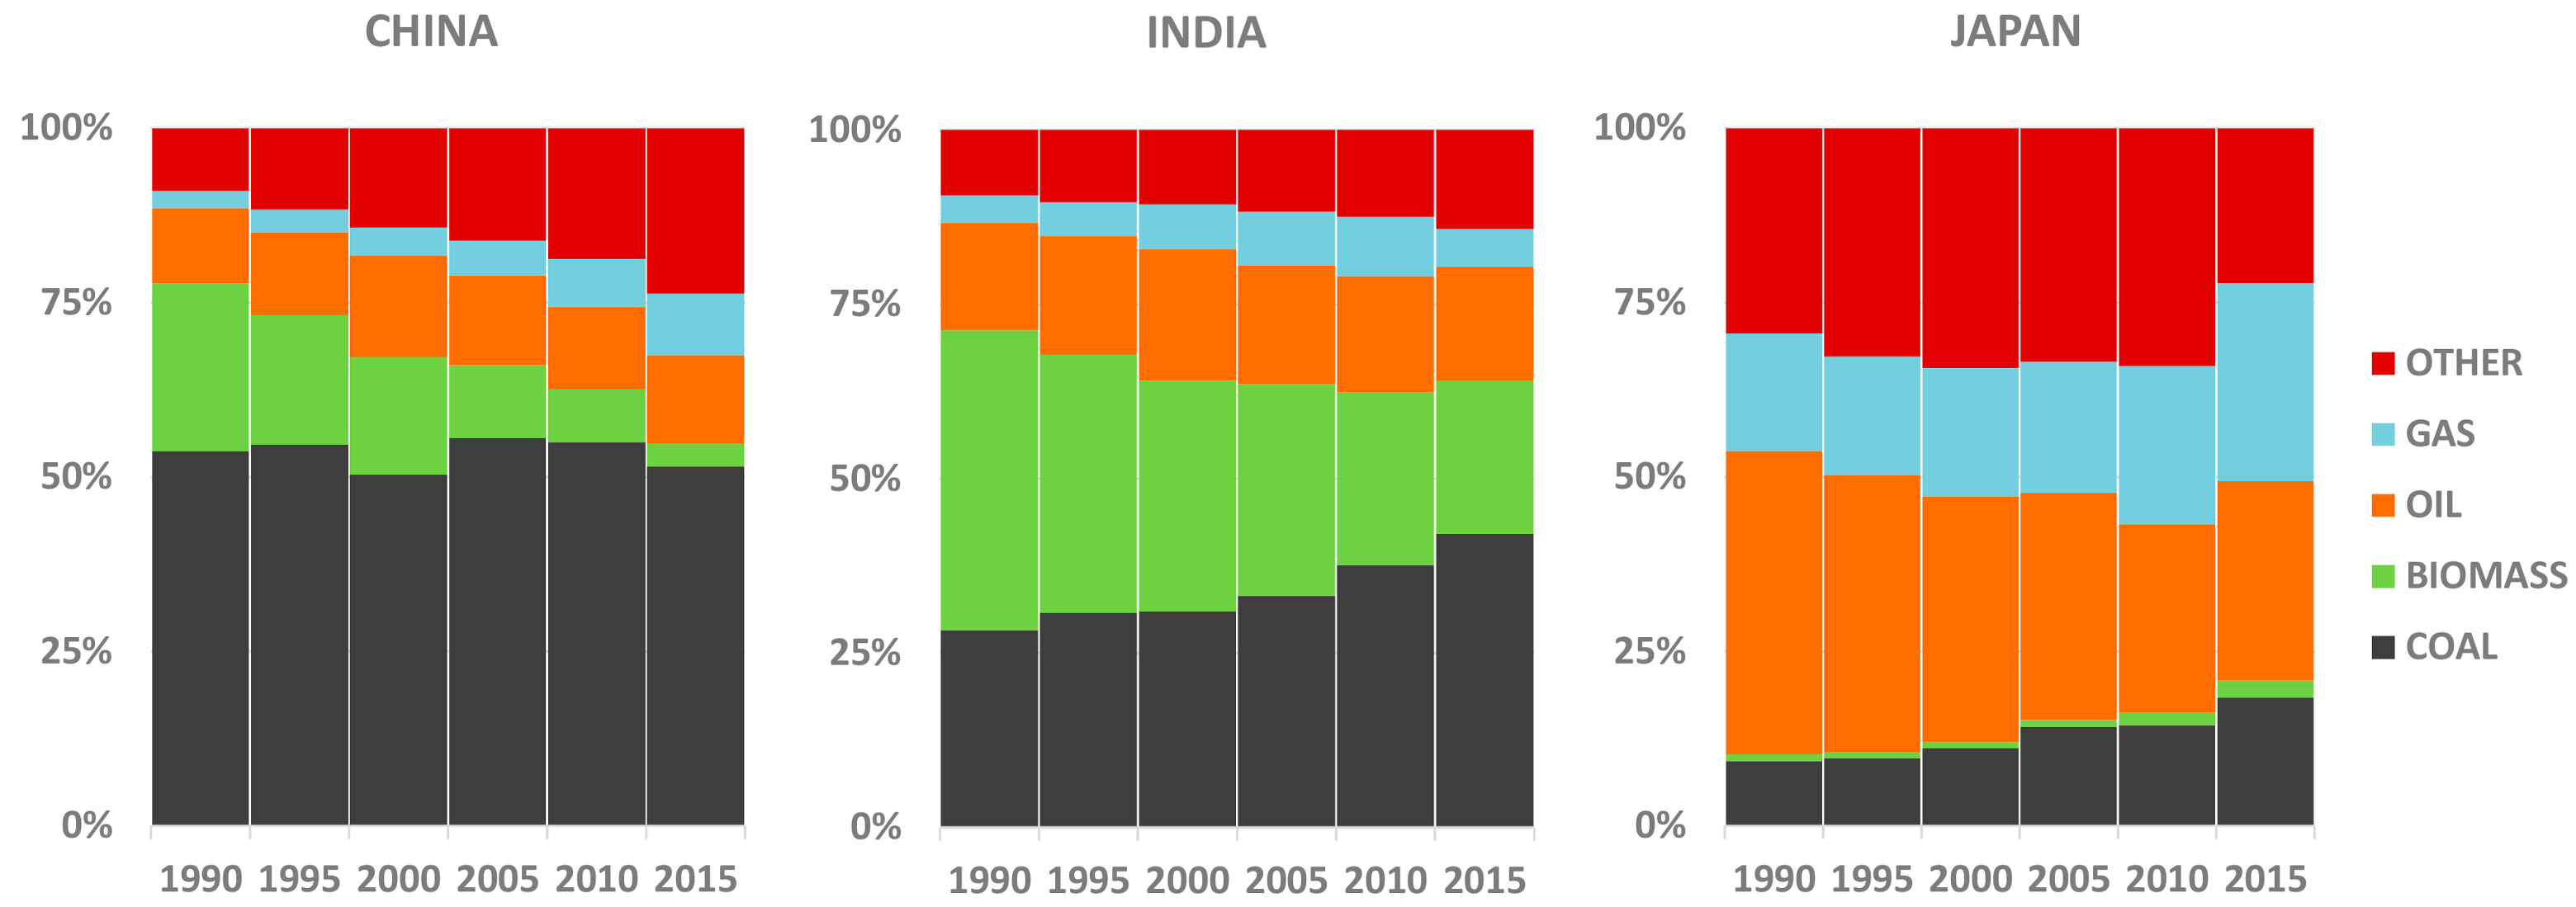
Figure 3.
Changes of emissions per capita through per-capita income from 1990–2015 in China, India and Japan. Adopted from IEA [15] and GAINS [16].

Figure 4.
Determinants of changes in SO2, NOx and PM2.5 emissions in China, 1990–2015.
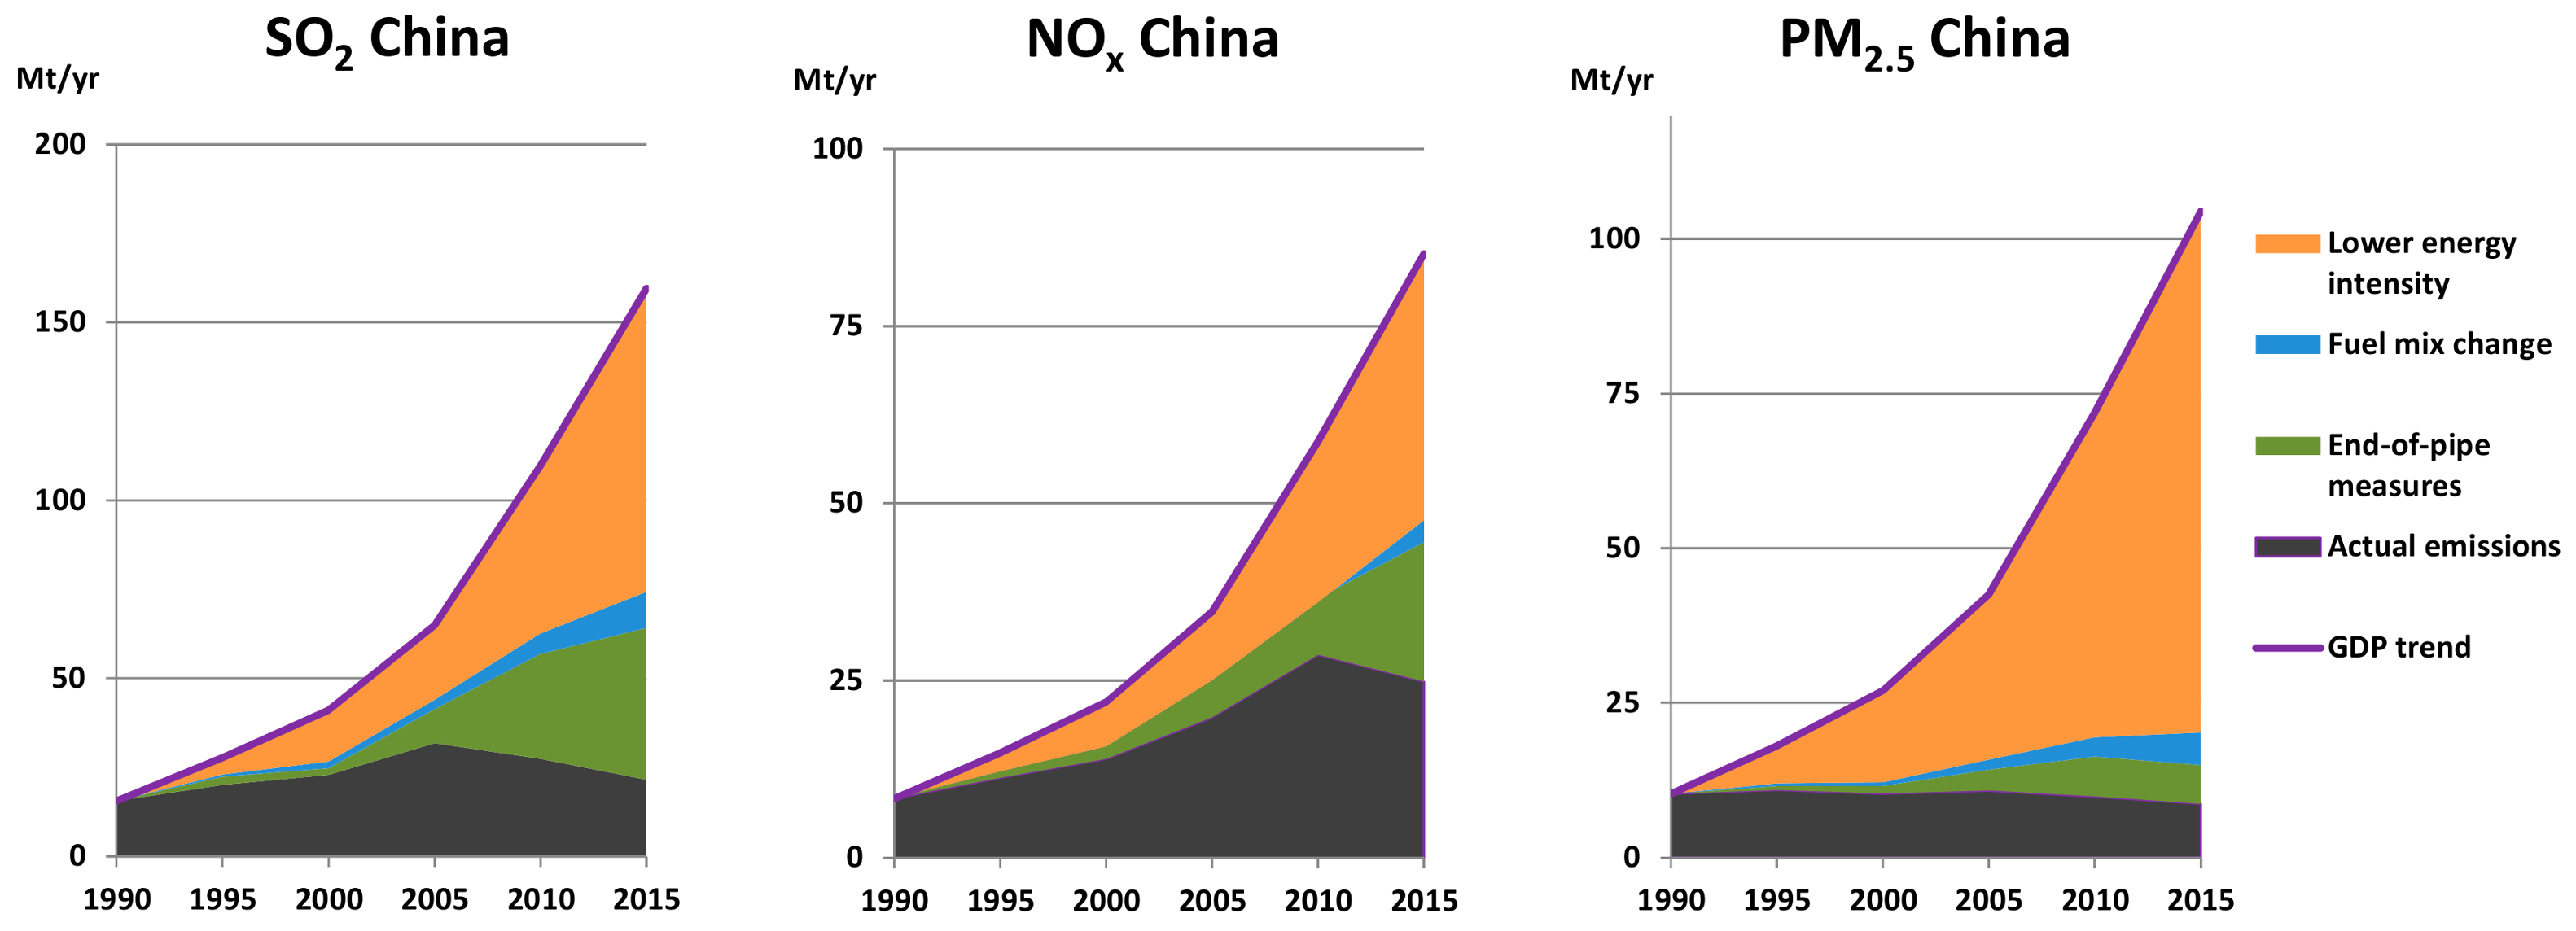
Figure 5.
Determinants of changes in SO2, NOx and PM2.5 emissions in India, 1990–2015.

Figure 6.
Determinants of changes in SO2, NOx and PM2.5 emissions in Japan, 1990–2015.

Figure 7.
Comparison of past projections and observed trends for energy use, and for SO2 and NOx emissions in China.
Figure 7.
Comparison of past projections and observed trends for energy use, and for SO2 and NOx emissions in China.
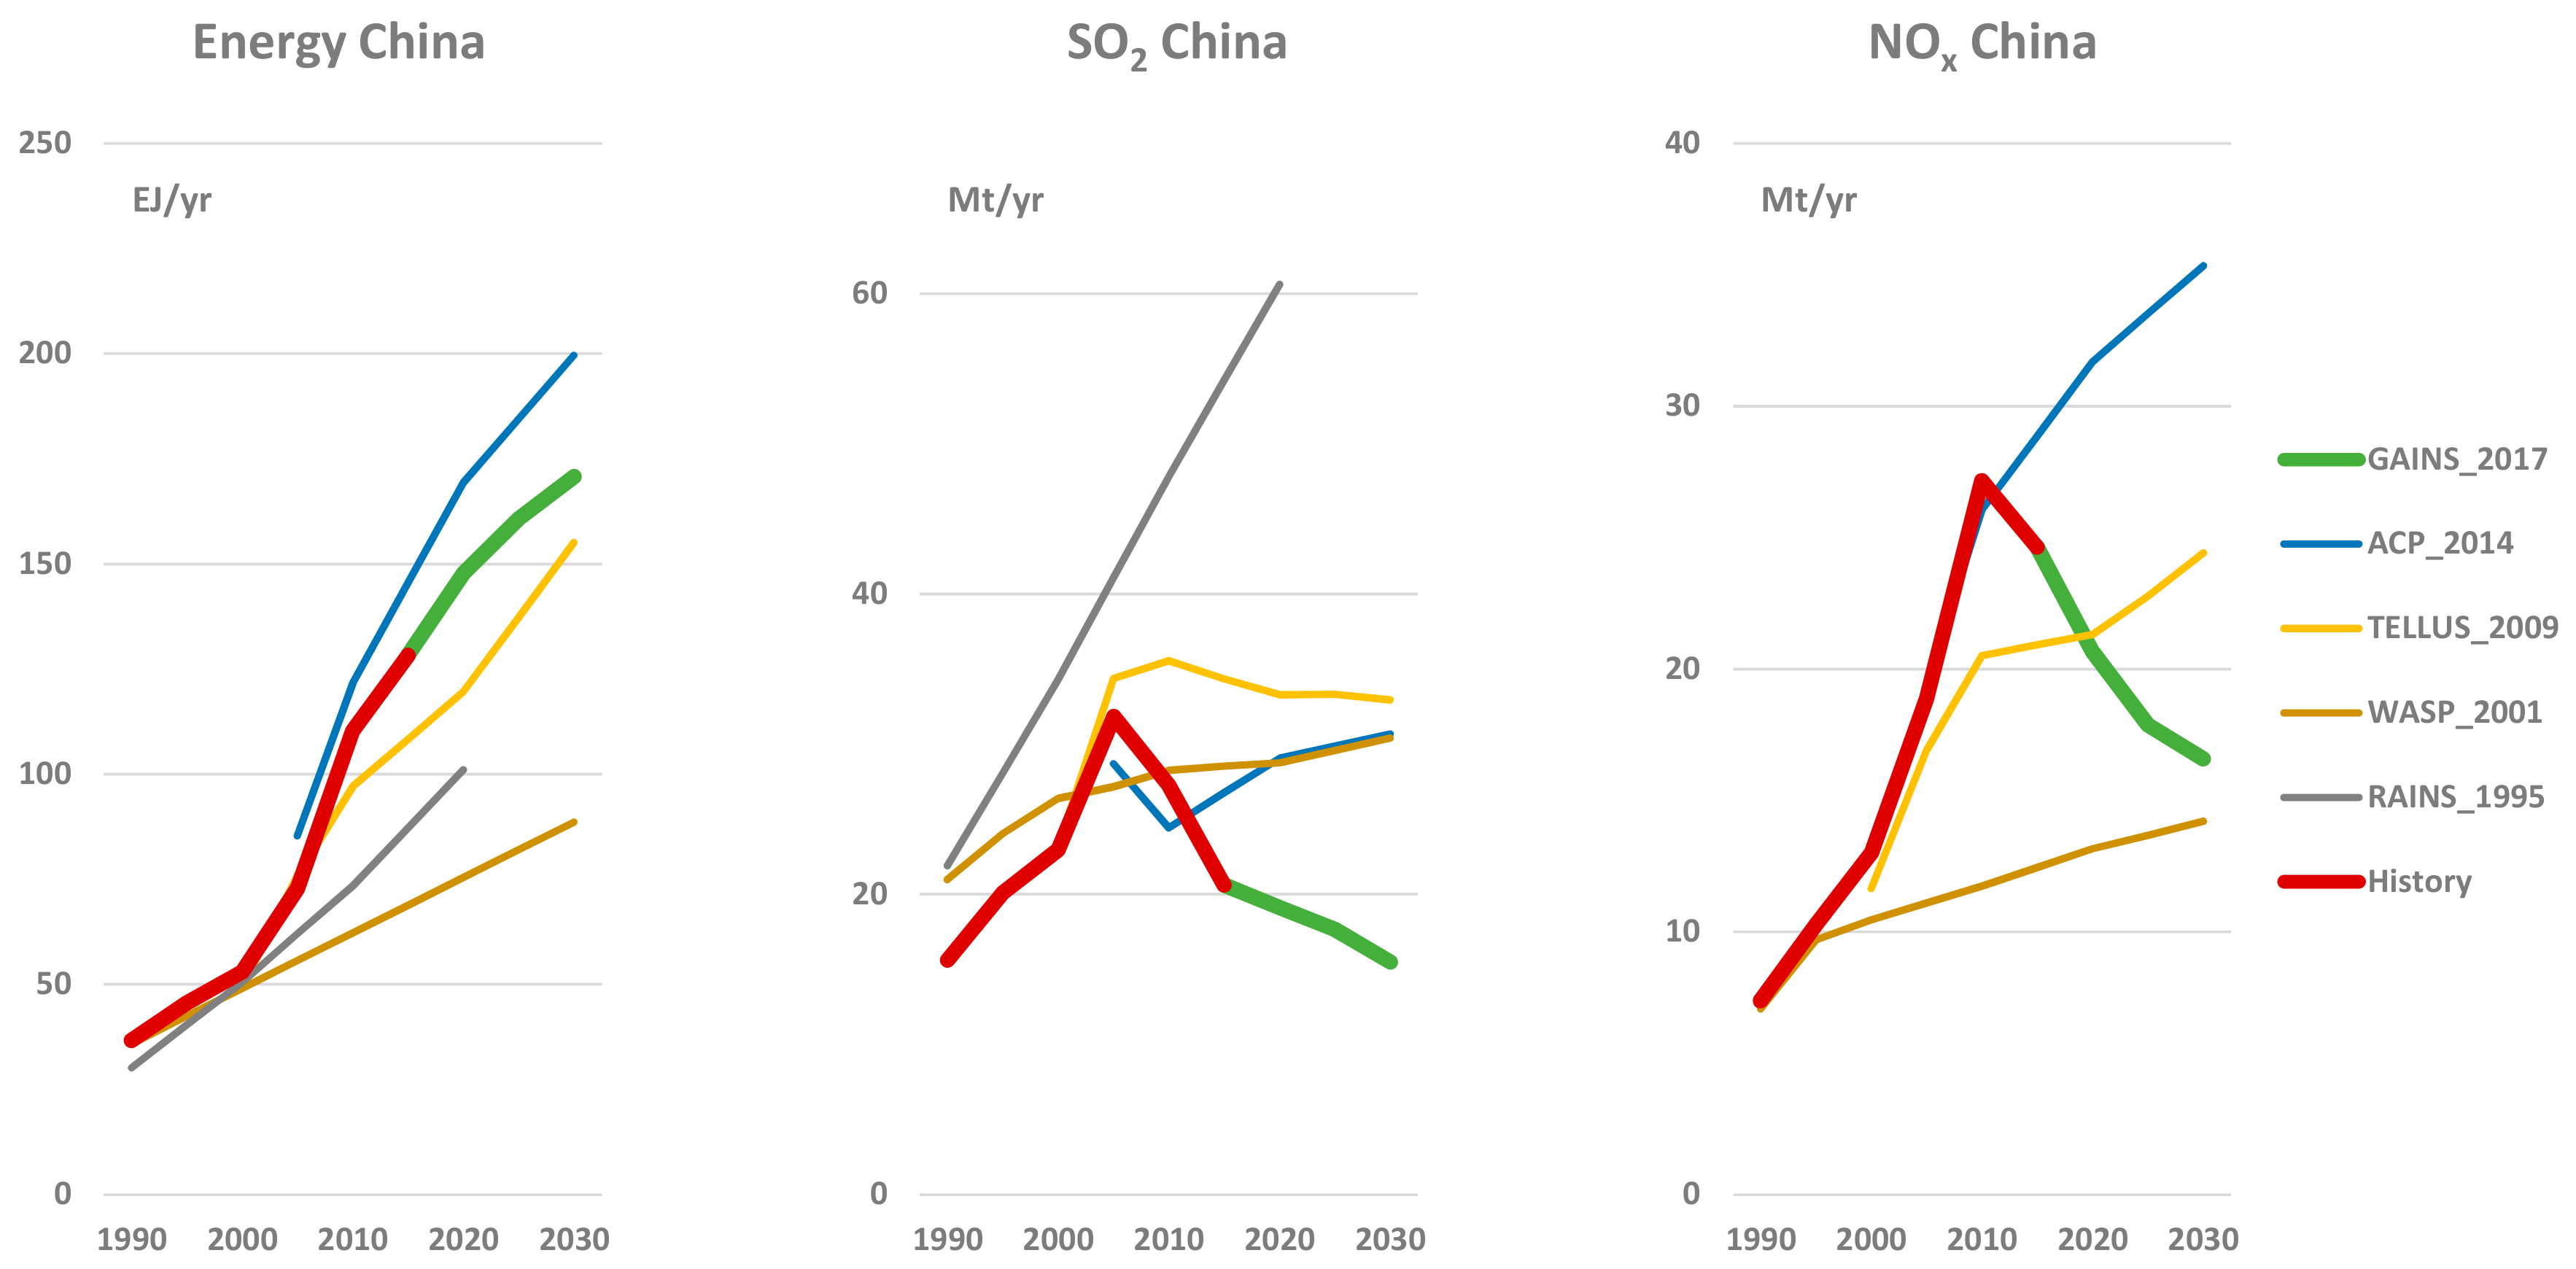
Figure 8.
Comparison of past projections and observed trends for energy use, and for SO2 and NOx emissions in India. Note: India was not covered by the ACP_2014 scenario and is replaced by projections developed in GAINS at the time, within the ECLIPSE project [45].
Figure 8.
Comparison of past projections and observed trends for energy use, and for SO2 and NOx emissions in India. Note: India was not covered by the ACP_2014 scenario and is replaced by projections developed in GAINS at the time, within the ECLIPSE project [45].


Table 1.
Evolution of emission standards in coal-fired power plants (mg/m3).
| Country | Policy | Revision | PM | SO2 | NOx |
|---|---|---|---|---|---|
| China | Emission standards for coal-fired power plants | 1992 | 200–3300 | ||
| 1996 | 200–3300 | 1200–2100 | 650–1000 | ||
| 2004 | 50–600 | 400–2100 | 450–1100 | ||
| 2012 | 20–30 | 50–400 | 100–200 | ||
| India | Environmental protection rules | 1986 | 150–350 | ||
| 2003 | 50–100 | ||||
| 2015 | 30–100 | 100–600 | 100–600 | ||
| Japan | Air pollution control law | 1968 | 600–2000 | ||
| 1996 | 50–200 | 410–720 | |||
| 1998 | 30–100 | 120–300 |
Notes: The ranges reflect specific limit values for existing and new plants of different types and capacity. Japanese standards for SO2 are region specific and depend further on the size, fuel and technology in a given facility. Values adopted from IEA [2], Jin et al. [23], Hashimoto [24], IEA CCC [25], McConville [26].
Table 2.
Evolution of emission standards for gasoline and diesel cars (g/km).
| Country | Policy | Revision | PM | NOx |
|---|---|---|---|---|
| China | Limits for emissions from light-duty vehicles | 2000 | 0.14–0.2 | 0.97–1.36 |
| 2004 | 0.08–0.1 | 0.5–0.9 | ||
| 2007 | 0.05 | 0.15–0.5 | ||
| 2010 | 0.025 | 0.08–0.25 | ||
| India | Bharat stages | 2000 | 0.14–0.25 | |
| 2005 | 0.08–0.17 | |||
| 2010 | 0.025–0.1 | 0.08–0.8 | ||
| Japan | Air pollution control law | 1978 | 0.25–0.9 | |
| Motor vehicle NOx law | 1992 | 0.25–0.48 | ||
| New short-term standards | 2001 | 0.014 | 0.05–0.15 | |
| Post new long-term emissions standards | 2009 | 0.005–0.007 | 0.05–0.11 |
© 2018 by the authors. Licensee MDPI, Basel, Switzerland. This article is an open access article distributed under the terms and conditions of the Creative Commons Attribution (CC BY) license (http://creativecommons.org/licenses/by/4.0/).
Share and Cite
MDPI and ACS Style
Rafaj, P.; Amann, M. Decomposing Air Pollutant Emissions in Asia: Determinants and Projections. Energies 2018, 11, 1299. https://doi.org/10.3390/en11051299
AMA Style
Rafaj P, Amann M. Decomposing Air Pollutant Emissions in Asia: Determinants and Projections. Energies. 2018; 11(5):1299. https://doi.org/10.3390/en11051299
Chicago/Turabian StyleRafaj, Peter, and Markus Amann. 2018. "Decomposing Air Pollutant Emissions in Asia: Determinants and Projections" Energies 11, no. 5: 1299. https://doi.org/10.3390/en11051299
Note that from the first issue of 2016, this journal uses article numbers instead of page numbers. See further details here.