Optimized Daily Dispatching Strategy of Building- Integrated Energy Systems Considering Vehicle to Grid Technology and Room Temperature Control


Abstract
:1. Introduction
2. Model Construction
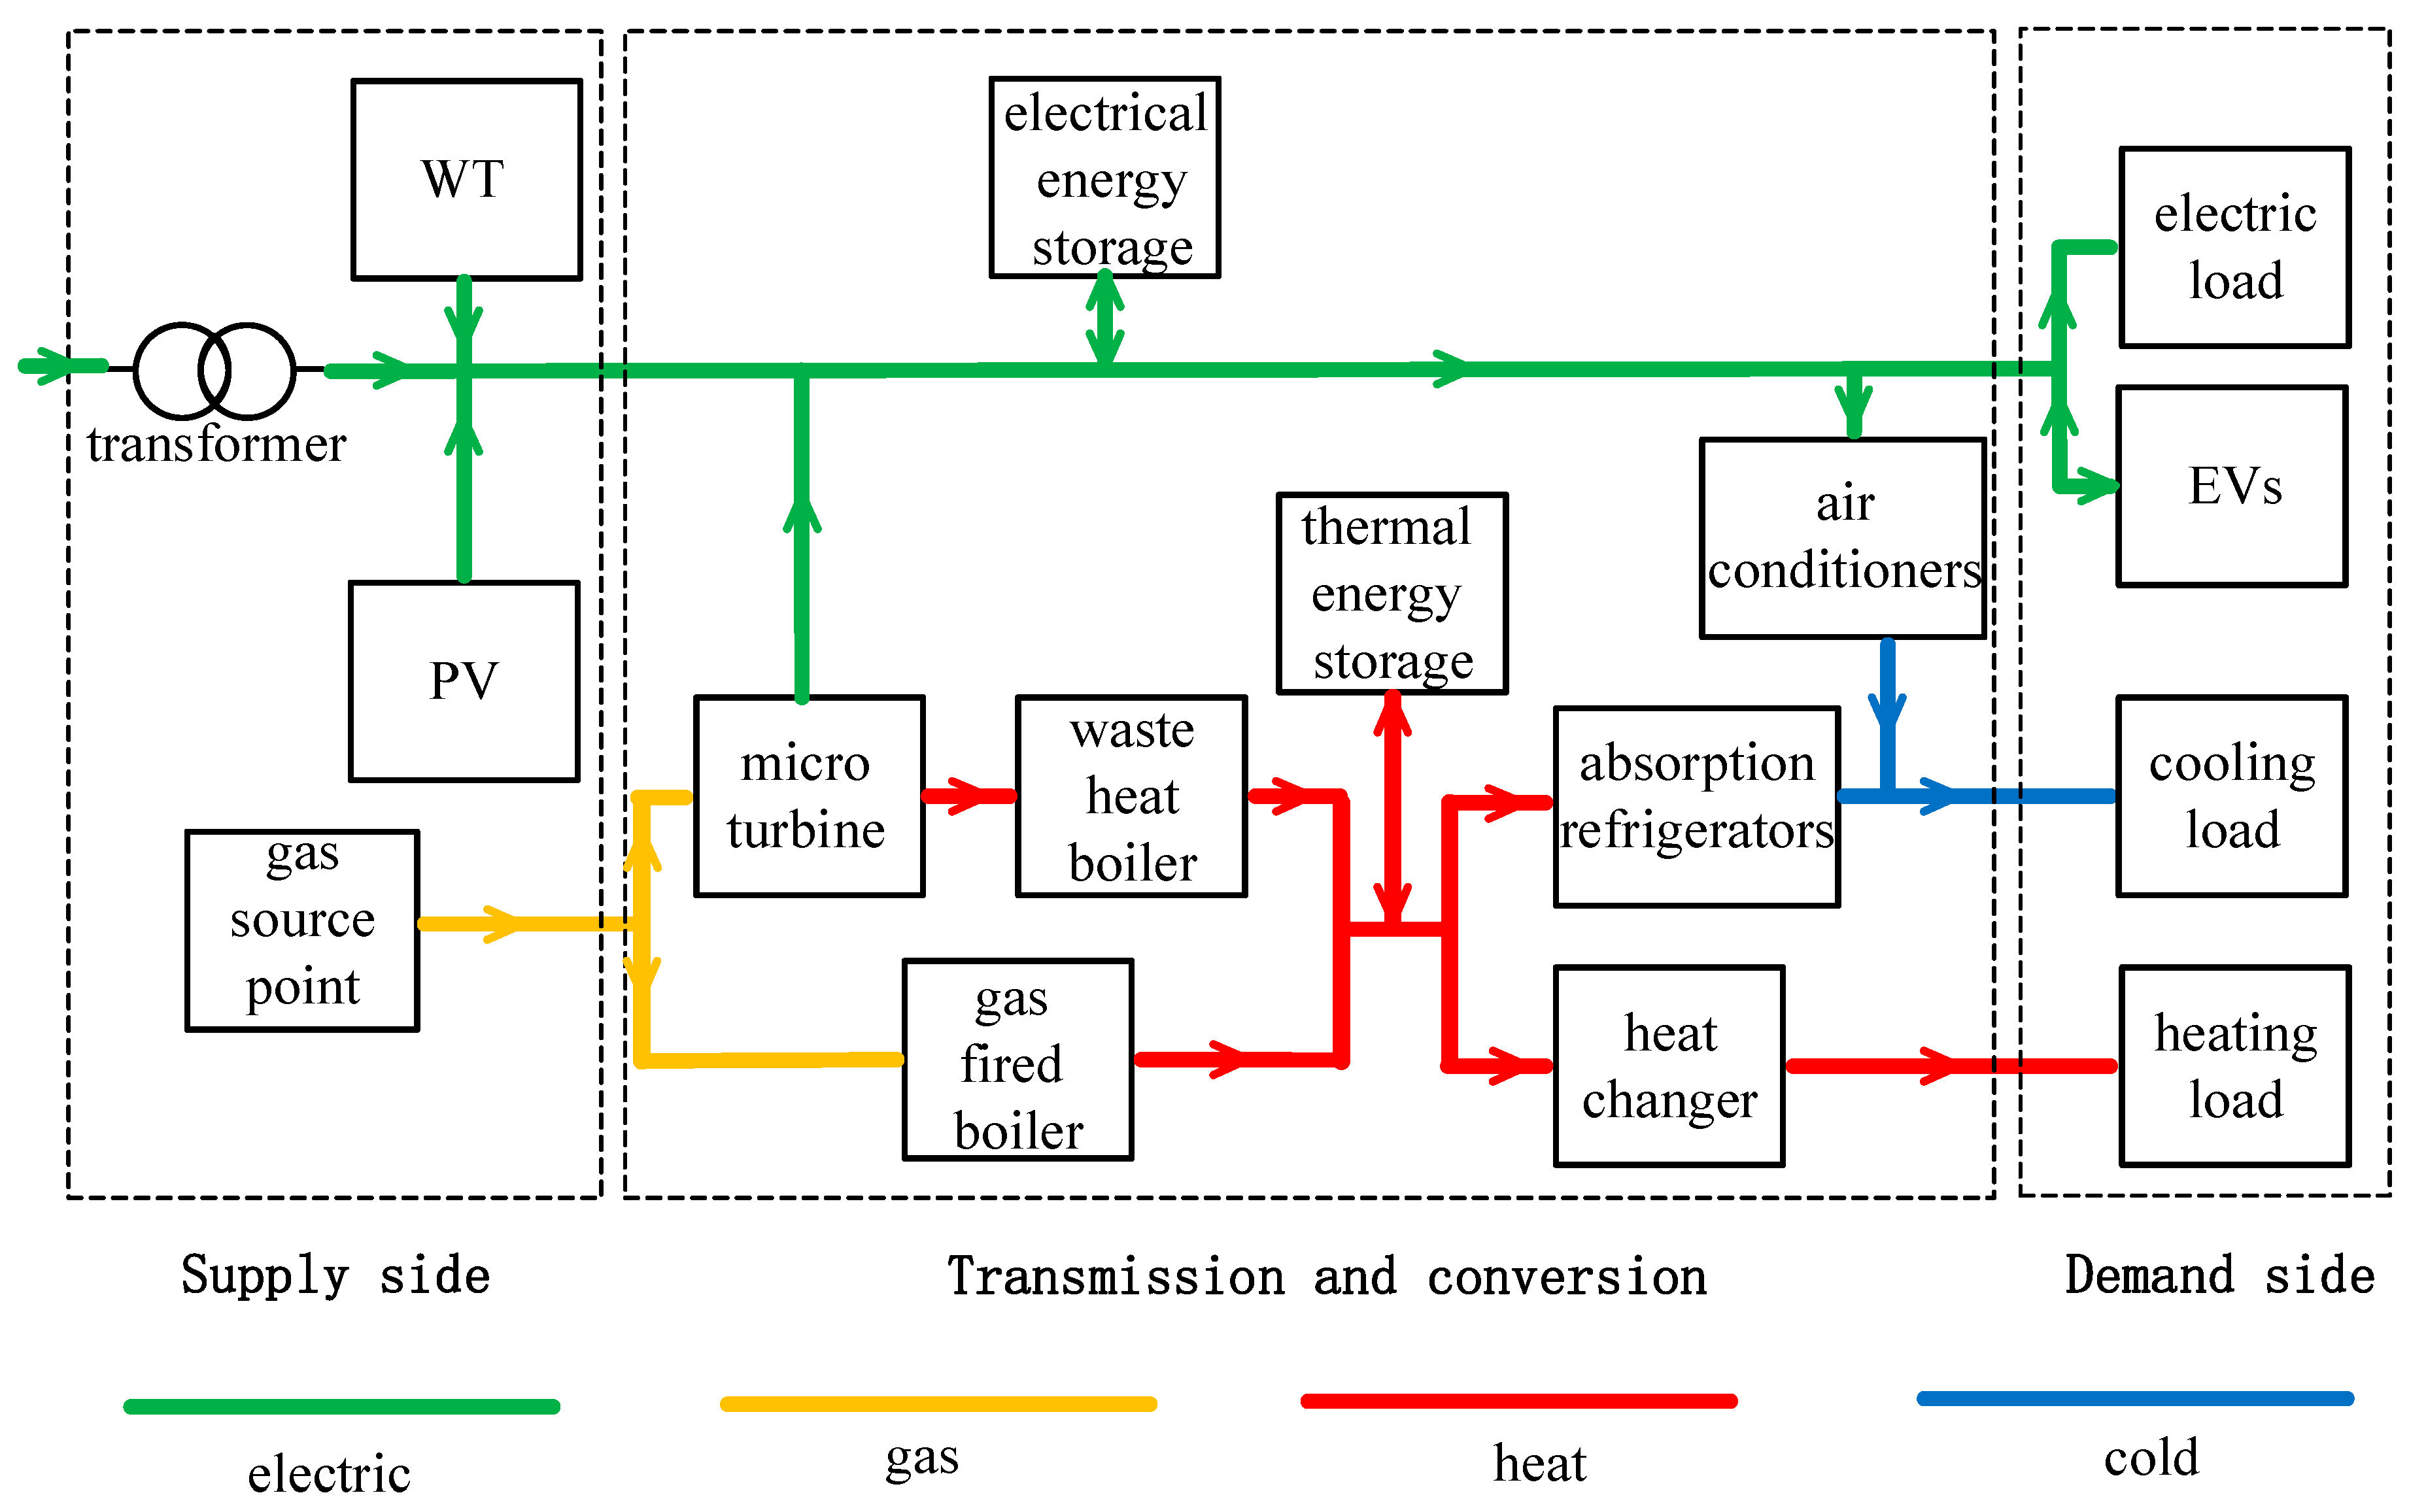
2.1. Structure of the BIES
2.2. Mathematical Models of the BIES
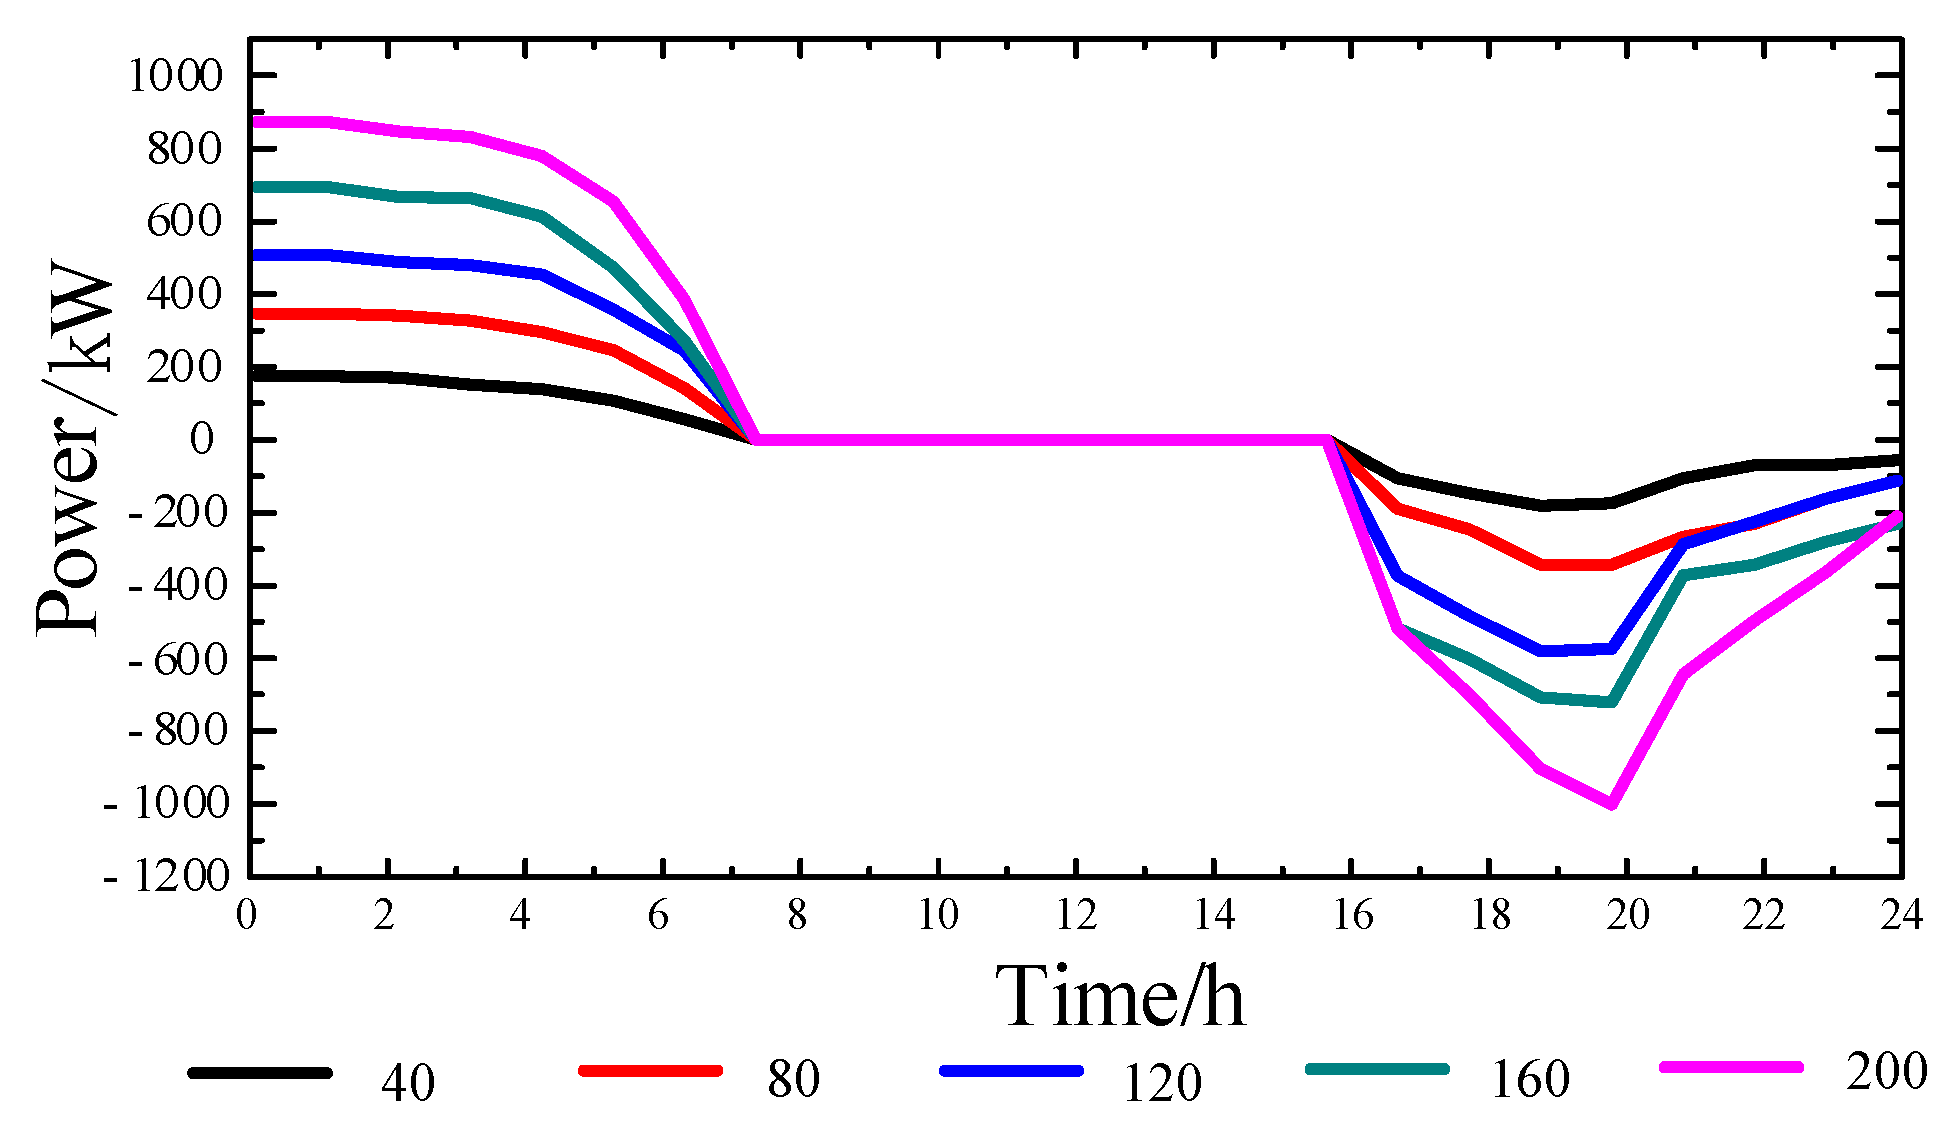
3. Model of Power Load Prediction of EVs
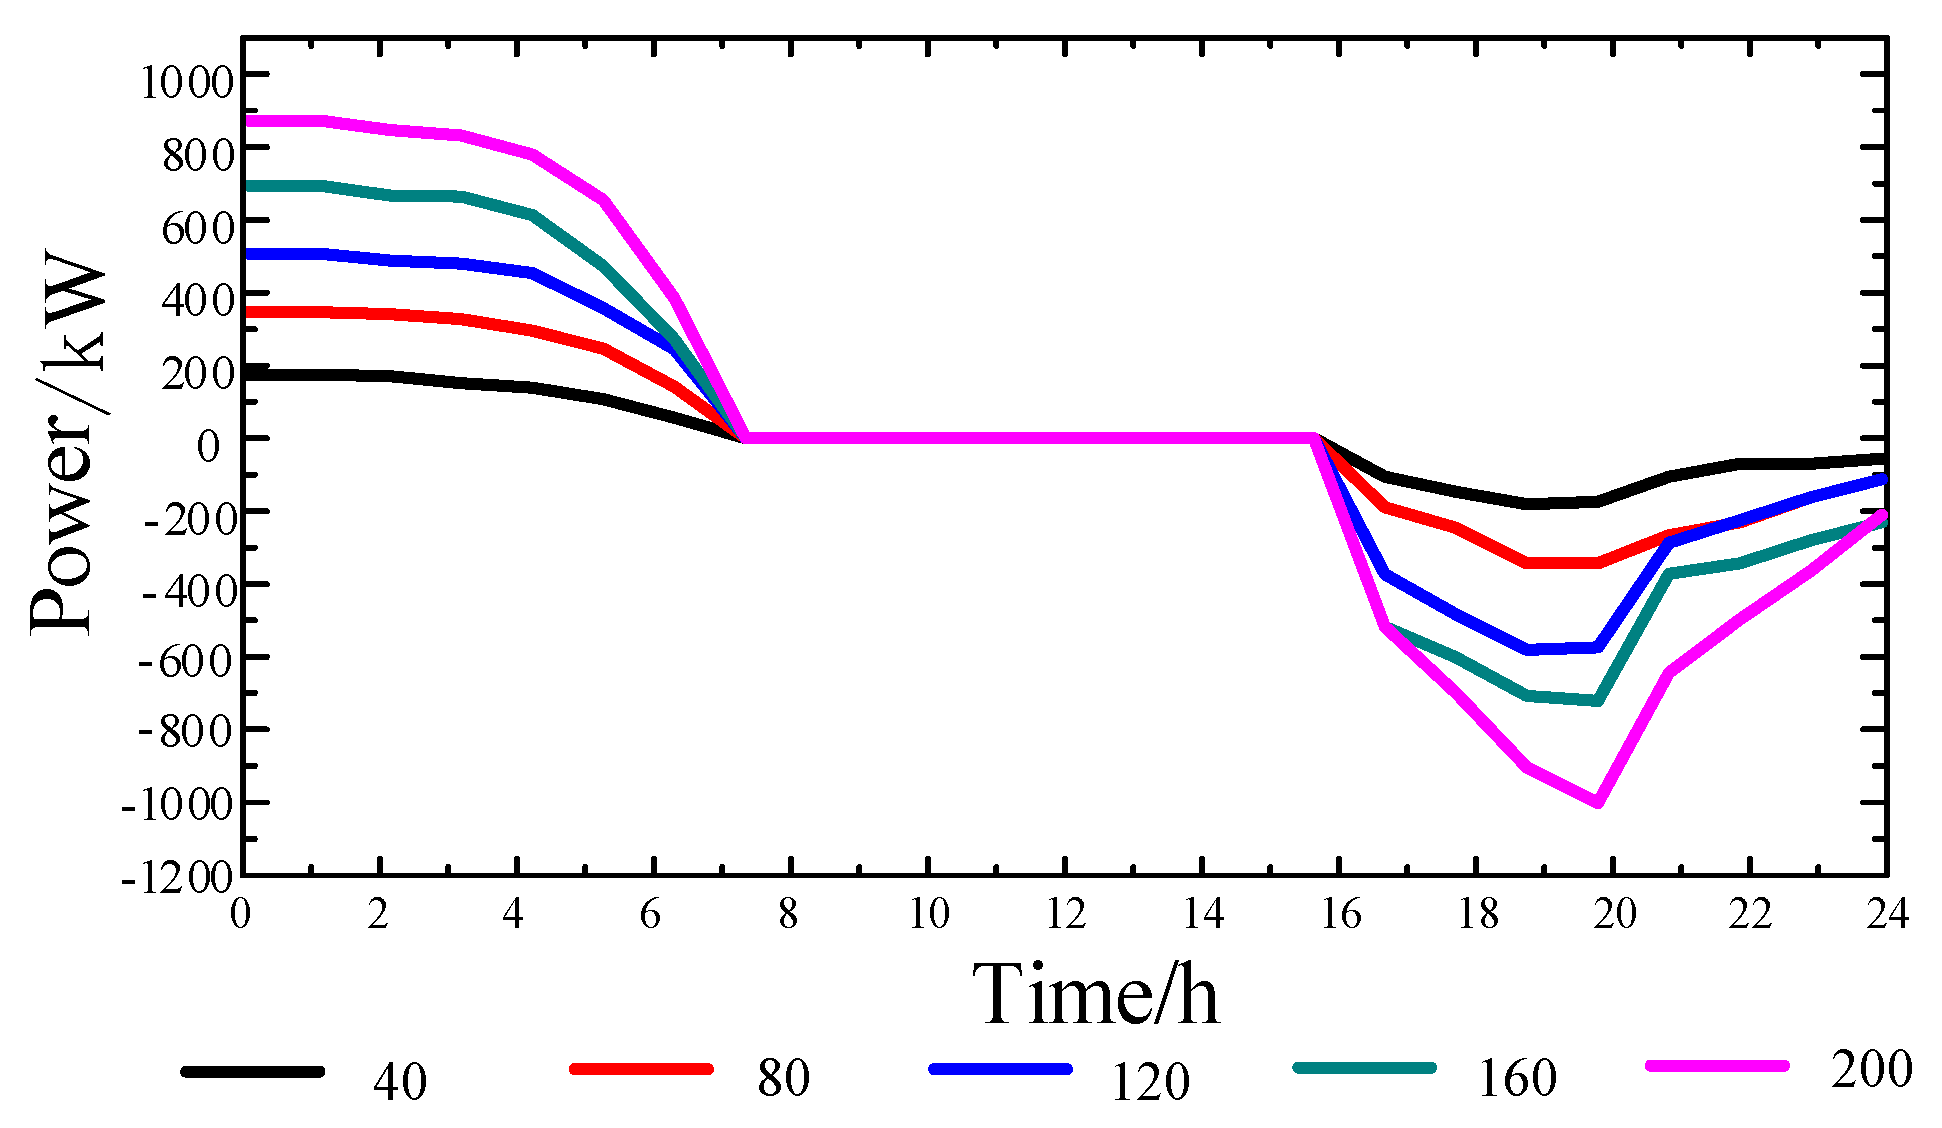
3.1. Resident-Owned EVs
- (a)
- Power consumption per 100 km is set to be 15 kWh. In this paper, the battery capacity of the EV is assumed to be 40 kWh.
- (b)
- The charging power of EVs is set to conform to a normal distribution between 4 and 5 kW at the charging current ratio of 0.1 C.
- (c)
- Initial battery power is set to be the same.
- (d)
- Starting charging time and daily mileage of EVs are independent random variables.
- (e)
- Battery of all EVs is at fully-charged state initially
3.2. Staff-Owned EVs
4. Model of BIES Dispatching
4.1. Objective Function
4.2. Constraints
5. Study Case
6. Result Analysis
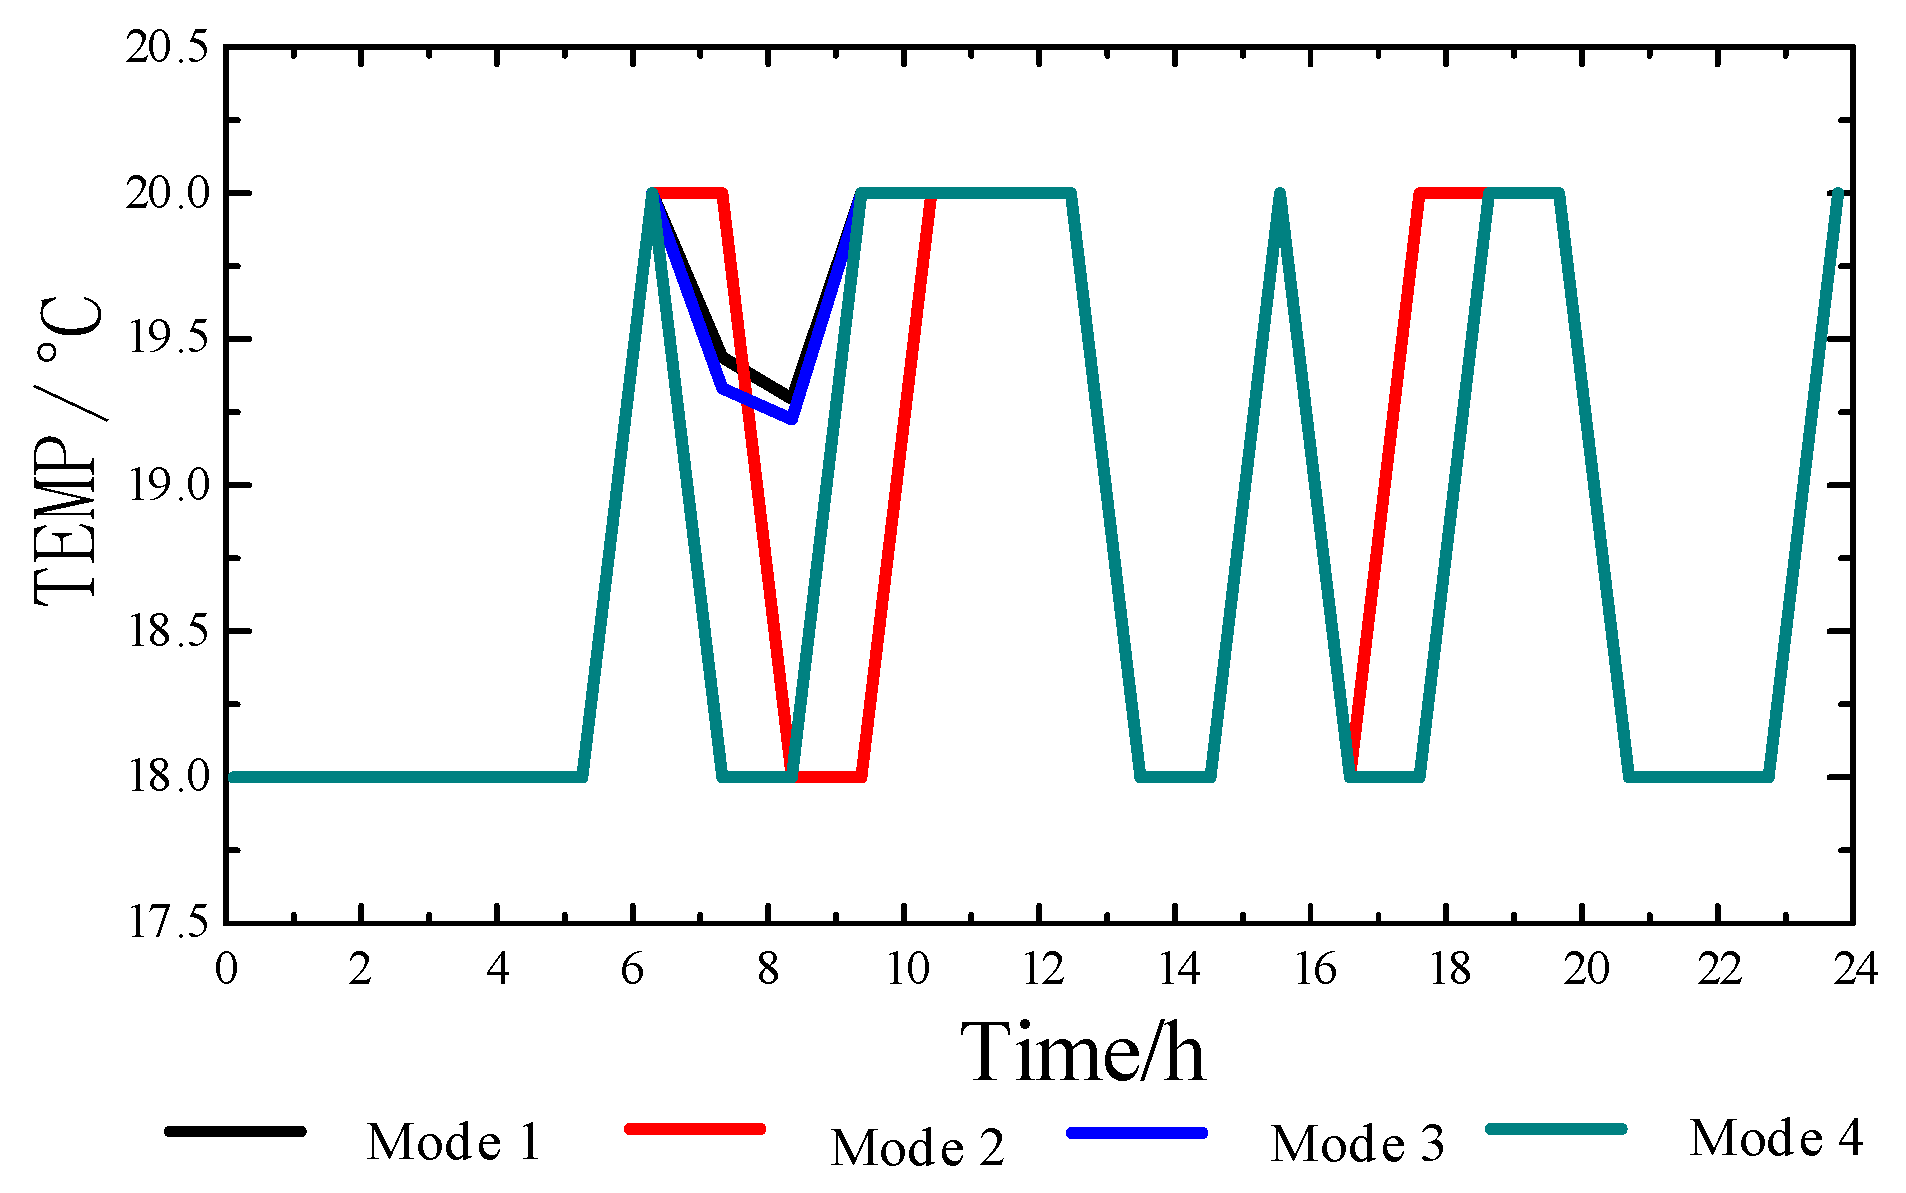
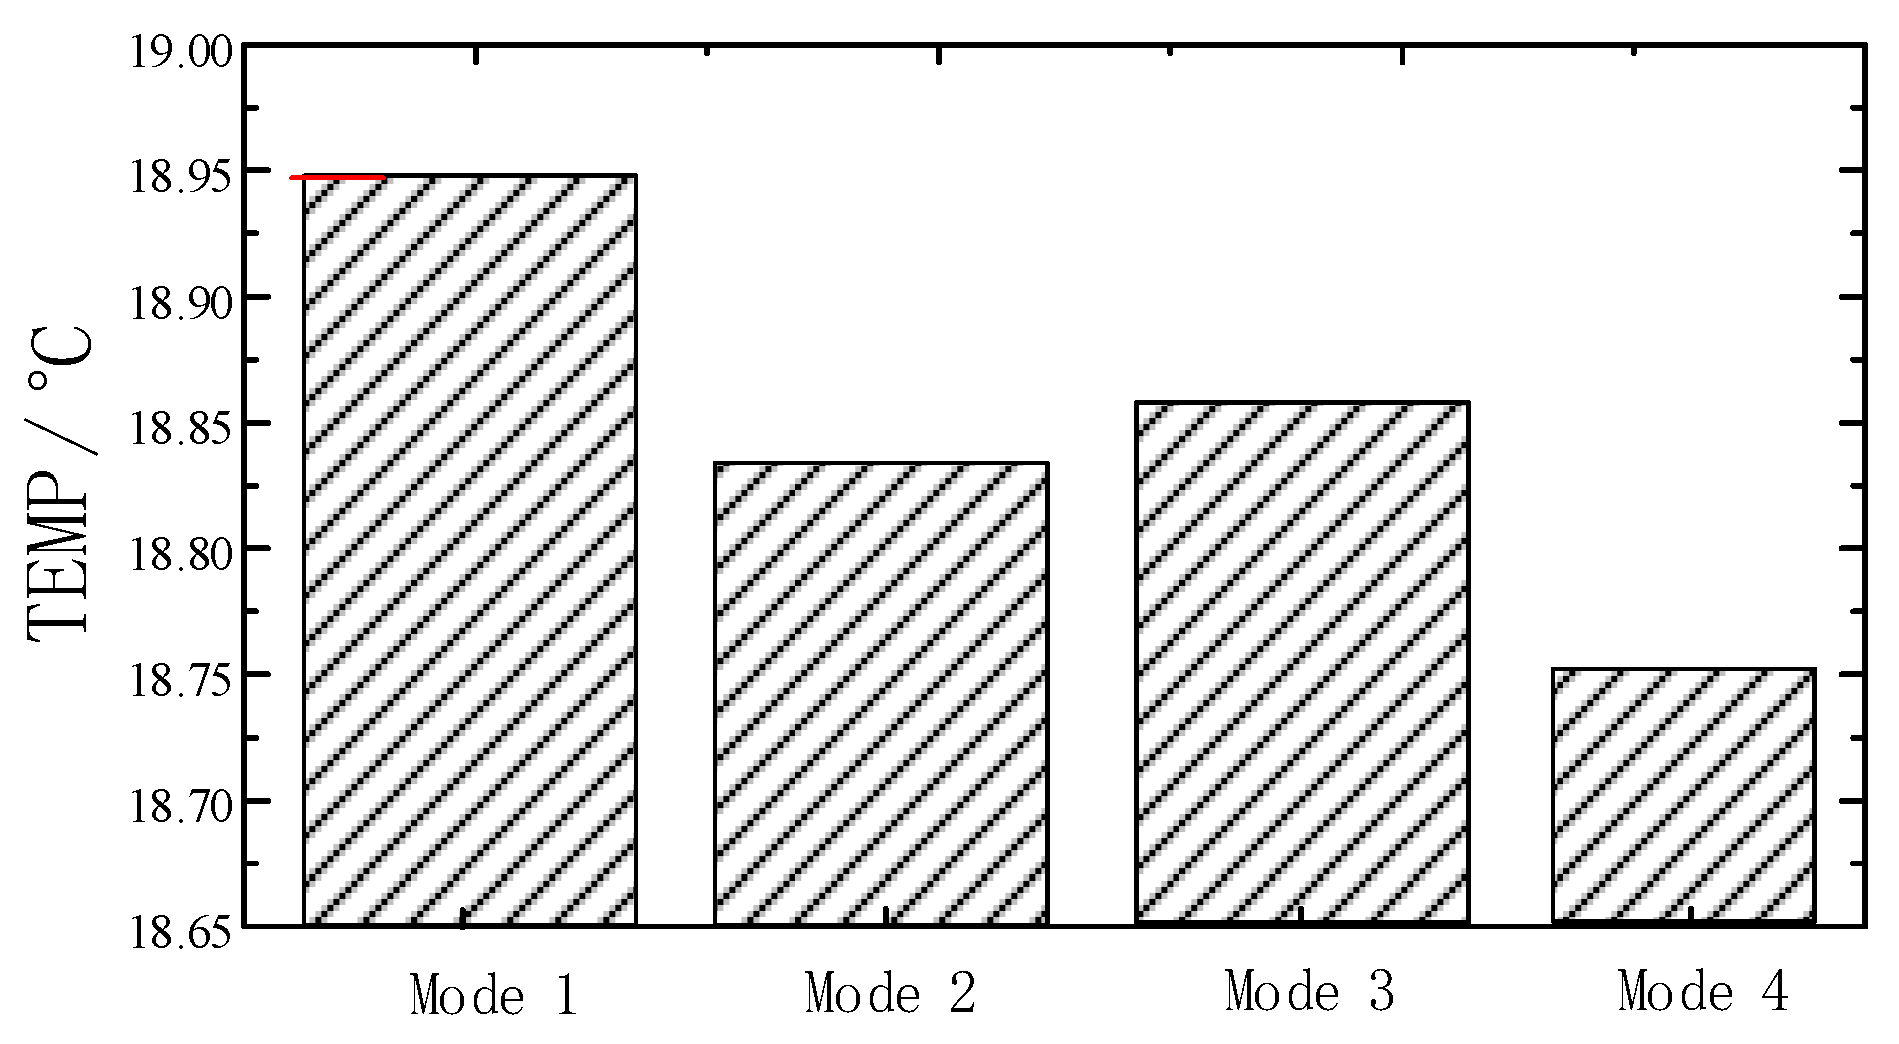
- Mode 1:
- Without control, i.e., resident-owned EVs adopt orderly charging, while staff-owned EVs adopt self-sustained mode.
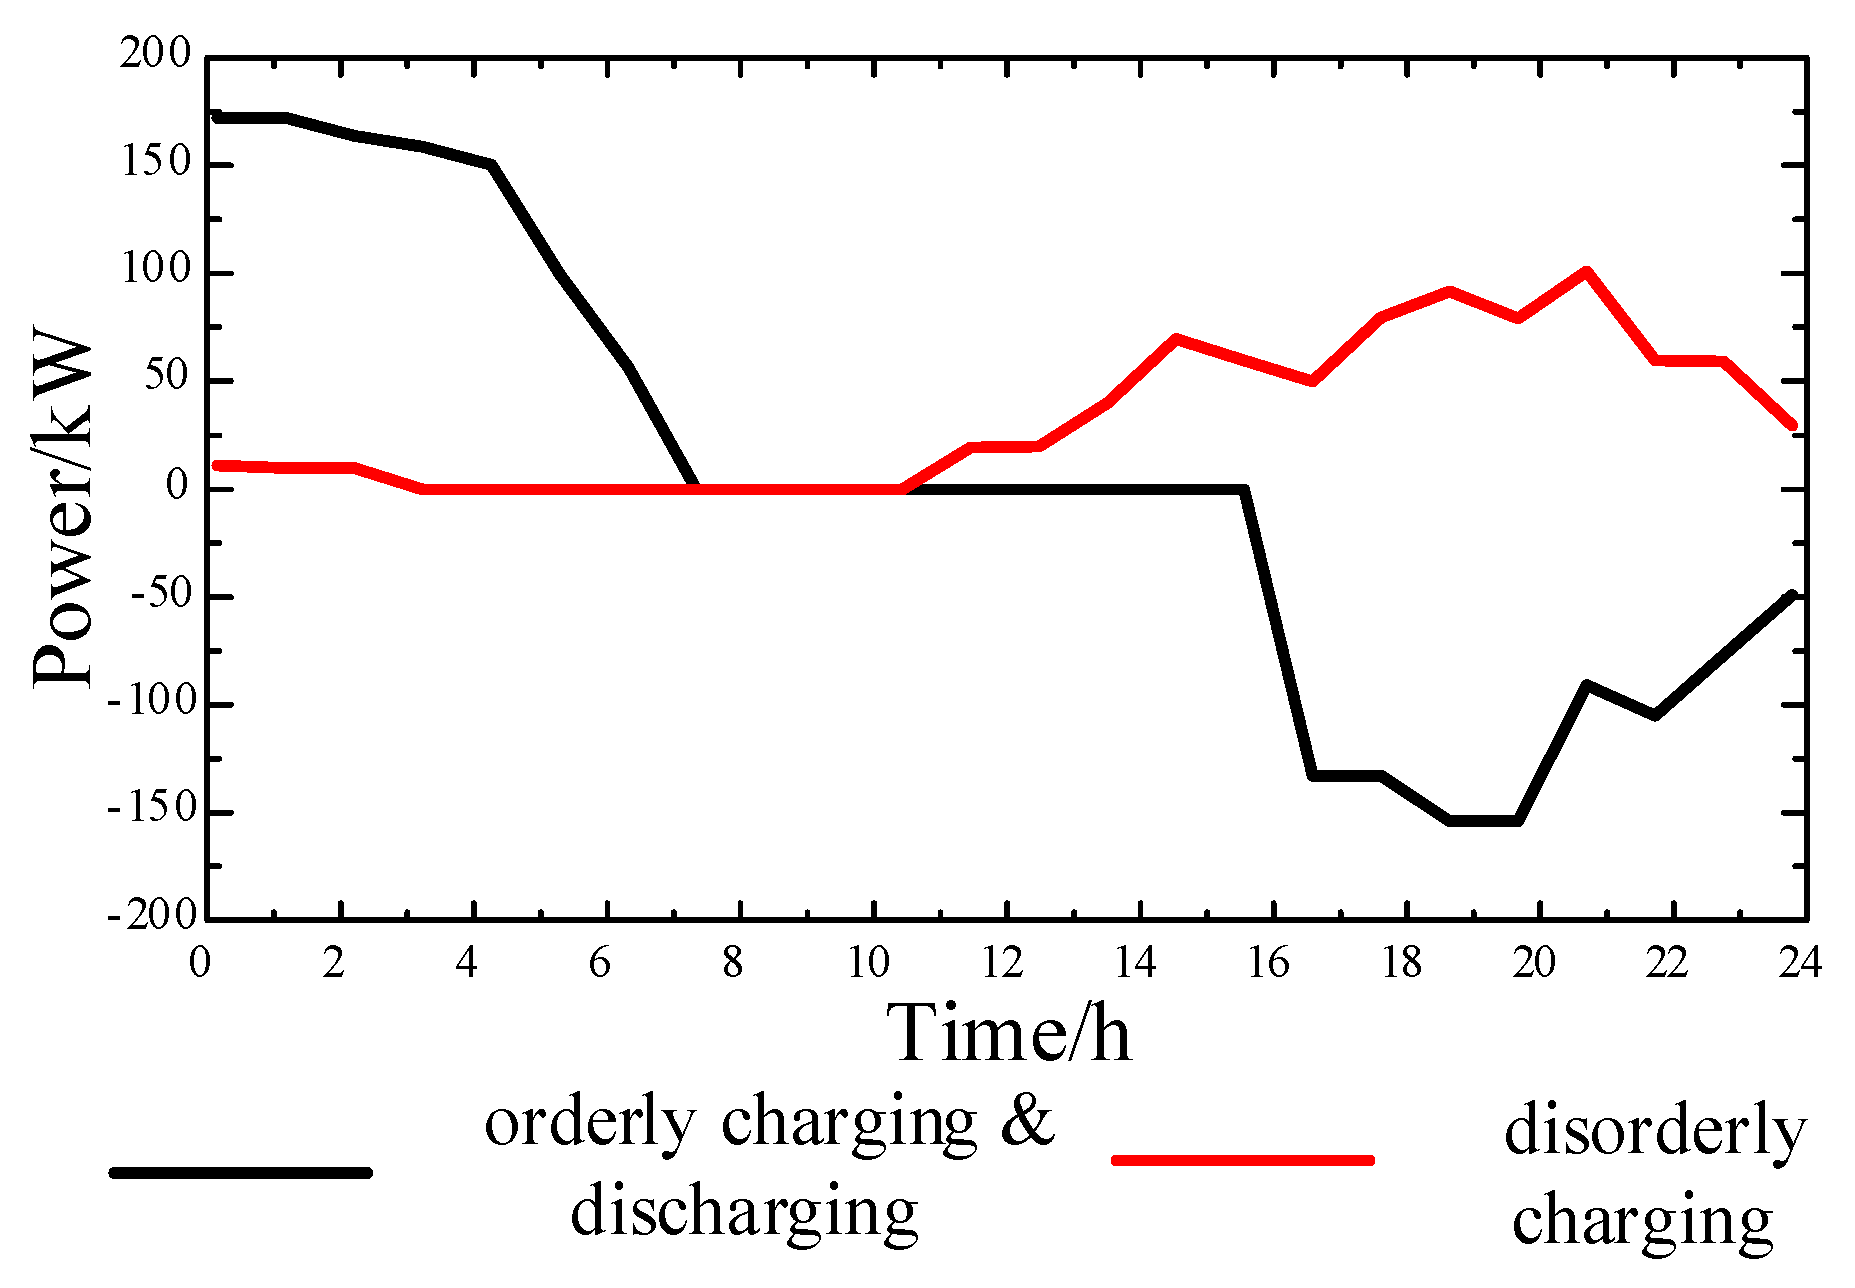
- Mode 2:
- Only control staff-owned EVs, i.e., resident-owned EVs adopt disorderly charging, while staff-owned EVs take part in the dispatching.
- Mode 3:
- Only control resident-owned EVs, i.e., resident-owned EVs adopt orderly charging and discharging, while staff-owned EVs adopt self-sustained mode.
- Mode 4:
- Joint control, i.e., resident-owned EVs adopt orderly charging and discharging, while staff-owned EVs take part in the dispatching.
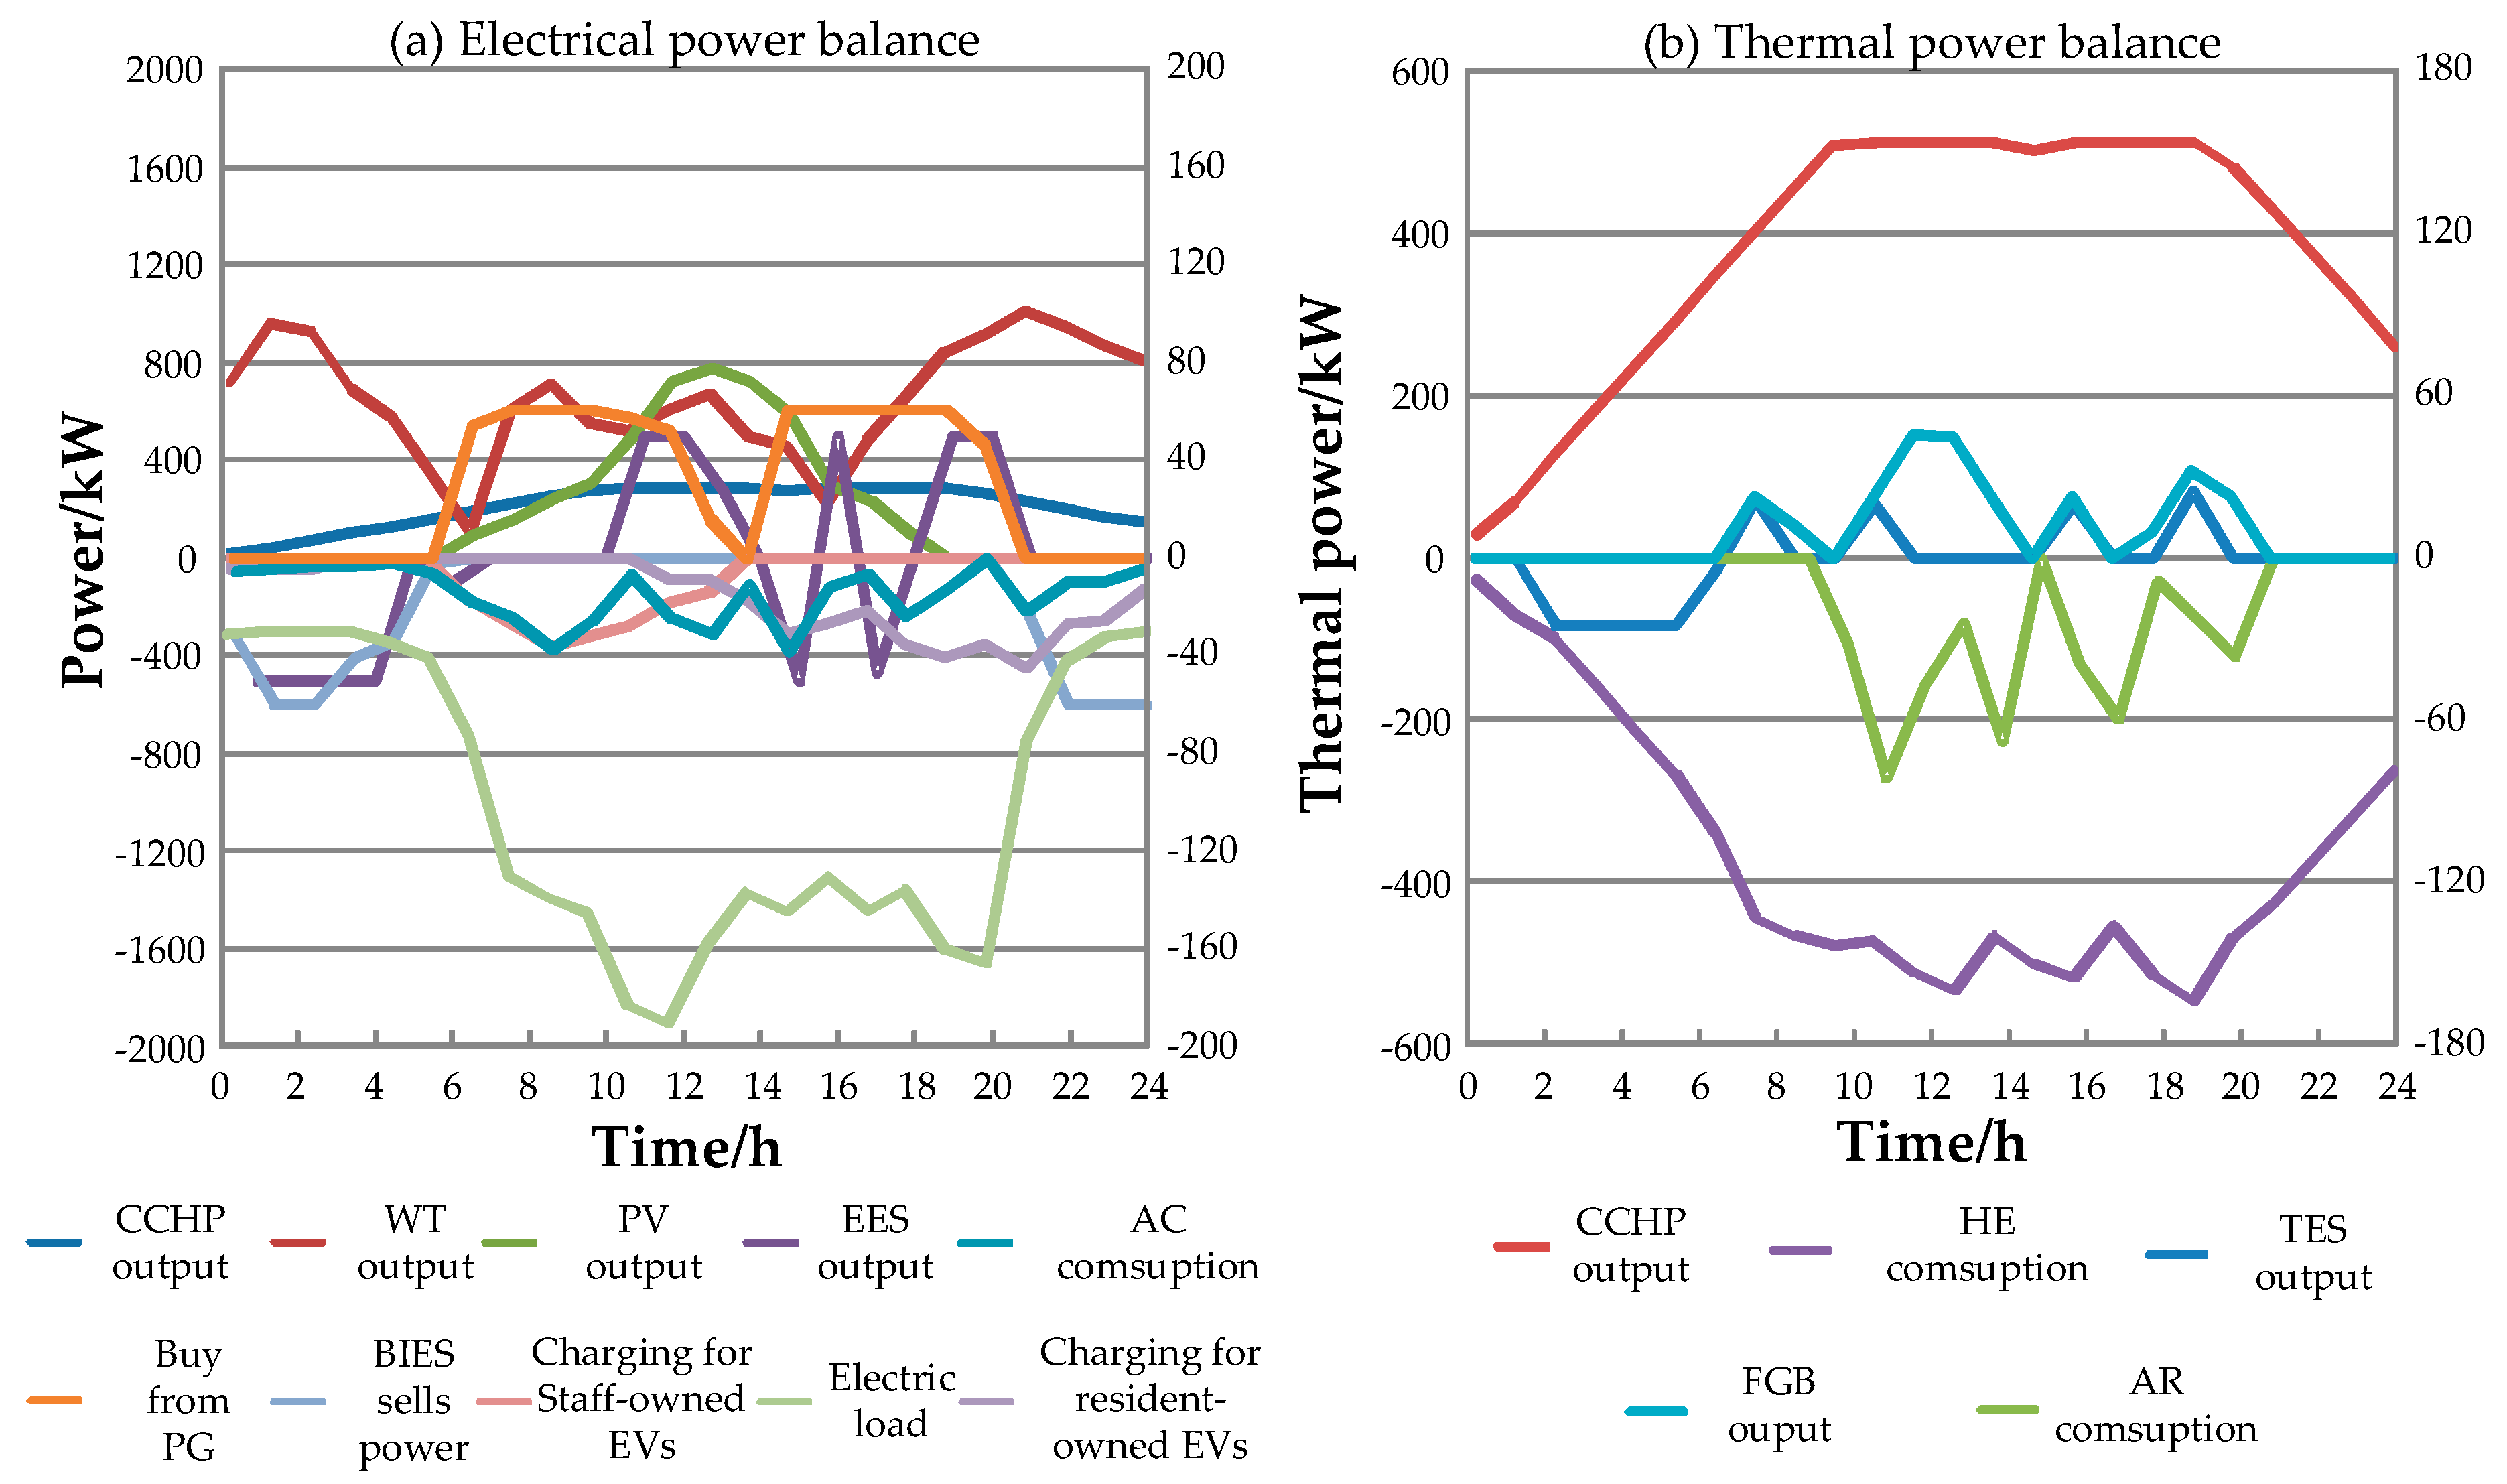
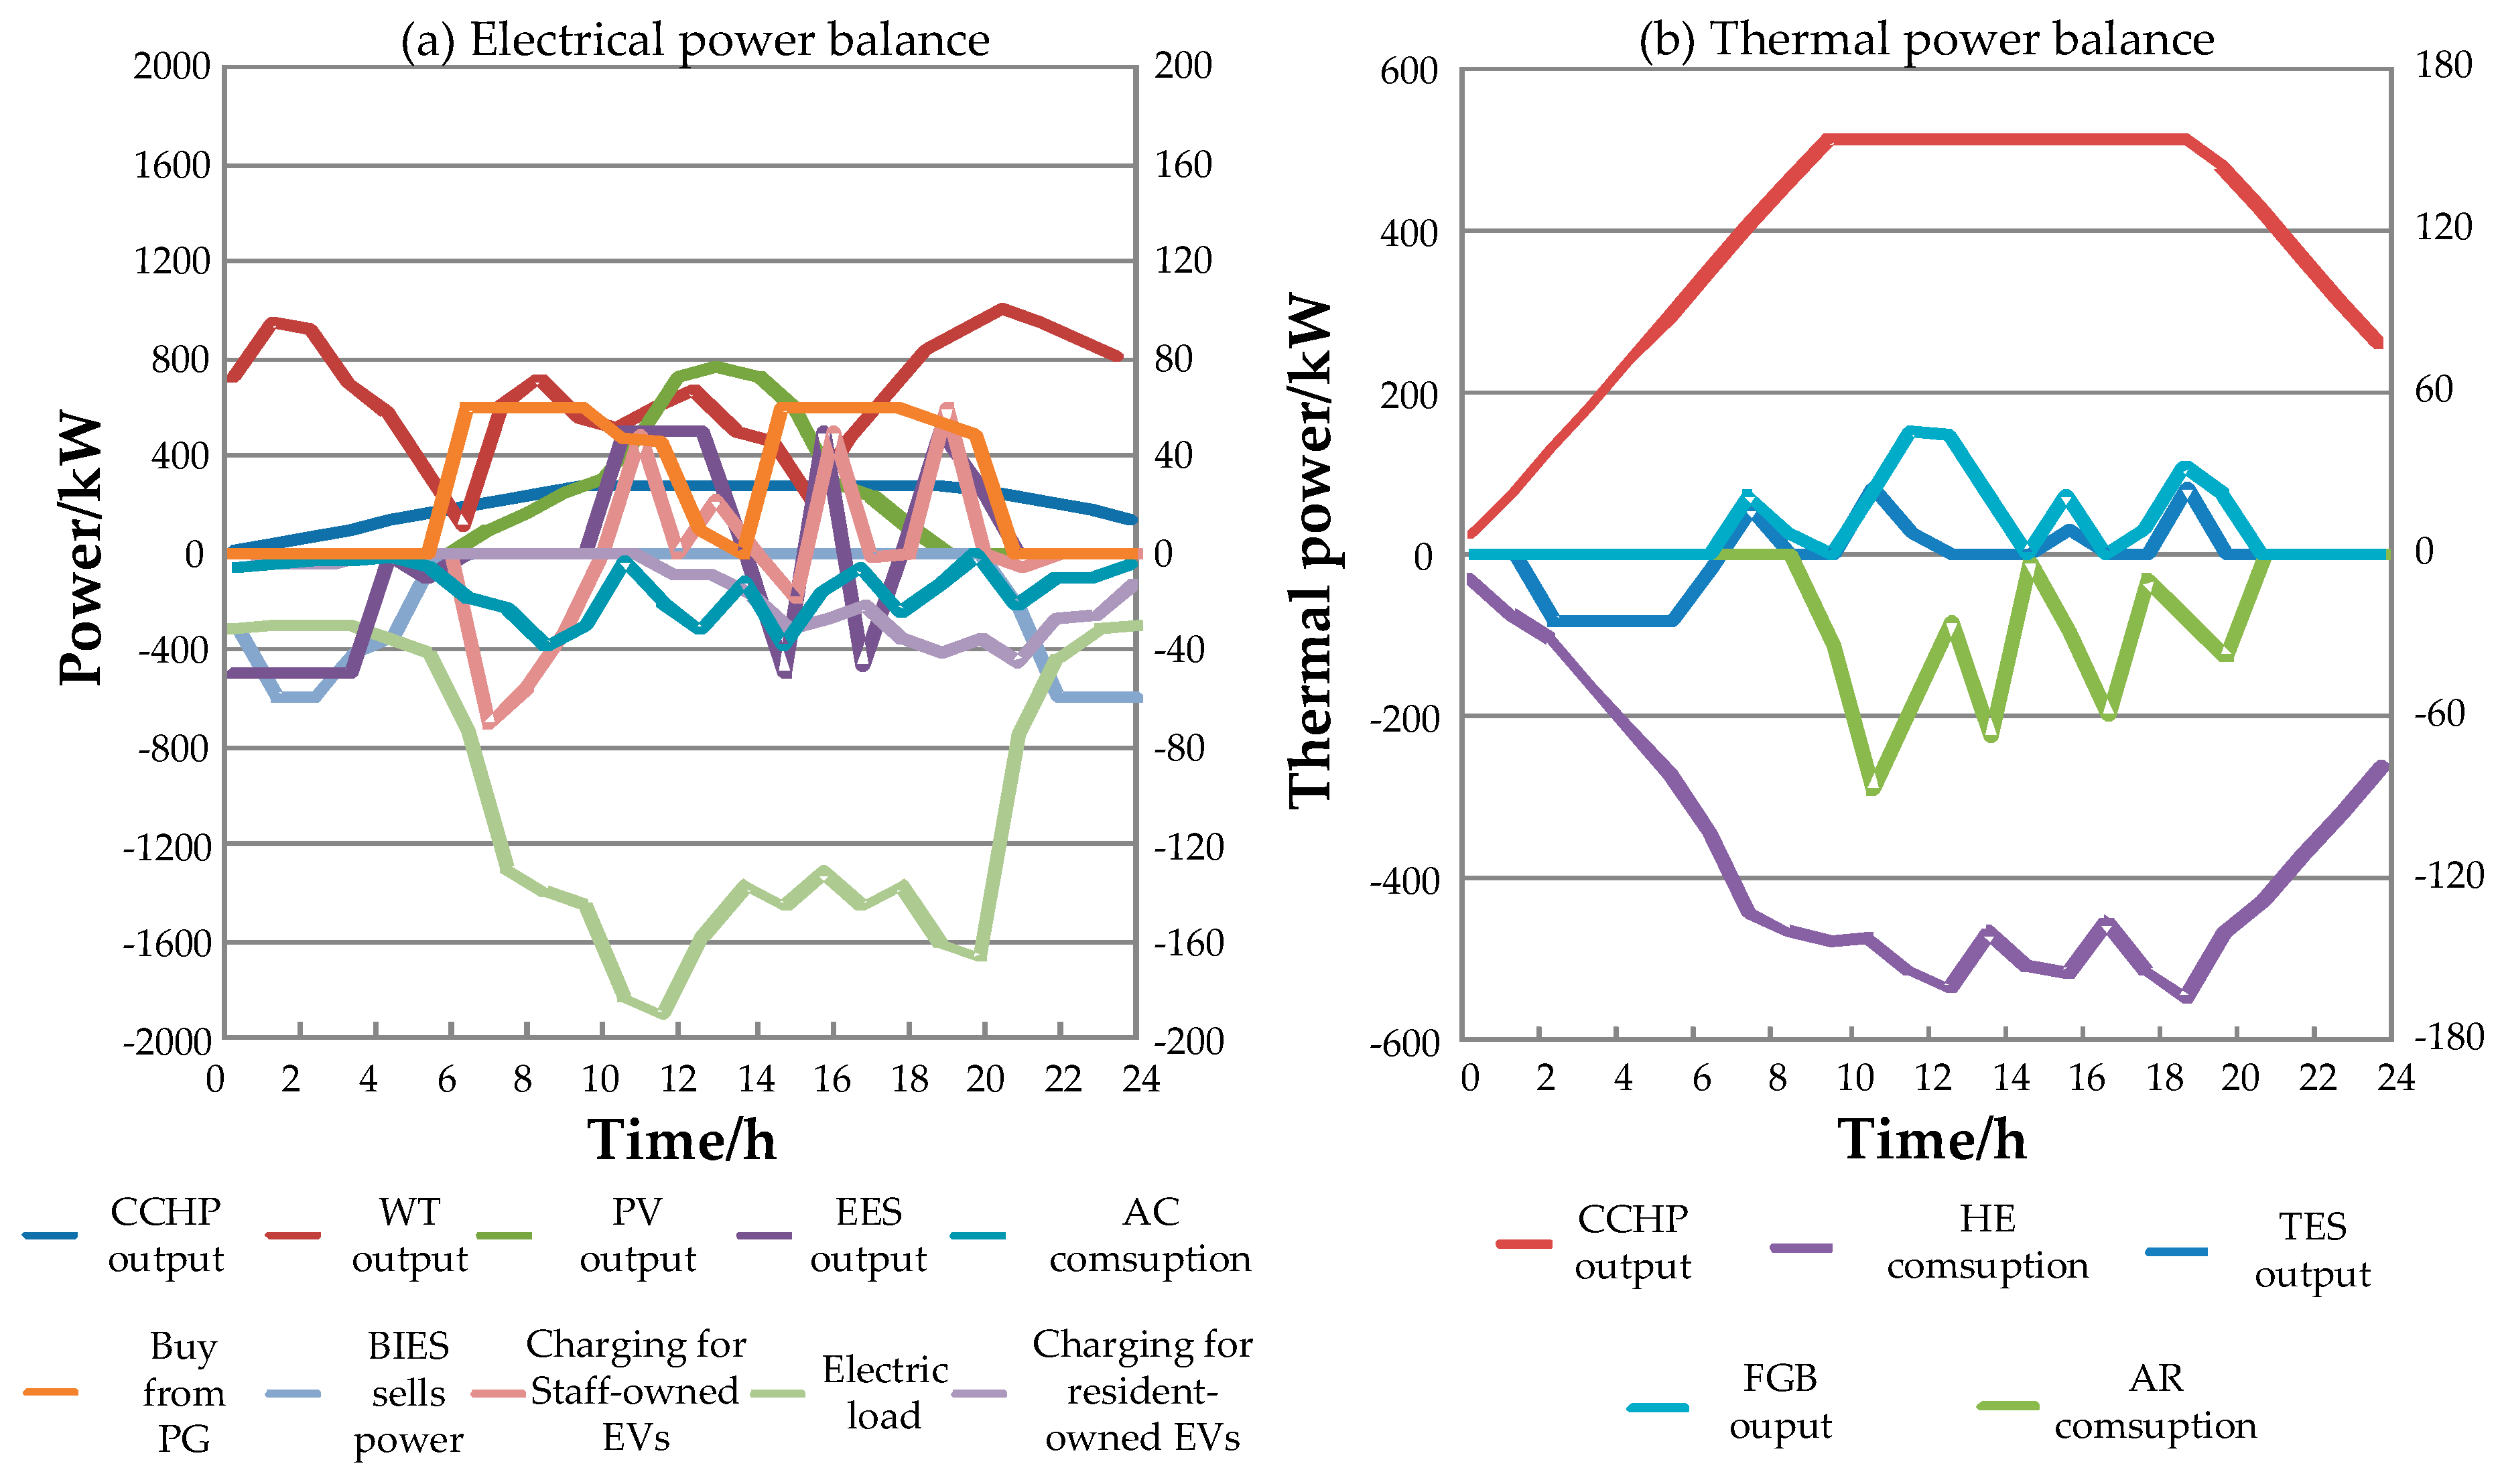
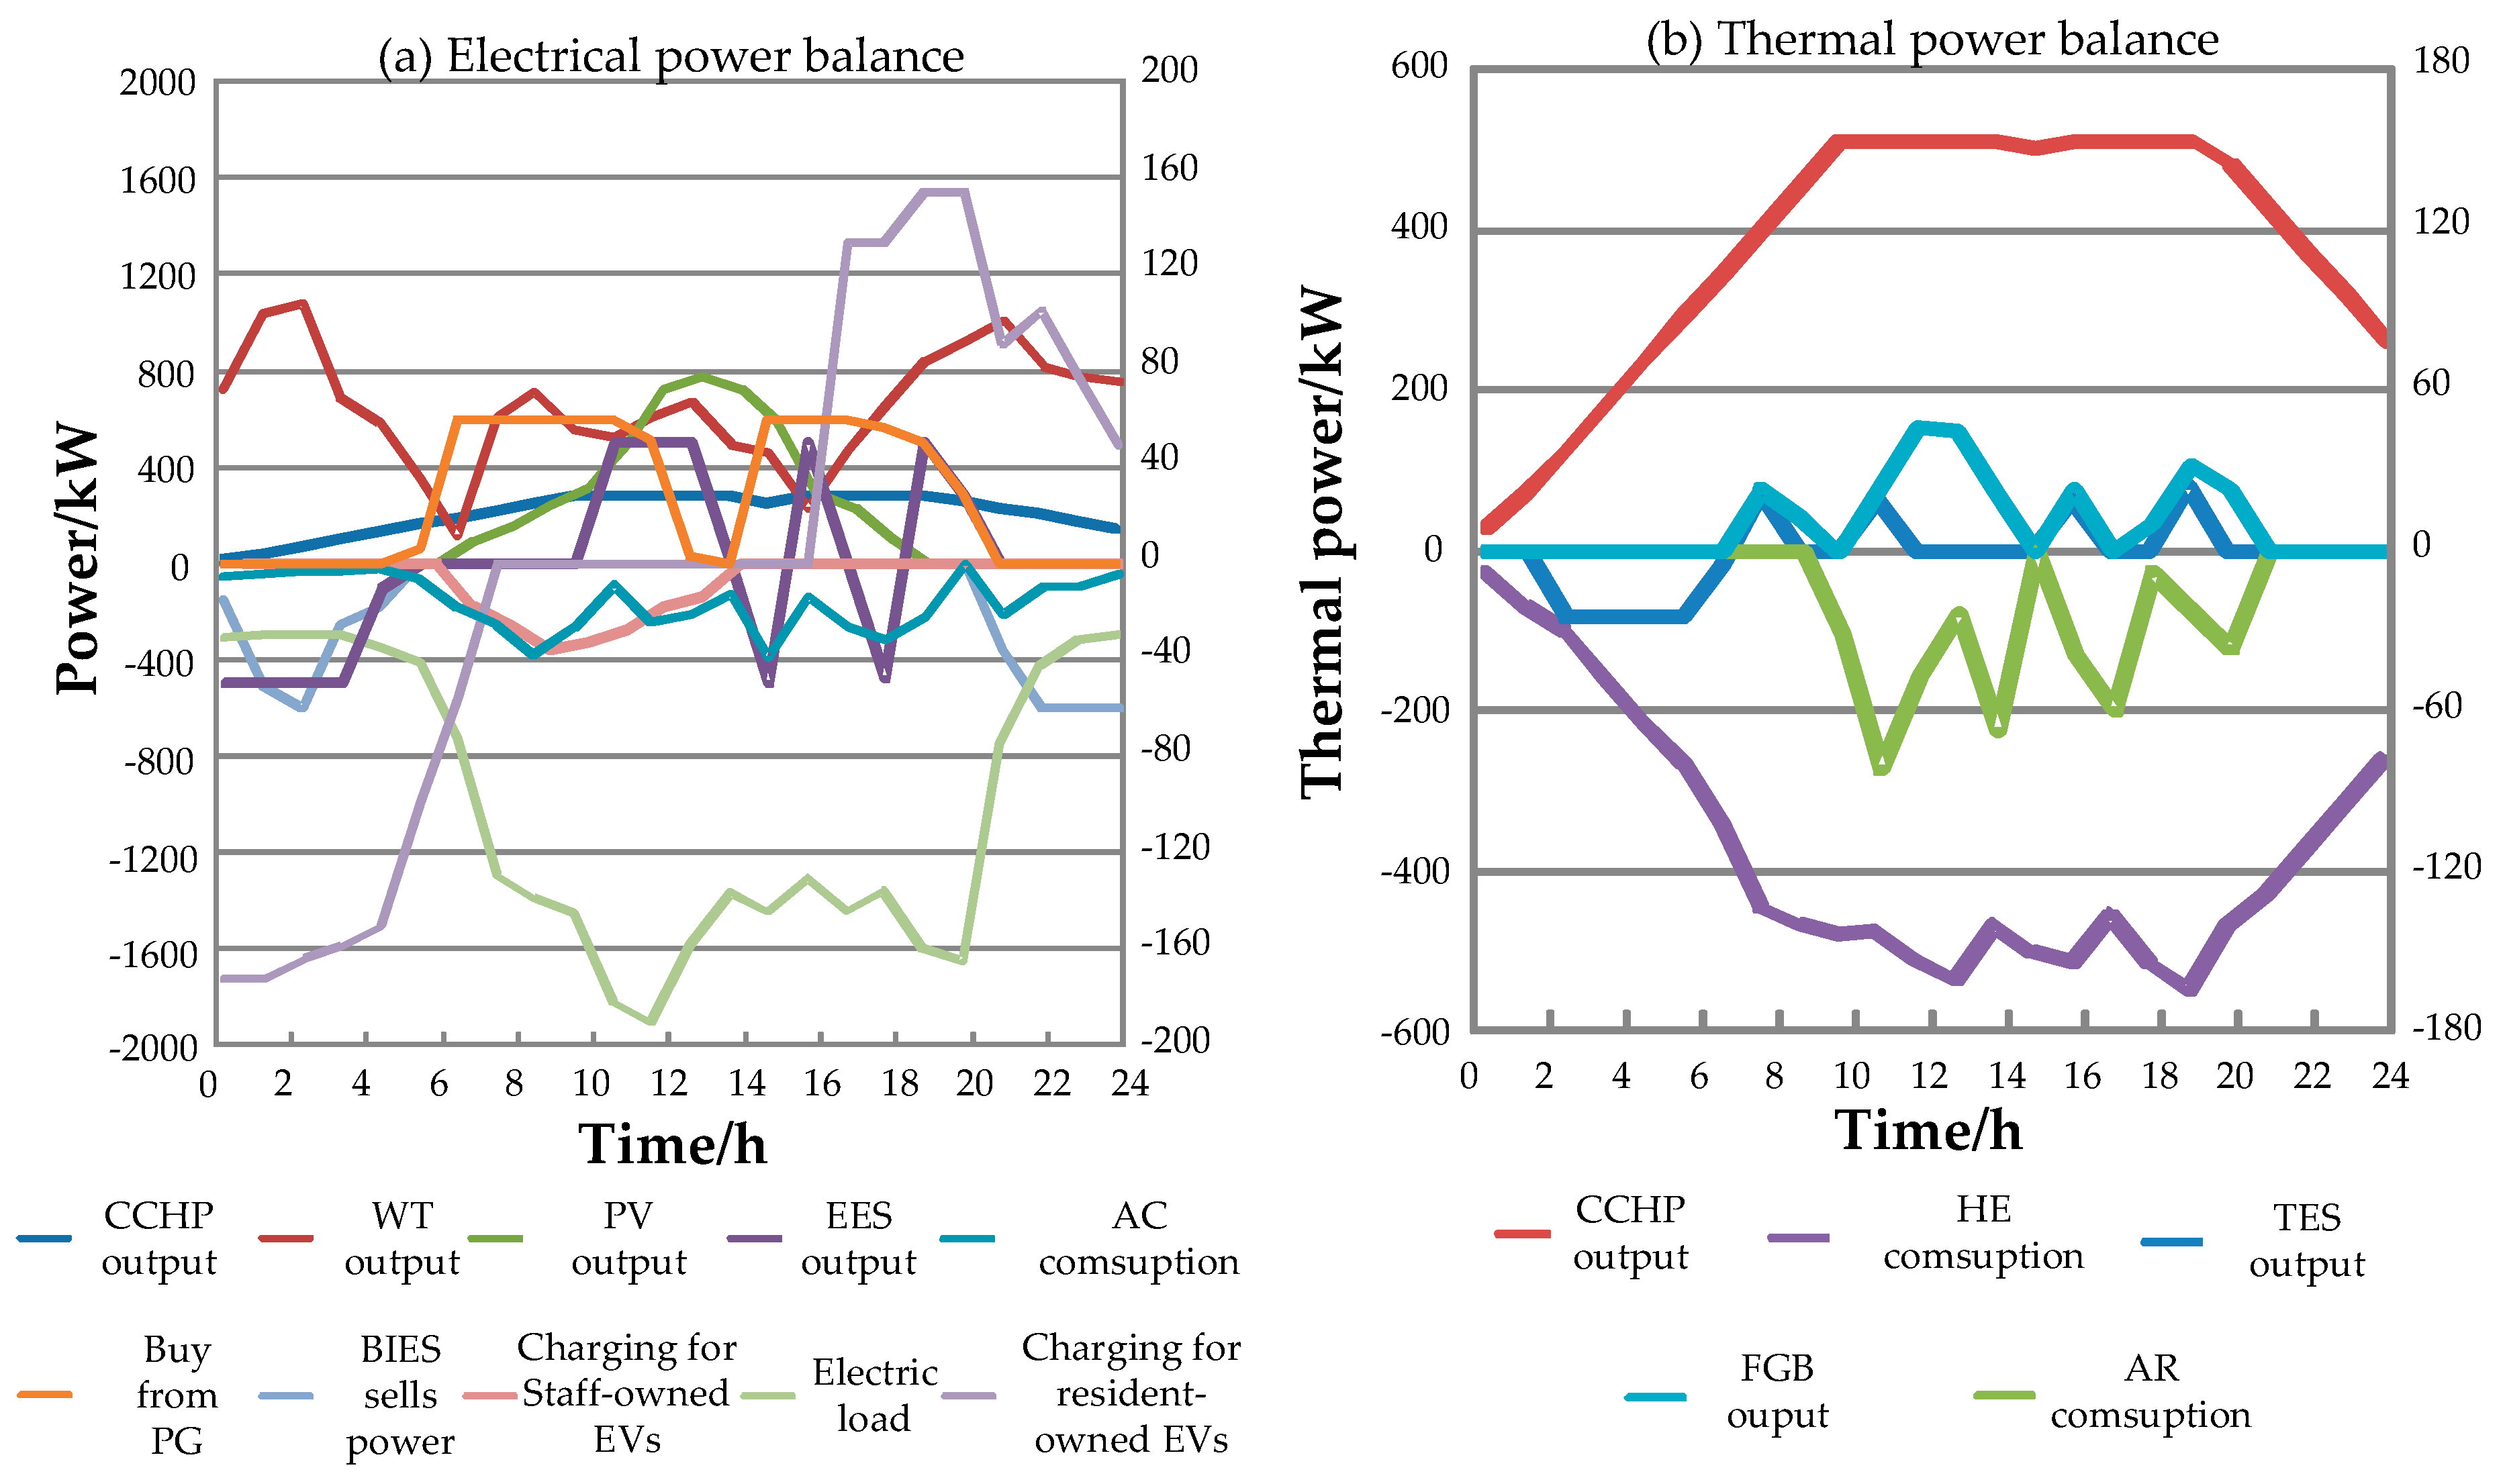
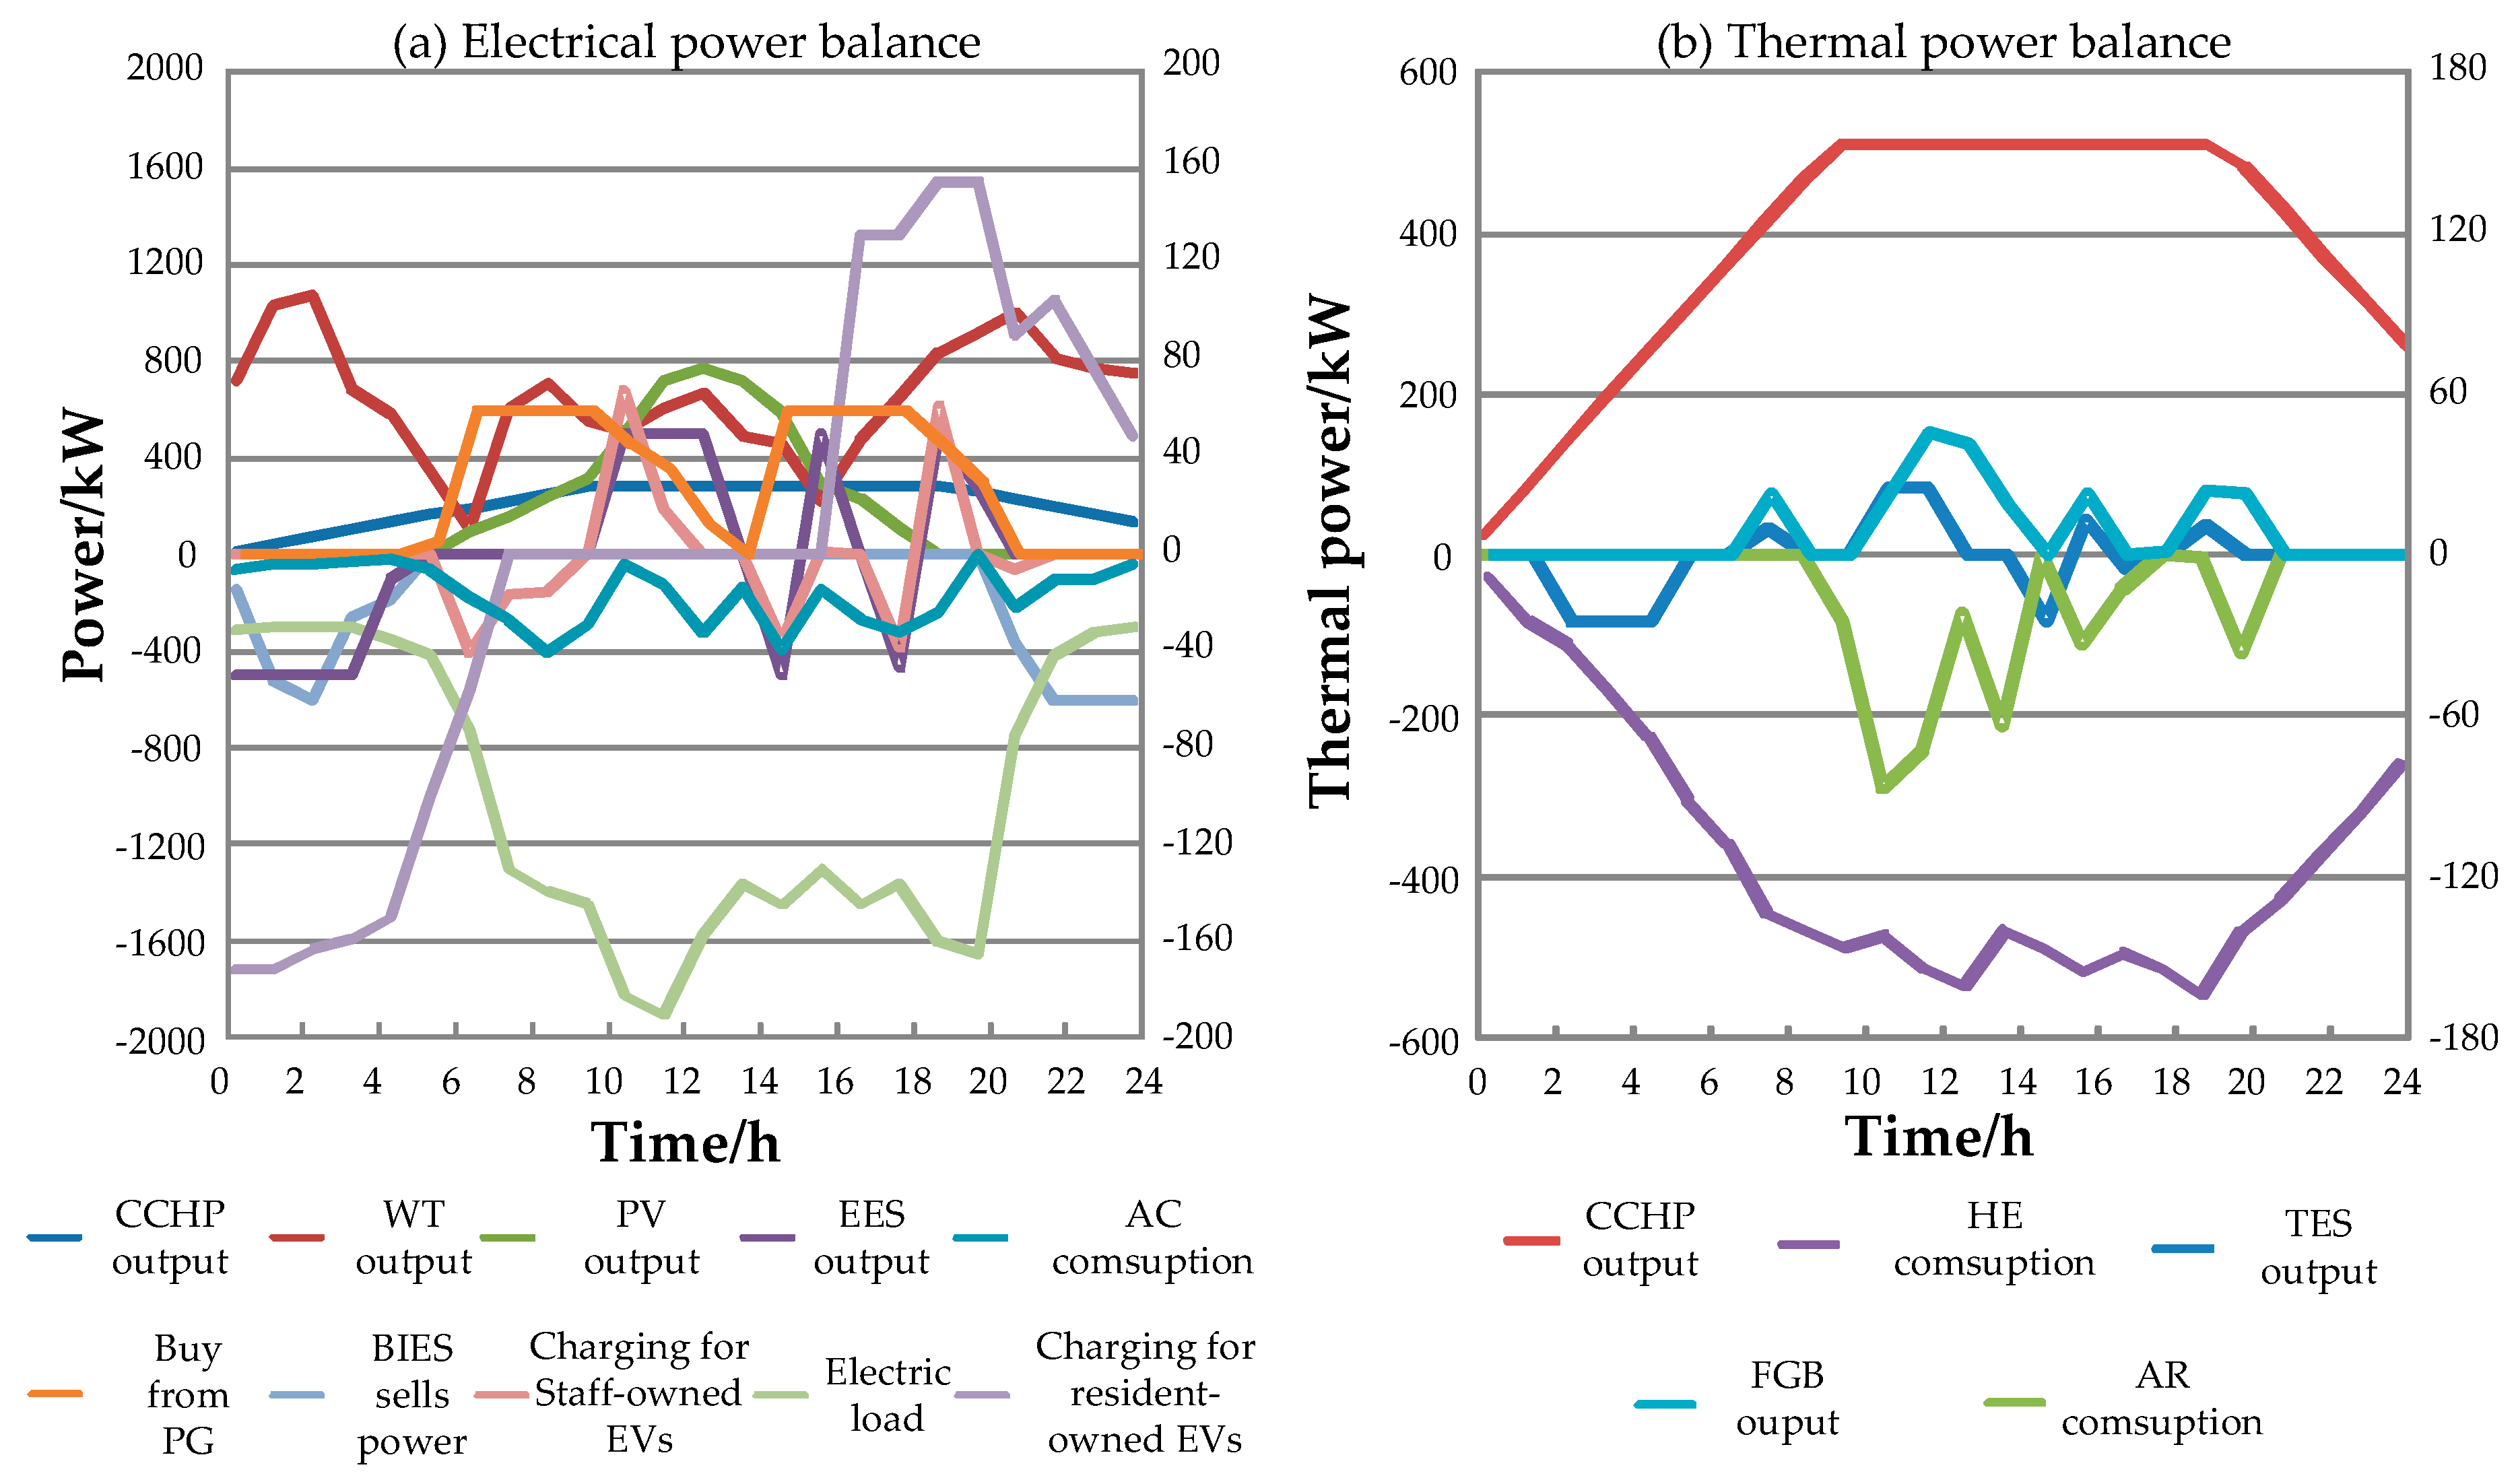
6.1. Analysis of Four Operational Modes
6.2. BIES Economic Analysis
7. Conclusions
- (1)
- The merits of the BIES are that the various load demands (cooling, heating, electricity) can be met. The connection of EVs in the BIES will have an impact of the operation of the BIES. It gives some insight in the optimization and the improvement of the safety of the BIES.
- (2)
- Simulation results suggest V2G can effectively improve the economy of the BIES through the application of sort management on all the EVs within the building.
- (3)
- By limiting the room temperature, it is found that temperature is also one of the factors impacting the benefits. This was not considered in previous research.
Author Contributions
Funding
Conflicts of Interest
Nomenclature
| Notations | |
| the power output a t | |
| the power consumption of gas at t | |
| waste thermal power output of waste heat boilers at t | |
| the thermal power input of absorption refrigerators at t | |
| the power output of absorption refrigerators at t | |
| thermal flow on the heating and heated side of the heat exchanger at t respectively | |
| gas consumption and the thermal power output of gas fired boiler at t respectively | |
| the cool power output of air-conditioner | |
| the power consumption of air-conditioner | |
| electricity storage at t | |
| charging and discharging power of electricity storage system at t respectively | |
| heat storage at t | |
| charging and discharging thermal power of the thermal storage system at t respectively | |
| heat storage in building | |
| V | air capacity indoor |
| C | air specific heat |
| the air density | |
| cooling loads demand at t | |
| the heat loss through building exterior wall | |
| the heat transfer coefficient | |
| the exterior wall area of the building | |
| the heat loss through building exterior window | |
| heat transfer coefficient of exterior window | |
| the exterior wall area of the building | |
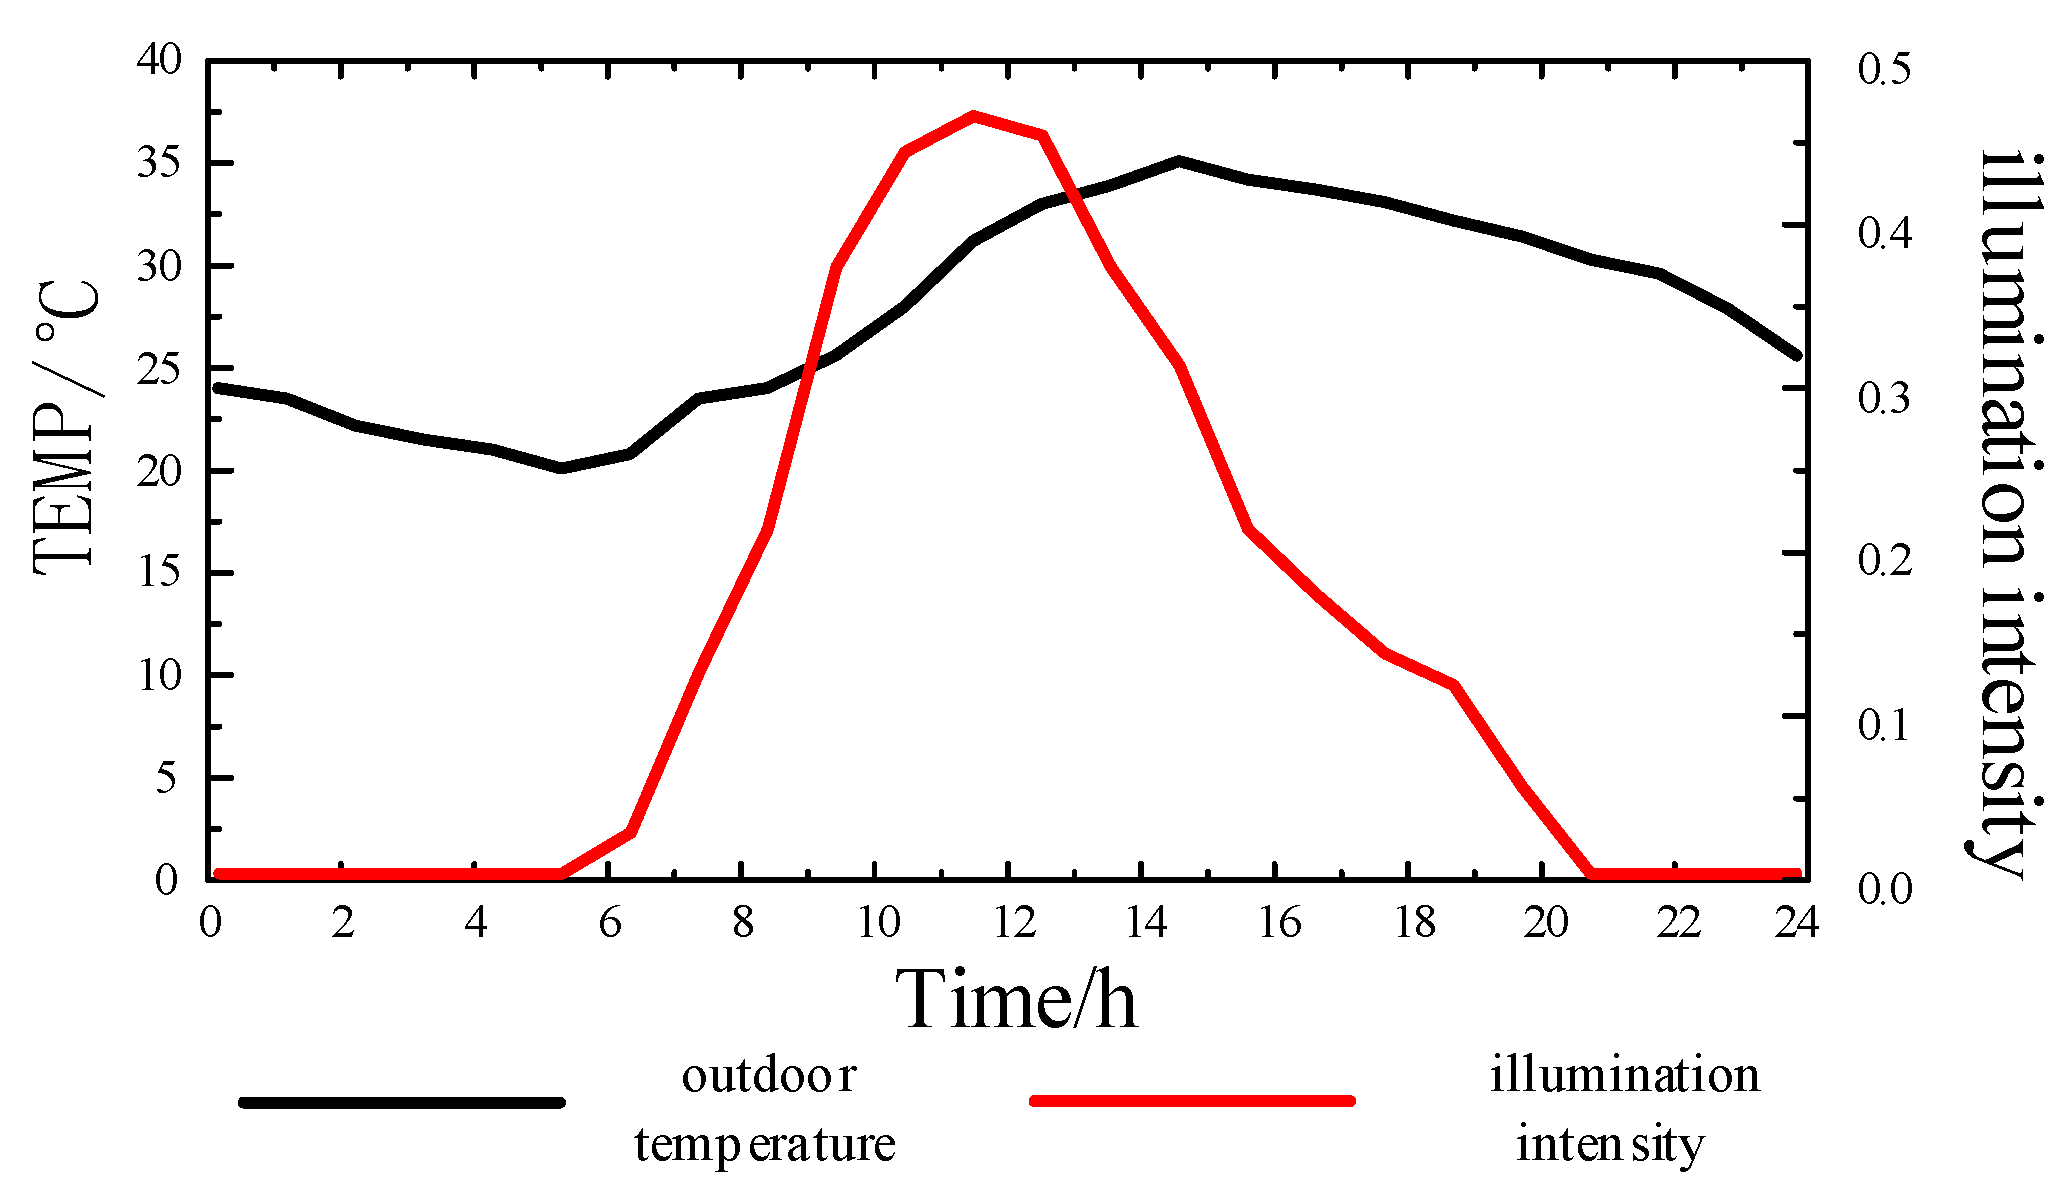
| HS | heat transfer from solar radiation |
| I | solar radiation power |
| SC | the abbreviation of shading coefficient |
| Qin | the power output of indoor heat sources |
| charging time | |
| per 100 km power consumption | |
| charging power | |
| daily mileage | |
| the power load at t | |
| the predicted regular load at t | |
| the discharging loads at t by EVs | |
| the charging loads of EVs at t | |
| the cost of buying gas | |
| the cost of equipment operation | |
| refrigeration income | |
| dealing cost with main power grid | |
| the cost occurred when EVs buy electricity from the main power grid, the cost occurred when EVs sell electricity to the main power grid | |
| the output of photovoltaics | |
| the output of wind turbine generators | |
| electric power purchased from and sold to the power grid | |
| heating load at t | |
| cooling load at t | |
| the maximum and minimum electricity purchased from the main power grid respectively | |
| the maximum and minimum electricity sold to the main power grid respectively | |
| the ramping up rate and the ramping down rate of micro gas turbines respectively | |
| the maximum and minimum output of fired gas boiler respectively | |
| the ramping up rate and the ramping down rate of micro gas turbines respectively | |
| the ramping up rate and the ramping down rate of fired gas boiler respectively | |
| the maximum gas supply of gas source point | |
| the maximum and minimum capacity of electrical energy storage | |
| the maximum and minimum capacity of thermal energy storage | |
| Abbreviations | |
| V2G | vehicle-to-grid |
| EV | electric vehicle |
| BIES | building integrated energy system |
| CCHP | combined cooling heating and power |
| ESD | energy storage device |
| PV | photovoltaic |
| WT | wind turbine |
| GSP | gas source points |
| REG | Renewable energy generator |
| GFB | gas fired boiler |
| EES | electrical energy storage |
| TES | thermal energy storage |
| PG | power grid |
| MT | micro gas turbine |
| WHB | waste heat boiler |
| AR | absorption refrigerator |
| HE | heat exchanger |
| EEM | emergency energy management |
References
- Zeng, S.; Wang, L.; Chen, D.; Li, Y. The integrated operation of multiple energy carrier used to enhance the reliability of the integrated energy system. In Proceedings of the 2017 IEEE Conference on Energy Internet and Energy System Integration, Beijing, China, 26–28 November 2017; pp. 1–5. [Google Scholar]
- Quelhas, A.; Gil, E.; Mccalley, J.D.; Ryan, S.M. A Multiperiod Generalized Network Flow Model of the U.S. Integrated Energy System: Part I—Model Description. IEEE Trans. Power Syst. 2007, 22, 829–836. [Google Scholar] [CrossRef]
- Roy, J.V.; Leemput, N.; Geth, F.; Buscher, J.; Salenbien, R.; Driesen, J. Electric Vehicle Charging in an Office Building Microgrid with Distributed Energy Resources. IEEE Trans. Sustain. Energy 2014, 5, 1389–1396. [Google Scholar]
- Mu, Y.F.; Ji, X.L.; Jia, H.J.; Yu, X.D.; Qi, W.Y. A Fusion Demand-Side Virtual Storage System Building Micro Networks Optimization Method. Proc. CSEE 2017, 37, 581–590. [Google Scholar]
- Guan, X.; Xu, Z.; Jia, Q.S. Energy-Efficient Buildings Facilitated by Microgrid. IEEE Trans. Smart Grid 2010, 1, 243–252. [Google Scholar] [CrossRef]
- Zhao, Y.; Lu, Y.; Yan, C.; Wang, S. MPC-based Optimal Scheduling Of Grid-Connected Low Energy Buildings with Thermal Energy Storages. Energy Build. 2015, 86, 415–426. [Google Scholar] [CrossRef]
- Lu, Y.; Wang, S.; Sun, Y.; Yan, C. Optimal Scheduling Of Buildings with Energy Generation and Thermal Energy Storage under Dynamic Electricity Pricing Using Mixed-Integer Nonlinear Programming. Appl. Energy 2015, 147, 49–58. [Google Scholar] [CrossRef]
- Habash, G.; Chapotchkine, D.; Fisher, P.; Rancourt, A.; Habash, R.; Norris, W. Sustainable Design of a Nearly Zero Energy Building Facilitated by a Smart Microgrid. J. Renew. Energy 2014, 2014. [Google Scholar] [CrossRef]
- Xu, Z.; Jia, Q.S.; Guan, X. Green Building Facilitated By Supply Demand Coordination in Microgrid. IFAC Proc. Vol. 2014, 47, 7671–7677. [Google Scholar] [CrossRef]
- Luo, Z.W.; Hu, Z.C.; Song, Y.H.; Yang, X.; Zhan, K.J.; Wu, J.Y. Study On Plug-In Electric Vehicles Charging Load Calculating. Autom. Electr. Power Syst. 2011, 35, 36–42. [Google Scholar]
- Zhao, X.Y.; Wang, S.; Wu, X.H.; Liu, J. Coordinated Control Strategy Research of MicroGrid Including Distributed Generations and Electric Vehicles. Power Syst. Technol. 2016, 40, 3732–3740. [Google Scholar]
- Lu, L.R.; Wen, F.S.; Xue, Y.S.; Kang, J.J. Plug-In Electricity Market Ancillary Service Regulation Spinning Reserve Charging and Discharging Management Power Systems. Autom. Electr. Power Syst. 2013, 37, 43–49. [Google Scholar]
- Kempton, W.; Tomić, J. Vehicle-To-Grid Power Fundamentals: Calculating Capacity and Net Revenue. J. Power Sources 2005, 144, 268–279. [Google Scholar] [CrossRef]
- Callaway, D.S.; Hiskens, I.A. Achieving Controllability of Electric Loads. Proc. IEEE 2010, 99, 184–199. [Google Scholar] [CrossRef]
- Wu, H.B.; Hou, X.F.; Zhao, B.; Zhu, C.Z. Economical Dispatch of Microgrid Considering Plug-in Electric Vehicles. Autom. Electr. Power Syst. 2014, 38, 77–84. [Google Scholar]
- Zhuang, H.D.; Wu, H.B.; Liu, H.T.; Ji, Y. Multi-Objective Economic Dispatch of Microgrid System Considering Electric Vehicles. Trans. China Electrotech. Soc. 2014, 365–373. [Google Scholar]
- Liang, Z.P.; Chen, H.Y.; Wang, Y.C.; Zhang, C.; Zheng, X.D.; Wan, C.L. Robust Economic Dispatch of Microgrids Containing Electric Vehicles. Power Syst. Technol. 2017, 41, 2647–2656. [Google Scholar]
- Liu, N.; Chen, Q.; Liu, J.; Lu, X.; Li, P.; Lei, J. A Heuristic Operation Strategy for Commercial Building Microgrids Containing EVs and PV System. IEEE Trans. Ind. Electr. 2015, 62, 2560–2570. [Google Scholar] [CrossRef]
- Yang, Z.; Peng, S.C.; Liao, Q.F.; Liu, D.C.; Xu, Y.Y. Zhang, L.M.; Wang, X.T. Ancillary Services Provided by Electric Vehicles for Building Integrated Energy System. Power Syst. Technol. 2017, 41, 2831–2839. [Google Scholar]
- Ahmadian, A.; Sedghi, M.; Mohammadi-Ivatloo, B.; Elkamel, A.; Golkar, M.A.; Fowler, M.W. Cost-Benefit Analysis of V2G Implementation in Distribution Networks Considering PEVs Battery Degradation. IEEE Trans. Sustain. Energy 2018, 9, 961–970. [Google Scholar] [CrossRef]
- Taylor, J.; Maitra, A.; Alexander, M.; Brooks, D.; Duvall, M. Evaluation of the Impact of Plug-In Electric Vehicle Loading on Distribution System Operations. Power Energy Soc. Gen. Meet. 2009, 2009, 1–6. [Google Scholar]
- Vyas, A.; Santini, D. Use of National Surveys for Estimating ‘Full’ PHEV Potential for Oil Use Reduction 2008. Available online: http://www.transportation.anl.gov/pdfs/HV/525.pdf (accessed on 21 July 2008).
- Tian, L.T.; Shi, S.L.; Jia, Z. A Statistical Model for Charging Power Demand of Electric Vehicles. Power Syst. Technol. 2010, 34, 126–130. [Google Scholar]
- Liu, F.; Yang, X.; Shi, S.S.; Zhang, M.X.; Deng, H.; Guo, P.C. Hybrid Energy Storage Scheduling Based Microgrid Energy Optimization Under Different Time Scales. Power Syst. Technol. 2014, 38, 3079–3087. [Google Scholar]
- Chen, L.; Xu, F.; Wang, X.; Min, Y.; Ding, M.; Huang, P. Implementation and Effect of Thermal Storage in Improving Wind Power Accommodation. Proc. CSEE 2015, 35, 4283–4290. [Google Scholar]
- Yu, J.; Tian, L.; Xu, X.; Wang, J. Evaluation on Energy and Thermal Performance for Office Building Envelope in Different Climate Zones of China. Energy Build. 2015, 86, 626–639. [Google Scholar] [CrossRef]
- Chu, Y.; Urquhart, B.; Gohari, S.M.I.; Pedro, H.T.C.; Kleissl, J.; Coimbra, C.F.M. Short-Term Reforecasting of Power Output from a 48 MW Solar PV Plant. Solar Energy 2015, 112, 68–77. [Google Scholar] [CrossRef]
- Yang, G.; Yong-Xian, D.U.; Chen, M. The Calculation of Energy Provided by Wind Turbine Based on Its Power Characteristic and the Wind Frequency Weibull Distribution. J. Electr. Power 2008, 23, 276–300. [Google Scholar]
- Wang, C.S.; Hong, B.W.; Guo, L.; Zhang, D.J.; Liu, W.J. A General Modeling Method for Optimal Dispatch of Combined Cooling, Heating and Power Microgrid. Proc. CSEE 2013, 33, 26–33. [Google Scholar]


| PAPER | PROS | CONS |
|---|---|---|
| [4] | - Virtual energy storage reduces the operational cost of the BIES | - Room temperature is set as a constant instead of being time-variant. |
| [5] | - Take into account the impact of different equipment on the operational cost of the BIES | - Cooling load is not considered - No detailed discussion on equipment |
| [6,7] | - Improve the optimization method of micro-grid | - Cooling load is not considered |
| [8] | - propose the framework of NZEB | - Lack of study case |
| [9] | - Take into account the factor of comfort when optimizing the BIES - Take room temperature as a factor | - The fact that human beings are heat sources is not considered. |
| [15,16] | - Impact of charging and discharging of EVs on micro-grid | - Cooling and heating load are not considered, only electric load is considered. |
| [17] | - Impact of loss caused by V2G on the operational cost of micro-grid | - Cooling and heating load are not considered, only electric load is considered. |
| [18] | - Propose a method of EV charging to reduce the operational cost of micro-grid - Improve PV acceptance rate | - Cooling and heating load are not considered - V2G is not considered |
| [19] | - Propose a scheme of service aimed at EVs in the BIES | - Lack of discussions on EVs which play the role as movable energy storage devices. |
| Parm | kwall/(W/(m2k)) | Fwall | kwin/(W/(m2k)) | Fwin/m2 |
|---|---|---|---|---|
| Value | 1.092 | 6000 | 2.800 | 1350 |
| Type | Parm | Definitions | Value |
|---|---|---|---|
| CCHP | conversion efficiency of micro gas turbine | 0.3 | |
| heat loss rate of waste heat boilers | 0.15 | ||
| coefficient of performance of absorption refrigerators | 1.2 | ||
| heat efficiency of the heat exchanger | 0.9 | ||
| cost of CCHP operation (RMB/kWh) | 0.3 | ||
| cost of absorption refrigerator operation (RMB/kWh) | 0.025 | ||
| cost of heat exchanger operation (RMB/kWh) | 0.01 | ||
| FGB | thermal conversion efficiency of gas fired boiler | 0.92 | |
| cost of gas fired boiler operation (RMB/kWh) | 0.01 | ||
| AC | refrigeration energy efficiency ratio | 4 | |
| cost of air-conditioner operation (RMB/kWh) | 0.01 | ||
| EES | charging electric efficiency | 0.95 | |
| discharging electric efficiency | 0.95 | ||
| initial value of electrical energy storage at time at 0 (kWh) | 30 | ||
| cost of electrical energy storage operation (RMB/kWh) | 0.0018 | ||
| TES | charging heat efficiency | 0.9 | |
| discharging heat efficiency | 0.9 | ||
| initial value of thermal energy storage at time at 0 (kWh) | 0 | ||
| cost of thermal energy storage operation (RMB/kWh) | 0.0016 | ||
| REG | cost of photovoltaic system operation (RMB/kWh) | 0.08 | |
| cost of wind turbine generator operation (RMB/kWh) | 0.11 |
| Parameter | Probability Density Function | Domain of Definition |
|---|---|---|
| EVs entry time | t~N (8, 1.0) | (0, 24) |
| EVs exit time | t~N (19.5, 1.0) | (0, 24) |
| Initial SOC | t~N (0.5, 0.4) | (0.2, 0.95) |
| Cost | Mode 1 | Mode 2 | Mode 3 | Mode 4 |
|---|---|---|---|---|
| Operation | 2398.196 | 2399.068 | 2390.15 | 2392.882 |
| Dealing | 3272.766 | 3086.833 | 2956.082 | 2769.724 |
| Gas | 2353.17 | 2363.125 | 2340.715 | 2369.805 |
| Refrigeration | −2871.27 | −2863.18 | −3136.02 | −3149.69 |
| Staff-owned EVs | −52.0142 | 34.7657 | −52.0142 | 28.6428 |
| Resident-owned EVs | −105.05 | −105.05 | 156.1353 | 156.1353 |
| Total | 4995.801 | 4915.566 | 4655.054 | 4567.497 |
© 2018 by the authors. Licensee MDPI, Basel, Switzerland. This article is an open access article distributed under the terms and conditions of the Creative Commons Attribution (CC BY) license (http://creativecommons.org/licenses/by/4.0/).
Share and Cite
Wang, Z.; Tang, Y.; Chen, X.; Men, X.; Cao, J.; Wang, H. Optimized Daily Dispatching Strategy of Building- Integrated Energy Systems Considering Vehicle to Grid Technology and Room Temperature Control. Energies 2018, 11, 1287. https://doi.org/10.3390/en11051287
Wang Z, Tang Y, Chen X, Men X, Cao J, Wang H. Optimized Daily Dispatching Strategy of Building- Integrated Energy Systems Considering Vehicle to Grid Technology and Room Temperature Control. Energies. 2018; 11(5):1287. https://doi.org/10.3390/en11051287
Chicago/Turabian StyleWang, Zesen, Yanmei Tang, Xiao Chen, Xiangyang Men, Jun Cao, and Haifeng Wang. 2018. "Optimized Daily Dispatching Strategy of Building- Integrated Energy Systems Considering Vehicle to Grid Technology and Room Temperature Control" Energies 11, no. 5: 1287. https://doi.org/10.3390/en11051287