Article

Study on Fuel Distribution of Wall-Impinging Diesel Spray under Different Wall Temperatures by Laser-Induced Exciplex Fluorescence (LIEF)

State Key Laboratory of Engines, Tianjin University, Tianjin 300072, China
*
Author to whom correspondence should be addressed.
Energies 2018, 11(5), 1249; https://doi.org/10.3390/en11051249
Submission received: 9 April 2018 / Revised: 25 April 2018 / Accepted: 26 April 2018 / Published: 14 May 2018

Abstract

:
Spray wall-impingement has large effects on the pollutant emissions and thermal efficiency of engines. Different wall temperatures can affect the gas–liquid phase transition of the spray, and the temperature gradient from the ambient to the wall will cause a different mixture process in the region nearby the wall. However, there are few studies on spray wall-impingement with different wall temperatures, particularly on the liquid–gas phase transition of the spray. Therefore, in this paper, the effects of different wall temperatures on spray-impingement have been investigated in a high-temperature, high-pressure constant volume combustion vessel. Cooling equipment was used to adjust the temperature difference between the wall and the ambient gas. n-Dodecane was chosen as the diesel surrogate to study the spray process. The spray wall-impingement was tested by changing the injection pressures (Pi) and wall temperatures (Tw). The ambient temperature (Ta) and ambient pressure (Pa) were kept constant at 773 K and 4 MPa, and the distance (L) between wall and injector was set to 35 mm to mimic the radius of the combustion chamber in heavy-duty diesel engines. A laser-induced exciplex fluorescence (LIEF) technique was used to probe the vapor and liquid phases of the injected fuel. Results show that the liquid phases of the spray do not reach the wall except in the condition of low wall temperature and high injection pressure. The liquid penetration develops and then becomes constant after 1 ms from the start of injection. With the increase of injection pressures (600–1600 bar), the liquid concentration of the spray decreases; however the liquid penetration decreases insignificantly. The wall temperature and the injection pressure have little influence on the liquid interpenetration process. For the vapor phase of the spray, the high concentration regions (equivalence ratio (φ) > 1) mainly distribute in the area of 10 mm away from the impact point on the wall. With the decrease of wall temperatures, the high-concentration regions are enlarged at the near wall regions. However, at the injection pressure of 1600 bar, the influence of wall temperatures on the equivalence ratio is small. The decreasing wall temperature deteriorates the mixing process of the fuel and ambient gas, but the effect is weakened with the increase of injection pressure.

1. Introduction

Spray wall-impingement is hard to avoid and may lead to the formation of soot, unburned hydrocarbons (UHC) and carbon monoxide (CO) in small-bore engines [1,2,3]. In recent years, in order to improve thermal efficiency and reduce pollution, new advanced combustion technologies have been adopted in engines like HCCI (homogeneous charge combustion ignition), PPC (partially premixed combustion) and LTC (low-temperature combustion) [4,5,6,7,8]. Among these new technologies, earlier fuel injection timing is one of the most important measures to accomplish these advanced combustion processes. However, as fuel is injected into a low-pressure and low-temperature chamber at the earlier injection timing condition, spray impingement becomes a common phenomenon and may increase the pollution emissions in all the direct injection engines. Miles et al. [9,10] found that incomplete combustion products near the wall region were prevented from moving to the center of the cylinder by the gas flow, which increased the UHC and CO emissions and reduced engine efficiency. Liu et al. [11] found that with the increase of the ignition delay, the soot emission was not reduced linearly but first increased and then declined. The increase of soot emissions in Ref. [9] is also derived from the spray wall-impingement. Therefore, spray wall-impingement has large effects on the pollutant emissions and thermal efficiency in engines.
The mechanism of spray wall-impingement has been investigated in many years. Arai et al. [12,13,14,15,16] had conducted a series experiments of diesel spray wall-impingement under non-evaporation conditions in a constant volume vessel. This showed that the quality of fuel adhered to the wall decreased with the increase of injection pressure, ambient pressure, Weber’s number and the distance between the wall and spray tip. Katsura et al. [17] proposed experimental equations of the radius and height of the impinging spray as functions of injection pressure, distance between wall and nozzle, etc. Li et al. [18] have studied the effects of different distances of wall-impingement on diesel spray flame characteristics and found that the reactive intensity was improved by increasing impinging distance. Senda et al. [19], Bruneaux [20] and Zhang et al. [21] studied the mixture concentration under spray wall-impingement conditions. They found that there was a low mixture concentration near the spray tip region. Even if the spray wall-impingement has been widely studied, the mechanism of spray wall-impingement still provokes argument. On one hand, spray wall-impingement leads to a better atomization compared with free spray, especially in the secondary collision process [22]. On the other hand, spray wall-impingement results in a higher concentration region near wall surfaces [23,24,25,26]. Therefore, for a better understanding the mechanism of spray wall-impingement, more research needs to be conducted.
To investigate the process of spray wall-impingement, wall temperature is one of main factors that affect the spray and combustion process. Different wall temperatures may lead to different spray wall-impingement processes. For example, Li et al. [18,27] concluded that spray-wall interaction deteriorated the combustion significantly in comparison with the free spray flames, and thus led to higher UHC and soot emissions. Conversely, Pickett and Lopez [28] found that soot emissions were obviously reduced as compared to a free spray flame. For these results, it can be found the wall temperature of Pickett’s work was lower than the ambient, while in other researchers’ studies, the wall temperature was kept the same as the ambient temperature. Different wall temperatures can affect the gas–liquid phase transition of the spray. The temperature gradient from the ambient to the wall will cause a different mixture process in the region near the wall. However, there are few studies on spray wall-impingement with different wall temperatures, especially in the liquid–gas phase transition of the spray.
Therefore, in this paper, the effects of different wall temperatures on spray-impingement have been investigated in a high-temperature, high-pressure constant volume combustion vessel. The main aims are to clarify the influence of wall temperatures on the gas–liquid phase transition of the spray and the mixture process near the wall regions. Both gas and liquid phases of spray were measured by using the laser-induced exciplex fluorescence (LIEF) method. In parallel, the influence of different injection pressures was also detected to account for the spray wall-impingement. These experiments will enable the mechanism of spray wall-impingement to be better understood and will provide a relevant basis for the development of the model of spray wall-impingement.

2. Experimental Apparatus and Method

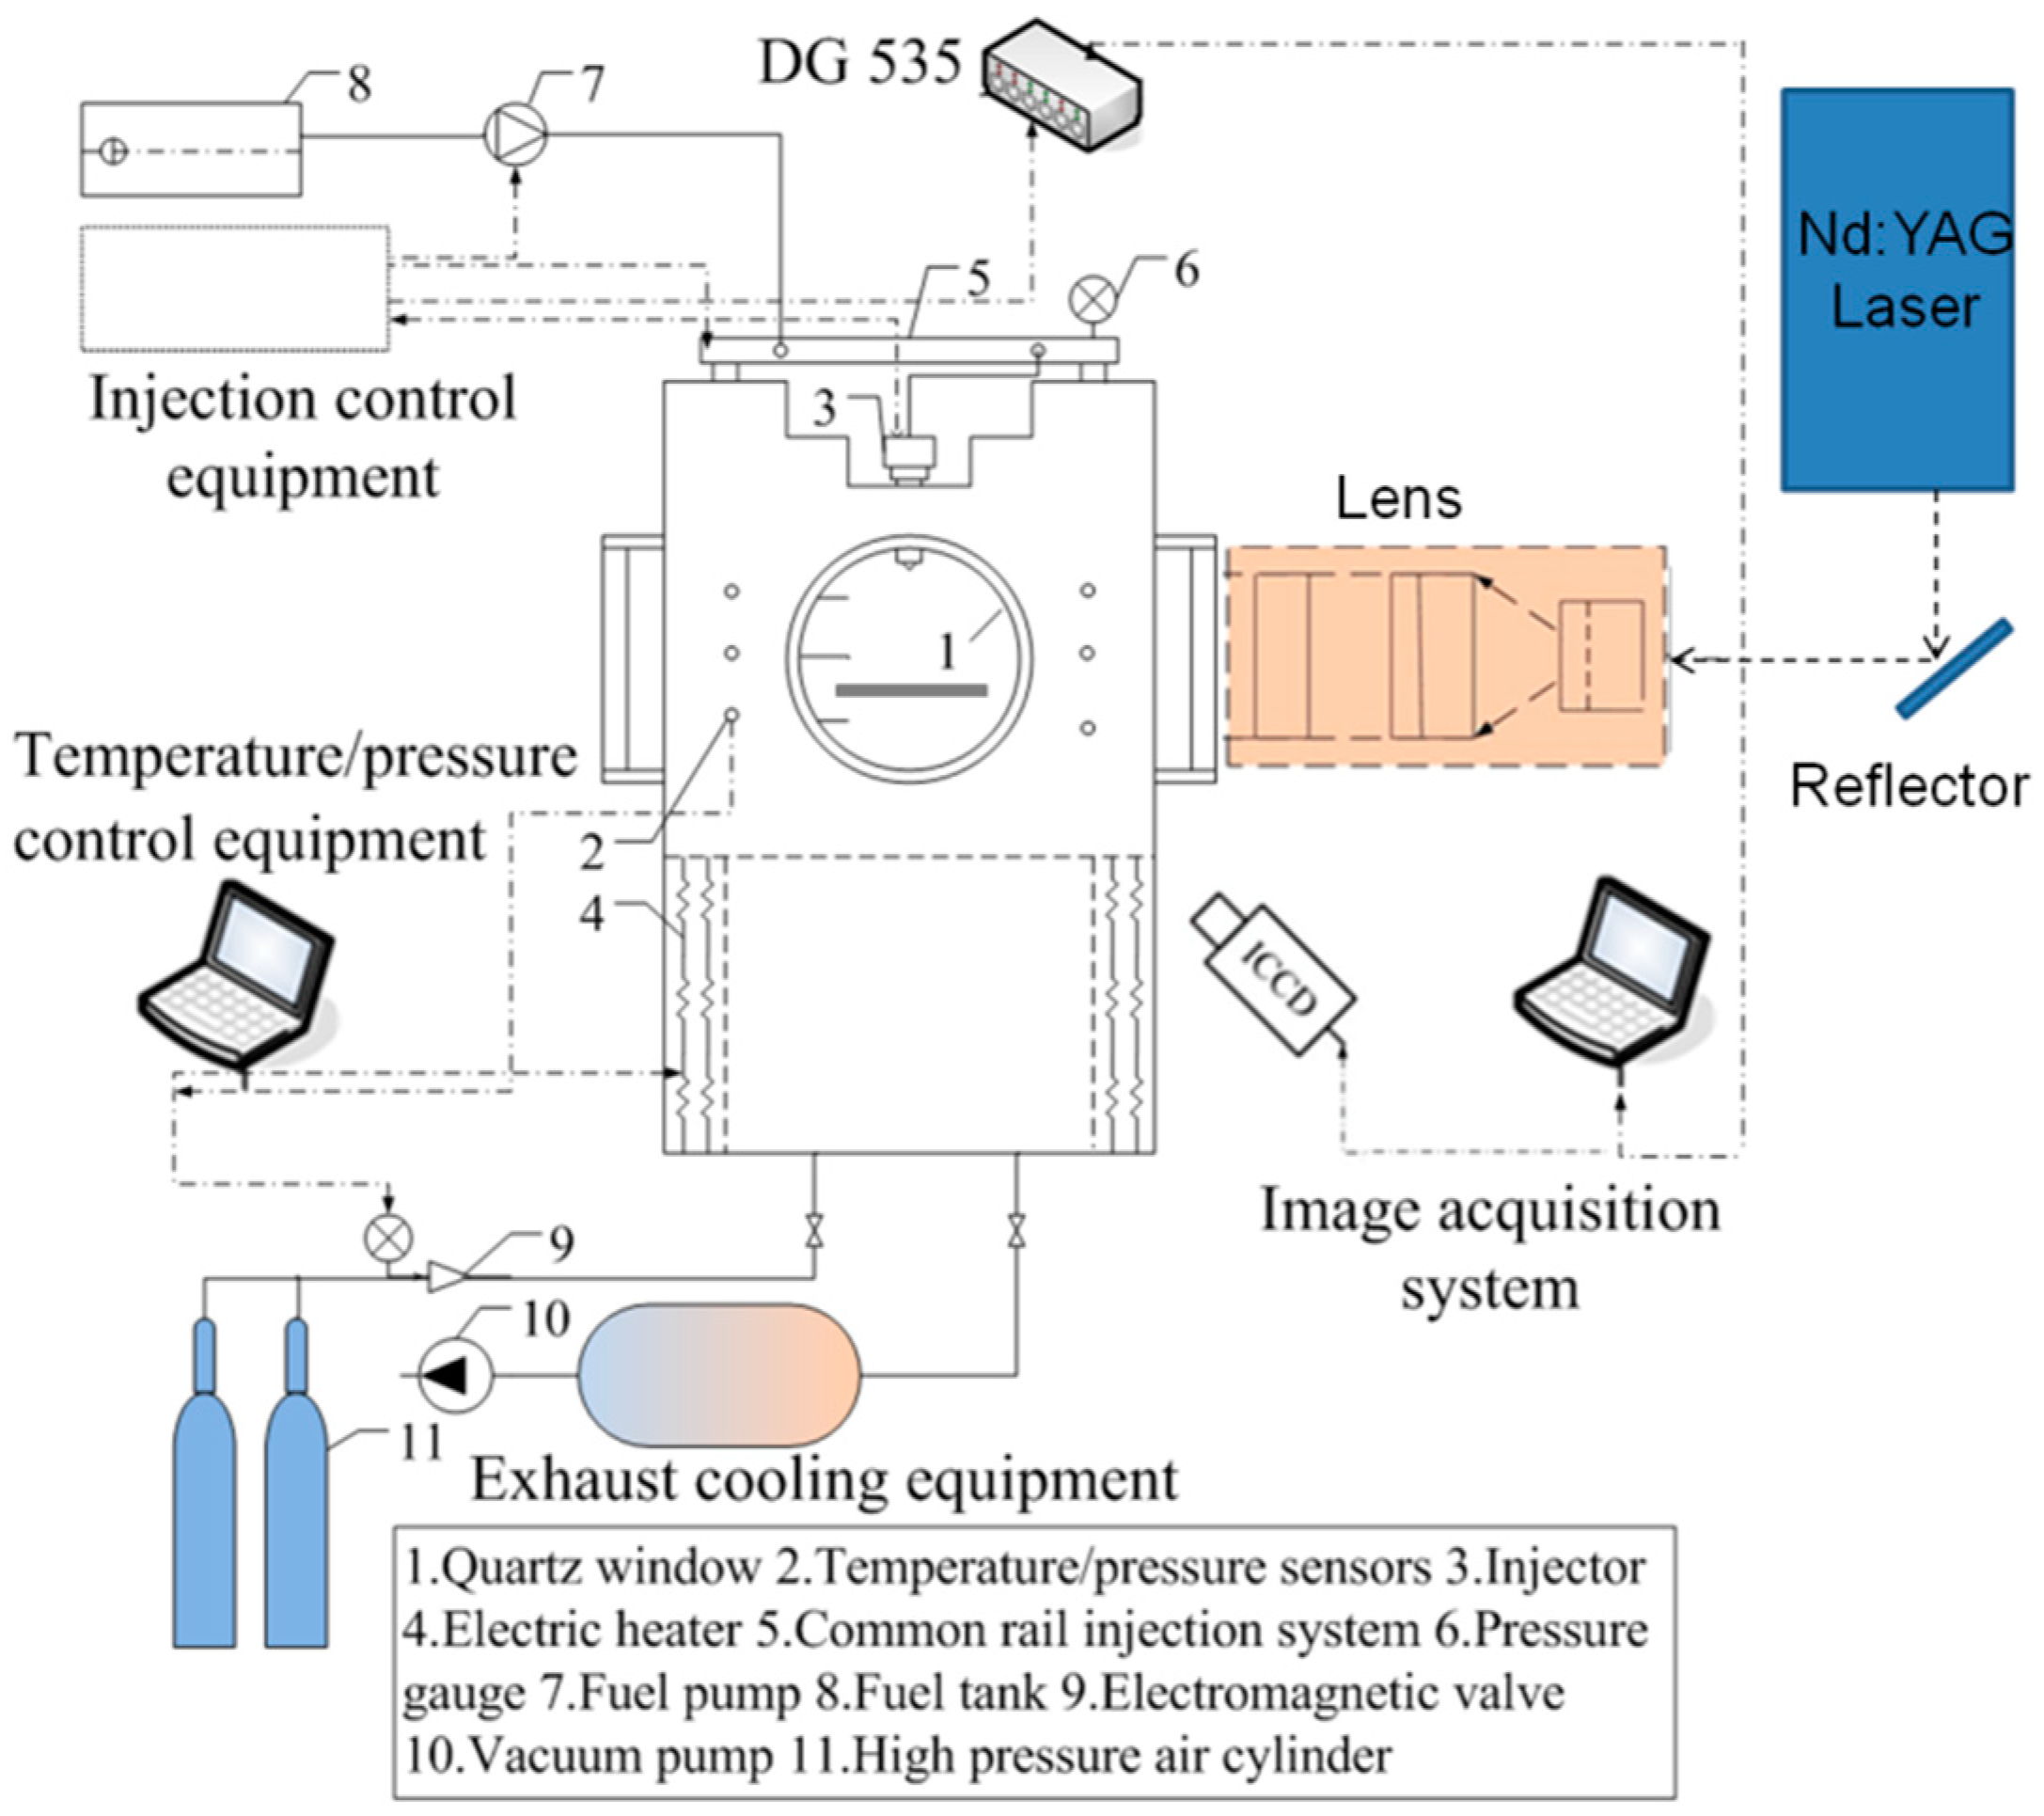
2.1. Experimental Apparatus

Figure 1 presents the high-temperature, high-pressure constant volume combustion vessel and the laser measurement setup. Four transparent windows were installed at the four sides of the combustion vessel, respectively. The effective diameter of the windows was 100 mm to provide the optical measurements on the spray development process. The ambient temperatures were detected in different places inside the vessel to explore the temperature homogeneity before the experiment. The maximum error of the temperature was 20 K, which appears at the ambient temperature of 850 K. The injector was a single-hole type and installed in the center of the top lid of the combustion vessel. The nozzle diameter was 0.14 mm. A common Bosch rail injection system was used to supply constant pressure to the injector. The maximum pressure can be set up to 1800 bar which can meet the demand of modern diesel engines. An injection controller (EC94821ZZ, Changzhou automotive electronic systems Co., Ltd., Changzhou, China) was used to control the injection timing and injection mass. For measuring the spray wall-impingement, a flat wall was perpendicular to the injector axis and was located 35 mm away from the injector tip to mimic the size of the combustion chamber in heavy-duty diesel engines. Four thermocouples were applied to measure the wall temperature at different places. The tips of the thermocouples were put into the hole of the flat wall and sealed to prevent effects caused by the ambient temperature. The detected location was 2 mm under the upper surface of the wall to make the detected temperature as close to the actual surface wall temperature as possible. The temperature homogeneity of the wall surface was also tested before the experiments and showed a good uniformity. Cooling equipment was used to control the wall temperature steadily from 330 K (at 773 K ambient temperature) to 773 K (without cooling water).
To detect the vapor and liquid phase of the spray, a Nd:YAG laser (Pro 250 Spectra Physics, Santa Clara, CA, USA) was used to offer a 355 nm laser sheet by LIEF. The laser had a pulse repetition rate of 10 Hz and pulse duration of 8 ns. A laser sheet about 50 mm in height and 0.5 mm in thickness was formed with an appropriate lens assembly, and then passed through the axis of the spray. The energy of the laser was set as 100 mJ. An intensified charge-coupled device (ICCD, DH734i-18F-03, 1024 × 1024 pixels, Andor, Belfast, Northern Ireland) equipped with an image doubler (VZ10-0274, LaVision, Göttingen, Germany) was used to acquire images for simultaneous measurements of both the vapor and liquid phases by LIEF. The delay time of the ICCD with respect to the laser pulse was 20 ns for LIEF to suppress the interference of the laser. The gate width of the ICCD was 20 ns for the LIEF method.

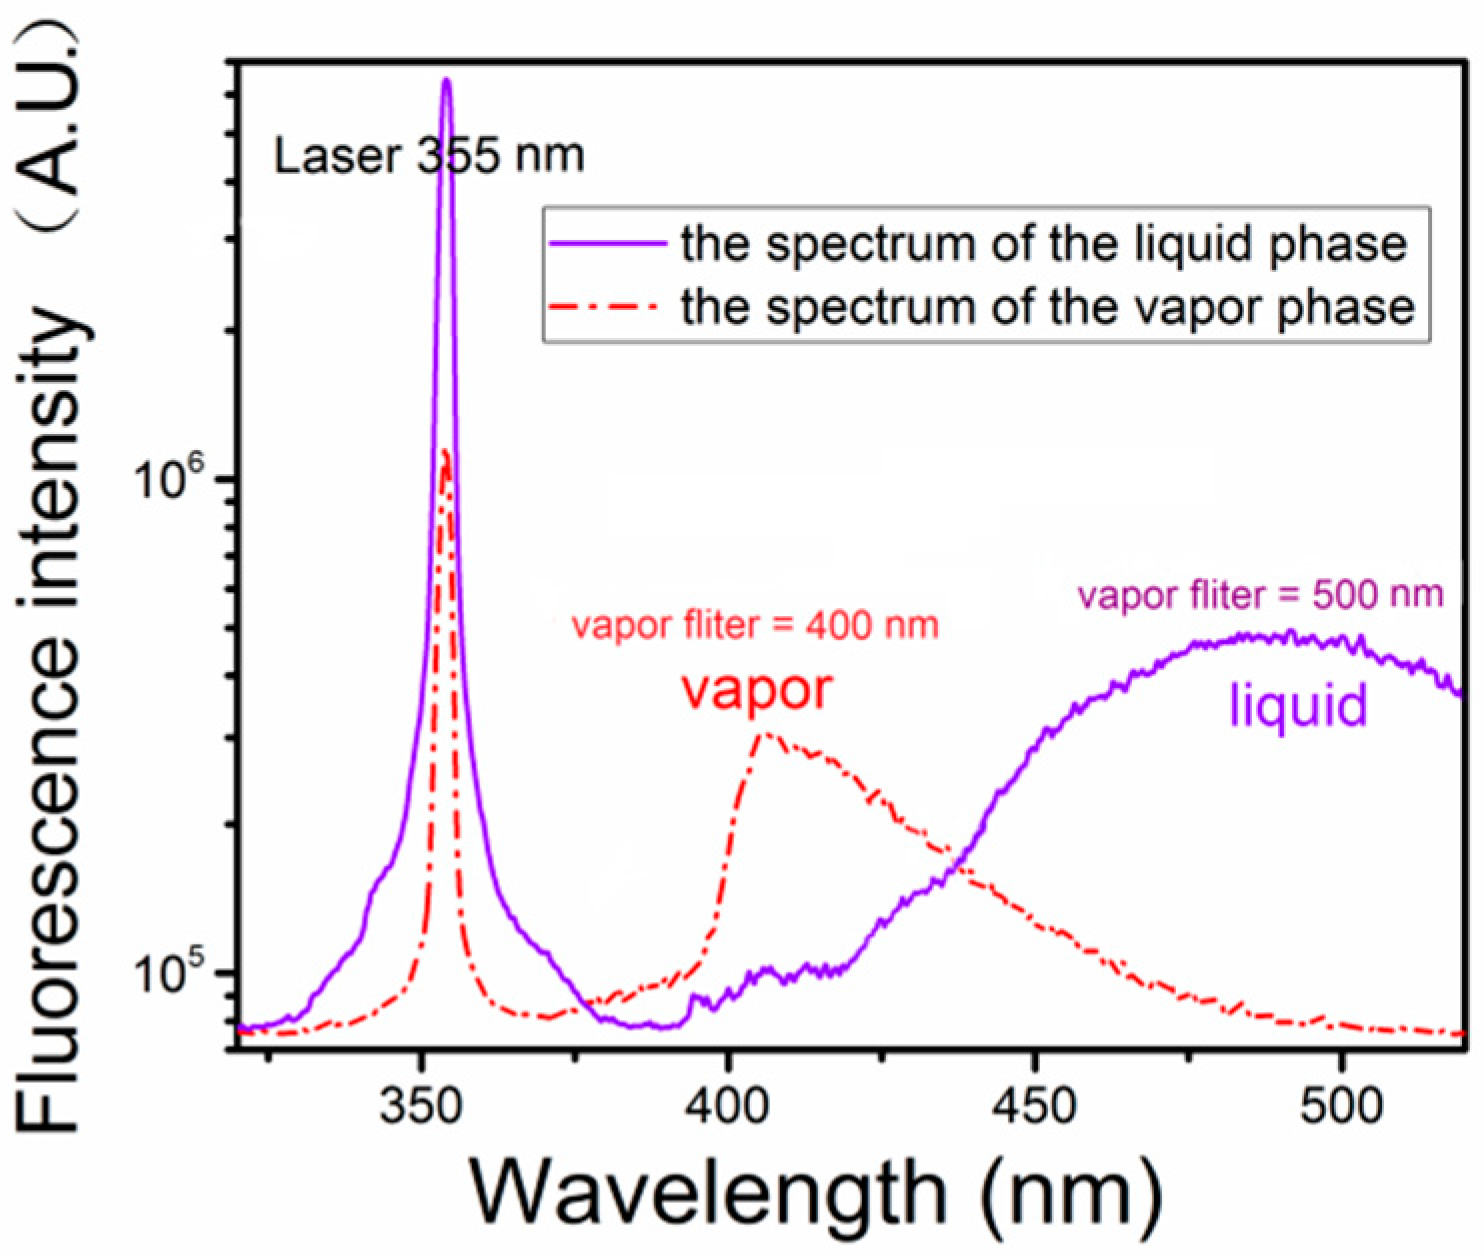
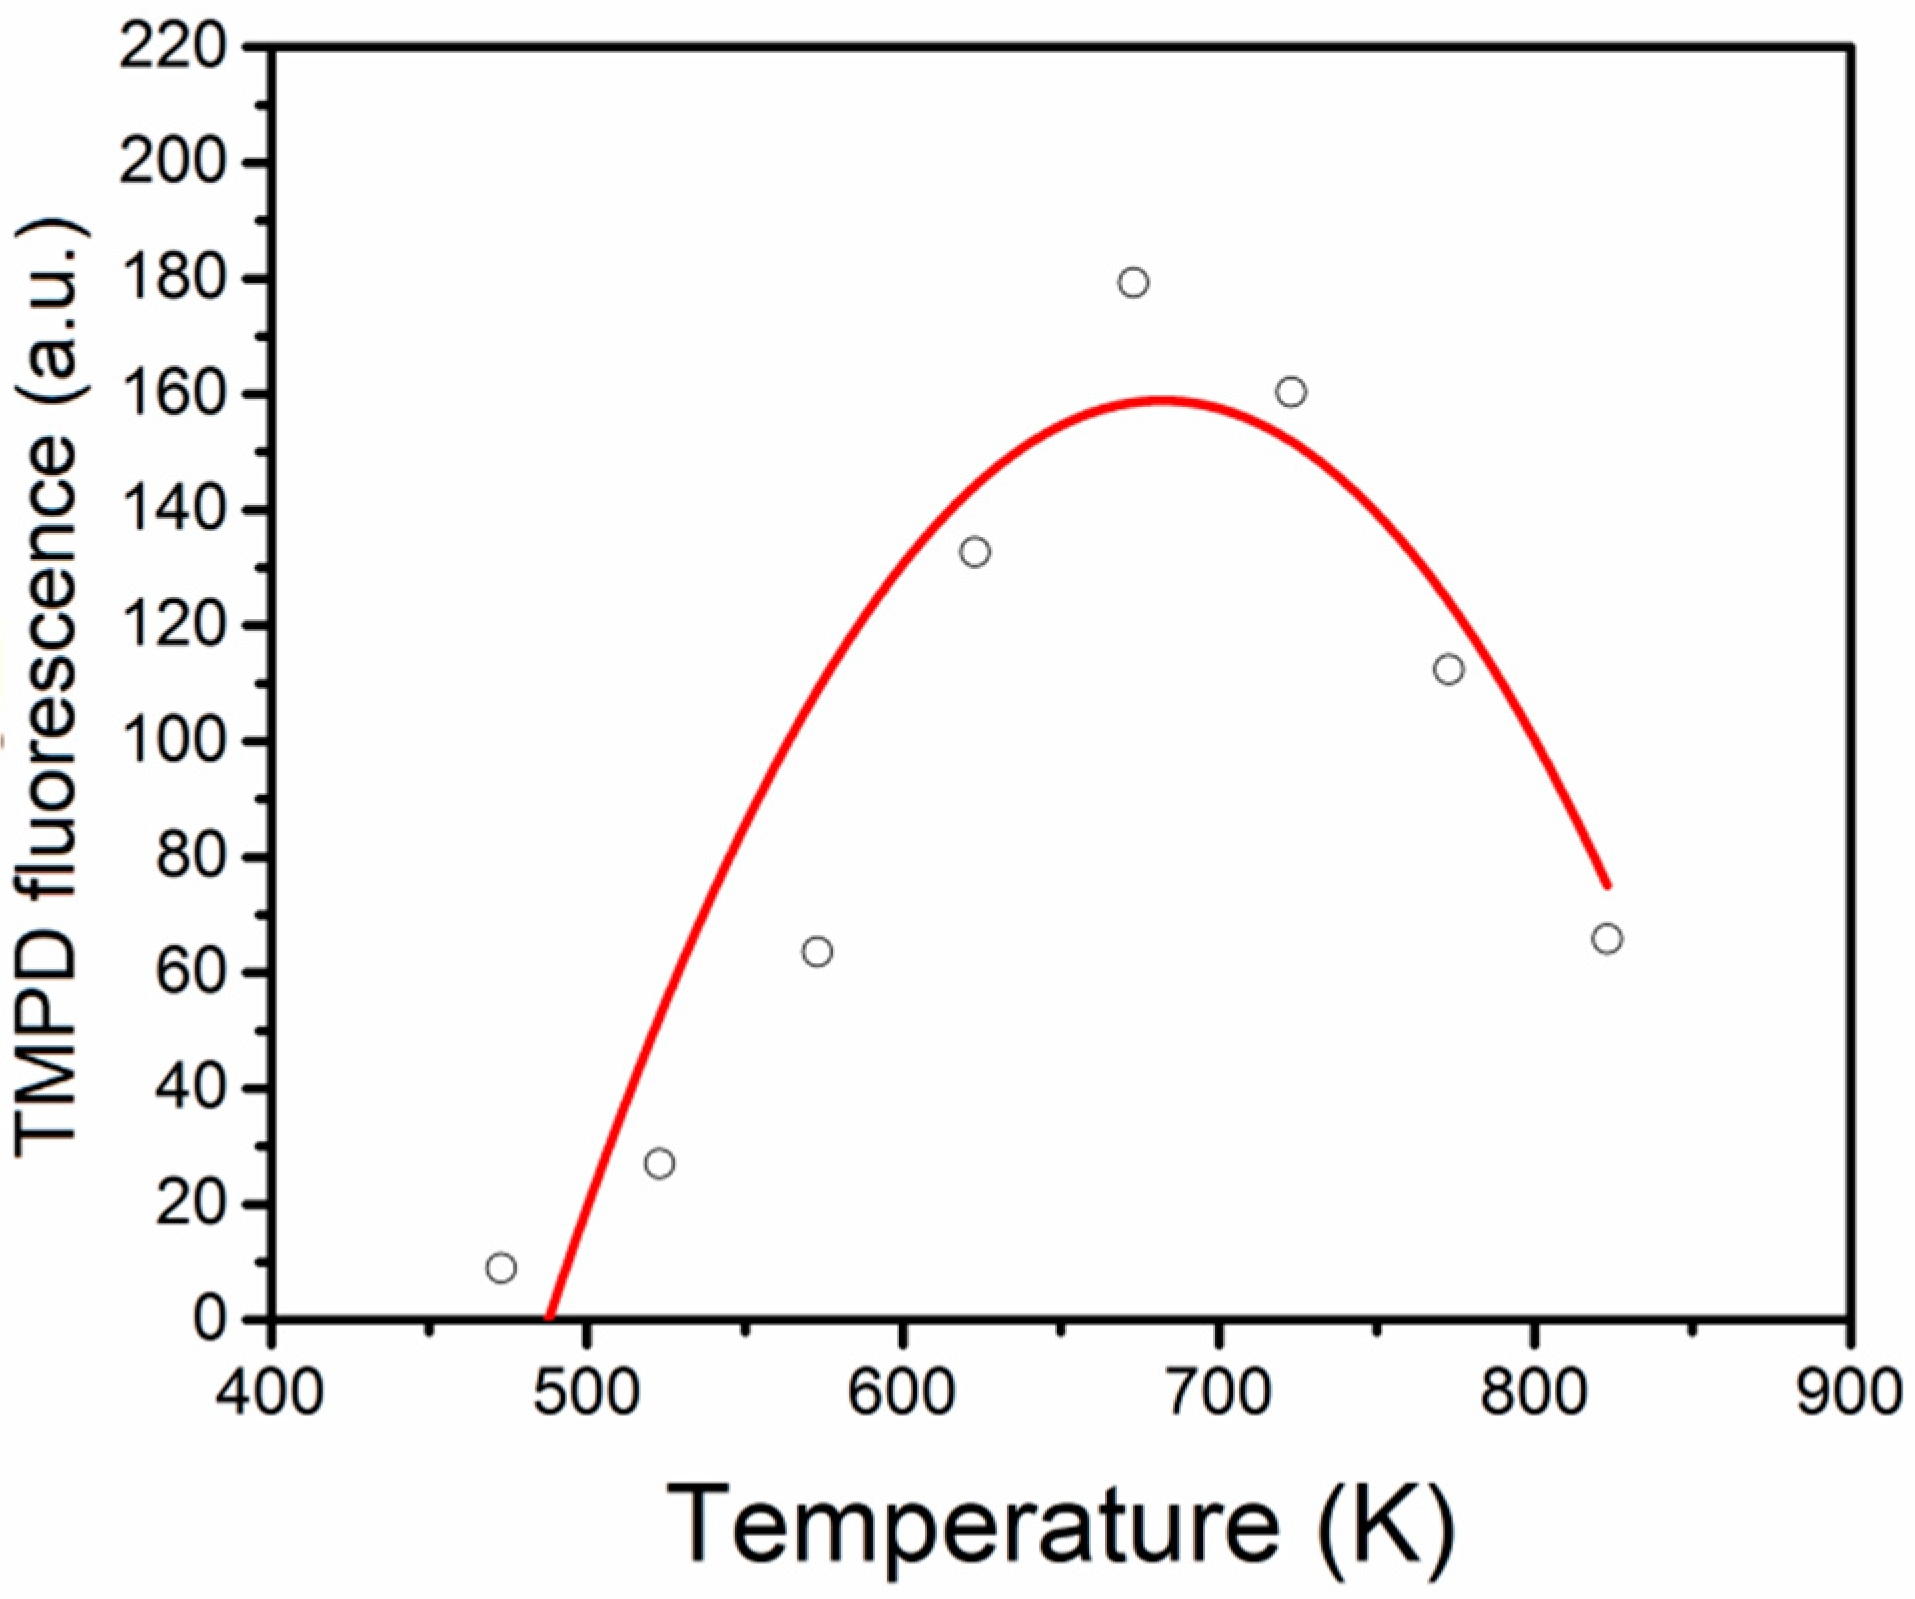
2.2. Experimental Method

For detecting the concentration of fuel, laser-induced fluorescence (LIF) is always used as an effective method to visualize the concentration of fuel itself or the fluorescence dopant [29]. However, it is not possible to separate the spectra of fluorescence for both the liquid and vapor phases. To overcome this problem, Melton and Verdieck [30,31] developed the LIEF method and simultaneously measured both vapor and liquid phases. In the LIEF method, a fluorescence molecule reacts in an excited state, M*, with another molecule, G, to form a second fluorescent species (M−G)*. The emission from the species (M–G)* is red-shifted with respect to that of M*. As (M−G)* hardly exists in the vapor phase because of the low density, the fluorescence of M* can be regarded as the vapor concentration. Similarly, M* combines the molecule G to form (M–G)* in the liquid phase; the fluorescence of (M–G)* can represent the liquid concentration.
In this paper, both 2,3,5,6-tetramethyl-1,4-phenylenediamine (TMPD) and naphthalene were chosen as the fluorescence tracer. TMPD was regarded as M* and dominated the vapor phase, while TMPD-naphthalene was regarded as (M–G)* and dominated the liquid phase. n-Dodecane was chosen as the surrogate of diesel fuel. The mass ratio and properties of these two fuel-tracers were shown in Table 1 [32,33,34,35,36].
The spectra of vapor and liquid phases were detected by using a spectrograph (Bruker 250is, Billerica, MA). For detecting the different phase, mixed fuel was added into a cuvette which was used to detect the vapor spectrograph when heated up to boiling point with a liquid spectrograph at room temperature. To obtain a wider wavelength range to present both vapor and liquid, a 150 lines/mm grating with a spectral resolution of 3 nm was used. The results are shown in Figure 2. It was found that the peak of the vapor phase was near 400 nm and the peak of the liquid phase was near 500 nm. An overlap area existed between the spectra from 400 to 450 nm. To reduce the interference of the overlap, two filters were chosen at 400 nm with a Semrock filter FF01-390/18-25 for receiving the vapor fluorescence, and at 500 nm with a Newport filter 485/20 for receiving the liquid fluorescence. As two filters have been used in the experiments, the error caused by the overlap can be neglected.
For quantifying the LIEF signal, some problems need to be solved such as the temperature dependant, oxygen quenching, and stray light from the laser [29]. Oxygen quenching can be minimized by performing experiments in a nitrogen atmosphere. The interference of other light can be solved by adding filters and setting a delay time for the ICCD. Finally, for calibrating the temperature dependant, the fluorescence intensity was detected at a known concentration of vapor phase in the vessel with different temperatures. A parameter Kv was used to represent the relationship between fluorescence intensity, and gas-phase fuel concentration can be calculated through Equation (1) [37,38].
I v = K v ρ v
where Iv is the fluorescence intensity of vapor phase, and ρv is the concentration of vapor.
Figure 3 shows the calibration curve of the relationship between the temperature and fluorescence intensity. It can be seen that the fluorescence intensity firstly increases with the increases of the temperature. The maximum fluorescence intensity appears at 680 K and then the fluorescence intensity decreases as the temperature increases further.
As the temperature dependant of the LIEF signal is obtained by the calibration method, the next step is to obtain the temperature profile of the spray. The temperature of the spray is not uniform due to the phase transition. So, to acquire a better temperature profile, the local temperature should be calibrated. As the physical properties of the components are similar, the saturated temperature and evaporation rate are supposed to be the same, and the process of evaporation can be completed instantaneously. Then, it can be ascertained that the reduction of heat energy in the vapor phase is equal to the increment of heat energy evaporated from the liquid phase in a pixel. The detailed equation is shown in Equation (2):
T m T a m b C p , a d T = F v A [ T f , i T v C p , l d T + h v , T V + T v T m C p , v d T ]
where Tamb is the average temperature in the vessel; Tm is average temperature in a pixel (local temperature); p is ambient pressure in the vessel; Cp,a is the specific heat capacity at constant pressure in a pixel; Fv and A are the amount of gas, respectively, from the fuel and ambient; Tv is the saturation temperature of the fuel; Tf is fuel temperature; Cp,l is the specific heat capacity at constant pressure of the liquid fuel; and hv,Tv is the latent heat of vaporization of the fuel in the saturation temperature.
The amount of fuel and ambient gas in the pixel can be calculated by Equations (3) and (4):
F v = I v K v , T m × L p i x 2 × L 1 × 10 6
A = ( p 8.314 × T m I v K v , T m ) × L p i x 2 × L 1 × 10 6
where Iv can be loaded from the fluorescence image of vapor; Lpix is the actual size of a pixel, which is 0.31 mm in this paper; L1 is the thickness of the laser sheet, which is 0.5 mm in this paper. Kv,Tm can be calculated from the table of the saturation temperature.
Simultaneous to the Equations (2)–(4), the local temperature Tm can be calculated by an iteration method [29].
Through the acquired local temperature, the vapor concentration can be calculated accurately. Then, as fuel-injection quantity and vapor concentration is known, the liquid concentration can be calculated from the fluorescence image of a liquid by assuming the relationship between the liquid concentration and fluorescence intensity is linear [39].

3. Experimental Conditions

The experimental conditions are shown in Table 2. The ambient gas in the constant volume vessel was compressed nitrogen. The ambient temperature and pressure were set to 773 K and 4 MPa, respectively, to mimic the actual spray conditions in diesel engines. The injection pressures were set at 600, 1000 and 1600 bar to explore the difference of spray at different injection pressures. The wall temperatures were set at 333 K, 473 K and 773 K to investigate the effect of different wall temperatures on the spray. The impingement distance was fixed at 35 mm. The measurements of LIEF were conducted at least 10 times under each condition to obtain a repeatable result.

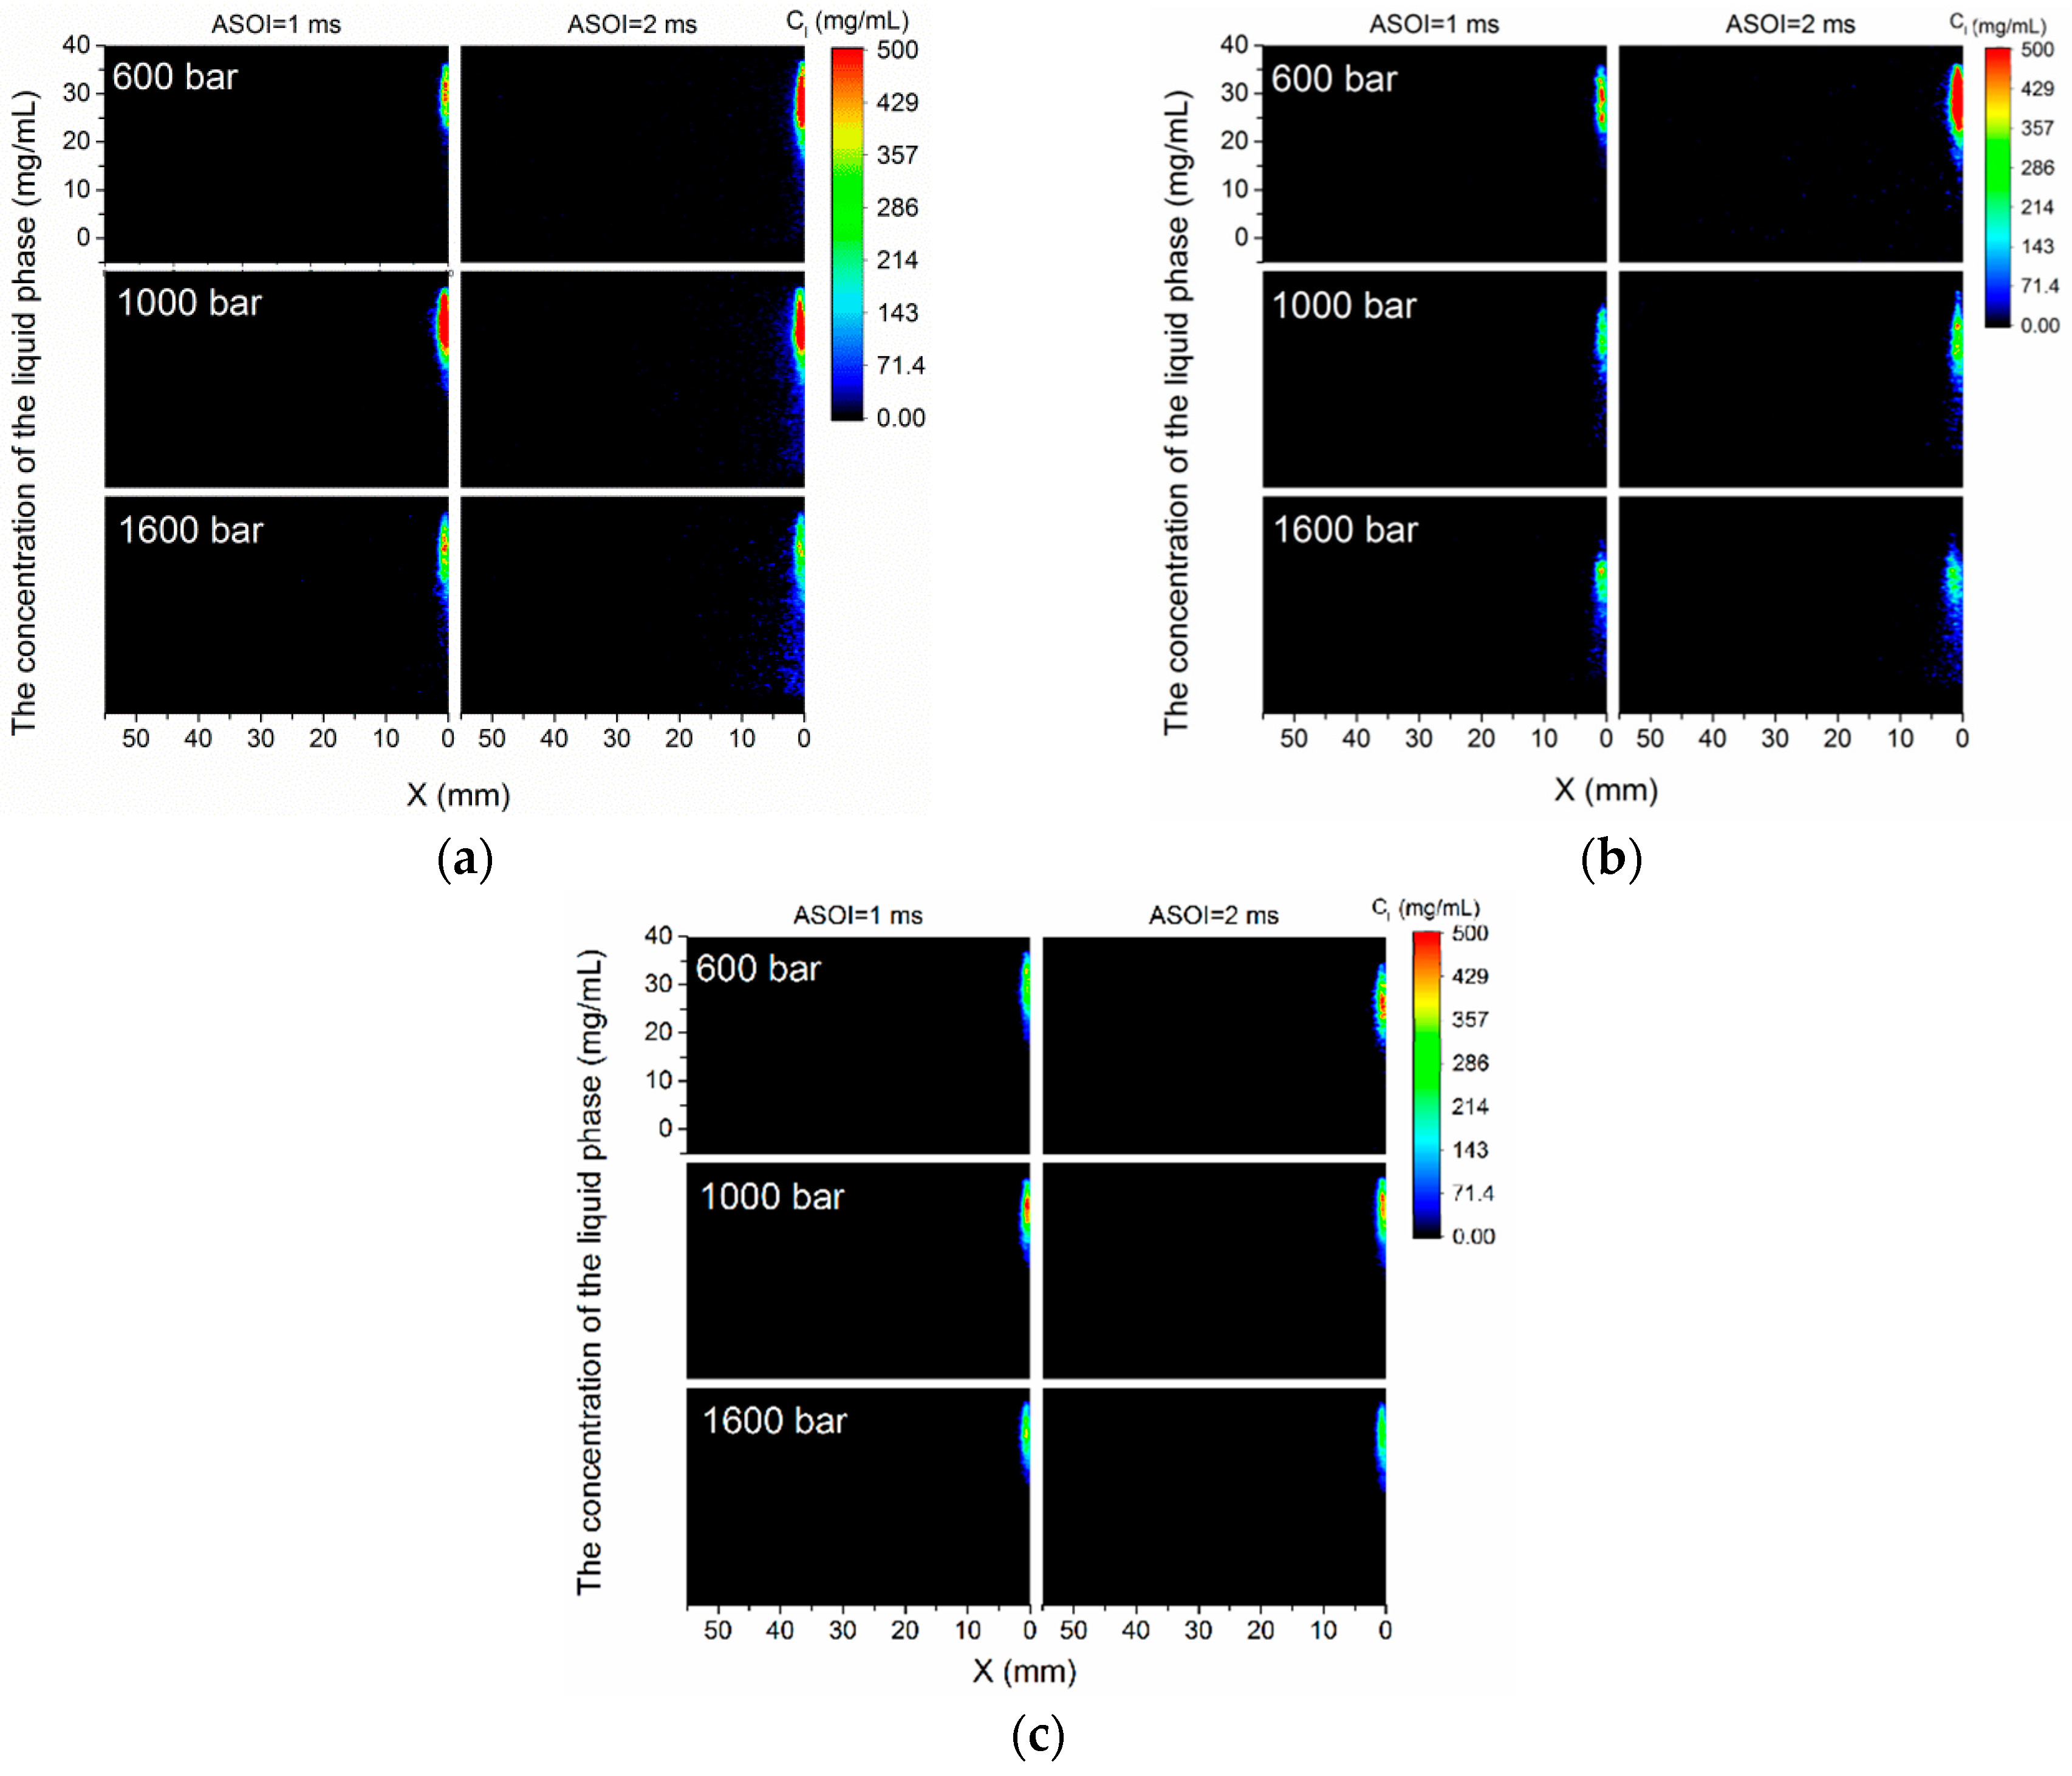
4. Results and Discussion

The concentrations in vapor or liquid phases of the impingement spray (named as Cv or Cl) are discussed in this section. The images of the vapor phases are chosen from 1 ms to 5 ms after the start of injection to observe the whole spray process. After 5 ms, as the gas phase of the spray diffuses out of the optical window, the concentration may be inaccurate. Considering the limit of the optical window by simultaneous measurement of the vapor and liquid phases, the results of the spray are chosen from half of the image by assuming the spray is symmetrical.

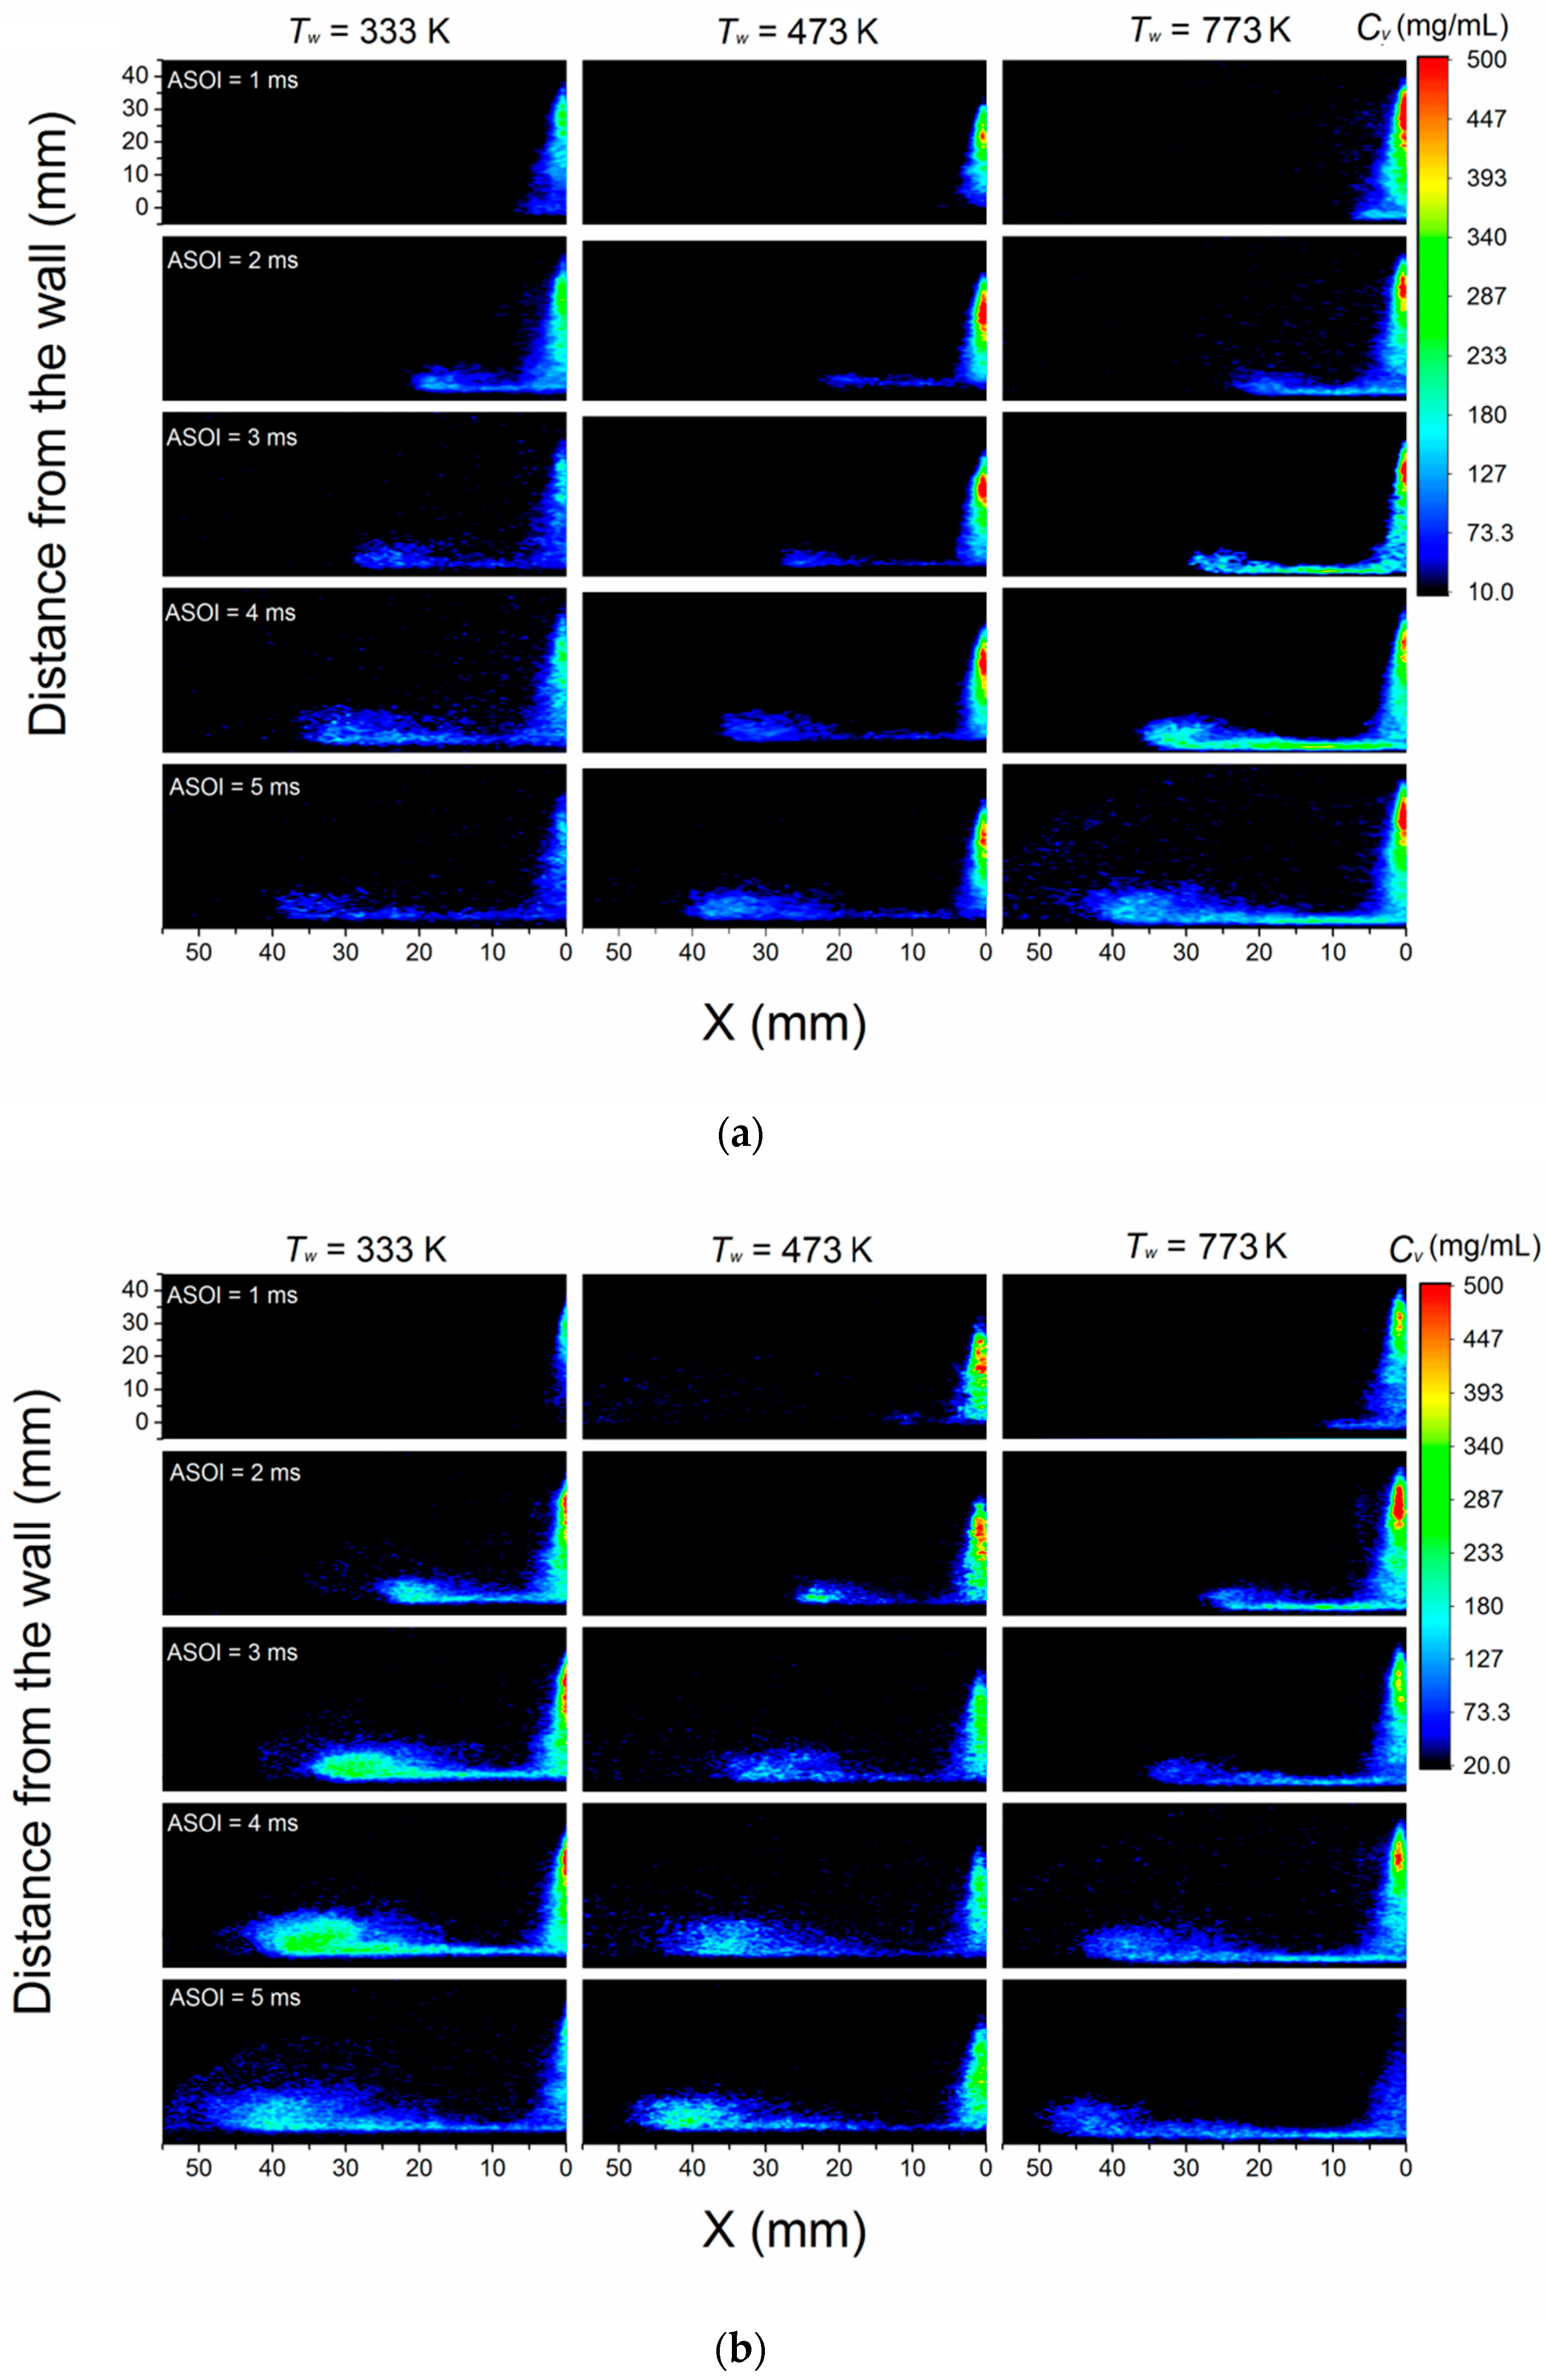
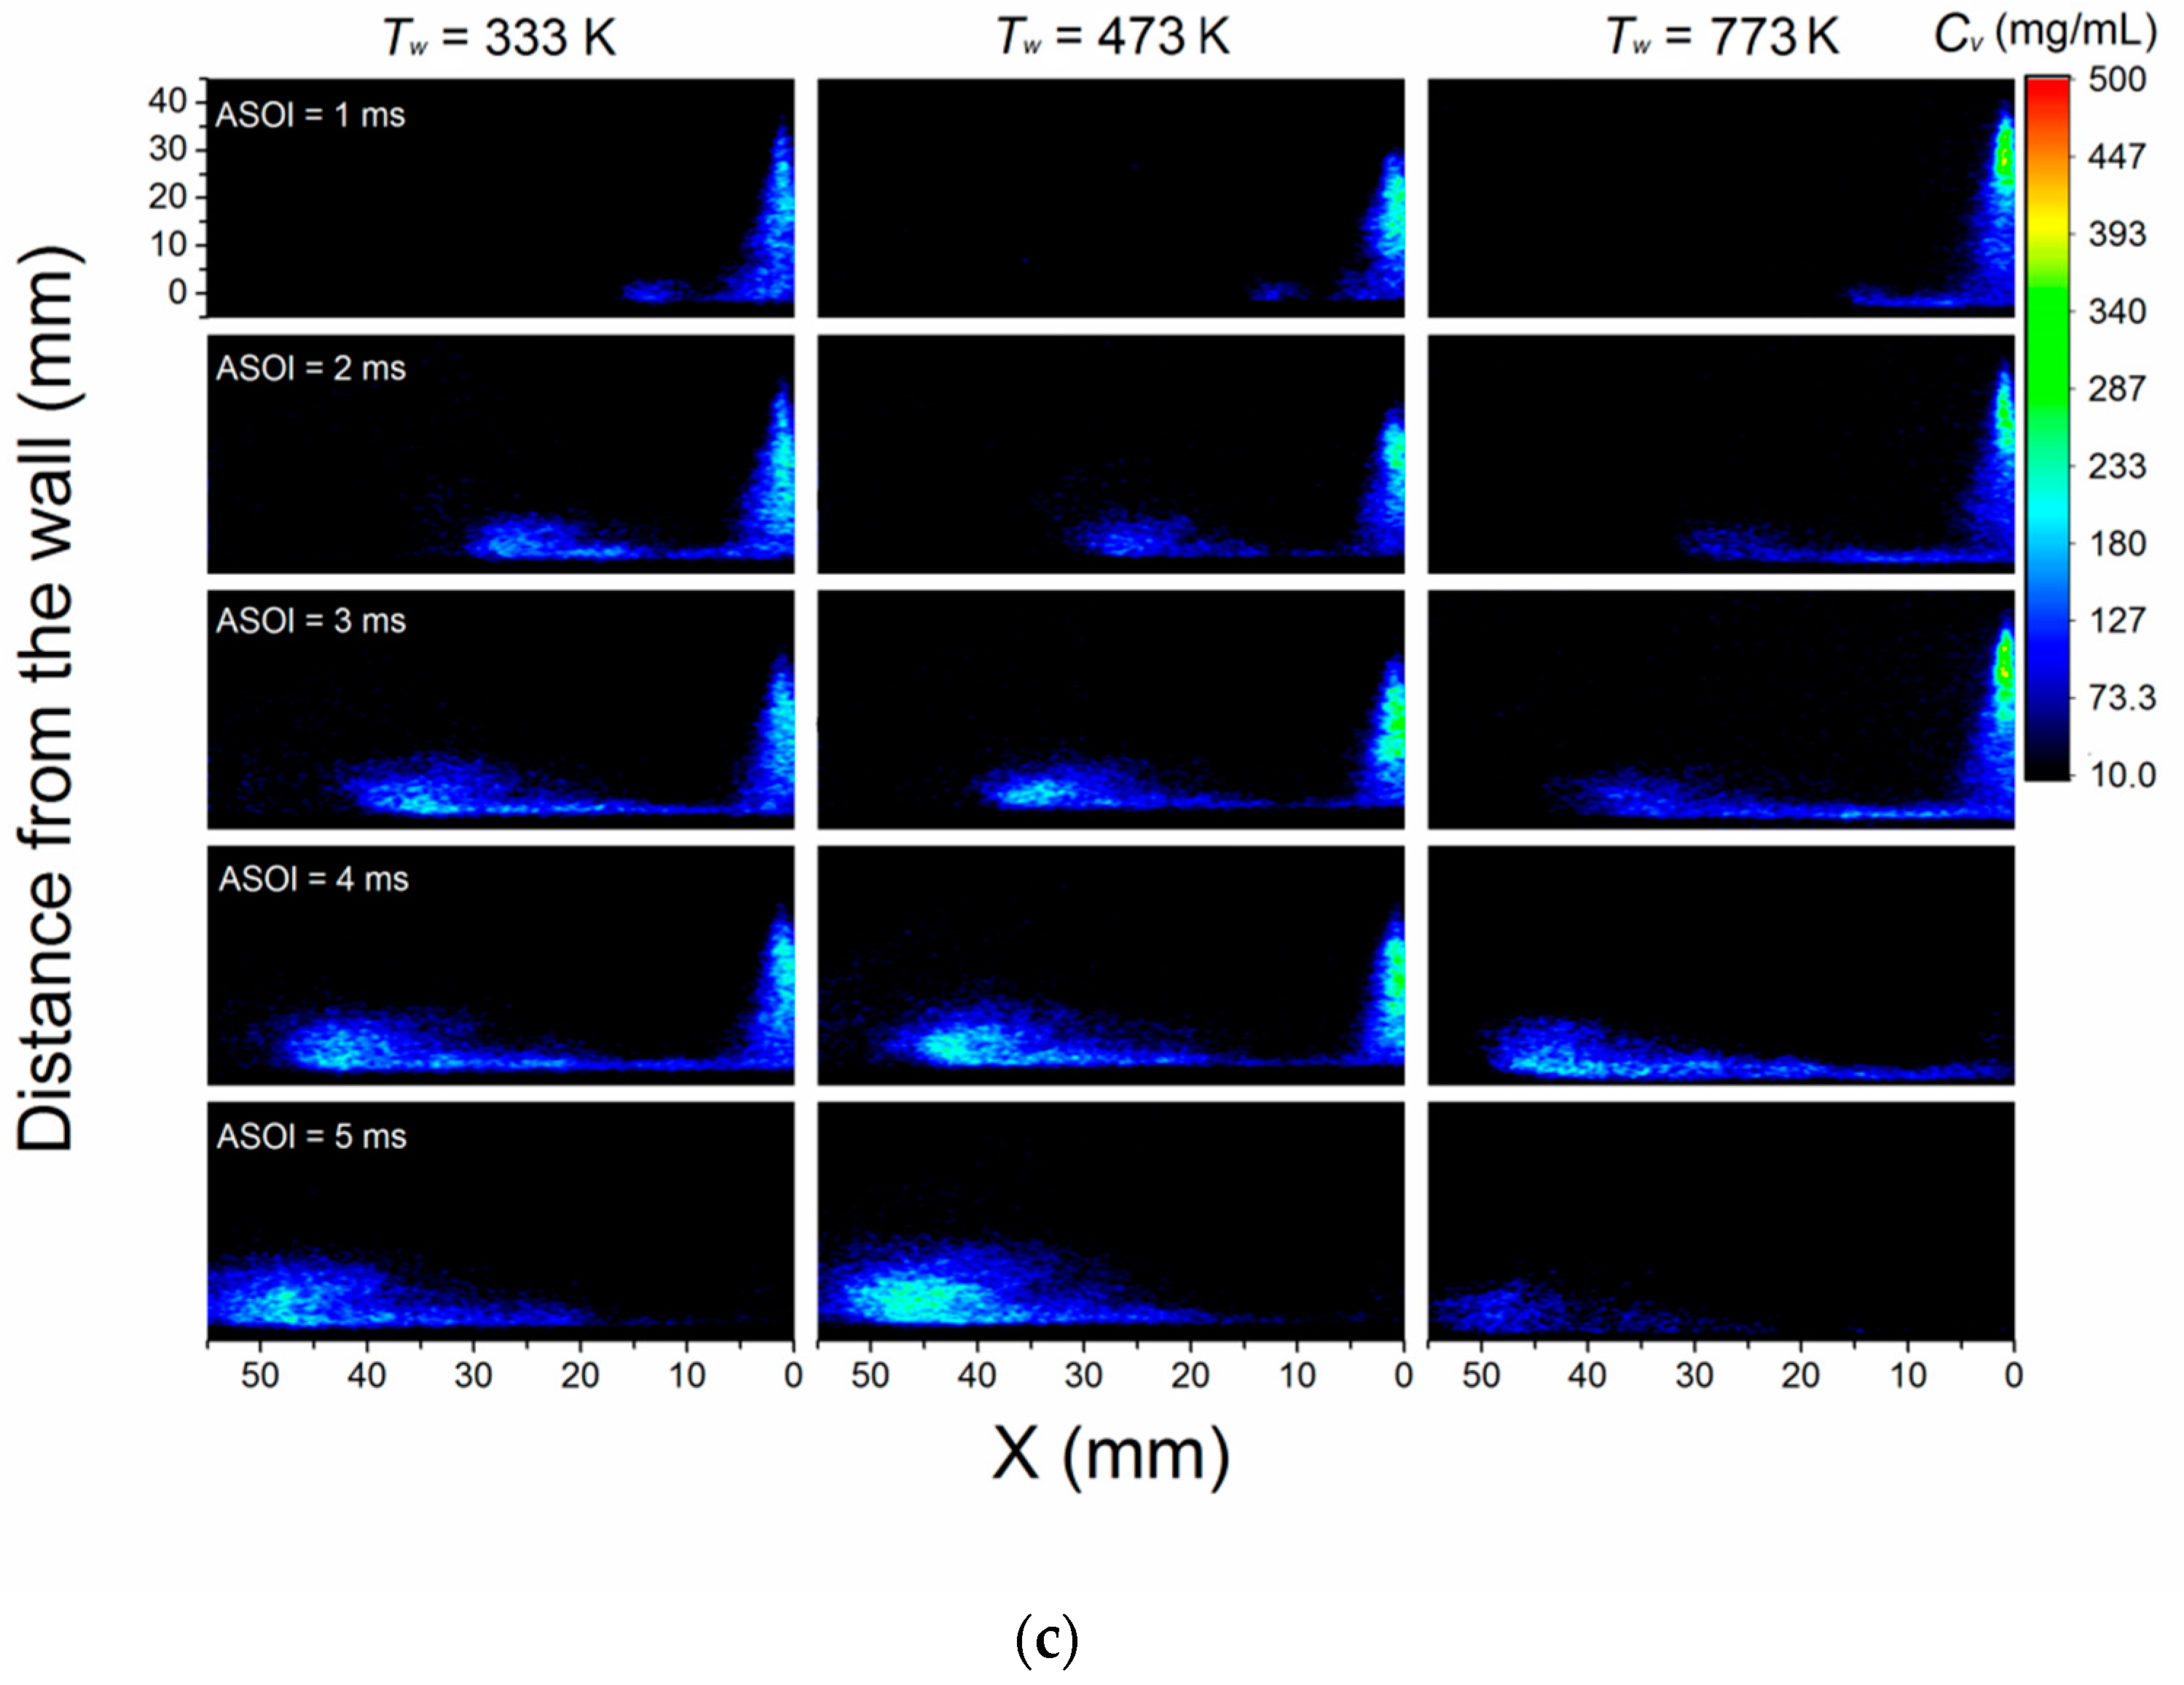
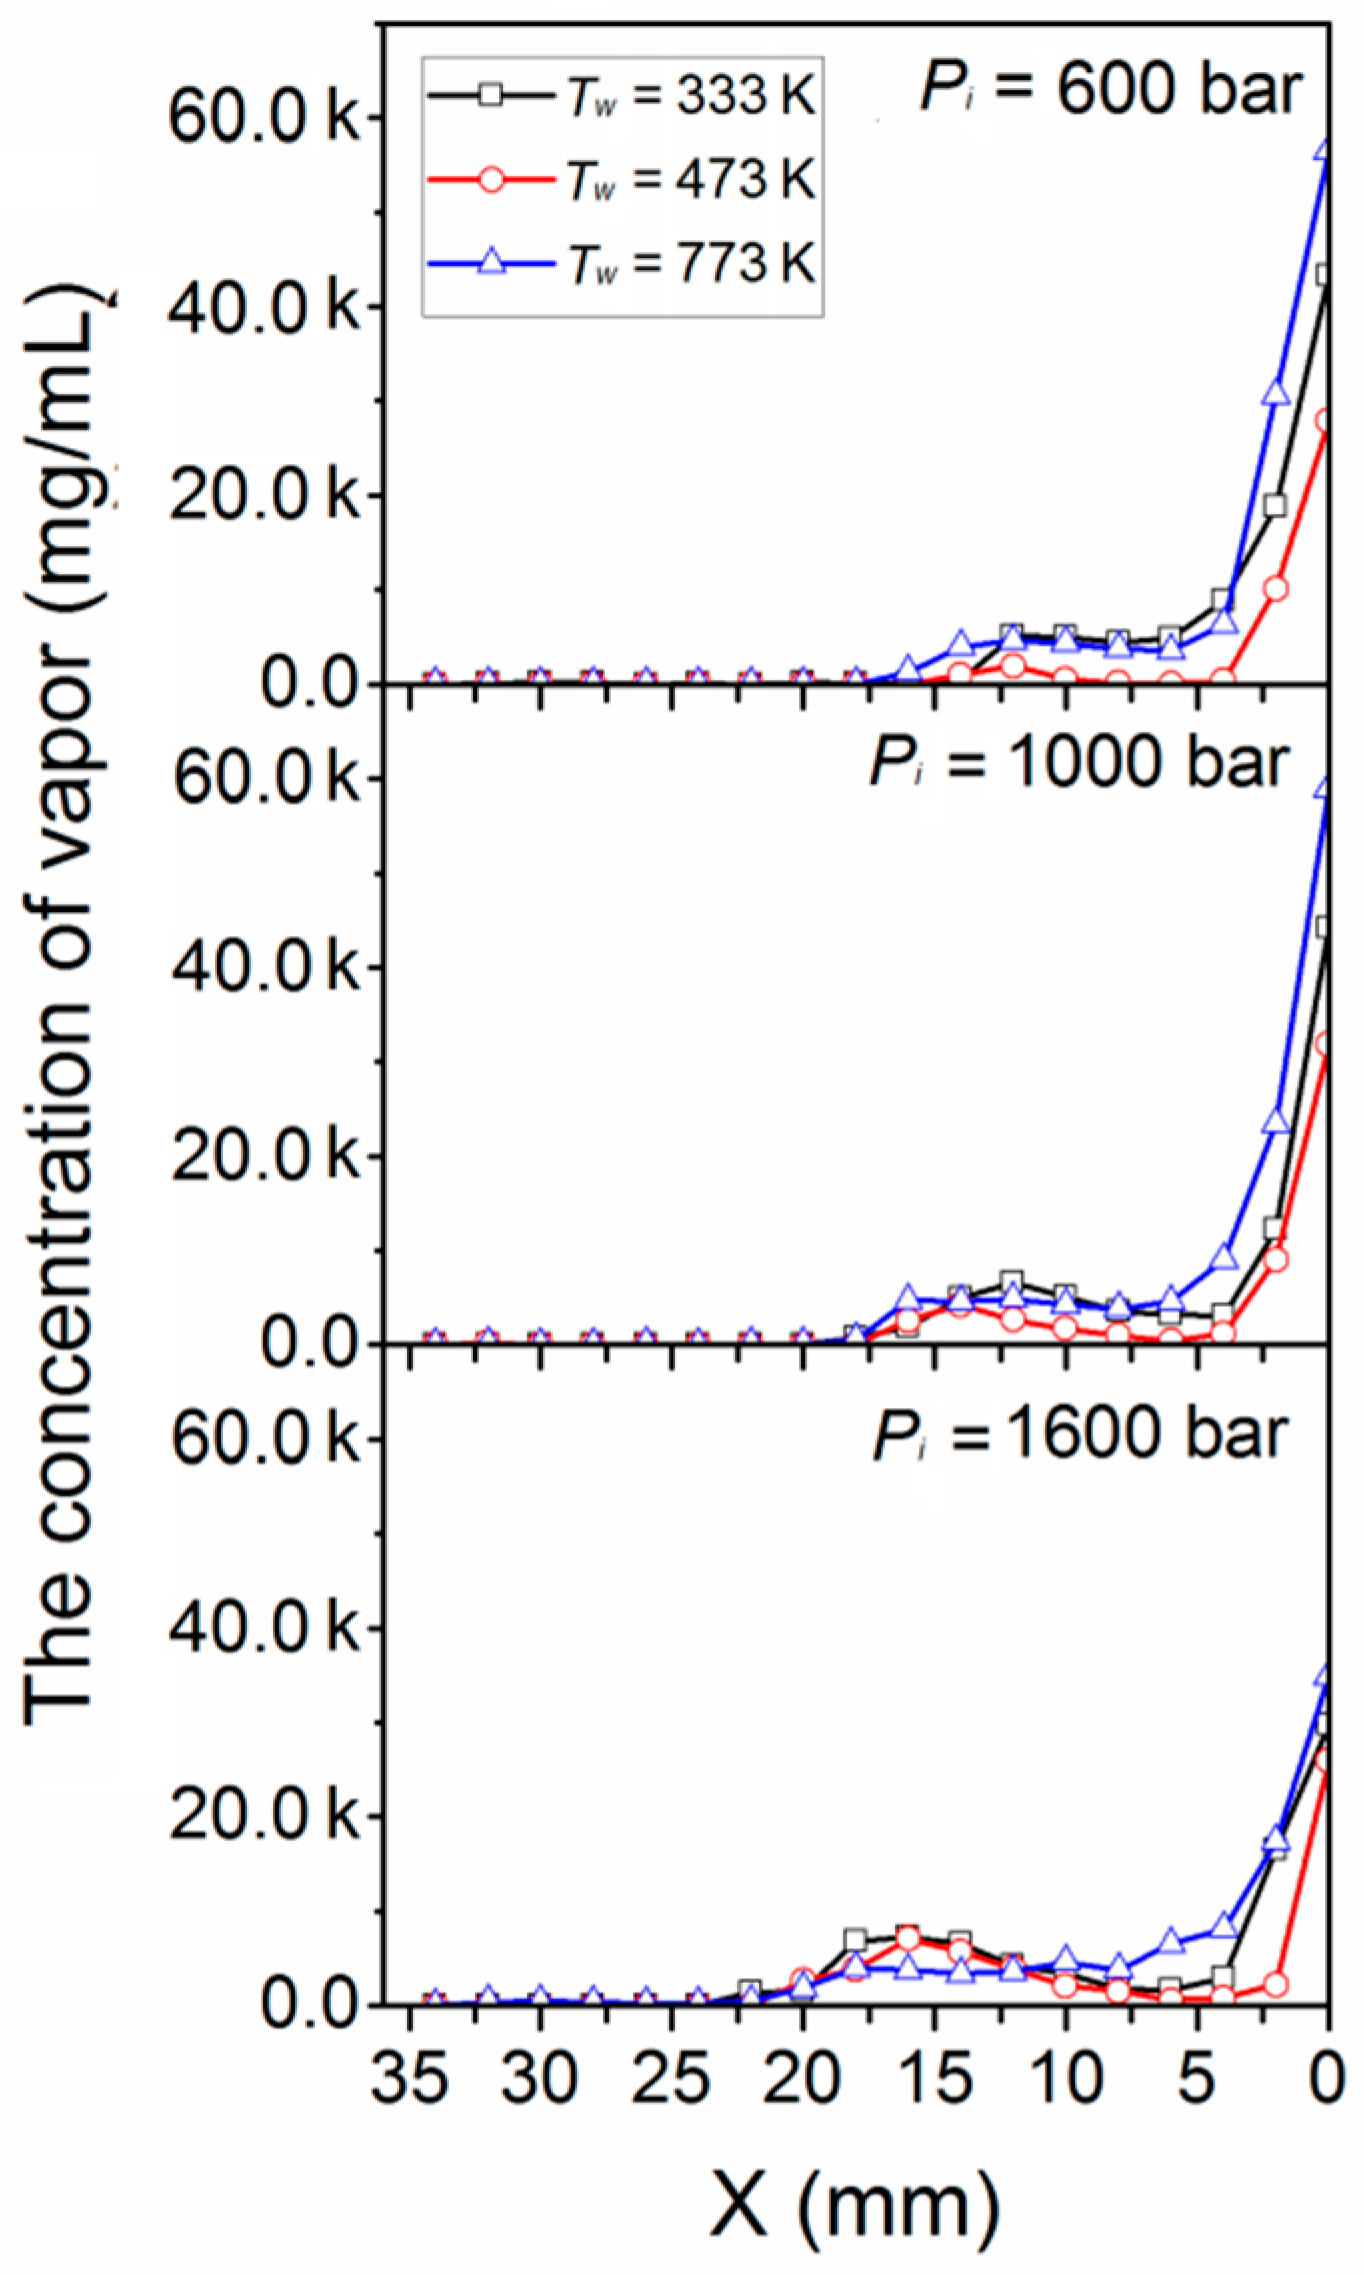
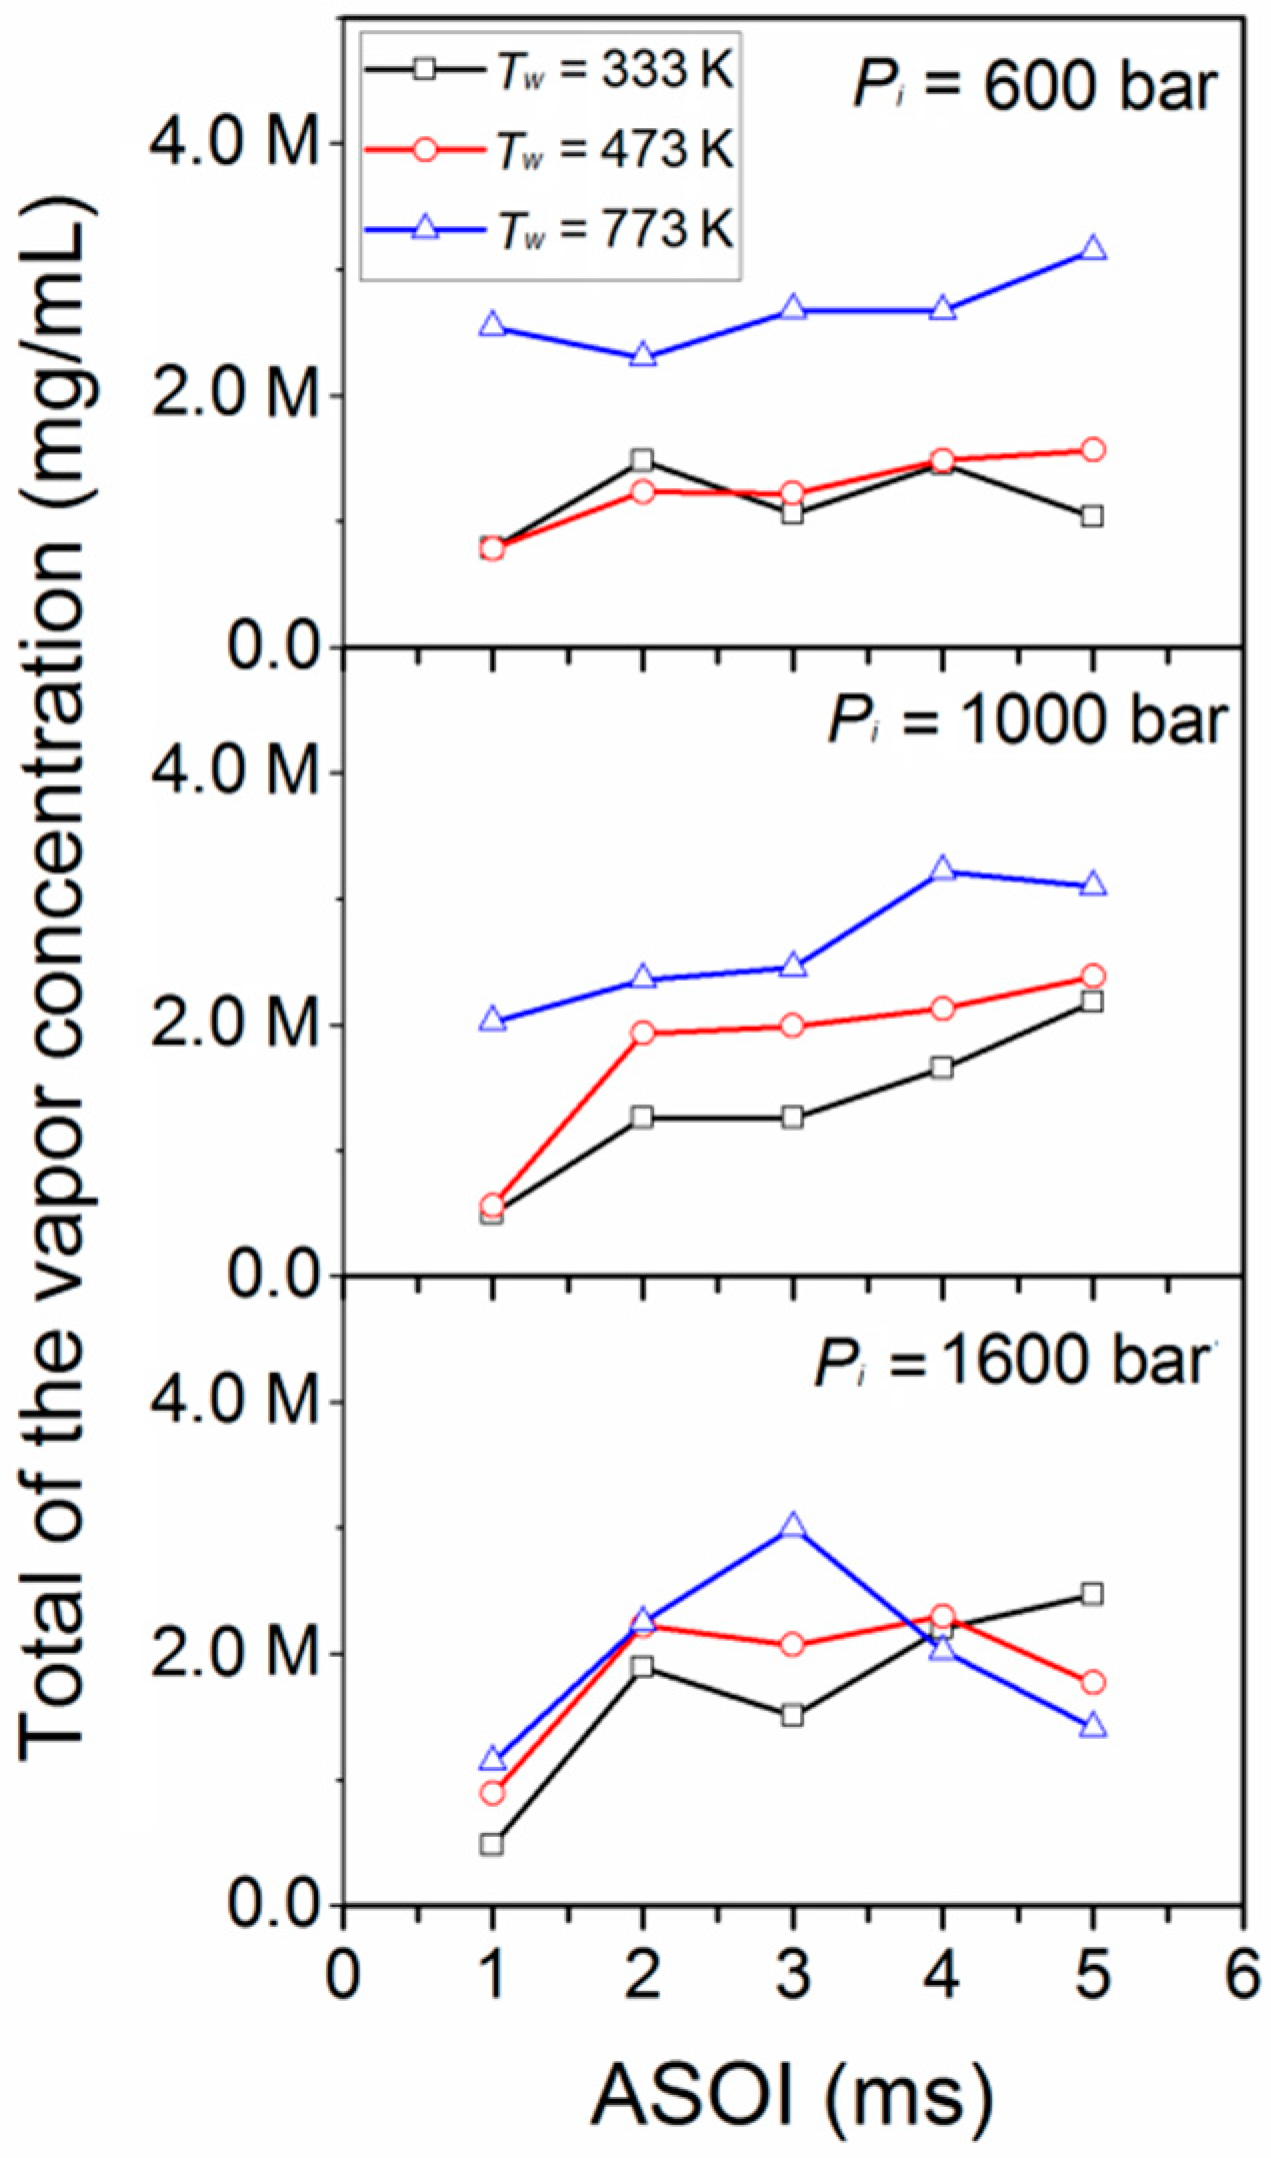
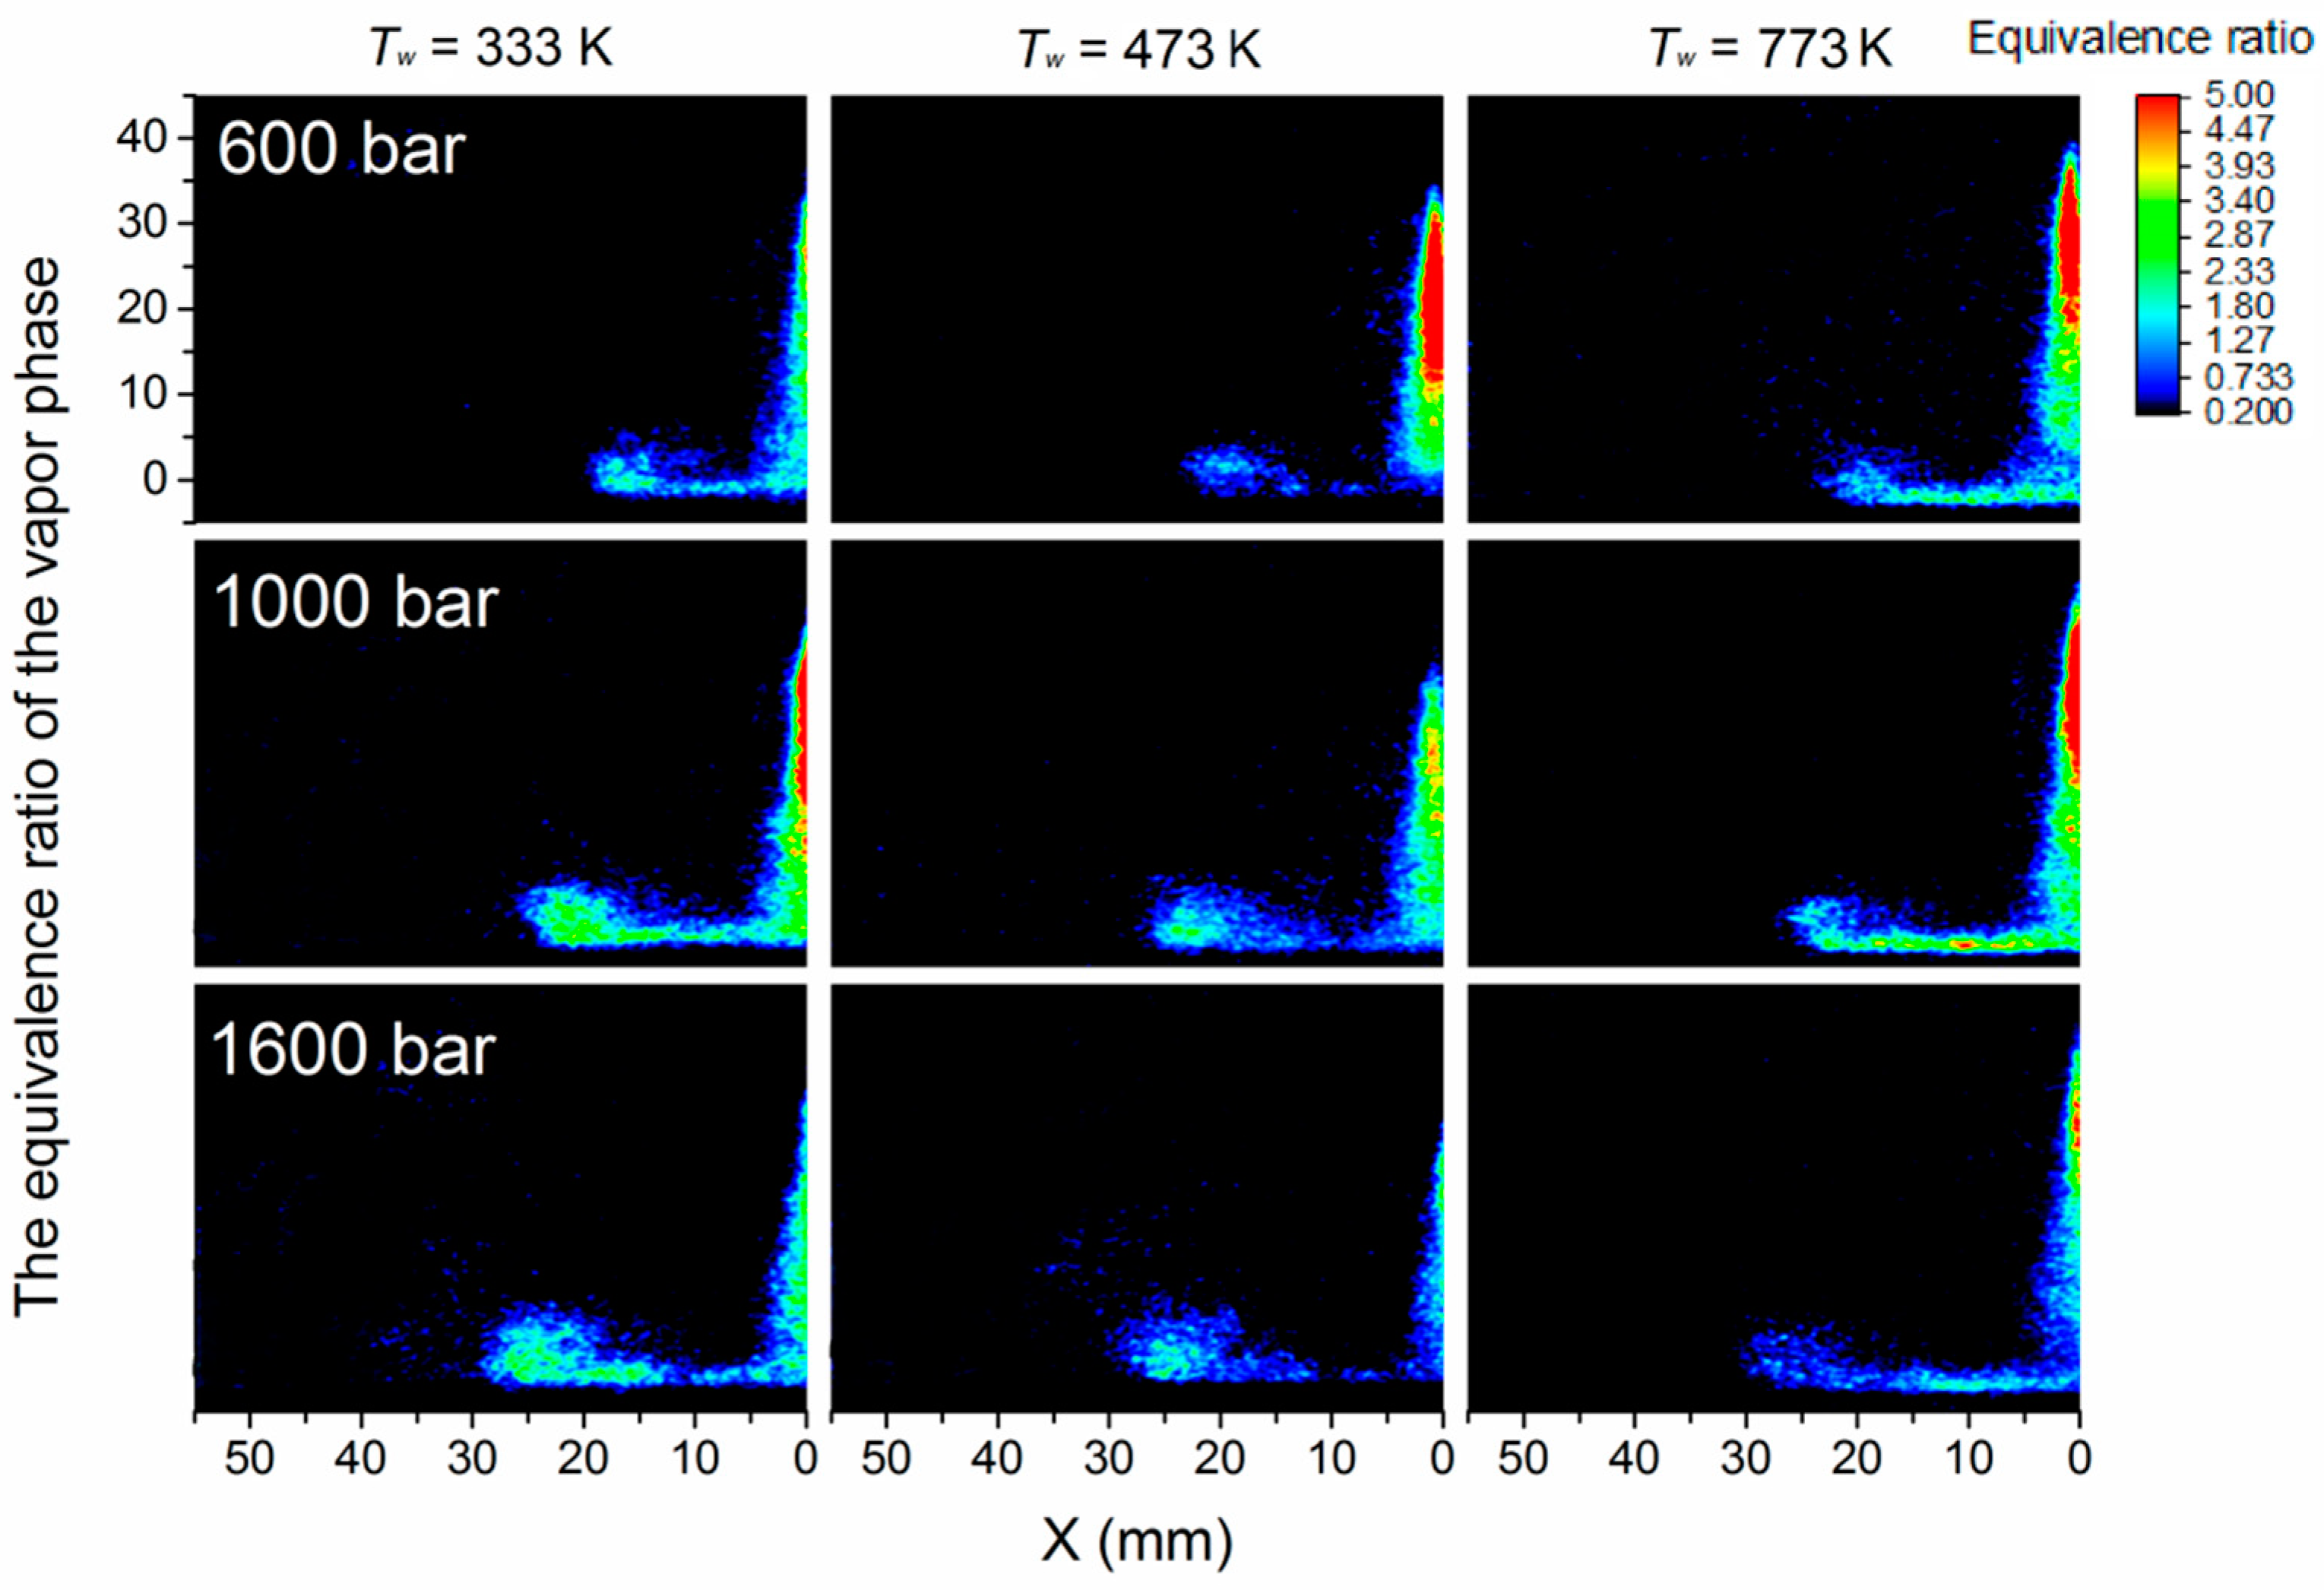
4.1. Vapor Concentration

Figure 4 shows the vapor phase of spray concentrations at different wall temperatures and injection pressures. As shown in Figure 4, the spray develops along the axis at the first 1 ms, then hits the wall and spread out along the wall surface. Finally, the spray spreads to the head vortex region and mixes with the ambient gas. The high-concentration region is mainly distributed in the axis of the spray where there exists rich vapor-gas fuel. Furthermore, the different temperature gradients caused by the various wall temperatures can also affect the concentration distribution in the spray axis. It can be found that the high-concentration area moves away from the wall along the axis with the increase of wall temperature. For example, the high-concentration regions presented in a red color are closer to the injector tip at higher wall temperature conditions. This means that the wall temperature can affect the evaporation process not only at near wall regions but can reach near injector tip regions.
The effects of different wall temperatures at a low injection pressure are shown in Figure 4a. It can be found that the concentration obviously increases with the wall temperature rises, which is due to the effect of evaporation. Also, the speed of the spray spreading is raised because of the increase of wall temperatures. However, in Figure 4b,c, the evaporation rate of the spray is accelerated by the increase of injection pressure. The effect of the wall temperature on the evaporation rate declines with the increase of injection pressure.
Comparing the change of the vapor concentration in different injection pressures, the maximum of the vapor concentration decreases with the injection pressure increase. This is because the spray can spread to a bigger area and the distribution of the spray is more uniform as the injection pressure rises. However, at 333 K wall temperature, the maximum of the vapor concentration increases when the injection pressure rises from 600 bar to 1000 bar. This can be explained by the cold wall temperature preventing the diffusion of the vapor phase at a low injection pressure. As the injection pressure increases to 1600 bar, the effect of diffusion on the wall surface derived from the higher injection pressure is higher than the inhibiting effect of the cold wall temperature, and the vapor phase becomes more uniform distribution which makes the maximum of vapor concentration decrease.
As the spray ignition delay is near to 2 ms after the start of injection in the same condition in a previous study [40], the cumulative vapor concentrations along the axis at after start of injection ASOI = 2 ms are shown in Figure 5 to study the vapor concentration before the start of combustion. From Figure 5, it can be found that as the promotion of the injection pressure approaches diffusion, the concentration decreases as the injection pressure rises. At Tw = 333 K and Tw = 473 K, the evaporation is suppressed by the cold temperature, which makes the vapor concentration decrease at 5–10 mm along the wall surface at all tested injection pressures. Then, due to the impingement effect, the vapor concentration increases in the head vortex area. At Tw = 773 K, the vapor concentration does not decrease at 5–10 mm along the wall surface because of the higher wall temperature at all tested injection pressures. In addition, the vapor concentration reduces with the increase of injection pressure at 0–5 mm along the wall surface.
The effects of different wall temperatures are also compared in Figure 5 at the same injection pressure. The cumulative vapor concentration firstly decreases then increases as the wall temperature rises. This can be explained by the fact that the higher wall temperature raises the total vapor concentration at Tw = 773 K, which makes the vapor concentration highest. At Tw = 333 K, even though the total vapor concentration decreases with the cold wall temperature, the diffusion of the vapor phase is also confined in a smaller area upon the wall surface which makes the concentration decrease less. At last, at Tw = 473 K the evaporation effect is still inhibited because the wall temperature is lower than the boiling of dodecane. Meanwhile, the vapor phase is distributed more widely than at the condition of Tw = 333 K. So the cumulative vapor concentration is the least at Tw = 473 K. It should be noted that, with the injection pressure increasing, the inhibition of evaporation decreases, which makes the difference of cumulative vapor concentration decline at different wall temperatures.
Figure 6 shows the total of the vapor concentration to analyze the effect of different wall temperatures. It can be seen that the evaporation obviously decreases when the temperature is under the boiling point of dodecane, especially at the low injection pressure. As the injection pressure increases, the total vapor concentration rises because of good atomization. Therefore, the effect of wall temperature on the total vapor concentration changes by less than that of the lower injection pressure. At higher injection pressures of 1000 bar and 1600 bar, the concentration decreases after 4 ms, which may due to the fact that the spray has developed out of the observed windows.
To clarify the mixing of the spray, the fuel–air equivalence ratio (Φ) of the vapor phase is calculated from the results of vapor concentration by Equation (5) [37].
Φ = m f / m a ( m f / m a ) s = ρ f × V / ρ a × V ( ρ f × V / ρ a × V ) s = ρ f / ρ a ( ρ f / ρ a ) s = ρ f ( ρ f ) s
where m f is the quality of the injection; ma is the quality of the total gas in the vessel; the sub s represents the ideal situation; ρ f is the density of the fuel and ρs is the density of the gas; and V is the volume of the spray.
The results of the equivalence ratio at the condition ASOI = 2 ms are shown in Figure 7. Under the same injection pressure, the ideal mixture (φ = 1) moves toward to the head of the spray along the wall surface with the increase of wall temperature. For the area before the spray impinging the wall surface, the equivalence ratio increases as the wall temperature increases. The different wall temperatures also affect the spray evaporation before the impingement, but the trend decreases with the increase of injection pressure. Along the wall surface, it can be seen that the difference of equivalence ratio is small as the wall temperatures are 333 K and 473 K. This is because both wall temperatures are lower than the spray boiling point of dodecane, which prevents the spray evaporating. The equivalence ratio at 437 K is smaller than it is at 333 K. It can be deducted that the higher wall temperature promotes vapor phase diffusion to the ambient, and some regions with lower than the given threshold cannot be displayed in the figure. For wall temperature at 773 K, the higher wall temperature promotes considerable spray evaporation which makes the equivalence ratio higher than the other two results.

4.2. Liquid Concentration

The liquid concentration can be calculated from the results of vapor quality and total quality. In this paper, liquid concentrations are only shown at ASOI = 1 ms and ASOI = 2 ms because the liquid concentration changes little after 2 ms. Meanwhile, after 2 ms the ignition is also started, as shown in previous studies under the same conditions [40].
Figure 8 shows the liquid concentration of the spray at different wall temperatures and injection pressures. It can be seen that the liquid spray hardly hits the wall when the injection pressure is 600 bar. The lower injection pressures decrease the liquid evaporation, which makes the spray hit the wall easily. But the lower injection momentum at 600 bar pressure limits the movement of the liquid spray. Therefore, the impingement effect barely promotes the liquid–vapor transition at the lower injection pressure because the spray cannot hit the wall. At Pi = 1000 and 1600 bar, the liquid spray can hit the wall at low wall temperature conditions because of its higher injection momentum. Comparing the different wall temperatures, the evaporation is suppressed by the cold wall temperature, which enables the spray to hit the wall. As the wall temperature increases, the liquid spray cannot also hit the wall even if the higher injection pressures are used.
Comparing with the effects of different wall temperatures on the liquid spray, it can be seen that the larger temperature gradient caused by the cold wall can decline the spray evaporation. The difference at injection pressure of 600 bar is smaller than the other two injection pressures. The lower injection pressure makes the spray evaporate before the impingement, and the spray experiences more interaction with the ambient air but less with the wall. As the injection pressures are 1000 bar and 1600 bar, because the spray can hit the wall the wall temperatures have greater effects than in low injection pressure conditions.

5. Conclusions

The spray characteristics of wall-impingement were investigated in a high-temperature and high-pressure situation. The vapor and liquid phases of the spray were distinguished by LIEF in order to study the effect of different wall temperatures on fuel evaporation. Different injection pressures were also used to analyze the different impingement effects. The equivalence ratio was calculated from the vapor concentration to present the mixture of the spray. Liquid penetration was also observed though the liquid concentration results. The main conclusions are summarized as follows.
Cold wall temperature can simultaneously inhibit the evaporation of the spray and the spread of the vapor phase along the wall surface. As the injection pressure rises, the inhibiting effect decreases and the difference of the vapor concentration reduces at different wall temperatures.
After the vapor phase impinges the wall surface, the cold temperature reduces the spray evaporation near the 10 mm point away from the axis, which makes the concentration decrease in this area. The high-concentration regions (φ > 1) mainly distribute in the region of 10 mm away from the impact point on the wall. With the decrease of wall temperature, the high-concentration regions are enlarged and the total area of the vapor phase decreases.
For the total vapor concentration, the difference in evaporation is small between the wall temperatures of 333 K and 473 K. That is because these two wall temperature are both lower than the boiling point of the tested fuel. As the wall temperature increases to 773 K, an obvious improvement of the total vapor concentration caused by the wall temperature can be observed.
For the liquid phase of the spray, it can barely be seen that the liquid spread along the wall surface under the current tested conditions. The impingement effect barely promotes the liquid–vapor transition because most of the liquid spray has evaporated before it touches the wall surface. The difference in liquid concentration is attributed to the temperature gradient caused by the different wall temperatures.

Author Contributions

All authors have worked on this manuscript together and all authors have read and approved the final manuscript. H.L., B.C. and L.F. planned and conducted the research work. H.L., B.C., L.F., Y.W. and W.Y. analyzed the experimental data. H.L. and B.C. wrote the paper. W.Y. helped to check the English. M.Y. provided useful suggestions and helped during the whole work.

Funding

This research was funded by [the National Key Research and Development Program of China] grant number [2017YFC0806302] and by [the National Natural Science Foundation of China] grant number [91541111].

Conflicts of Interest

The authors declare no conflicts of interest.

References

  1. Jacobs, V.L. Numerical investigation of the combustion characteristics and wall impingement with dependence on split-injection strategies from a gasoline direct-injection spark ignition engine. Proc. Inst. Mech. Eng. Part D 2013, 227, 1518–1535. [Google Scholar]
  2. Fan, Q.; Deng, J.; Hu, Z.; Li, L. An experimental study on spray characteristics after impingement on a piston surface through an asymmetrical multi-hole injector of a direct-injection spark ignition gasoline engine. Proc. Inst. Mech. Eng. Part D 2012, 226, 399–409. [Google Scholar] [CrossRef]
  3. Jochen, S.; Martin, D.; Unterlechner, P.; Kneer, R. Near-wall characteristics of an impinging gasoline spray at increased ambient pressure and wall temperature. At. Sprays 2009, 19, 997–1012. [Google Scholar]
  4. Yao, M.F.; Zheng, Z.; Liu, H. Progress and recent trends in homogeneous charge compression ignition (HCCI) engines. Prog. Energy Combust. Sci. 2009, 35, 398–437. [Google Scholar] [CrossRef]
  5. Musculus, M.P.B.; Miles, P.C.; Pickett, L.Y. Conceptual models for partially premixed low-temperature diesel combustion. Prog. Energy Combust. Sci. 2013, 39, 246–283. [Google Scholar] [CrossRef]
  6. Lu, X.C.; Han, D.; Huang, Z. Fuel design and management for the control of advanced compression-ignition combustion modes. Prog. Energy Combust. Sci. 2011, 37, 741–783. [Google Scholar] [CrossRef]
  7. Luijten, C.C.M.; Somers, L.M.T.; Rijk, E.P.; Albrecht, B.A. Spray impingement in the early direct injection premixed charge compression ignition regime. SAE Int. 2010. [Google Scholar] [CrossRef]
  8. Han, S.; Qin, J.; Lin, M.; Li, Y.; Zhang, Y. Simulation study of injection strategy and tumble effect on the mixture formation and spray impingement in a gasoline direct injection engine. SAE Int. 2014. [Google Scholar] [CrossRef]
  9. Miles, P.C.; Collin, R.; Hildingsson, L.; Hultqvist, A.; Andersson, O. Combined measurements of flow structure, partially oxidized fuel, and soot in a high-speed, direct-injection diesel engine. Proc. Combust. Inst. 2007, 31, 2963–2970. [Google Scholar] [CrossRef]
  10. Miles, P.C.; Hildingsson, L.; Hultqvist, A. The influence of fuel injection and heat release on bulk flow structures in a direct-injection, swirl-supported diesel engine. Exp. Fluids 2007, 43, 273–283. [Google Scholar] [CrossRef]
  11. Liu, H.F.; Ma, S.Y.; Zhang, Z.; Zheng, Z.Q.; Yao, M.F. Study of the control strategies on soot reduction under early-injection conditions on a diesel engine. Fuel 2015, 139, 472–481. [Google Scholar] [CrossRef]
  12. Akop, M.Z.; Zama, Y.; Furuhata, T.; Arai, M. Experimental investigations on adhered fuel and impinging diesel spray normal to a wall. At. Sprays 2013, 23, 211–231. [Google Scholar] [CrossRef]
  13. Akop, M.Z.; Zama, Y.; Furuhata, T.; Arai, M. Characteristics of adhesion of diesel fuel on impingement disk wall. Part 1: EFFECT of Impingement area and inclination angle of disk. At. Sprays 2013, 23, 725–744. [Google Scholar] [CrossRef]
  14. Akop, M.Z.; Zama, Y.; Furuhata, T.; Arai, M. Characteristics of adhesion diesel fuel onan impingement disk wall Part 2: Droplet Weber number and adhered fuel mass. At. Sprays 2013, 24, 651–671. [Google Scholar] [CrossRef]
  15. Akop, M.Z.; Zama, Y.; Furuhata, T.; Arai, M. Characteristics of adhesion diesel fuel on an impingement disk wall Part 3: Ambient pressure effect. At. Sprays 2014, 24, 625–650. [Google Scholar] [CrossRef]
  16. Amagai, K.; Maruyama, Y.; Saito, M.; Arai, M. Spray-to-spray interactions after wall impingement. SAE Int. 2003. [Google Scholar] [CrossRef]
  17. Katsura, N.; Saito, M.; Senda, J.; Fujimoto, H. Characteristics of a Diesel Spray Impinging on a Flat Wall: 2nd report. Nihon Kikai Gakkai Ronbunshu B Hen/Trans. Jpn. Soc. Mech. Eng. Part B 1989, 54, 2252–2259. [Google Scholar]
  18. Li, K.C.; Dong, P.B.; Matsuo, T.; Shi, B.; Ogata, Y.; Nishida, K. Characteristics of diesel spray flame under flat wall impinging condition—LAS, OH* chemiluminescence and two color pyrometry results. SAE Int. 2014. [Google Scholar] [CrossRef]
  19. Senda, J.; Tanabe, Y.; Fujimoto, H.; Fukami, Y. Visualization of evaporative diesel spray impinging upon wall surface by exciplex fluorescence method. SAE Int. 1992. [CrossRef]
  20. Bruneaux, G. Mixing process in high pressure diesel jets by normalized laser induced exciplex fluorescence Part I: Free jet. SAE Int. 2005. [Google Scholar] [CrossRef]
  21. Zhang, W.; Nishida, K.; Gao, J.; Miura, D. An experimental study on flat-wall-impinging spray of microhole nozzles under ultra-high injection pressures. J. Shenyang Pharm. Univ. 2011, 222, 1731–1741. [Google Scholar] [CrossRef]
  22. Park, S.W.; Chang, S.L. Macroscopic and microscopic characteristics of a fuel spray impinged on the wall. Exp. Fluids 2004, 37, 745–762. [Google Scholar] [CrossRef]
  23. Panão, M.R.O.; Moreira, A.L.N.; Durão, D.F.G. Effect of a cross-flow on spray impingement with port fuel injection systems for HCCI engines. Fuel 2013, 106, 249–257. [Google Scholar] [CrossRef]
  24. Merola, S.S.; Vaglieco, B.M. Optical investigations of fuel deposition burning in ported fuel injection (PFI) spark-ignition (SI) engine. Energy 2009, 34, 2108–2115. [Google Scholar] [CrossRef]
  25. Zheng, Z.L.; Liu, C.T.; Zhang, X.Y. Numerical study of effects of reformed exhaust gas recirculation (REGR) on dimethyl ether HCCI combustion. Int. J. Hydrogen Energy 2014, 39, 8106–8117. [Google Scholar] [CrossRef]
  26. Arcoumanis, C.; Chang, J.C. Flow and heat transfer characteristics of impinging transient diesel sprays. SAE Int. 1994, 104, 798–812. [Google Scholar]
  27. Li, K.C.; Nishida, K.; Ogata, Y.; Shi, B. Effect of flat-wall impingement on diesel spray combustion. Proc. Inst. Mech. Eng. Part D 2015, 229, 535–549. [Google Scholar] [CrossRef]
  28. Pickett, L.M.; Lopez, J.J. Jet-wall interaction effects on diesel combustion and soot formation. China Mech. Eng. 2004, 20. [Google Scholar] [CrossRef]
  29. Zhao, H.; Ladommatos, N. Optical diagnostics for in-cylinder mixture formation measurements in IC engines. Prog. Energy Combust. Sci. 1998, 24, 297–336. [Google Scholar] [CrossRef]
  30. Melton, L.A.; Verdieck, J.F. Vapor/liquid visualization in fuel sprays. Symp. Combust. 1984, 20, 1283–1290. [Google Scholar] [CrossRef]
  31. Melton, L.A.; Verdieck, J.F. Vapor/Liquid Visualization for Fuel Sprays. Symp. Combust. 1985, 20, 1283–1290. [Google Scholar] [CrossRef]
  32. Bardsley, M.E.A.; Felton, P.G.; Bracco, F.V. 2-D Visualization of liquid and vapor fuel in an I.C. Engine. SAE Int. Congr. Exp. 1989, 97, 281–291. [Google Scholar]
  33. Campbell, P.H.; Sinko, K.M.; Chehroudi, B. Liquid and vapor phase distributions in a piloted diesel fuel spray. SAE Trans. 1996, 104, 760–775. [Google Scholar]
  34. Yeh, C.N.; Kamimoto, T.; Kobori, S.; Kosaka, H. 2-D measurement of fuel vapor concentration in diesel spray via exciplex-based fluorescence technique. Trans. Jpn. Soc. Mech. Eng. 1993, 60, 321–326. [Google Scholar] [CrossRef]
  35. Li, T.Y.; Xu, M.; Wu, S.Q.; Xu, Q.L.; Hung, D.L.S. Influence of the Injector Configuration on the Spray Evaporation Characteristics under Superheated Conditions. SAE Int. 2015. [Google Scholar] [CrossRef]
  36. Zhang, G.M.; Xu, M.; Zhang, Y.Y.; Zeng, W. Quantitative measurements of liquid and vapor distributions in flash boiling fuel sprays using planar laser induced exciplex technique. SAE Int. 2011. [Google Scholar] [CrossRef]
  37. Melton, L.A. Applications of Laser-Induced Exciplex Fluorescence to Single Droplet and Fuel Spray Visualization; University of Texas: Dallas, TX, USA, 1991. [Google Scholar]
  38. Rotunno, A.A.M.; Dobbs, W.G.M.; Melton, L.A. Direct calibration procedures for exciplex-based vapor/liquid visualization of fuel sprays. Combust. Sci. Technol. 1990, 71, 247–261. [Google Scholar] [CrossRef]
  39. Felton, P.G.; Bracco, F.V.; Bardsley, M.E.A. On the quantitative application of exciplex fluorescence to engine sprays. SAE Int. 1993. [Google Scholar] [CrossRef]
  40. Feng, L.; Chen, B.L.; Liu, H.F.; Yao, M.F.; Geng, C. Combustion characteristics of wall-impinging diesel fuel spray under different wall temperatures. SAE Int. 2017. [Google Scholar] [CrossRef]
Figure 1. Schematic diagram of the experimental set-up.
Energies 11 01249 g001
Figure 2. The spectra of vapor and liquid phases excited by a 355 nm laser.
Energies 11 01249 g002
Figure 3. The calibration curve of the relationship between the temperature and fluorescence intensity.
Energies 11 01249 g003
Figure 4. The vapor concentration of the impingement spray at different temperature. (Ta = 773 K, Pa = 4 MPa). (a) Pi = 600 bar; (b) Pi = 1000 bar; (c) Pi = 1600 bar.
Energies 11 01249 g004aEnergies 11 01249 g004b
Figure 5. The cumulative vapor concentration along the axis at different temperature. (Ta = 773 K, Pa = 4 MPa, ASOI = 2 ms).
Energies 11 01249 g005
Figure 6. The total vapor concentration of the profile. (Ta = 773 K, Pa = 4 MPa).
Energies 11 01249 g006
Figure 7. The equivalence ratio of the vapor phase at the condition of Ta = 773 K, Pa = 4 MPa, ASOI = 2.
Energies 11 01249 g007
Figure 8. The concentration of the liquid phase at different wall temperature. (a) TW = 333 K; (b) TW = 473 K; (c) TW = 773 K.
Energies 11 01249 g008
Table 1. The characteristic of the fuel and tracer in the experiment.
Name of ChemicalsChemical FormulaBoiling Point (K)Mass Fraction
n-DodecaneC12H26488–49090%
TMPDC10H16N25331%
NaphthaleneC10H84919%
Table 2. Experiment conditions.
ParametersValue
Nozzle hole diameter/mm0.14
Injection quantity/mg22
Injection pressure, Pi/bar600, 1000, 1600
Ambient pressure, Pa/MPa4
Ambient density, ρa/kg·m−318.03
Ambient temperature, Ta/K773
Wall temperature, Tw/K333, 473, 773
Impingement distance, L/mm35

