Electric Field Induced Changes of a Diffusion Flame and Heat Transfer near an Impinging Surface


Mechanical and Aerospace Engineering Department, University of California, Irvine, CA 92697, USA
*
Author to whom correspondence should be addressed.
Energies 2018, 11(5), 1235; https://doi.org/10.3390/en11051235
Submission received: 12 April 2018
/
Revised: 6 May 2018
/
Accepted: 9 May 2018
/
Published: 12 May 2018
(This article belongs to the Special Issue Electric Fields in Energy & Process Engineering)
Abstract
:This research investigates heat transfer phenomena on a plate used with impinging electric field flames; i.e., flames burning in the presence of an electric field. Electric field effects on flames have been investigated in different applications but not when the flames are impinging on nearby surfaces. Challenges to measurement methods when an electric field is applied in the system have limited the understanding of changes to the temperature distributions and species concentrations caused by the field. This study uses an infrared forward looking infrared (FLIR) camera with Schlieren visualization to examine the heat flux from flames over an impinging plate with different electric fields applied. In particular, we study the electric field effects on flames when those flames transfer heat to a nearby plate, and then how that transfer can be controlled using the electric field. The results show that electric fields affect substantially the heat flux distribution through the ion-driven wind, particularly when the plate location is just above the flame tip.
1. Introduction
This paper describes how an electric field controlled flame can change the temperature distribution over the plate on which the flame impinges. Electric field actuated flames can occur because hydrocarbon flames naturally produce positive ions and negative charge carriers (generally electrons) in the reaction zone. H3O+ is the most important ion for near stoichiometric mixture combustion, having a much higher concentration than other ions such as C2H3O+, C3H3+ and HCO+. Prager, et al. [1] found H3O+ dominant in lean flames, and the strong consensus in the literature is that this ion is dominant for all flames actuated by negative fields. The fundamentals of chemi-ion production and the transport of these ions is well-documented in the literature so a complete repeat of this topic is not necessary [2]. A general finding in all cases is that the weak plasma reactions naturally occurring inside flames is not essential for any of the major heat release reaction pathways. Furthermore, applying relatively modest electric fields to the flames can affect the chemi-ion transport and the local convective flow around the flame through the ion-driven wind effect [2].
Based on the above consensus findings, it is clear that proper application of electric fields can act on the charge carriers in flames and modify combustion and thermal transport behavior. The use of electrical aspects of flames for beneficial impact has been explored for many years, including continuing investigations not only in a microgravity environment [3,4,5], but also with a series of experiments in the International Space Station for NASA microgravity combustion [6]. Recent work in the literature also demonstrates a direct current electric field effect on thermoacoustic behaviors of flat premixed flames, where the ion-driven wind has been used to suppress thermoacoustic oscillations [7]. Emissions such as carbon monoxide and NOx can be minimized with electric fields, even when the fields are weakly applied [8,9], and effects are also seen in turbulent premixed flames at high pressure [10]. Sooting characteristics under the influence of electric fields with ethylene fuel (as more soot promoting) is also studied with a counterflow burner [11]. Optically based experiments, such as particle image velocimetry (PIV) and planar laser induced fluorescence (PLIF), have been used to study how the shape of premixed fuel/air flames responds to high electric fields [12,13,14]. These past studies have helped demonstrate several different experimental methods for measuring the ions generated in flames and their influence [2] but they have not been used in the context of flames near surfaces. Impinging flame study has been carried out for several decades, with these studies distributed among turbulent and laminar flow situations, depending on the regime of interest. In quasi-steady experiments, one important phenomenon observed is that when the impinging surface is progressively brought towards a diffusion flame, the temperature gradients near the plate and the peak temperatures in the reaction zone remain relatively constant [15]. Electric fields can, however, change the flame shape and ion distribution, and how this electric manipulation of shape thermally influences the temperature distribution over an impinging plate is the subject of this paper. The specific objective of this work is to describe how an electric field acting on a diffusion flame changes the heat distribution over an impinging surface when the flame is close to it.
In order to determine the temperature change induced by the changes made to the flame with the electric field, non-intrusive heat transfer measurements are needed. To measure the heat transferred to the plate from the flame we use a forward looking infrared (FLIR) camera to observe the temperature profile of an impinging plate as a 25 W (thermal) flame impinges on it. That is, the flame is interrupted by a flat stainless steel plate, and we acquire a 2-D temperature distribution from a top view. We also observe the thermal flow field transitions from a side view using Schlieren imaging. The acquired thermal information from the plate and the stagnation flow density plume offers the opportunity to understand how the heat transfers to the plate from the flame when the flame is manipulated by an electric field.
2. Experimental Configuration
2.1. Burner and Electric Field Setups
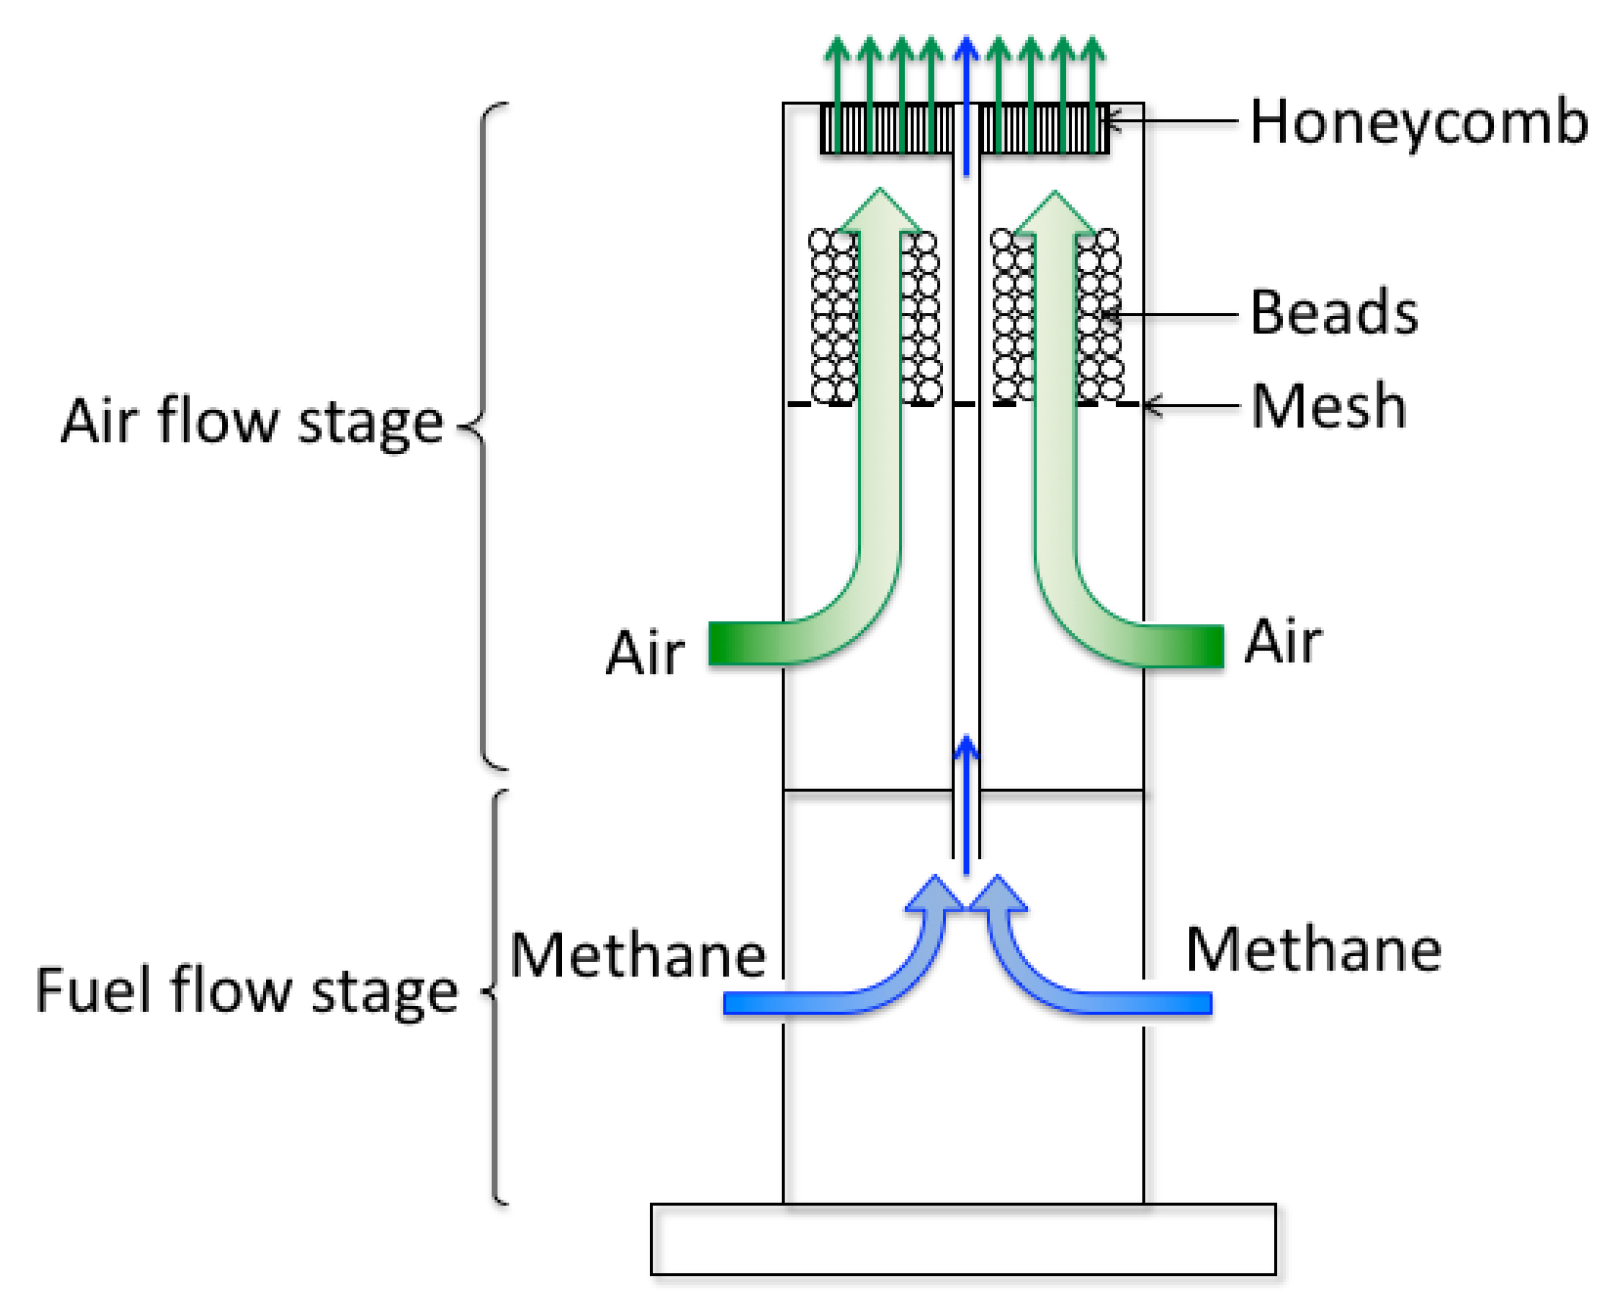
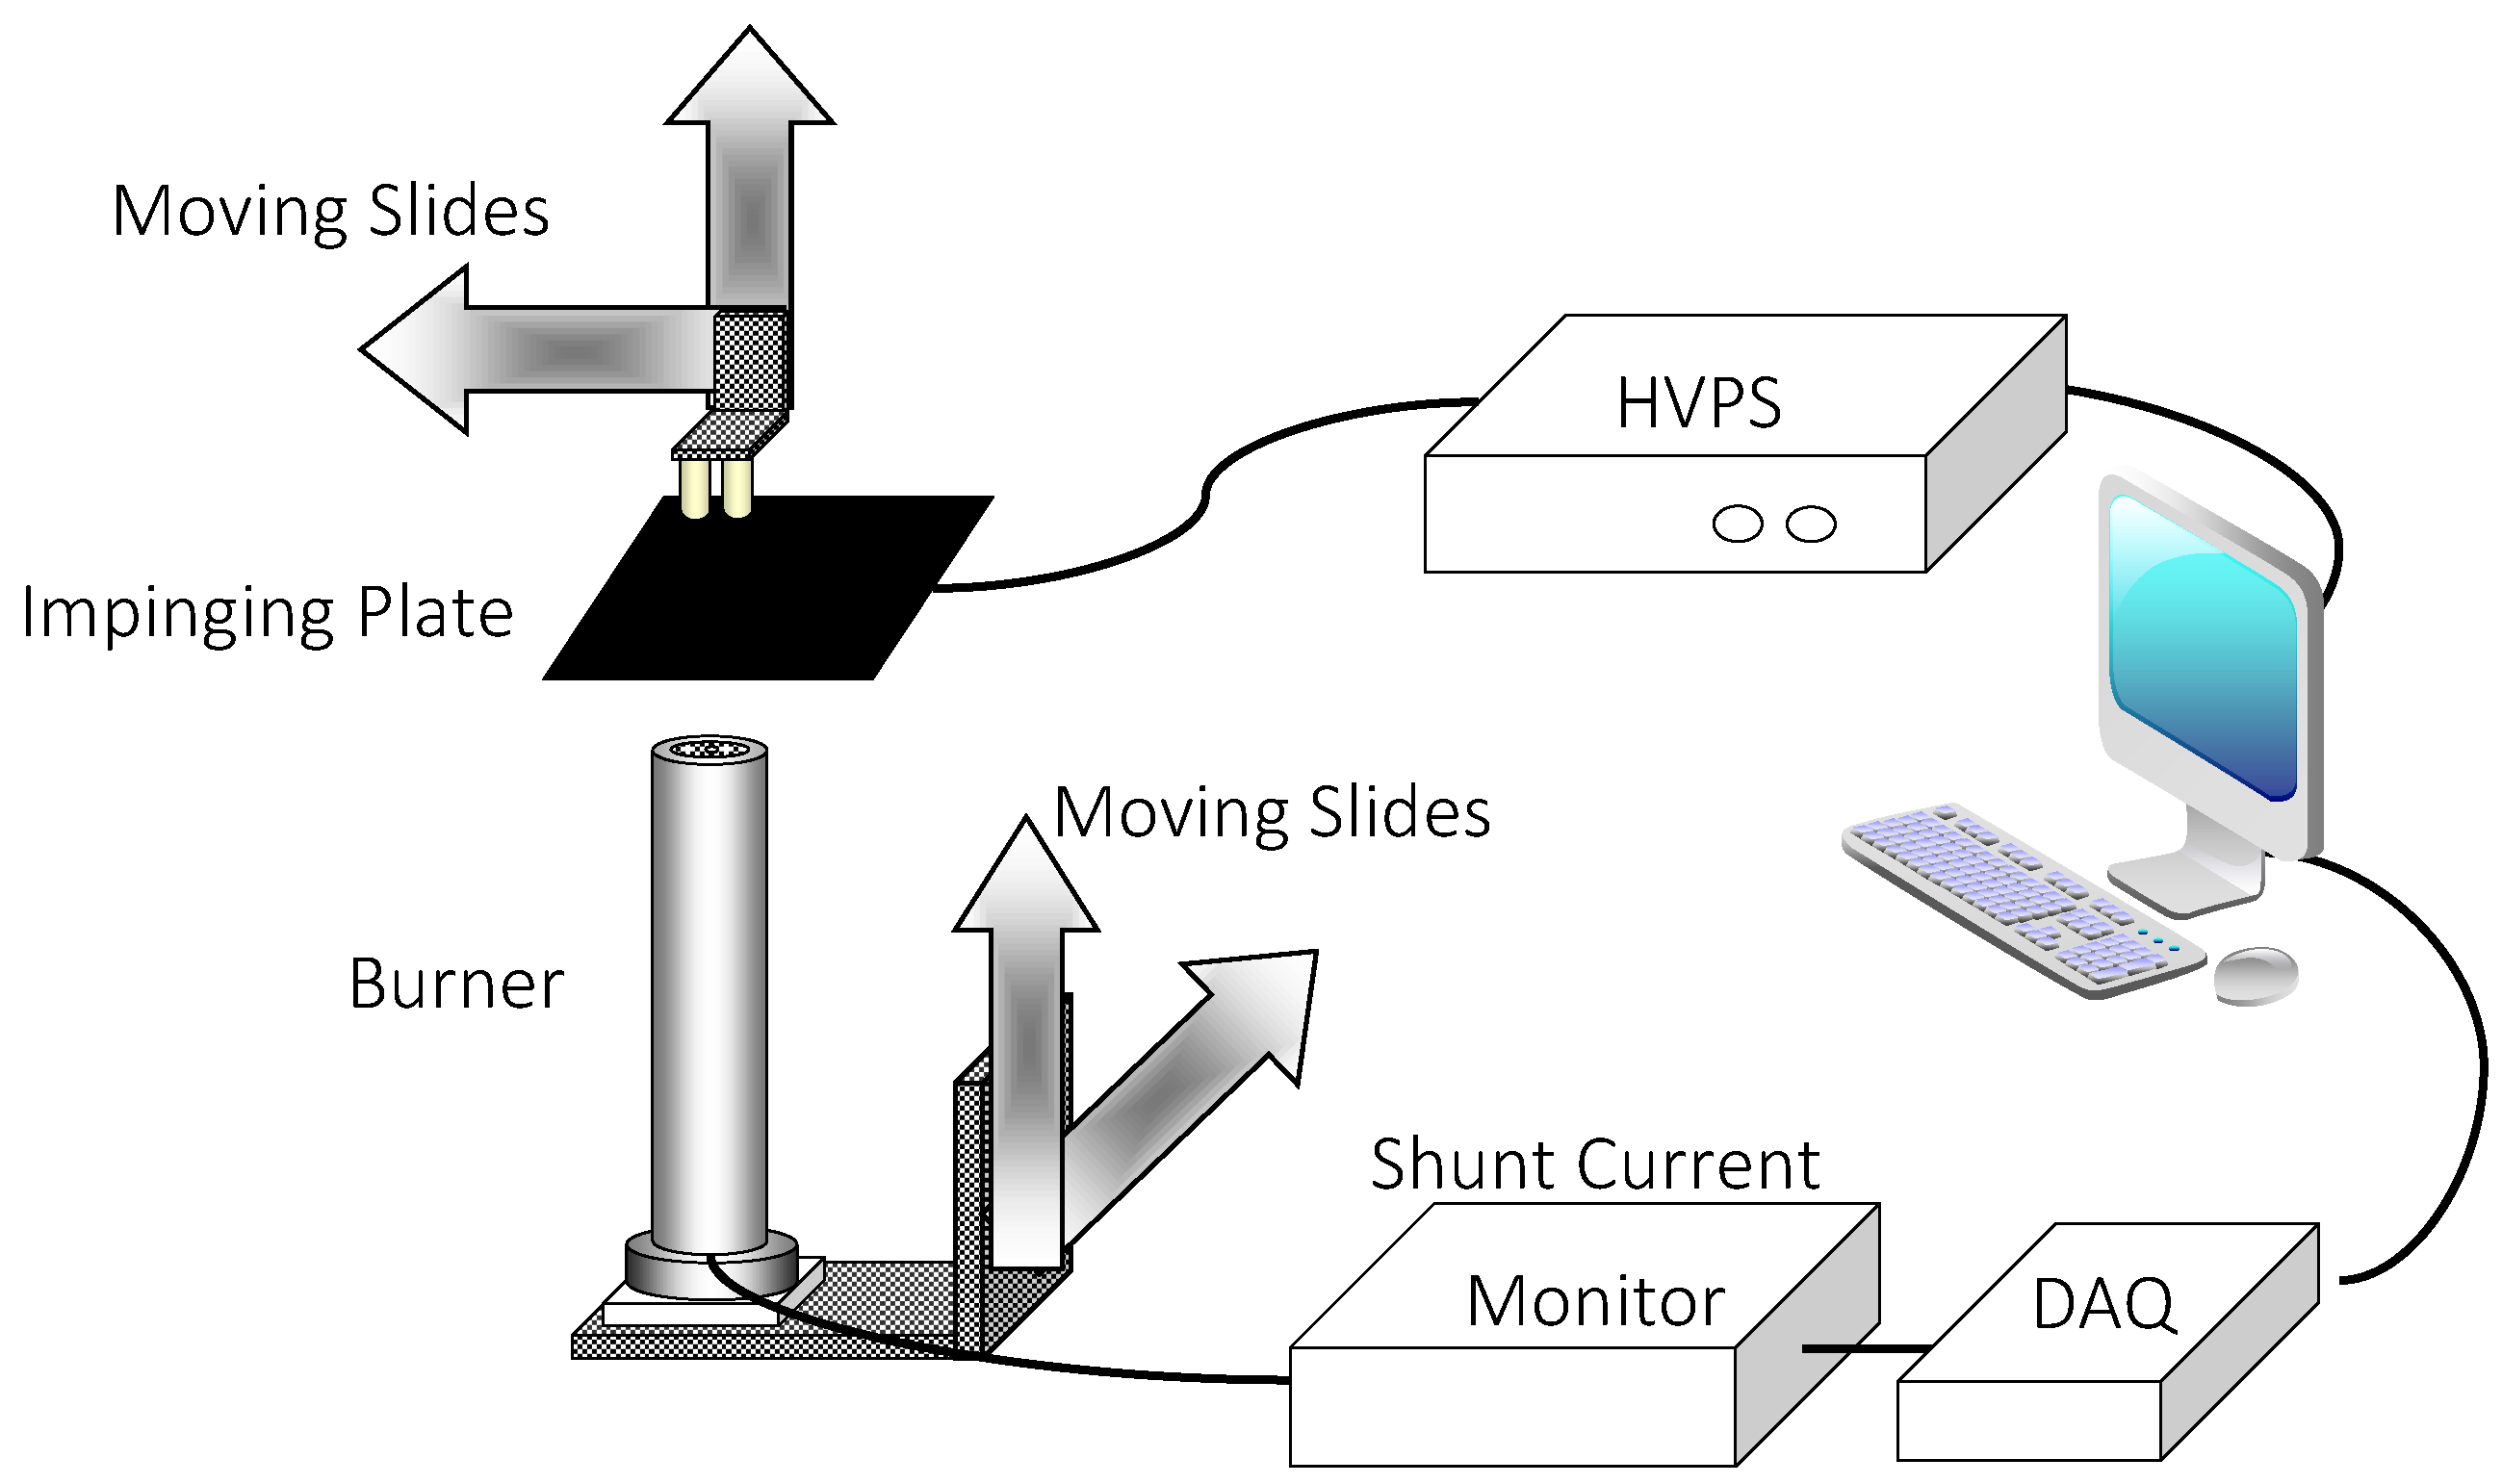
A coflow burner with a 2 mm inner diameter tube at the center flows fuel of 100% methane. The fuel tube is surrounded by a bead bed through which the surrounding air flows, ensuring a uniform coflow. The impinging plate is 4 in square stainless steel with 2 mm thickness. The material is chosen to be uninfluenced by the electric field and it does not introduce any catalytic effect [16]. The schematic of the burner is shown in Figure 1, and detailed information is described in [15]. The impinging plate is indirectly connected onto a vertical-axis translation stage through two cylindrical ceramic threaded posts for electrical insulation. The burner sits on a square Teflon block mounted onto moving slides in order to prevent conducting current through the base connection. The diffusion flame used for this work has flow rates equivalent to a constant nominal speed of 20 cm/s for both methane and air at the burner exit as laminar flow. The burner with the electric field monitoring setup is shown in Figure 2. A high voltage power supply (HVPS, TREK Model 609A-3) is connected onto the impinging plate and controlled by a computer using MATLAB with a data acquisition board. The power supply can produce from −10,000 volts to +10,000 volts with a response time below 10 ms. To ensure that the voltage is applied properly to the flow field without reaching electric discharge, the ion current from the flame is monitored during the experiment using a shunt resistor system with a National Instruments data acquisition card (NI-DAQ, SCB-68). As with all experiments that use only natural flame chemi-ions, the typical electrical power needed for affecting the flame is several orders of magnitude lower than the thermal power of the combustion (in this case, mW of electrical power versus 10’s of W of thermal power).
2.2. Electric Field Influenced Flame
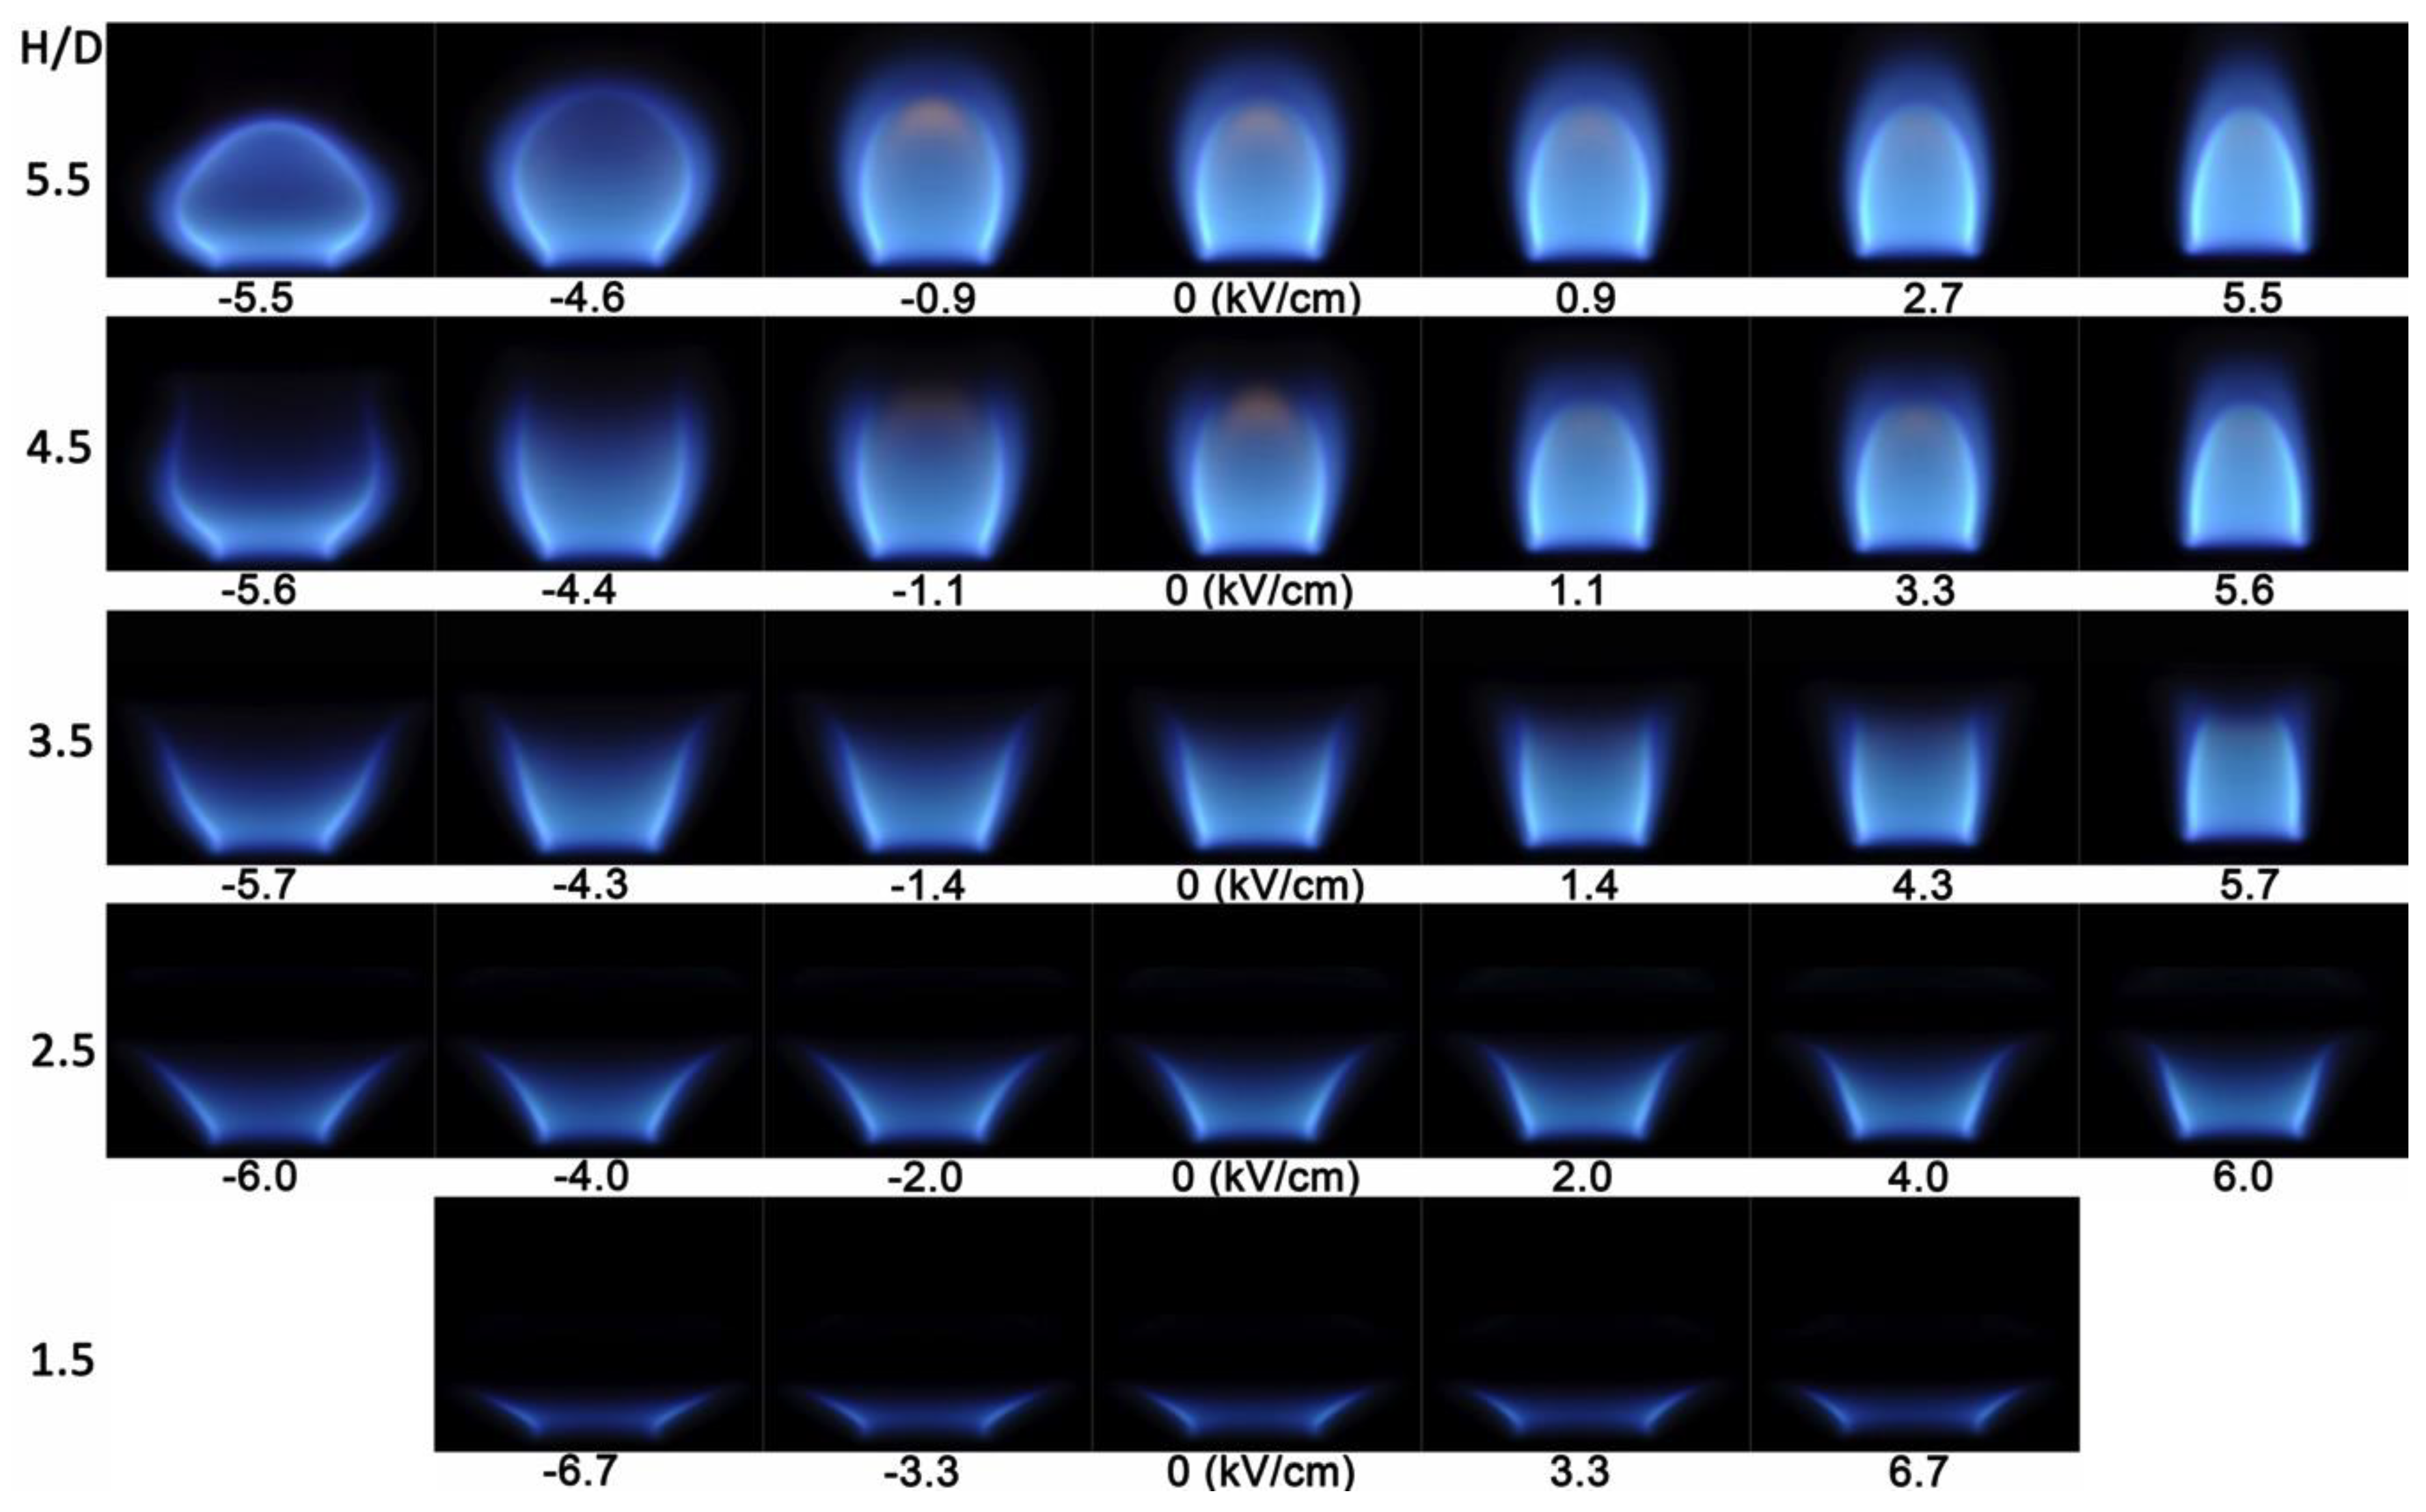
A composite image of flames at various plate-to-burner spacing and various electric field strengths is shown in Figure 3. The nominal field strength, Enominal = −ΔV/H, is marked under each flame image [17]; H/D denotes the plate height to the diameter of the fuel tube. This paper refers to positive or negative field strength (instead of the polarity on the plate), which coincides with the direction of the ion driven wind for the more commonly seen positive ion dominated flows (i.e., positive ions flow from high toward low potential). At each H/D in Figure 3, the positive field condition is on the right-hand side, representing negative charges flowing to the burner while the left-hand side has a negative field. With a positive field, the electric field drives positive ions and the ion wind towards the plate so that the flame is pulled upwards. The luminous zone at the flame front is brighter presumably because the ion drift wind (also known as the Chattock wind [18]) has entrained more oxidizer and enhanced the reaction zone. For negative fields, the downward ion wind pushes down on the flame, causing it to open. At H/D = 2.5, the flame is already opened by the stagnation flow. Nevertheless, the flame opens wider with increasing negative field strength. At H/D = 1.5 the flame shape is not affected by the field as the stagnation flow dominates the shape. The flame extinguishes when a field is applied above the maximum limit in both field directions. At each different plate height, the range of the electric field is shown that can operate on the flame without extinguishing it and without producing corona or arc discharge. The limits of the electric field become narrower as the gap between the plate and the burner decreases. With this qualitative understanding of how the flame shape changes under the influence of the plate and the electric field, it is now possible to examine linkages to the heat transfer between the flame and the plate.
3. Experimental Methods
Temperature and species concentration measurements in flames that have an electric field applied have been a challenge for exploring local property distribution because probes of any kind disrupt the electric field significantly. Non-intrusive measurement therefore is the only choice, and in this work, an infrared camera is used to understand how the temperature distributes across the impinging plate as a function of the electric field applied to the flame. Schlieren imaging shows how the thermal structure in the gas flow varies with the electric field. Details of the detailed Schlieren technique can be found in [19].
3.1. Infrared (IR) Thermal Distribution Imaging
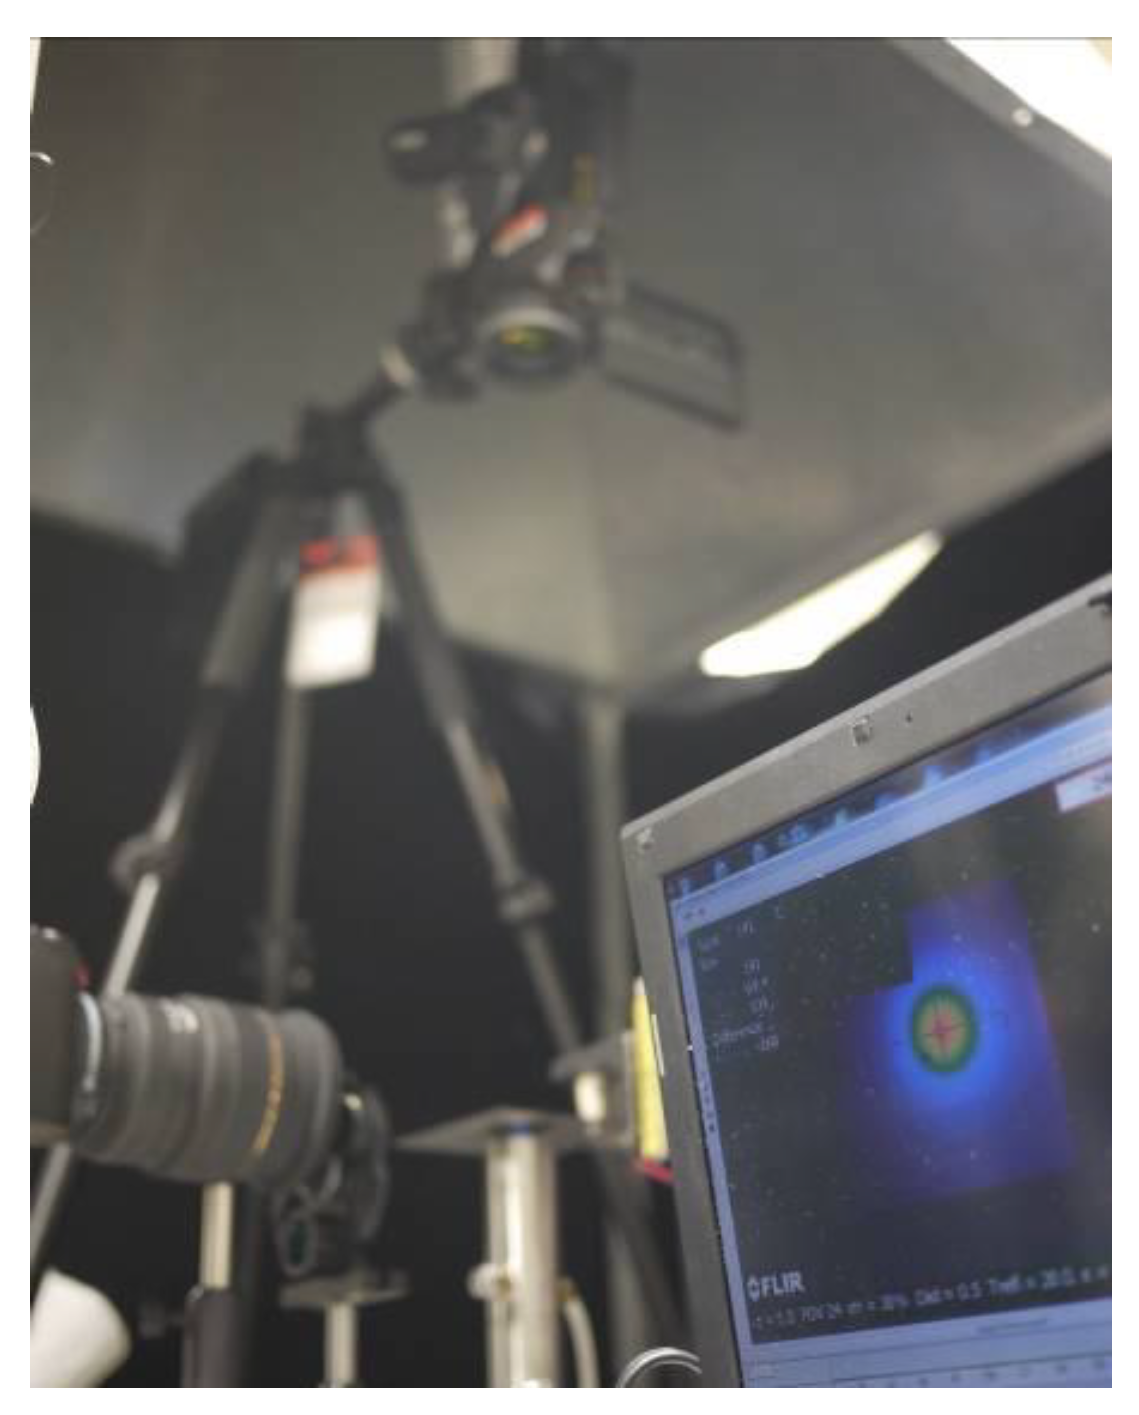
The camera (FLIR SC620, FLIR, Wilsonville, OR, USA) measures radiative emission in the range from 7.5 to 13 microns, and it is situated directly above the quenching plate at normal incidence (to avoid complications associated with Lambert’s Cosine Law). The camera is controlled by its native commercial software (ExaminIR, an example image is shown on the computer screen in Figure 4). The impinging plate is painted black and is considered a blackbody object. This assumption was confirmed using thermocouple temperature comparisons at several locations.
The RGB image taken at thermal steady state shows a well-distributed temperature change on the plate that concentrically decreases outward. The IR camera is actually measuring the radiative emission from a thin layer of heat resistant spray paint to avoid emissivity variation in the raw metal. A validation measurement with a K-type thermocouple was conducted over the plate at the same spots comparing temperatures with painted and non-painted surfaces with an absolute error of less than 3.6%. Therefore, the temperature shown in the image can be interpreted safely as the local temperature of the plate. The measurement was recorded 60 s after changing the electric field, by which time the temperature is steady. Pressure changes that affect the incoming flow during the experiment can affect the flow rate as a result of the blockage resistance to the small jet flow impinging on the plate. The different flow rate affects slightly the temperature measured from the infrared camera, showing that about 1 mL/min difference (5%) changes the maximum plate temperature 2 K (<1%) [20]. The initial IR images are taken over a field of view that includes the optical table and the obscuration of the electrically insulated mount. The images were then cropped and processed to full plate thermal fields using reconstructions that assumed a cylindrically symmetric distribution [21].
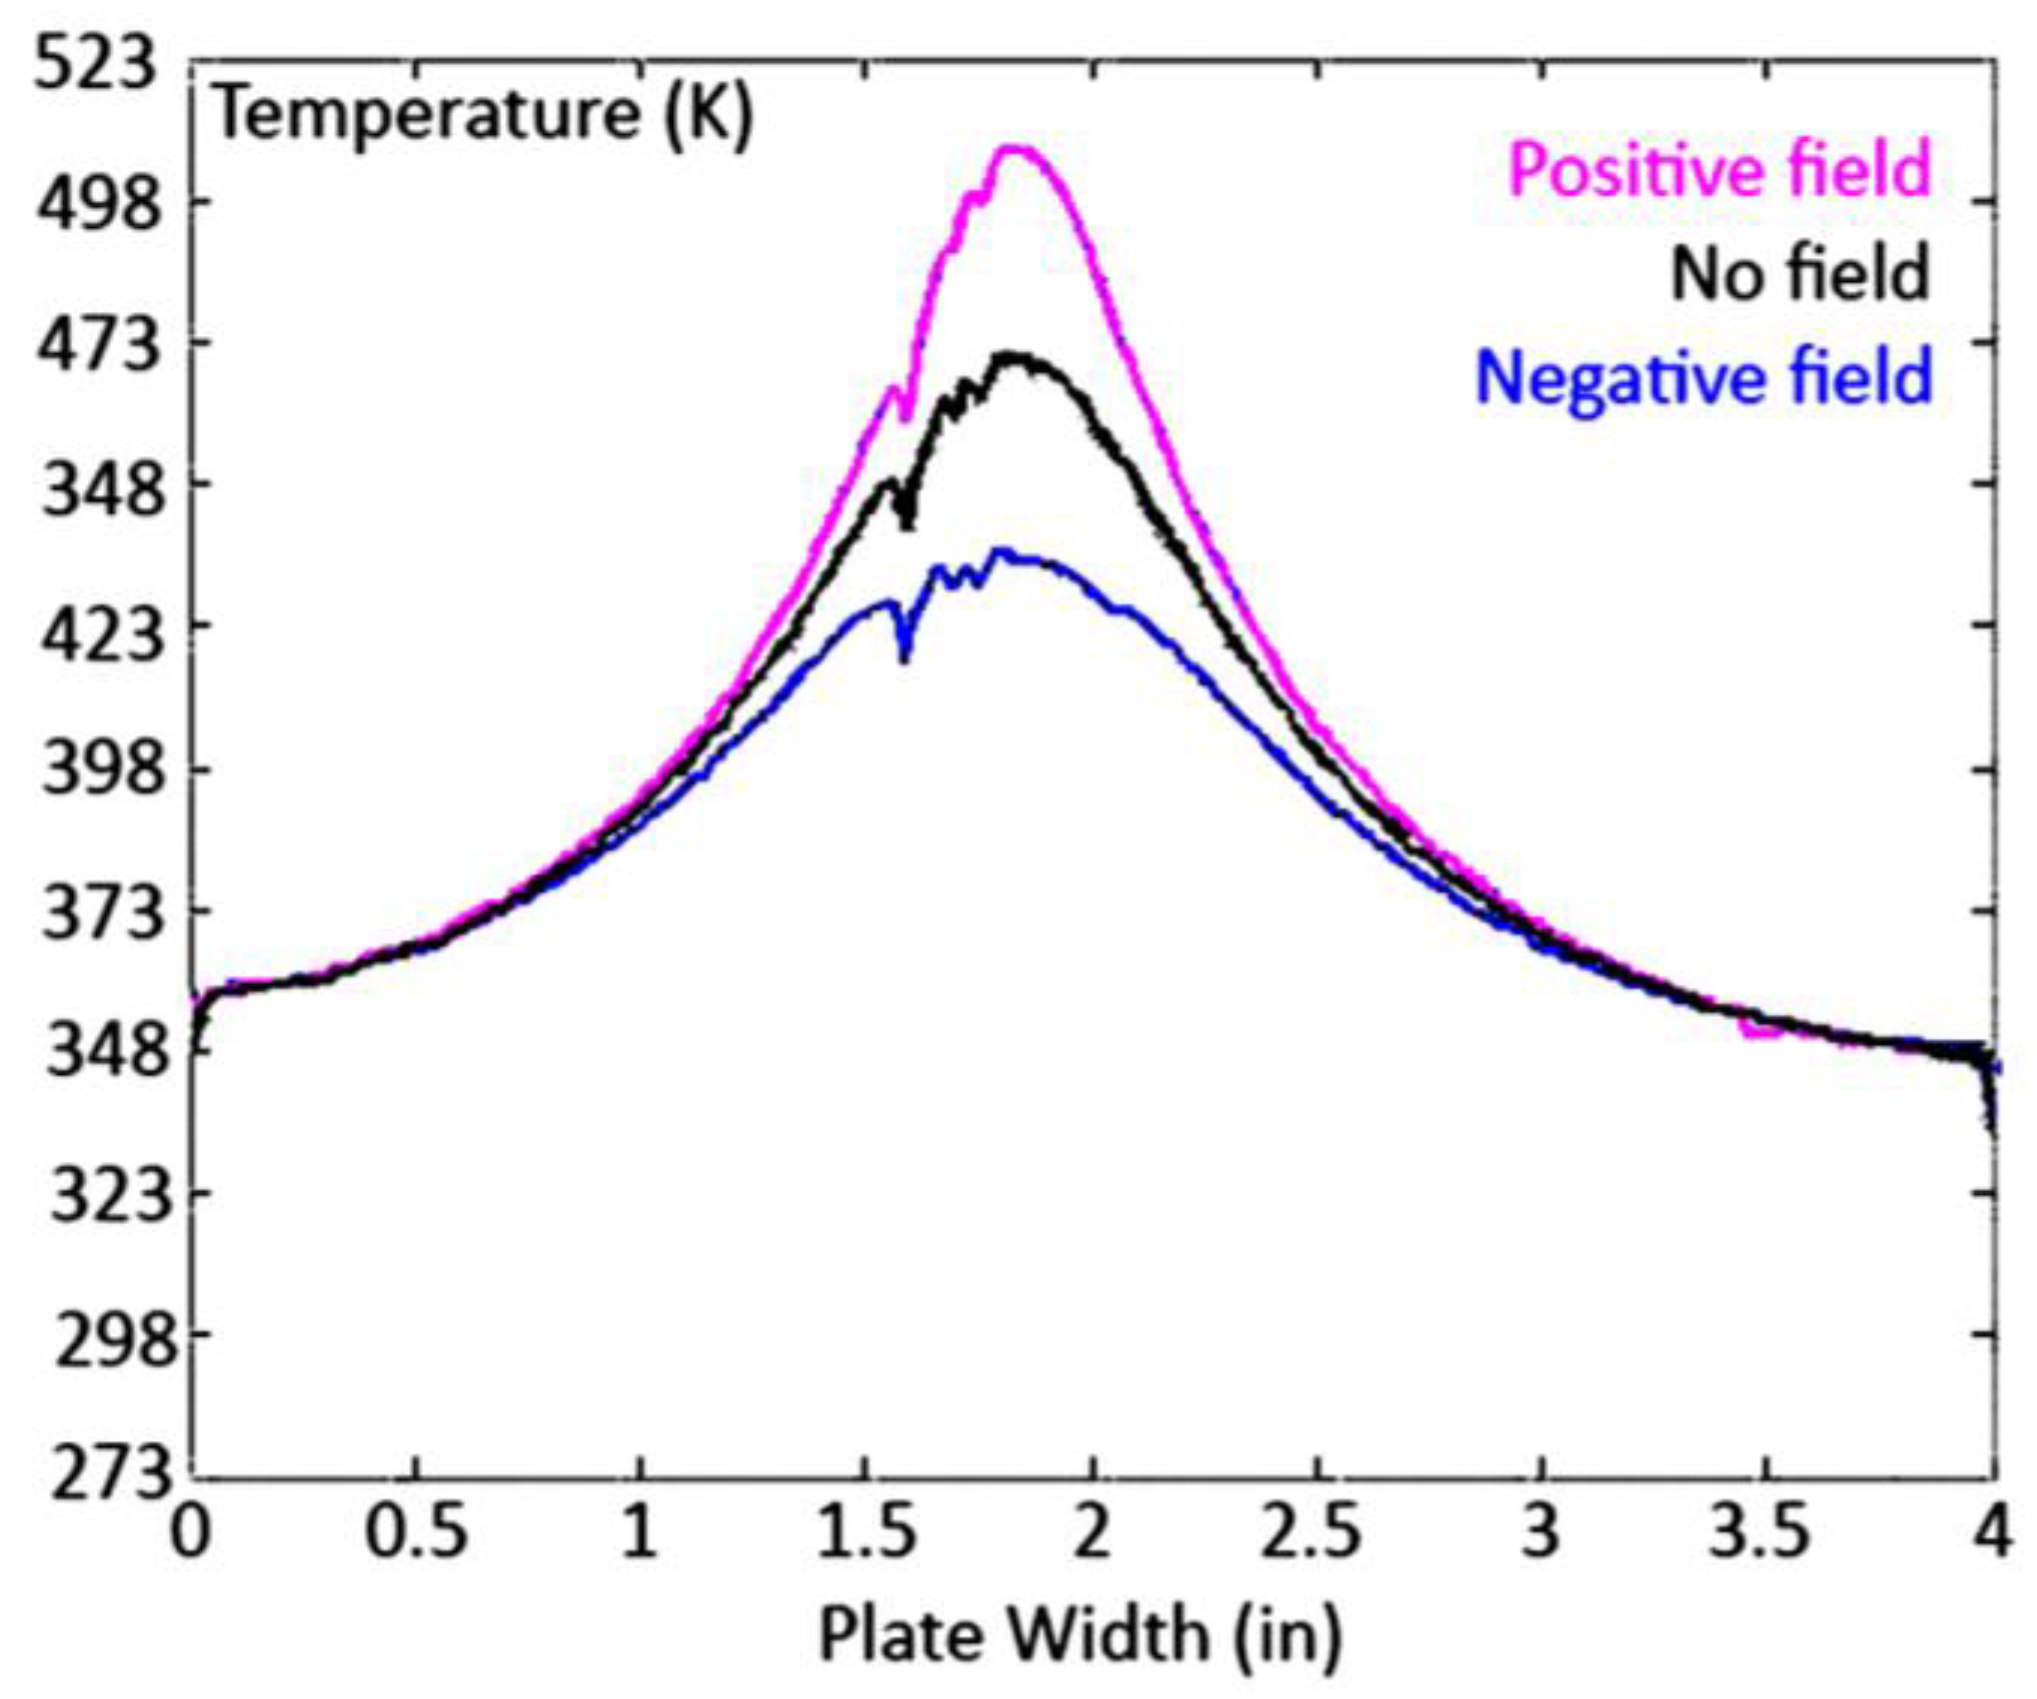
Figure 5 shows the conversion of an acquired thermal map from the 2-D image of the IR camera into a local temperature profile across the plate, when it is H/D = 4.5 from the burner. The overall temperature distribution is approximately a cylindrically symmetric Gaussian with a central hot spot. With a negative field, the peak plate temperature is lower and the profile is broader while the positive field case has a higher peak temperature and narrower profile. The small aberrations on the left side of the peak in the profiles occur because defects in the black paint on the plate give variations of local emissivity. This information suggests that the heat transfer over the impinging plate can be altered or improved by the electric field and, moreover, that the electrically controlled flame might improve the targeting of heat transfer to surfaces.
The experiments are conducted in open air without plate temperature control so it is important to also consider the broader heat transfer processes involved. The heat transfer around the plate balances forced convection from hot flame products on the bottom surface of the plate, conduction through the plate, heat convection out from the surface into the air, and radiation from all the surfaces to the surroundings, until the system reaches thermal steady state (Figure 6) [15]. Because the plate is very thin with relatively low thermal conductivity, radial conduction inside the plate is not significant. The heat transfer around the boundary near the plate can be written as:
Heat into the plate = Radiation + Convection
Straightforward heat transfer analysis shows that the radiation from the paint on the top surface provides a reliable measure of the impinging heat from the flame on the underside of the plate.
3.2. Schlieren Imaging
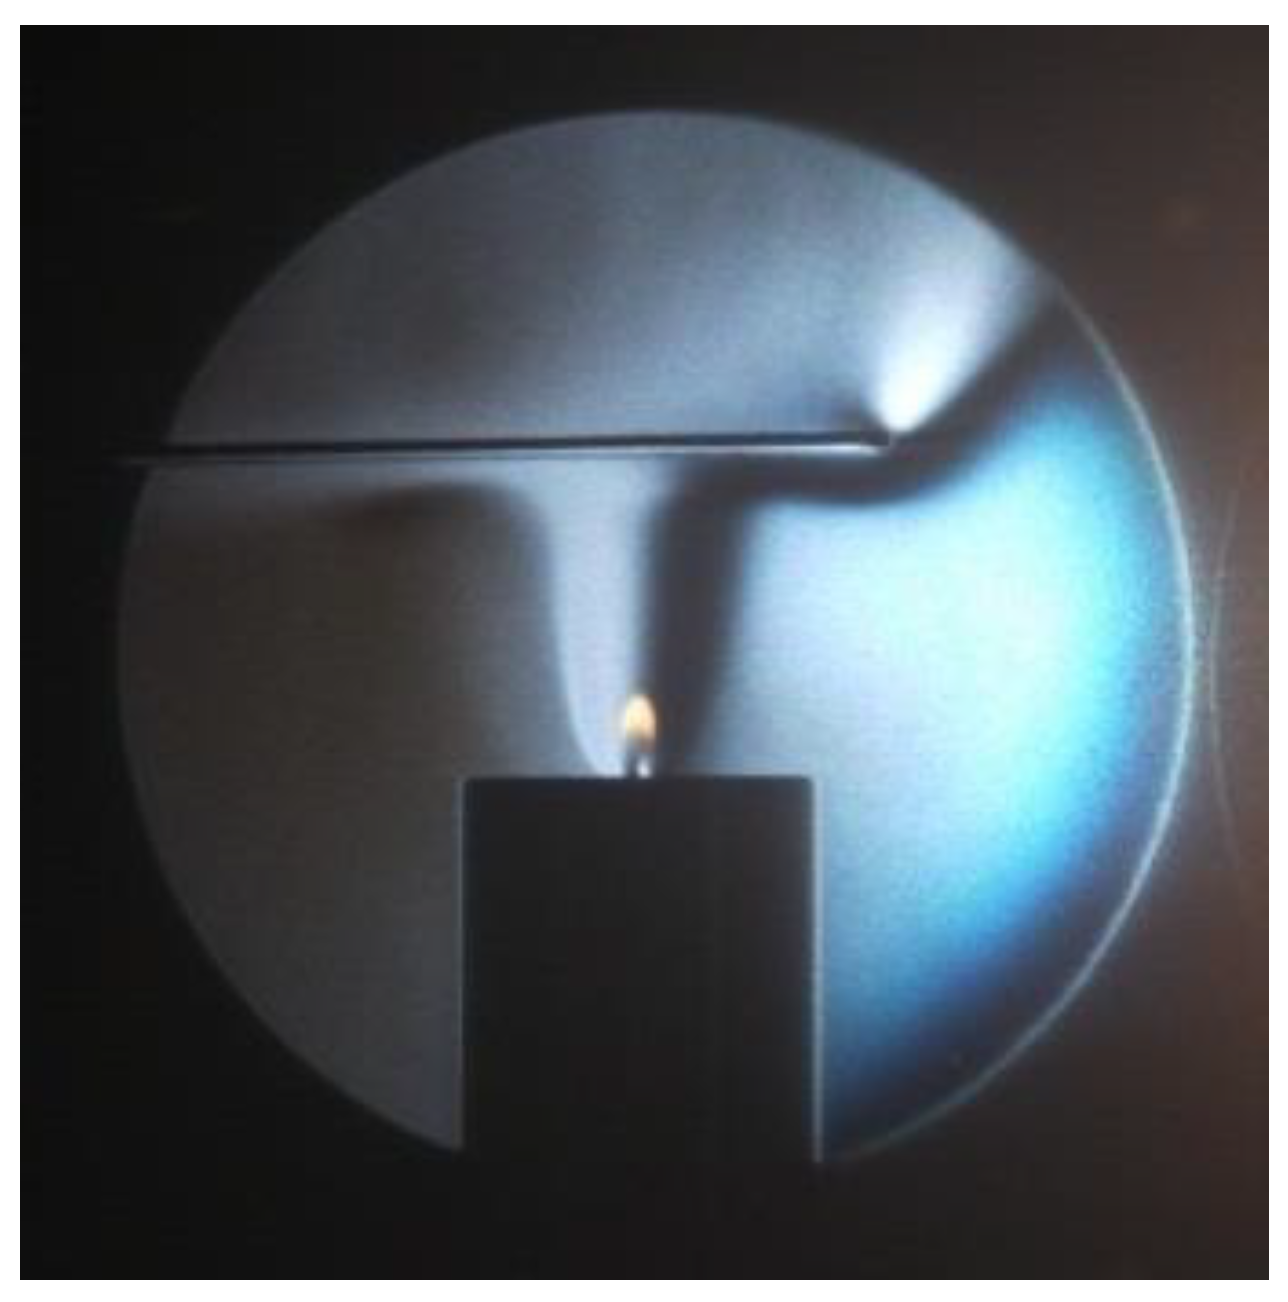
A Z-type Schlieren imaging technique is used in order to understand better how the thermal flow field changes near the surface under electric field control. The setup in this research includes two 6 inch diameter parabolic mirrors, which reduced spherical aberration as compared to equal sized lenses [21]. An arc lamp provides white light as a bright but not tightly constrained source. This light is then focused by a convex lens. An optical fiber collects the focused light and acts as a point light source at the focal point of the first parabolic mirror. The reflected light from the mirror travels parallel and across the test zone to the second mirror situated at its focal distance of 45 inches. A knife edge is placed at the refocused light from the second mirror to partially block the light that has been deviated by the refractive index gradients in the test section. The generated Schlieren image is then projected onto a glass screen by an achromatic lens. Figure 7 is a Schlieren imaging demonstration for this experiment with the plate at its furthest downstream location. The image includes a focused sooting flame at the center of the gradient thermal plume that shows the stagnation flow at the plate created by the rising hot gases. The quality of the focused Schlieren image in the figure shows clearly the size of the flame relative to the size of the thermal plume in this configuration.
4. Results and Discussion
4.1. Heat Transfer from Impinging Flames in Electric Fields
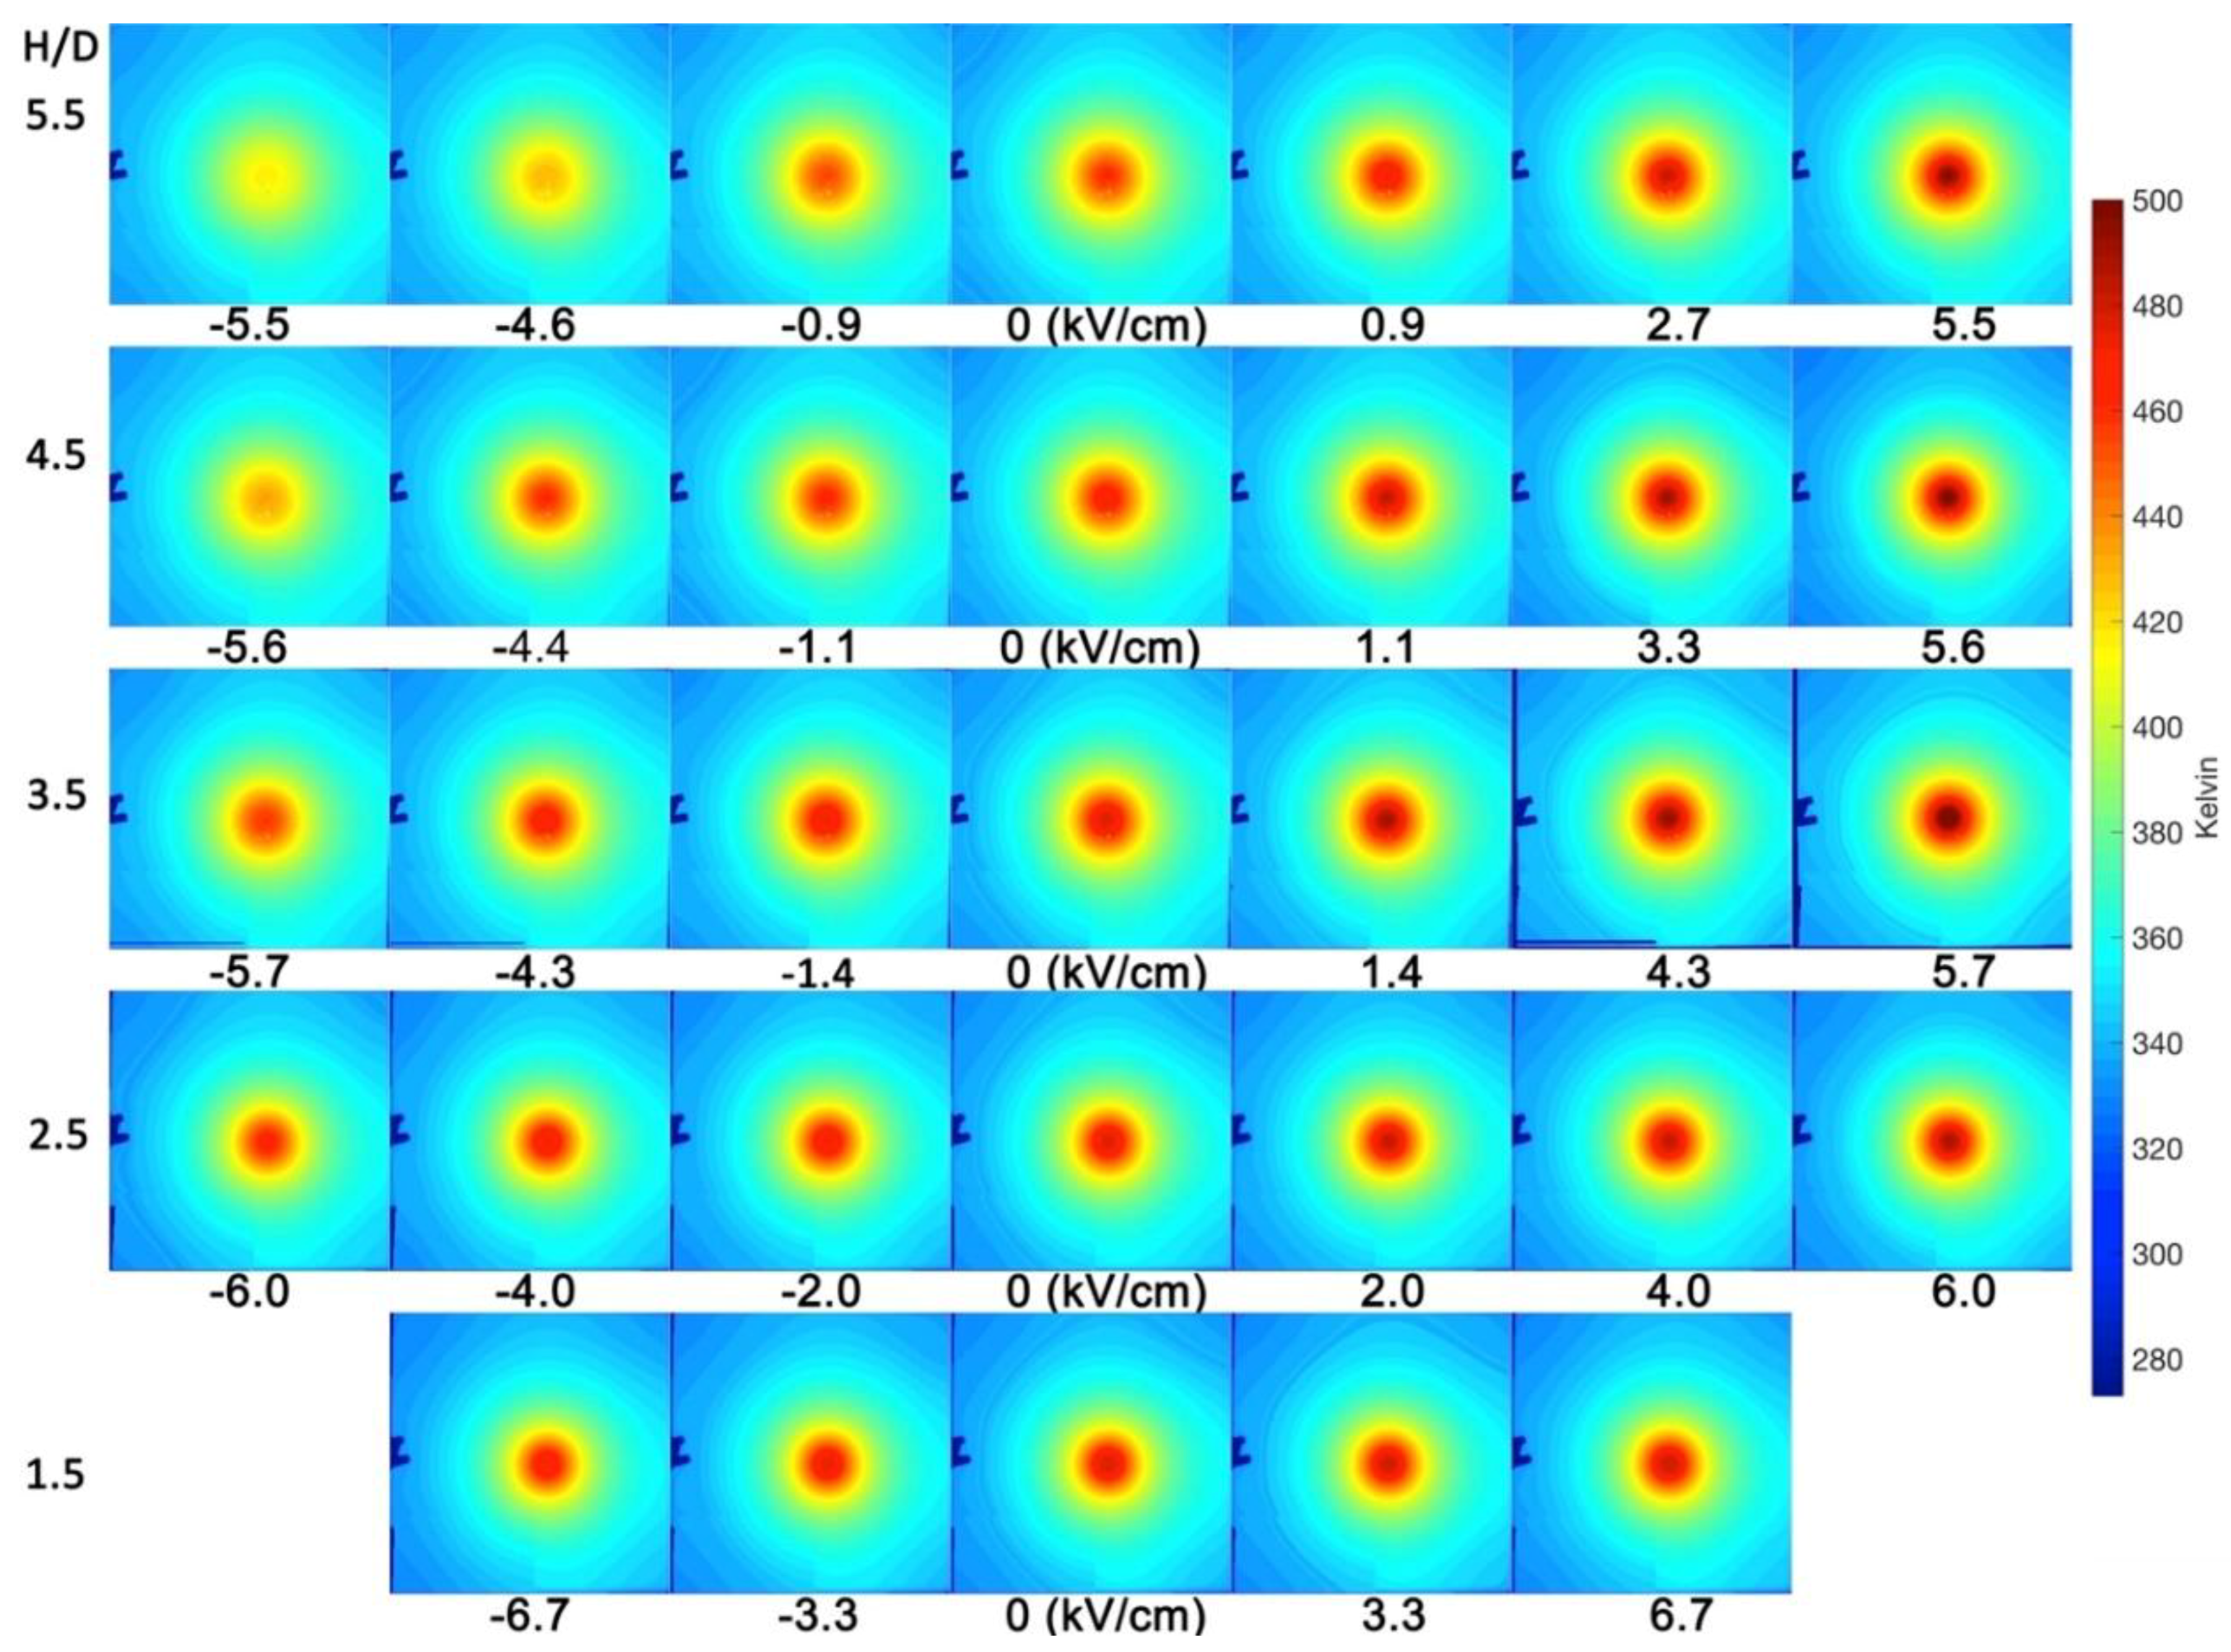
An overall image that shows the changes in the thermal maps with the changing electric field and the plate-to-burner distance is shown in Figure 8. The images show the full portion of the impinging plate (4 in × 4 in). The plate temperature in the outer region (>20 jet diameters away from the flame center) remains similar (330–350 K) throughout all of the experiment conditions. The matching overall Schlieren image, Figure 9, shows that the thermal plume is created in the hot flame region and it then spreads along the impinging plate. The small flame jet at the exit of the burner region indicates where the jet flame front is [15]. The Schlieren images of the hot gas around the flame impinging on the plate demonstrate that part of the insensitivity of the heat flux to the electric field is because the thermal plume is far larger than the flame, and so the electric field has less dominance on it, while the near flame core is affected substantially by the field. For reference, the luminous zone of the flame under this condition extends approximately halfway across the H/D = 4.5 electrode gap.
The results present the influence of the downstream plate on the heat distribution and also the role of the stagnation flow geometry. From the IR mapping, the peak temperature is rising and extending with the increase of positive field strength. At the same time, the stagnation thermal zone is narrower near the plate as the positive ion-driven wind is directed upward. On the contrary, with decreasing negative field strength, the peak temperature drops and the stagnation thermal plume expands into a broader zone as the ion-driven wind is directed downward. The combination of IR image and Schlieren visualization indicates that the electric control of flames has a clear effect on the flame jet and its thermal plume, and the effect changes the plate temperature whenever H/D values are larger than 2.5. The cases at lower distances, H/D = 1.5, encounter flow regions where the momentum of the gas jet plays the more dominant role.
4.2. Heat Loss from the Plate
Figure 10 shows the total amount of heat dissipated from the plate as a percentage of the total thermal power assumed to have been generated by the flame (from complete combustion of the fuel) and available at the bottom of the plate, 25 watts. The heat loss includes free air convection from the plate top, with a convection coefficient set at 12 W/m2K [22], and radiation from both sides of the plate, with the emissivity set at 1. Based on these values, the temperature profile is consistent with 5–6 Watts (20–24%) of heat transferred to, and lost from, the plate at steady state. It appears that when the impingement is close to the heat source (i.e., for H/D < 4.5) the total amount of heat loss over the plate is not affected by the electric field. This is because the plate is so large relative to the heat source that the electric field focusing of heat does not change the integrated heat addition. The overall heat loss for both polarities at the two sides in the strongest electric field cases has a tendency of decreasing at the same plate height. It is worth noticing that at H/D = 5.5 the heat loss grows from the negative field to the positive field, suggesting that the largest effects on heat transfer for impinging flames occur when the plate has not begun to interact with the flame significantly but is a recipient of the thermal exhaust from the flame. At the lower impinging plate positions, such as H/D 1.5 to 3.5, the overall heat loss from the entire plate does not vary significantly over the full range of the electric field applied. This suggests that the plate location dominates the heat transfer rather than the electric field acting on the flames. However, the temperature profile across the impinging plate with different polarities of electric field tells a different story.
4.3. Heat Concentration Under the Influence of an Electric Field
Figure 10 conveys the information that the total heat loss is not affected by the electric field when the flame is close to the plate; i.e., for cases below H/D = 4.5. It is clear from Figure 5, however, that the temperature profile does change with the field so it must be that the electric field is affecting the distribution of heat flux rather than its overall integrated value. Quantifying this situation involves the radial analysis of heat loss from the center of the peak temperature extended outward. A heat flux by percentage mapping example, Figure 11, demonstrates these rings mapped from the hottest spot with different percentages of the total heat flux from the plate. We can then compare how the temperature profile changes between the different electric field strengths and burner-to-plate distances.
The analysis included six cases of heat rings from 20% to 80% calculated, with four distinct percentages selected and presented in Figure 12. The overall heat flux is growing as the rings move toward the hottest center. The heat flux varies under electric field control, with 80% to 50% heat rings providing from 400 to 700 watts per meter square, the 40% ring is 800–900 W/m2, 30% at 1000–1100 W/m2, and 20% can be as high as 1400 W/m2. At H/D = 5.5, the area-specific heat flux increases with the addition of the field from 2400 W/m2 to 3800 W/m2 from −5.5 to 5.5 kV/cm. These results show that the electric field is capable of changing the concentration of the flux and the associated temperature gradients even if it does not affect the total heat transferred. This is reasonable since the plate is much larger than the flame, allowing substantial time for the heat to transfer as the thermal plume spreads along the surface. The result would be far different for a small target, and in that case the electric field could effectively direct the heat to an intended location.
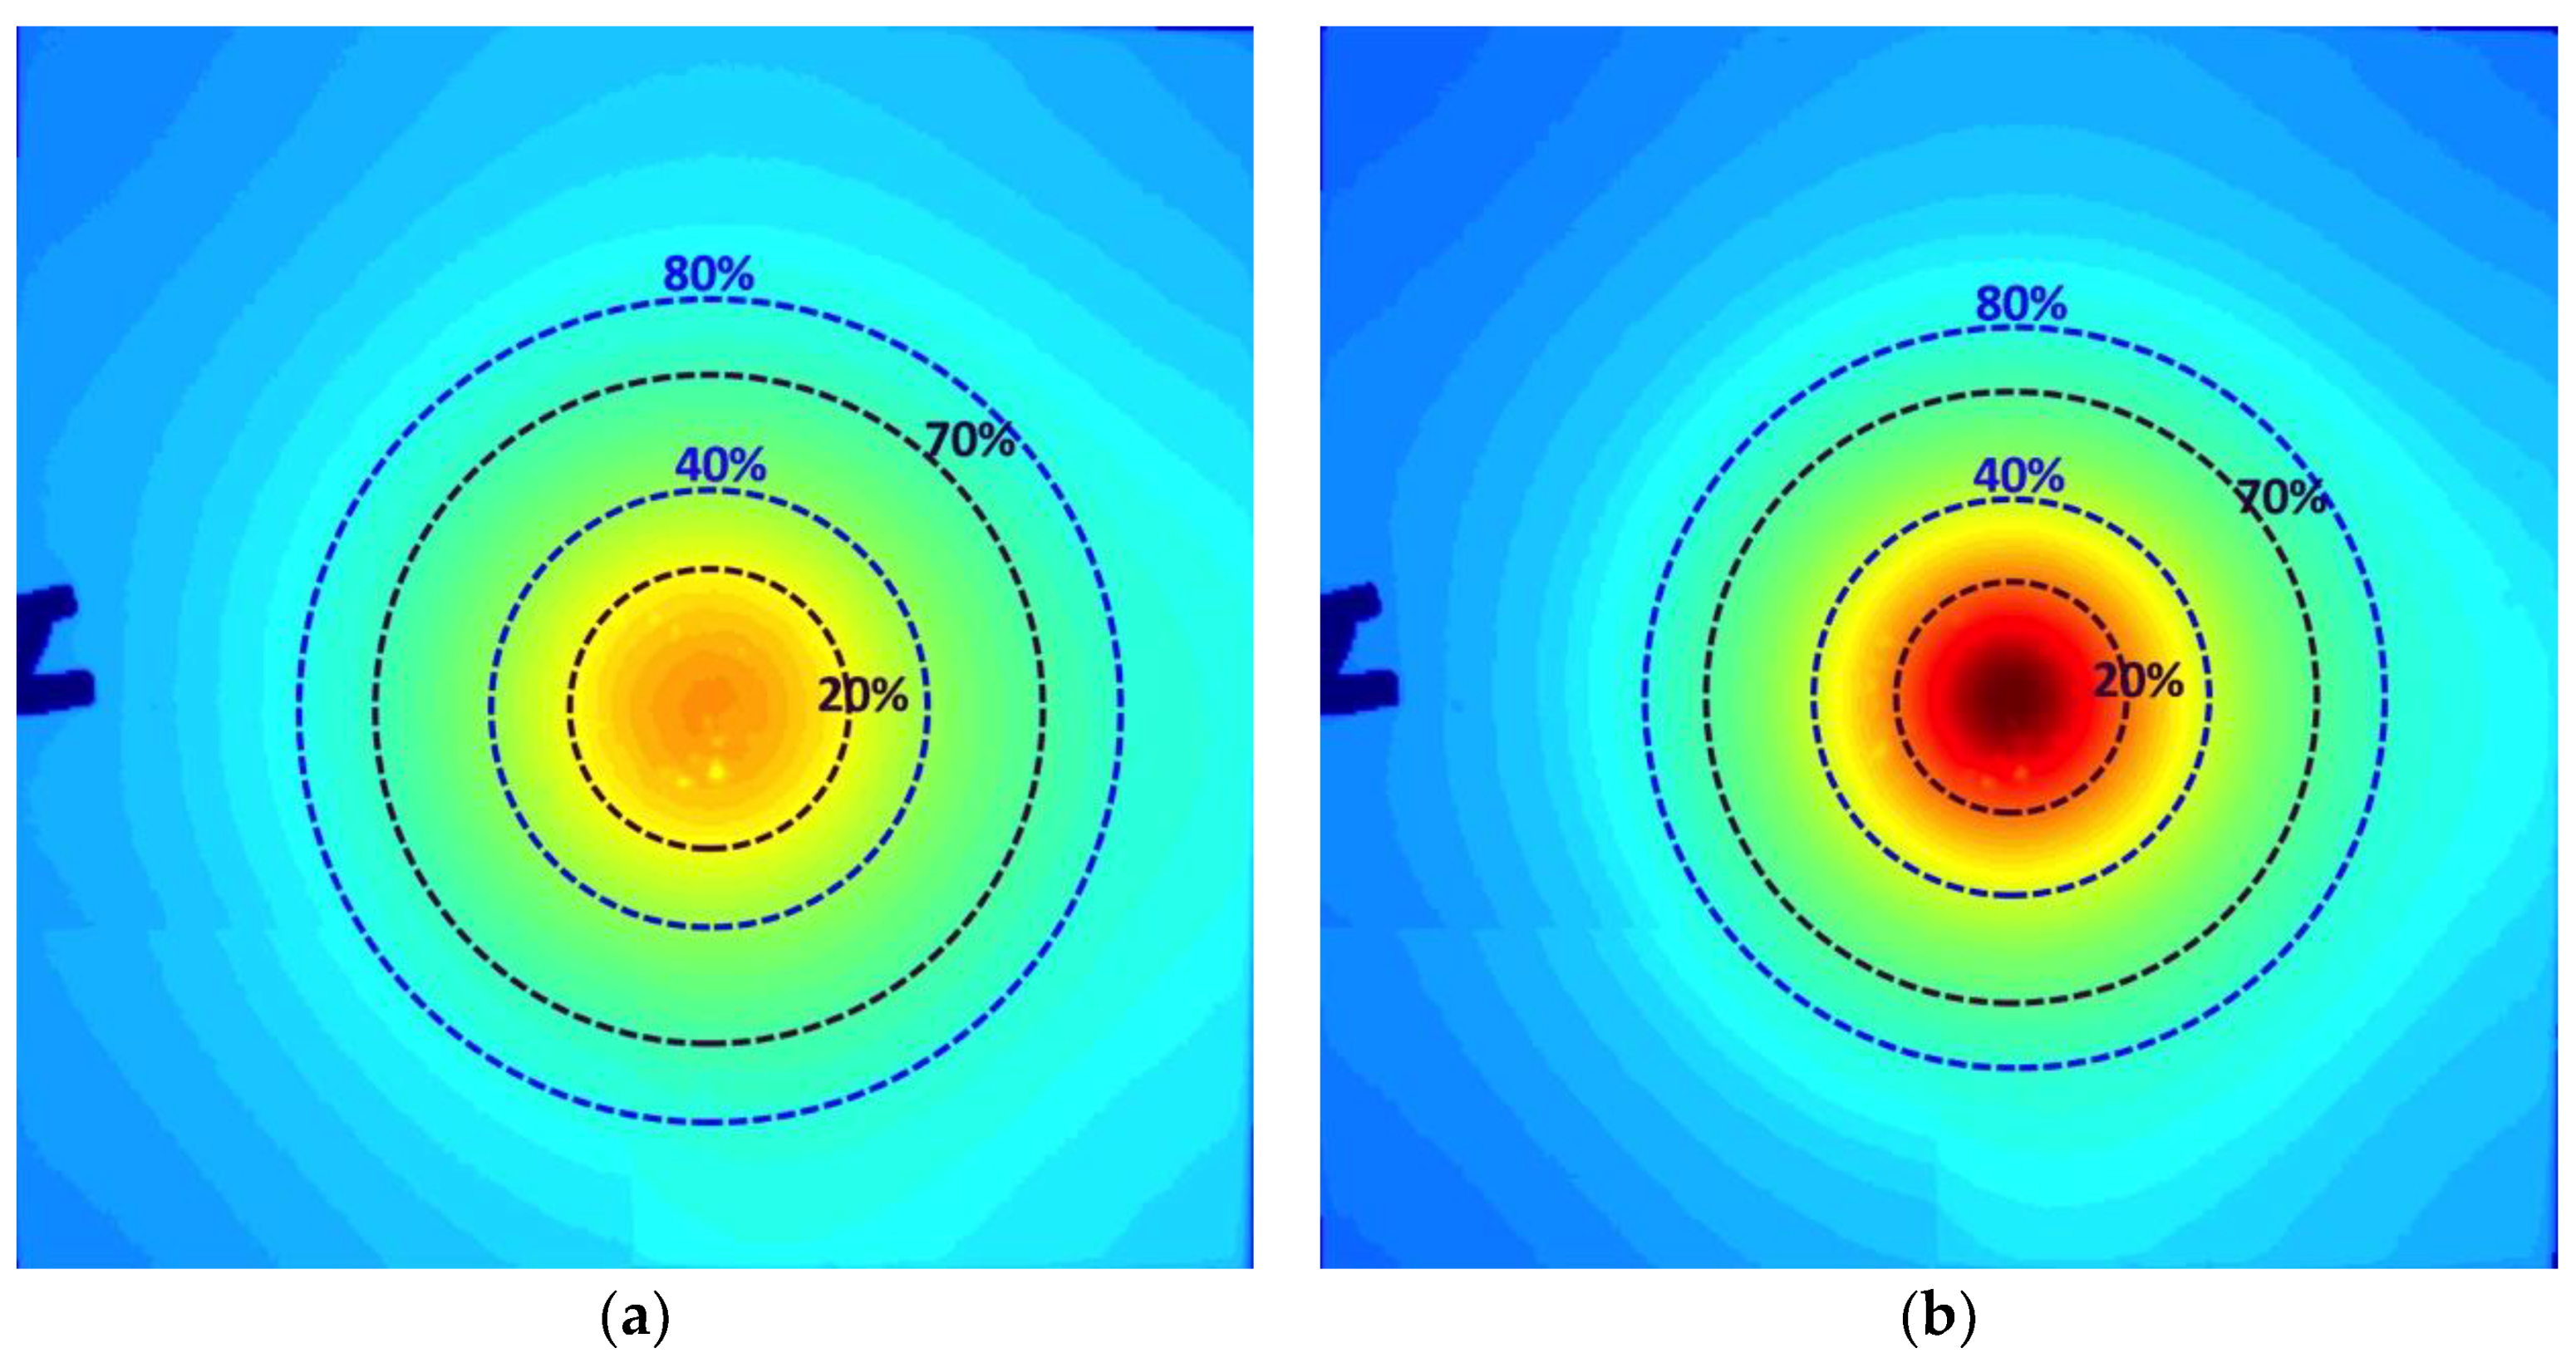
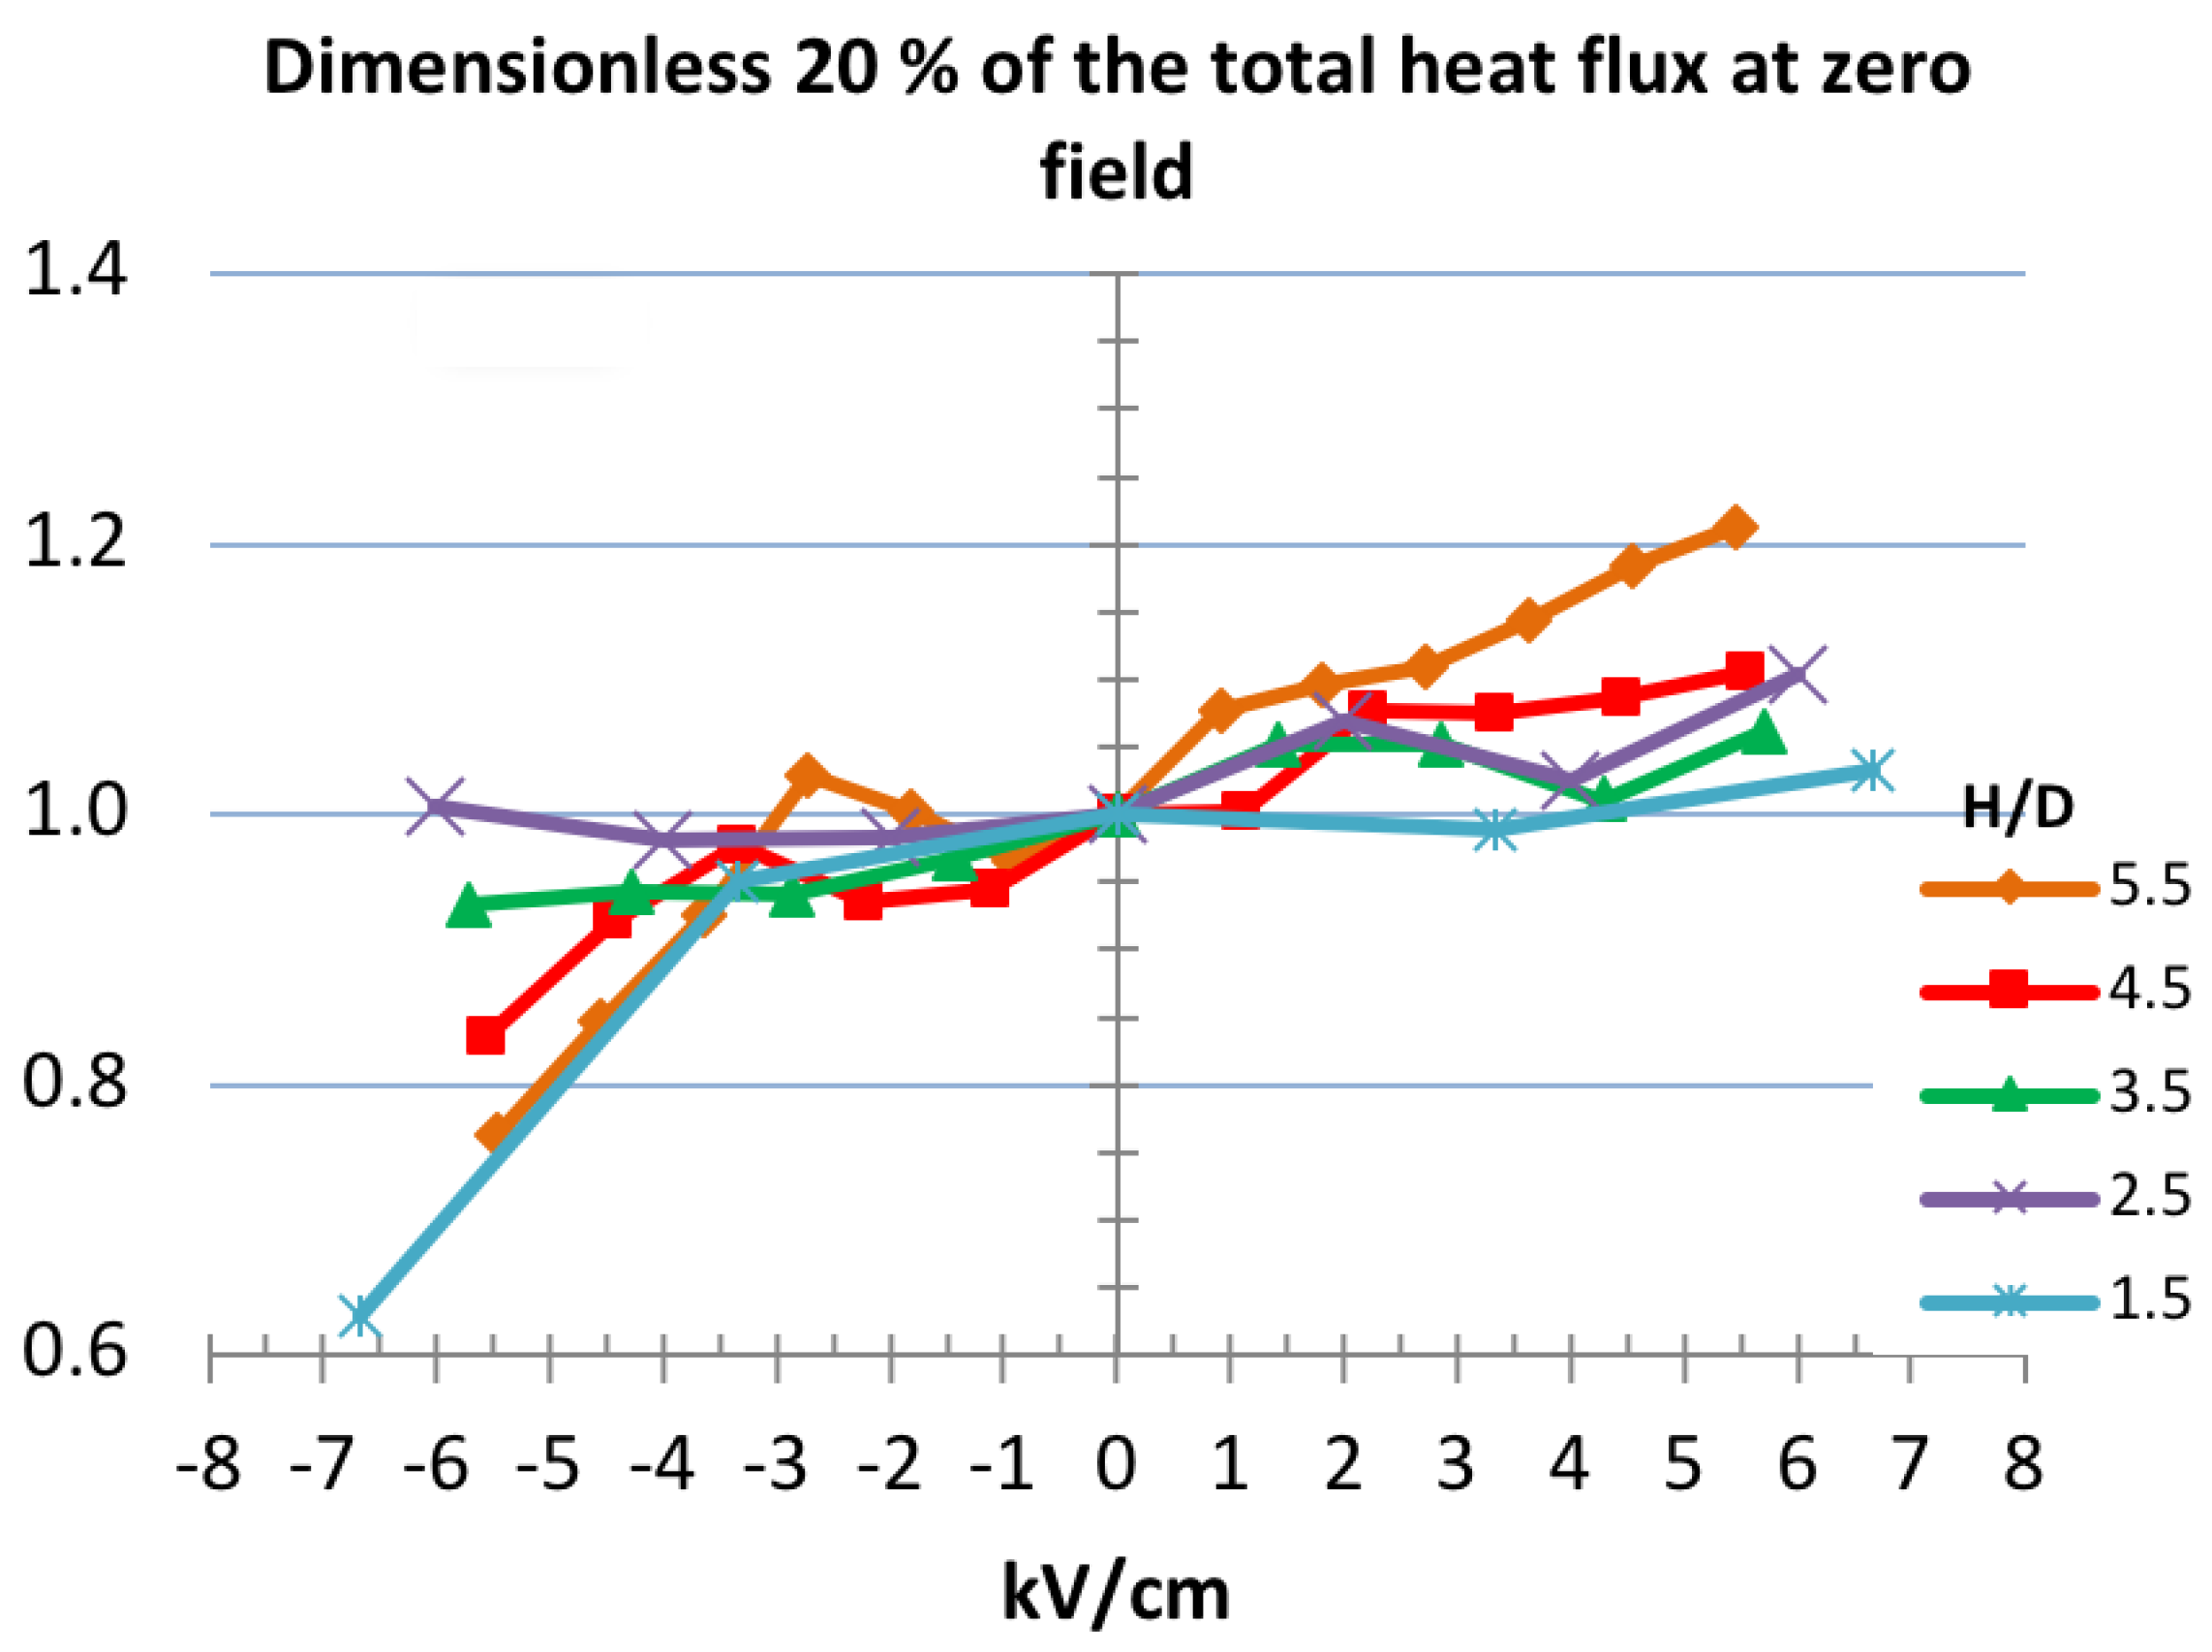
Figure 13 profiles the true physical scale of the heat rings at H/D = 4.5; the negative electric field spreads out the heat while the positive field concentrates the heat at the center. It is observed that the greatest relative size change of the heat rings is the 20% ring. Table 1 provides the 20% heat ring diameter at each plate height for all the electric field conditions, as well as the maximum temperature at the center. Note that since the flame is small (around 1 cm tall and 6 mm wide with no impinging plate and no electric field applied) the maximum temperature is at the center instead of in a ring heated by the circular reaction wings. The table shows that at each H/D, the maximum temperature increases not only with more electric field but also with the 20% heat ring size decrease. This result indicates that with the same 25 watt flame at the same impinging plate height, the heat flux can be concentrated with the more positive field and distributed with the more negative field. Furthermore, we take a close look at the 20% heat ring size normalized by the heat flux at zero-field at each height in order to make a relative comparison since the total heat flux for each experiment condition varies. Figure 14 shows how the electric field changes the heat flux between plate locations. It has a strong effect at H/D = 4.5 and less effect at lower locations, such as H/D = 3.5 and 2.5, when the plate starts spreading the flow by direct interruption of the jet flow and changing the flame shape. The H/D = 1.5 case is complex since the plate is very near the burner, affecting the flow, the heat release, combustion, and the heat transfer—further study is needed to fully understand the processes involved for this very small spacing case [23].
5. Conclusions
This study investigates the temperature and heat transfer of an impinging plate with the effect from electric fields acting on a flame especially up to the limits of the plate quenching the flame and up to the maximum electric field that can be applied without breakdown. The plate shows a broadened heating profile and lower peak temperature for the negative field (i.e., for a downward ion driven wind) and the opposite effects for the positive field and upward directed wind. The overall heat flux to the plate is not particularly sensitive to the electric field since the plate is much larger than the flame, but the level of heat focusing on the plate is changing with the electric field. The results demonstrate that the region responsible for the most intense 20% of the heat flux on the plate can be concentrated by the positive field with a peak temperature increase. This phenomenon can be observed for flames affected by close impinging plates at locations where the flame reaction wings are not significantly altered; i.e., at H/D 3.5 and above these changes are not as significant at lower plate heights H/D 2.5 and 1.5. In these low plate cases the orientation of the two reaction wings change. The normalized 20% heat ring at zero field strength indicates that when the flame tip has not yet been perturbed by the plate (i.e., at H/D from 5.5 to 4.5), the plate height dominates the heat flux. When the plate starts influencing the flame tip (H/D from 4.5 to 2.5) the electric field can produce the same heat flux at different plate locations. This finding shows that the same heat flux can be obtained with applying positive electric fields as from lower plate locations without electric fields applied. Further exploration is required to understand details of the advantages and disadvantages of lower impinging plate locations, for example, such as the production of carbon monoxide.
These results show that there is good potential for electric field focusing of heat from flames, and this would be particularly true in environments where the flame was not affected by buoyancy. Hence, zero-g heat focusing offers a particularly extreme example of potential thermal management and direction from flames using the ion-driven wind body force.
Author Contributions
Y.-C. Chien conceived, designed, and carried out the experiments. She also compiled and analyzed the resulting data as part of her Ph.D. dissertation. D. Dunn-Rankin shared in the discussion and analysis of the results, and contributed to the hypotheses presented. Y.-C. Chien wrote the paper with assistance from co-author D. Dunn-Rankin.
Funding
Funding was provided for this work by NASA through ISS Research Project via agreement NNX07AB55A
Acknowledgments
The authors appreciate the enthusiastic participation in experiments from Koji Yamashita.
Conflicts of Interest
The authors declare no conflict of interest.
References
- Prager, J.; Riedel, U.; Warnatz, J. Modeling ion chemistry and charged species diffusion in lean methane–oxygen flames. Proc. Combust. Inst. 2007, 31, 1129–1137. [Google Scholar] [CrossRef]
- Lawton, J.; Weinberg, F.J. Electrical Aspects of Combustion; Oxford University Press: Oxford, UK, 1969; ISBN 0198553412. [Google Scholar]
- Papac, M.J.; Dunn-Rankin, D. Canceling Buoyancy of Gaseous Fuel Flames in a Gravitational Environment Using an Ion-Driven Wind. Ann. N. Y. Acad. Sci. 2006, 1077, 585–601. [Google Scholar] [CrossRef] [PubMed]
- Karnani, S.; Dunn-Rankin, D.; Takahashi, F.; Yuan, Z.-G.; Stocker, D. Simulating Gravity in Microgravity Combustion Using Electric Fields. Combust. Sci. Technol. 2012, 184, 1891–1902. [Google Scholar] [CrossRef]
- Strayer, B.A.; Posner, J.D.; Dunn-Rankin, D.; Weinberg, F.J. Simulating microgravity in small diffusion flames by using electric fields to counterbalance natural convection. Proc. R. Soc. Lond. A 2002, 458, 1151–1166. [Google Scholar] [CrossRef]
- Advanced Combustion via Microgravity Experiments (ACME) Webpage. Available online: http://issresearchproject.grc.nasa.gov/Investigations/ACME/ (accessed on 10 May 2018).
- Volkov, E.N.; Kornilov, V.N.; de Goey, L.P.H. Experimental evaluation of DC electric field effect on the thermoacoustic behaviour of flat premixed flames. Proc. Combust. Inst. 2013, 34, 955–962. [Google Scholar] [CrossRef]
- Vega, E.V.; Shin, S.S.; Lee, K.Y. NO emission of oxygen-enriched CH4/O2/N2 premixed flames under electric field. Fuel 2007, 86, 512–519. [Google Scholar] [CrossRef]
- Weinberg, F.J. Advanced Combustion Methods; Academic Press Inc.: Orlando, FL, USA, 1986. [Google Scholar]
- Sakhrieh, A.; Lins, G.; Dinkelacker, F.; Hammer, T.; Leipertz, A.; Branston, D.W. The influence of pressure on the control of premixed turbulent flames using an electric field. Combust. Flame 2005, 143, 313–322. [Google Scholar] [CrossRef]
- Park, D.G.; Choi, B.C.; Cha, M.S.; Chung, S.H. Soot Reduction Under DC Electric Fields in Counterflow Non-Premixed Laminar Ethylene Flames. Combust. Sci. Technol. 2014, 186, 644–656. [Google Scholar] [CrossRef]
- Altendorfner, F.; Kuhl, J.; Zigan, L.; Leipertz, A. Study of the influence of electric fields on flames using planar LIF and PIV techniques. Proc. Combust. Inst. 2011, 33, 3195–3201. [Google Scholar] [CrossRef]
- Kuhl, J.; Jovicic, G.; Zigan, L.; Leipertz, A. Transient electric field response of laminar premixed flames. Proc. Combust. Inst. 2013, 34, 3303–3310. [Google Scholar] [CrossRef]
- Schmidt, J.; Kostka, S.; Lynch, A.; Ganguly, B. Simultaneous particle image velocimetry and chemiluminescence visualization of millisecond-pulsed current–voltage-induced perturbations of a premixed propane/air flame. Exp. Fluids 2011, 51, 657–665. [Google Scholar] [CrossRef]
- Chien, Y.-C.; Escofet-Martin, D.; Dunn-Rankin, D. CO emission from an impinging non-premixed flame. Combust. Flame 2016, 174, 16–24. [Google Scholar] [CrossRef] [PubMed]
- Weinberg, F.J.; Dunn-Rankin, D.; Carleton, F.B.; Karnani, S.; Markides, C.; Zhai, M. Electrical aspects of flame quenching. Proc. Combust. Inst. 2013, 34, 3295–3301. [Google Scholar] [CrossRef]
- Tinajero, J.; Bernard, G.; Autef, L.; Dunn-Rankin, D. Characterizing I-V Curves for Non-Premixed Methane Flames Stabilized on Different Burner Configurations. Combust. Sci. Technol. 2017, 189, 1739–1750. [Google Scholar] [CrossRef]
- Chattock, A.P. On the electrification needle-points of air. Lond. Edinb. Dublin Philos. Mag. J. Sci. 1891, 32, 285–304. [Google Scholar] [CrossRef]
- Settles, G.S. Schlieren and Shadowgraph Techniques: Visualizing Phenomena in Transparent Media; Springer: Berlin/Heidelberg, Germany, 2001; ISBN 3-540-66155-7. [Google Scholar]
- Chien, Y.C.; Dunn-Rankin, D. Electric Field Effects on Carbon Monoxide Release from Impinging Flames. In Proceedings of the 8th US National Combustion Meeting, Park City, UT, USA, 9–22 May 2013. [Google Scholar]
- Chien, Y.-C. Electrical Aspects of Impinging Flames. Ph.D. Dissertation, UC Irvine, Irvine, CA, USA, 2015. [Google Scholar]
- Incropera, F.P.; DeWitt, D.P.; Bergman, T.L.; Lavine, A.S. Fundamentals of Heat and Mass Transfer 5th Edition with IHT2.0/FEHT with Users Guides; Wiley: Hoboken, NJ, USA, 2001; ISBN 978-0-471-20448-0. [Google Scholar]
- Remie, M.J.; Särner, G.; Cremers, M.F.G.; Omrane, A.; Schreel, K.R.A.M.; Aldén, L.E.M.; de Goey, L.P.H. Heat-transfer distribution for an impinging laminar flame jet to a flat plate. Int. J. Heat Mass Transf. 2008, 51, 3144–3152. [Google Scholar] [CrossRef]
Figure 1.
Gas flow schematic with the side view of the coflow burner [15].
Figure 1.
Gas flow schematic with the side view of the coflow burner [15].

Figure 2.
Schematic diagram of an impinging flame under the influence of an electric field.

Figure 3.
Natural flame images with changing electric field at different plate position. The overall flame base width remains the same (4 mm) while the 2 mm diameter fuel jet is located at the center.
Figure 3.
Natural flame images with changing electric field at different plate position. The overall flame base width remains the same (4 mm) while the 2 mm diameter fuel jet is located at the center.

Figure 4.
Infrared camera connected with the software (ExaminIR) as it observes the impinging plate over the burner. The camera with tripod on top of the image is the forward looking infrared (FLIR) camera, facing downward observing the surface of the impinging plate sitting just above the top of the burner (silver).

Figure 5.
Temperature profiles along the plate at H/D 4.5 of no electric field, −5.6 kV/cm and 5.6 kV/cm applied.
Figure 5.
Temperature profiles along the plate at H/D 4.5 of no electric field, −5.6 kV/cm and 5.6 kV/cm applied.

Figure 6.
Heat transfer near the boundary around the plate control volume (dashed box).

Figure 7.
A Schlieren image showing the thermal flow produced by a diffusion flame and impinging on a plate above. As a scale reference, the rectangular black object is the coflow burner with outer diameter 4 cm. The 2 mm fuel jet is located at the center just below the flame.
Figure 7.
A Schlieren image showing the thermal flow produced by a diffusion flame and impinging on a plate above. As a scale reference, the rectangular black object is the coflow burner with outer diameter 4 cm. The 2 mm fuel jet is located at the center just below the flame.

Figure 8.
Overall infrared (IR) images with different electric field and impingement plate height.

Figure 9.
Overall Schlieren images with different electric field and impingement plate height.

Figure 10.
The heat losses from the plate with electric field at different heights.

Figure 11.
Analyzing the total heat flux of the impinging plate at different percentages. Four heat rings are presented which show successive enclosed quantities of the plate heat flux.
Figure 11.
Analyzing the total heat flux of the impinging plate at different percentages. Four heat rings are presented which show successive enclosed quantities of the plate heat flux.

Figure 12.
The overall heat flux for different thermal emission zones, in percentages with different electric fields at various plate-to-burner distance.
Figure 12.
The overall heat flux for different thermal emission zones, in percentages with different electric fields at various plate-to-burner distance.

Figure 13.
The detailed heat rings mapping from 20% to 80% of total heat flux at different field strengths for H/D = 4.5 to show the direct effect of the electric field polarity: (a) −5.6 kV/cm; (b) 5.6 kV/cm.
Figure 13.
The detailed heat rings mapping from 20% to 80% of total heat flux at different field strengths for H/D = 4.5 to show the direct effect of the electric field polarity: (a) −5.6 kV/cm; (b) 5.6 kV/cm.

Figure 14.
Normalized heat flux at zero field at 20% heat ring location.


Table 1.
The maximum temperature and diameter of 20% heat ring at all electric field strengths for all heights.
Table 1.
The maximum temperature and diameter of 20% heat ring at all electric field strengths for all heights.
| H/D | KV/cm | −5.5 | −4.5 | −0.9 | 0.0 | 0.9 | 2.7 | 5.5 |
|---|---|---|---|---|---|---|---|---|
| 5.5 | Tmax (K) | 418.4 | 429.4 | 455.2 | 462.3 | 472.9 | 484.1 | 498.0 |
| Diameter (mm) | 24.5 | 22.8 | 22.3 | 21.9 | 21.1 | 20.7 | 19.8 | |
| KV/cm | −5.6 | −4.4 | −1.1 | 0.0 | 1.1 | 3.3 | 5.6 | |
| 4.5 | Tmax (K) | 491.1 | 489.9 | 470.4 | 472.0 | 492.0 | 509.1 | 493.4 |
| Diameter (mm) | 22.3 | 21.5 | 21.5 | 21.1 | 21.1 | 20.2 | 19.4 | |
| KV/cm | −5.7 | −4.3 | −1.4 | 0.0 | 1.4 | 4.3 | 5.7 | |
| 3.5 | Tmax (K) | 490.9 | 470.9 | 476.6 | 475.8 | 419.4 | 477.8 | 476.5 |
| Diameter (mm) | 20.7 | 20.7 | 20.7 | 20.2 | 19.8 | 20.2 | 19.8 | |
| KV/cm | −6.0 | −4.0 | −2.0 | 0.0 | 2.0 | 4.0 | 6.0 | |
| 2.5 | Tmax (K) | 484.1 | 481.3 | 482.4 | 434.7 | 462.7 | 464.4 | 501.5 |
| Diameter (mm) | 20.2 | 20.7 | 20.7 | 20.7 | 19.8 | 20.2 | 19.4 | |
| KV/cm | −6.7 | −3.3 | 0.0 | 3.3 | 6.7 | |||
| 1.5 | Tmax (K) | 489.0 | 454.8 | 464.0 | 471.0 | 492.6 | ||
| Diameter (mm) | 24.5 | 20.2 | 19.8 | 19.8 | 19.4 |
© 2018 by the authors. Licensee MDPI, Basel, Switzerland. This article is an open access article distributed under the terms and conditions of the Creative Commons Attribution (CC BY) license (http://creativecommons.org/licenses/by/4.0/).
Share and Cite
MDPI and ACS Style
Chien, Y.-C.; Dunn-Rankin, D. Electric Field Induced Changes of a Diffusion Flame and Heat Transfer near an Impinging Surface. Energies 2018, 11, 1235. https://doi.org/10.3390/en11051235
AMA Style
Chien Y-C, Dunn-Rankin D. Electric Field Induced Changes of a Diffusion Flame and Heat Transfer near an Impinging Surface. Energies. 2018; 11(5):1235. https://doi.org/10.3390/en11051235
Chicago/Turabian StyleChien, Yu-Chien, and Derek Dunn-Rankin. 2018. "Electric Field Induced Changes of a Diffusion Flame and Heat Transfer near an Impinging Surface" Energies 11, no. 5: 1235. https://doi.org/10.3390/en11051235
Note that from the first issue of 2016, this journal uses article numbers instead of page numbers. See further details here.