Multi-Objective Optimization of Start-up Strategy for Pumped Storage Units
by
Jinjiao Hou
1, 
Chaoshun Li
1,*,
Ziqin Tian
2,
Yanhe Xu
1,*,
Xinjie Lai
1,
Nan Zhang
1,
Taoping Zheng
2 and
Wei Wu
3 1
School of Hydropower and Information Engineering, Huazhong University of Science and Technology, Wuhan 430074, China
2
Changjiang Institute of Survey, Planning, Design and Research, Wuhan 430010 China
3
China Yangtze Power Co., Ltd., Yichang 443000, China
*
Authors to whom correspondence should be addressed.
Energies 2018, 11(5), 1141; https://doi.org/10.3390/en11051141
Submission received: 22 March 2018
/
Revised: 26 April 2018
/
Accepted: 26 April 2018
/
Published: 3 May 2018
Abstract
:This paper proposes a multi-objective optimization method for the start-up strategy of pumped storage units (PSU) for the first time. In the multi-objective optimization method, the speed rise time and the overshoot during the process of the start-up are taken as the objectives. A precise simulation platform is built for simulating the transient process of start-up, and for calculating the objectives based on the process. The Multi-objective Particle Swarm Optimization algorithm (MOPSO) is adopted to optimize the widely applied start-up strategies based on one-stage direct guide vane control (DGVC), and two-stage DGVC. Based on the Pareto Front obtained, a multi-objective decision-making method based on the relative objective proximity is used to sort the solutions in the Pareto Front. Start-up strategy optimization for a PSU of a pumped storage power station in Jiangxi Province in China is conducted in experiments. The results show that: (1) compared with the single objective optimization, the proposed multi-objective optimization of start-up strategy not only greatly shortens the speed rise time and the speed overshoot, but also makes the speed curve quickly stabilize; (2) multi-objective optimization of strategy based on two-stage DGVC achieves better solution for a quick and smooth start-up of PSU than that of the strategy based on one-stage DGVC.
1. Introduction
In recent years, the fluctuation of power supply and load demand in power grids has become more and more severe, due to the large-scale integration of renewable energy and diversity of demand. In order to maintain the stability of the power grid, pumped-storage power station (PSPS) are developing rapidly in China, to undertake the peak shaving and valley filling, or other tasks in the power system. These tasks often require pumped storage unit (PSU) switching working conditions frequently, and quick and stable start-ups and shutdowns are necessary. When PSU starts, the start-up time and speed overshoot are the main indices, while speed oscillations, water pressure, and other criterions are also considered. A short start-up time and a small overshoot of unit speed are all needed in PSU start-up process, but these two objectives are contrary. If the guide vane is driven move quickly, the unit speed may reach the rated value too early. In this situation, it may also cause a large overshoot of the speed and a large water hammer at the entrance of the spiral case. Therefore, it is necessary to optimize the start-up strategy to enable a rapid rise and quick stability of unit speed, while constraining the water hammer in a reasonable range.
Start-up of PSU usually refers to the starting process on turbine mode. The start-up process begins at the move of the guide vane and ends at the unit’s connection the grid. The traditional and actually applied start-up strategy of PSU mainly contains two phases. In the first phase, a direct guide vane control (DGVC) is adopted, while the governor drives the guide vane (GV) as a given law to launch the unit until its rotational speed reaches to a threshold, approximately 90% rated speed. In the second phase, a closed-loop rotational speed control (RSC) is applied to track the rated rotational speed and keep stability of the speed control system. In the first phase, the time of duration is called start-up time, which is a core criterion concerning quickness of PSU start-up. In the second phase, the dynamic control indices of the close-loop speed control system, i.e., overshoot, number of oscillation, are criteria concerning control quality of PSU start-up.
There are typically two types of DGVC strategies [1], namely the open-loop type and the close-loop type. For the former type, feedback of the rotational speed of PSU is not adopted, and the reference trajectory of GV is designed to drive the unit [2]. As for close-loop DGVC, the feedback is adopted and the reference trajectory of rotational speed is used to generate control signal [3]. The open-loop DGVC law provides the trajectory of guide vane opening (GVO), which could be a one-stage polyline or two-stage polyline. Compared with close-loop DGVC, the advantage of open-loop DGVC is that GVs open much faster, and therefore, less time is needed to make the speed rise to the threshold value of speed for proportional-integral-derivative controller (PID controller) being switched in. The disadvantage is that the impact and disturbance would be greater for the subsequent PID control. For close-loop DGVC, a smooth speed rise could be obtained because the feedback speed tracks the desired speed all the time, and the sudden disturbance caused by speed differences can be avoided. The close loop start-up weighs on the speed tracking performance of the unit, which may result in a long duration.
In order to improve the start-up performance, some researches concentrated on GVO trajectory design. Bao et al. designed an “open-closed loop” GVO trajectory, the results have shown that start-up process of the hydropower station is fast and smooth [4]. It has also been indicated that the “open-closed loop” start-up rule is an excellent and simple start-up control mode. Zhang et al. proposed a new DGVC strategy, which integrates the open-loop and close-loop trajectories in DGVC, solving the contradiction between rapidity and smoothness [5]. Yang et al. [6] improved the traditional “open-loop + closed-loop” control mode, and the simulation results shows that the controllability is greatly strengthened, which ensures a reasonable change of the rotation speed and volute pressure. Moreover, it ensures the rapidity and stability of start-up process under both maximum head and minimum head. Additionally, more efforts have been made on the optimization of start-up strategy. Indices on dynamic response of rotational speed, i.e., overshoot, number of oscillation, are often considered in start-up optimization for smooth start-up. Zhou et al. [7] proposed a start-up strategy which does not depend on the water head parameters and the no-load opening parameters, in which the constant rational speed growth rate has been chosen as the objective, and the strategy ensures the rapidity and stability of start-up process with a given slope. Dynamic control indices have been chosen as optimization objectives in designing an adaptively fast fuzzy fractional order PID (FOPID) controller in the second phase of start-up process. Simulation analysis demonstrates that FOPID control is capable of significantly improving the transition process of the frequency of pumped storage unit and guide vane opening. Meanwhile, the FOPID control would enhance the dynamic performance and stability of the pumped storage unit governing systems [8]. Although indices on control quality are often considered in start-up strategy optimization, the start-up time is always neglected. An excellent start-up strategy should be built on indices concerning both quickness and stability. Pannatier et al. presented the start-up and synchronization procedures of large variable-speed pump-turbine units in pumping mode. Significant decreases in start-up time may be obtained through optimization [9]. Wang et al. [10] proposed an integrated start-up method, in which a two-phase closed-up start-up strategy is designed, and the Integral Time Absolute Error (ITAE) [11] index is used as the objective function. Although ITAE is a composite index composed of speed overshoot and speed up time, it is still a single objective function.
The previous research on start-up strategy optimization was mainly focused on single objective optimization, while a particular objective concentrated mainly on indices of control quality is outlined. Handling objectives on quickness and control quality is equally important and challenging. Quickness and control quality are contrary objectives. This implies that the optimization of start-up of PSU is a multi-objective optimization problem (MOOP), if start-up time and control quality indices are considered simultaneously. An effective method to solve a MOOP is to develop a multi-objective optimization approach based on Pareto theory [12,13]. A multi-objective optimization method for start-up strategy has two advantages over single objective optimization. The first advantage is that the multi-objective optimization method for start-up strategies can consider two contradictory objectives, such as quickness and control quality. The second advantage is that the optimization result of the multi-objective optimization method for start-up strategy is a Pareto Optimal Set, while the single-objective method obtains only one solution. There is no dominant relationship between the two solutions in the Pareto Optimal Set, which means that one solution is no better than any other. The advantage of obtaining the optimal solution set is that it can provide more choice for decision makers or operators; the decision maker or the operator selects a solution from the optimal solution set as the optimal solution according to the engineering requirements.
In this paper, on the basis of Reference [10], the MOOP for PSU start-up strategy optimization is studied for the first time, while start-up time and indices on control quality are selected as the objectives. The start-up strategy of a typical 300 MW PSU in a PSPS in Jiangxi Province in China is researched. As extracted from the PSPS, the start-up strategy is composed of an open-loop DGVC with two-stage GVO strategy in the first phase and a PID closed-loop control in the second phase. The GVO strategy and PID control parameters are optimized synchronously. Compared with single objective optimization, which may neglect the optimization objective and could only obtain one optimal solution, the multi-objective optimization of the start-up strategy could obtain an optimal solution set based on the Pareto front. A multi-objective decision-making method is applied to choose a suitable solution according to actual engineering requirements. Additionally, the suitable solution can be embedded into the control module of the unit governor to achieve the optimal transition process of rotational speed under start-up conditions.
The rest of the paper is organized as follows: The simulation platform of a PSPS is established in Section 2. The multi-objective optimization method models are established based on the one-stage and two-stage start-up strategy in open loop control mode in Section 3. Section 4 introduces multi-objective decision-making method. A case study and discussion are presented in Section 5. Section 6 presents our conclusions.
2. Simulation Platform of PSPS
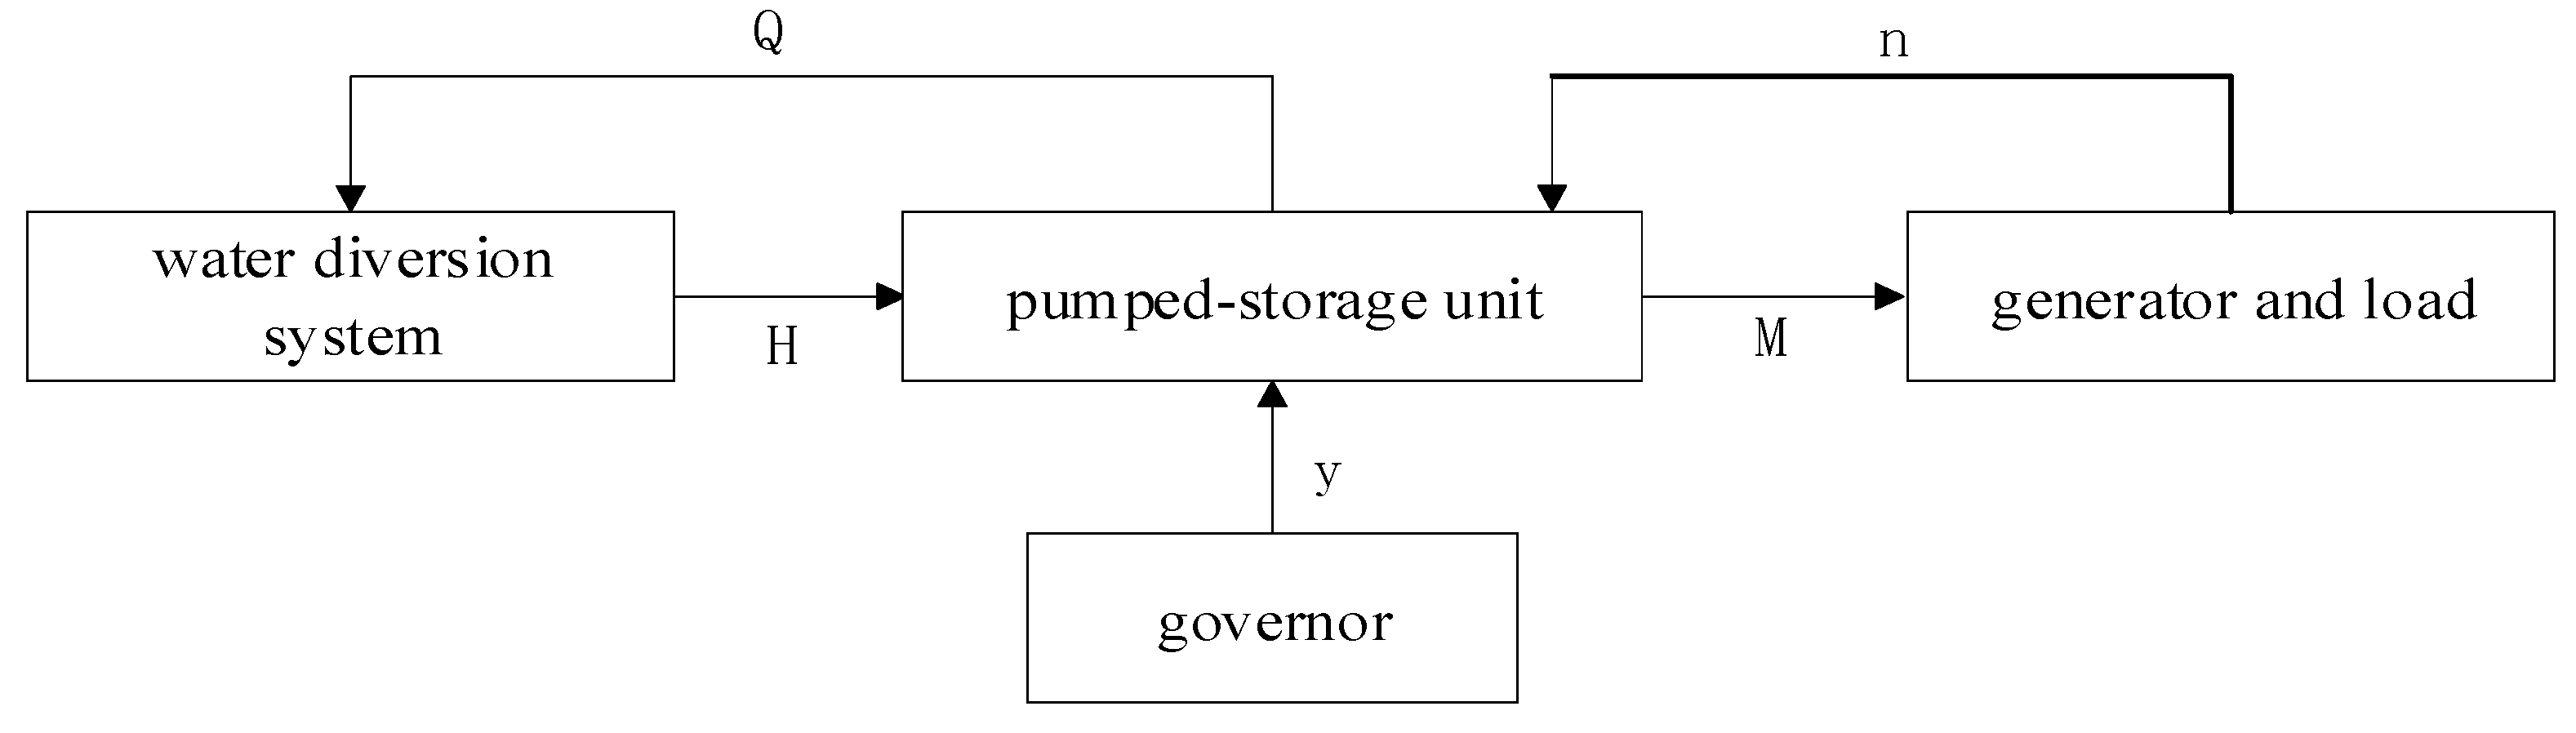
The simulation model of a PSU in a PSPS in China is built to study the start-up strategy. The model of the PSU is divided into four parts: water diversion system model, pumped-storage unit model, generator and load model and governor model [10,14]. Figure 1 presents the basic structure block diagram of the regulating system of pumped-storage unit. The details of the numerical calculation procedures of the simulation model can be seen in reference [14].
2.1. Water Diversion System Model
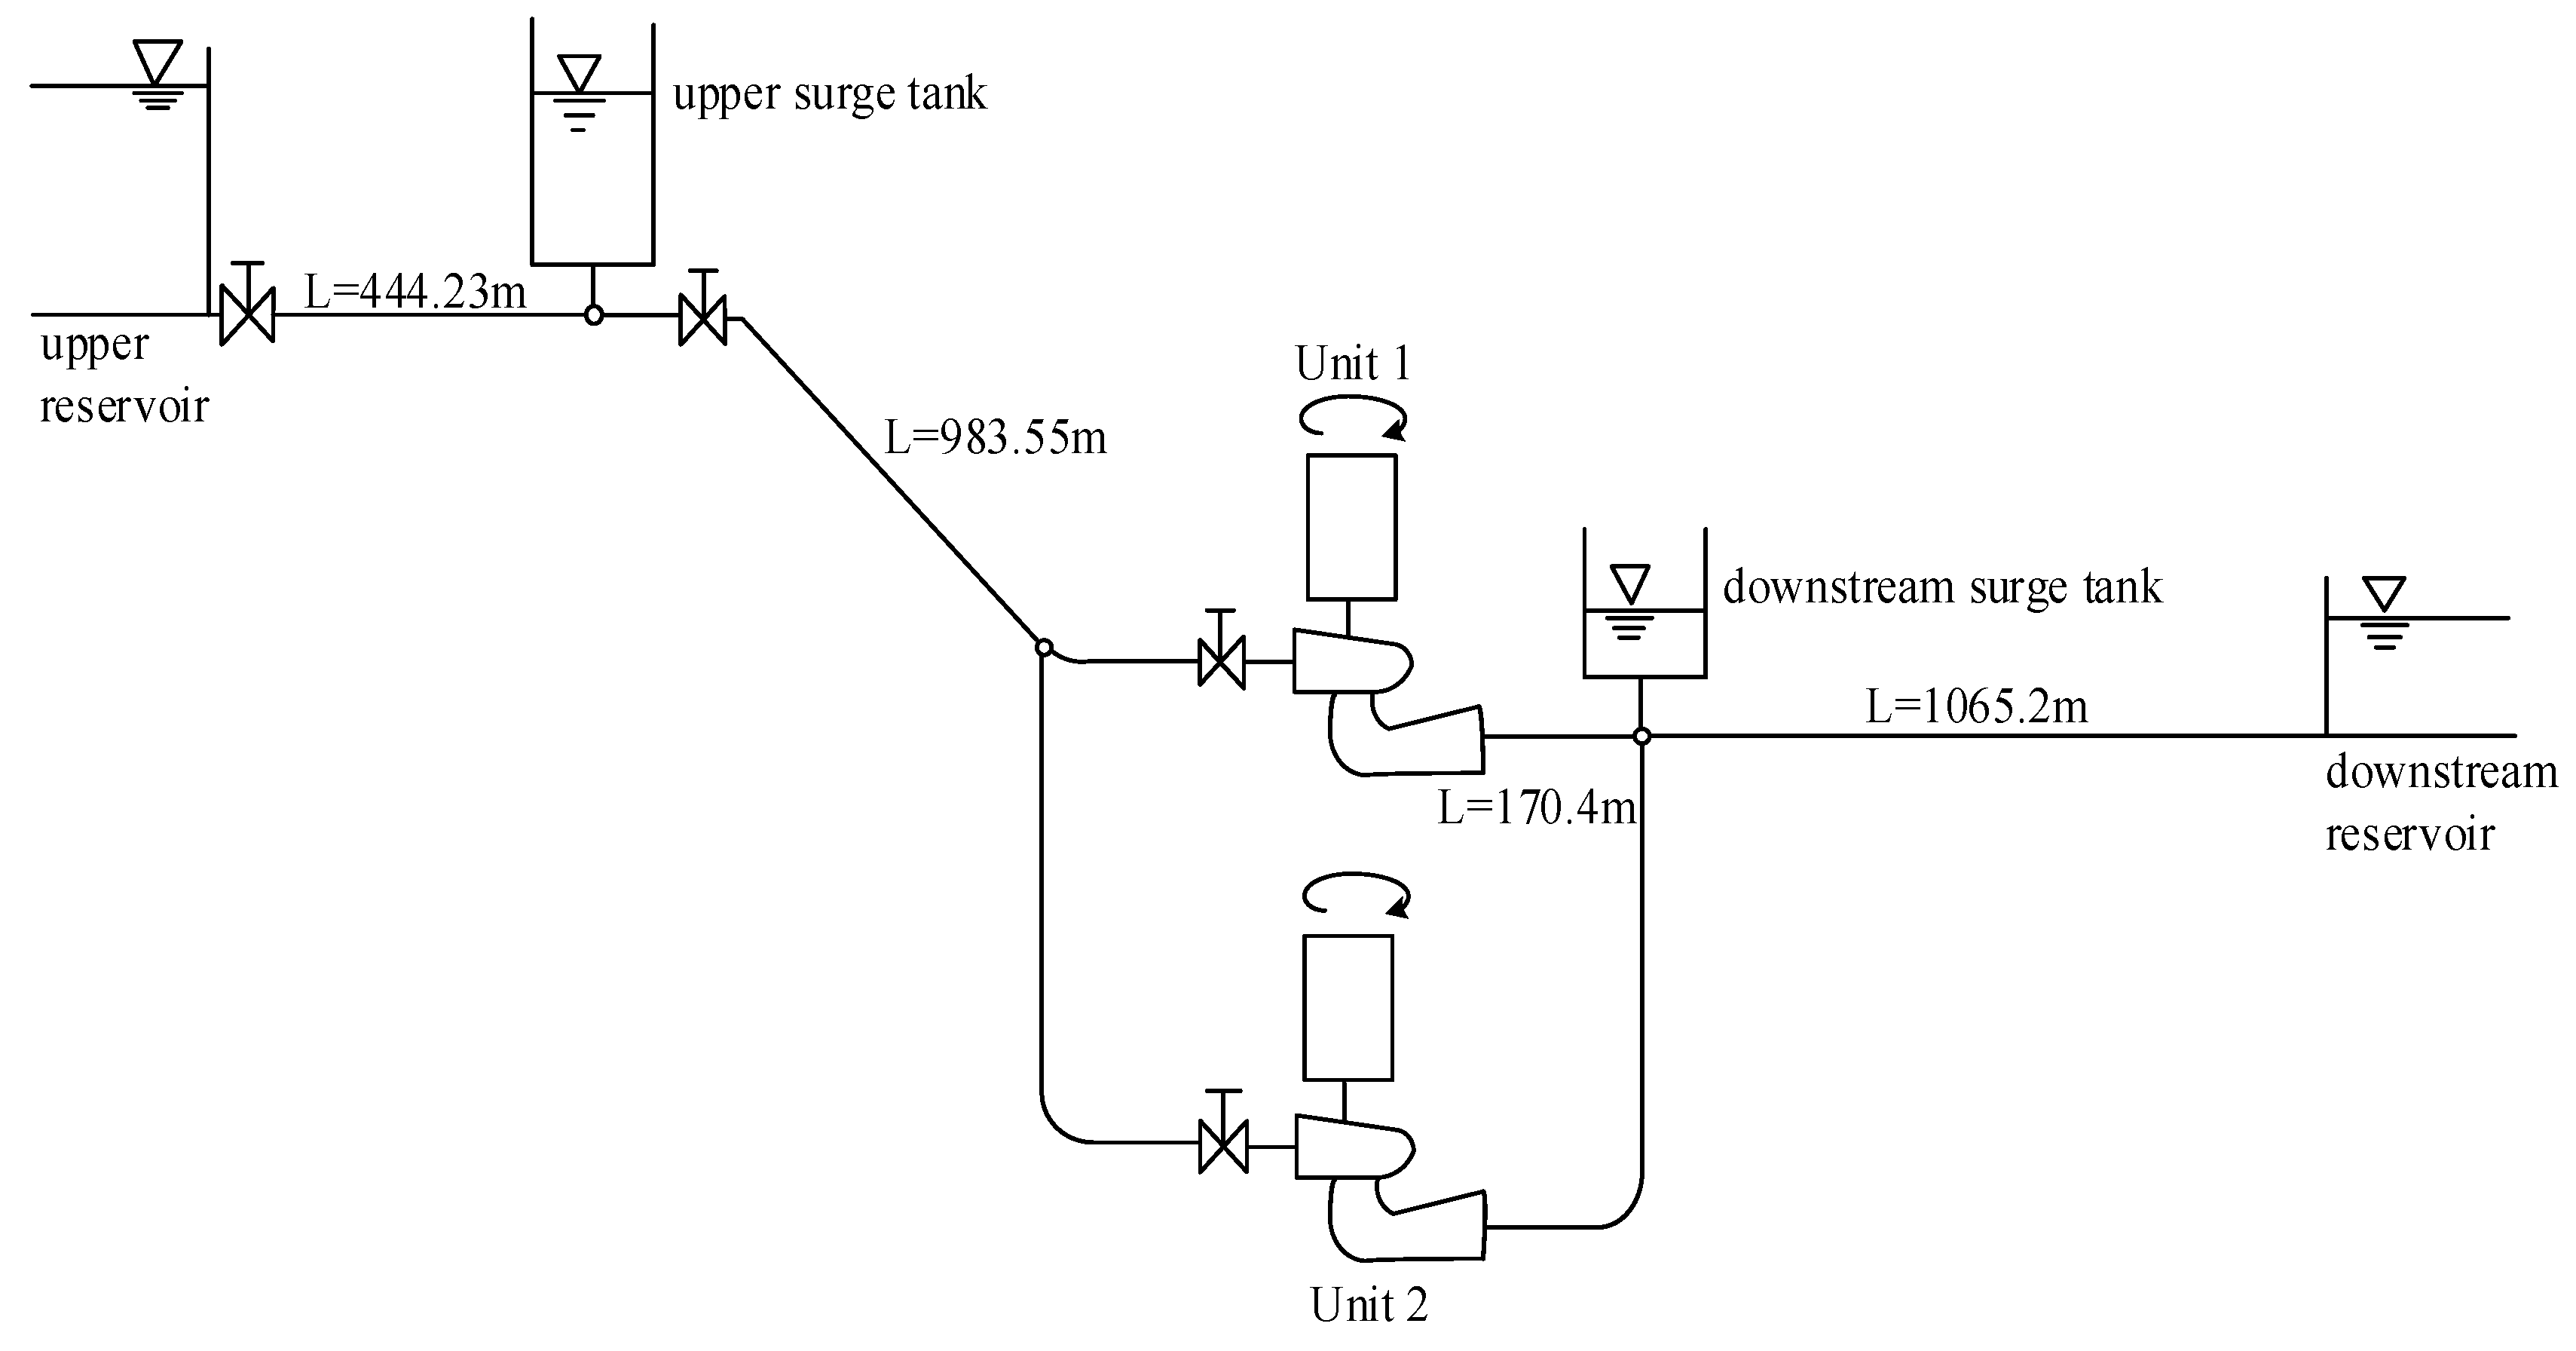
As the power station studied has upstream and downstream surge chambers, and only one pumped-storage unit named 1# operates, in order to make the modeling more refined, the water diversion system is divided into four parts. Respectively: the first segment: the upstream reservoir to the upstream surge chamber; the second segment: the upstream surge chamber to 1 # unit spiral case; the third segment: 1# unit draft tube to the downstream surge chamber; the forth segment the downstream surge chamber to the downstream reservoir. The basic equations of the non-constant flow of the water diversion pipelines are given below.
The details of all the symbols in these equations are given in the nomenclature.
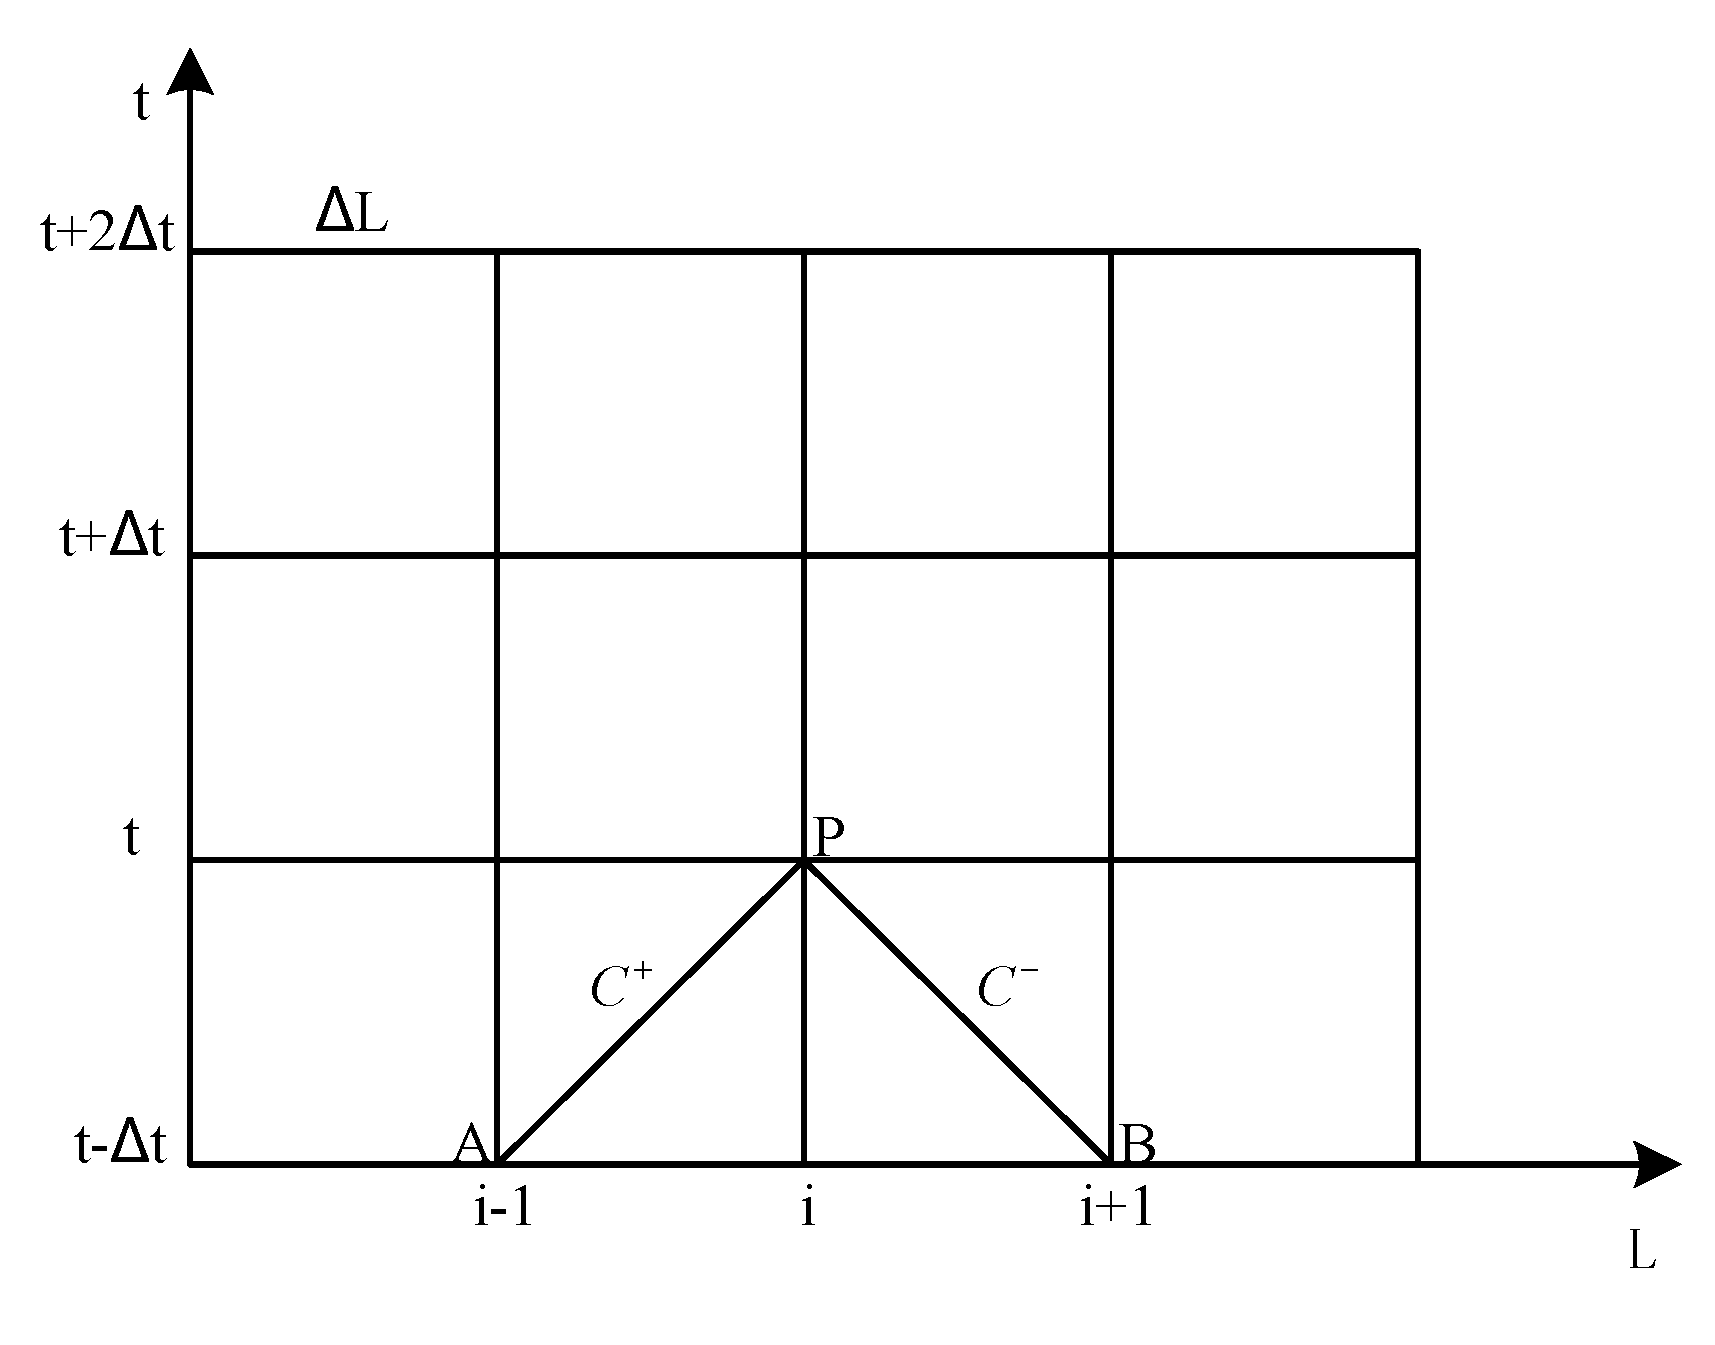
The method of characteristics (MOC) [15] is applied to the partial differential equations (PDEs), as shown in Equations (1) and (2). The following describes the principle of MOC. Equations (3) and (4) [16] are obtained by solving two simultaneous Equations (1) and (2). C+ and C− are respectively positive and negative characteristic line.
where .
From the characteristic line equation C+ and C−, we can construct a differential grid as shown in Figure 2. The time step constant is defined as a given value, so can be obtained by formula . A and B are two adjacent points at the left and right of P. If this moment is time , the water head of point A and of point B are known, the flow of point A and of point B are also known, so we can calculate the water head and the flow of point P at the time t by solving two simultaneous Equations (3) and (4).
2.2. Pumped-Storage Unit Model
During the simulation process of pumped-storage unit start-up, we need to interpolate the full characteristic curve of pumped-storage unit to get the unit flow Q11, the unit torque M11. As we know, there is an inverse “S” characteristic in the high rotational speed region at the end of the curve. The “S” area of characteristic curves present uneven distribution, crossing and aggregation phenomena, which may lead to the multi-value problem in interpolation. The ending of flow characteristic curve are almost perpendicular to the rotation axis, which also leads to the multi-value problem of interpolation. In order to overcome these problems, Suter-transformation [17], and some improved Suter-transformation methods [18,19], have been proposed. The following formula is given for the improved Suter transformation (IST) [19] adopted in this paper.
where , , , . The improved Suter transformation method can eliminate the inverse “S” characteristic, the uneven distribution, and the cross and aggregation of the curves.
According to the above transformation formulas, the calculation model of pump turbine could be summarized as Equation (7):
where equations hn+1 and mn+1 represent the interpolation of the characteristic curves of the pumped-storage unit.
2.3. Generator and Load Model
As this paper is the study of the start-up process simulations, it does not consider units with load situations, that is, the unit load Mg is 0. The following formula is the synchronous generator model [20]:
2.4. Governor Model
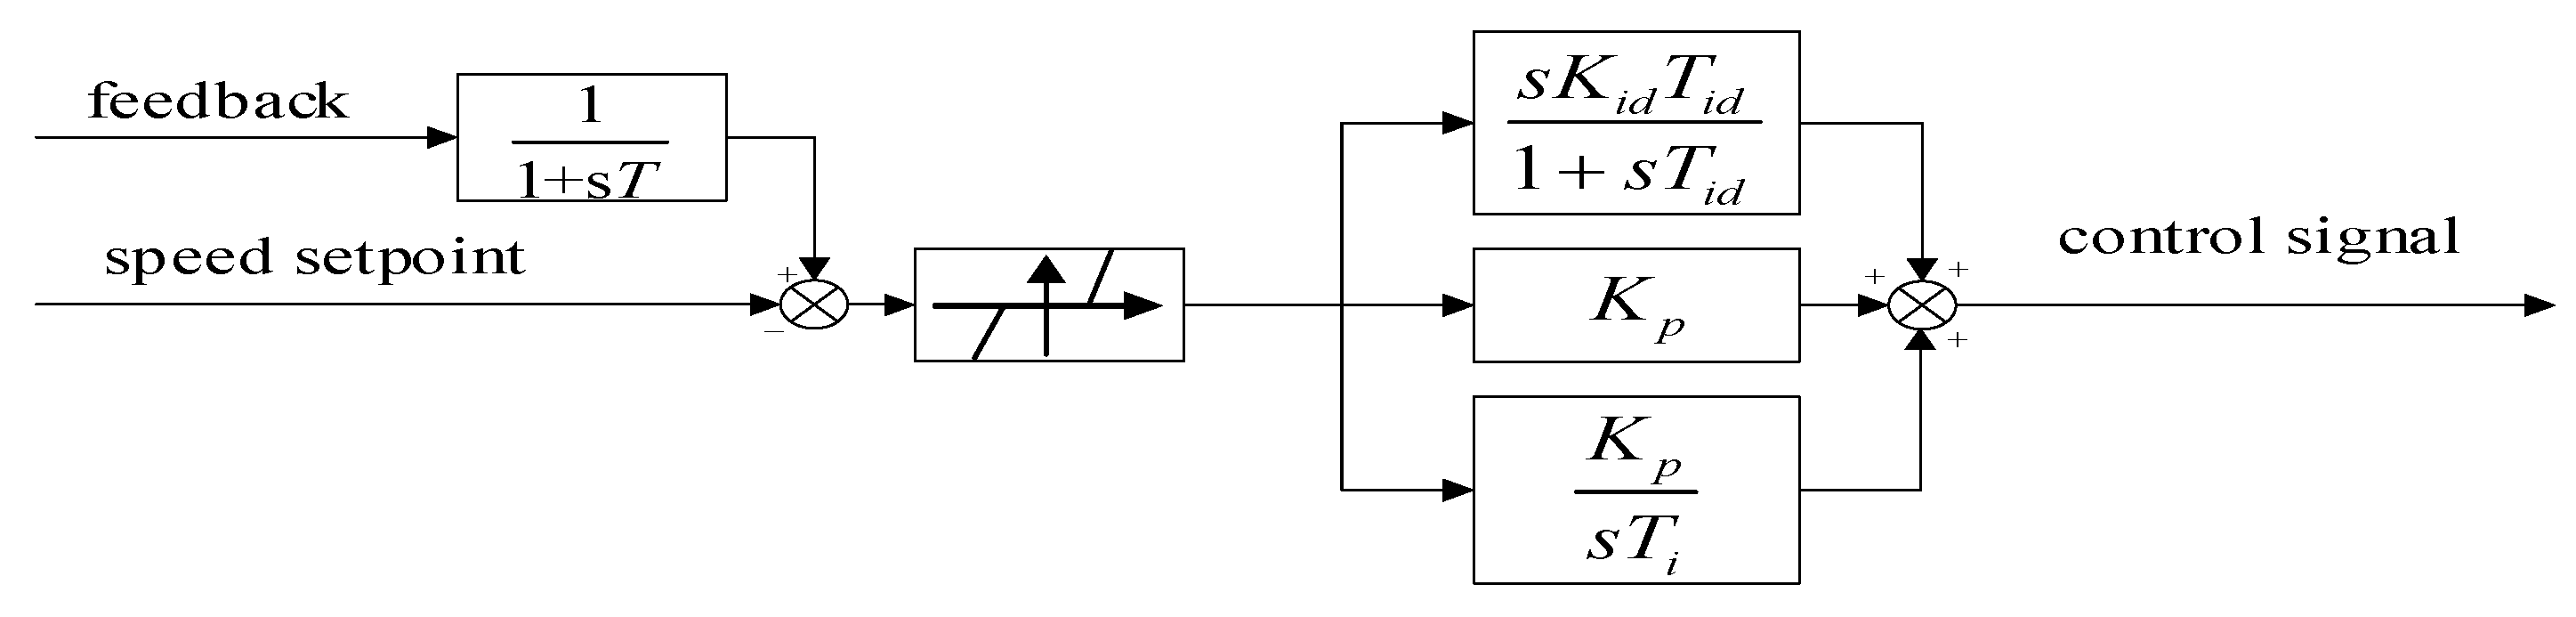
The pump-turbine governor contains controller and servomechanism, which are the control part of the pumped storage unit governing system (PSUGS). A PID controller is used to eliminate speed deviations in this paper [21], as shown in Figure 3.
As seen in Figure 3, the model considers the time constant of the frequency measurement in the unit speed feedback, which is described by a first order inertia links. The transfer function of PID controller is described as:
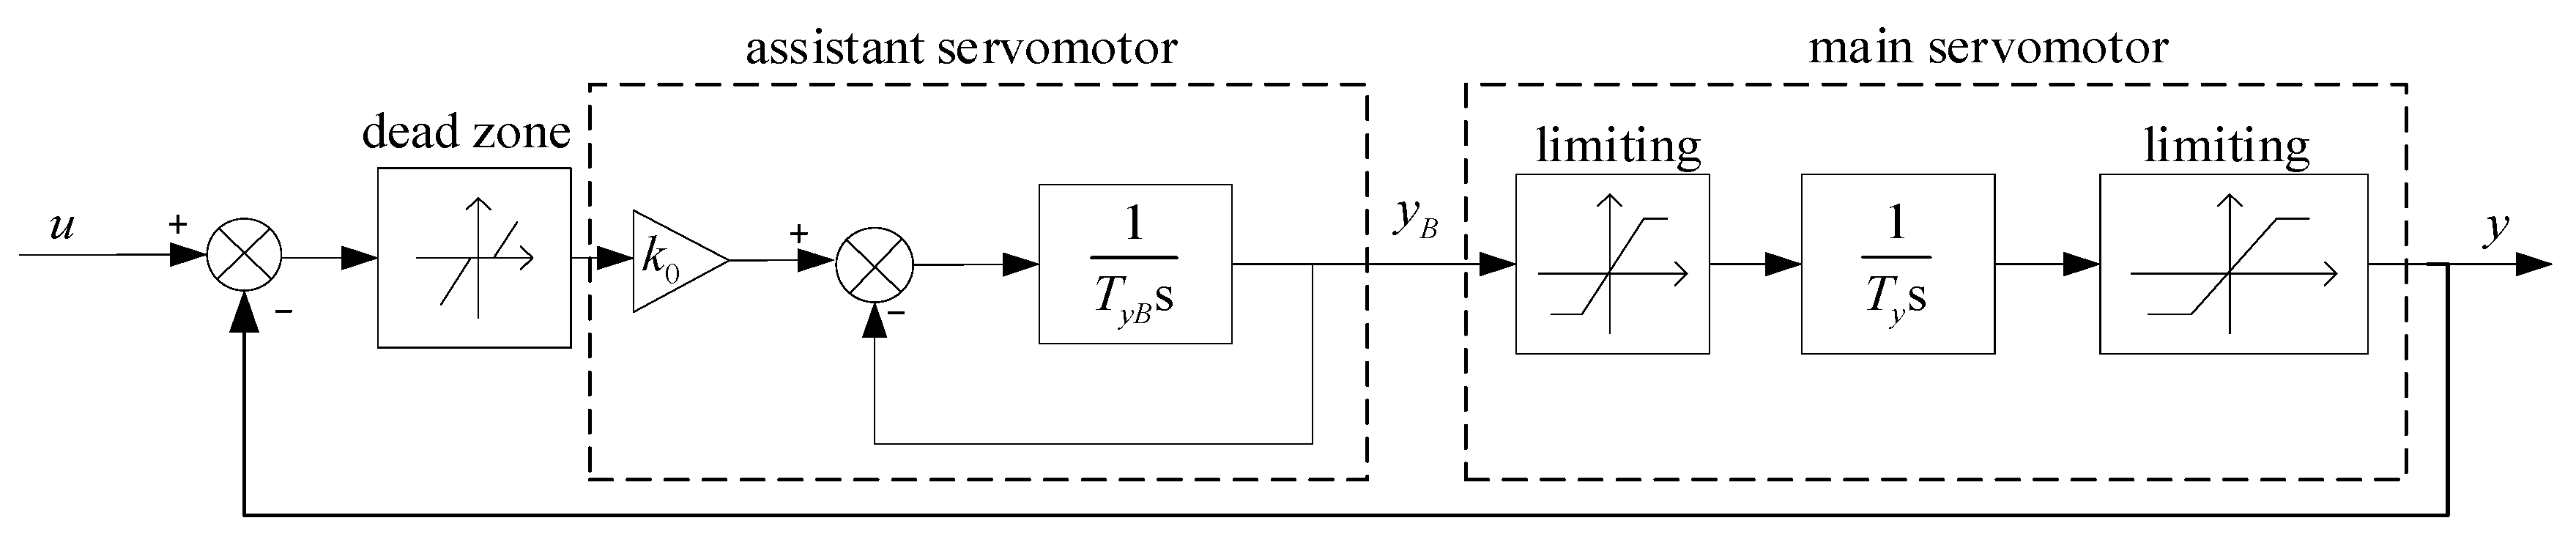
The servomechanism is the actuator of speed governor which consists of the main and assistant servomotor. A servomechanism is used to amplify the control signal and provide power to operate the guide vane of pump-turbine. The control signal u is the output of the PID controller. The structure of the servomechanism is shown as Figure 4.
3. Multi-Objective Optimization of Start-up Strategy
Quickness and control quality are two important objectives for PSU start-up. However, these two objective may be contrary to each other. A rapide movement of GVs is beneficial to shorten the duration time of start-up on one hand, but may worsen the dynamic control indices on the other. In this section, the MOOP of the start-up strategy for the PSU is discussed, while objectives concerning quickness and control quality are considered. Two typical start-up strategies have been studied for optimization, including “one-stage DGVC+PID control”, and “two-stage DGVC+PID control”. For the sake of comparison, the multi-objective optimization and traditional single objective optimization methods are presented. A suitable optimization strategy and algorithm may play a vital role in solving complicated optimization problems [22,23]. MOPSO [12,24] is applied for multi-objective optimization, and Particle Swarm Optimization (PSO) [25] is used for single objective optimization.
Thus, there are four methods studied in this paper for PSU start-up strategy optimization: the single objective one-stage method (SOOSM), the single objective two-stage method (SOTSM), the multi objective one-stage method (MOOSM), and the multi objective two-stage method (MOTSM), with start-up strategies based on one-stage DGVC and two-stage DGVC.
3.1. Objective Functions
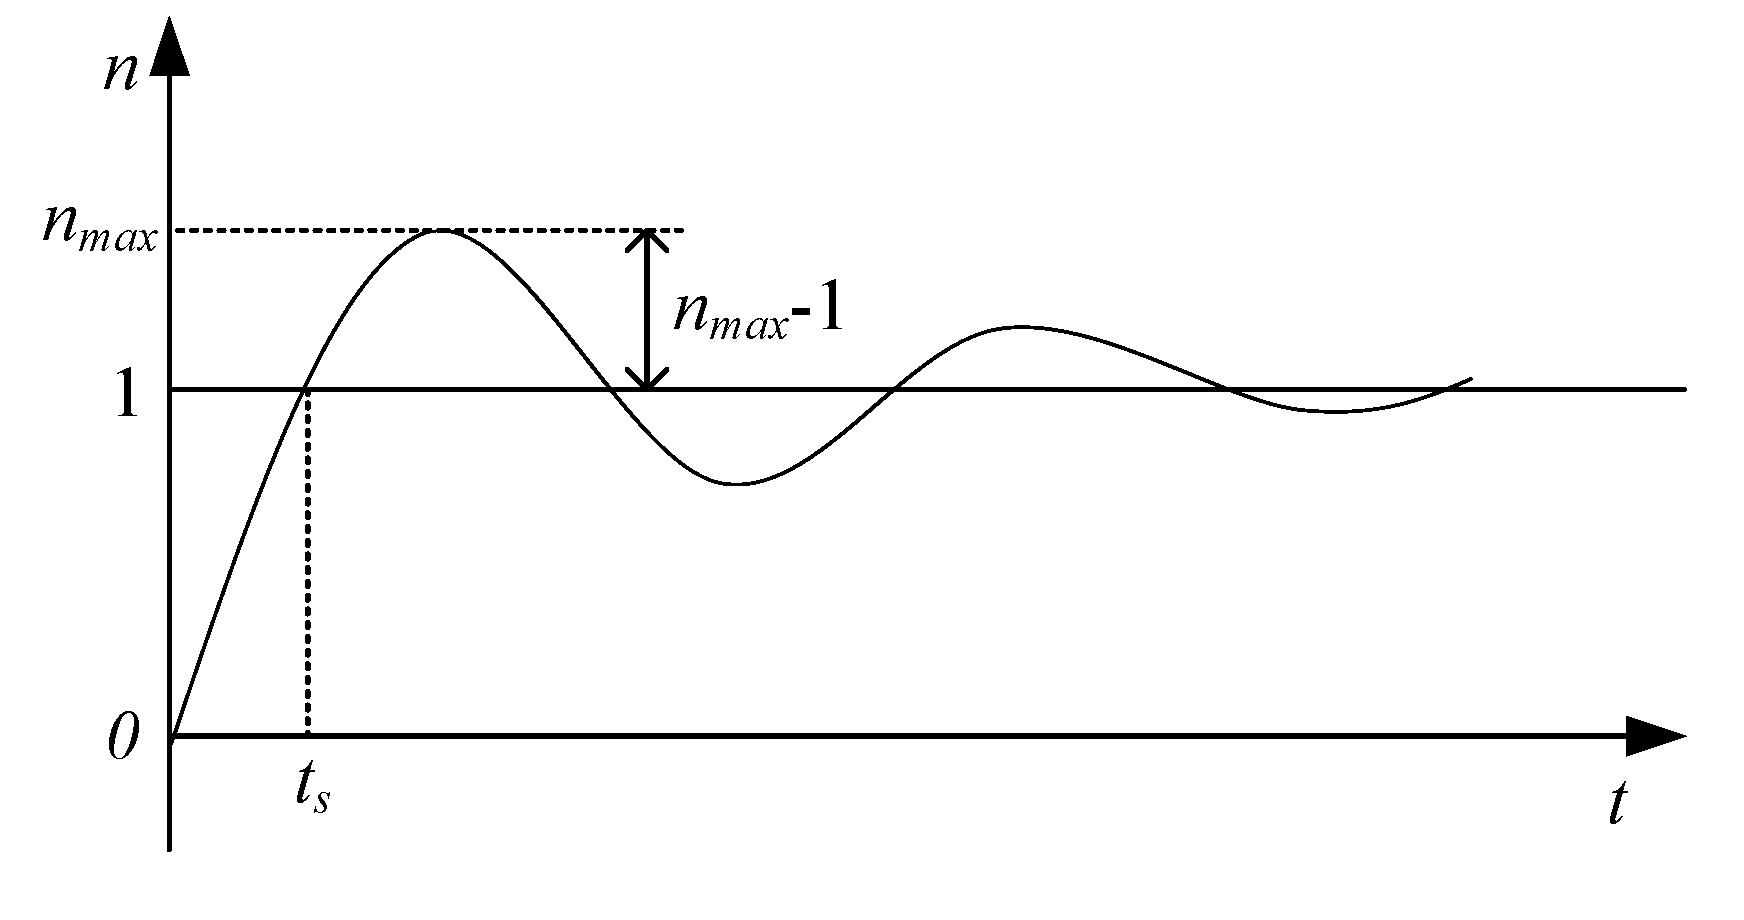
The overshoot of rational speed response after the PID controller is switched in is chosen as the objective to evaluate the control quality. The speed rise time, which is the duration time from the start time to the time of speed reaching the rated value, is chosen as the quickness objective. The bi-objectives are defined as:
where nmax is the relative value of the peak speed, ts, i.e., the speed rise time is the corresponding time when the relative value of the speed reaches 1. The specific description is shown in Figure 5.
3.2. Optimization Variables
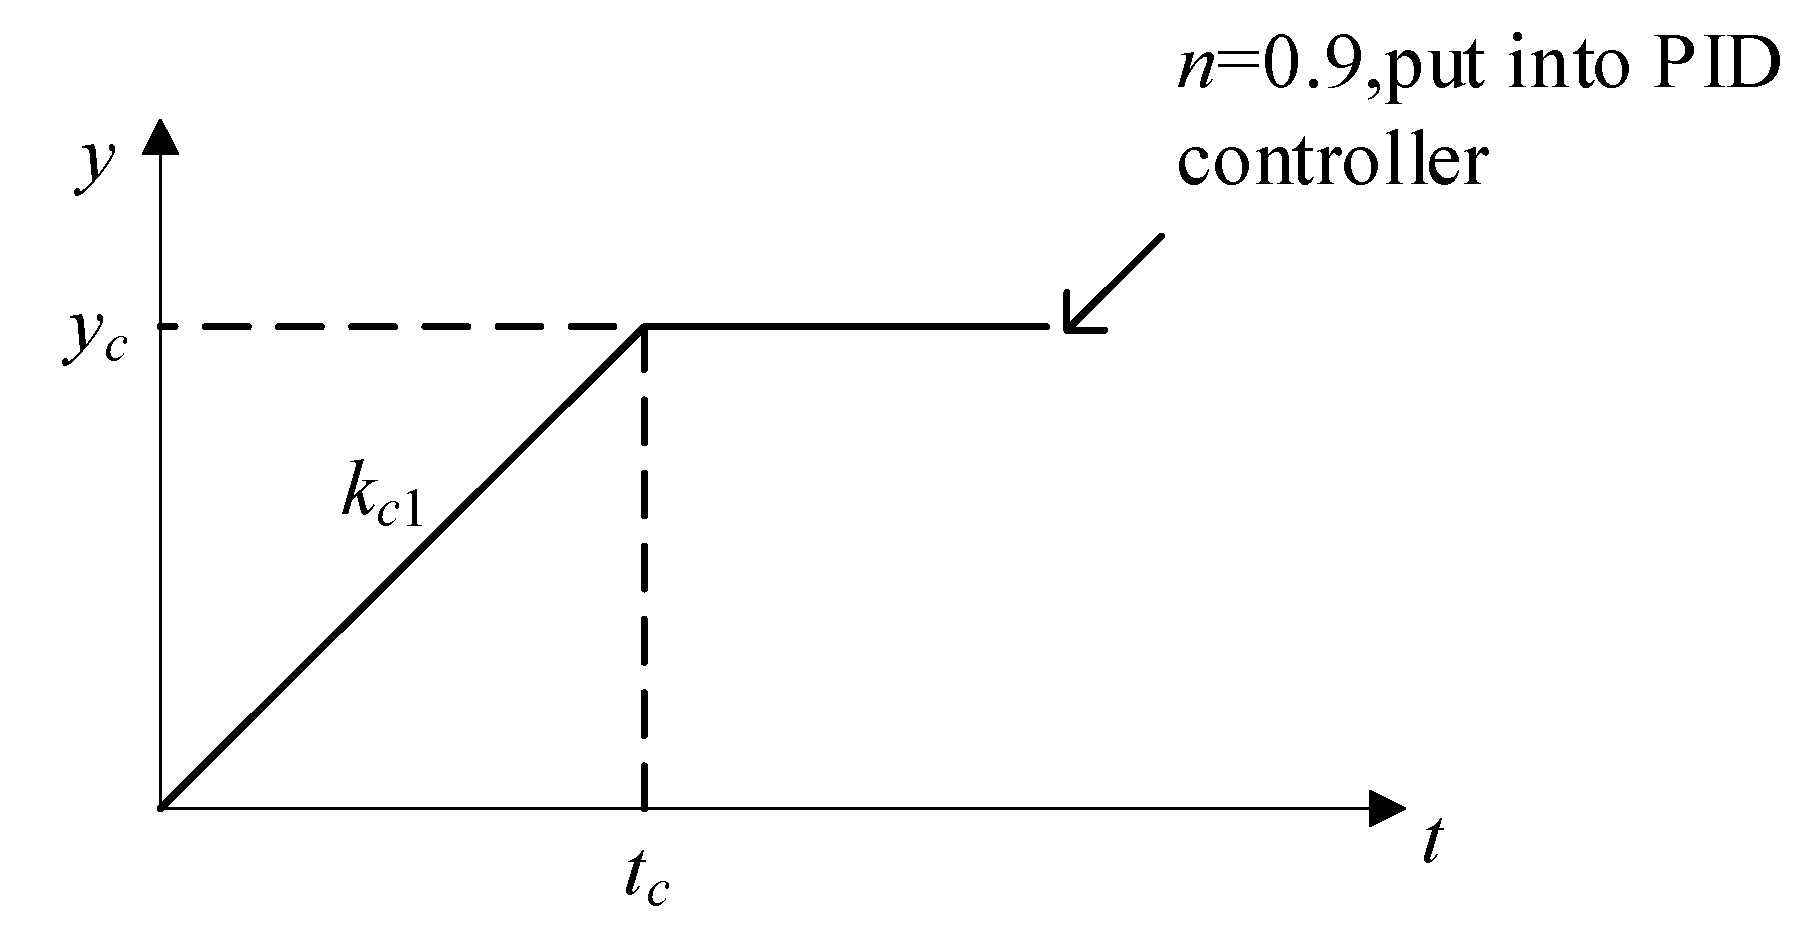
The optimization variables are parameters of start-up strategy of PSU. Thus, there are two main start-up strategies (named one-stage DGVC, and two-stage DGVC). In one-stage DGVC, the guide vane is first opened as the fastest speed, and when the opening is reached yc, it remains the same until the speed reaches a 90% rated value. As the speed reaches that value, a closed-loop PID controller will be switched in to adjust and keep stability of the speed for grid connection. The one-stage DGVC is illustrated in Figure 6.
Based on the one-stage DGVC, we can determine the decision variables. As the opening slope is known, only yc can be selected as a decision variable in the first paragraph of Figure 6, and the other three decision variables are three parameters of the PID controller: Kp, Ki, Kd. As can be seen from Figure 3, Ki = Ti, Kd = Kid. Thus, the decision variables are denoted as:
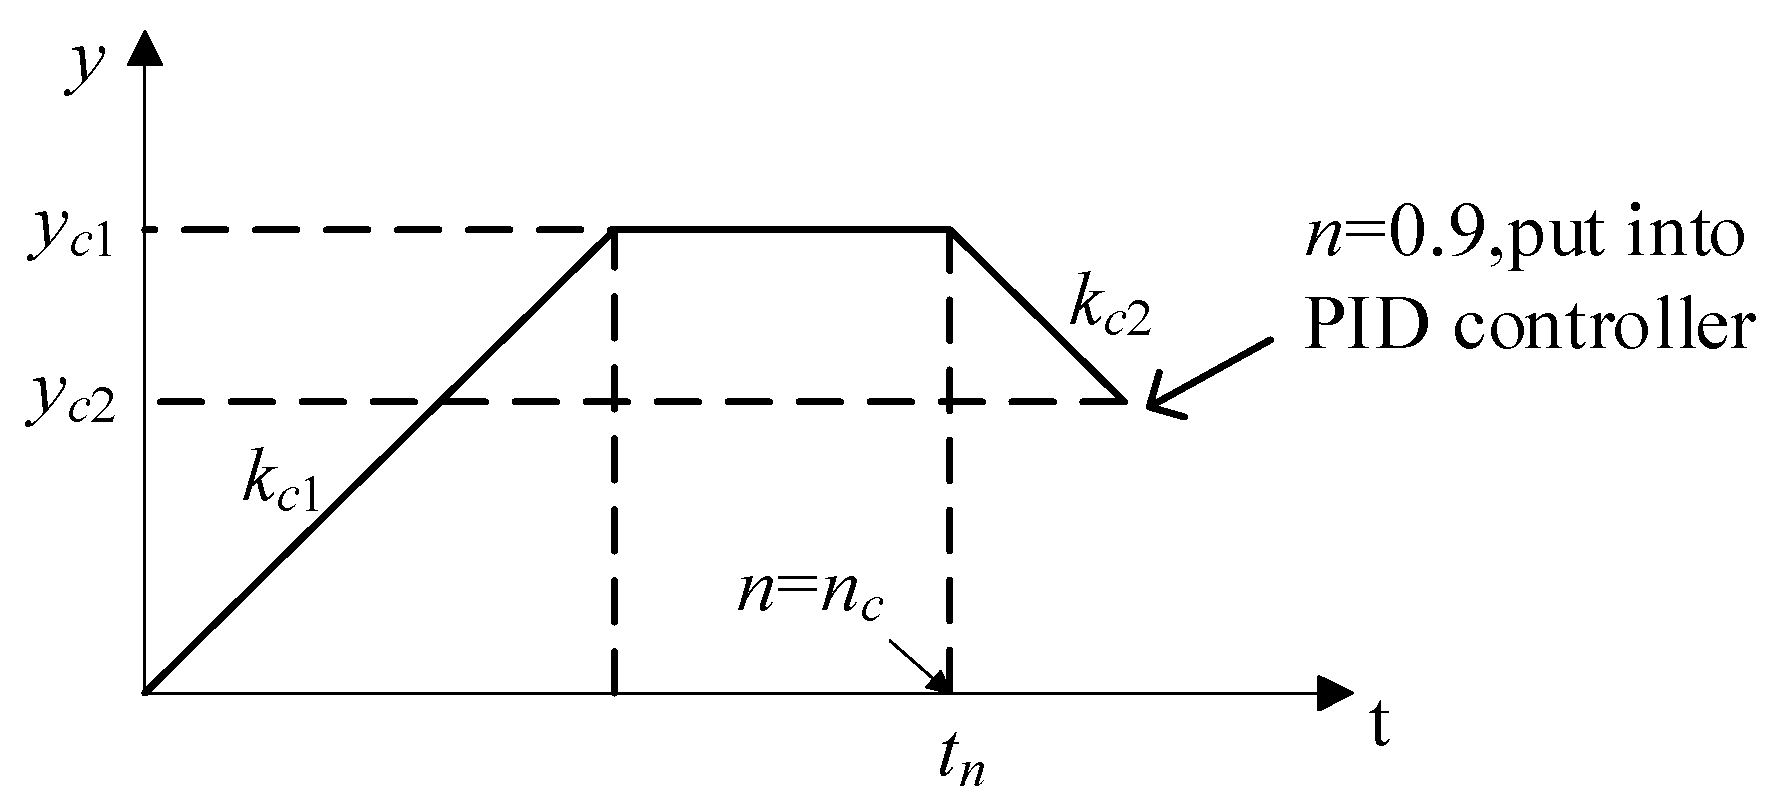
In two-stage DGVC, the guide vane is first opened as the fastest speed, and when the opening reaches yc, the opening remains the same until the speed is reached nc. Then the guide vane is closed at a slope of kc2 before the speed reaches a 90% rated value. As the speed reaches that value, a closed-loop PID controller will be switched in to adjust and keep stability of speed for the grid connection. The two-stage DGVC is illustrated in Figure 7.
As can be seen from Figure 7, yc1, yc2, nc can be selected as decision variables in the paragraph of “open-delay-off”, and the other three decision variables are three parameters of the PID controller, which are the same as one-stage DGVC. Thus, the decision variables are denoted as:
3.3. Constraint Condition
There are four types of constraints, which are the boundaries of decision variables, the number of oscillation range, the objective function range and the opening limit. The following gives the details of the four types of constraints based on experience and experiments. The constraint (2) only applies to multi-objective methods.
(1) The boundaries of decision variables
(2) The number of oscillation range
According to the requirements of the dynamic performance of the start-up transient process, the number of oscillation is required no more than once.
(3) The opening limit
3.4. Single Objective Optimization for PSU Start-up Strategy Optimization
The objective function for single objective optimization of start-up strategy could be an integral performance index to evaluate the control performances. The Integral Time Absolute Error (ITAE) [11] index is used as the objective function, which is defined as:
where k is the sample number, Ns is the number of samples, T(k) is the sample time, x(k) is the relative value of unit speed. In [10,26,27], the ITAE index has been successfully applied as a single objective function, so the ITAE index is used as a single objective function for comparison in this study.
3.5. Procedures
In this study, MOPSO and optimization method have already presented respectively. In following, the simulation procedures based on the MOPSO are summarized as instruction.
Step 1: Initialize the population pop.
Initialize the decision variables X and the velocity V, calculate the objective function value of the population pop.
Step 1.1: Initialize the decision variables X and the velocity V.
Step 1.2: calculate the objective function value of the population pop.
Step 2: Determines whether the constraints are met. If yes, go to step 3; otherwise, go to step 1.
Step 3: Initialize the dominant relationship between particles, then store the particles that represent non-dominated vectors in the repository rep.
Step 4: Create a grid and mark the grid information for the particles of the rep.
Step 5: Calculate particles’ individual historical optimal solution Xbest and use the grid method to obtain the global leader Gbest.
Step 6: Update the velocity and decision variables of the particles by Equations (17) and (18).
Step 7: Determines whether the constraints are met. If yes, go to step 8, otherwise go to step 5.
Step 8: Update the objective function vector F, and determine whether the constraints are met. If yes, go to step 9, otherwise go to step 5.
Step 9: Enable mutation mechanism, then re-establish the dominance relationship between particles including the rep and pop.
Step 10: Update the rep.
Step 11: Repeat Step5–Step10 until the maximum number of iterations is reached.
The simulation procedures in Section 3.5 are designed for MOOSM and MOTSM. For single objective method simulation procedures, it is different from the multi-objective method simulation procedures in some parts. There is no dominant mechanism or grid method in the single-objective method; it is simply necessary to directly compare the value of the fitness function of each particle to distinguish the particle quality.
4. Multi-Objective Decision-Making Method
To select the particles that are suitable for the actual situation of pumped-storage power station, the solutions need to be sorted according to the quality. In this paper, we use the entropy weight method [28] to calculate the objective weight of each objective function, and then give each function a subjective weight according to the experience of the decision maker. We then combine the objective weight and the subjective weight to get the comprehensive weight of each objective function. Finally, we use the method of relative objective proximity [29] to obtain the close degree of each multi-objective optimization solution and ideal solution, and then sort the multi-objective optimization schemes.
The entropy method introduces the concept of information entropy. The entropy e and the objective weight w are defined as follows:
where, pj (j = 1, 2, …, m) is the probability of j-th scheme, ωi, αi, βi, are objective weight, subjective weight and comprehensive weight of the i-th objective respectively.
The relative objective proximity of the objective function vector and the ideal point vector of the particle in the Pareto Front is given hereafter, the specific content reference [29,30].
Step 1: fi (i = 1, 2, …, n) is the objective functions, find the minimum di1 and maximum di2 of fi, so the feasible region of fi is [di1, di2].
Step 2: Define FMIN = [d11, d21, …, dn1] as the ideal point, and FMAX = [d12, d22, …, dn2] as the negative ideal point. Thus, the objective function vector F(X) = (f1(x), f2(x), …, fn(x)) can be transformed into a standard form as follows:
Step 3: Calculate g1(X), which is the weighted distance between the objective function vector and the ideal point; calculate g2(X), which is the weighted distance between the objective function vector and the negative ideal point.
Step 4: Calculate the relative objective proximity of particle X: l(X). The particle with greater the value of l is closer to the ideal point.
5. Case Study
To verify the effectiveness of multi-objective start-up, we choose a pumped-storage station in Jiangxi Province of China as the research target. In the project requirements, it is hoped that the transition process of turbine start-up condition can be safe and fast. Therefore, we need to apply the optimization method to get the optimal start-up rule. The structure of the water diversion system of the station is shown in Figure 8. The control system of the station is simulated in MATLAB 9.1, while the operating condition assumed as only unit 1 is working.
5.1. Model Parameters
Experiments are conducted under the same water head conditions: the water level of upper reservoir is 735.45 m, and downstream reservoir is 181 m. In the following experiments, parameters of PSO are set as: total number of iterations is 500, the population size is 200, the initial value of inertial weight w = 1, the inertial weight damping rate d = 0.99, the constant c1 = 1.5, the constant c2 = 2.0. Parameters of MOPSO are the same for PSO, except for c1 = 1.6, c2 = 1.6, w = 0.5. The repository size of MOPSO is 100. The values of some basic parameters of the methods are listed in Table 1. And the boundaries of decision variables are listed in Table 2.
5.2. Optimization Results of Multi-Objective Methods
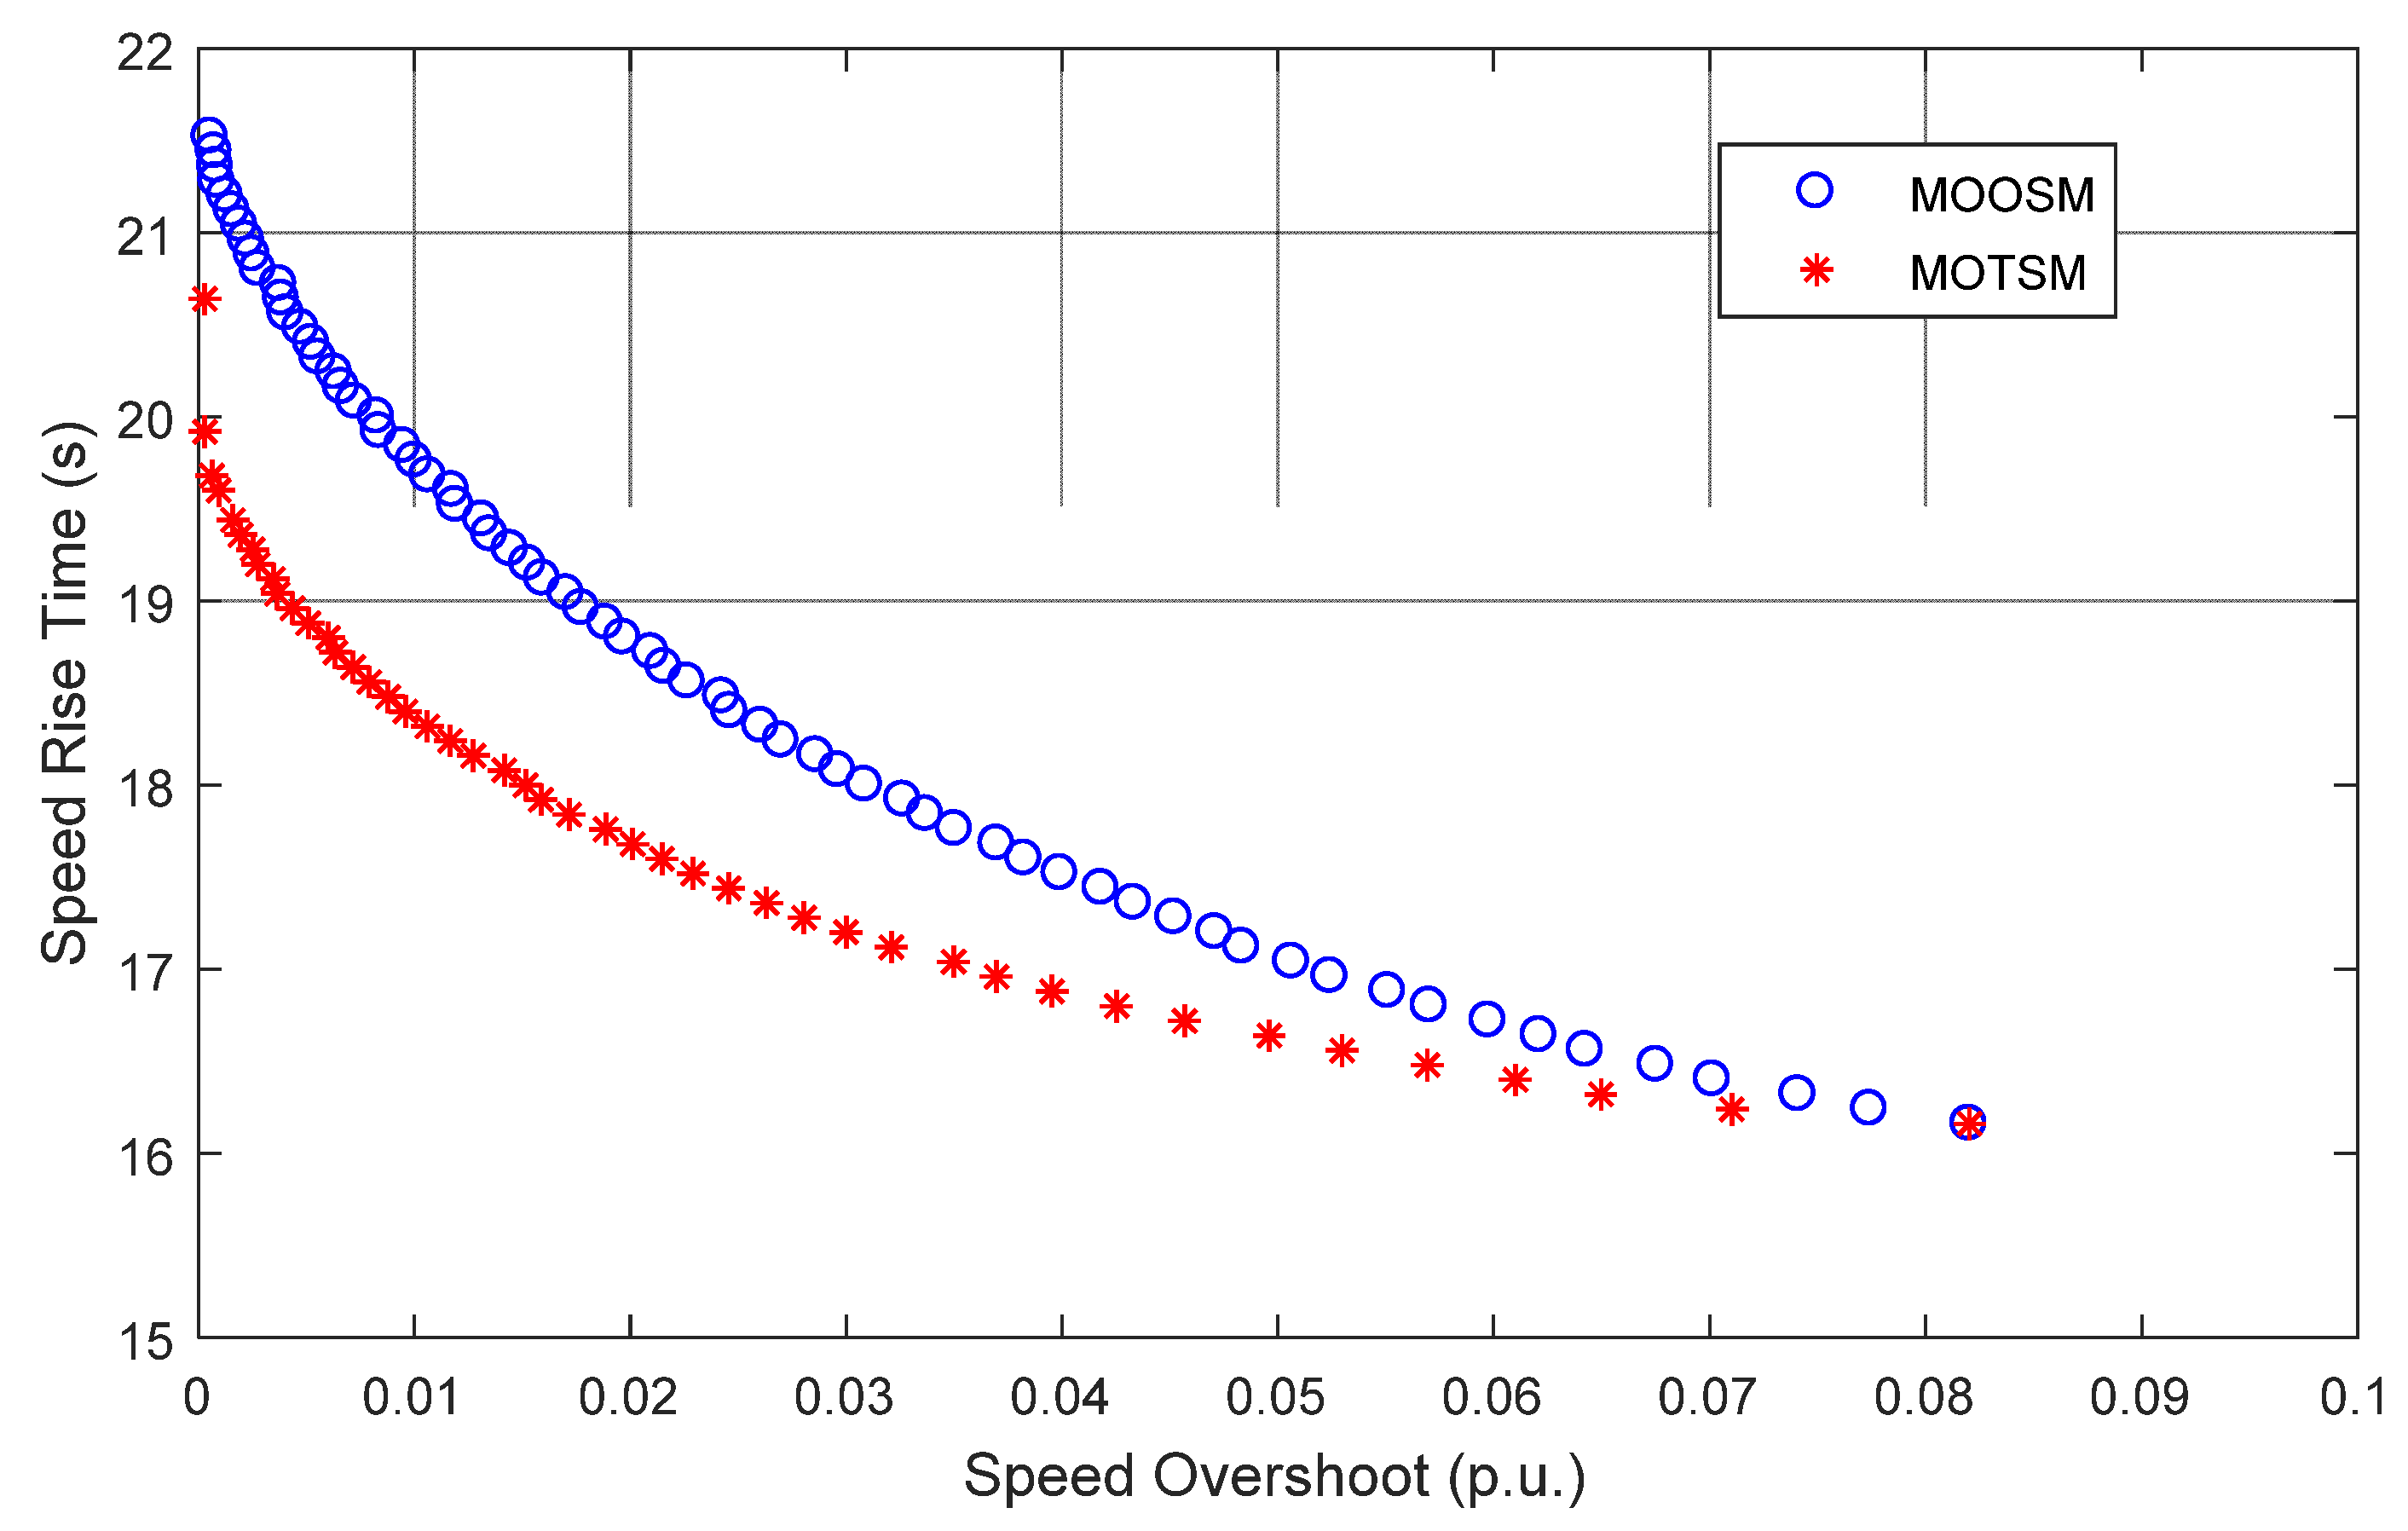
Experiments on multi-objective optimization of start-up strategies based on one-stage DGVC and two-stage DGVC have been conducted and the results have been analyzed. With the Pareto Front, we can optimize the initial population to get the Pareto Front of the MOOSM. The MOTSM have been presented in Figure 9. From Figure 9, it is shown that the particles of both fronts are evenly distributed. Comparatively, the solutions obtained by MOTSM are superior to those obtained by MOOSM, while those solutions in front of MOOSM are all dominated.
For solutions in both fronts, the speed overshoots are mainly concentrated in [0, 0.09], and the speed rise time are mainly concentrated in [15,21]. The optimization results satisfy the standard required for the transient process. The specific values of the objective function and the decision variable of the particles in the repository are given in Table A1.
To select the particles suitable for operation of pumped-storage power station, the solutions need to be sorted. The multi-objective decision-making method presented in Section 4 has been applied for this purpose. The weight information for sorting is shown in the Table 3. The sorting results of the particles in the Pareto Front of MOOSM and MOTSM are shown in the Table 4, in which, l1, l2 are relative objective proximity of particles of the MOOSM and MOTSM respectively.
5.3. Scheme Comparisons
To show the superiority of multi-objective optimization for PSU start-up, results obtained by multi-objective and single objective optimization are compared. Experiments on single objective optimization of straggles based on one-stage DGVC and two-stage DGVC have been conducted and the results have been collected. According to the sorting results of Table 4, which only shows the first 20 solutions, the scheme 15 in MOOSM, scheme 5 in MOTSM are the best solutions in the two groups. These two solutions are selected to represent the results of multi-objective optimization.
The selected solutions of multi-objective optimization methods are compared with those obtained by single objective optimization, while the optimization variables are listed in Table 5 and the performance indices concerning speed dynamics are shown in Table 6. In Table 5, We can see the DGVC parameters and PID parameters of the four optimal solutions. For the operators, they use the optimized DGVC parameters and PID parameters to construct the start-up rules, so as to control the start-up transition process of the unit. In other words, the operator enters a set of DGVC parameters and PID parameters to the governor, in order to get a start-up rule curve. In Table 6, tp is the stability time, s is the speed variance between ts and tp. From results in Table 6, it is shown that MOTSM achieves an overall best performance. With the price of a slightly bigger overshoot, the MOTSM possesses a smaller variance and stability time, which means that the PSU is much quicker at reaching a more stable state under the optimized start-up strategy. To be more specific, the speed rise time ts of MOTSM is 18.4 s, which 3% less than SOOSM, 2.5% less than SOTSM and 9.4% less than MOOSM. Furthermore, the stability time tp of MOTSM is 25.44 s, which 9.1% less than SOOSM, 14.7% less than SOTSM and 10.4% less than MOOSM.
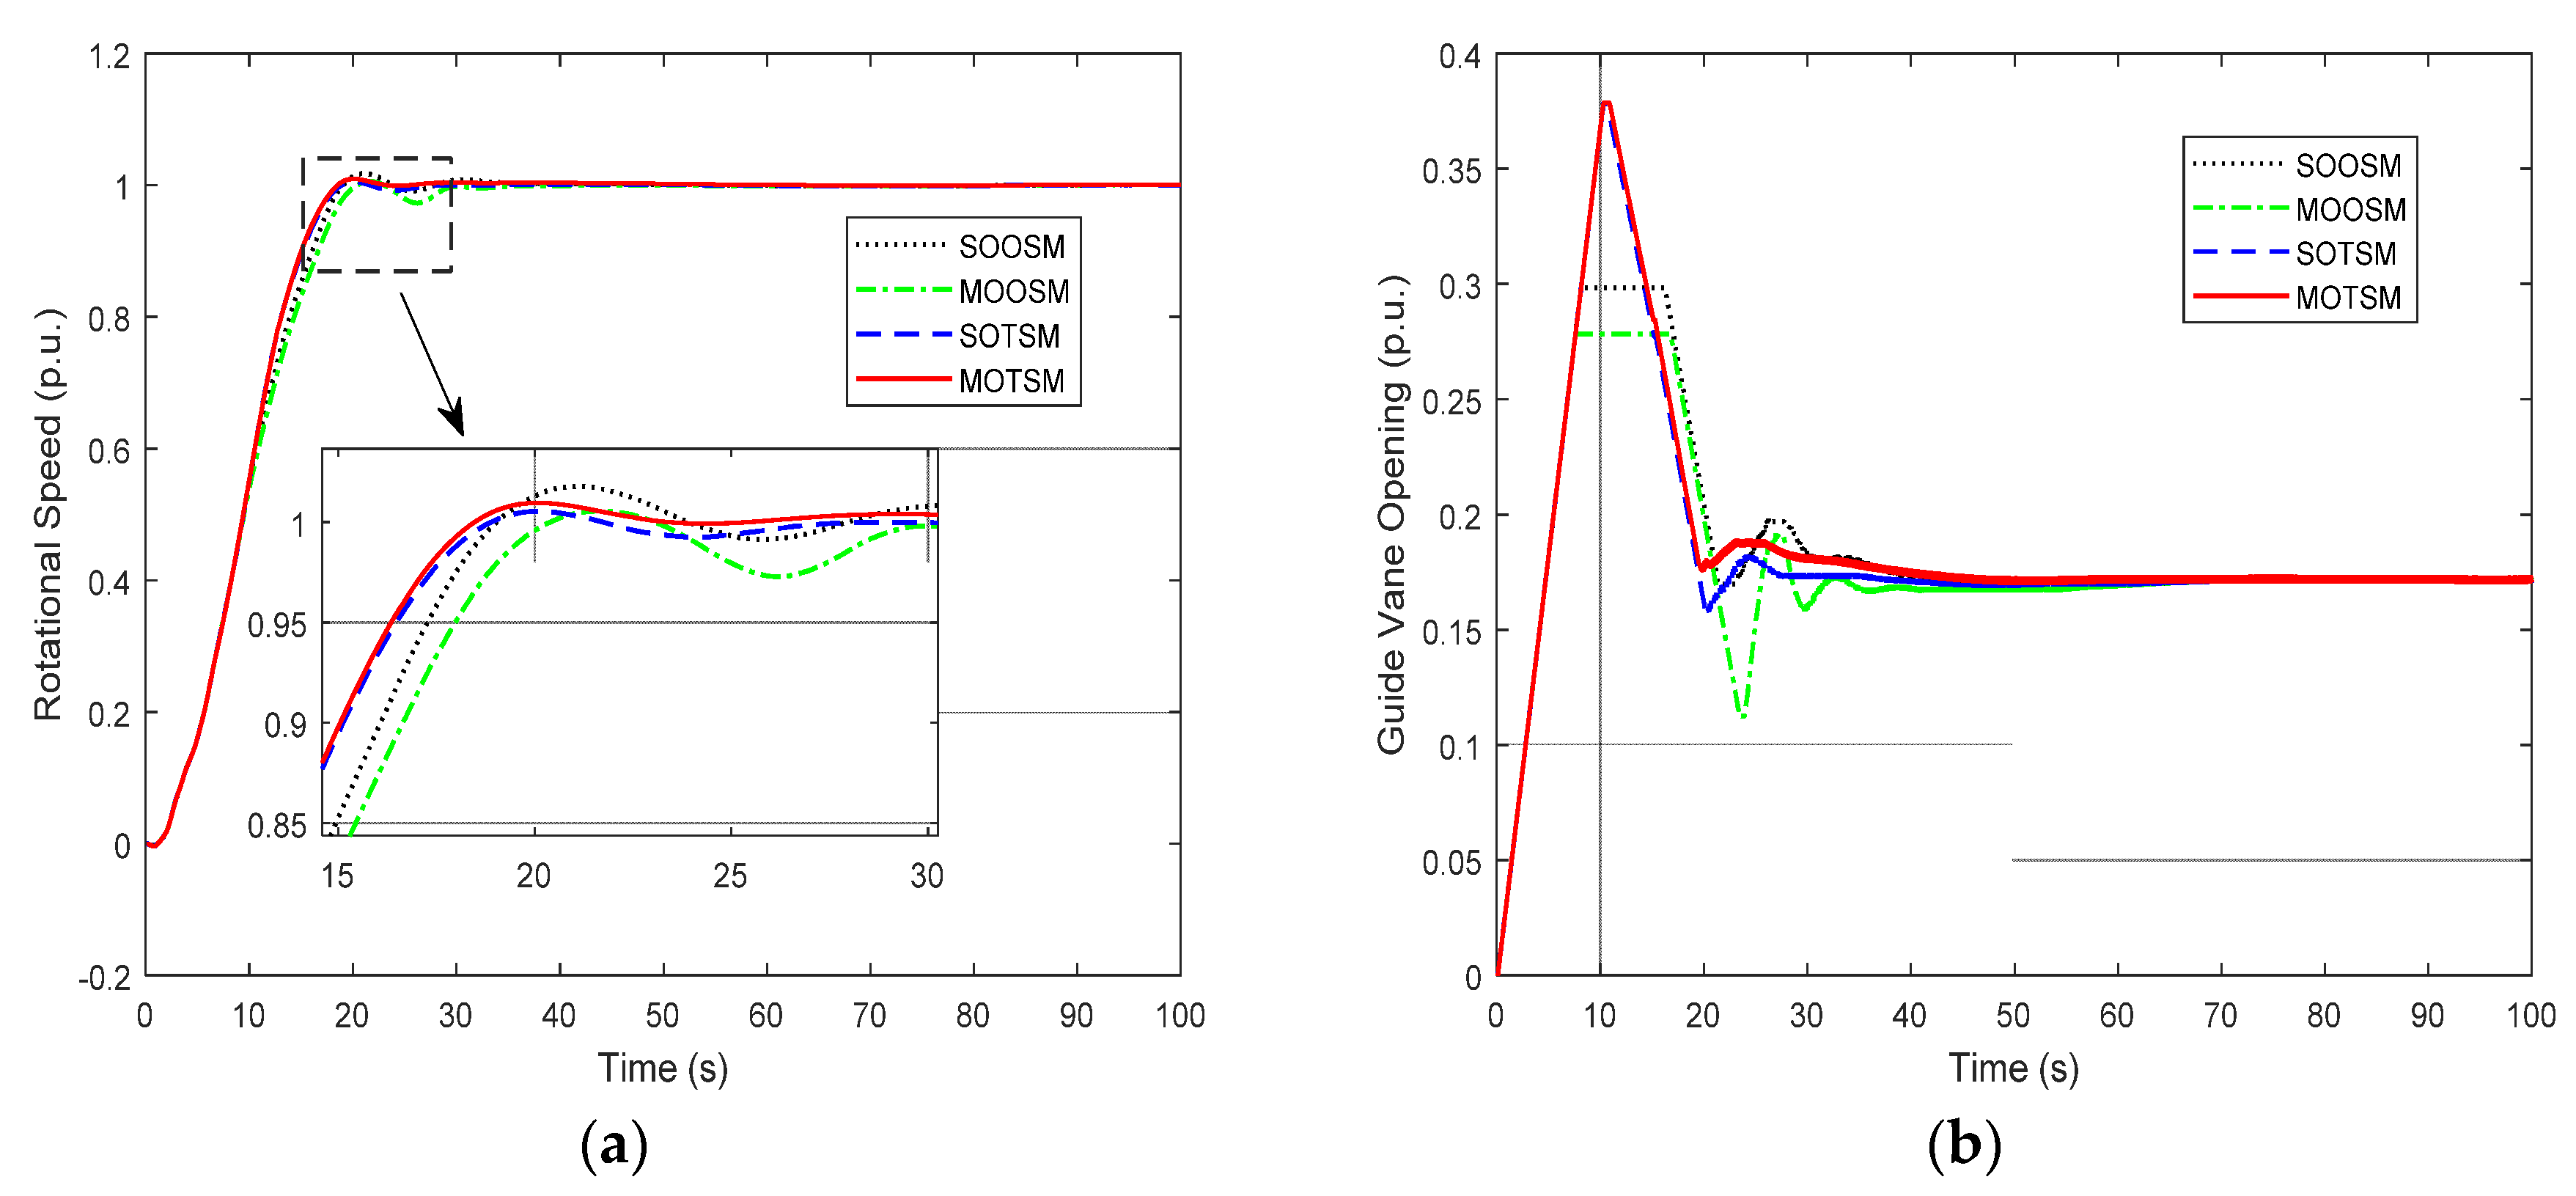
Correspondingly, the transient processes of the PSU with different optimization solutions of start-up strategies are shown in Figure 10, Figure 11 and Figure 12, in which the rotational speed, guide vane opening and some dynamic process characteristic curves are presented.
As shown in Figure 10a, compared to one-stage start-up strategies, the two-stage strategies possesses a quicker rotational speed rise ratio. The reason is that a two-stage start-up strategy, as shown in Figure 10b, has a larger guide vane opening as time in first stage, so a shorter time is needed for rotational speed to reach 90% of rated value. As can be seen from the enlarged part of Figure 10a, the speed curves of one-stage with single-objective and one-stage with multi-objective not only have a higher speed rise time and a larger speed overshoot, but also take a long time to stabilize. Therefore, it can be considered that the two-stage start-up strategy is better. It also can be seen from the two-stage start-up strategy with multi-objective of Figure 10b that the guide vane opening can be balanced rapidly and smoothly after the PID controller is put in, so the speed curves reach a stable state first. In general, the solution of MOTSM is the best.
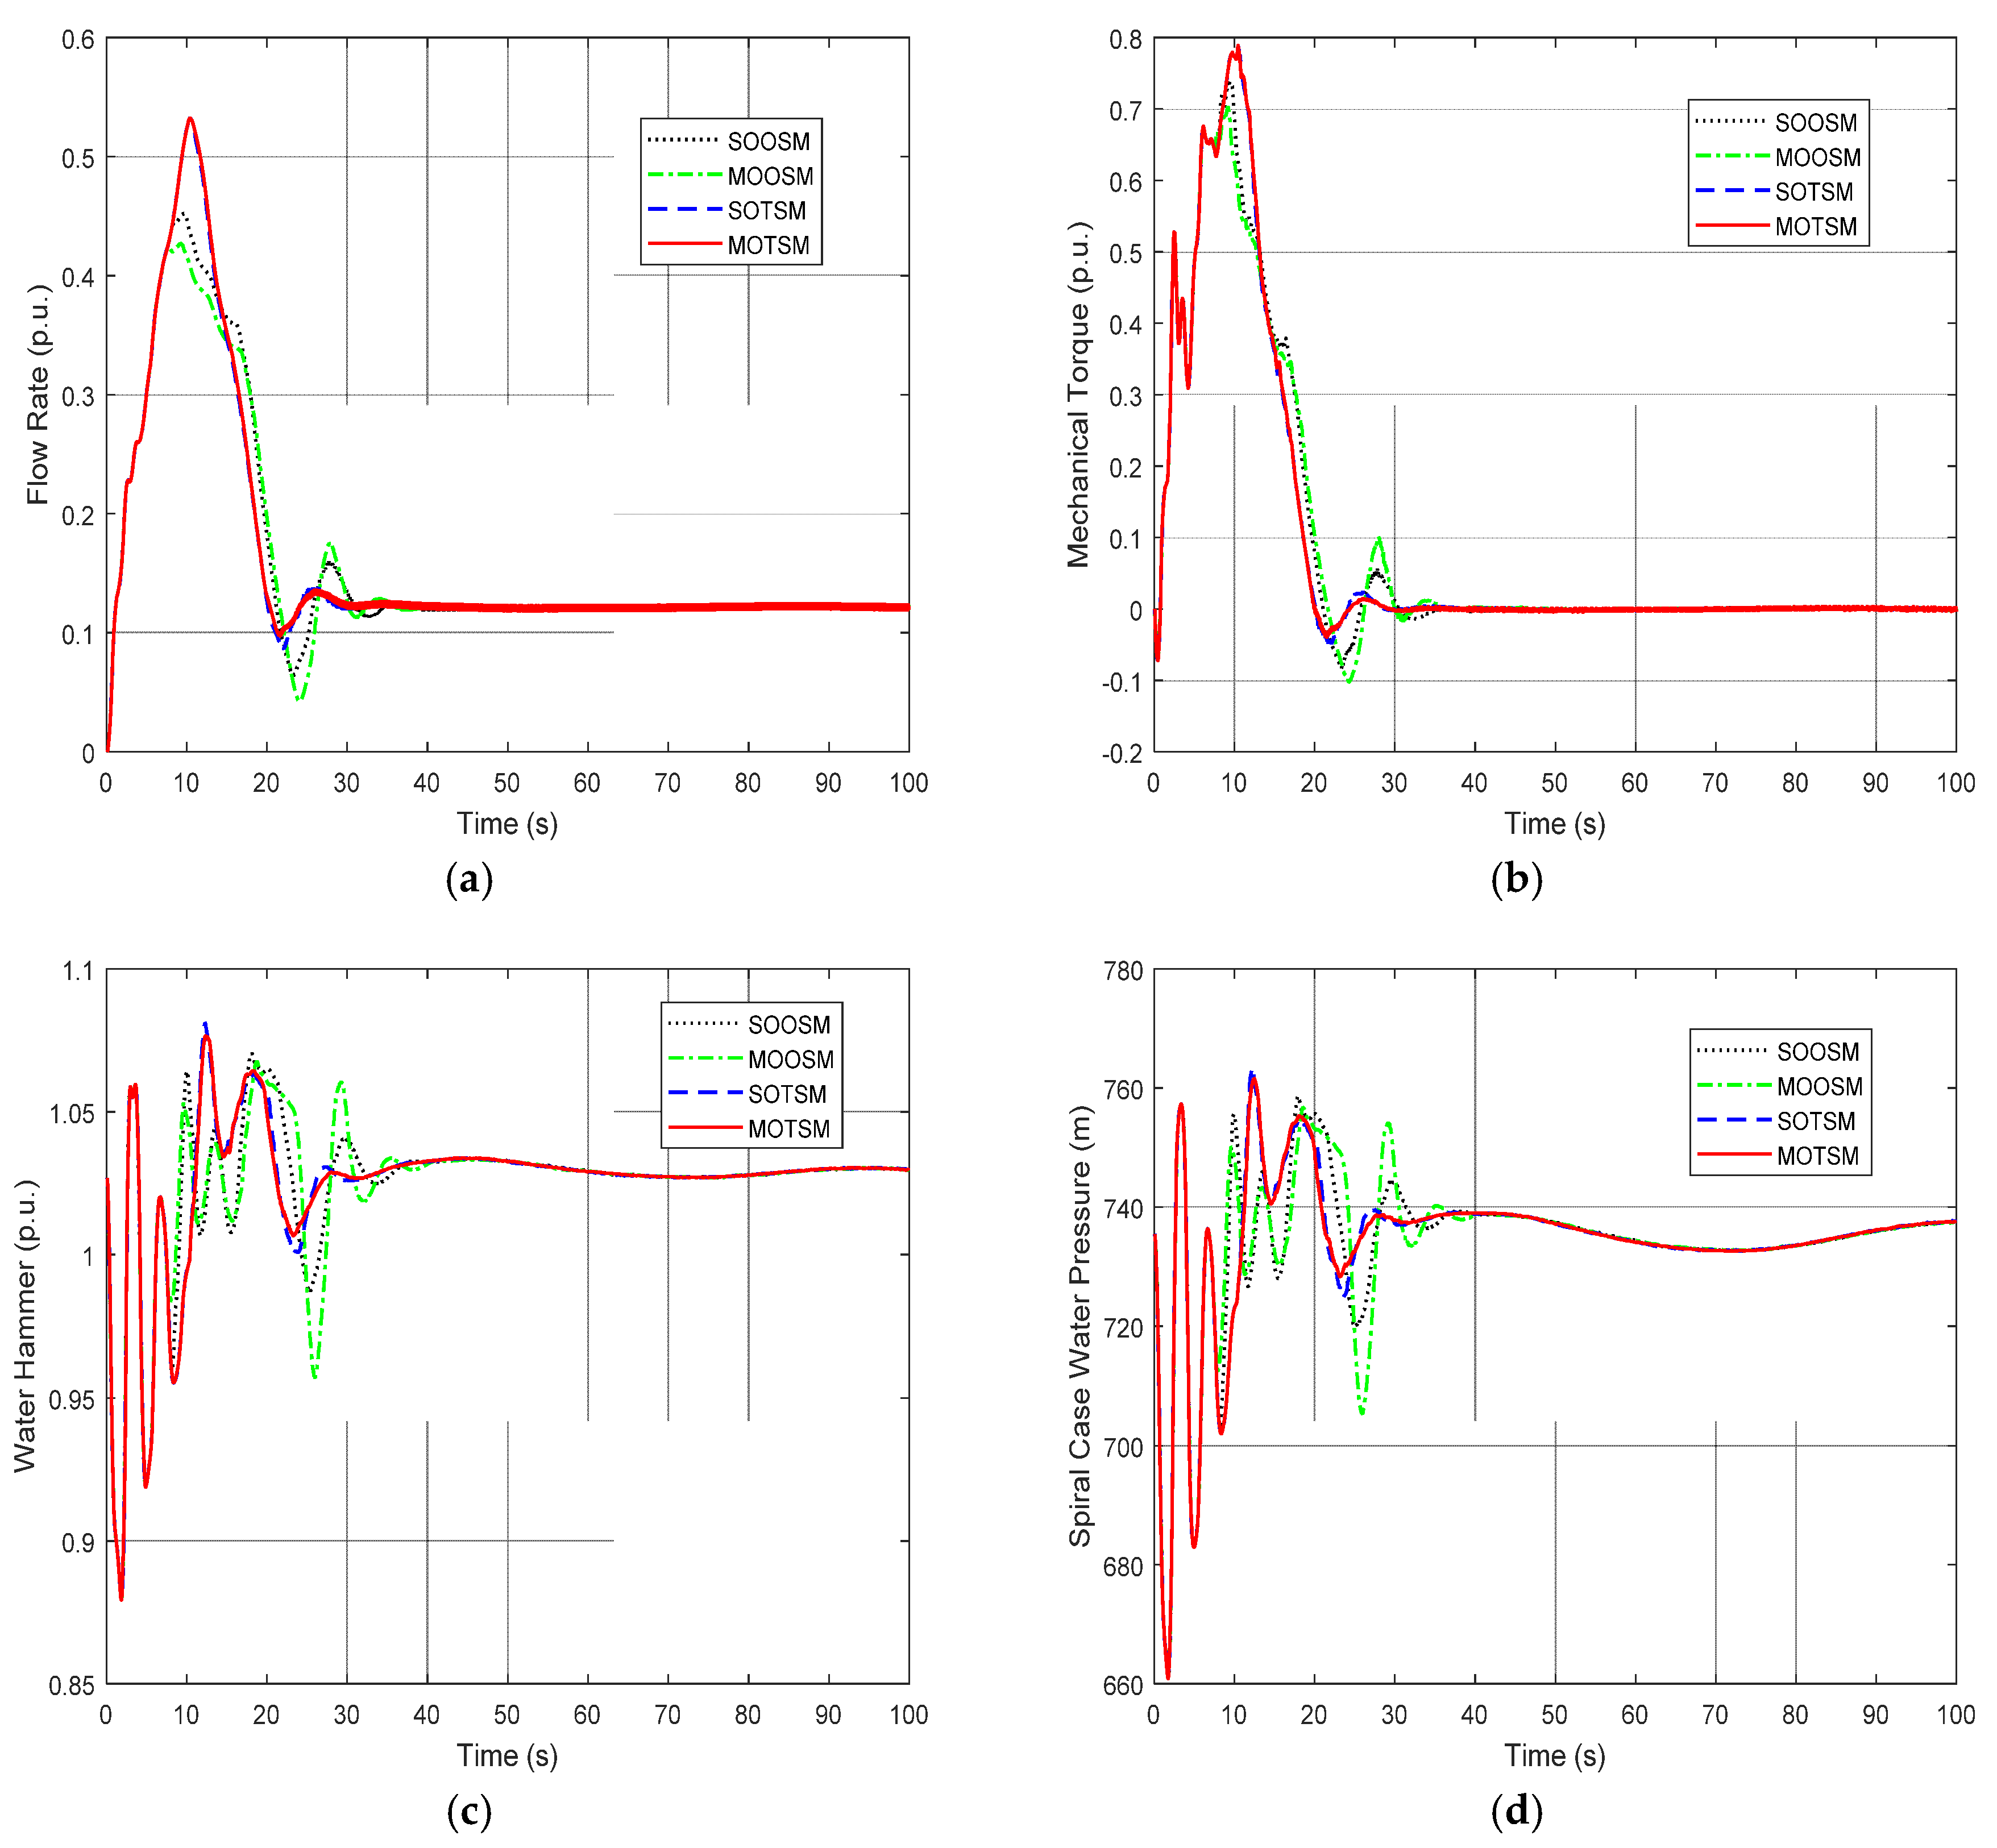
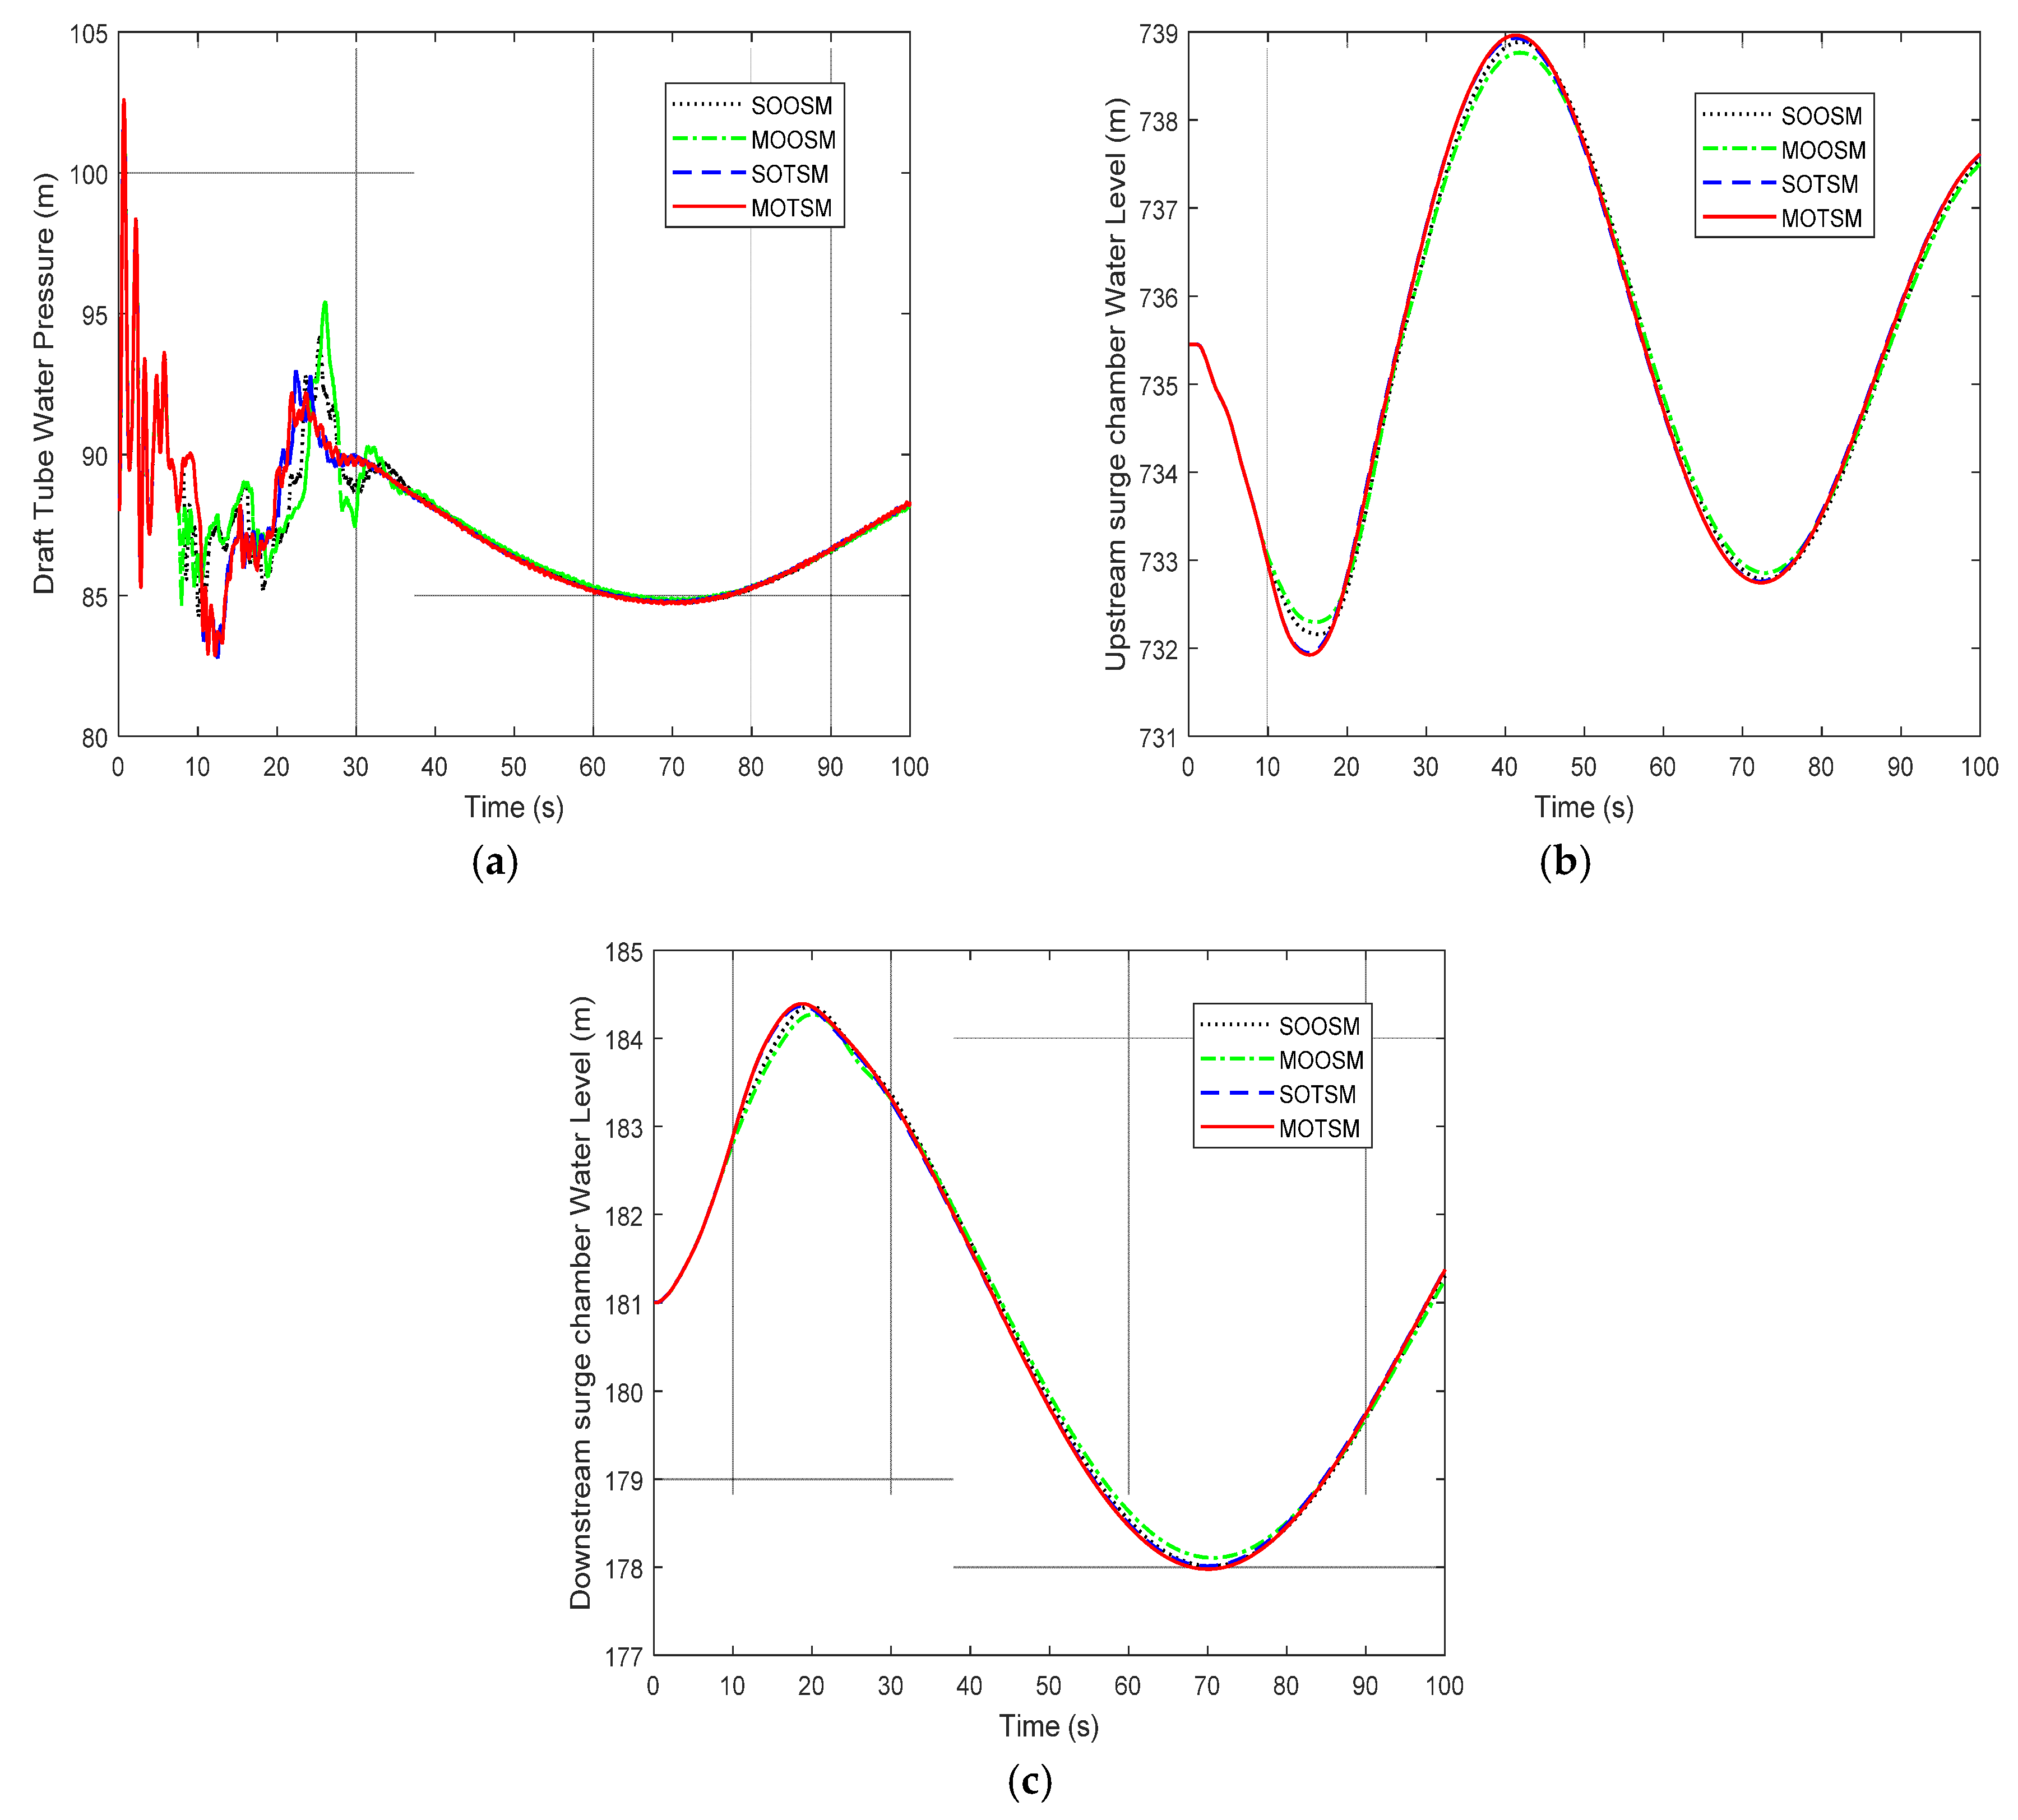
From the Figure 11a,b, it is found that the flow and the mechanical torque of unit 1# in the two-stage start-up strategy will continue to increase due to the continuous increase of the guide vane opening when the simulation time is around 8 s to 15 s. Furthermore, as can be seen from Figure 11c,d, the water hammer and the spiral case water pressure rise more sharply during this time. However, the continuous increase of the guide vane opening ensures the quick start up. After 20 s, due to the regulation of PID controller, the unit speed can be stabilized as quickly as possible. At this point, the two-stage start-up with multi-objective shows obvious advantages. The transient processes of related variables are presented in Figure 12. It is found that oscillation amplitude of the tube water pressure obtained by MOTSM is smaller than those obtained by other methods, as shown in Figure 12a. This means that more stable operation conditions could be reached. From Figure 12b,c, it is shown that the upstream and downstream surge chamber water-level of all strategies are in the safe area.
6. Conclusions
In the start-up process of a PSU, quickness and stability are two contrary objectives. In previous studies, these objectives have been converted to a single objective by weighting or by applying a particular transformation. This conversion will undoubtedly neglect some possible solutions, due to the presumption of relation of objectives, thus restricting the optimization performance on start-up process. Motivated by this demand, this paper proposes a multi-objective optimization method for start-up of PSU for the first time, in which the two objectives are the speed overshoot and the speed rise time. The Multi-objective Particle Swarm Optimization algorithm is applied to solve the multi-objective method. Two typical types of start-up strategy are studied: one is based on one-stage DGVC and the other is based on two-stage DGVC. In order to verify the effectiveness and advancement of multi-objective optimization for start-up strategy, comparative experiments based on a precise simulation plant of a PSPS in China have been designed, while single and multi- objective optimization on strategies with one-stage DGVC and two stage DGVC, i.e., SOOSM, SOTSM, MOOSM and MOTSM, are compared. The following conclusions could be obtained:
Compared with single objective optimization, the proposed multi-objective optimization of start-up strategy not only greatly shortens the speed rise time, the speed settling time and the speed overshoot, but also makes the speed curve stabilize quickly. Multi-objective optimization of strategy based on two-stage DGVC achieves better solution for a quick and smooth start-up of PSU than that of strategy based on one-stage DGVC. Furthermore, the optimization result of the multi-objective optimization method for start-up strategy is a Pareto Optimal Set, while the single-objective method obtains only one solution. The advantage of obtaining the Pareto Optimal Set is that it can provide more choice for decision makers or operators, and the set can be integrated into the unit governor control system according to the engineering requirements; optimal start-up of the unit can then be achieved. In conclusion, the multi-objective optimization for a start-up strategy with a two-stage DGVC could produce a satisfactory solution for a quick and stable start-up for PSUs, and the proposed method has the potential to be applied in practice.
Author Contributions
C.L. and Y.X. conceived and designed the experiments; J.H. and X.L. performed the simulations; N.Z., T.Z. and W.W. analyzed the data; J.H. and Z.T. wrote the paper; C.L. and Y.X. played an important role in the process of revising the paper.
Funding
This paper is supported by the National Key Research and Development Program of China (2016YFC0401905) and the National Natural Science Foundation of China (No. 51679095, No. 51479076).
Conflicts of Interest
The authors declare no conflict of interest.
Nomenclature
| V | average flow velocity of pipeline section |
| t | time |
| H | piezometric water head in the pipeline |
| L | length of the pipeline section |
| D | inner diameter of the pipe |
| f | Darcy-Weisbach coefficient of friction resistance |
| c | velocity of pressure wave |
| α | angle between pipeline and water level |
| A | cross section area of pipeline |
| g | gravitational acceleration |
| a | the relative value of turbine speed |
| q | the relative value of turbine flow |
| h | the relative value of water head |
| m | the relative value of turbine torque |
| x | horizontal coordinate of curves WH and WM |
| J | moment of inertia |
| Mt | the shaft mechanical moment |
| T | the time constant of frequency measurement |
| Tid | the time constant of differential link |
| k0 | the gain coefficient of servo-mechanism |
| TyB | the assistant servomotor response time |
| Ty | the main servomotor response time |
| n | the turbine speed |
| N11 | unit turbine speed |
| Q11 | unit turbine flow |
| M11 | unit turbine torque |
| ε1 | accuracy indexe for calculating Q |
| ε2 | accuracy indexe for calculating N |
Appendix A

Table A1.
Objective functions of the repository schemes.
| Scheme | MOOSM | MOTSM | ||
|---|---|---|---|---|
| nmax − 1 | ts | nmax − 1 | ts | |
| 1 | 0.0095 | 19.84 | 0.0229 | 17.52 |
| 2 | 0.0038 | 20.72 | 0.0006 | 19.68 |
| 3 | 0.0132 | 19.44 | 0.0088 | 18.48 |
| 4 | 0.0038 | 20.72 | 0.0117 | 18.24 |
| 5 | 0.0107 | 19.68 | 0.0096 | 18.40 |
| 6 | 0.0160 | 19.12 | 0.0009 | 19.60 |
| 7 | 0.0013 | 21.20 | 0.0159 | 17.92 |
| 8 | 0.0041 | 20.56 | 0.0016 | 19.44 |
| 9 | 0.0145 | 19.28 | 0.0044 | 18.96 |
| 10 | 0.0039 | 20.64 | 0.0159 | 17.92 |
| 11 | 0.0008 | 21.44 | 0.0159 | 17.92 |
| 12 | 0.0227 | 18.56 | 0.0159 | 17.92 |
| 13 | 0.0100 | 19.76 | 0.0201 | 17.68 |
| 14 | 0.0073 | 20.08 | 0.0142 | 18.08 |
| 15 | 0.0056 | 20.32 | 0.0159 | 17.92 |
| 16 | 0.0019 | 21.04 | 0.0127 | 18.16 |
| 17 | 0.0008 | 21.36 | 0.0189 | 17.76 |
| 18 | 0.0270 | 18.24 | 0.0036 | 19.04 |
| 19 | 0.0063 | 20.24 | 0.0201 | 17.68 |
| 20 | 0.0270 | 18.24 | 0.0019 | 19.36 |
| 21 | 0.0118 | 19.60 | 0.0569 | 16.48 |
| 22 | 0.0197 | 18.80 | 0.0152 | 18.00 |
| 23 | 0.0197 | 18.80 | 0.0051 | 18.88 |
| 24 | 0.0028 | 20.80 | 0.0027 | 19.20 |
| 25 | 0.0370 | 17.68 | 0.0246 | 17.44 |
| 26 | 0.0171 | 19.04 | 0.0159 | 17.92 |
| 27 | 0.0643 | 16.56 | 0.0350 | 17.04 |
| 28 | 0.0016 | 21.12 | 0.0063 | 18.72 |
| 29 | 0.0053 | 20.40 | 0.0159 | 17.92 |
| 30 | 0.0025 | 20.88 | 0.0457 | 16.72 |
| 31 | 0.0383 | 17.60 | 0.0159 | 17.92 |
| 32 | 0.0009 | 21.28 | 0.0215 | 17.60 |
| 33 | 0.0484 | 17.12 | 0.0395 | 16.88 |
| 34 | 0.0153 | 19.20 | 0.0106 | 18.32 |
| 35 | 0.0216 | 18.64 | 0.0003 | 19.92 |
| 36 | 0.0083 | 20.00 | 0.0159 | 17.92 |
| 37 | 0.0178 | 18.96 | 0.0159 | 17.92 |
| 38 | 0.0084 | 19.92 | 0.0425 | 16.80 |
| 39 | 0.0119 | 19.52 | 0.0530 | 16.56 |
| 40 | 0.0048 | 20.48 | 0.0072 | 18.64 |
| 41 | 0.0243 | 18.48 | 0.0025 | 19.28 |
| 42 | 0.0023 | 20.96 | 0.0035 | 19.12 |
| 43 | 0.0067 | 20.16 | 0.0201 | 17.68 |
| 44 | 0.0135 | 19.36 | 0.0060 | 18.80 |
| 45 | 0.0006 | 21.52 | 0.0159 | 17.92 |
| 46 | 0.0452 | 17.28 | 0.0159 | 17.92 |
| 47 | 0.0471 | 17.20 | 0.0172 | 17.84 |
| 48 | 0.0621 | 16.64 | 0.0370 | 16.96 |
| 49 | 0.0351 | 17.76 | 0.0710 | 16.24 |
| 50 | 0.0210 | 18.72 | 0.0263 | 17.36 |
| 51 | 0.0675 | 16.48 | 0.0159 | 17.92 |
| 52 | 0.0507 | 17.04 | 0.0159 | 17.92 |
| 53 | 0.0261 | 18.32 | 0.0159 | 17.92 |
| 54 | 0.0327 | 17.92 | 0.0280 | 17.28 |
| 55 | 0.0741 | 16.32 | 0.0159 | 17.92 |
| 56 | 0.0419 | 17.44 | 0.0300 | 17.20 |
| 57 | 0.0286 | 18.16 | 0.0610 | 16.40 |
| 58 | 0.0246 | 18.40 | 0.0321 | 17.12 |
| 59 | 0.0820 | 16.16 | 0.0003 | 20.64 |
| 60 | 0.0337 | 17.84 | 0.0159 | 17.92 |
| 61 | 0.0309 | 18.00 | 0.0079 | 18.56 |
| 62 | 0.0189 | 18.88 | 0.0159 | 17.92 |
| 63 | 0.0399 | 17.52 | 0.0650 | 16.32 |
| 64 | 0.0702 | 16.40 | 0.0820 | 16.16 |
| 65 | 0.0433 | 17.36 | 0.0496 | 16.64 |
| 66 | 0.0551 | 16.88 | ||
| 67 | 0.0570 | 16.80 | ||
| 68 | 0.0296 | 18.08 | ||
| 69 | 0.0598 | 16.72 | ||
| 70 | 0.0524 | 16.96 | ||
| 71 | 0.0774 | 16.24 | ||
References
- Chen, S.Y.; Zhang, G.S.; Rui, Z.; Nan, C.; Cao, B.D. Program Control Based Starting-up Control Strategy of Hydroelectric Generating Sets. Power Syst. Technol. 2005, 29, 76–79. [Google Scholar]
- Ye, L.; Wei, S.; Xu, H.; Malik, O.P.; Hope, G.S. Variable structure and time-varying parameter control for hydroelectric generating unit. IEEE Trans. Energy Convers. 2002, 4, 293–299. [Google Scholar]
- Kang, L. Studies on Closed loop Start up Control Strategy and Simulation for Hydroelectric Generating Units. J. Hydroelectr. Eng. 2000, 1, 55–61. [Google Scholar]
- Bao, H.; Yang, J.; Fu, L. Study on Nonlinear Dynamical Model and Control Strategy of Transient Process in Hydropower Station with Francis Turbine. In Proceedings of the Asia-Pacific Power and Energy Engineering Conference, Wuhan, China, 27–31 March 2009; pp. 1–6. [Google Scholar]
- Zhang, J.B.; Xie, J.C.; Jiao, S.B. Study on optimum start-up rule for hydroelectric generating units. J. Hydraul. Eng. 2004, 35, 53–59. [Google Scholar]
- Yang, W.; Yang, J. Study on Optimum Start-Up Method for Hydroelectric Generating Unit Based on Analysis of the Energy Relation. In Proceedings of the Asia-Pacific Power and Energy Engineering Conference, Shanghai, China, 27–29 March 2012; pp. 1–5. [Google Scholar]
- Zhou, B.; Yongliang, S.U.; Luo, R.; Jin, W.U. Comparison and Optimization of Two Control Technologies on Hydraulic Turbine Start-up Process. Hydropower Autom. Dam Monit. 2013, 37, 17–19, 23. [Google Scholar]
- Xu, Y.; Zhou, J.; Xue, X.; Xin, X.; Pei, X.; Chaoshun, L.I. Fractional Order PID-based Regulation and Control of Pumped Storage Units Under No-load Condition. Autom. Electr. Power Syst. 2015, 39, 43–48. [Google Scholar]
- Pannatier, Y.; Kawkabani, B.; Nicolet, C.; Schwery, A.; Simond, J.J. In Optimization of the start-up time of a variable speed pump-turbine unit in pumping mode. In Proceedings of the XX International Conference on Electrical Machines, Marseille, France, 2–5 September 2012; pp. 2126–2132. [Google Scholar]
- Wang, Z.; Li, C.; Lai, X.; Zhang, N.; Xu, Y.; Hou, J. An Integrated Start-Up Method for Pumped Storage Units Based on a Novel Artificial Sheep Algorithm. Energies 2018, 11, 151. [Google Scholar] [CrossRef]
- Maiti, D.; Acharya, A.; Chakraborty, M.; Konar, A.; Janarthanan, R. Tuning PID and PI/λDδ Controllers using the Integral Time Absolute Error Criterion. In Proceedings of the IEEE International Conference on Information and Automation for Sustainability, Colombo, Sri Lanka, 12–14 December 2008; pp. 457–462. [Google Scholar]
- Coello, C.A.C.; Lechuga, M.S. MOPSO: A proposal for multiple objective particle swarm optimization. In Proceedings of the Evolutionary Computation (CEC’2002), Honolulu, HI, USA, 12–17 May 2002; pp. 1051–1056. [Google Scholar]
- Lai, X.; Li, C.; Zhou, J. A Multi-objective Artificial Sheep Algorithm. Neural Comput. Appl. 2018, 1–35. [Google Scholar] [CrossRef]
- Chen, J. Computer Simulation of Hydraulic Turbine Regulation System; Water Resources and Electric Power Press: Beijing, China, 1993. [Google Scholar]
- Sim, W.G.; Park, J.H. Transient analysis for compressible fluid flow in transmission line by the method of characteristics. KSME Int. J. 1997, 11, 173–185. [Google Scholar] [CrossRef]
- Chaudhry, M.H. Characteristics and Finite-Difference Methods. Appl. Hydraul. Transients 2014, 94, 65–113. [Google Scholar]
- Dörfler, P.K. Improved Suter Transform for Pump-Turbine Characteristics. Int. J. Fluid Mach. Syst. 2010, 3, 332–341. [Google Scholar] [CrossRef]
- Zheng, X.B.; Guo, P.C.; Tong, H.Z.; Luo, X.Q. Improved Suter-Transformation for Complete Characteristic Curves of Pump-Turbine. In IOP Conference Series: Earth and Environmental Science; IOP: Bristol, UK, 2012. [Google Scholar]
- Liu, Z.M.; Zhang, D.H.; Liu, Y.Y.; Zhang, X. New Suter-transformation Method of Complete Characteristic Curves of Pump-turbines Based on the 3-D Surface. China Rural Water Hydropower 2015, 1, 143–145. [Google Scholar]
- Yang, W.; Yang, J.; Guo, W.; Zeng, W.; Wang, C.; Saarinen, L.; Norrlund, P. A Mathematical Model and Its Application for Hydro Power Units under Different Operating Conditions. Energies 2015, 8, 10260–10275. [Google Scholar] [CrossRef]
- Chen, Z.; Yuan, Y.; Yuan, X.; Huang, Y.; Li, X.; Li, W. Application of multi-objective controller to optimal tuning of PID gains for a hydraulic turbine regulating system using adaptive grid particle swam optimization. ISA Trans. 2015, 56, 173–187. [Google Scholar] [CrossRef] [PubMed]
- Xu, Y.; Li, C.; Wang, Z.; Zhang, N.; Peng, B. Load frequency control of a novel renewable energy integrated micro-grid containing pumped hydropower energy storage’. IEEE Access 2018. [Google Scholar] [CrossRef]
- Li, C.; Xiao, Z.; Xia, X.; Zou, W.; Zhang, C. A hybrid model based on synchronous optimisation for multi-step short-term wind speed forecasting. Appl. Energy 2018, 215, 131–144. [Google Scholar] [CrossRef]
- Zhong-Kai, L.I.; Tan, J.R.; Feng, Y.X.; Fang, H. Multi-objective particle swarm optimization algorithm based on crowding distance sorting and its application. Comput. Integr. Manuf. Syst. 2008, 14, 1329–1336. [Google Scholar]
- Kennedy, J.; Eberhart, R. Particle Swarm optimization. In Proceedings of the IEEE International Conference on Neural Networks, Champaign, IL, USA, 27 November–1 December 1995; Volume 4, pp. 1942–1948. [Google Scholar]
- Li, C.; Mao, Y.; Yang, J.; Wang, Z.; Xu, Y. A nonlinear generalized predictive control for pumped storage unit. Renew. Energy 2017, 114, 945–959. [Google Scholar] [CrossRef]
- Li, C.; Zhang, N.; Lai, X.; Zhou, J.; Xu, Y. Design of a fractional order PID controller for a pumped storage unit using a gravitational search algorithm based on the Cauchy and Gaussian mutation. Inf. Sci. 2017, 396, 162–181. [Google Scholar] [CrossRef]
- Huang, J. In Combining entropy weight and TOPSIS method for information system selection. In Proceedings of the IEEE International Conference on Automation and Logistics, Chengdu, China, 21–24 September 2008; pp. 1281–1284. [Google Scholar]
- Song, H.Z. A Method Based on Objective Adjacent Scale for Multi-Objective Decision-Making and its Application. Math. Pract. Theory 2004, 5, 30–36. [Google Scholar]
- Yang, G.Y.; Zhang, Y.H. Research on Solving Method of Multi-Objective Decision-making. Math. Pract. Theory 2012, 42, 108–115. [Google Scholar]
Figure 1.
The regulating system model of pumped storage unit.

Figure 2.
Difference grid obtained by MOC.

Figure 3.
Structure of the PID controller.

Figure 4.
Structure of the servomechanism.

Figure 5.
The speed transition curves of PSU.

Figure 6.
One-stage DGVC.

Figure 7.
Two-stage DGVC.

Figure 8.
Structure of the water diversion system.

Figure 9.
The domination relations of two Pareto Fronts.

Figure 10.
The transient processes of the rotational speed and guide vane opening with different solutions: (a) Rotational speed; (b) Guide vane opening of optimal solutions.
Figure 10.
The transient processes of the rotational speed and guide vane opening with different solutions: (a) Rotational speed; (b) Guide vane opening of optimal solutions.

Figure 11.
Transient processes of the PSU with different solutions: (a) Flow rate of optimal solutions; (b) Mechanical torque of optimal solutions; (c) Water hammer of optimal solutions; (d) Spiral case water pressure of optimal solutions.
Figure 11.
Transient processes of the PSU with different solutions: (a) Flow rate of optimal solutions; (b) Mechanical torque of optimal solutions; (c) Water hammer of optimal solutions; (d) Spiral case water pressure of optimal solutions.

Figure 12.
Some other transient processes of PSU with different solutions: (a) Draft tube water pressure of optimal solutions; (b) Upstream surge chamber water level of optimal solutions; (c) Downstream surge chamber water level of optimal solutions.
Figure 12.
Some other transient processes of PSU with different solutions: (a) Draft tube water pressure of optimal solutions; (b) Upstream surge chamber water level of optimal solutions; (c) Downstream surge chamber water level of optimal solutions.

Table 1.
Basic parameters of methods.
| Components | Values | ||||
|---|---|---|---|---|---|
| Suter transformation | k1 = 10 | k2 = 0.9 | Cy = 0.2 | Ch = 0.5 | |
| Generator | J = 96.84 | ||||
| Governor | TID = 1 | T = 0.1 | k0 = 7 | TyB = 0.05 | Ty = 0.3 |
| DGVC | kc1 = 1/27 | kc2 = −1/45 | |||
Table 2.
The boundaries of decision variables.
| Parameters | Boundary | Values | |||||
|---|---|---|---|---|---|---|---|
| X1 | BL1 | 0 | 0 | 0 | 0.1 | ||
| BU1 | 10 | 5 | 10 | 0.4 | |||
| X2 | BL2 | 1 | 3 | 0.1 | 0.2 | 0.1 | 0.6 |
| BU2 | 3 | 7 | 0.4 | 0.4 | 0.3 | 0.9 | |
Table 3.
The weight information of two methods.
| Method | w | α | β |
|---|---|---|---|
| MOOSM | [0.33,0.67] | [0.90,0.10] | [0.81,0.19] |
| MOTSM | [0.45,0.55] | [0.72,0.28] | [0.67,0.33] |
Table 4.
The sorting results of two methods.
| Order Number | Scheme of MOOSM | l1 | Scheme of MOTSM | l2 |
|---|---|---|---|---|
| 1 | 15 | 0.833301 | 5 | 0.774395 |
| 2 | 43 | 0.832457 | 34 | 0.773965 |
| 3 | 8 | 0.83231 | 3 | 0.773264 |
| 4 | 29 | 0.832253 | 4 | 0.772700 |
| 5 | 40 | 0.831972 | 61 | 0.772088 |
| 6 | 19 | 0.831914 | 16 | 0.770794 |
| 7 | 14 | 0.831352 | 40 | 0.770027 |
| 8 | 10 | 0.830653 | 28 | 0.768047 |
| 9 | 24 | 0.829389 | 14 | 0.765439 |
| 10 | 38 | 0.828815 | 44 | 0.763881 |
| 11 | 2 | 0.828675 | 22 | 0.762701 |
| 12 | 4 | 0.828675 | 23 | 0.761969 |
| 13 | 30 | 0.827776 | 7 | 0.761787 |
| 14 | 36 | 0.827336 | 10 | 0.761787 |
| 15 | 42 | 0.826125 | 11 | 0.761787 |
| 16 | 16 | 0.824560 | 12 | 0.761787 |
| 17 | 1 | 0.823365 | 15 | 0.761787 |
| 18 | 28 | 0.823017 | 26 | 0.761787 |
| 19 | 13 | 0.821481 | 29 | 0.761787 |
| 20 | 7 | 0.821374 | 31 | 0.761787 |
Table 5.
Optimization variables obtained by different methods.
| Method | SOOSM | SOTSM | MOOSM | MOTSM |
|---|---|---|---|---|
| Kp | 1.497668 | 1.576230 | 2.572042 | 1.318555 |
| Ki | 3.150735 | 5.710390 | 4.622788 | 5.909830 |
| Kd | 9.952709 | 0.100000 | 6.735524 | 0.400000 |
| yc (yc1) | 0.298406 | 0.378624 | 0.278244 | 0.378610 |
| yc2 | 0.161722 | 0.162522 | ||
| nc | 0.602104 | 0.619057 |
Table 6.
The performance indices.
| Indices | SOOSM | SOTSM | MOOSM | MOTSM |
|---|---|---|---|---|
| speed overshoot | 0.017860 | 0.005485 | 0.005569 | 0.009590 |
| ts | 18.96 | 18.88 | 20.32 | 18.40 |
| tp | 28.00 | 29.84 | 28.40 | 25.44 |
| s (×10−4) | 0.9653 | 2.056 | 0.2412 | 0.2365 |
© 2018 by the authors. Licensee MDPI, Basel, Switzerland. This article is an open access article distributed under the terms and conditions of the Creative Commons Attribution (CC BY) license (http://creativecommons.org/licenses/by/4.0/).
Share and Cite
MDPI and ACS Style
Hou, J.; Li, C.; Tian, Z.; Xu, Y.; Lai, X.; Zhang, N.; Zheng, T.; Wu, W. Multi-Objective Optimization of Start-up Strategy for Pumped Storage Units. Energies 2018, 11, 1141. https://doi.org/10.3390/en11051141
AMA Style
Hou J, Li C, Tian Z, Xu Y, Lai X, Zhang N, Zheng T, Wu W. Multi-Objective Optimization of Start-up Strategy for Pumped Storage Units. Energies. 2018; 11(5):1141. https://doi.org/10.3390/en11051141
Chicago/Turabian StyleHou, Jinjiao, Chaoshun Li, Ziqin Tian, Yanhe Xu, Xinjie Lai, Nan Zhang, Taoping Zheng, and Wei Wu. 2018. "Multi-Objective Optimization of Start-up Strategy for Pumped Storage Units" Energies 11, no. 5: 1141. https://doi.org/10.3390/en11051141
Note that from the first issue of 2016, this journal uses article numbers instead of page numbers. See further details here.