1. Introduction
A fundamental problem of particular interest to engineering is flow maldistribution, which is the non-uniform distribution of flow in a system or device in some industrial applications. It causes poor working conditions and higher energy losses where it occurs. Flow distribution is an important parameter in the efficiency of diverse thermal systems such as parallel plate heat exchangers [
1], microchannel heat exchangers [
2], energy storage systems [
3], fuel cells [
4], solar collector [
5], solar collector networks [
6,
7,
8], etc.
Several methods to improve the thermal efficiency in solar collectors such as the use of alumina nanofluids, variable tilt angles, and variable mass flow rates, have been used [
9,
10,
11]. Nevertheless, in solar collectors the thermal performance is also greatly affected by the flow distribution through the riser tubes. The first analyses developed to determine the efficiency of a solar collector are based on the assumption of a uniform flow distribution through the riser tubes [
12], which does not happen in these systems due to the arrangement.
Dunkle and Davey [
13] performed experimental analysis on the non-uniform flow distribution, demonstrating that unlike systems with natural circulation, this condition presents a stronger effect on forced circulation systems. Their results show that there exist temperature differences up to 22 °C from the center to the end sides of a bank of twelve collectors connected in parallel. Furthermore, Fan et al. [
14] indicated that the flow non-uniformity, besides causing efficiency reduction, it can also produce boiling in some parts of the collector, causing severe problems such as flow oscillations and steam blockage, which generate vibrations and a lower heat transfer rate, respectively.
Chiou [
5] developed a numerical model based on finite differences, in order to estimate the value of the efficiency deterioration factor of a solar collector for different flow distributions by means of Equation (1), demonstrating that the non-uniformity in the flow distribution can cause a decrease in the thermal efficiency larger than 20%. Several non-uniform flow distributions were analyzed and obtained under the assumption of the existence of incrustations inside the riser tubes. However, these distributions do not coincide with the different flow distributions present in a collector that operates in ordinary usage conditions:
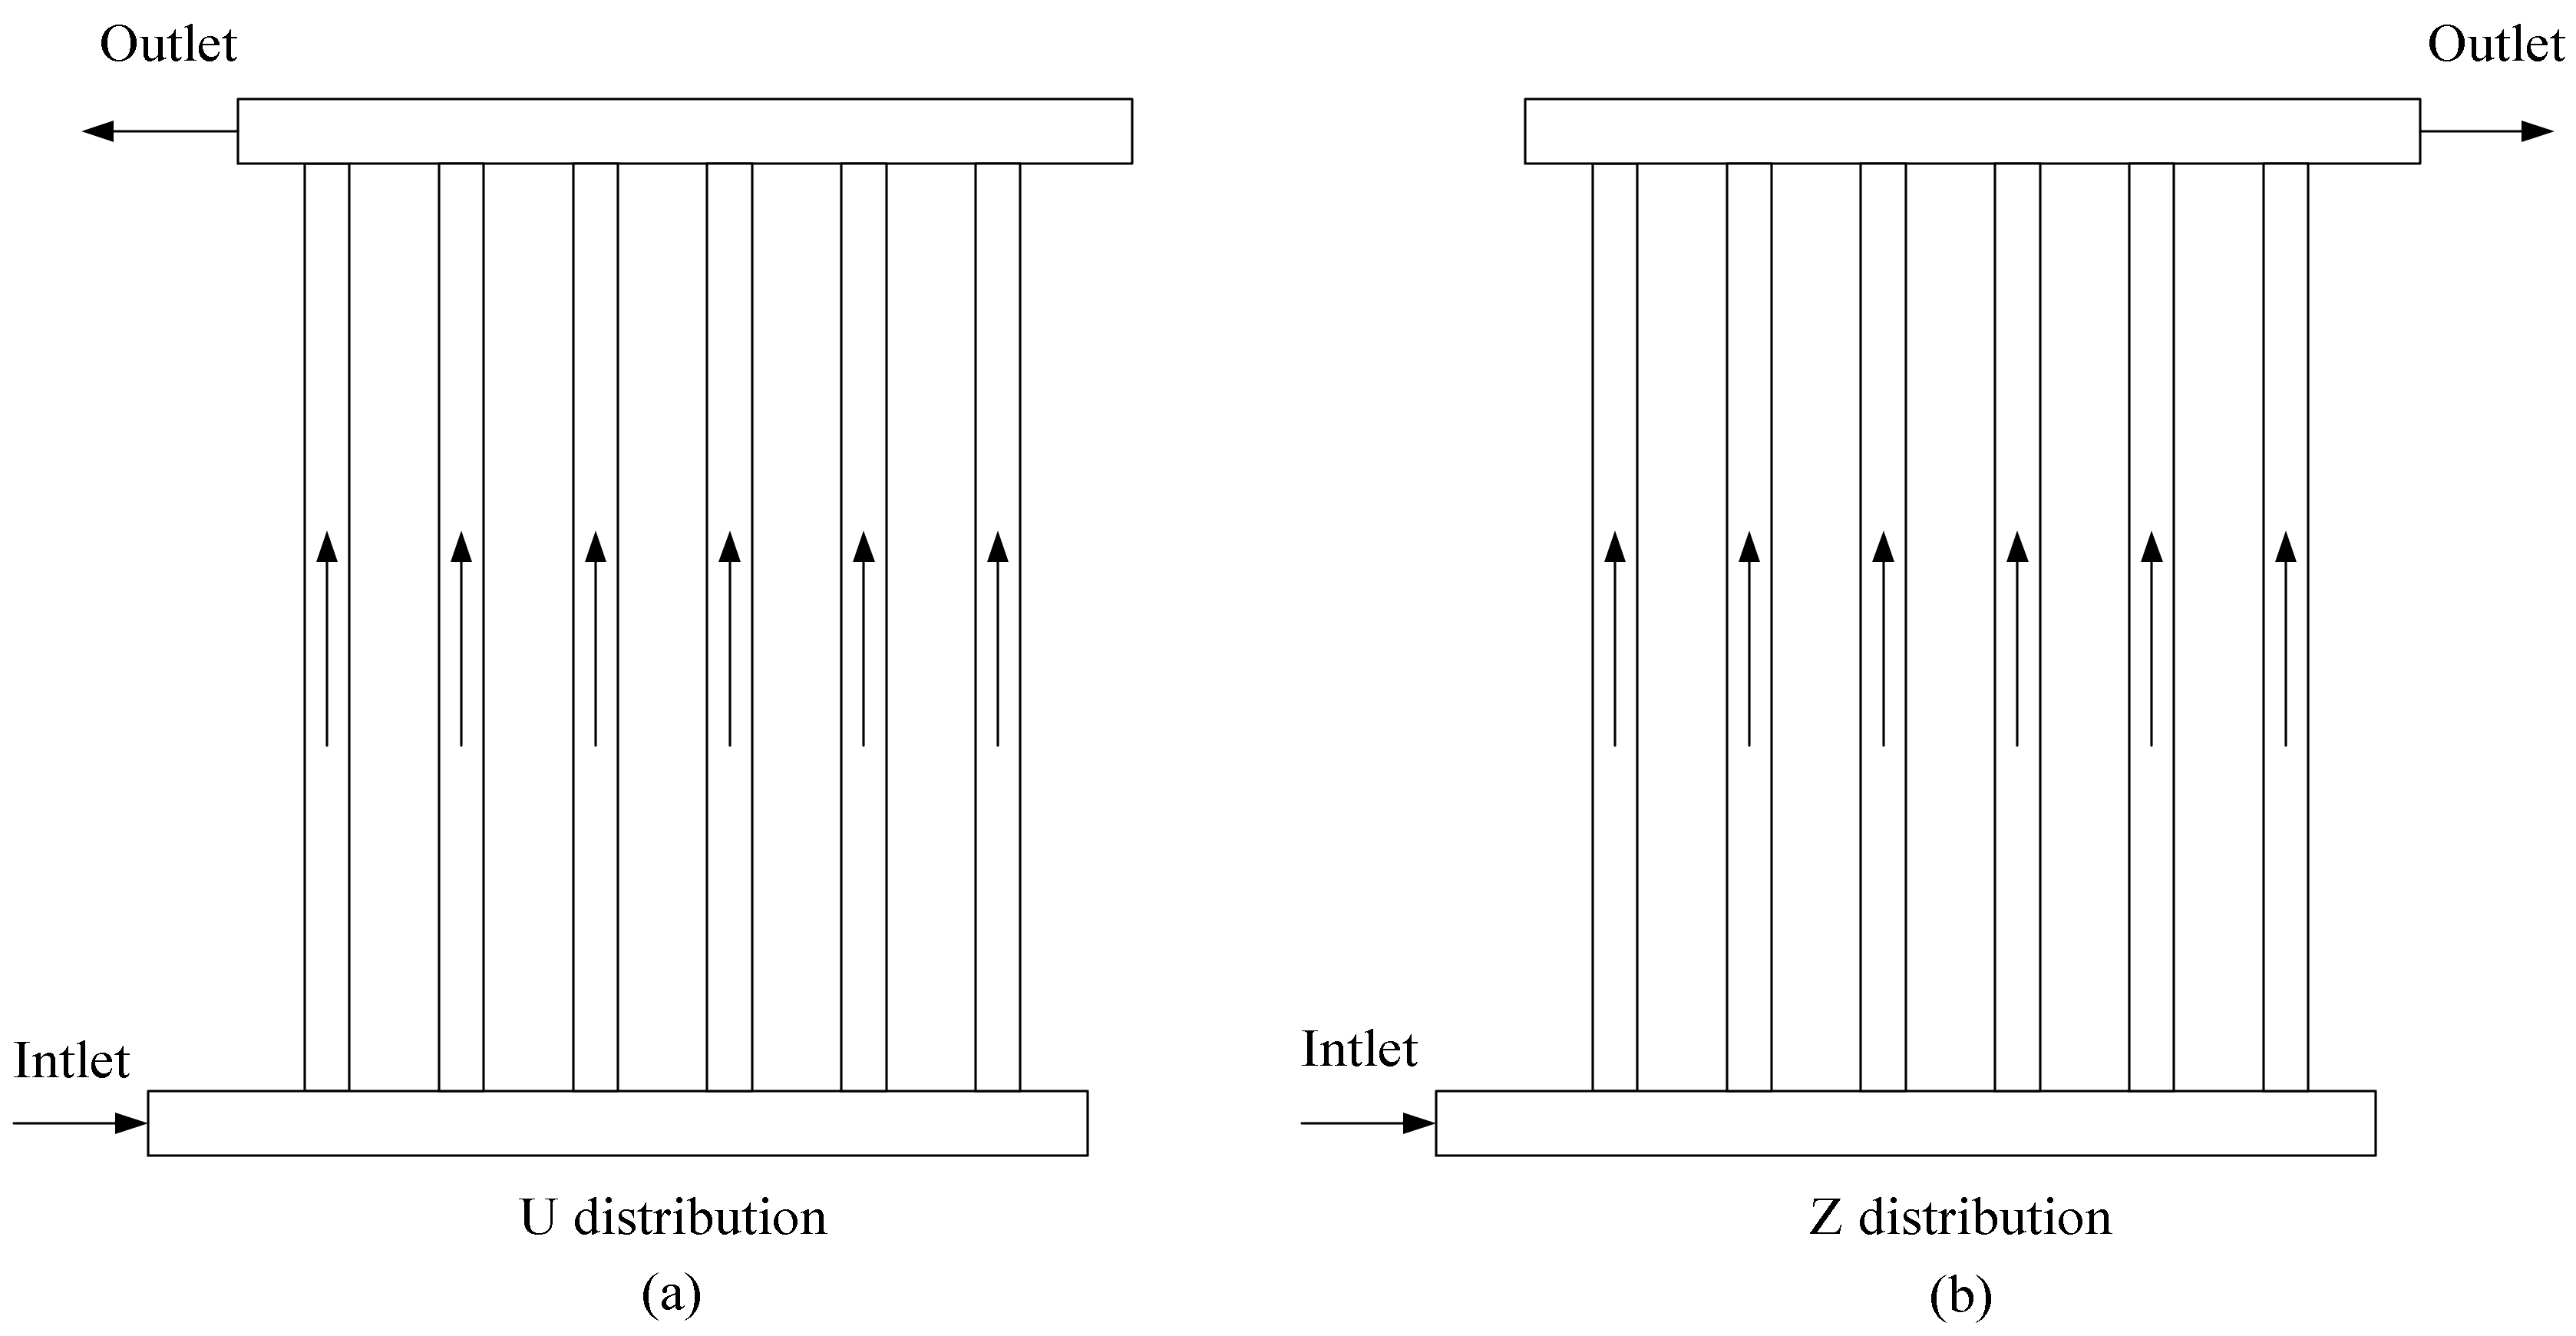
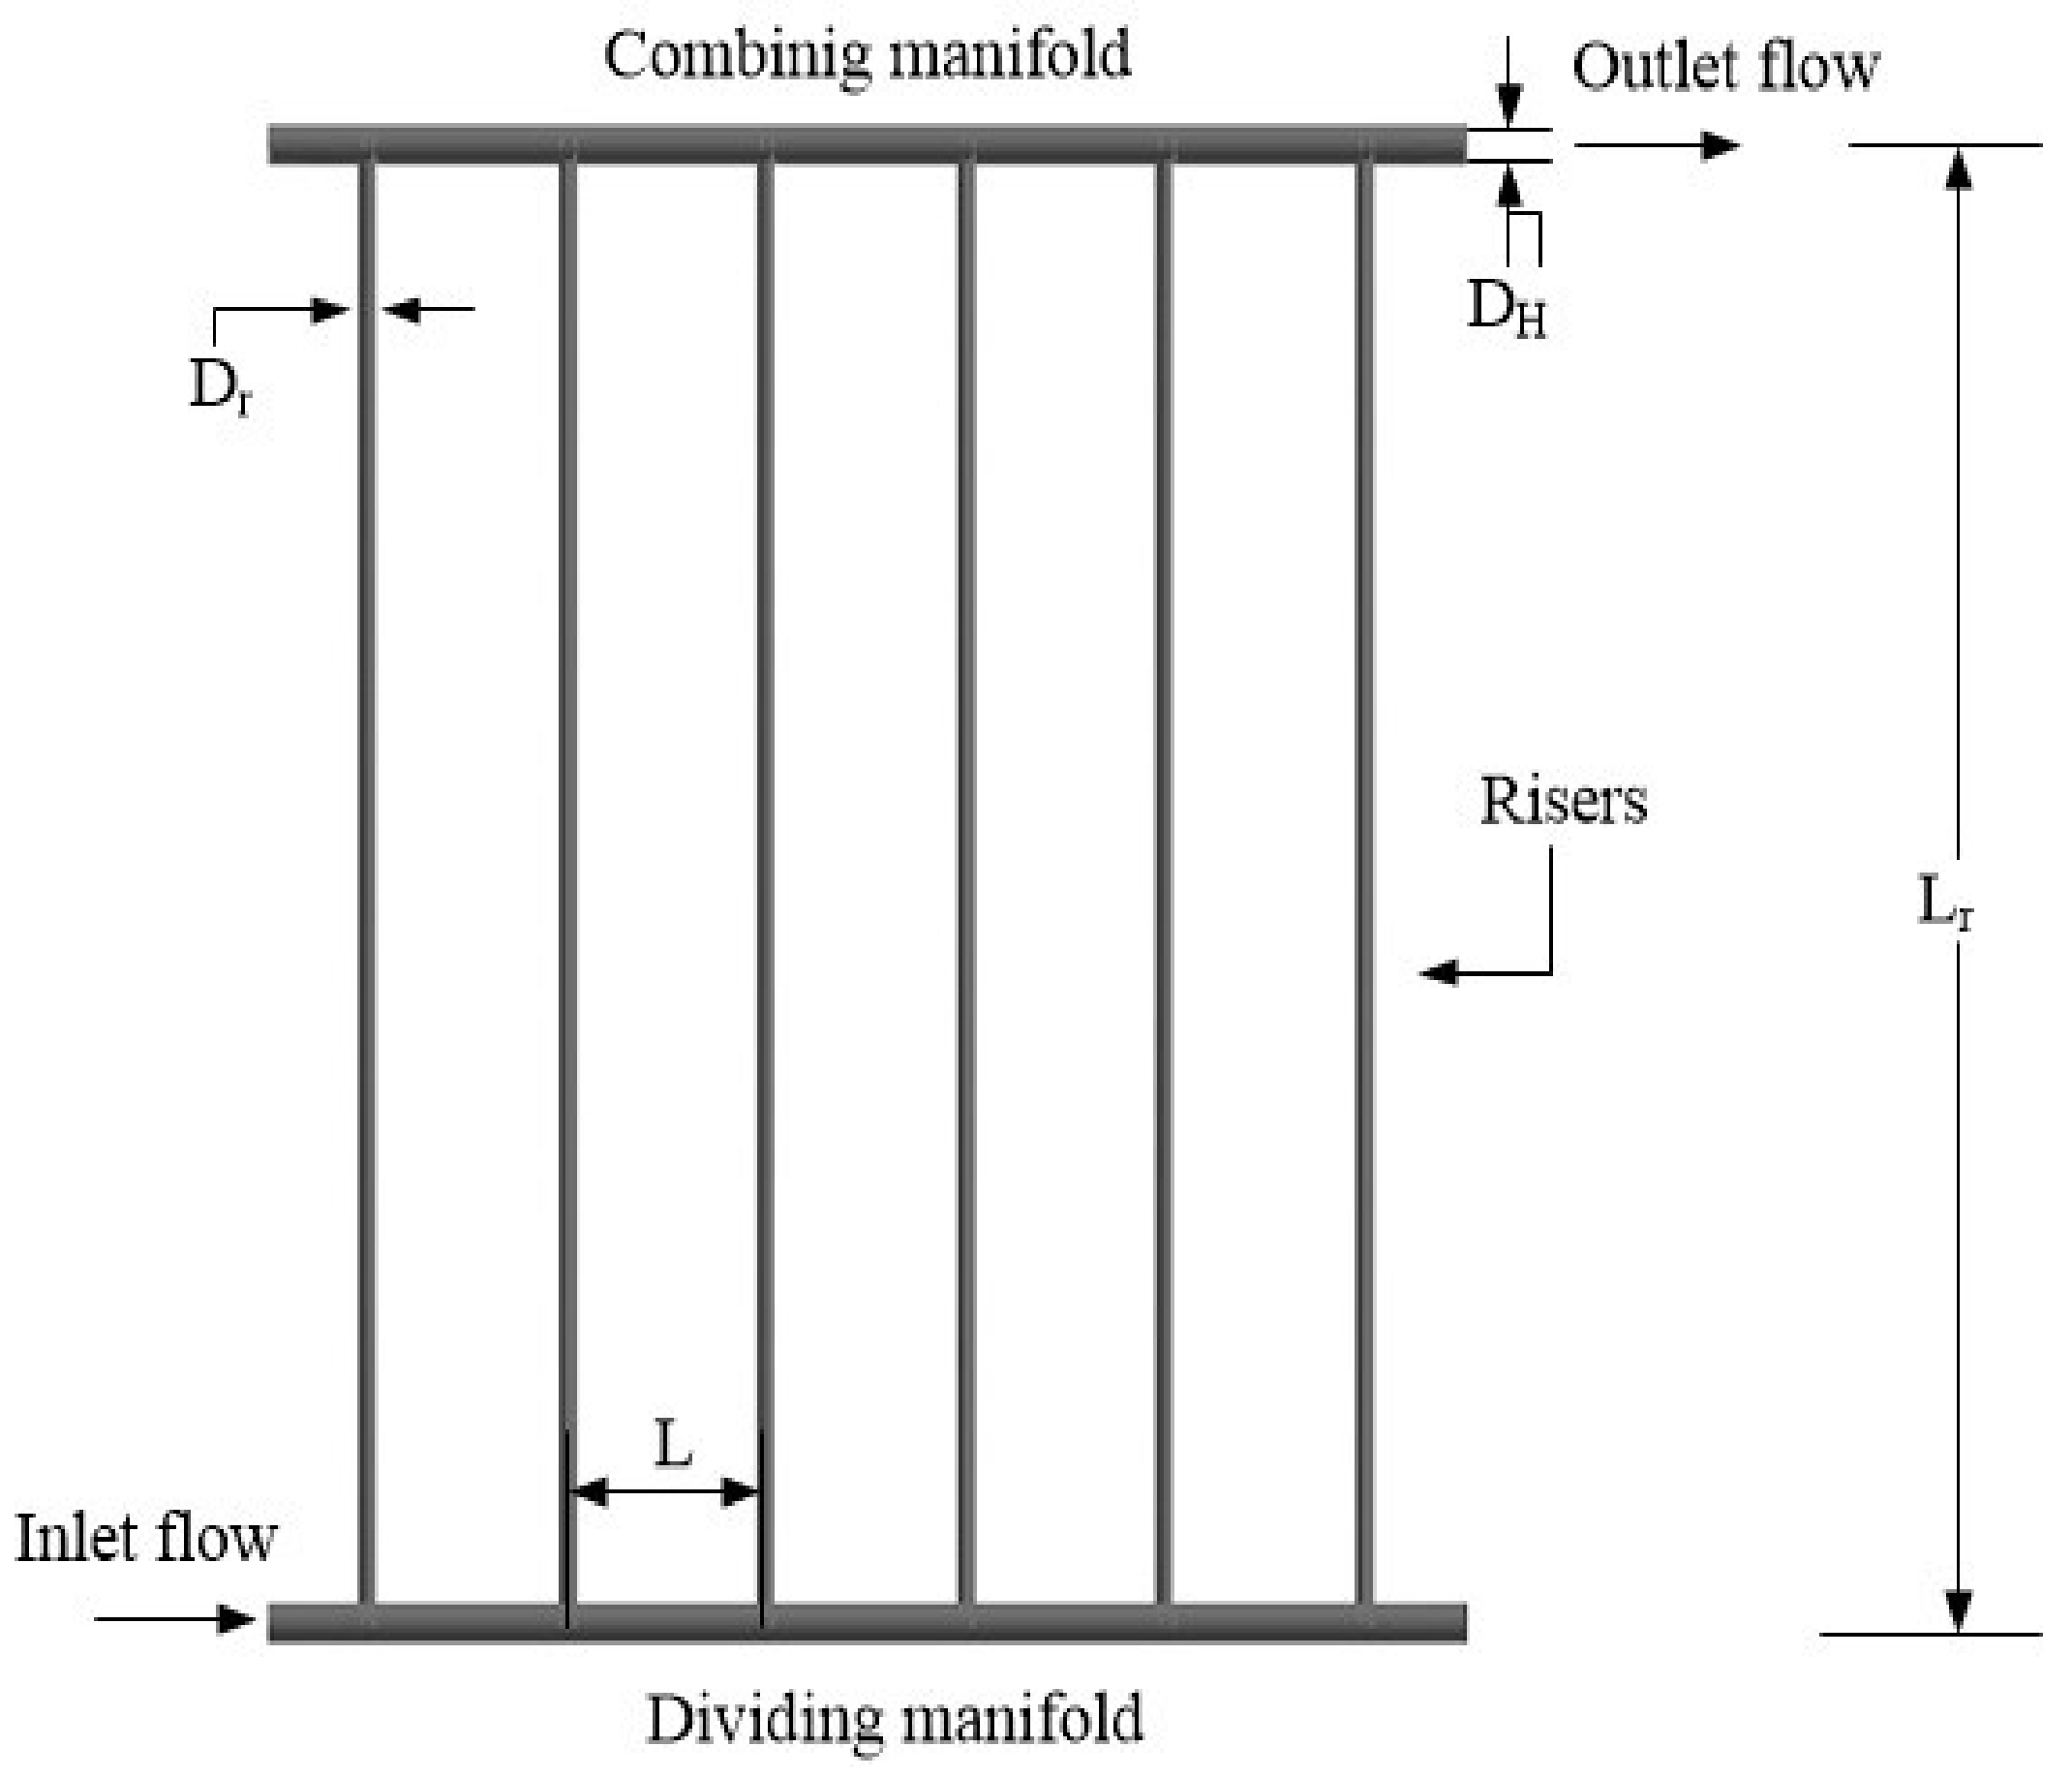
Other works have demonstrated that the flow non-uniformity depends significantly on the collector configuration, either Z type or U type (
Figure 1). Jones and Lior [
15] performed an analysis for a collector with a Z type configuration (
Figure 1b). The results were compared with experimental data demonstrating that for this configuration a larger amount of flow is present in the last riser tubes. However, Datta and Majumbdar [
16] showed that for a U type configuration (
Figure 1a) the larger amount of flow is present in the first riser tubes. This behavior is attributed to pressure distribution through the manifolds; in the Z type, pressure increases along the dividing manifold and decreases along the combining manifold, which produce lower pressure drop in the risers close to the inlet, and higher pressure drop in the risers close to outlet. In the U type, pressure increases along both, combining and dividing manifolds, but is much more pronounced in the combining manifold, which produces a higher pressure drop in the risers close to the inlet compared with the risers close to the outlet [
15].
Villar et al. [
17], similarly to Chiou [
5], analyzed the efficiency deterioration factor in a solar collector with a Z type configuration by means of Equation (1). In order to reduce the complexity of the proposed model, a flow distribution based on the results obtained by Jones and Lior [
15] was considered. The results show a non-uniform temperature distribution in each riser tube and a decline in its efficiency.
A similar assumption has been implemented by Cruz-Peragon et al. [
18] in order to simplify the development of a model for the complete characterization of a solar collector. In their work, experimental data were needed with the aim of increasing the accuracy of the developed model which can be used to optimize the geometry in a flat plate solar collector.
The flow distribution assumption implies obtaining errors in temperature distributions and hence in the thermal efficiency of the system. Therefore, the development of a model with good accuracy for the prediction of the flow distribution is necessary for a complete characterization of a solar collector.
1.1. Models for the Prediction of Flow Distribution
Several models have been developed for the analysis of flow distribution in manifolds. Some models have been focused on fuel cells and microchannels with U and Z type configurations (
Figure 1), however, they can also be applied to determine the flow behavior in a flat plate solar collector.
Wang [
19] indicated that there exist three approximations for the study of the pressure drop and flow distribution in manifolds: analytical models, discrete models and models based on computational fluid dynamics (CFD).
In the analytical models, also called continuum models, the manifold is considered as a constant cross-section area pipe consisting of several outlets located along the manifold, which emulate the riser tubes. It has been demonstrated that the continuous models are limited cases of the discrete models [
20,
21,
22].
Majumdar [
23] presented an analytical solution for a distribution manifold and a combination manifold for the case of an ideal frictionless fluid. Wang et al. [
20] obtained an equation for determining the coefficients of pressure recovery in the distribution and combination manifolds based on the solution of the continuity and momentum equations; whereas Maharudrayya et al. [
24] obtained an analytical model for the flow distribution in fuel cells in which the inertial effects were neglected due to the assumption of laminar flow. Wang [
21,
22] developed a mathematical relation to determine the flow distribution in manifolds in U and Z configurations for fuel cells where the inertial effects were considered. Later on, Wang [
25] developed a model for determining the flow distribution in reactors in which the manifold was of variable cross-section area. However, these models are based on the assumption of constant friction coefficient, constant pressure recovery and losses coefficients due to turning flow, with the aim of simplifying the governing equations and thus obtaining an analytical solution.
The discrete models are also called network models in which the manifold can be represented as a network of several sections through which a fluid flows. The mass and momentum governing equations are defined for each section, which are solved by means of an iterative method. Acrivos et al. [
26] performed the first analysis to determine, by means of a discrete model, that pressure increments can be obtained along the manifold in the regions where the flow is deviated toward the riser tubes. Jones and Lior [
15] included a parameter of pressure recovery coefficient to take into account those pressure increments in the momentum conservation equations, while Wang and Wang [
27] developed a discrete model for several fuel cell configurations in which the variation of the momentum and friction coefficients have been considered; Liu et al. [
28] developed a discrete model for flow distribution in heated parallel pipes (Z-type and U-type) under both supercritical and subcritical pressure conditions with good results for two phase flow. Some authors like Weitbrecht et al. [
29] analyzed a collector as a pipe network system in which the loss coefficients have been taken from experimental data to adjust the developed model. Ríos Orozco et al. [
30] developed a model based on pipe networks which was compared with a CFD model showing a considerable difference between them which is due to the fact that the discrete model employs an integral formulation to determine the flow distribution.
The CFD models are based on the solution of the fluid flow governing equations for infinitesimal volumes, thus, it is not needed to know the friction coefficient or pressure recovery coefficient as in the previously mentioned models. Facão [
31] has demonstrated that the solution by means of CFD presents good results to determine the flow distribution through a Z configuration flat plate collector under laminar flow conditions, whereas Huang and Wang [
32] presented a very good agreement with experimental data shown by Wang et al. [
33] when a CFD model is used for a compact heat exchanger with a Z type configuration under turbulent flow conditions. Further, Cerón et al. [
34] have shown that there exists a good agreement between the results obtained by means of CFD simulations with experimental data on the thermal efficiency of a flat plate solar collector. Therefore, the use of CFD is a more appropriate technique to obtain the hydraulic and/or thermal behavior of a flat plate solar collector.
Table 1 shows the three types of models and their main features.
1.2. Strategies to Reduce the Flow Non-Uniformity
The analysis of strategies to obtain a uniform flow distribution has mainly focused on micro- channel heat sinks. Kim et al. [
35] presented a two-dimensional CFD numerical model to determine the effect of the manifold shape on the flow distribution in liquid cooling modules with a Z distribution type for electronic applications. Three different Reynolds numbers and three different lengthwise shapes were analyzed (trapezoidal, triangular and square). The results showed that the triangular and trapezoidal manifolds reduce significantly the mal distribution effect. Tonomura et al. [
36] performed a three-dimensional analysis by means of CFD to obtain the flow distribution in plate-fin micro devices for heat exchange. The results show that the flow uniformity strongly depends on the manifold shape, channels length and the mass flow rate at the inlet of the device. Griffini and Gavriilidis [
37] made a comparison between the 2D and 3D models for a Z distribution type showing that 2D simulations overestimate the mal distribution, thus a more accurate distribution is obtained with 3D simulations.
In spite of the high accuracy of the CFD models, compared with others, some authors have developed analytical and discrete models to determine the qualitative behavior of the flow distribution for new configurations of the manifolds. Pan et al. demonstrated with several analyses based on discrete models of electrical resistances, that the distribution in microchannels becomes more uniform when: (i) the collectors have symmetrical configurations [
38]; (ii) the microchannel width is increased [
39]; (iii) the ratio of the length of the dividing manifold to the length of the combining manifold increases; as well as the ratio of the width of the dividing manifold to the width of the combining manifold increases [
40]; (iv) the ratio of the radius of the inflow port of the manifold to the radius of the outflow port of the manifold increases [
40]. Furthermore, the optimization of an analytical model that describes the flow distribution in microchannels with complex configurations was performed, concluding that a manifold with a right triangle shape presents a more uniform distribution than a manifold with an obtuse triangle shape when operating under the same conditions [
41]. However, these results were not verified experimentally. A similar methodology was developed by Solovitz and Mainka [
42] for the optimization of the design of multi-segmented geometries for the uniform flow distribution, concluding that the multi-segmented geometry is very similar to a trapezoidal manifold. However, this analysis was only performed in the laminar flow regime.
Mohammadi et al. [
43] analyzed the flow distribution in microchannels with manifolds with the shape of right triangles (variable area) by means of a three-dimensional CFD model. It was shown that the angle made by the variable area in the triangular manifold is a very important parameter for the uniform distribution and it strongly depends on the minimum area along the manifold in order to obtain a high uniformity level.
A variable area analysis for a flat plate solar collector was performed by Uzarraga-Rodriguez et al. [
44]. The results showed that an increase on the ratio of the inlet and outlet area of the solar collector contributes on obtaining a uniform distribution through the riser tubes, slightly decreasing the pressure drop. Missirlis et al. [
45] analyzed the heat transfer in a polymer solar collector for different manifold configurations using CFD. Several configurations of the position of the inlet and outlet tubes were studied with the aim of achieving a better flow distribution and therefore a higher efficiency.
Facão [
31] developed an optimization of the flow distribution by using a model based on correlations for an isothermal solar collector. Through a CFD analysis it was shown that the dimensions of the manifold at the outlet must be larger than at the inlet. The developed numerical model was validated with experimental results presented in the same work.
Yang et al. [
46] analyzed the effect of rectangular exit ports in a dividing manifold. In that work, simulations in CFD were performed for several aspect ratio values (port width to port length), AR, where high values of AR produce worse non-uniformity flow distribution, and a value of 0.25 is the recommended to apply in practice. However, neither verification nor validation of the CFD model was done.
The different strategies described above, shown in
Table 2, are based on a considerable modification on the geometry of the entrance and outlet manifolds of the distribution system for solar collectors and similar systems. In this work a numerical analysis of the flow distribution through the riser tubes of a solar collector with distribution plates inside the manifolds (distribution and combination) was performed by means of CFD. The study was proposed as a practical way of improving the mal distribution inside the riser tubes for a flat plate solar collector without the need of making a considerable change in their geometry.
2. Numerical Modeling
2.1. Governing Equations
In this section are described the governing equations, the mesh generation and prescribed boundary conditions to obtain a 3D numerical solution of the flow distribution in an isothermal flat plate solar collector by using the commercial software FLUENT®.
The governing equations applied to the computational model include the Reynolds Averaged Navier-Stokes (RANS) equations and the standard κ-ε turbulence model. The following assumptions are considered in the model:
The RANS equations for incompressible flow are:
The term
is the effective stress tensor which is expressed as:
The aforementioned equations must be coupled introducing the Reynolds stress tensor,
by means of a turbulence model. This term is modeled using the mean velocity and the turbulent eddy viscosity [
39], expressed as:
where
is the turbulent viscosity obtained by combining the turbulent kinetic energy
and the dissipation rate
:
The transport equations considered for the turbulent quantities of the standard
κ-
ε model [
47] are described by Equations (7) and (8):
The semi-empirical κ-ε turbulence model is based on Boussinesq approximation which is described by Equation (5). This assumption implies that once the turbulent kinetic energy is generated in the low wave number range of the spectrum, it is dissipated in the high wave number range of the spectrum. The appropriate election of a turbulent model is important for the accuracy of the solution and the usage of computational resources. For this case the standard model has been chosen because it has provided good results when compared with experimental data, besides this model presents a low usage of computational resources when compared with other turbulence models.
Equations (9) and (10) describe the energy equation used for fluid and solid regions, respectively:
where
E is the total energy,
h is the sensible enthalpy,
P is the pressure,
k is the thermal conductivity,
keff is the effective thermal conductivity calculated from Equation (11):
here the Prandtl number, Pr
t, is 0.85 and
Cp is the specific heat.
2.2. Mesh Generation
The domain was meshed using the commercial software Gambit
® (Fluent Inc. Lebanon, NH, USA).
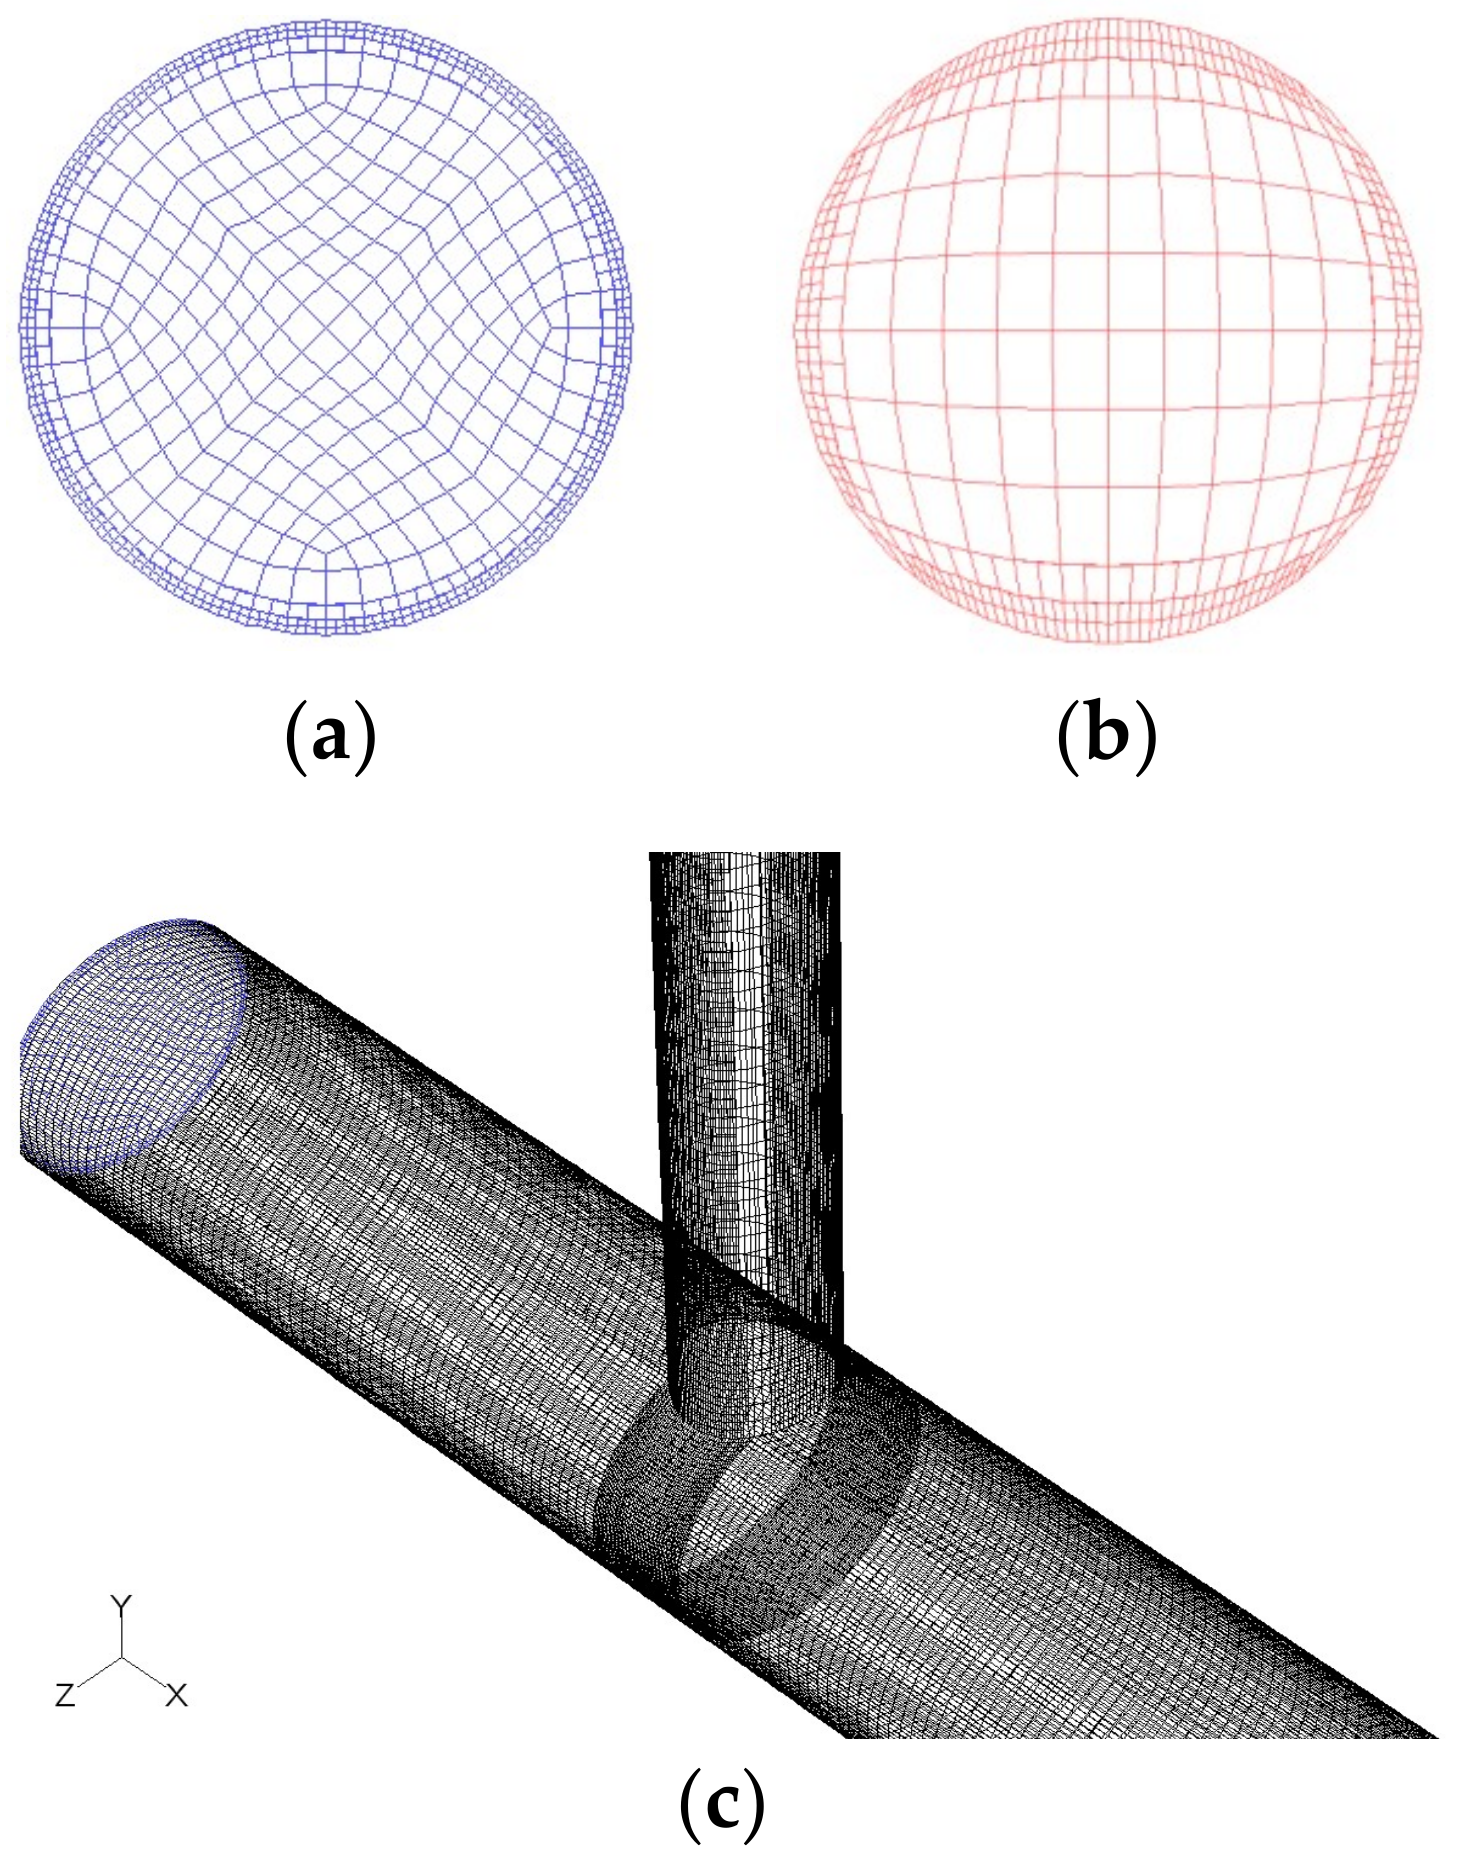
Figure 2 shows the mesh used in the solar collector which is structured with a combination of two types of cells mainly (hexahedral and prismatic elements) for all the analyzed configurations. The mesh was generated in such a way that near the walls of the solar collector and at the intersections between the manifolds and riser tubes, a high mesh density was used. This allows a better prediction of the high velocity and pressure gradients present at the walls.
2.3. Baseline Case
The analysis of a flat plate solar collector BTS-186, manufactured by Butesca was performed. This solar collector is made using copper pipe and it has two manifolds joined by six riser tubes. The analyzed distribution type in this case is Z configuration.
Figure 3 shows a drawing of the previously described solar collector. The prescribed boundary conditions are shown in
Table 3.
The turbulent intensity,
, has been obtained from the following empirical relation [
48]:
Water properties shown in
Table 4 were calculated based on the steady state operating temperature (approximately 70 °C) at standard pressure.
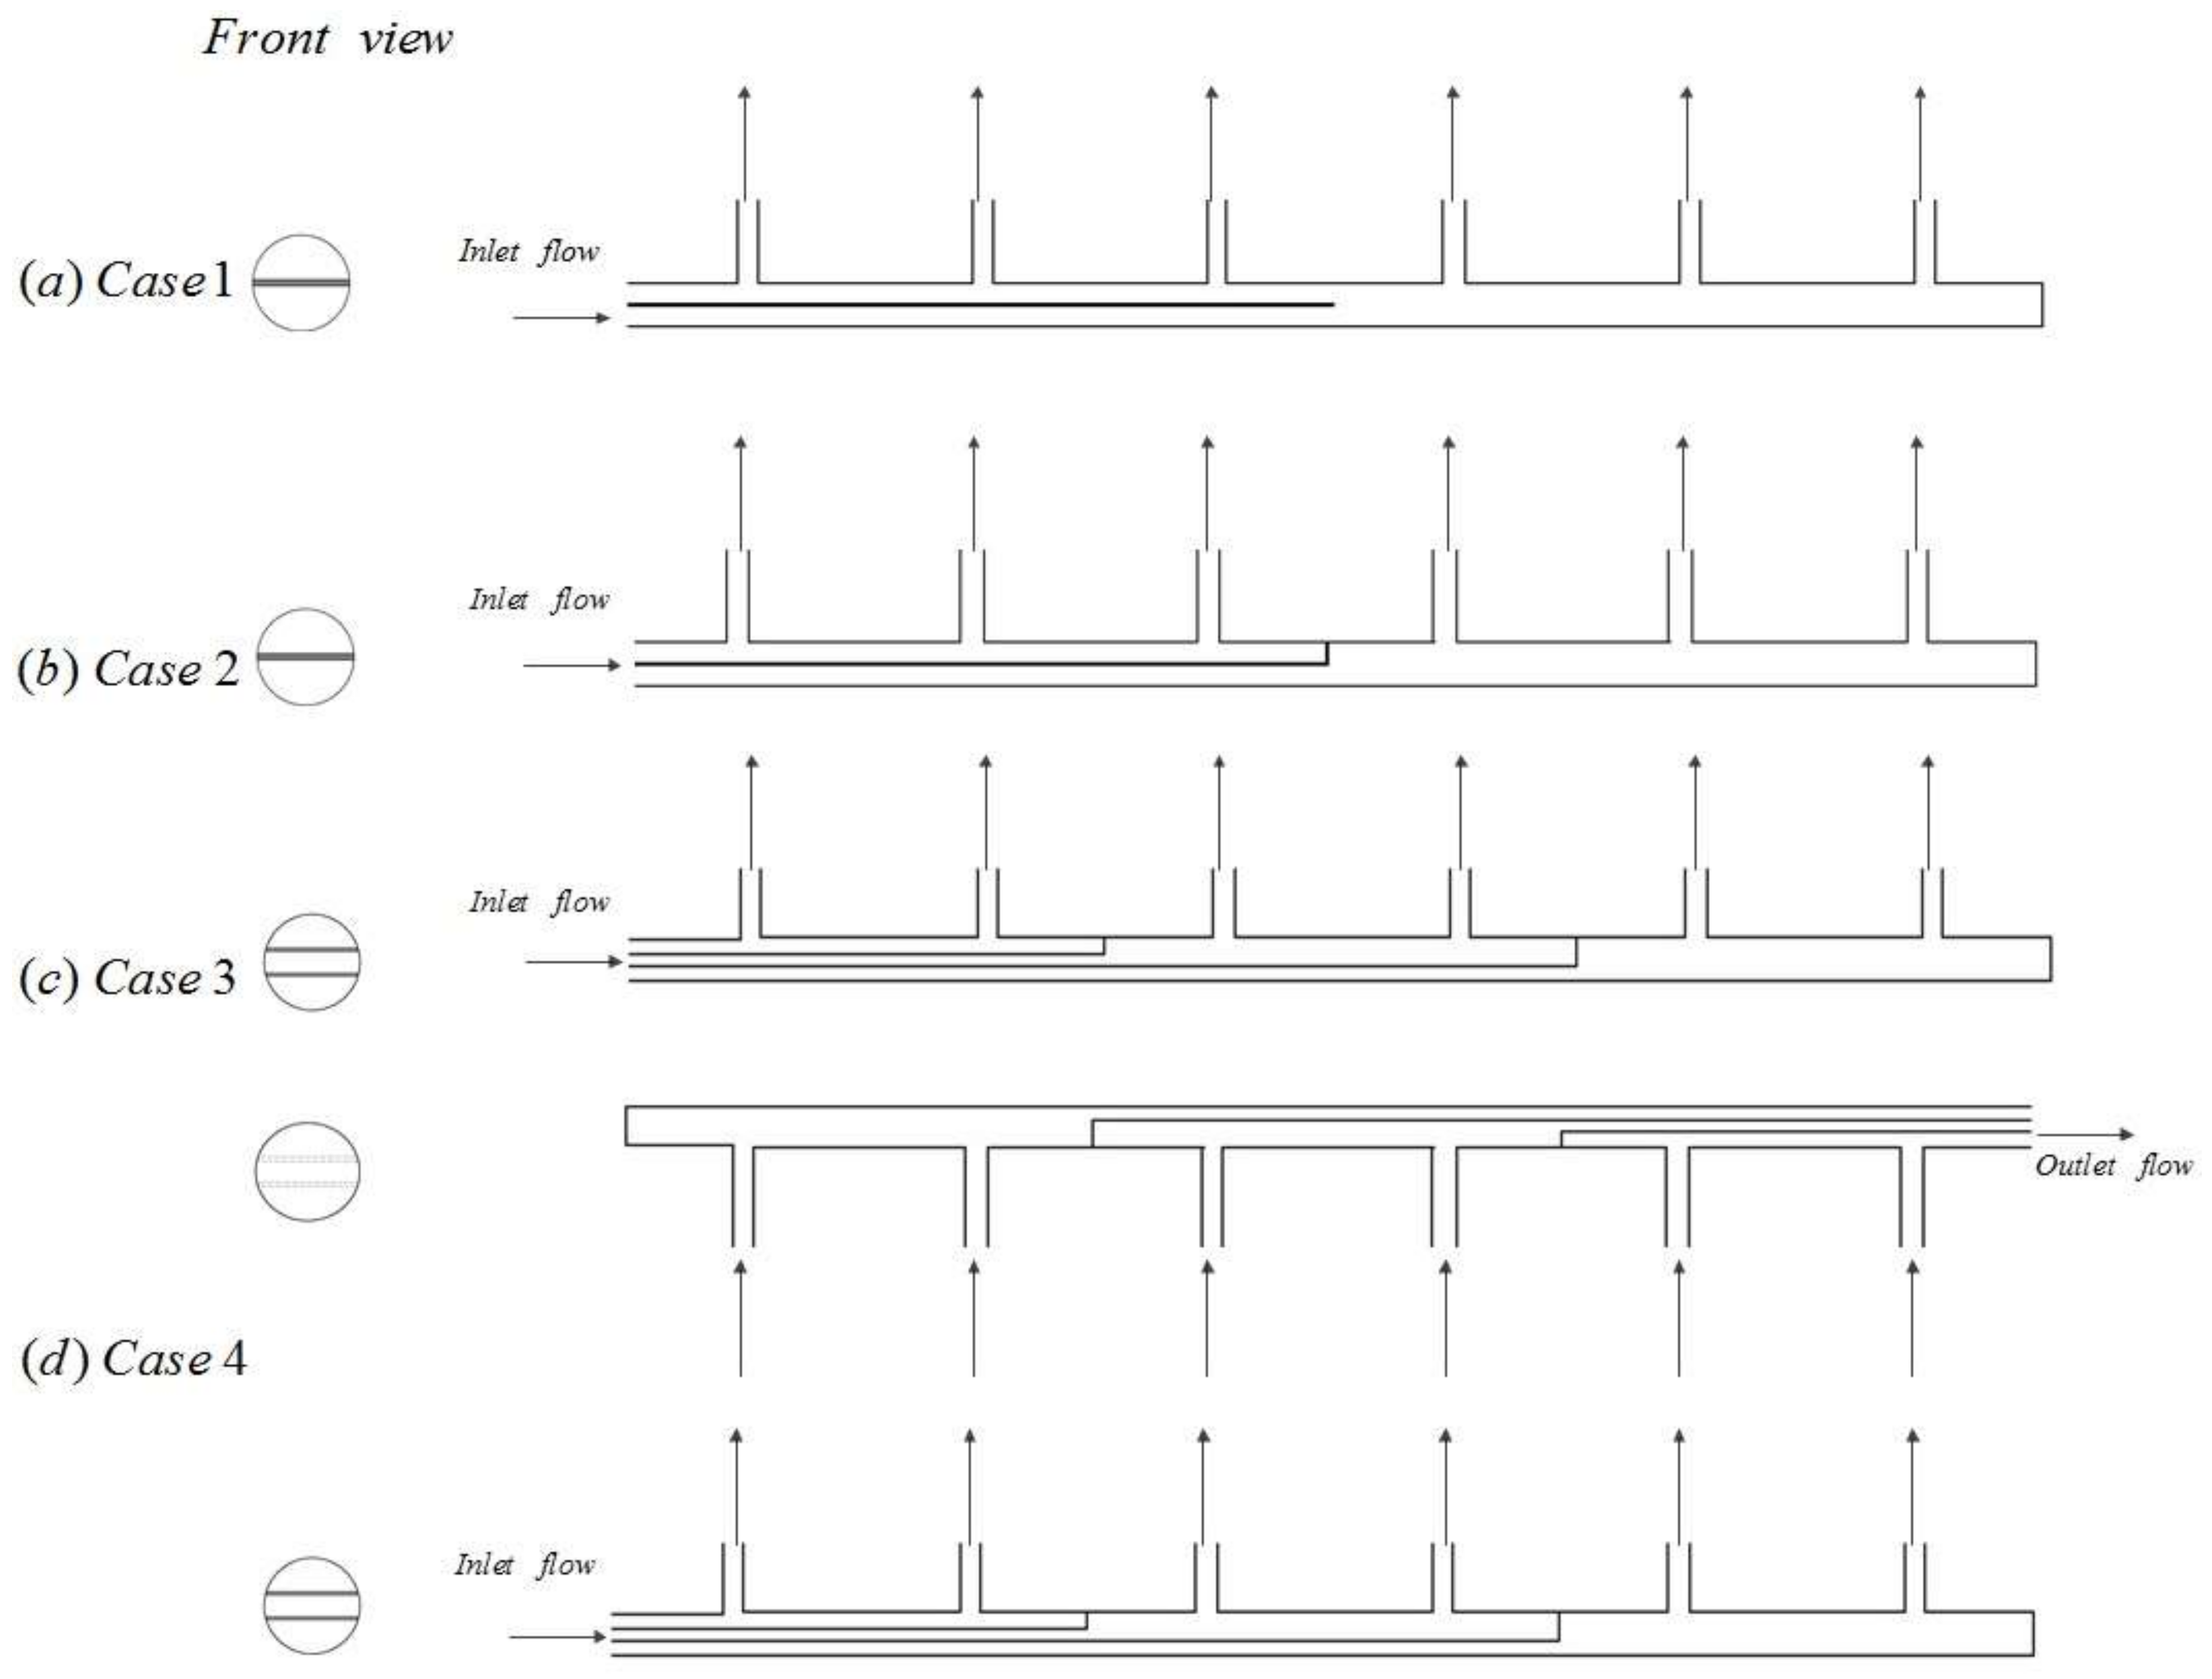
Four study cases are analyzed in the present work, which are shown in
Figure 4. Case 1 consists in placing a thin plate along the distribution header with a length equal to one half of the total manifold length. Case 2 is similar to case 1 but with a cap located at the end of the thin plate to guaranty that half of the inlet mass flow rate flows through the first three riser tubes. Case 3 consists in using two distribution plates. The length of the plates is one third and two thirds of the total length of the distribution manifold. There is a cap at the end of each thin plate to guaranty the distribution of the total mass flow rate in three approximately equal parts that will flow through the riser tubes. Case 4 is similar to Case 3 but differing in the fact that the same number of plates has been placed in the combination header.
All the cases are compared with a normal flat plate solar collector, called Case 0 or baseline case. It is important to point out that all the study cases (five in total) consist of the same geometrical characteristics of the flat plate collector, except the shape, number and length of thin distribution plates placed in one or both manifolds. Since all the study cases are subjected to the same operating conditions thus; a good comparison on the effect of the distribution plates on the flow distribution and system pressure drop can be performed. It is important to point out that the plates are placed in such a way that they divide the manifold cross section evenly.
3. Results
The aim of this work consists on improving the flow distribution by using division plates in the manifolds of a flat plate solar collector in order to increase the thermal efficiency. For this analysis, the system consists of a flat plate solar collector with six riser tubes with an internal diameter
Dr of 0.0135 m and a length
Lr of 2 m; separated by a distance
L of 0.1515 m and connected to two manifolds of constant cross section area with an internal diameter
DH of 0.0265 m (see
Figure 4).
3.1. Grid Independence Analysis
A grid independence analysis has been performed to determine the acceptable grid size for the different numerical simulations carried out in this work. A large amount of elements have been gathered near to the manifolds and riser walls, as well as in the manifold and riser junctions. In
Table 5, the number of elements used in each refinement level for Case 0 with a volumetric flow rate of 2 L/min is shown.
The SIMPLE algorithm was used for coupling velocity and pressure in the computational model. The PRESTO scheme was used for pressure, whereas a second order scheme was used for turbulent and momentum quantities in the numerical simulations. The convergence criteria of 10−5 were established for continuity and RANS equations, whereas for turbulence equations the criteria were lower than 10−4.
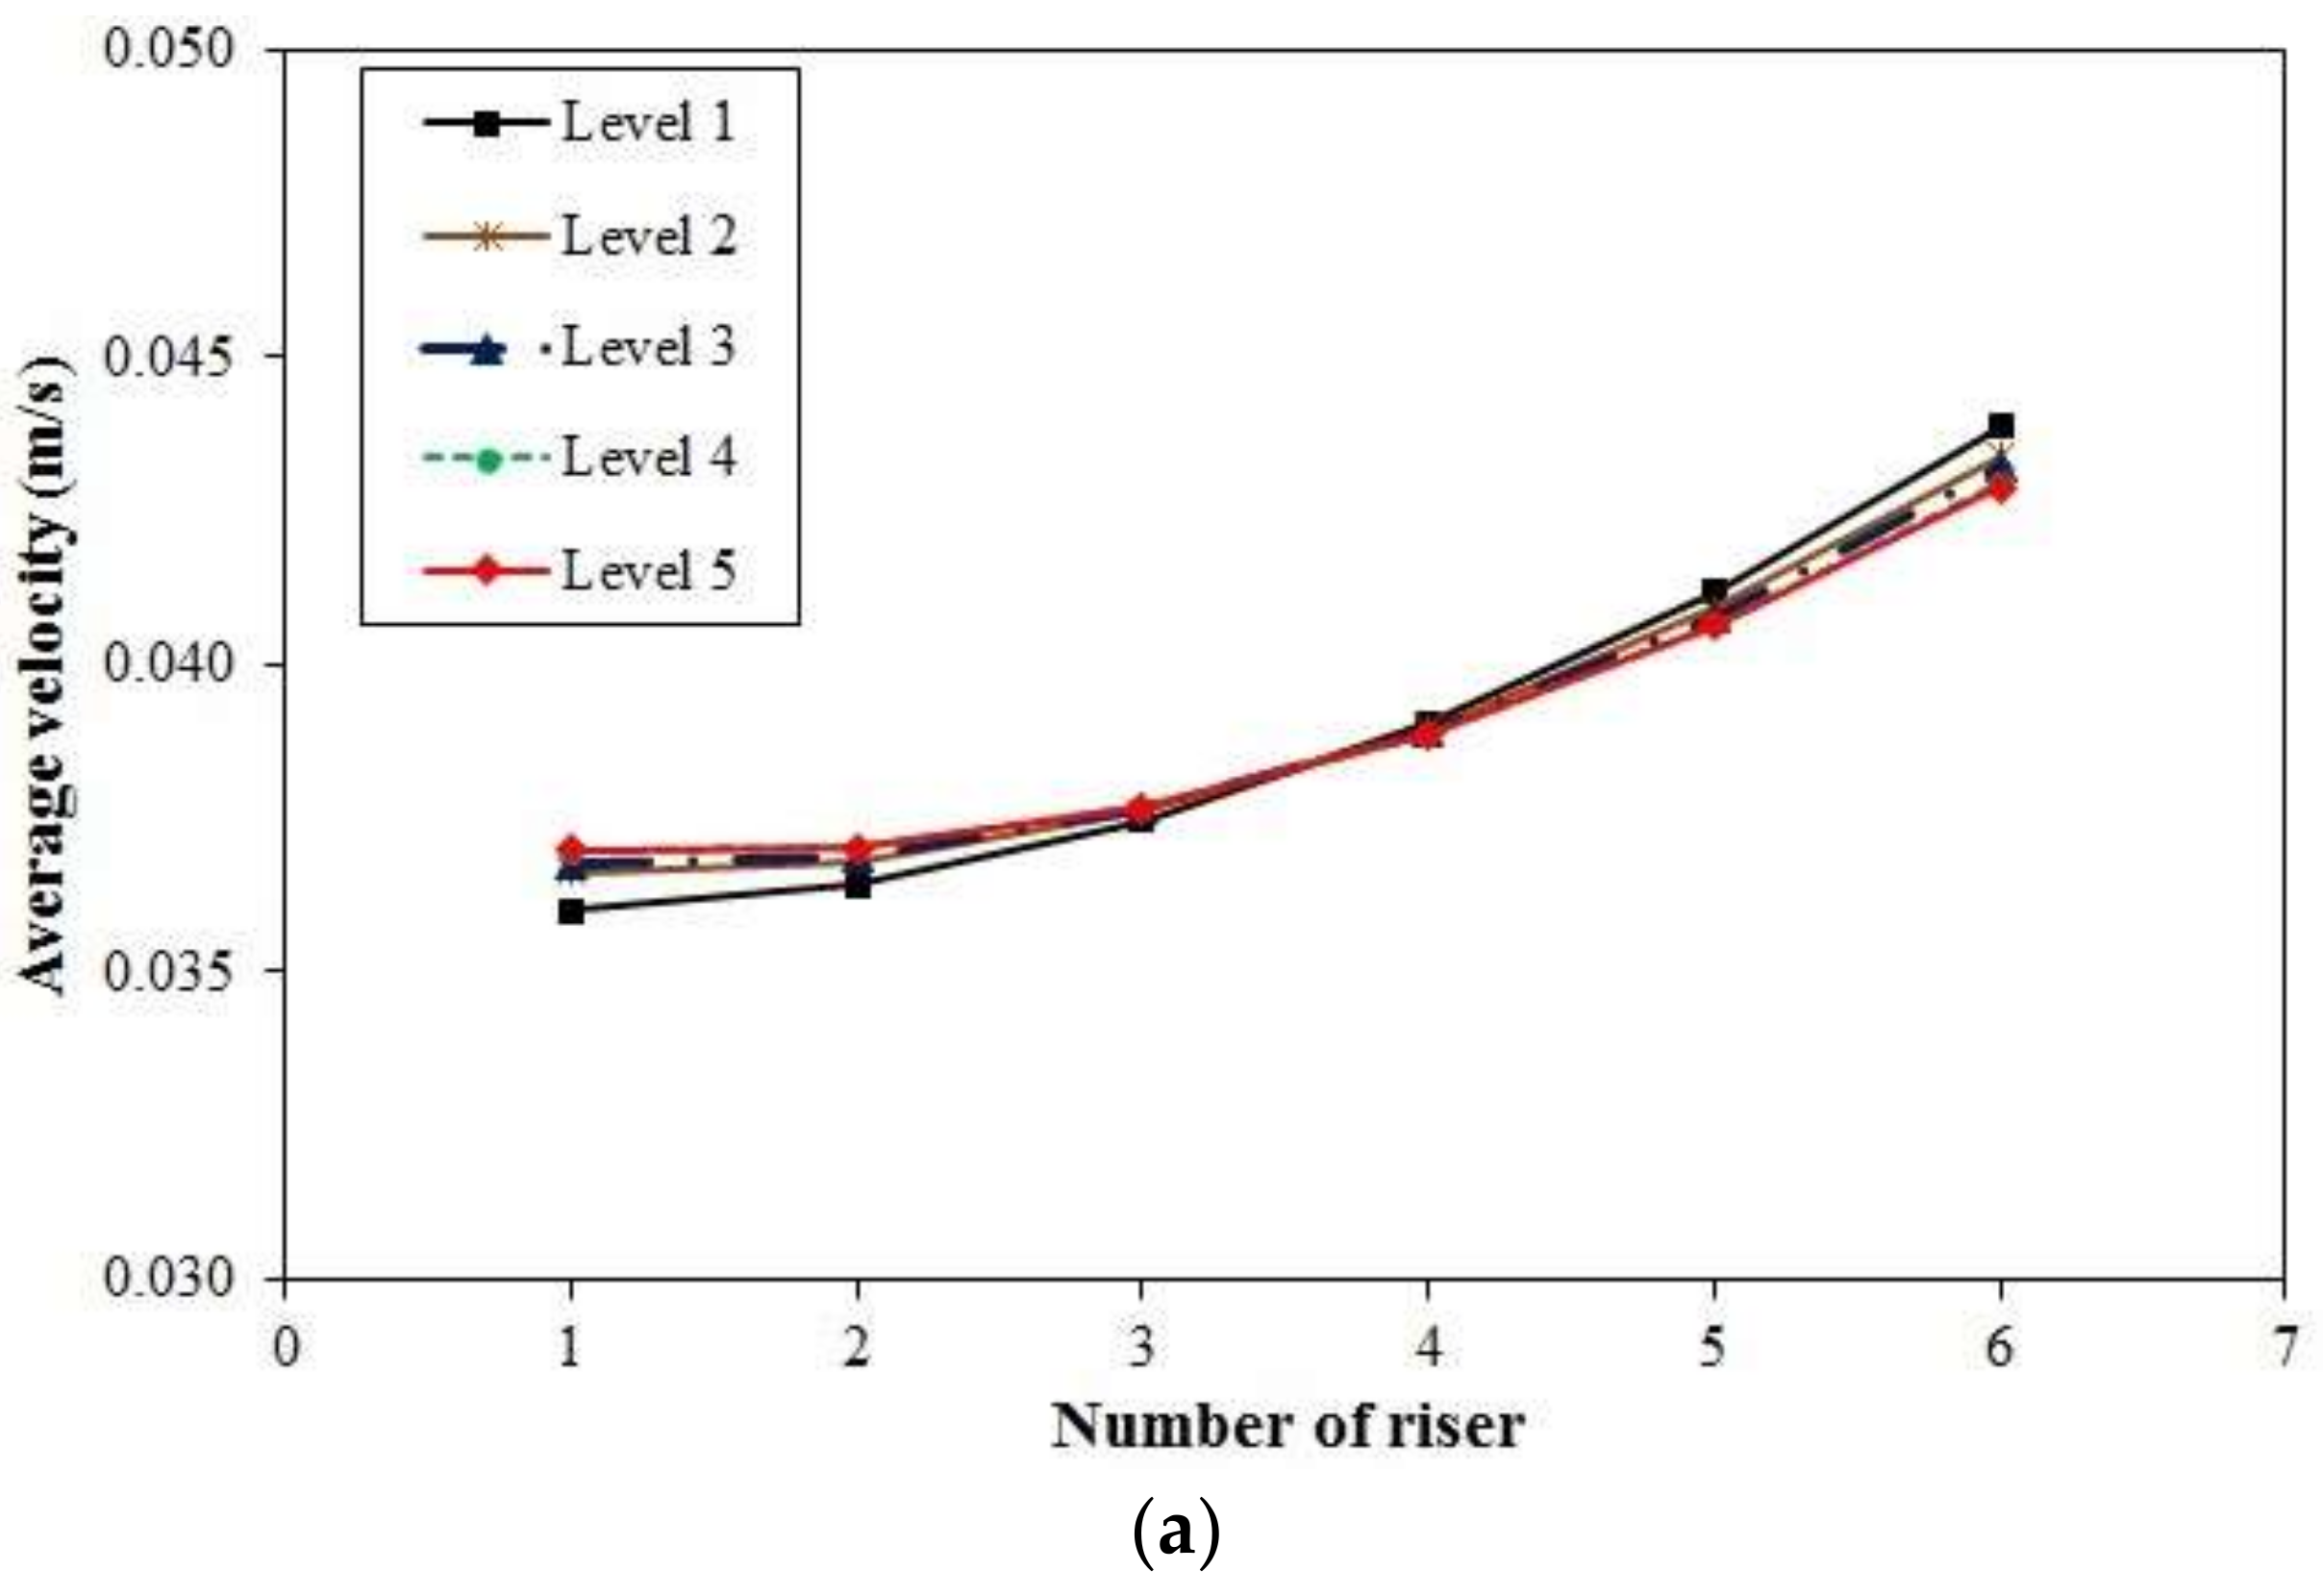
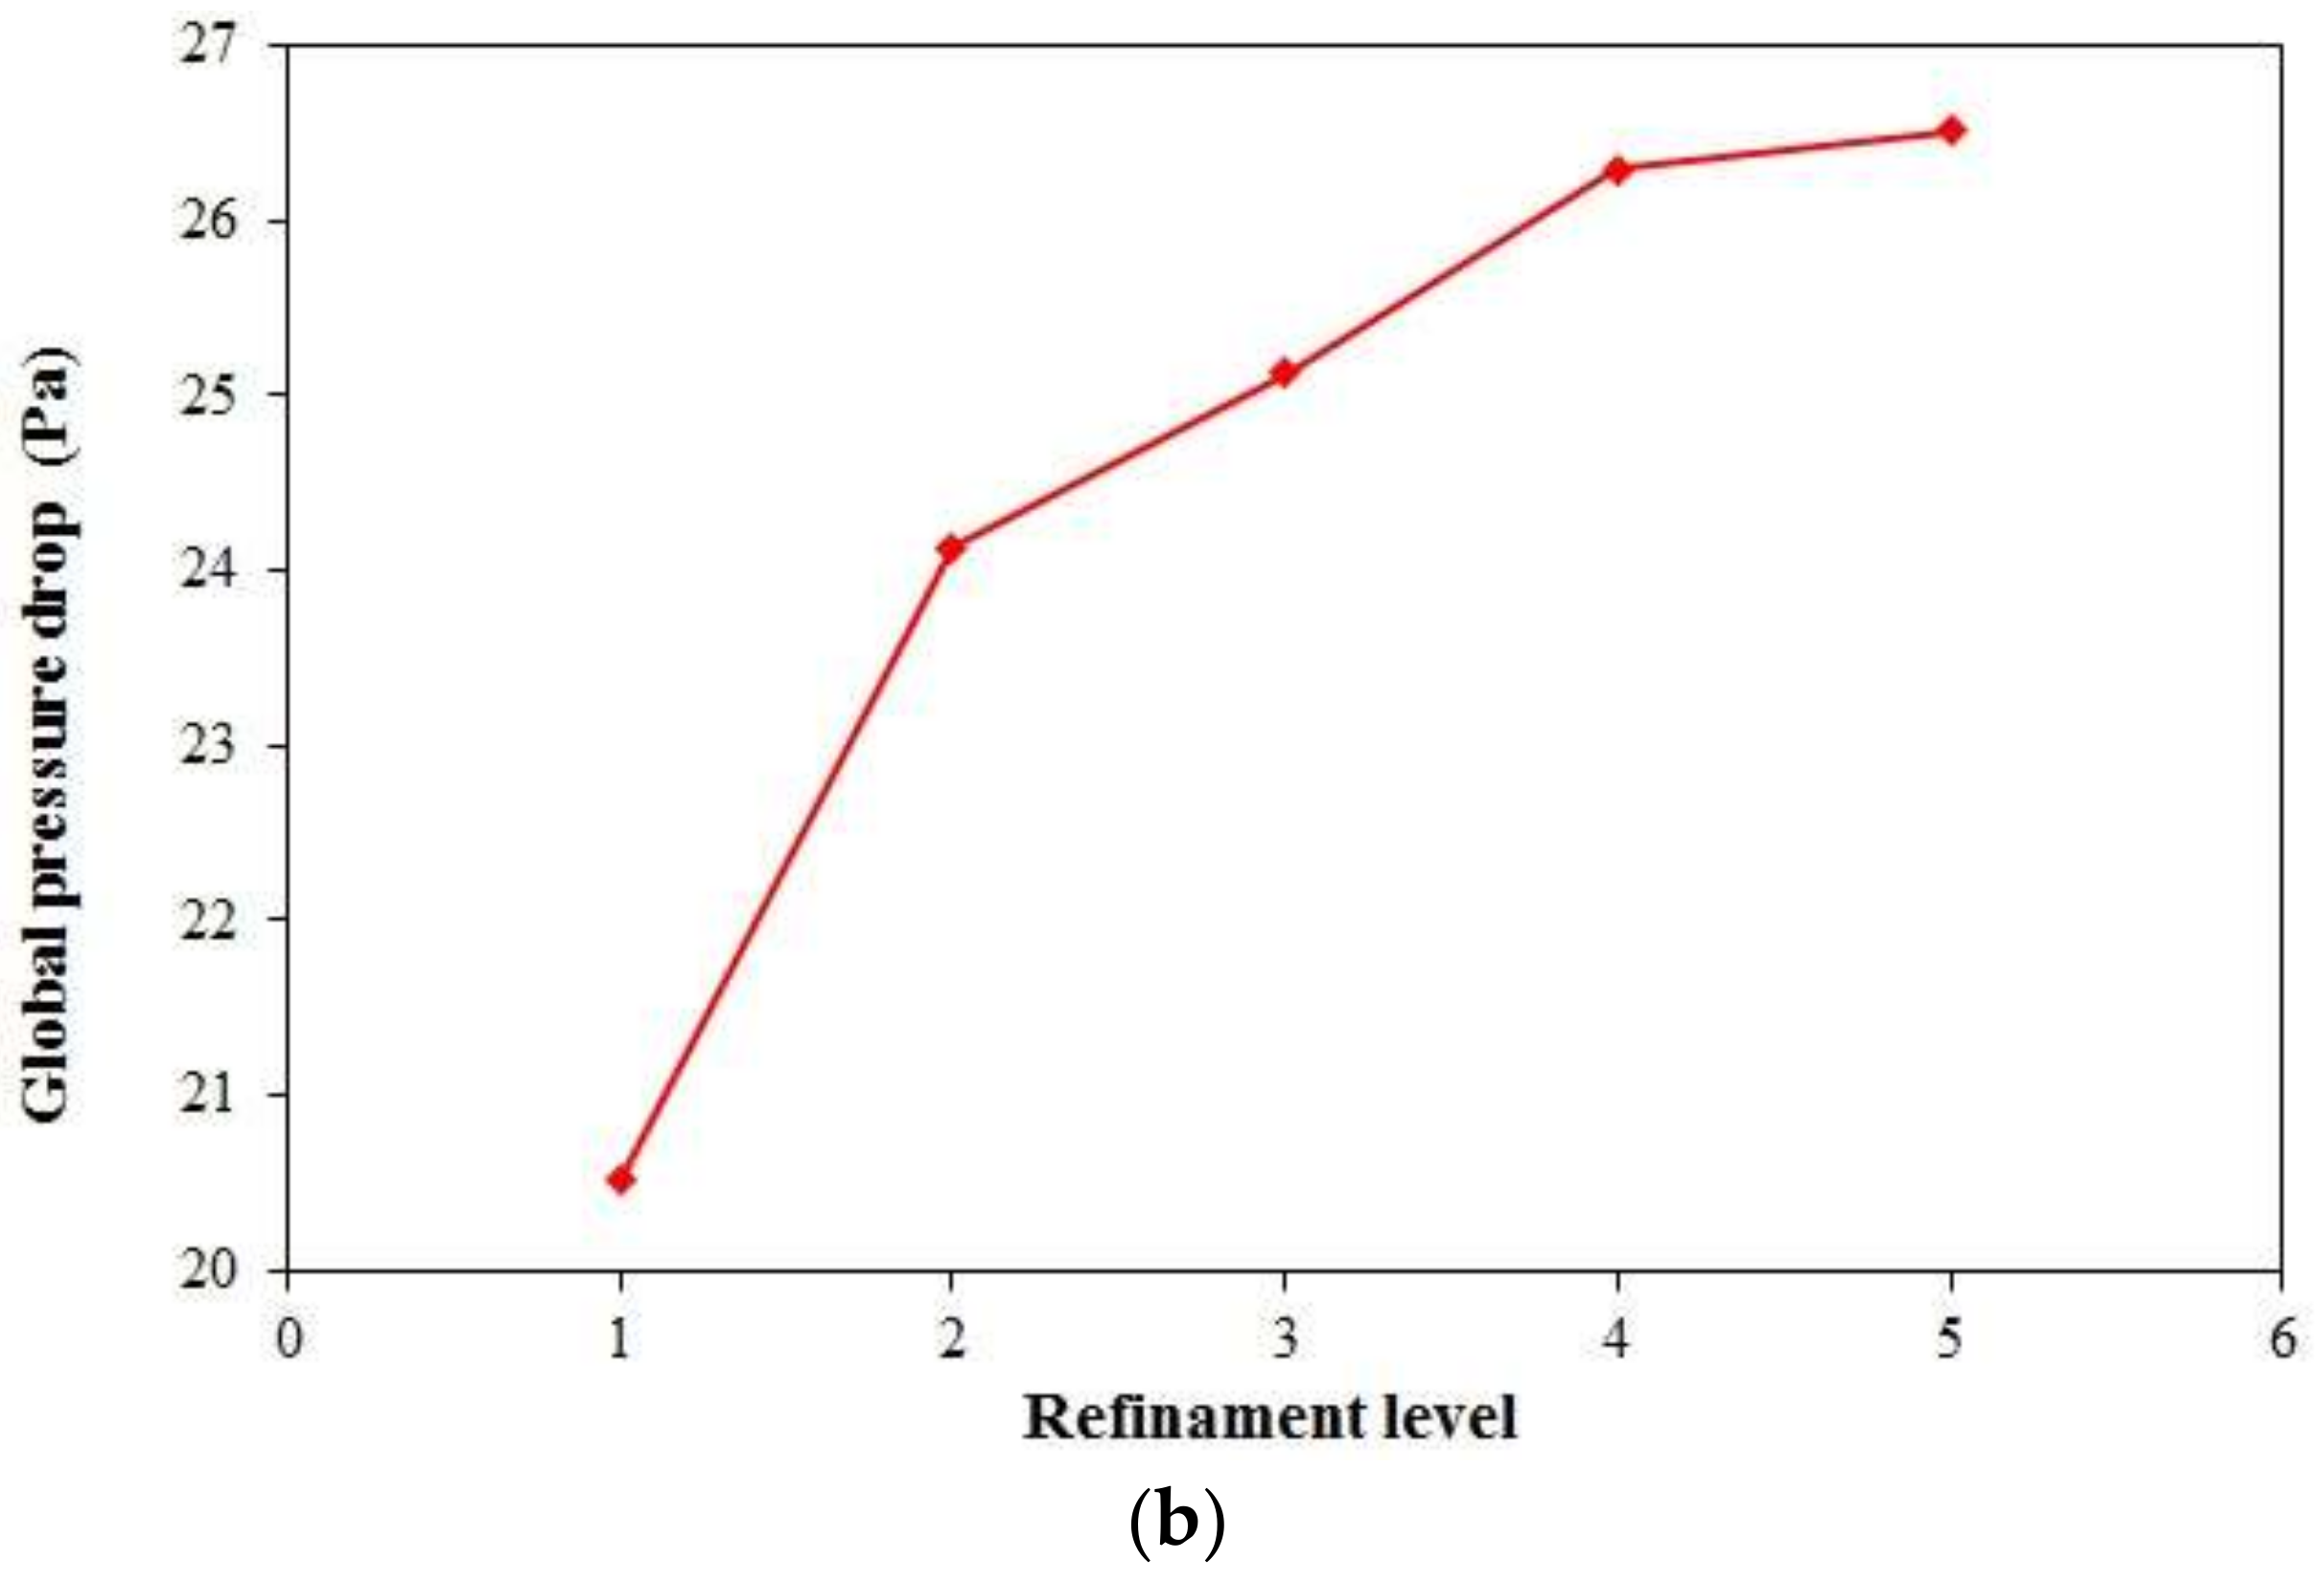
Figure 5a,b shows the average velocity in each riser tube and the global pressure drop, respectively, as a function of the refinement level for Case 0 (without division plates) with a volumetric flow rate of 2 L/min. It can be noticed that the flow distribution is almost independent of the mesh refinement level, whereas the global pressure drop is independent of the grid density with a mesh consisting of 2,537,036 elements. The global pressure drop difference between the refinement level 4 and 5 is approximately 0.82%, reason for which the mesh with a refinement level of 4 is used in this study.
3.2. Validation of the Numerical Solution
The accuracy of the numerical solution in obtaining the flow field using the commercial CFD software FLUENT® is important in order to analyze the different cases considered in this work. Therefore, a comparison with experimental data is needed to demonstrate the accuracy of the numerical solution. Two analyses have been performed in this study, the first one in the laminar flow regime and the second in the turbulent flow regime.
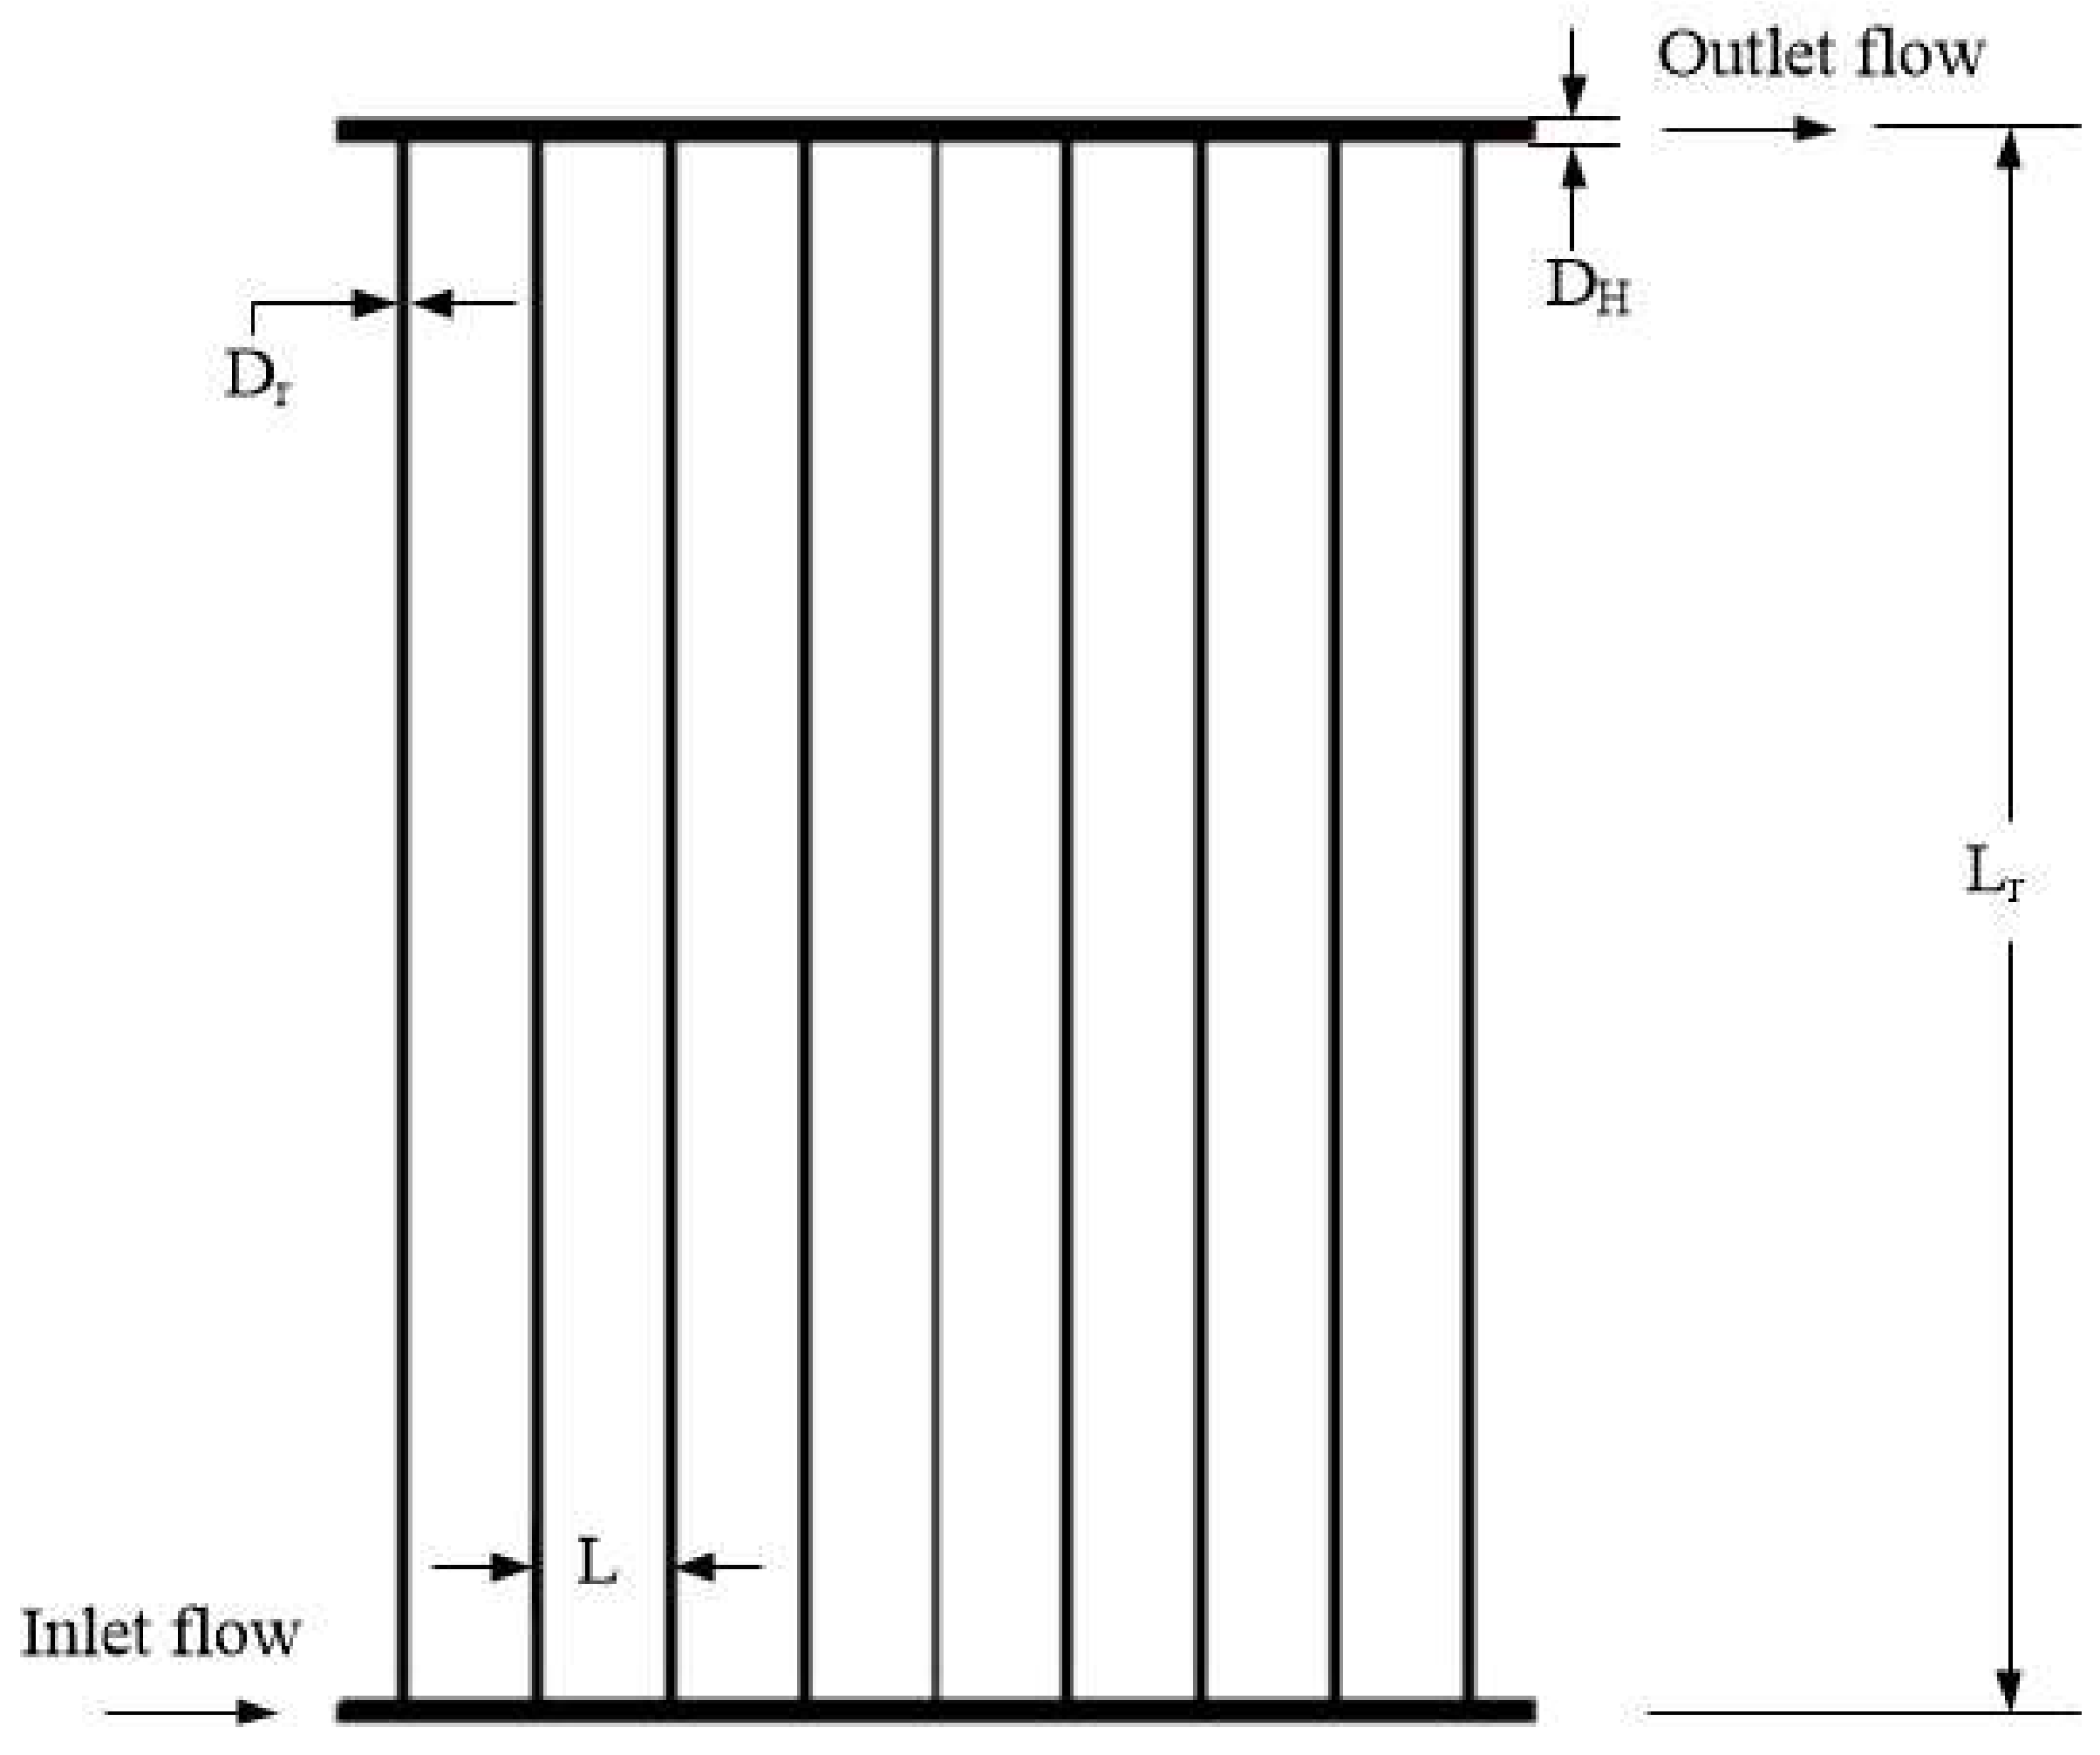
For the laminar flow case, a flat plate solar collector with a Z type configuration and 9 riser tubes which is shown in
Figure 6 is analyzed. Facão [
31] validated the laminar flow numerical solution obtained by using the commercial software FLUENT
® with experimental results. In this work, for validation purposes, the study carried out by Facão [
31] is replicated under the following operating and geometrical conditions shown in
Table 6.
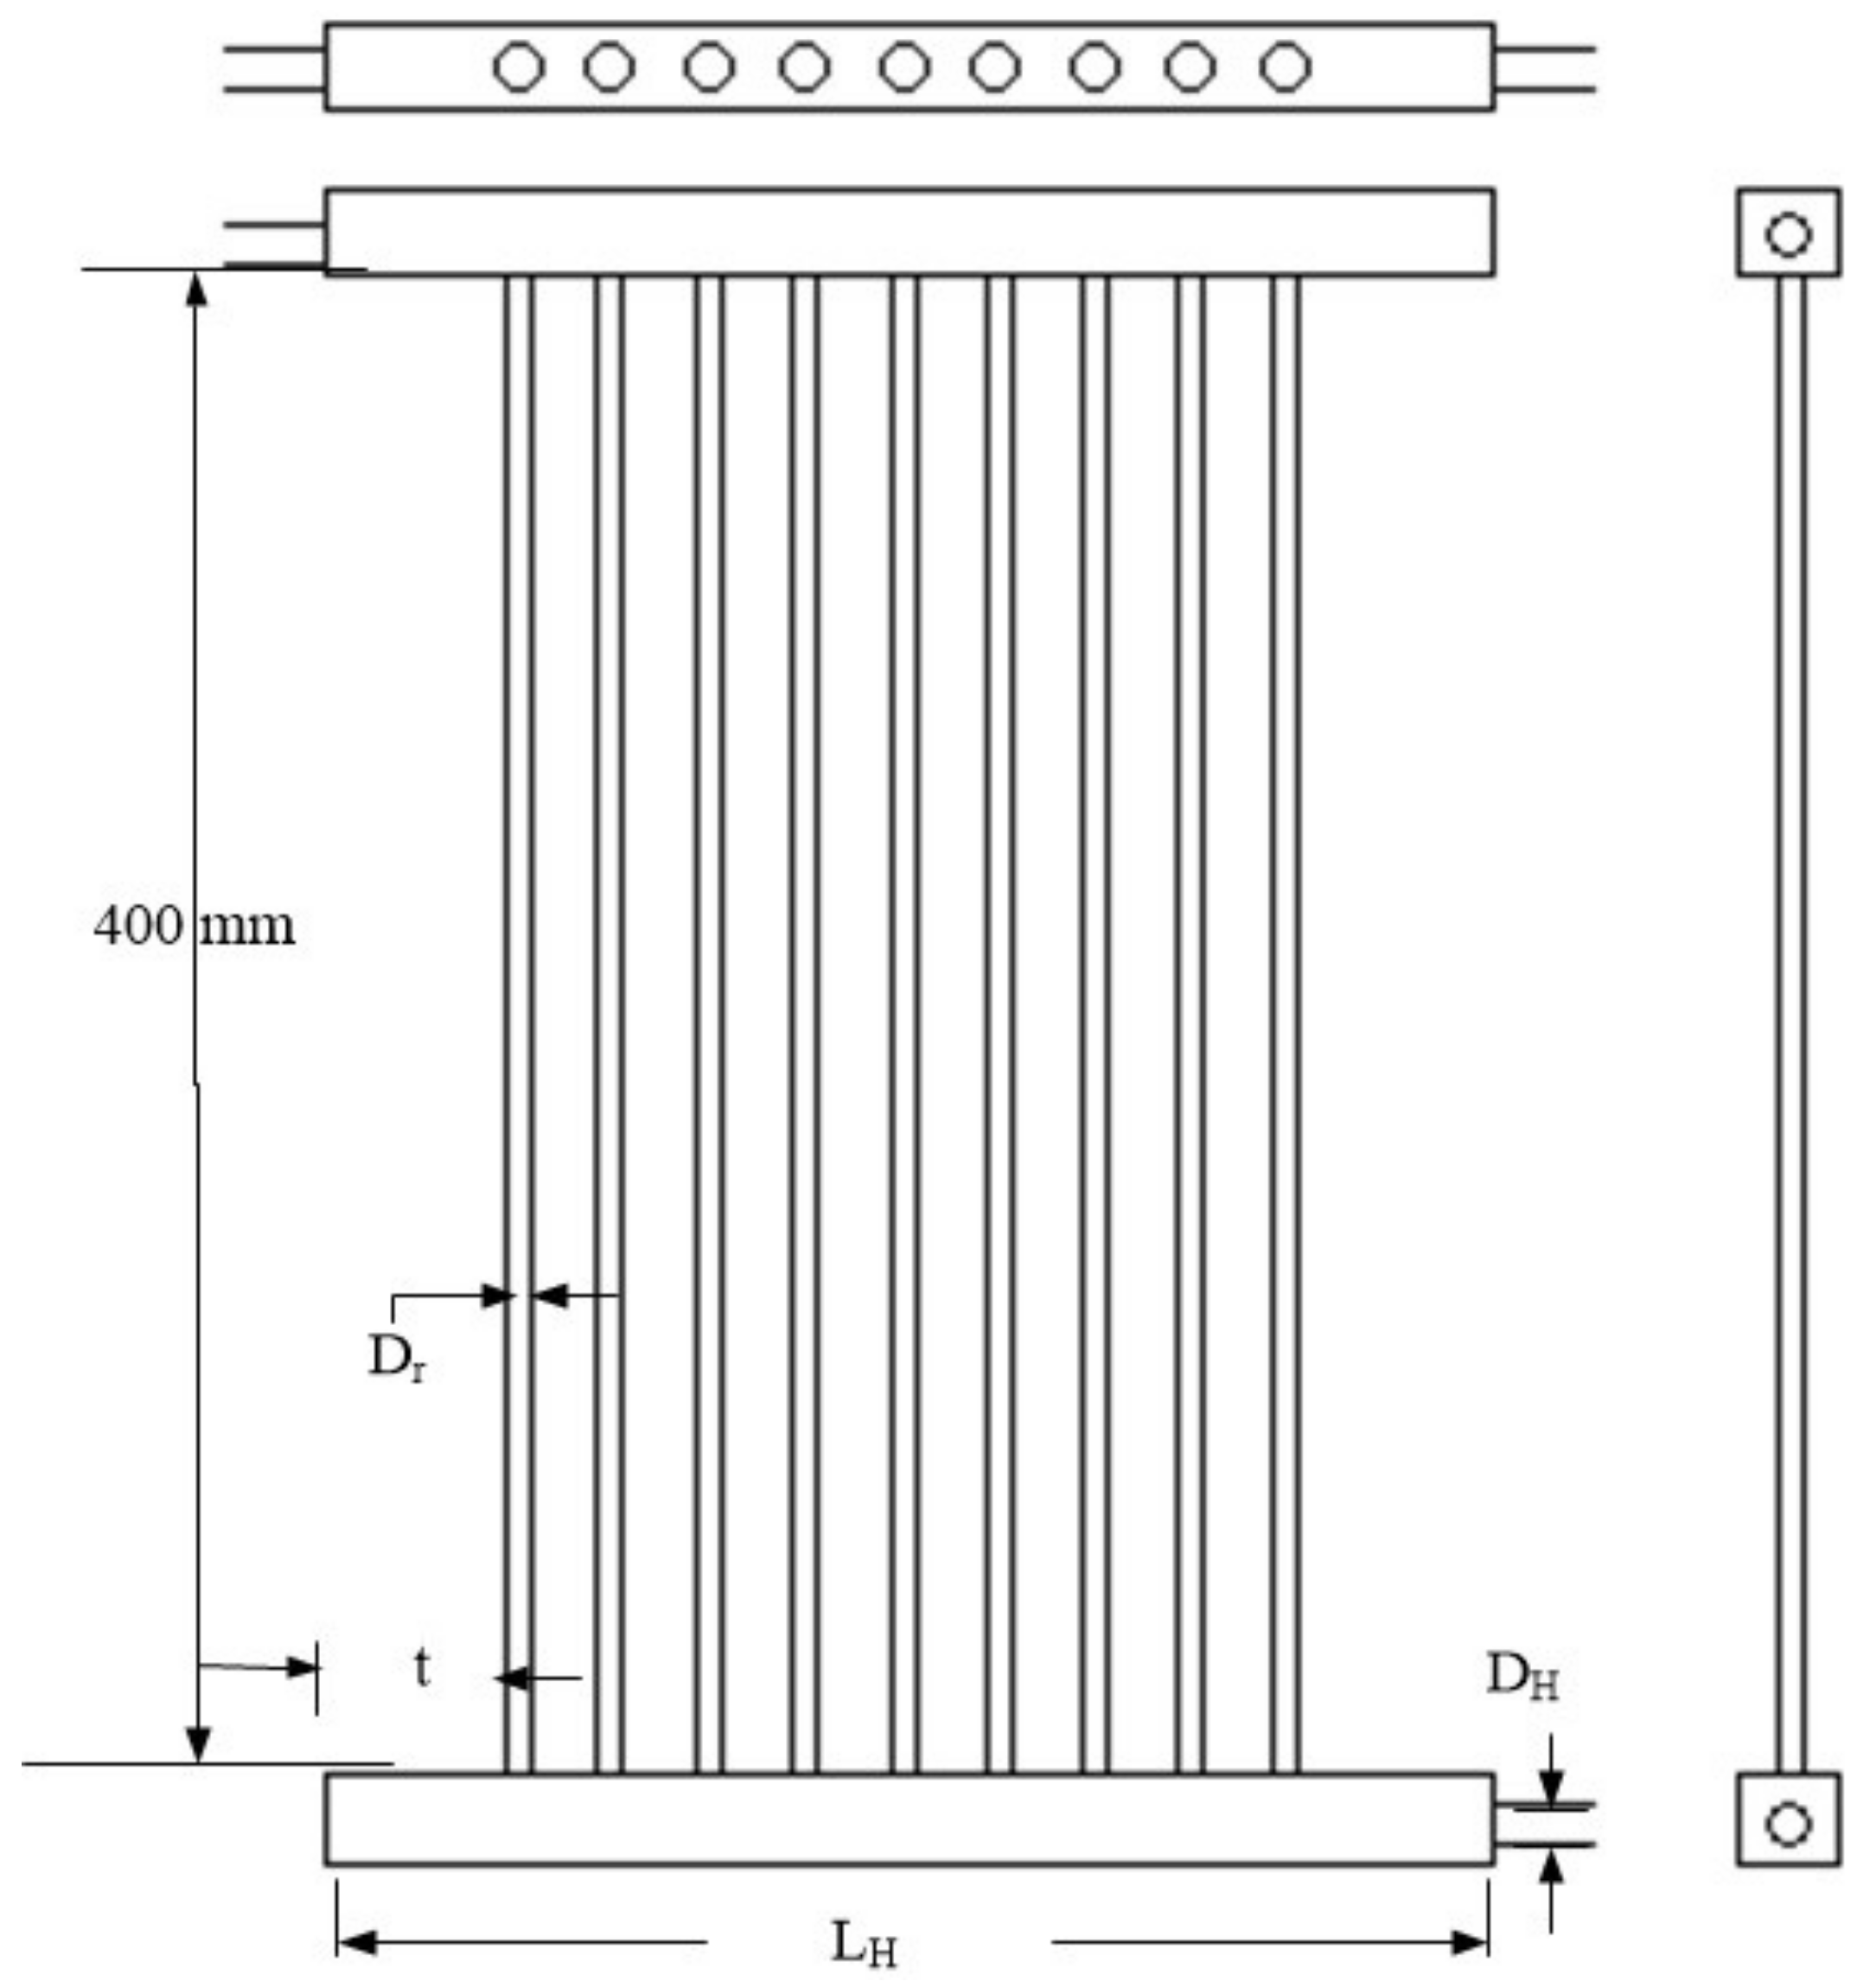
For the turbulent flow case, there is no experimental data about the flow distribution in a flat plate solar collector. However, Huang and Wang [
32] validated the turbulent flow field distribution of a compact heat exchanger by comparing with experimental data available in literature [
33]. The compact heat exchanger shown in
Figure 7 with a Z type configuration is similar to a flat plate solar collector.
In a similar way Huang and Wang [
32] performed the same analysis obtaining a solution by using the CFD software FLUENT
®. The geometrical and operating conditions under which the simulations were carried out are:
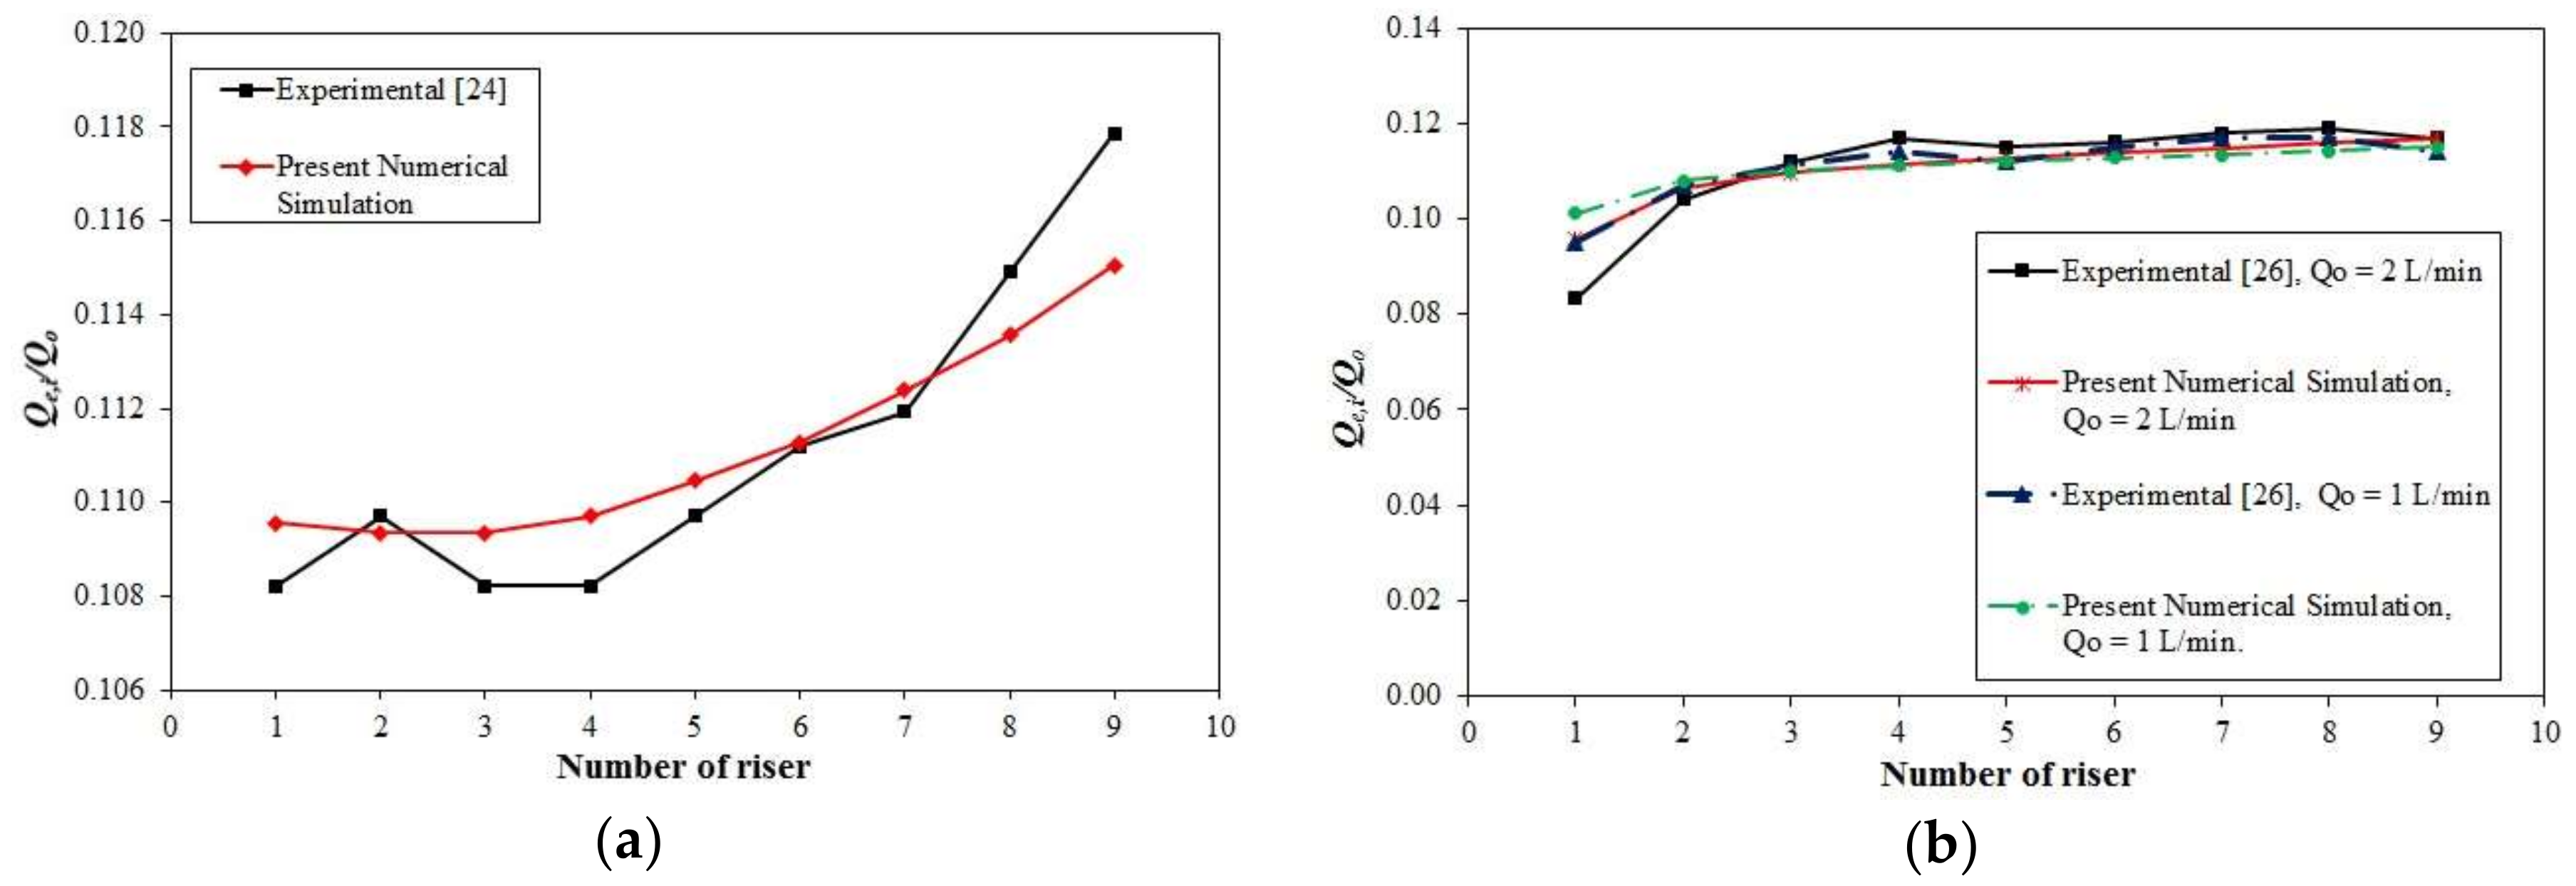
Figure 8 shows the comparison between the numerical solutions and experimental data in (a) laminar and (b) turbulent flow conditions, respectively. The numerical solutions in both flow regimes present a close agreement with the experimental data, with an absolute difference smaller than 3% relative to the experimental data.
3.3. Flow Distribution Analysis
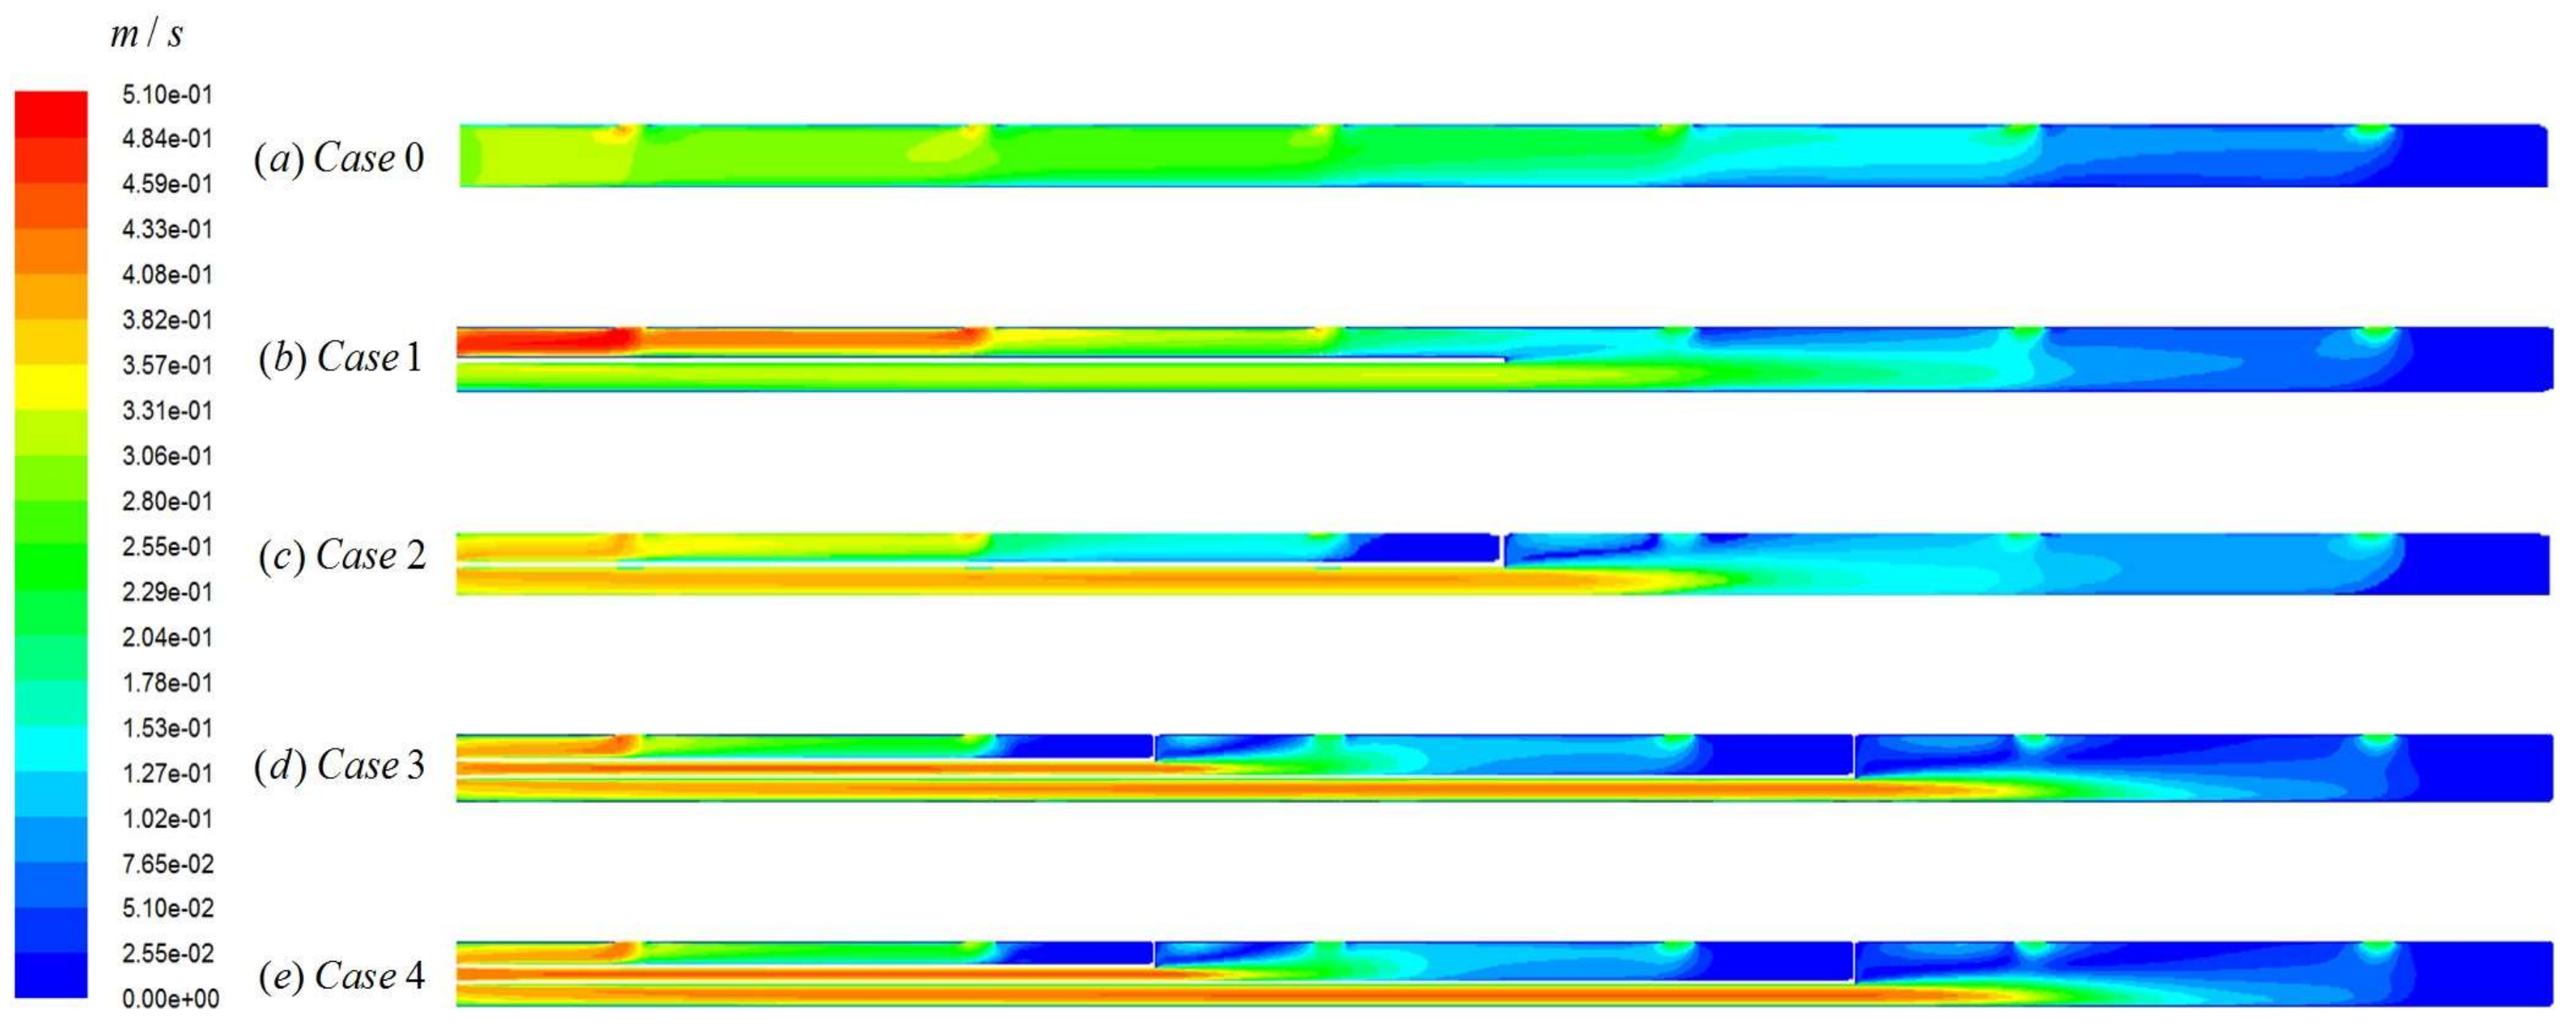
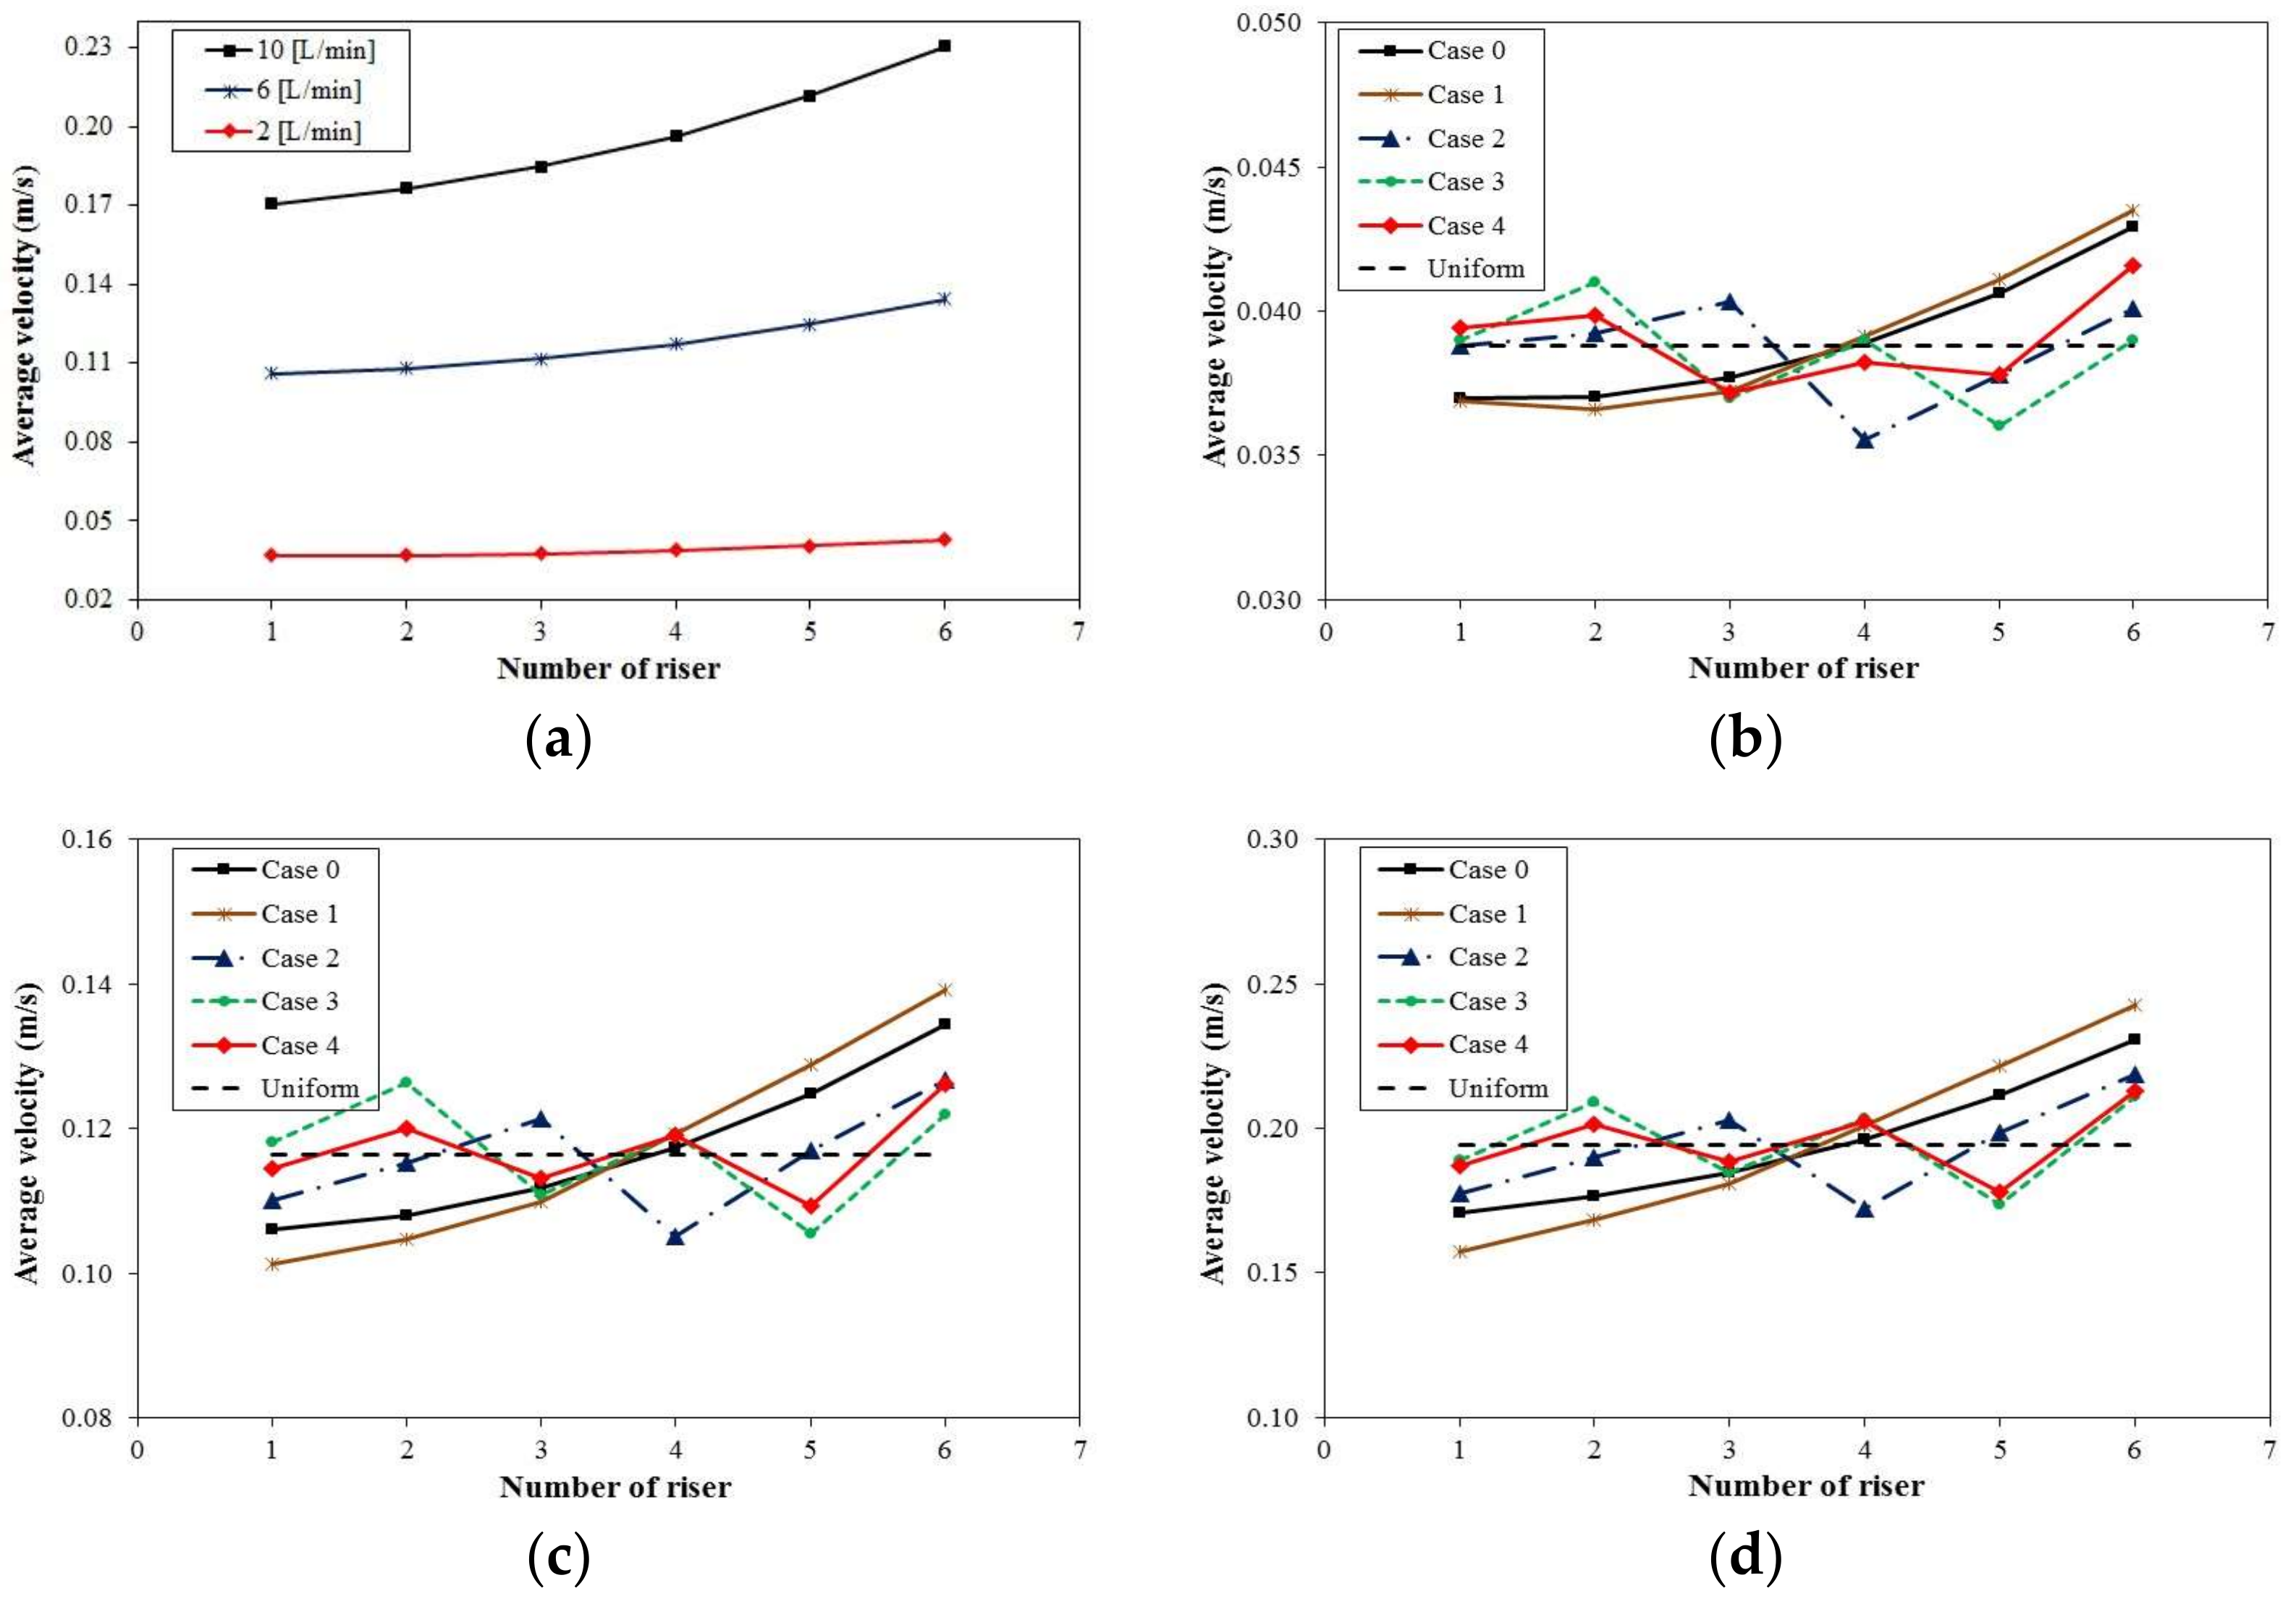
Relative to flow distribution, from
Figure 9a it can be seen that for Case 0, the amount of flow through the riser tubes is smaller in the first riser tube and higher in the last one, which usually happens in a Z type configuration, independently of the total volumetric flow rate entering the solar collector. Besides, the difference in average velocity between riser tubes decreases as the total volumetric flow rate entering the solar collector decreases, which means that the flow distribution becomes more uniform as the volumetric flow rate decreases. However, it can be noticed in
Figure 9b–d that for Case 1 at different volumetric flow rates, the velocity distribution and therefore the flow distribution presents a higher non-uniformity when compared with Case 0 in which the solar collector does not have distribution plates, thus, the use of one distribution plate without a cap at the end of the plate worsens the flow distribution.
Case 2 when compared with Case 1, shows a better distribution at low flow rates (
Figure 9b,c) whereas a better distribution at high flow rates can be observed in Case 3. Nevertheless, Case 4 presents a better distribution at the different flow rates analyzed in this work, as shown in
Figure 9 b–d.
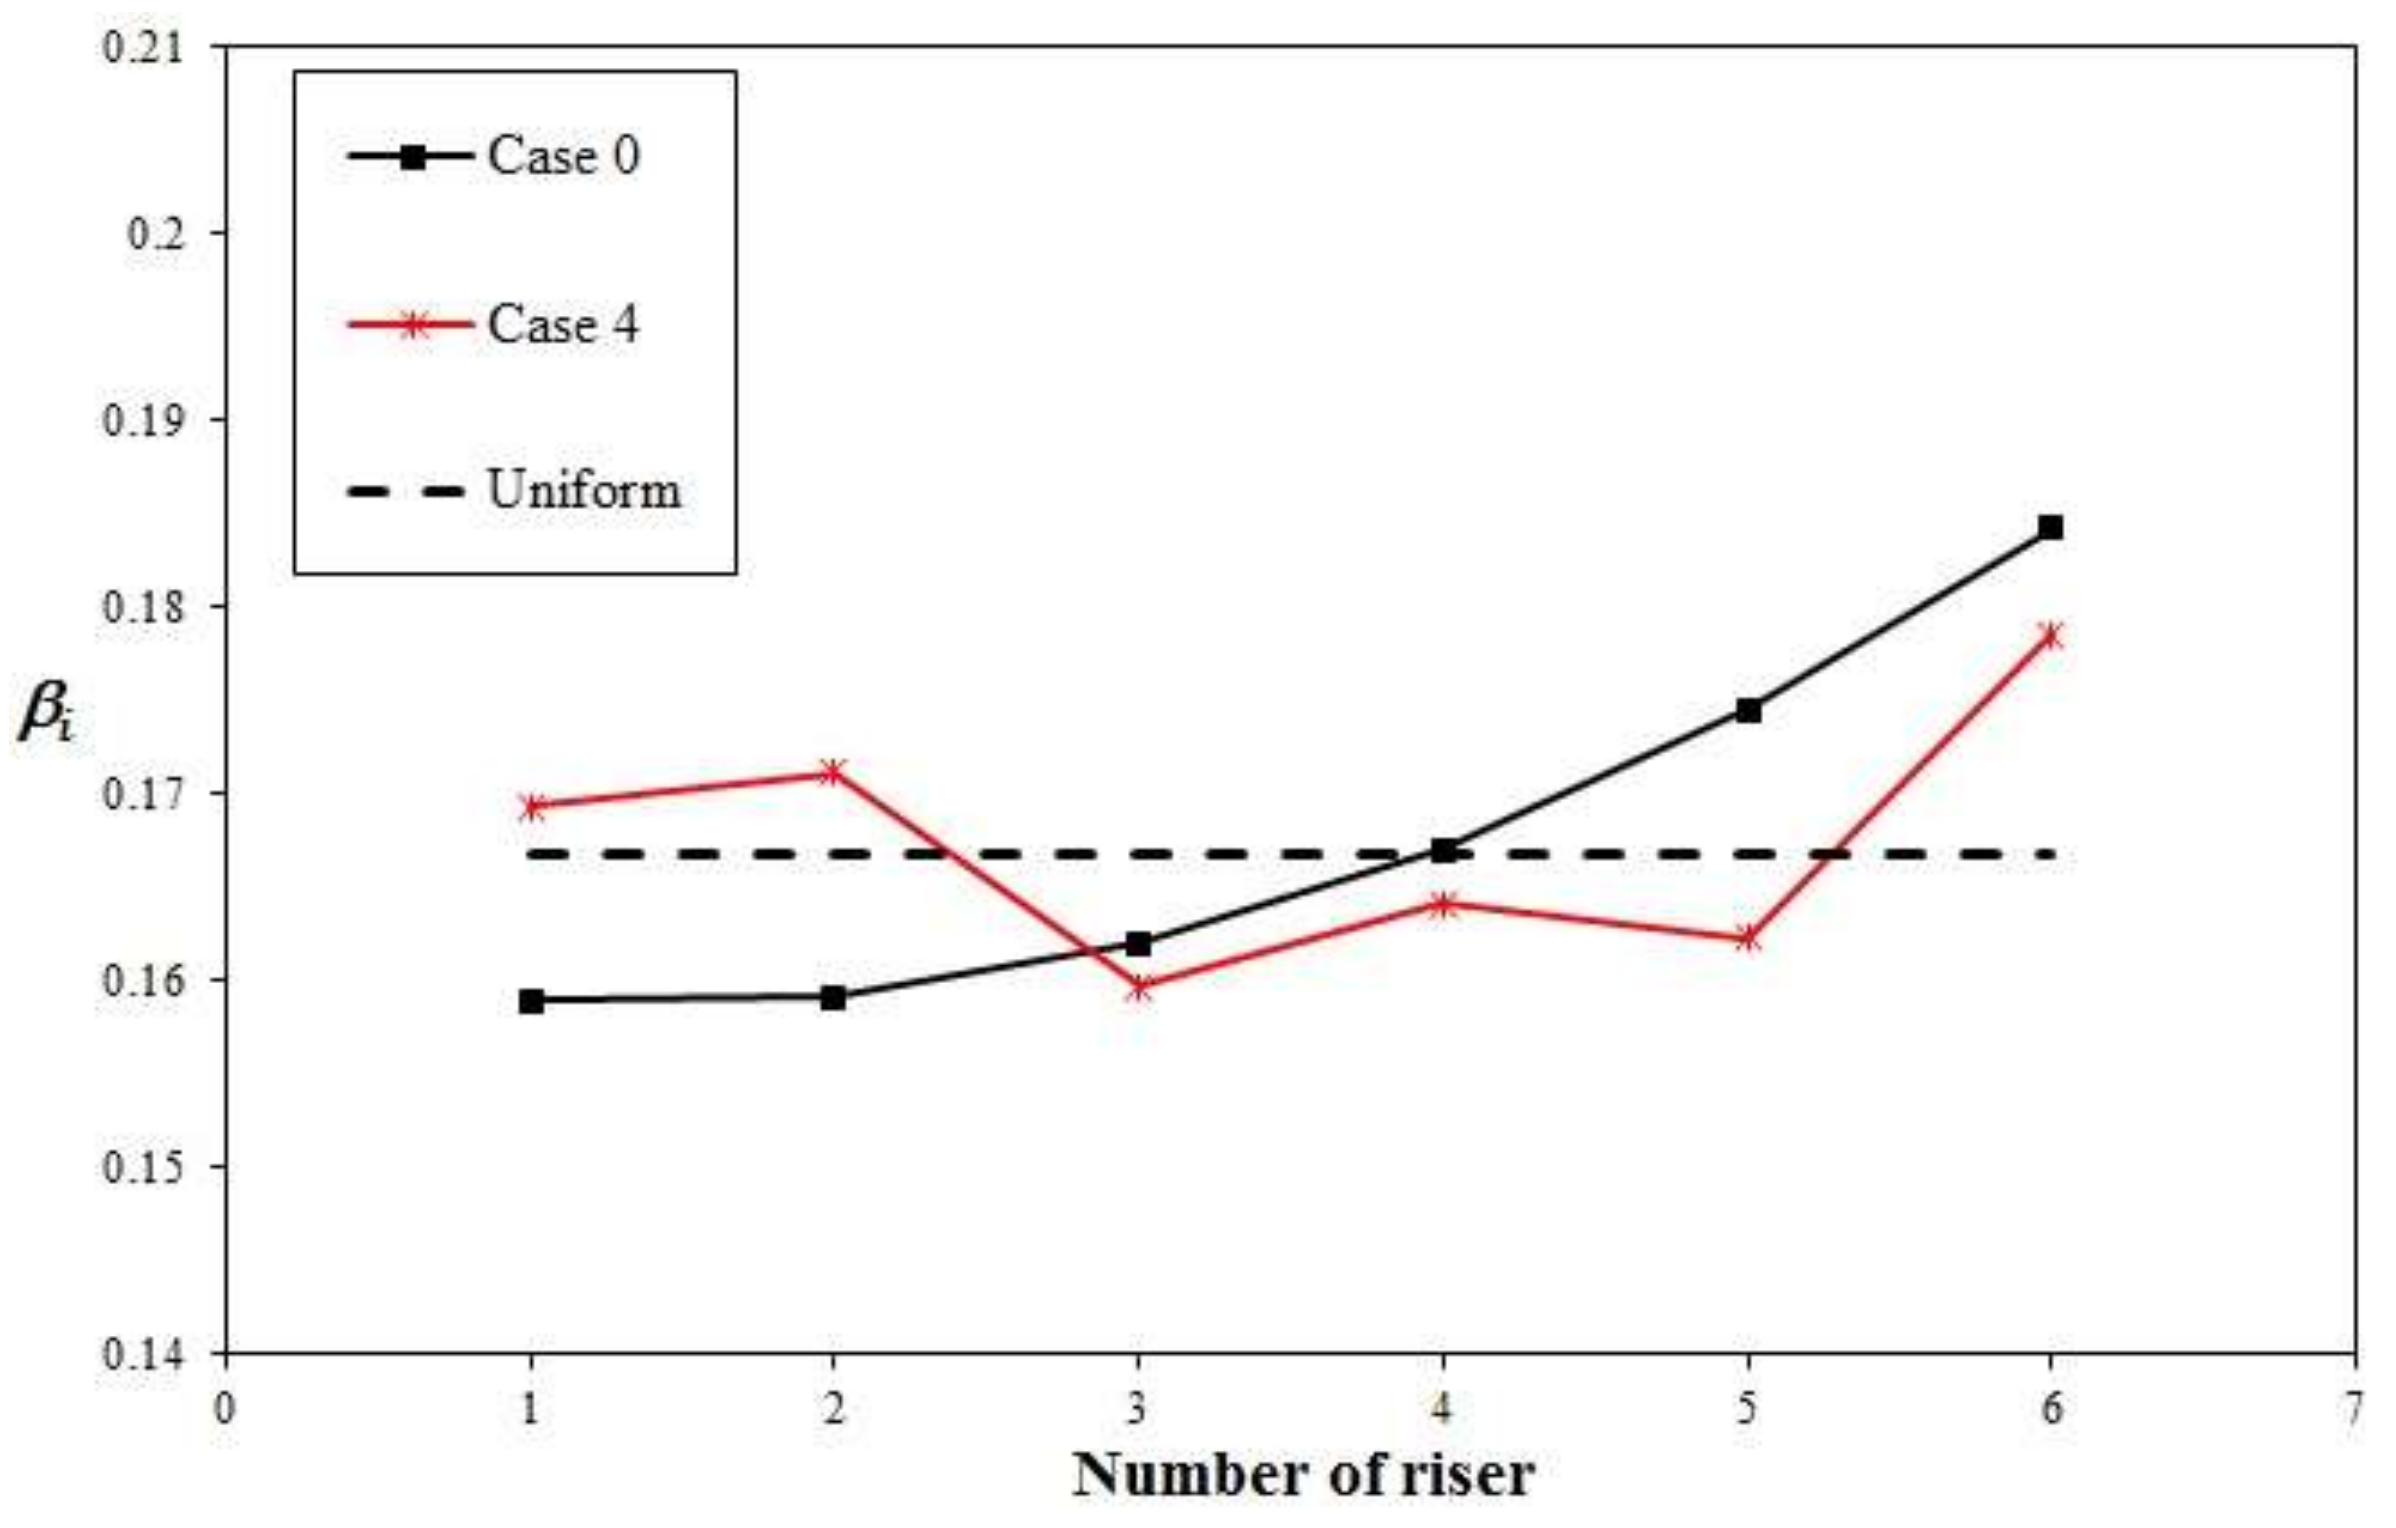
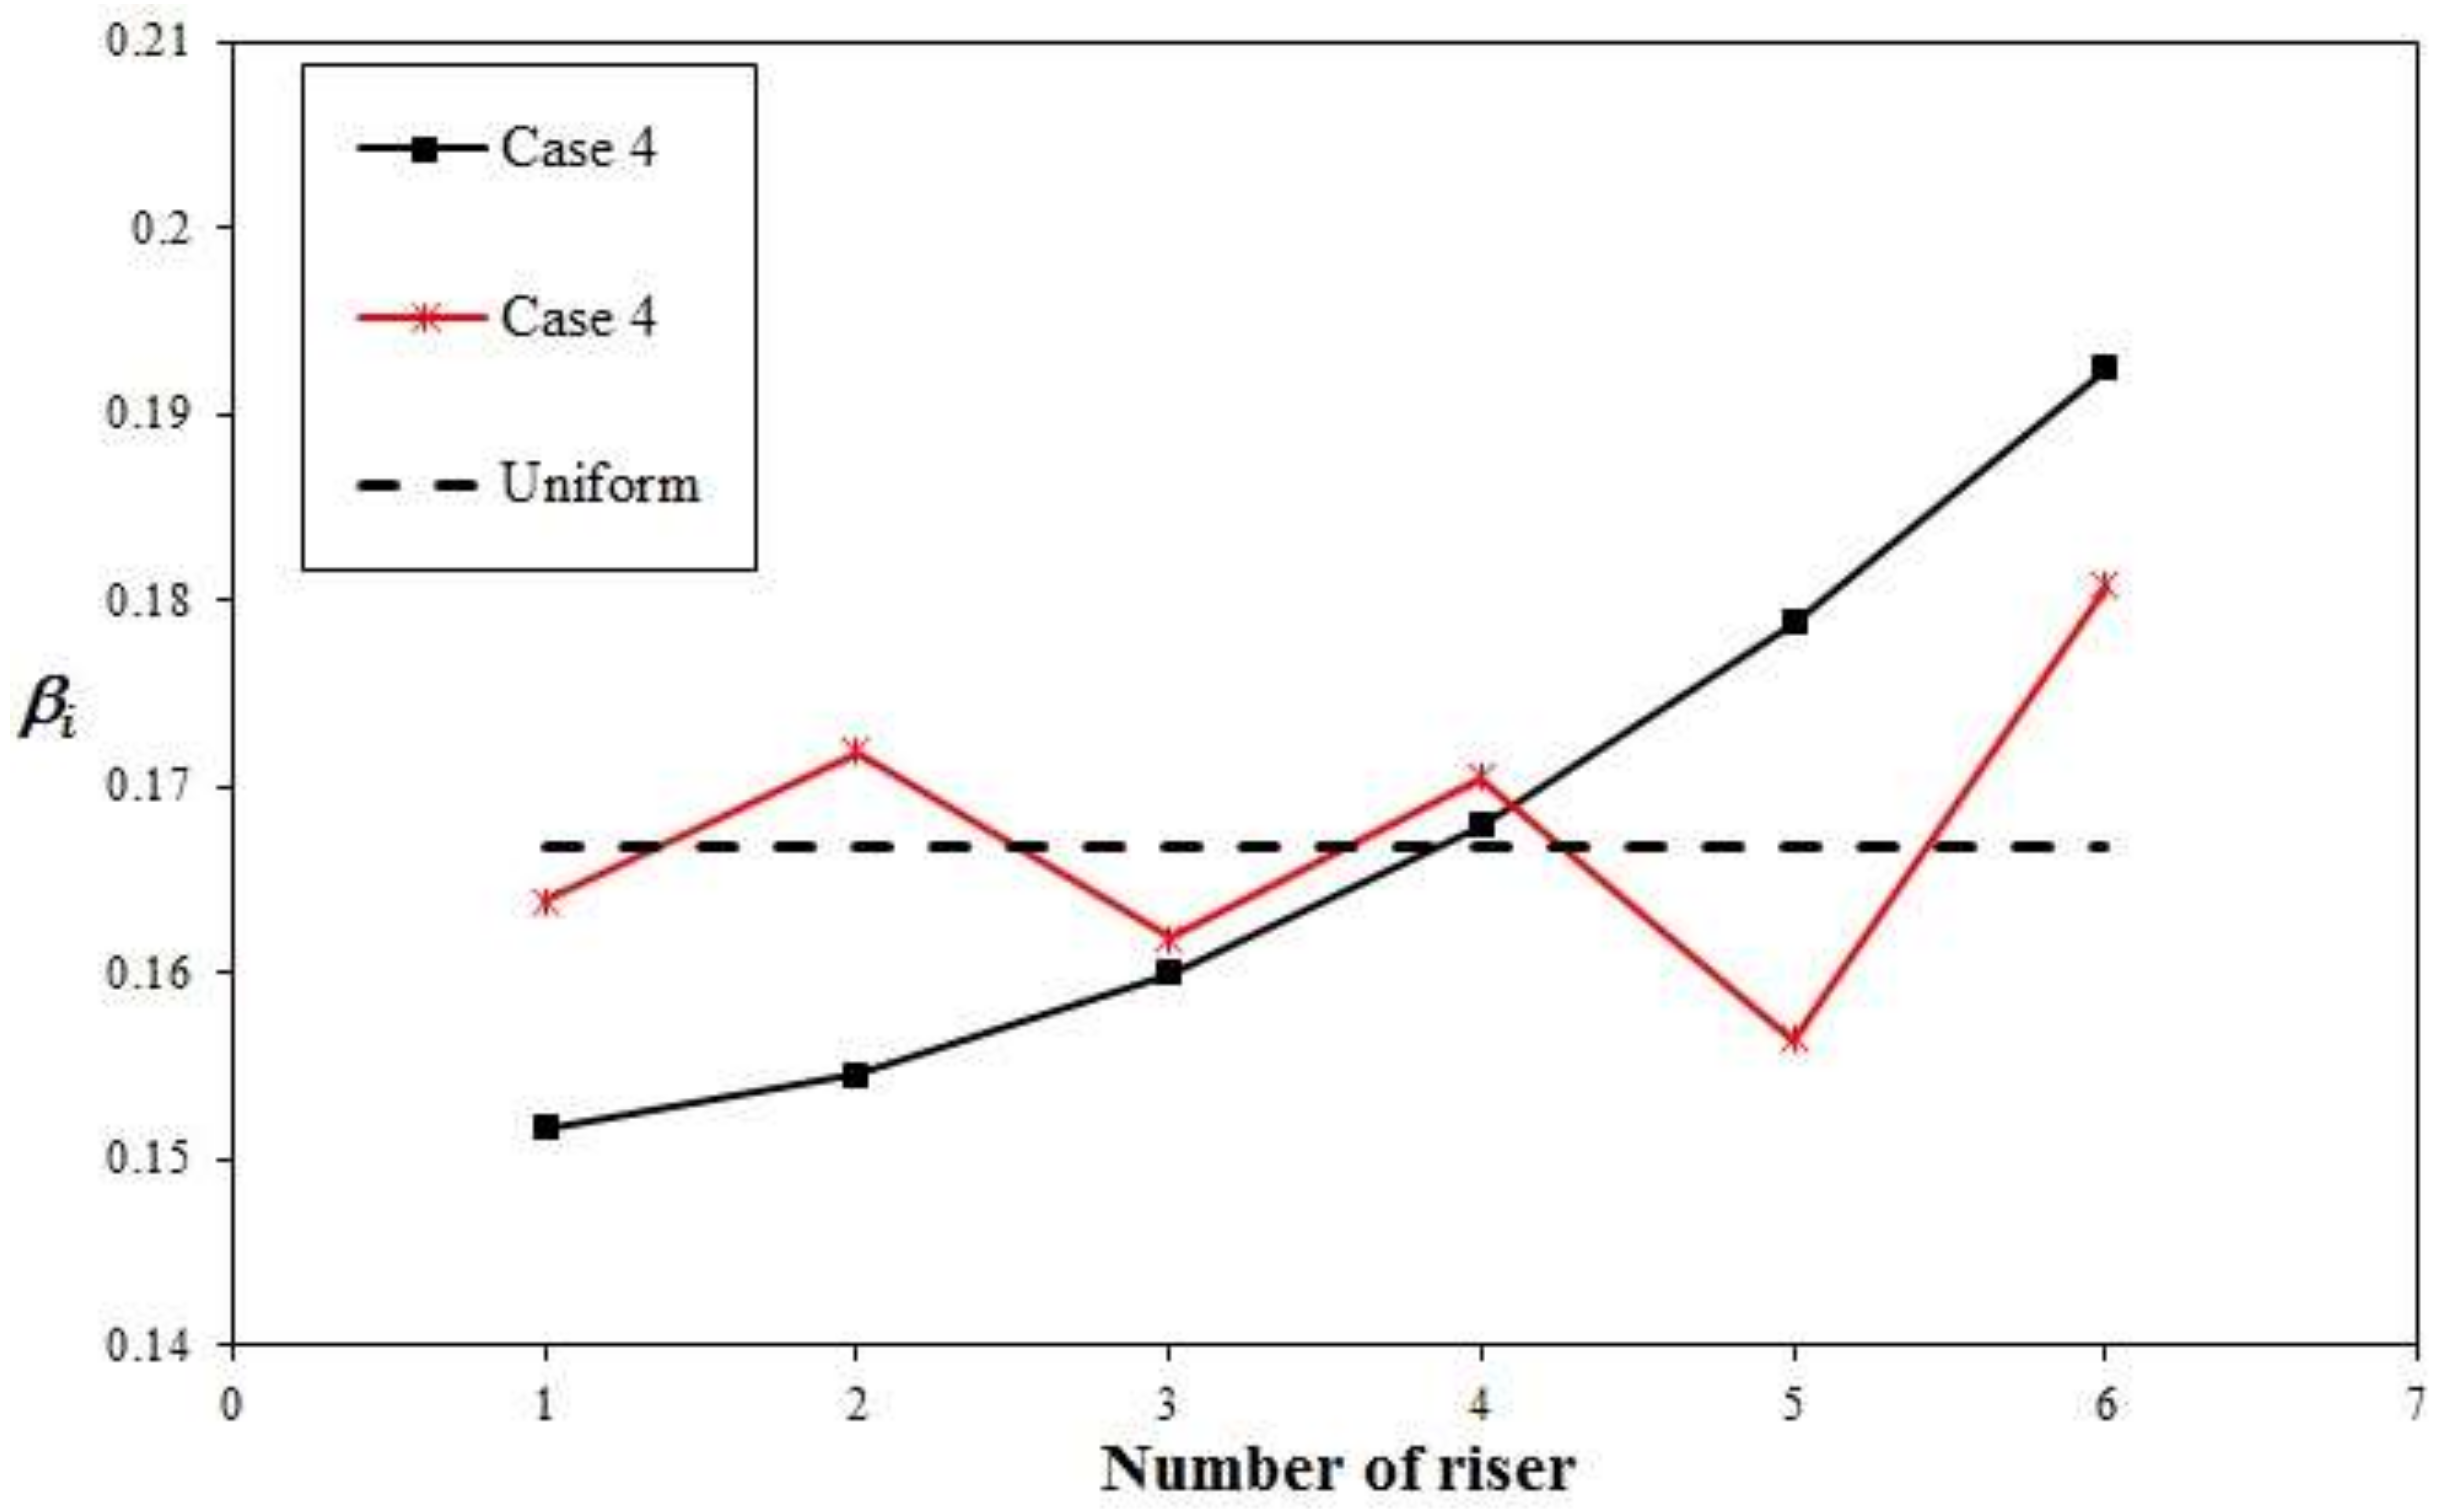
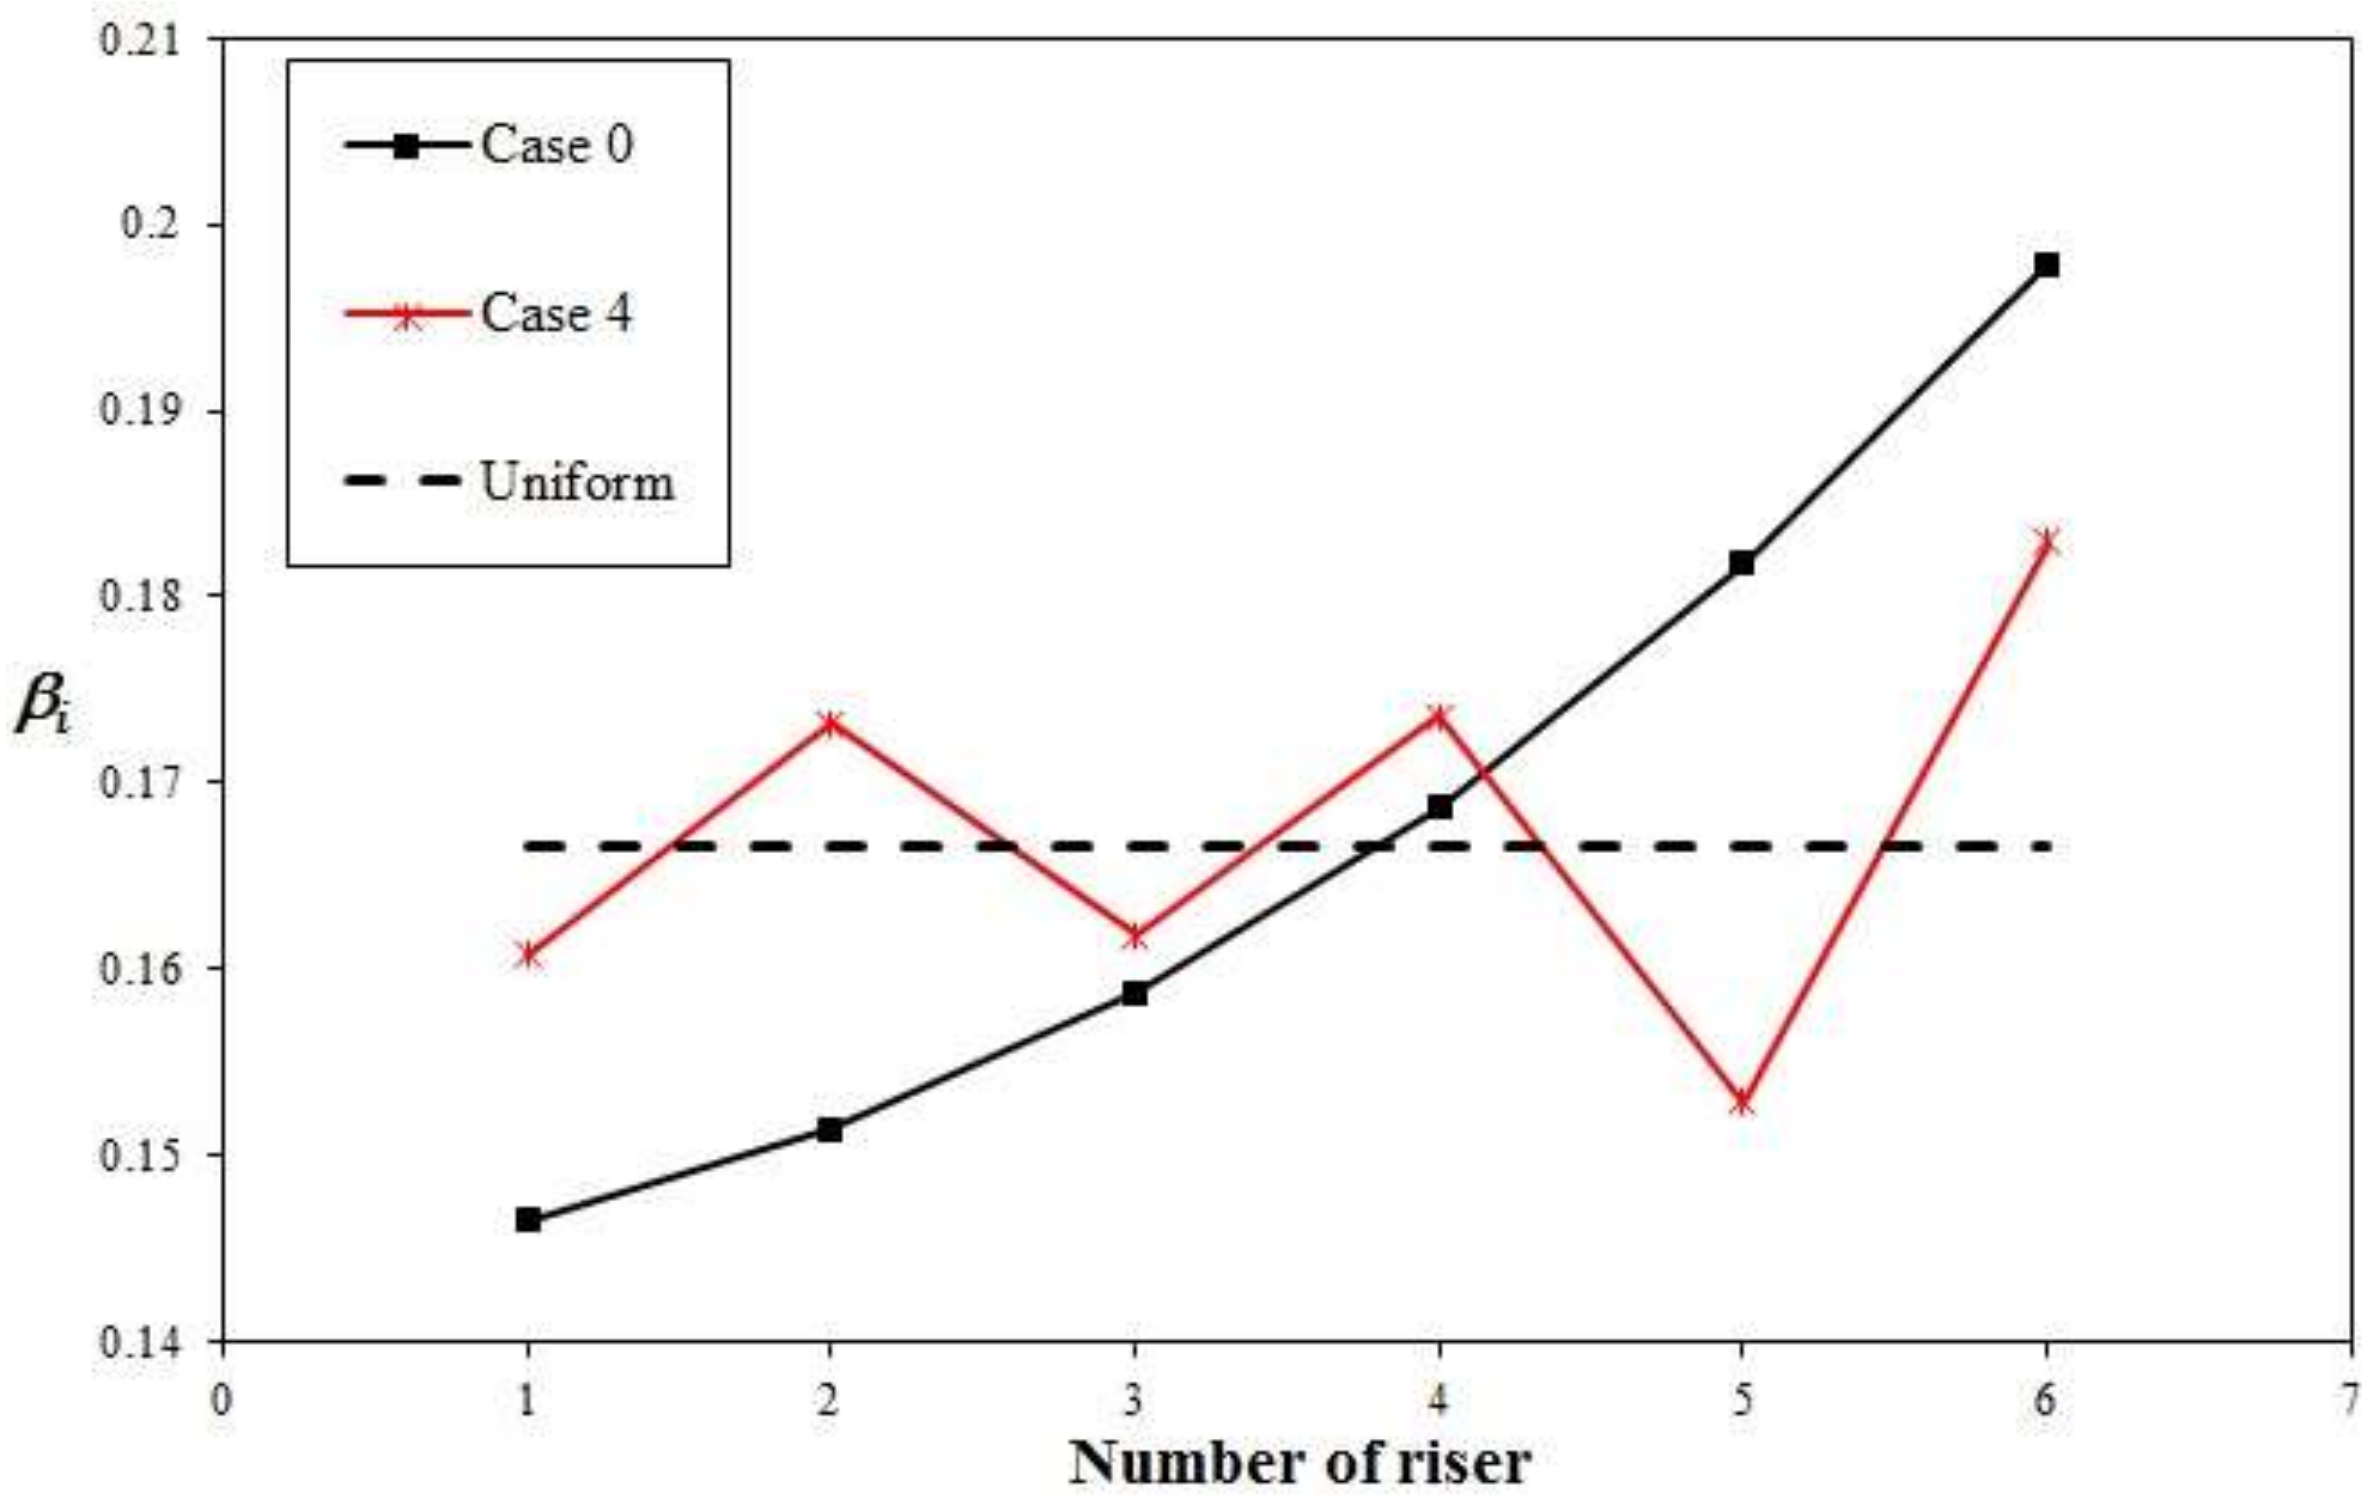
Figure 10,
Figure 11 and
Figure 12 show a comparison of the flow distribution between Case 0 and Case 4 at the different flow rates analyzed in this work.
The parameter
βi represents the ratio of the amount of flow passing through the
i-th riser tube to the total flow, defined as:
By analyzing
Figure 10,
Figure 11 and
Figure 12 it can be noticed a considerable improvement in the flow distribution uniformity in Case 4 when compared with Case 0 and a better flow distribution at low flow rates, as expected.
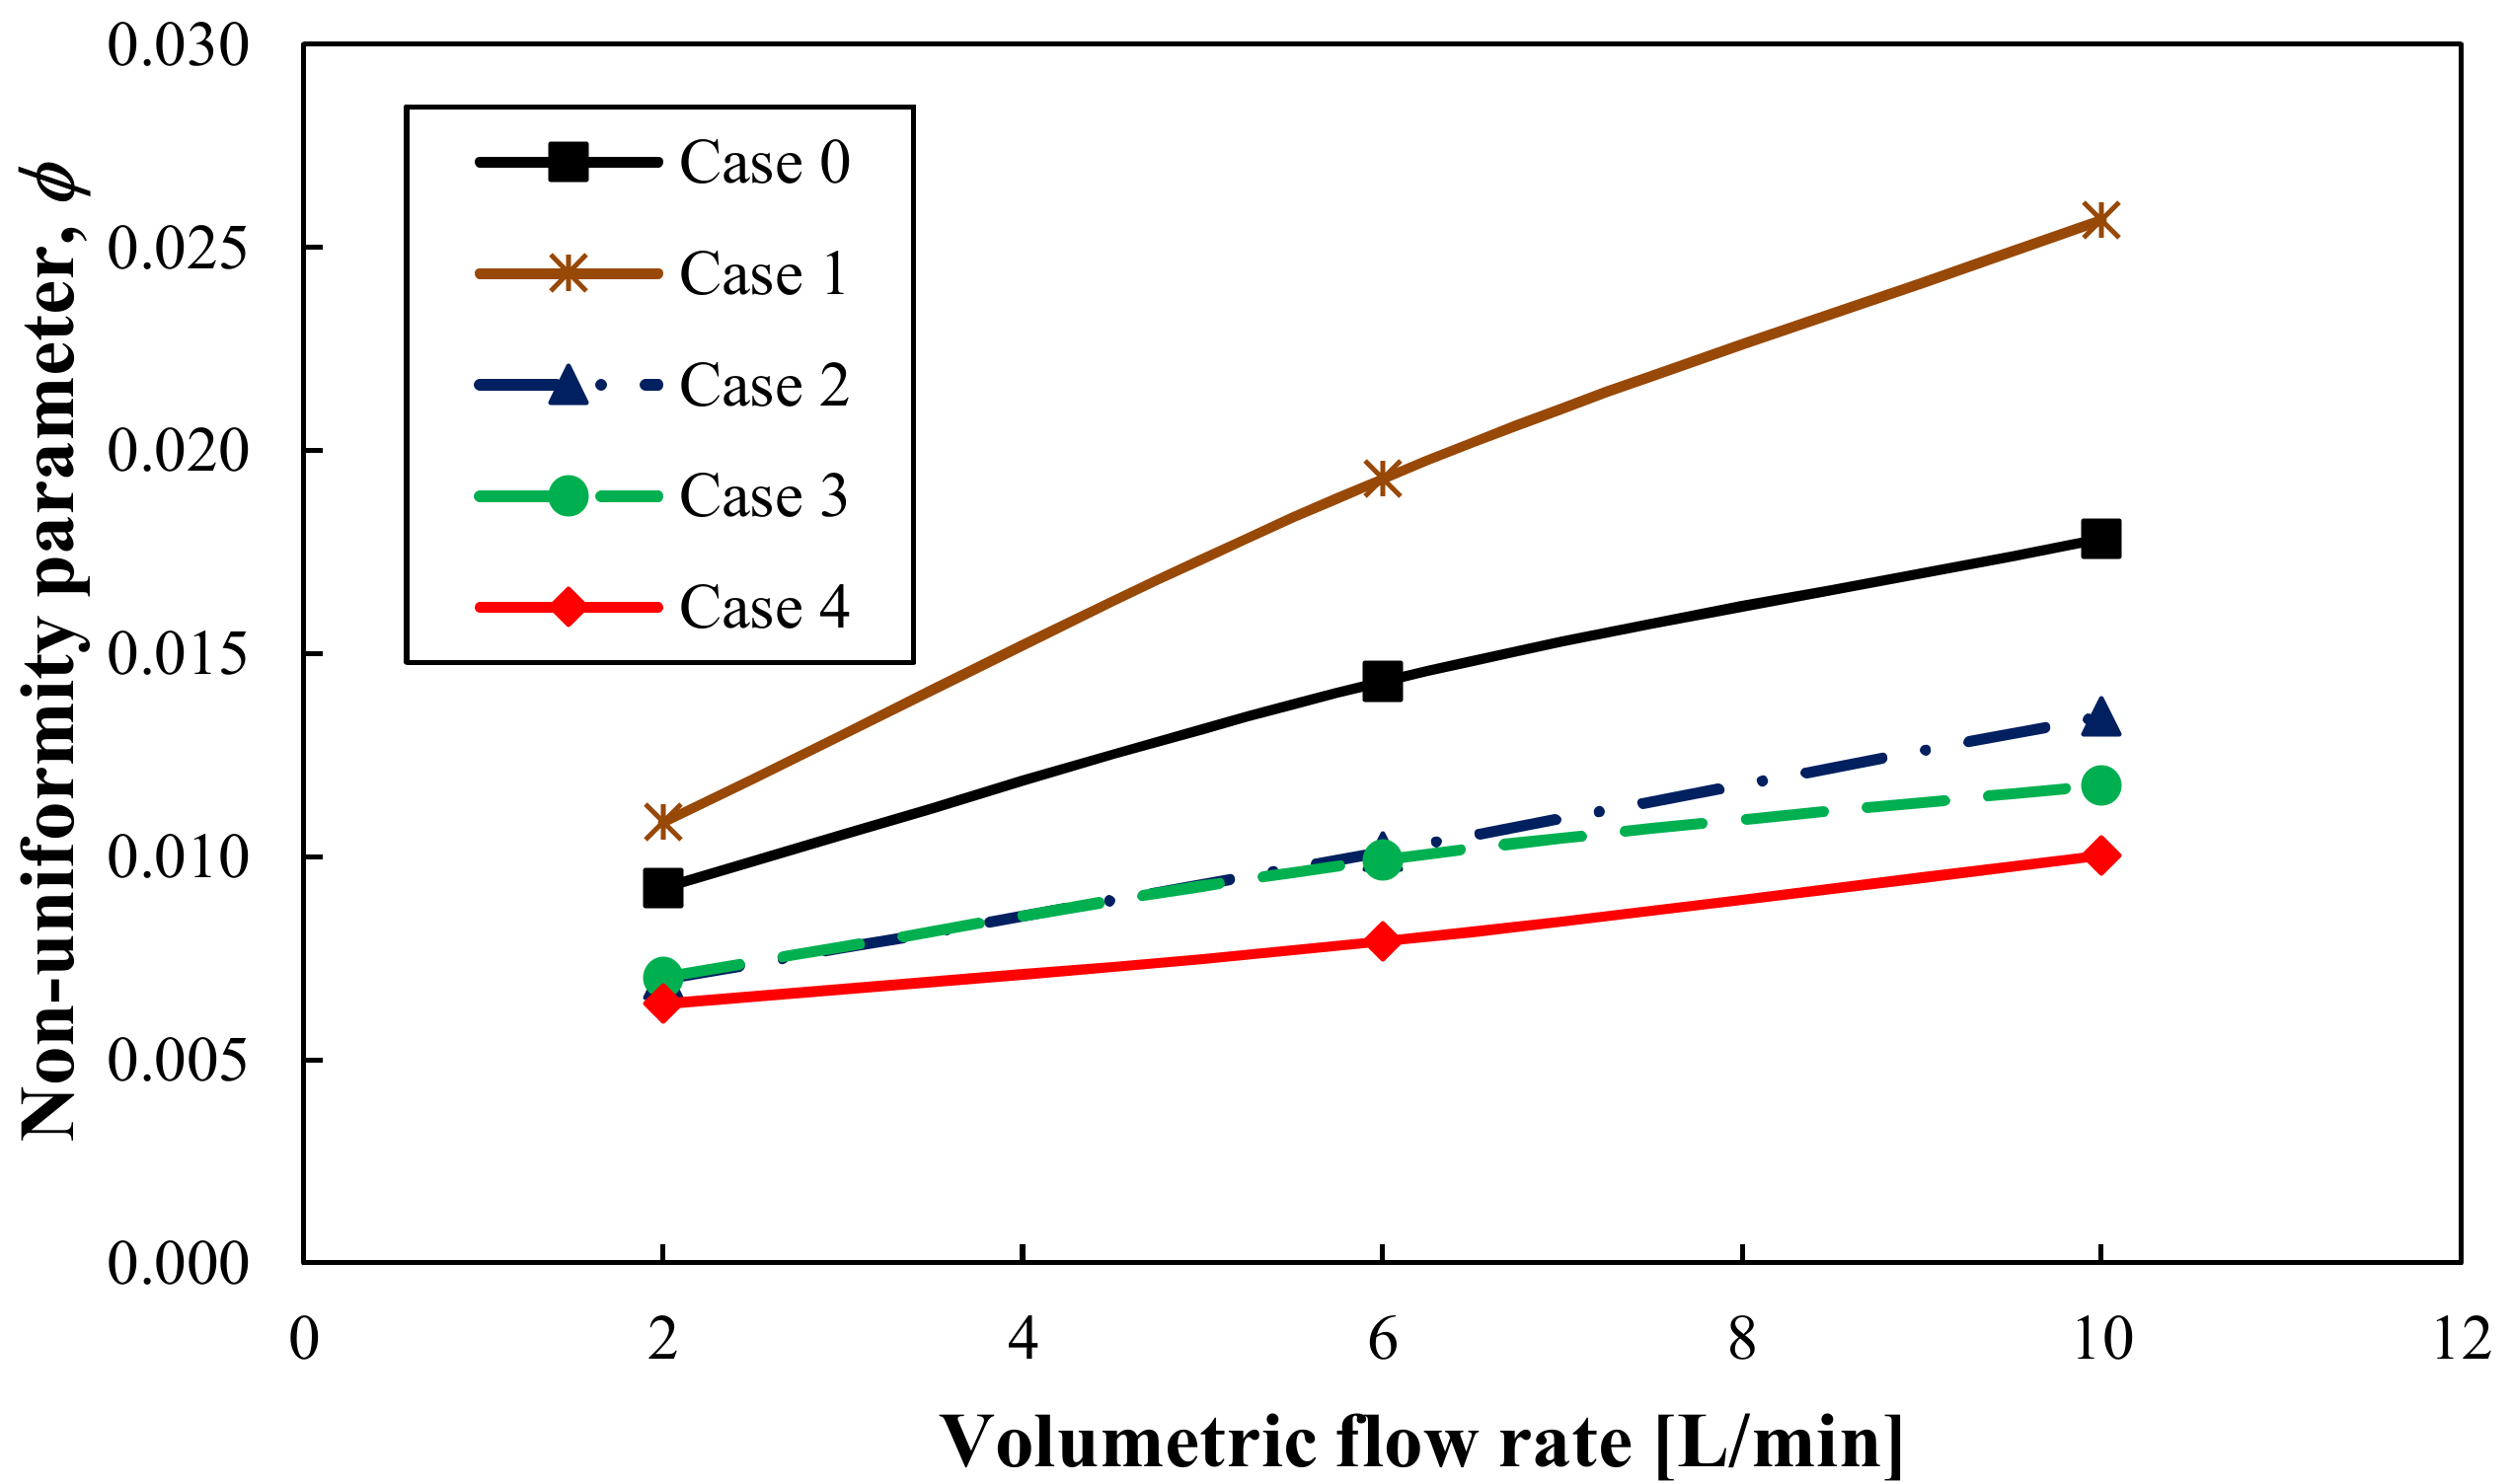
Although the use of distribution plates improves the flow uniformity, a deviation with respect to the uniform flow condition is still present. A parameter used by several authors to assess such deviation is the named non-uniformity parameter
φ, which is defined as:
where
n is total number of riser tubes in the solar collector. This parameter is similar to the mean square root or standard deviation generally used in statistics, thus, the lower the value of this parameter, more uniform would be the flow in the riser tubes.
Figure 13 shows the non-uniformity parameter obtained at three different volumetric flow rates for all the cases studied (baseline case included). This parameter increases for high volumetric flow rates because the pressure in the manifolds depends on volumetric flow rate through them, and hence it produces a higher pressure drop in the risers when compared to lower flow rates. When
Figure 9 and
Figure 13 are compared, a considerable reduction on non-uniformity is obtained for Cases 2–4. Case 1 presents a worse result when compared with other cases (even with baseline case); it can be attributed to the fact that the flow rate is divided in two flow rates at the inlet and since the distribution plate does not have a closed end (see
Figure 4a) it does not force the fluid to flow through the first risers as occurs in Case 2. Cases 3 and 4 have a similar configuration (see
Figure 4c,d), but Case 4 also has distribution plates with closed ends in the combining manifold, which causes that the flow leaving from the last risers does not add a flow resistance to the streams coming from the first risers, increasing the flow rate throughout the first risers and thus improving the flow distribution.
3.4. Overall Pressure Drop Analysis
The pressure drop through a solar collector is an important design parameter. Furthermore, this parameter affects considerably the system energetic efficiency because it represents the energy needed to maintain the flow rates at the operating conditions required by the system.
Figure 14 shows that using distribution plates originates a flow velocity increase in the distribution manifold when compared with the case of a collector without distribution plates, which also originates an increase in the global pressure drop of the system when it operates with higher volumetric flow rates as shown in
Table 7.
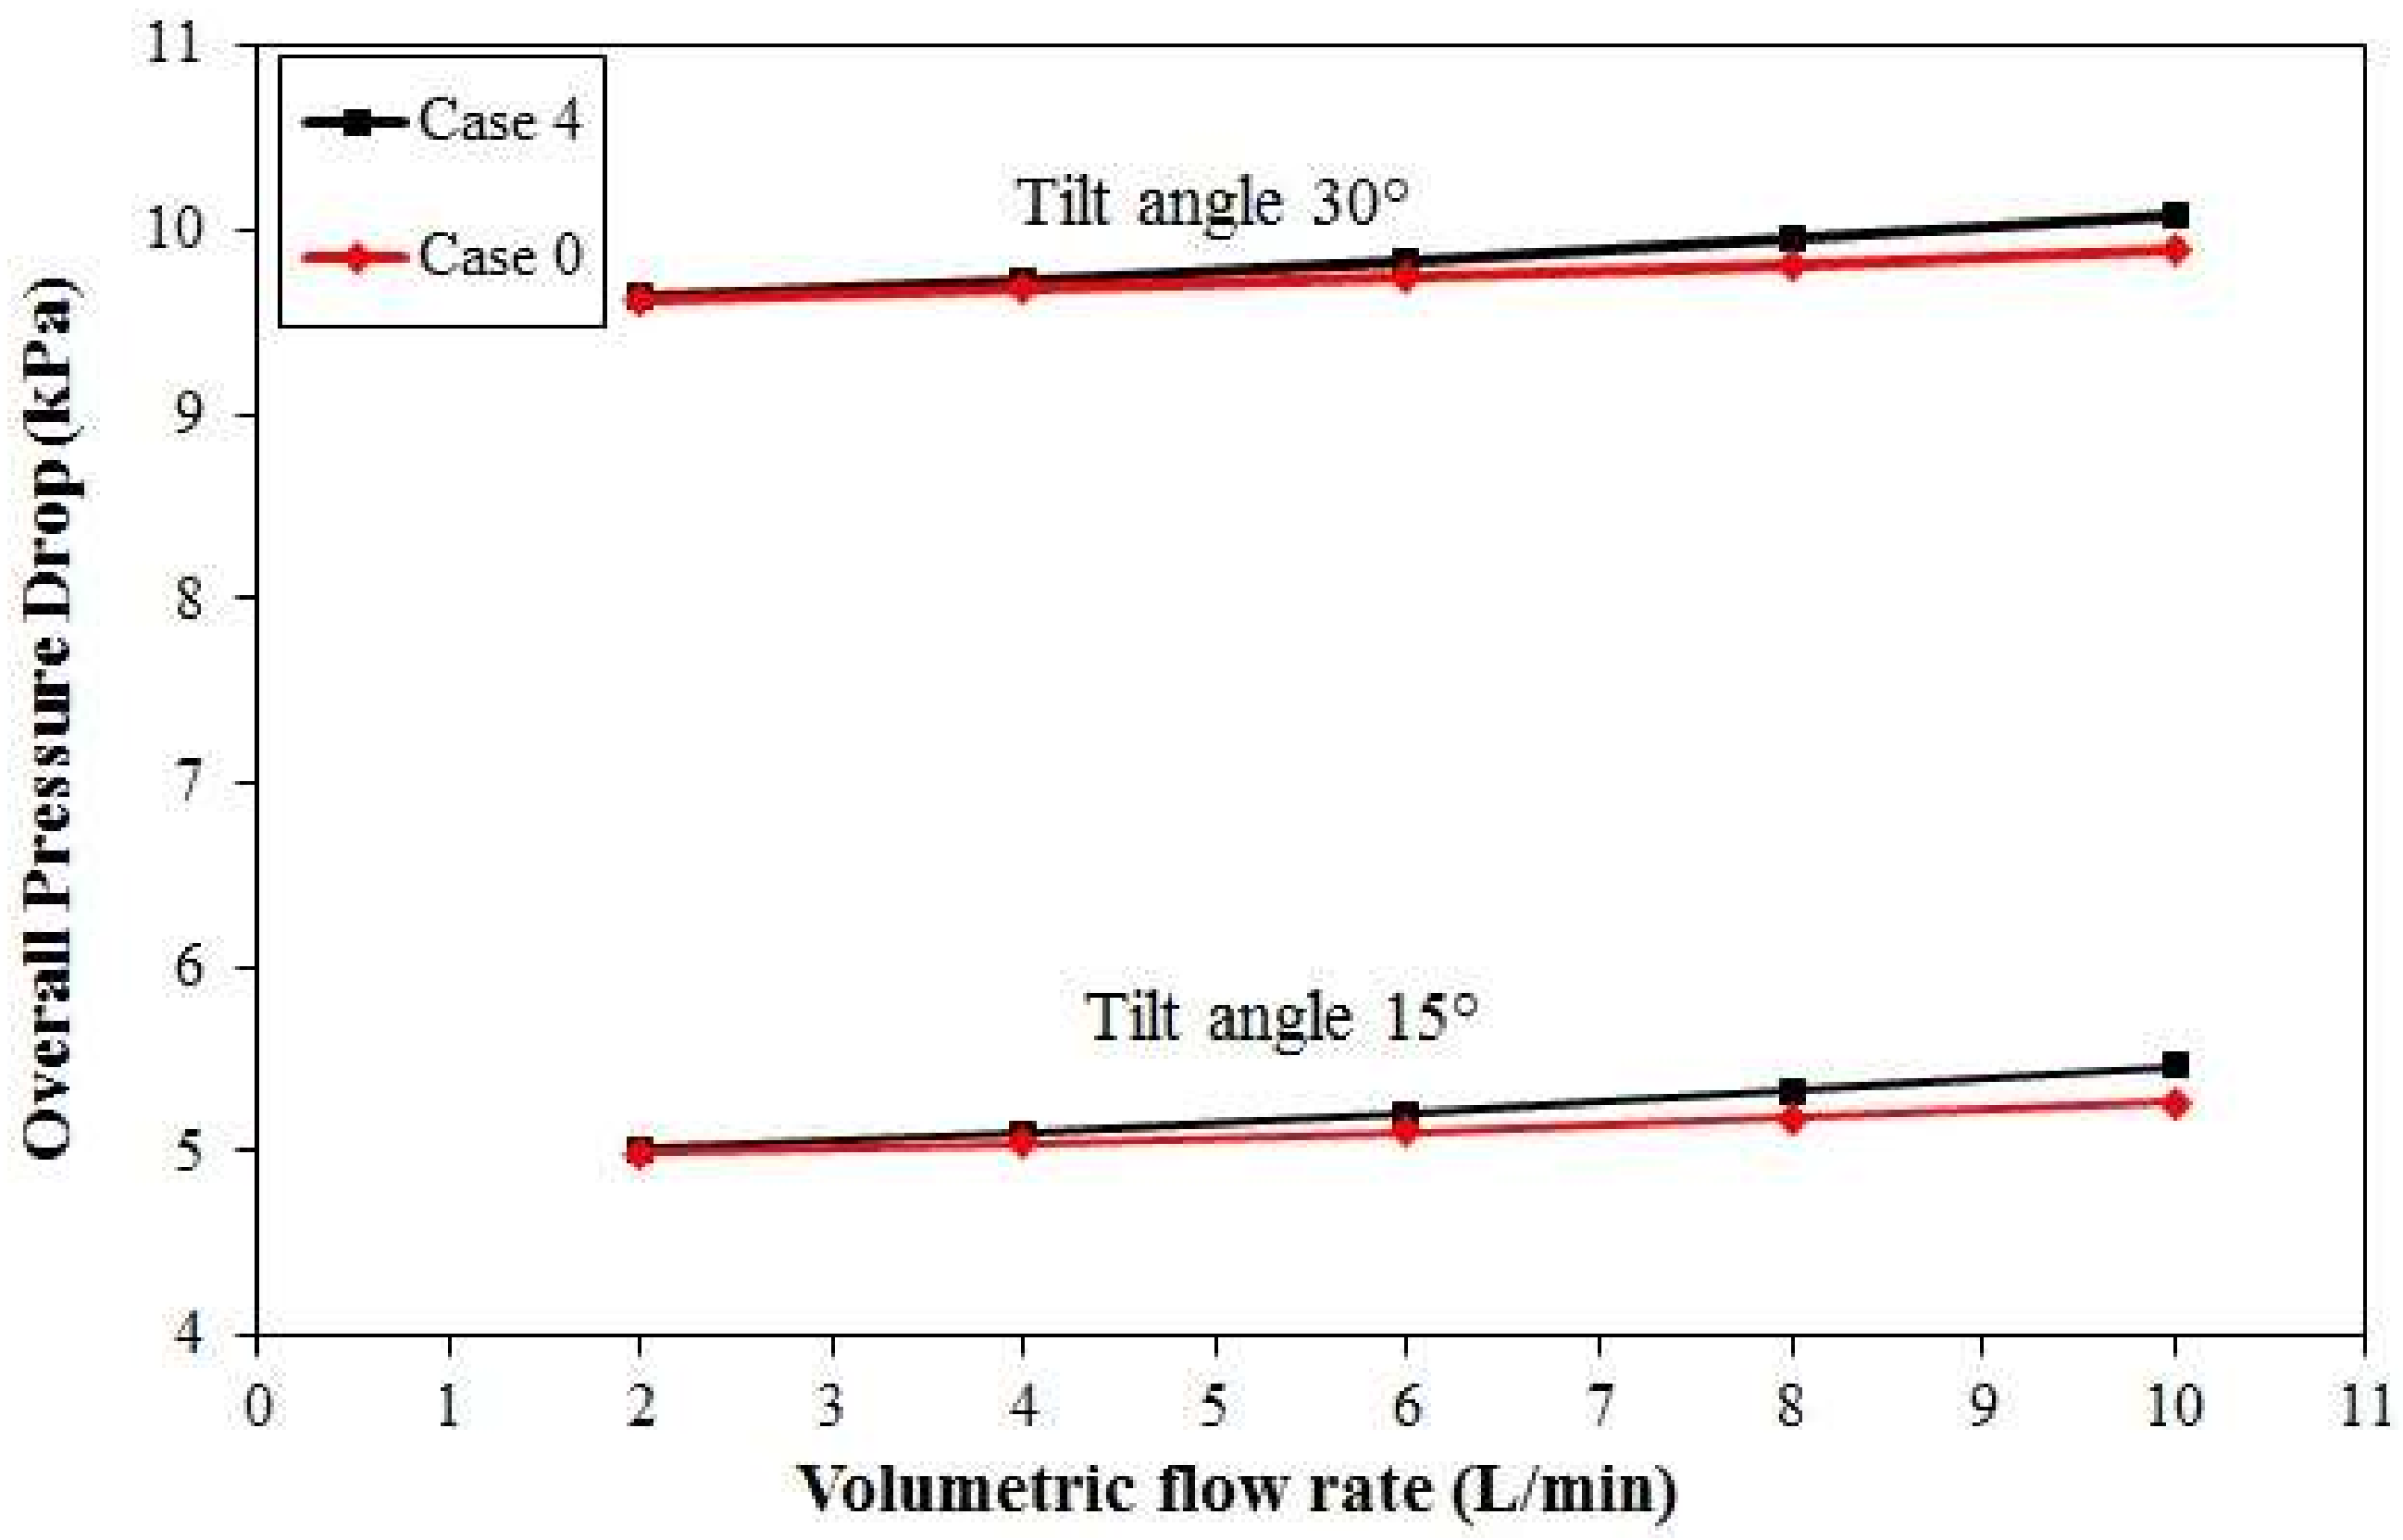
An evaluation of the pressure drop increase caused by the configuration which offers the best flow distribution has been performed.
Figure 15 shows the comparison of the overall pressure drop between a solar collector without distribution plates (Case 0) and a solar collector with two distribution plates in both manifolds (Case 4), for tilt angles of 15° and 30°, which are recommended in Mexico in order to use the largest amount of solar energy during the year [
12].
According to
Figure 15 the difference in the overall pressure drop between Case 0 and Case 4 increases as the volumetric flow rate increases, where the maximum difference is present at a volumetric flow rate of 10 L/min. This difference is basically negligible since it is about 3% and 2% for tilt angles of 15° and 30°, respectively.
4. Thermal Analysis
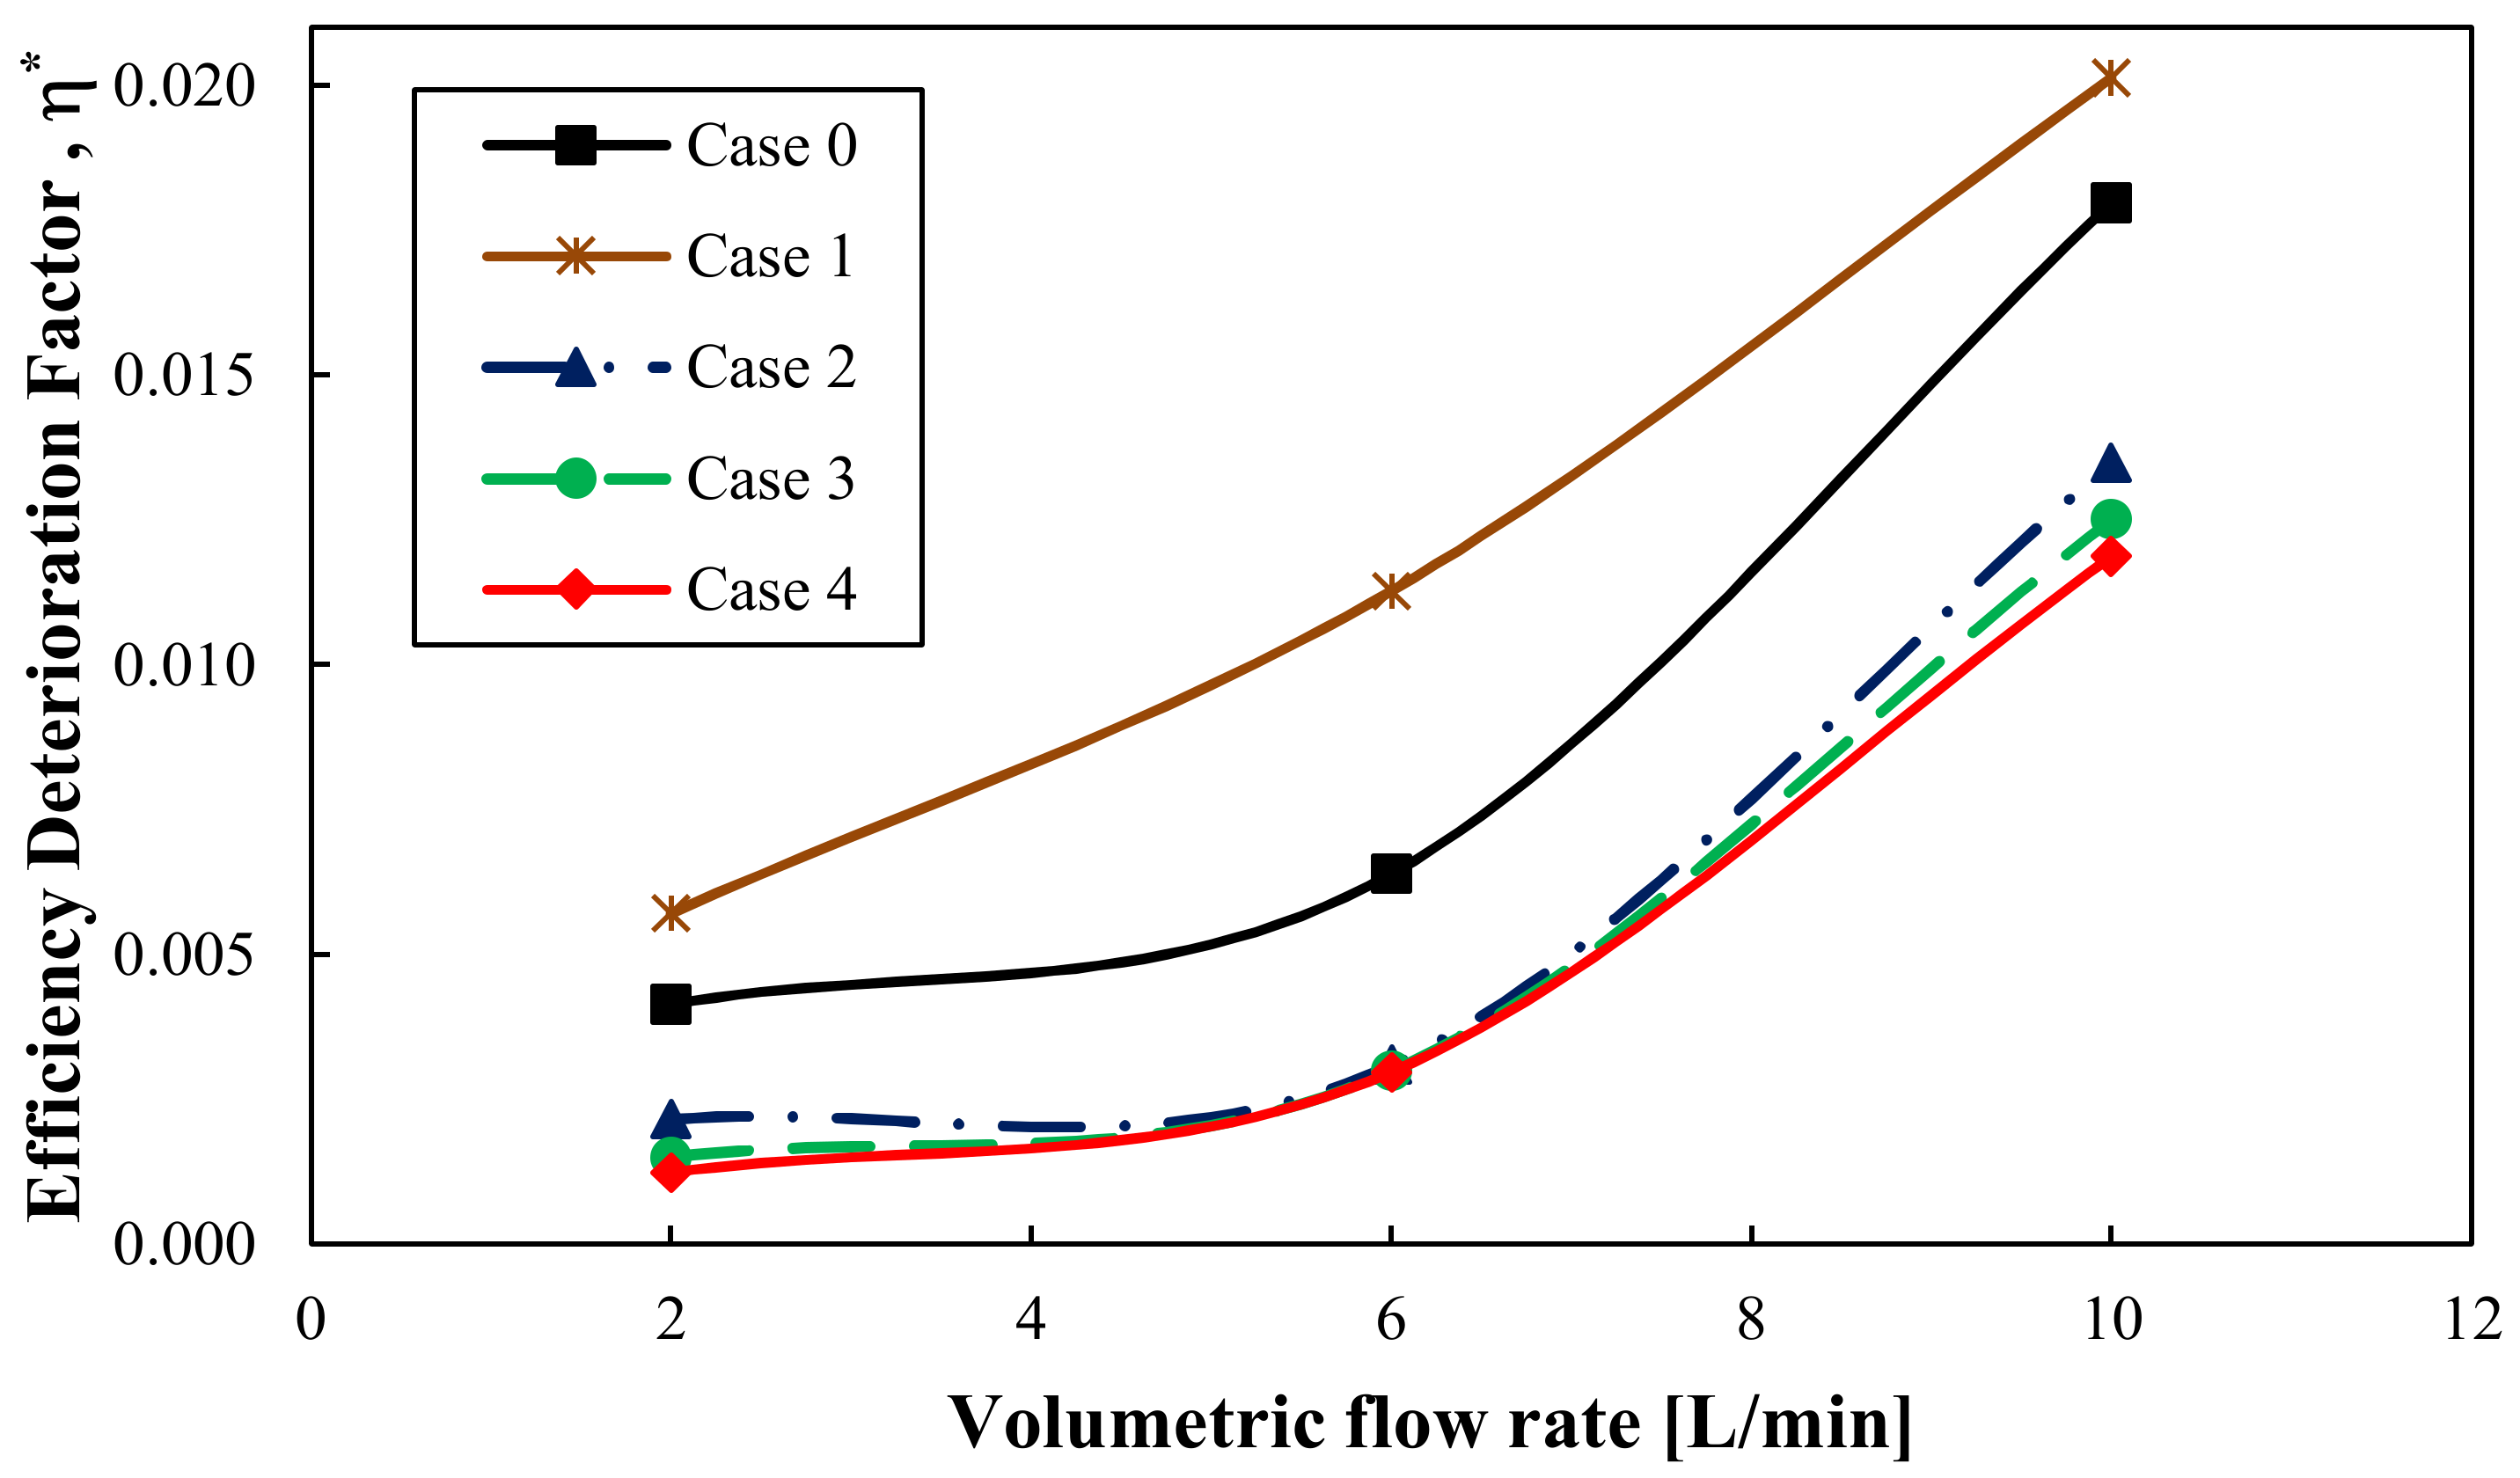
In this section flow distribution effect on solar collector thermal efficiency has been analyzed. Energy equations, (9) and (10) for fluid and solid regions, respectively, have been applied and solved for uniform heat flux boundary condition on absorber plate. Efficiency Deterioration Factor (EDF) has been calculated from Equation (1) to quantify the effect of non-uniformity distribution on thermal efficiency. In the EFD equation values close to zero represent a thermal efficiency closer to thermal efficiency obtained from uniform flow distribution in the risers (ideal condition).
Figure 16 shows the behavior of thermal efficiency deterioration factor for all studied cases (baseline case included). It can be seen that for Case 1 which only has one distribution plate without closed end, the thermal efficiency deterioration factor increases compared with baseline case and hence, a considerable reduction on thermal efficiency is obtained. A thermal efficiency improvement is achieved when closed end distribution plates are used (Cases 2–4), as can be seen in
Table 8. For Cases 3 and 4 there is no considerable improvement in the thermal efficiency due to a similar flow distribution, however,
Table 8 shows that Case 4 gives the best improvement in thermal efficiency for all the flow rates. The order of magnitude of the efficiency deterioration factor is similar to that reported in literature [
17] and an efficiency improvement of 6% is obtained for a volumetric flow rate of 10 L/min with Case 4 (
Table 8). Comparing
Figure 13 and
Figure 16, we can see a strong dependence of the non-uniformity parameter and efficiency deterioration factor; an improvement in the flow distribution implies also an improvement on thermal efficiency.
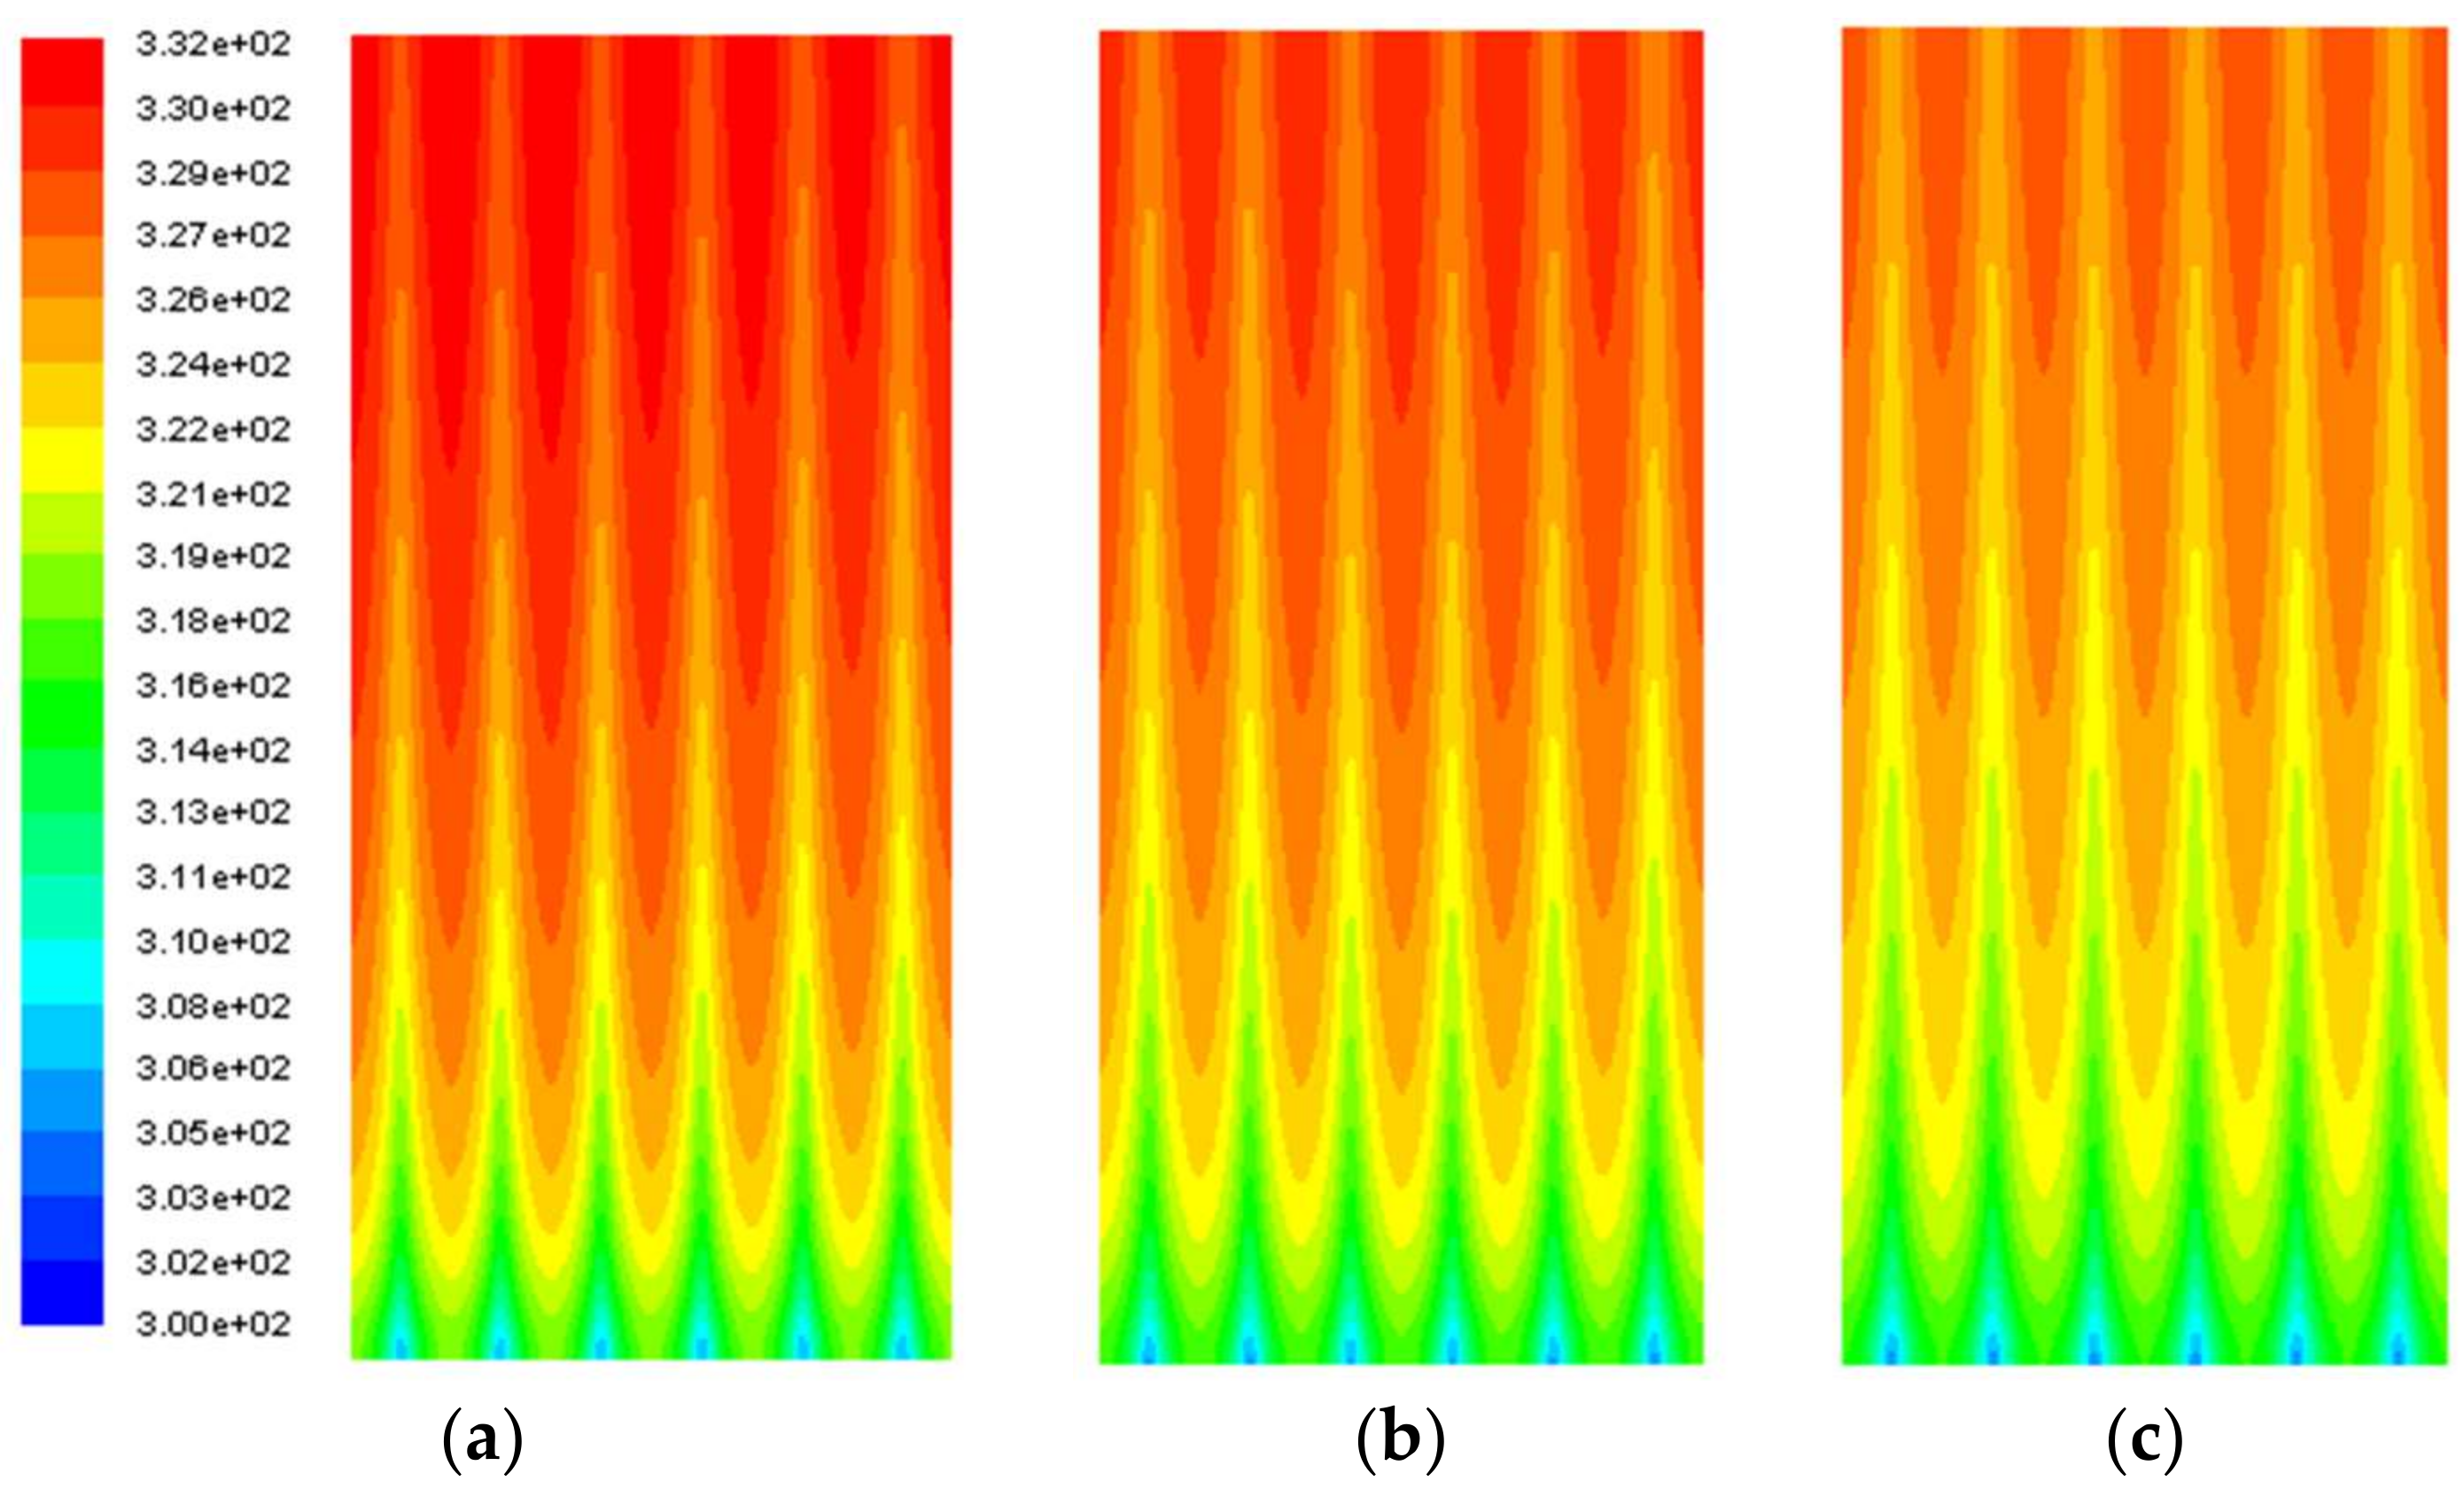
Figure 17 shows that a non-uniform flow distribution produces a non-uniform temperature distribution in the absorber plate. In Case 0, zones with high temperature gradients are obtained in the absorber plate, compared with the uniform flow condition (ideal case); when Case 4 is analyzed, a considerable reduction of high temperature gradients is achieved and this temperature distribution is closer to the uniform flow condition. High temperature gradients can produce a severe impact in the durability of the absorber plate [
17].
5. Conclusions
A numerical analysis on the flow distribution and overall pressure drop has been performed for a flat plate solar collector in which the use of distribution plates was considered inside the manifolds. The effects of applying four different configurations of distribution plates have been analyzed.
The numerical simulations were obtained using the commercial software FLUENT®, whose results present a close agreement with experimental data in laminar flow as well as in turbulent flow.
Analyzing the non-uniformity parameter, it is shown that the use of two distribution plates in both manifolds (Case 4) reduces the flow non-uniformity through the riser tubes about 40% approximately when compared with a normal solar collector operating under the same conditions. Besides, the configuration of Case 4 does not cause a considerable change in the overall pressure drop since it varies around 3% and 2% for tilt angles of 15° and 30°, respectively, which are the recommended tilt angles in Mexico for the highest use of solar energy.
The thermal efficiency when any distribution plates with a closed end are used, is closer to the ideal thermal efficiency (efficiency obtained from uniform flow distribution) and it increases when distribution plates are used in both, the dividing and combining manifolds.
High temperature gradients are obtained in the absorber plate for normal operation, which decreases its durability; a significant reduction of the temperature gradients is obtained with a uniform flow distribution. When distribution plates with a closed end are used, the non-uniformity is reduced and hence zones with high temperature gradients are also reduced.
The use of two distribution plates enhances the flow distribution uniformity through the risers without the need of making significant changes in the geometry of the manifolds in a flat plate solar collector, thus improving the system efficiency.


 ,
, 


