Analysis of Syngas Production from Biogas via the Tri-Reforming Process

Department of Mechanical Engineering, National Chung Hsing University, Taichung City 40227, Taiwan
*
Author to whom correspondence should be addressed.
Energies 2018, 11(5), 1075; https://doi.org/10.3390/en11051075
Submission received: 25 March 2018
/
Revised: 19 April 2018
/
Accepted: 25 April 2018
/
Published: 27 April 2018
(This article belongs to the Special Issue Biofuel and Bioenergy Technology)
Abstract
:The tri-reforming process was employed for syngas production from biogas at elevated pressures in this study. In the tri-reforming process, air and water were added simultaneously as reactants in addition to the main biogas components. The effects of various operating parameters such as pressure, temperature and reactant composition on the reaction performance were studied numerically. From the simulated results, it was found that methane and carbon dioxide conversions can be enhanced and a higher hydrogen/carbon monoxide ratio can be obtained by increasing the amount of air. However, a decreased hydrogen yield could result due to the reverse water–gas shift reaction. A higher level of methane conversion and hydrogen/carbon monoxide ratio can be obtained with increased water addition. However, negative carbon dioxide conversion could result due to the water–gas shift and reverse carbon dioxide methanation reactions. The dry reforming reaction resulting in positive carbon dioxide conversion can only be found at a high reaction temperature. For all cases studied, low or negative carbon dioxide conversion was found because of carbon dioxide production from methane oxidation, water–gas shift, and reverse carbon dioxide methanation reactions. It was found that carbon dioxide conversion can be enhanced in the tri-reforming process by a small amount of added water. It was also found that first-law efficiency increased with increased reaction temperature because of higher hydrogen and carbon monoxide yields. Second-law efficiency was found to decrease with increased temperature because of higher exergy destruction due to a more complete chemical reaction at high temperatures.
1. Introduction
The efficient production of syngas (a mixture of hydrogen and carbon monoxide) is gaining significant attention worldwide as it is a versatile feedstock that can be used to produce a variety of fuels and chemicals, such as methanol, Fischer–Tropsch fuels, H2, and dimethyl ether (DME) [1]. Using CH4 as the primary material, syngas can be produced from steam reforming (SR), partial oxidation (POX), autothermal reforming (ATR), and dry reforming (DR). The tri-reforming (TR) process for syngas production from CH4 has received growing attention because of its technical simplicity and flexible operation [2,3,4,5]. In the TR process, the syngas is produced by combining SR, DR, and POX in a single step. The TR process was proposed originally for syngas production from power plant flue gas [6,7]. There are several advantages for syngas production from the TR process. As CO2 is one of the reactants, there is no need for CO2 separation from the flue gas [6,7]. The H2/CO ratio in syngas can be altered by adjusting the relative amounts of the reactants. In addition, the presence of H2O and O2 in the feedstock helps to mitigate carbon deposition, and catalyst deactivation can be prevented [8,9].
As fossil energy resources reduce sharply and environmental pollution becomes more serious, searching for new materials for syngas production plays an important role in future energy development [10,11,12]. Biogas is receiving much attention because of its considerable economic and environmental benefits [13]. The biogas composition is related to the starting substrate, but is basically composed of CH4 and CO2 with the volume ratio of 2 [14,15,16]. Both CH4 and CO2 are regarded as major greenhouse gases (GHGs), which pose a serious threat to the global climate and environment. Using biogas for syngas production, both CH4 and CO2 emissions into the atmosphere can be reduced. Because of its potential for reducing global warming, further understanding of syngas production from biogas is essential. Moreover, syngas can also be used for H2 production. In this case, H2 can be enriched via the water–gas shift reaction using syngas and H2O as feedstock. Among the various alternative energy forms, hydrogen is considered an important energy carrier in the future [17]. It is also an important raw material in the chemical industry and can be used as a fuel in fuel cells to produce electrical energy. For reasons of sustainability, the use of renewable fuel sources such as biogas or biomass for hydrogen production has received considerable attention [18,19,20].
Several studies have reported on syngas production from biogas via the TR process experimentally. In the study of Vita et al. [21], tri-reforming simulated biogas over a Ni/ceria based catalysts was carried out and the H2O/CH4 and O2/CH4 molar ratios, reaction temperature, and nickel content effects on the catalyst’s performance were studied. They found that the H2/CO ratio could be flexibly adjusted using added amounts of oxygen and steam in order to meet the requirements of downstream processes. In the study of Lau et al. [22], biogas was used as the fuel source in dry reforming and combined dry/oxidative reforming reactions. The gas stream temperature and reactor space velocity effects were examined experimentally. Their results indicated that an increase in the O2/CH4 ratio at low temperature promotes hydrogen production. In dry/oxidative reforming, they found that biogas dry reforming is dominant and the overall reaction is net endothermic when the reaction temperature is higher than 600 °C. In the study of Zhu et al. [23], biogas reforming with added O2 through a spark-shade plasma was conducted under an O2/ CH4 ratio of 0.60 and CO2/CH4 ratios ranging from 0.17 to 1.00. Their results indicated that O2 and CH4 conversions decreased when the CO2/CH4 ratio was increased. They also reported that the partial oxidation of methane contributed mostly to CH4 conversion and the reverse water–gas shift (WGS) reaction dominated in CO2 conversion.
In addition to experimental work, several numerical TR process models using biogas as the feedstock have also been reported in the literature. In the study of Corigliano and Fragiacomo [24], biogas dry reforming analysis under various operating conditions was carried out using a numerical model. The CO2/CH4 ratio, pressure and temperature effects on reaction performance were reported. In the study of Hernández and Martín [25], a process based on mass and energy balances, chemical and phase equilibria, and rules of thumb was developed to optimize the production of methanol using biogas as the raw material. Based on the production cost and carbon footprint, the optimized CH4/CO2 ratio contained in the biogas was found. In the study of Hajjaji et al. [26], a H2 production system via biogas reforming was investigated using life-cycle assessment (LCA). They found that the total GHG emissions from the system were about half of the life-cycle GHG of conventional H2 production systems via steam methane reforming. In the study of Zhang et al. [27], the effects of various factors including reaction temperature, reactor pressure and CH4 flow rate on the syngas compositions obtained from the TR process were investigated numerically. An optimum operating condition for syngas production with a target ratio and maximized CO2 conversion were obtained.
In this work, the TR process is employed for syngas production using biogas as the feedstock. The effects of various operating conditions such as pressure, temperature, biogas composition, air addition, and H2O additions are investigated. The novelty of this paper is the focus on CO2 conversion in the TR process, which is seldom reported in the literature. Air is used as the added reactant in this study instead of pure oxygen in the conventional TR process.
2. Modeling
2.1. Chemical Reaction
The following reactions are coupled and carried out in a single reactor in the TR porcess:
Steam reforming (SR):
Dry reforming (DR):
Partial oxidation (POX):
As shown in Equations (1)–(3), the TR process combines the endothermic SR and DR reactions and the exothermic POX reaction. The heat released from POX is used as the heat supply for SR and DR and makes the TR process energy efficient [28]. As noted by Cho et al. [29], the chemical reactions involved in the TR process can be alternatively described using Equation (1) along with the following reactions:
Reverse CO2 methanation (RCM):
Water-gas shift (WGS):
Complete oxidation of methane (COM):
Note that with the chemical reactions described in Equations (1) and (4)–(6), the TR process becomes the well-known catalytic partial oxidation of methane (CPOM). In the literature, there are many studies devoted to the analysis of kinetic mechanisms for CPOM [30,31]. Similar to other reforming process of CH4, many reactions are likely to occur in the TR process. In addition to the study of Cho et al. [29], studies of De Groote and Froment [32], Scognamiglio et al. [33], Chan and Wang [34], and Izquierdo et al. [35] also reported that the reaction mechanism of CPOM is indirect in which the process can be described by combining reactions of methane oxidation, methane–steam reforming, and water–gas shift. According to these studies, reactions such as CO oxidation, H2 oxidation, and the Boudouard reaction were not included.
Equations (1), (4) and (5) are the reactions involved in the conventional SR reaction. In this study, syngas under high pressure is of interest for further fuel synthesis. The kinetic model for the SR reaction over a nickel catalyst given by Xu and Froment [36] is adopted,
SR:
WGS:
RCM:
For COM, the kinetic model of Trimm and Lam [37] is adopted in this study,
COM:
Equation (11) was derived over Pt-based catalyst support, while the model adsorption parameters are adjusted for a Ni-based catalyst [38]. In Equations (7)–(11), is the reaction rate for SR (i = 1), WGS (i = 2), RCM (i = 3), and COM (i = 4); and are the chemical equilibrium constant and rate constant for reaction i (i = 1,2,3,4); (j = CH4, CO2, H2O, H2, and CO) is the partial pressure of species j; and and are the adsorption constants of species j. All of these kinetic parameters are given in the Arrhenius function type and are functions of temperature, and can be found in the literature [36,37]. It is noted that catalyst deactivation due to the thermal effect and carbon deposition is neglected in this study [39]. For a reforming reaction involving CH4, carbon formation is inevitable. The carbon deposition on the catalyst surface is one of the reasons that causes catalyst deactivation. In the tri-reforming process, the appearances of O2 and H2O may suppress carbon formation [40,41]. Therefore, catalyst deactivation due to carbon deposition on the catalyst surface is neglected in this study.
2.2. Process Simulation
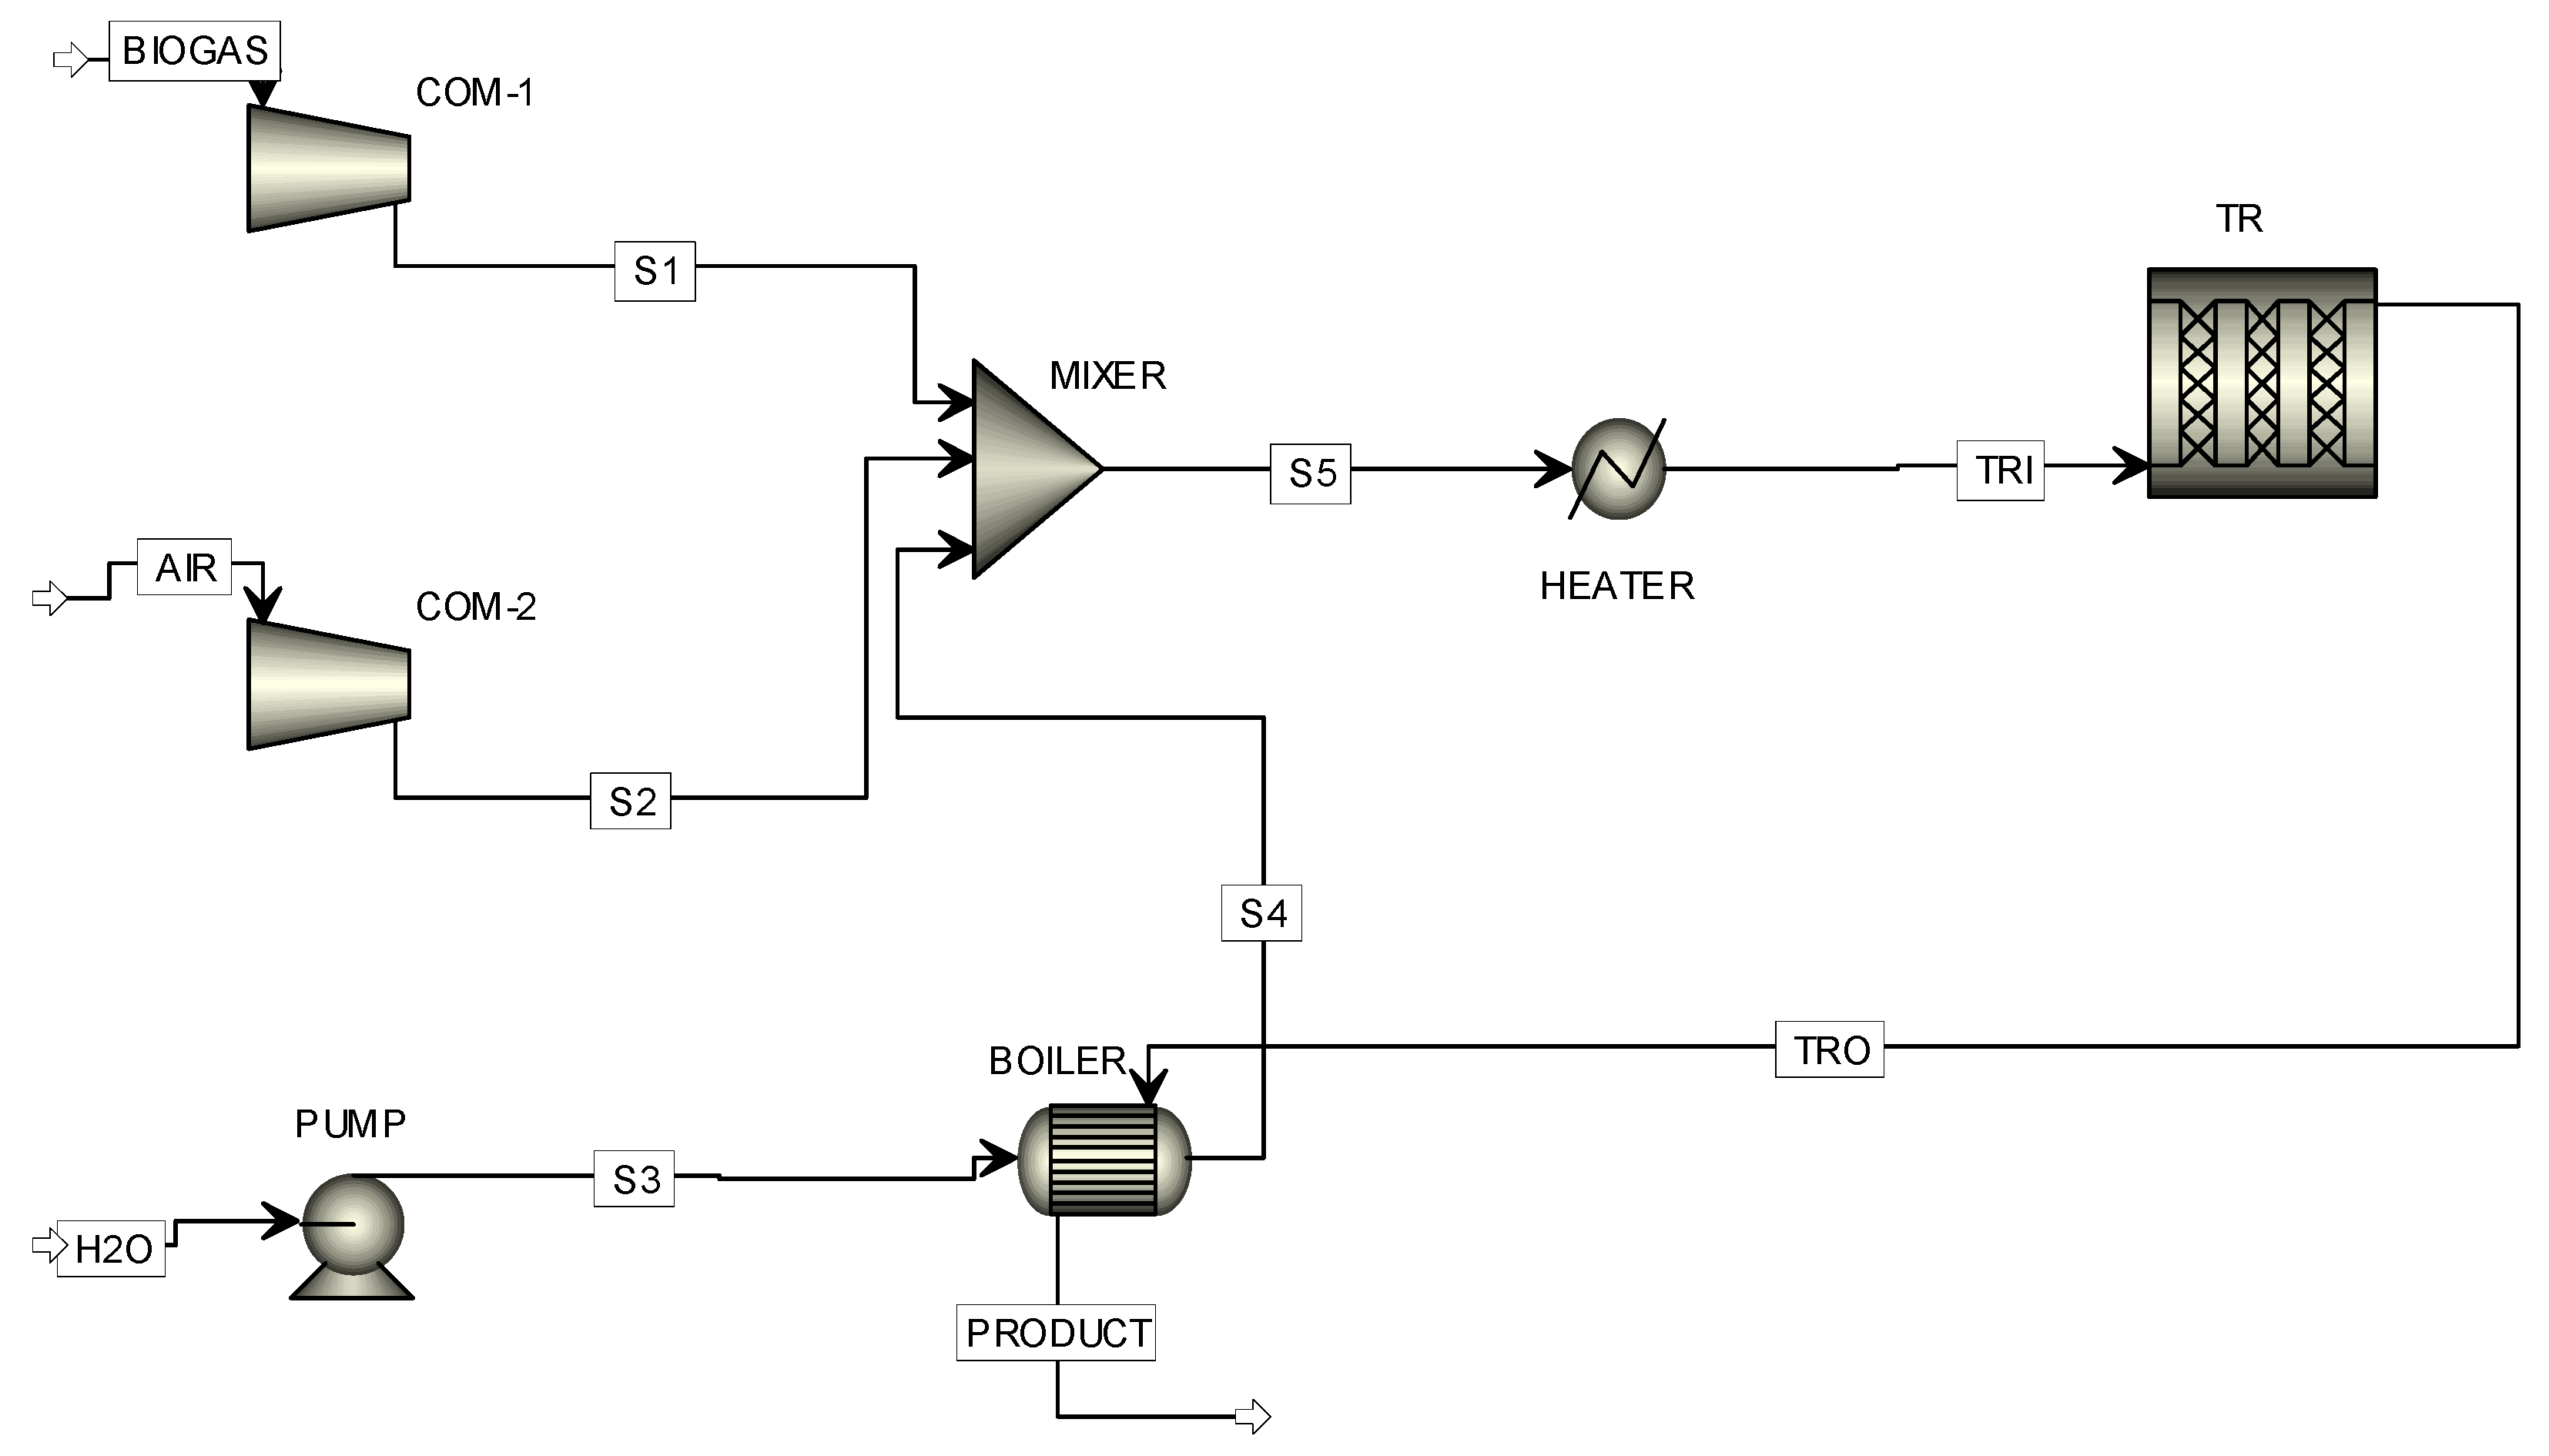
In this study, Aspen Plus (v.10) is employed to carry out the TR process using biogas as the feedstock. The flow process is depicted in Figure 1. The simulation is performed for a steady state. The biogas stream is assumed to be purely composed of CH4 and CO2 with the designated molar ratio. The air stream is composed of 21% O2, 78% N2, and 1% H2. The purpose of H2 addition is to avoid the singularity in chemical reaction rate computation. A 1% H2 addition is determined through sensitivity analysis [42,43]. In order to produce high-pressure syngas for future use in fuel synthesis, two compressors (COM-1 and COM-2) are used to increase the biogas and air pressures. In the H2O stream, a pump is used to increase the water pressure and it is then superheated in a boiler with heat supplied from the high-temperature product stream. After mixing in a mixer, the reactant mixture (TRI) is heated to a certain temperature before entering the insulated Rplug reactor (TR). The gas mixture from the reactor (TRO) is sent to the boiler where the heat is recovered for superheating the water. The TR process performance is characterized using the following dimensionless groups,
CH4 and CO2 conversions:
H2 yield:
CO yield:
H2/CO ratio:
where is the molar flow rate of the i-th species supplied to the process; and is the molar flow rate of the i-th species at reactor outlet. Based on these definitions, CH4 conversion is the ratio of the CH4 consumption rate to the fed CH4 flow rate at the reactor inlet. Similarly, CO2 conversion is the ratio of the CO2 consumption rate to the fed CO2 flow rate at the reactor inlet. The H2 and CO yields are defined as the net increased amounts of H2 and CO from the reaction per fed CH4 flow rate. The H2/CO ratio is defined as the ratio of H2 yield to CO yield. Note that all these variables are dimensionless.
In addition to the reactant conversion and product yield, energy and exergy analyses based on the resulting product stream flowing out of the TR reactor are also carried out. For the chemical reaction, there are several ways to define the first- and second-law efficiencies [44,45]. Since the objective of the TR process is to convert biogas into syngas, and noting that CO2 has zero low heating value (LHV), the first-law efficiency is then defined as,
where (i = comp, pump) and are the input work and heat input, respectively. The main heat input occurs at the heater at which the mixed reactant is heated to a certain inlet temperature. The exergetic analysis is carried out by considering three exergy transfers:
Exergy due to work:
Exergy due to heat transfer:
Exergy due to mass flow:
In these equations, the subscript 0 denotes the reference state (25 °C and 1 atm). The exergy due to mass flow is contributed by physical exergy, chemical exergy and mixing exergy as shown on the right-hand side of Equation (19). For second-law efficiency, this is generally defined as the ratio of exergy recovered to the exergy supplied,
where and are the exergies supplied to and recovered from the system, respectively. Based on Figure 1, and are expressed as,
3. Results and Discussion
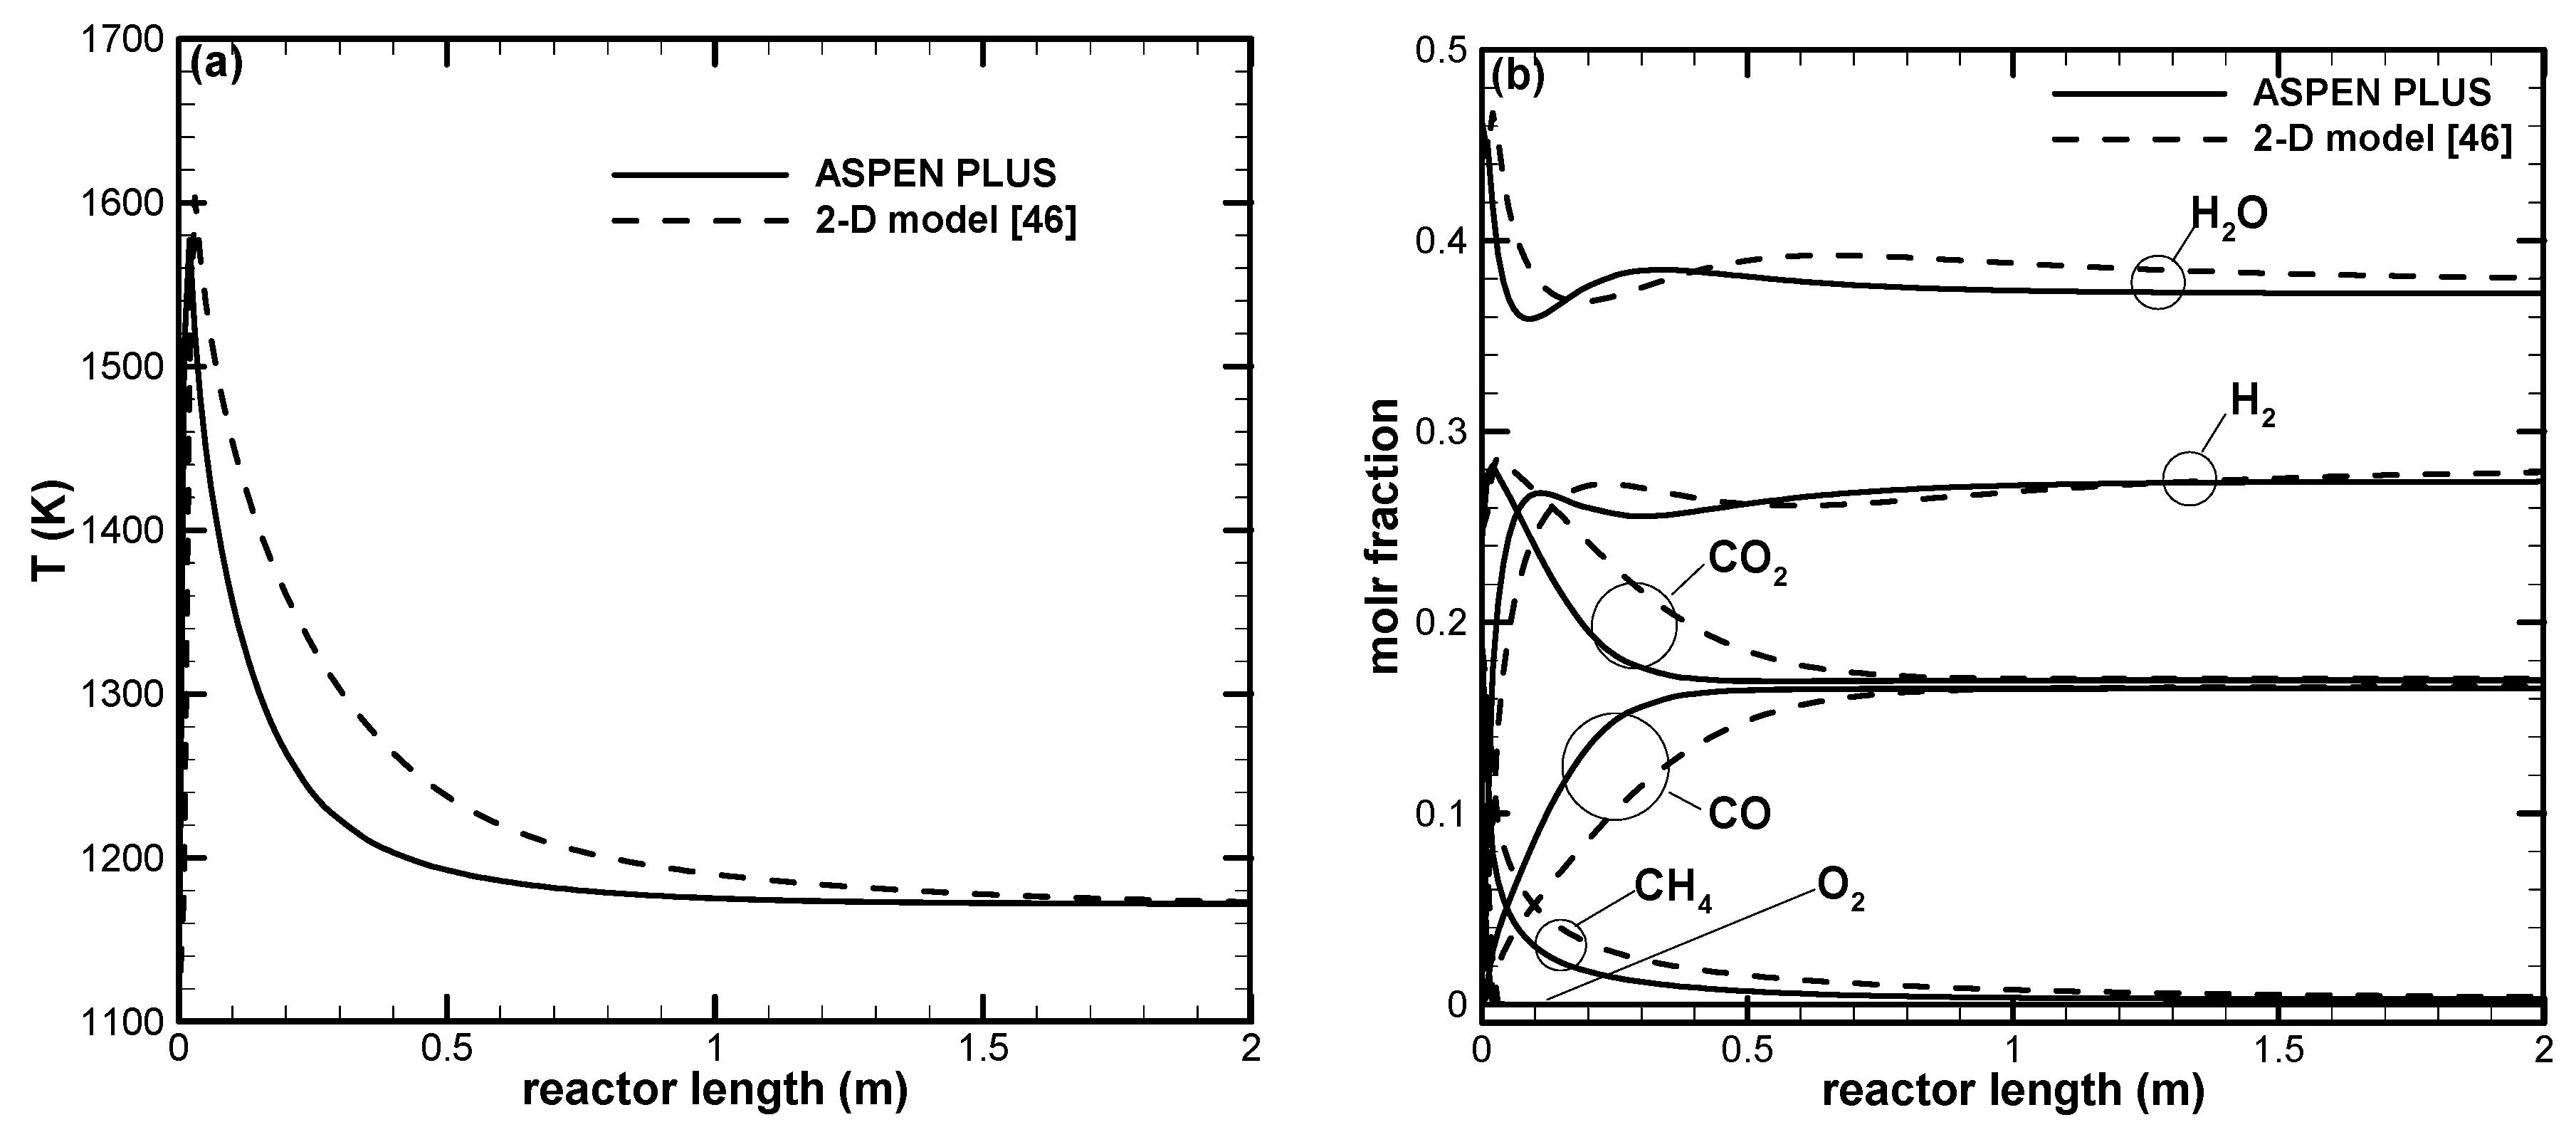
The TR process using biogas as the feedstock is similar to the tri-reforming of methane (TRM). The only difference is the CH4 and CO2 composition. We developed this work from our previous study [46] and focused on using biogas as the feedstock. To verify the correctness of the model built in Aspen Plus, the TRM using the reactor geometry and reactant composition reported in the studies of Chein et al. [46] and Arab Aboosadi et al. [47] was carried out using the built model in Aspen Plus. Figure 2 shows the comparison between the temperature and gas species distributions predicted from a two-dimensional model [46] and from a model built in Aspen Plus. As shown in Figure 2, the agreements for both temperature distribution shown in Figure 2a and species mole fractions shown in Figure 2b are quite good at the reactor downstream. The discrepancies in the region near the reactor inlet zone is believed due to the difference between one- and two-dimensional modeling. Since the TR process performance is evaluated using results at the reactor outlet, good agreement between one- and two-dimensional results is expected. In addition to the comparisons between numerical models, experimental verification of the numerical model was given in our previous study [46]. Also note that O2 is consumed rapidly as it enters the reactor shown in Figure 2b. That is, there will be no O2 available for oxidation of CO or H2 in the downstream of the reactor.
Based on the comparisons discussed above, the model built in Aspen Plus can be correctly extended to the TR process using biogas as the feedstock. The base operating conditions are listed in Table 1. The parameters listed in Table 1 are adopted from our previous study except for the feedstock composition and total volumetric flow rate [46]. The molar ratio of the reactants are chosen as CH4:CO2:Air:H2O = 1:0.5:2:1 and the volume flow rate is fixed as 0.0723 L/min. As compared with the previous study [46], a higher volume flow is used in this study because of the presence of N2 in the air. For economy, air is added instead of pure oxygen. The advantage of this is to avoid the cost of oxygen separation from air, but this obviously results in increased reactor volume. In the following, the TR process performance is examined using reactant inlet temperature Tin as the primary parameter. The effects of various pressures, catalyst weight/volume flow rate (W/F) ratios, CO2/CH4 ratio in biogas, amounts of air and H2O on TR process performance are discussed.
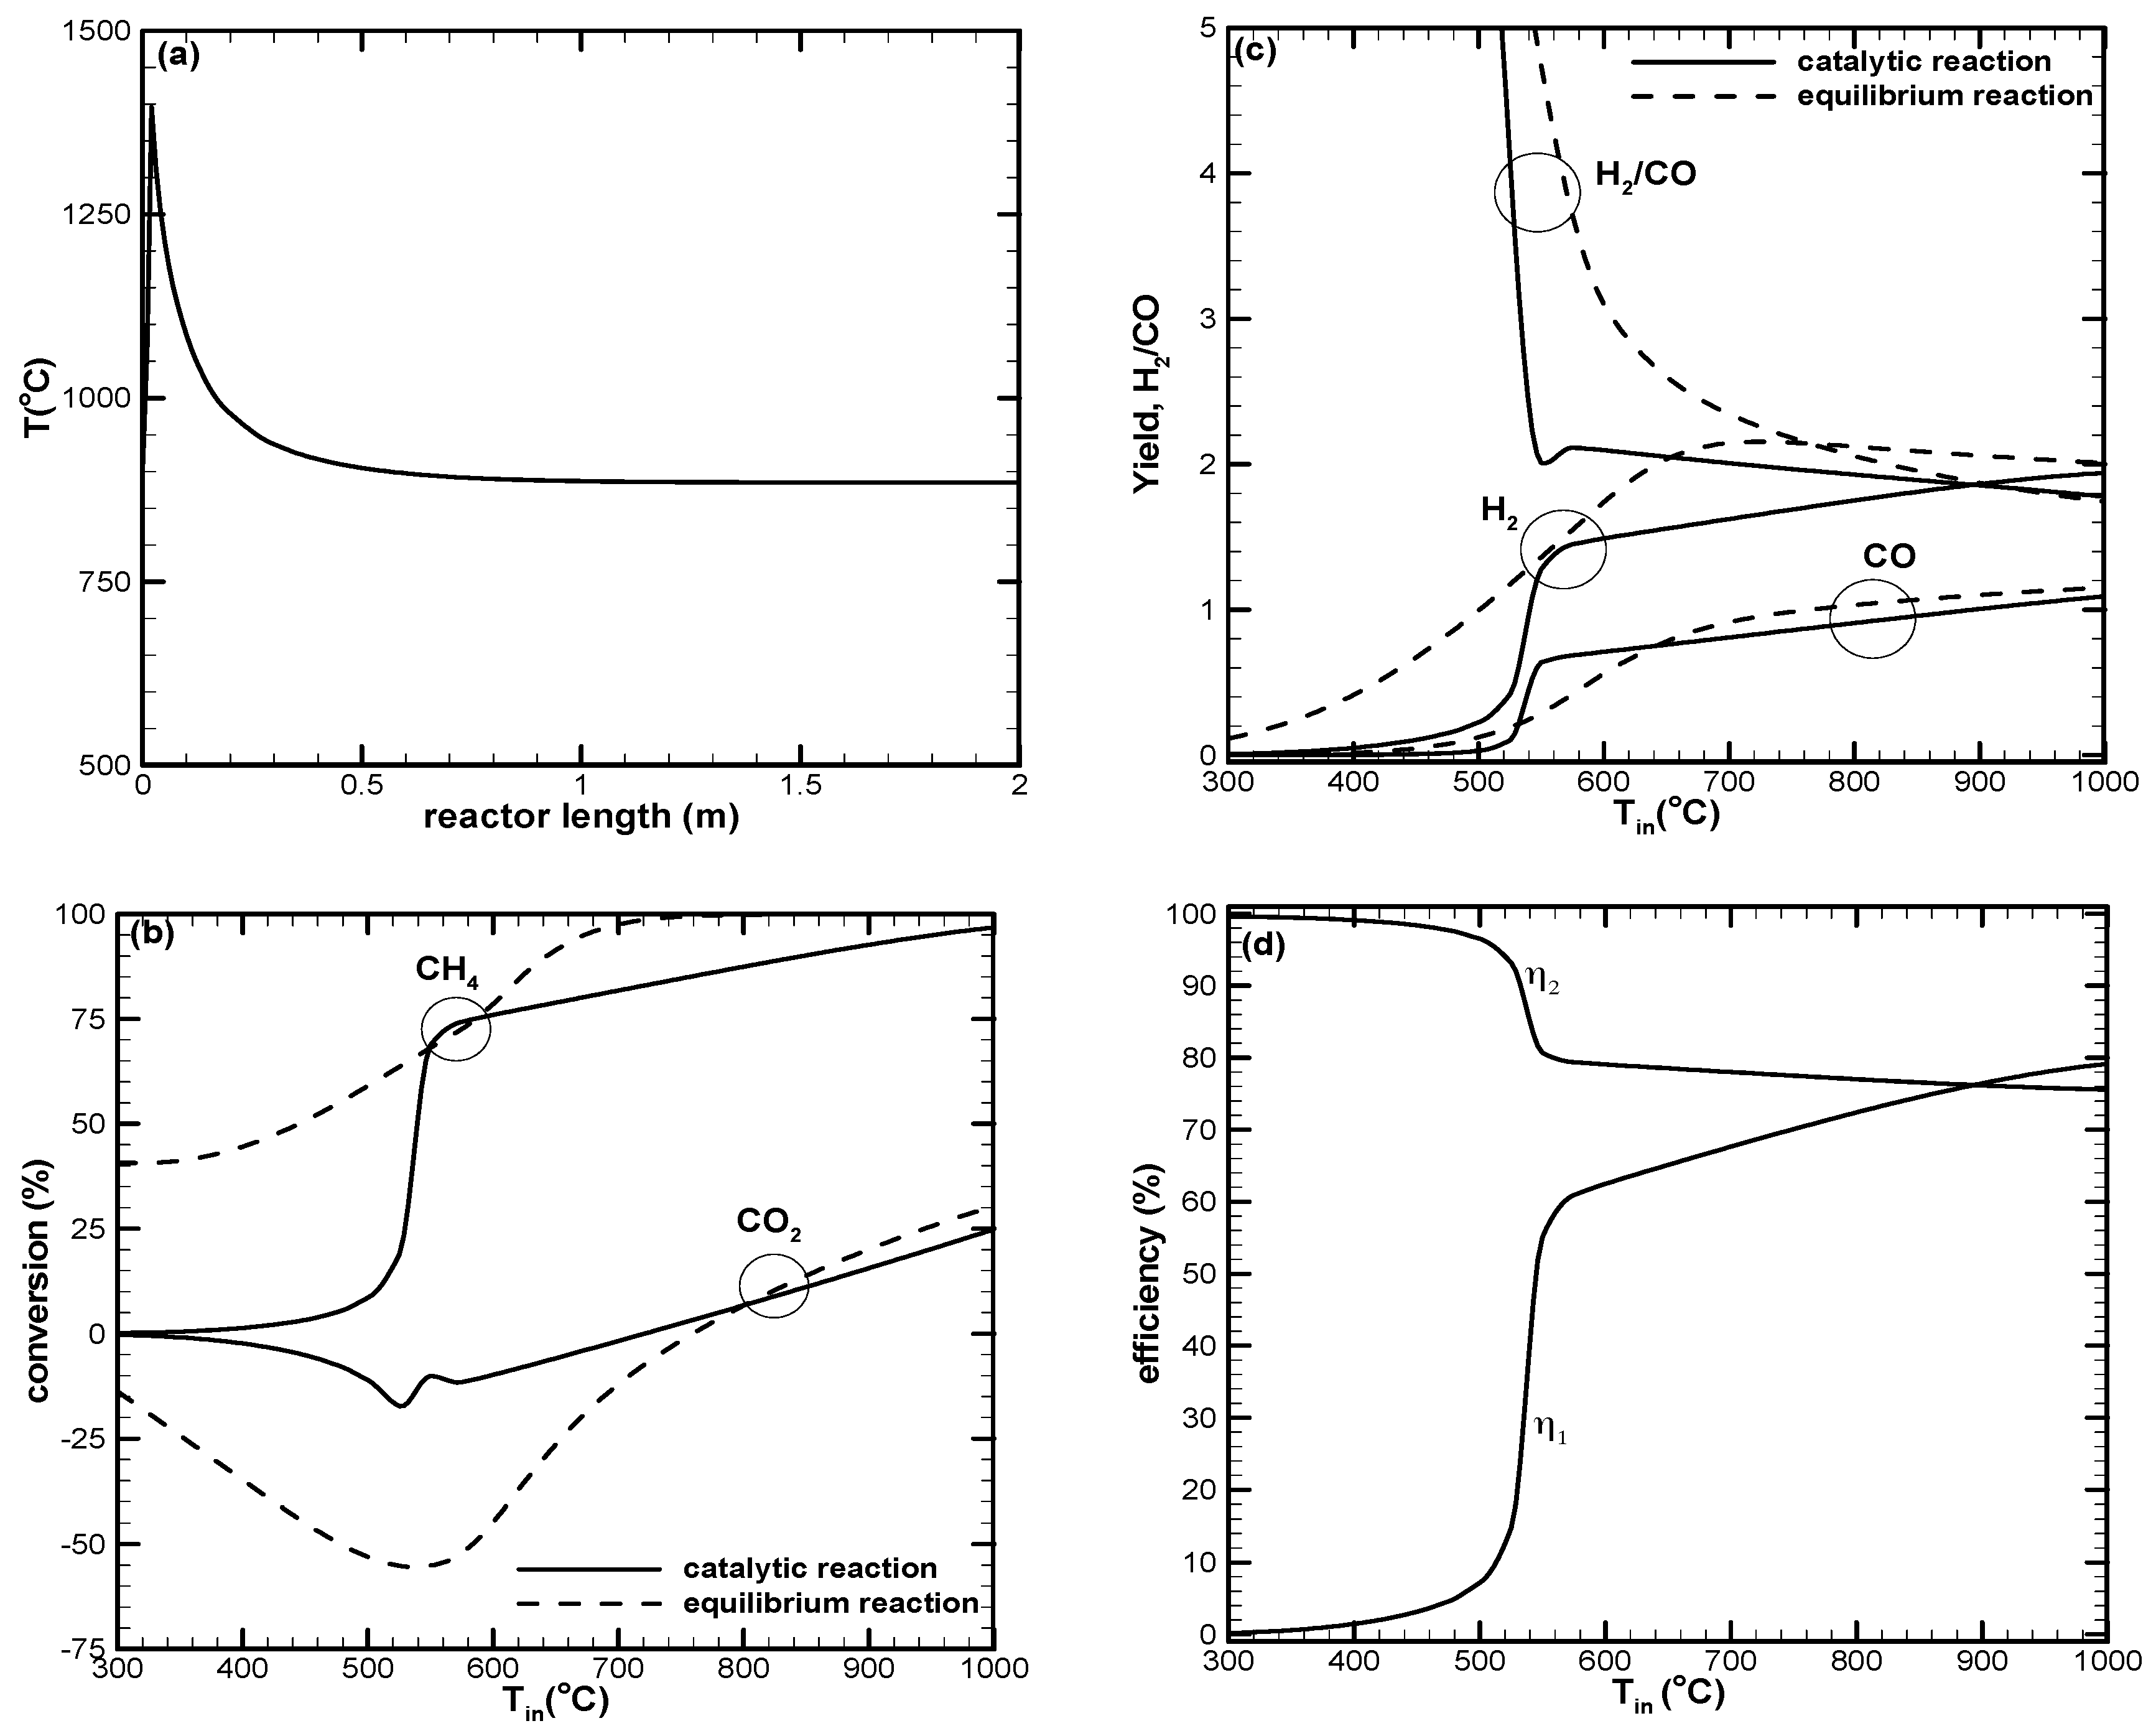
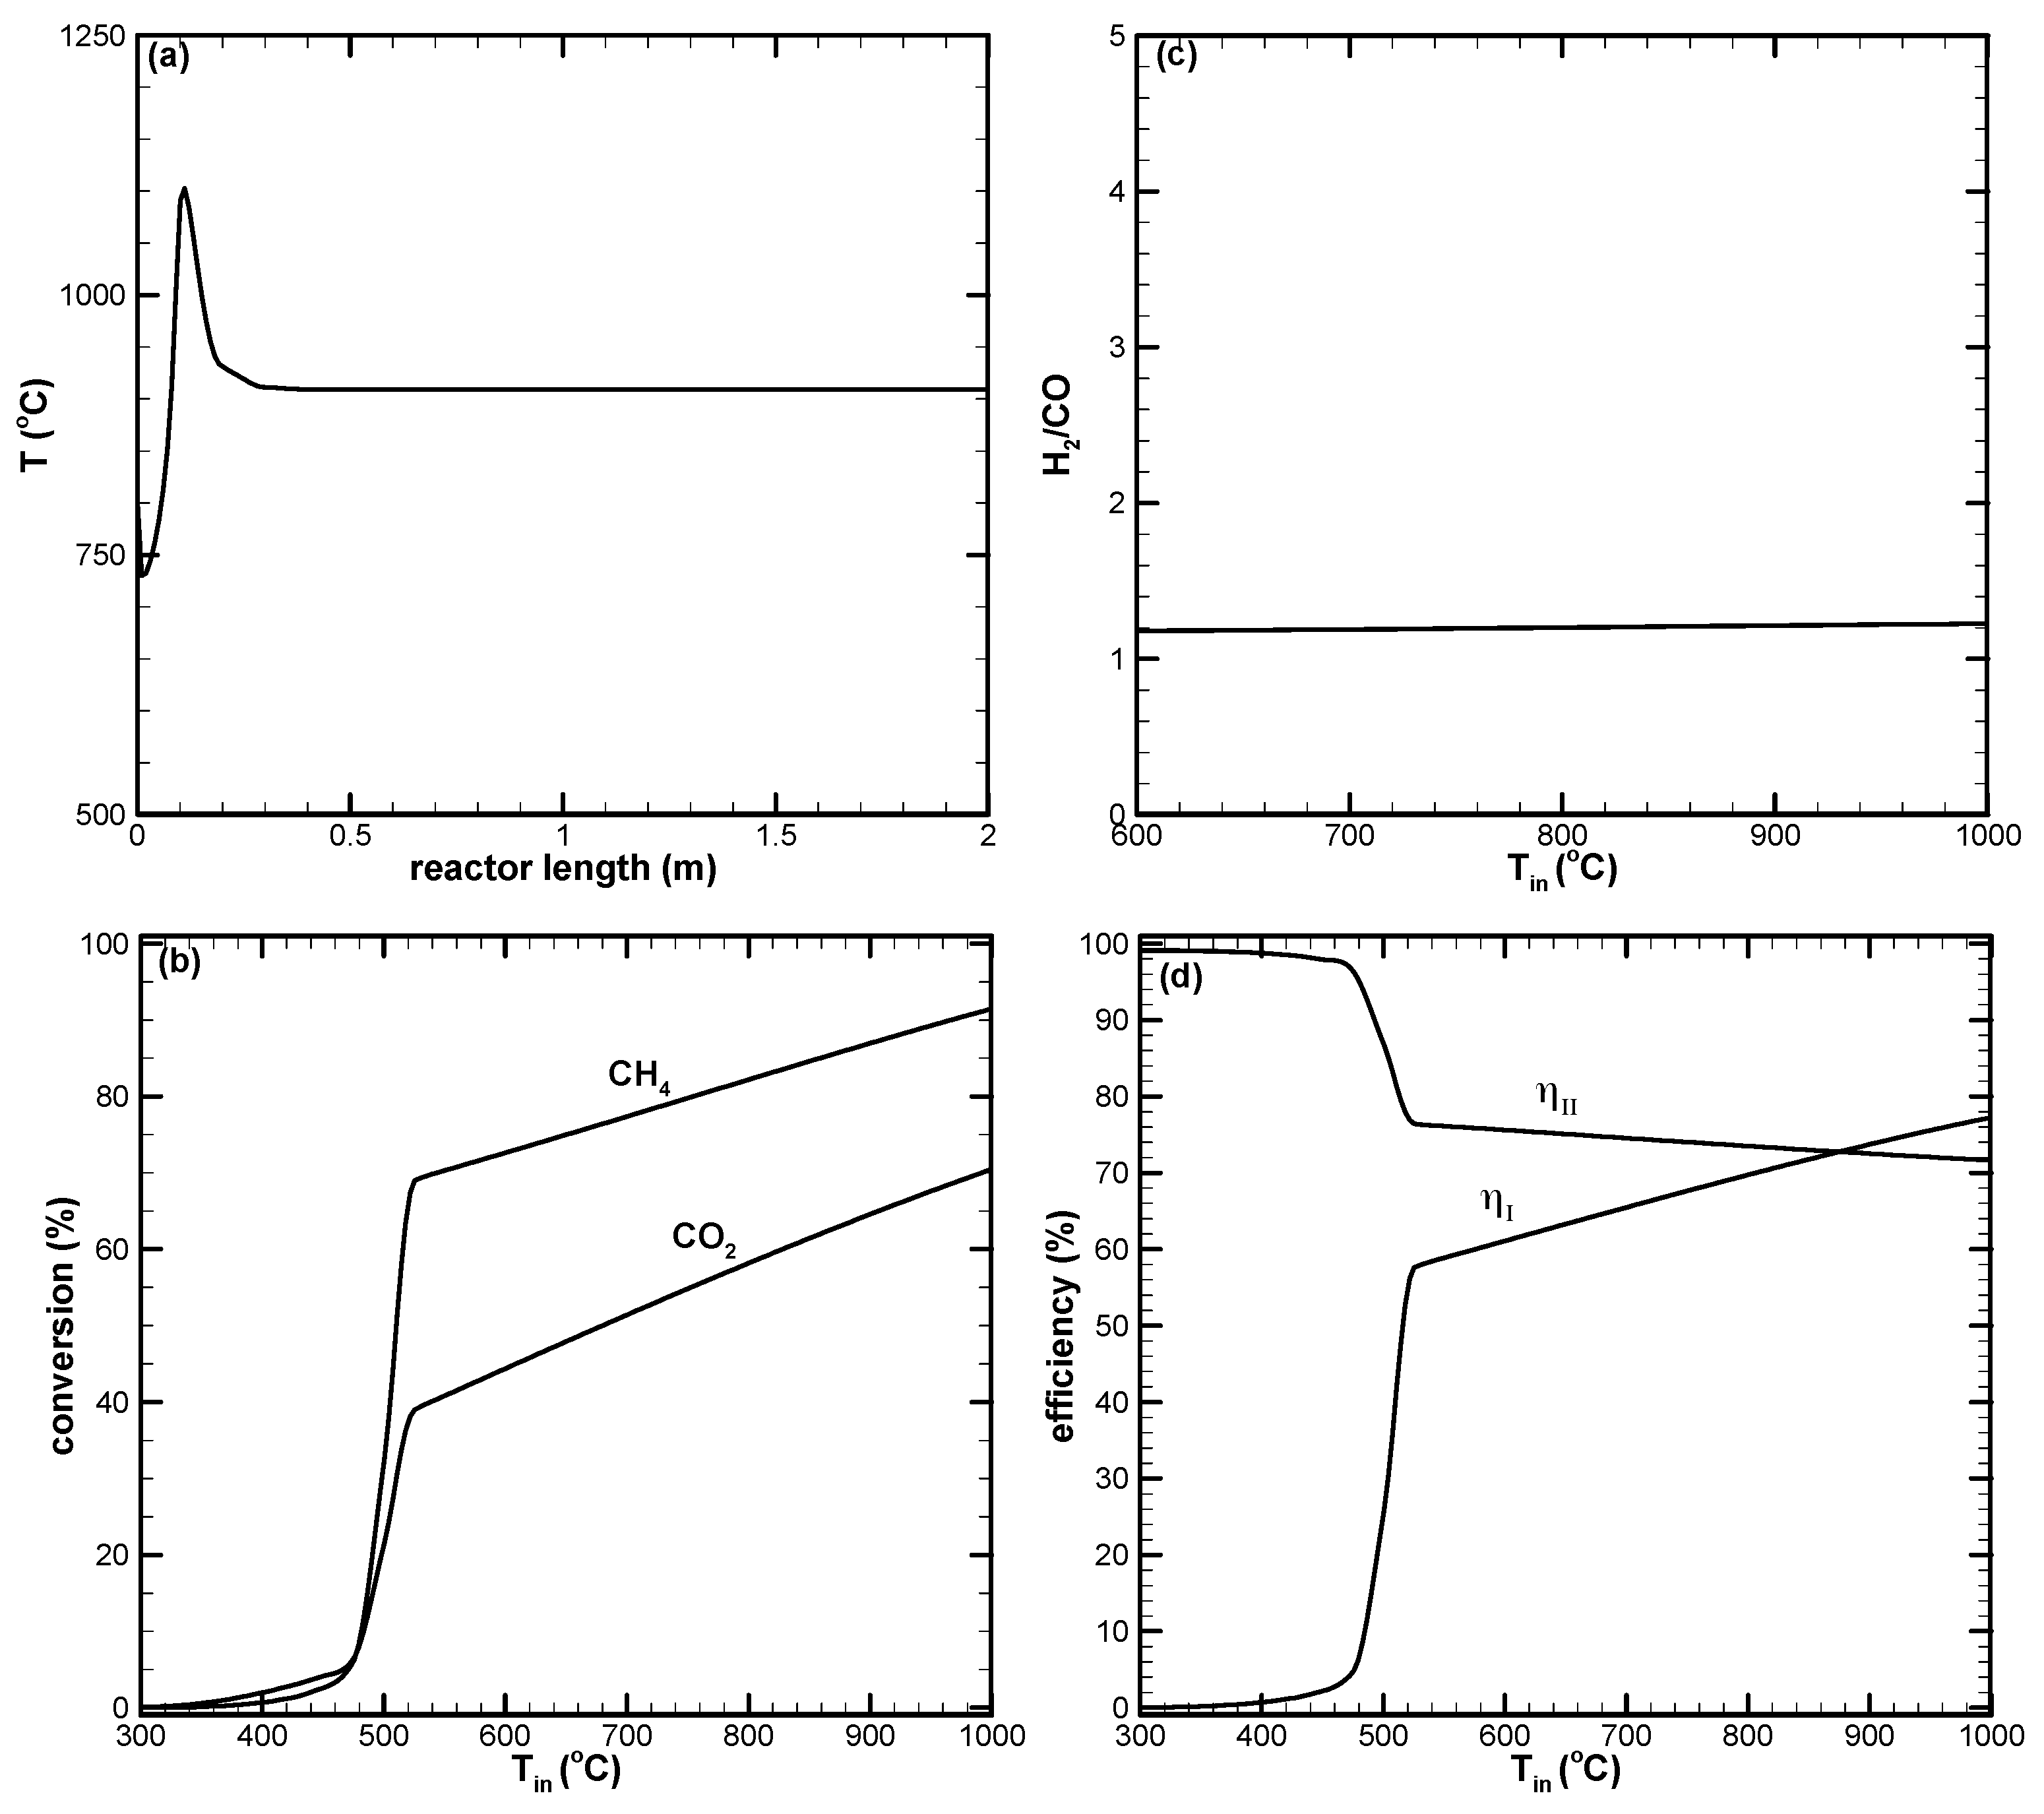
Figure 3 shows the TR process performance using the base operations listed in Table 1. In Figure 3a the temperature variation along the reactor length for Tin = 900 °C is shown. Due to the methane oxidation reaction, the maximum temperature occurs in the near entrance region. The energy produced from methane oxidation is used for steam reforming and dry reforming in the reactor downstream. This causes the temperature to decrease along the reactor length. The CH4 and CO2 conversions are shown in Figure 3b. The abrupt increase in CH4 conversion occurs at Tin = 550 °C. This indicates that Tin should be higher than 550 °C in order to activate the catalyst. With temperature higher than 550 °C, CH4 conversion increases gradually with increased Tin. In Figure 3b, negative CO2 conversion results for the low Tin regime. From the TR process chemical reactions, CO2 is produced by the methane oxidation and WGS reactions and consumed by the dry reforming reaction. For low Tin, the WGS reaction is dominated and CO2 consumption by DR is low. This results in negative CO2 conversion. However, positive CO2 conversion can result when Tin becomes higher than 700 °C, indicating that DR is active. DR contributes to increase the H2 and CO yield in the high Tin regime. Figure 3b also indicates that a complex interaction between CO2 consumption and production reactions occurs for Tin in the 500~600 °C range. The conversions of CH4 and CO2 from an equilibrium TR process obtained from an Aspen Plus simulation are also shown in Figure 3b using the parameters listed in Table 1. Since the results from the equilibrium process can be regarded as the theoretical limit of the reaction, it can be seen that CH4 conversion from the catalytic reaction is lower than that from the equilibrium reaction. Due to more CO2 production, lower CO2 conversion results from the equilibrium reaction. For Tin higher than 800 °C, CO2 conversion from the equilibrium reaction is higher than that from the catalytic reaction. From Figure 3c, the H2 yield, CO yield and H2/CO ratio are shown. It can be seen that when Tin is lower than 500 °C, the H2 and CO yields are very low due to inactive catalytic reactions at low temperatures. In this low Tin regime, CO yield is much lower than H2 yield and results in a high H2/CO ratio. As Tin is higher than 550 °C, the H2/CO ratio decreases with Tin slowly with a value close to 2. The decrease in H2/CO with Tin is due to increased CO production from the DR reaction while H2 decreases due to the reverse WGS reaction. In Figure 3d, the H2 yield, CO yield, and H2/CO ratio from the equilibrium TR process are also shown. As with conversions of CH4 and CO2 shown in Figure 3b, both yields of H2 and CO from the catalytic reaction are lower than the equilibrium reaction. At high temperature, the H2/CO ratio from both equilibrium and catalytic reactions is about the same. In Figure 3d, the first- and second-law efficiencies are shown. Based on Equation (16), the first-law efficiency depends on the H2 and CO yields. Because of higher H2 and CO yields at higher Tin, ηI increases with increased Tin. However, the variation in ηII is opposite that of ηI. Increased Tin implies that the chemical reaction is more complete towards the product side. Since the chemical reaction is a highly irreversible process, high exergy destruction due to the chemical reaction is expected. This results in decreased ηII as Tin increases. For the low Tin regime, exergy destruction due to the chemical reaction is low because of low catalytic activity. Moreover, the contributions of exergy destruction from compressors, pump, heaters and mixers are small. This leads to high ηII in the low Tin regime.
In Figure 4, the variation of species mole fraction of the TR process using the base operation conditions listed in Table 1 is shown. It can be seen that significant mole fraction variation can be found when Tin is higher than 500 °C. The mole fractions of reactants (CH4, CO2, H2O, O2, and N2) decrease while the mole fractions of products (CO and H2) increase as Tin increases. Due to a highly active methane oxidation reaction, O2 is consumed completely when Tin is greater than 550 °C. Also note that the variation trend of mole fractions of CO and H2 are similar to the yields of CO and H2 presented in Figure 3c. The yields of H2 and CO are used to characterize the TR process performance in this study.
In the following, parametric studies based on the base operation conditions listed in Table 1 are carried out. As listed in Table 1, the inlet temperature of the reactant is the primary parameter and the amount of CH4 fed is used as the reference for the species contained in the reactant and product. The catalyst weight (W) is varied from 0.025 g to 2.5 g; the operation pressure (P) is varied from 10 to 30 atm; the air/CH4 ratio is varied from 1 to 3; H2O/CH4 is varied from 1 to 3; and CO2/CH4 is varied from 0.25 to 0.75.
In Figure 5 the effect of W/F ratios on the TR process is examined. The results shown in Figure 4 were obtained by varying the catalyst weight, while other parameters listed in Table 1 were kept fixed. That is, higher W/F ratio results when the catalyst weight is increased. As shown in Figure 5a, a higher temperature along the reactor length is obtained for the W/F = 0.00576 ghL−1 case. This indicates that a smaller amount of energy released from methane oxidation reaction is used for endothermic SR and DR reactions. For W/F = 0.0576 and 0.576 ghL−1 cases, temperature variations are identical at the reactor downstream. That is, there is a limiting W/F ratio for the reaction. Increasing the W/F ratio (either increasing catalyst weight or decreasing reactant volumetric flow rate) may not lead to further improved reaction performance. In Figure 5b, CH4 and CO2 conversions are shown. Due to low catalyst activity, CH4 conversion is low when Tin is low. It can be seen that the Tin at which CH4 conversion abruptly increases can be decreased by increasing the W/F ratio. That is, the catalyst activation temperature can be lowered with increased W/F ratio. As shown in Figure 5b, the Tin at which CH4 conversion increases abruptly are 700 °C, 500 °C and 400 °C for W/F = 0.00576, 0.0576, and 0.576 gLh−1, respectively. CH4 conversions for the W/F = 0.0576 and 0.576 gLh−1 cases become identical when Tin is higher than 550 °C. As discussed above, limited performance results when the W/F ratio is increased. From Figure 5b, CO2 conversion has a negative value except in the high Tin regime. This is due to CO2 formation in the methane oxidation and WGS reactions while DR is less active. At high temperatures, CO2 is consumed via the dry reforming reaction, leading to positive CO2 conversion. In Figure 5c, the H2/CO ratios for various W/F ratios are shown. It can be seen that H2/CO ratio is about the same for the three W/F ratios studied when Tin is high. The H2/CO ratio close to a value of 2 can be obtained for the W/F range studied. In Figure 5d, variations in ηI and ηII are shown. It can be seen that ηI can be enhanced by increasing the W/F ratio. However, ηII decreases when the W/F ratio is increased because of a more complete chemical reaction.
In Figure 6, the reactor operating pressure effect on TR process performance is examined. From Figure 6a the highest temperature increases with increased operating pressure. As the high temperature in the near-entrance region of the reactor is due to the methane oxidation reaction, this implies that methane oxidation can be enhanced by increasing the operating pressure. Due to the enhanced methane oxidation reaction, the Tin at which an abrupt increase in CH4 conversion occurs can be decreased by increasing the pressure, as shown in Figure 6b. Figure 6b also shows that CH4 conversion can be increased in the low Tin regime when the pressure is increased. That is, increased operating pressure can enhance catalyst activity at lower temperatures. In the high Tin regime, CH4 conversion is slightly decreased as the pressure is increased. Although higher CH4 conversion can be obtained from lower pressure operations, the resulting syngas may not be suitable for further use because most applications involve high-pressure synthetic processes. A H2/CO ratio with a value close to 2 is obtained for all the pressures studied when Tin is high, as shown in Figure 6c. Because of the reduced CH4 conversion at a high Tin regime, it can be seen that ηI decreases with increased Tin and pressure, as shown in Figure 6d. However, Figure 6d shows that ηII increases with decreasing pressure because of less exergy destruction by the chemical reaction.
The variation in reactant composition effect on TR process performance is examined in the following. Figure 7 shows the air amount effect. Figure 7a shows that temperature can be increased using more air as the reactant. That is, a more complete methane oxidation reaction is achieved when the air supply is increased. With the increase in air amount, both CH4 and CO2 conversions can be enhanced, as shown in Figure 7b. For the Air/CH4 = 3 case, 100% CH4 conversion can be reached for Tin higher than 550 °C. Due to the increased energy supply, dry reforming can occur in the lower Tin regime resulting in increased CO2 conversion. However, negative CO2 conversion is still found when Tin is low. Although more N2 is also introduced, increasing the volumetric flow rate of the entire reactant, it does not affect CH4 and CO2 conversions. As shown in Figure 7c, a H2/CO ratio with a value higher than 2 can be obtained for the Air/CH4 = 3 case because DR is more active when the temperature is high. For the Air/CH4 = 1 case, the H2/CO value is lower than 2. This is due to the reverse WGS reaction at high temperatures, reducing the H2 amount. Because of decreased H2 yield, lower ηI in the higher Tin regime is obtained, as shown in Figure 7d. The reverse WGS reaction also causes ηII to increase with Tin in the high Tin regime.
Figure 8 shows the H2O amount effect on TR process performance. With increased H2O in the reaction, lower temperature results at the reactor entrance region, as shown in Figure 8a, because of an increased reactant volumetric flow rate and endothermic SR reaction. The increased H2O amount does not affect CH4 conversion, as shown in Figure 8b. However, more negative CO2 conversion results. In addition to CO2 produced from methane oxidation, CO2 may also be produced from WGS and RCM reactions, as indicated in Equations (4) and (5) when H2O is increased. As shown in Figure 8c, a higher H2/CO ratio is obtained when H2O is increased because of increased H2 yield. Figure 8d shows lower ηI results when the H2O amount is increased. This is because higher heating to the reactant is required when the H2O amount is increased. ηII increases with increased H2O amount, indicating that less exergy destruction results as H2O is increased.
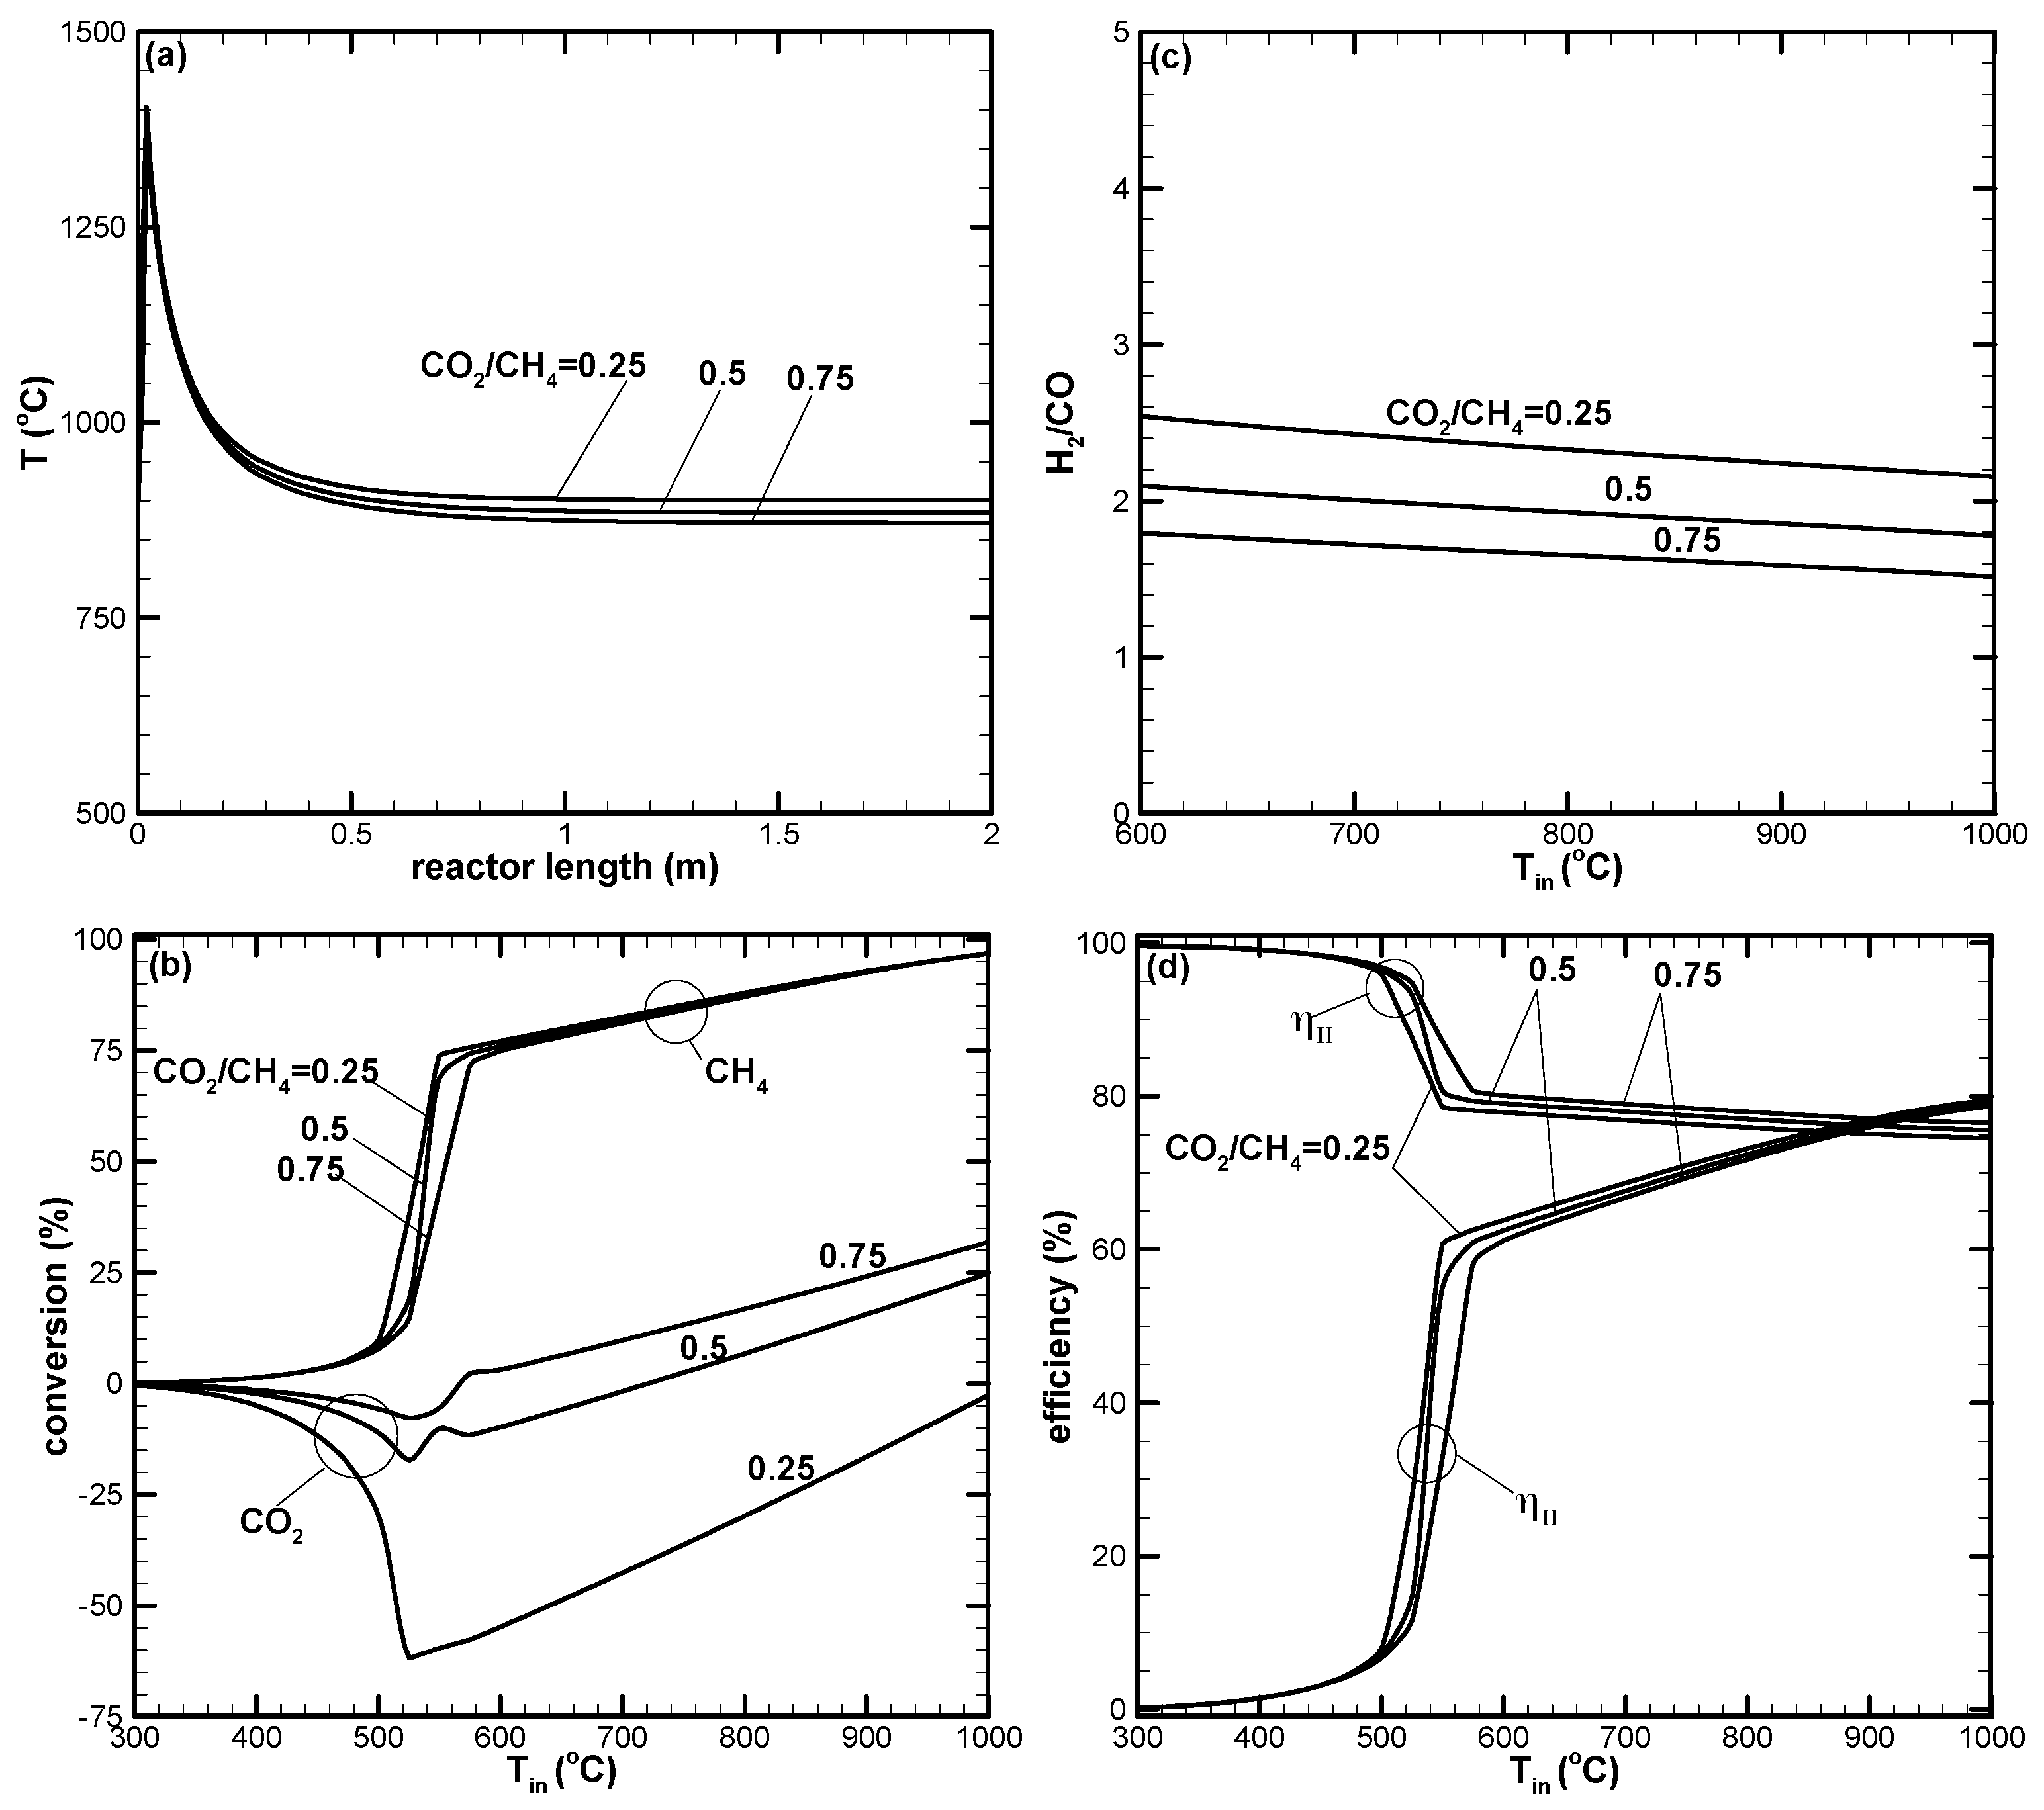
Figure 9 shows the amount of CO2 contained in the biogas effect on the TR process. As shown in Figure 9a, the amount of CO2 does not affect the reaction temperature to a large extent. The temperature increases slightly as the CO2 amount is decreased. As shown in Figure 9b, CH4 conversion is affected insignificantly by the CO2 amount. However, CO2 conversion is always negative for the CO2/CH4 = 0.25 case. That is, more CO2 is produced as a result of SR and WGS reactions than that consumed by DR and reverse WGS reactions. In Figure 9c, higher H2/CO results when CO2 is decreased. This may be due to less CO formed from CO2 conversion. As with CH4 conversion, the CO2 amount effect on first- and second-law efficiencies is not significant, as shown in Figure 9d.
Typical H2 and CO yield results are shown in Figure 10 for various air and H2O amounts. In Figure 10a, the H2 and CO yields increase with the increased air added in the reactant. As a high temperature results in the Air/CH4 = 3 case, the H2 yield decreases with increased Tin due to the reverse WGS reaction. Figure 10b shows that H2 yield can be enhanced by increased H2O addition. CO yield also decreases with H2O addition because of inactive DR and reverse WGS reactions. As a result, a higher H2/CO ratio is obtained, as shown in Figure 8b.
From the results shown above, the CO2 conversion is low or negative (CO2 production). Positive CO2 conversion only occurs in the high Tin regime. It is, then, desirable to determine the way to enhance CO2 conversion in the TR process. After several sets of numerical experiments, it was found that high CO2 conversion can be obtained when H2O is low. In this case, the TR process approaches the dry reforming of methane (DRM). Figure 11 shows TR process performance with H2O/CH4 = 0.001. As shown in Figure 11a, the temperature drop occurs in the region very near the entrance because DRM is a highly endothermic reaction. Large amounts of required heat leads to this temperature drop. When the methane oxidation becomes active, energy release causes a temperature increase in the reactor downstream. In Figure 11b, CH4 and CO2 conversions are shown for the H2O/CH4 = 0.001 case. CO2 conversion is always positive and increases with increased Tin. The CO2 conversion is lower than that of CH4 because of a low CO2/CH4 ratio in the biogas. Because of small amounts of H2O, the H2/CO ratio is close to unity, which is the stoichiometric H2/CO ratio of DRM, as shown in Figure 11c. Figure 11d shows that ηI increases with increased Tin because of higher H2 and CO yield. The second-law efficiency states that ηII decreases with increased Tin because of higher exergy destruction when the chemical reaction is more complete.
4. Conclusions
The tri-reforming process was used in this study for syngas production from biogas. The effects of various operating parameters such as pressure, temperature and reactant composition were studied based on a model built in Aspen Plus. Based on the results obtained, the following conclusions can be drawn:
- (1)
- There appears to be a limiting space velocity for the reaction. Beyond this limiting value, the reaction approaches the same performance. Lowering the reaction pressure could lead to higher CH4 conversion, but the syngas produced may not be suitable for further applications.
- (2)
- CH4 and CO2 conversions can be enhanced by increasing the amount of air in the reactant. Higher amounts of air could result in decreased H2 yield due to the reverse water–gas shift reaction, which is favorable at high reaction temperatures.
- (3)
- A higher H2/CO ratio can be obtained by increasing H2O addition. However, the dry reforming reaction is suppressed, leading to low CO2 or negative conversion.
- (4)
- Dry reforming of CO2 can only be found when the reaction temperature is high. This results in positive CO2 conversion and contributes to increased H2 and CO yields.
- (5)
- Higher CO2 conversion can be obtained for the low H2O addition case. However, low H2/CO with a value close to unity results.
- (6)
- The first-law efficiency increases with the increased reaction temperature because of higher H2 and CO yields. The second-law efficiency decreases with the increased temperature because of higher exergy destruction due to a more complete chemical reaction at high temperatures.
Author Contributions
This paper is a result of the collaboration between all co-authors. Rei-Yu Chein conceived the idea, designed the study, and wrote the paper. Wen-Hwai Hsu established the simulation model and data analysis.
Acknowledgments
Financial support from the Ministry of Science and Technology of Taiwan (MOST 106-2221-E-005-073-MY3) is acknowledged.
Conflicts of Interest
The authors declare no conflict of interest.
Abbreviation
| Nomenclature | |
| dp | catalyst particle diameter, m |
| Ex | exergy, kJ |
| chemical exergy, kJ mol−1 | |
| F | reactant volumetric flow rate, m3 s−1 |
| Kj | surface adsorption equilibrium constant of species j, Pa−1 |
| surface adsorption equilibrium constant of species j in combustion reaction, Pa−1 | |
| equilibrium constant of reaction i | |
| rate constant of reaction i, mol Pa0.5kgcat s−1, or mol Pa kgcat s−1 | |
| L | length of reactor, m |
| LHV | lower heating value, kJ mol−1 |
| Ni | total molar flow rate of a stream i, mole s−1 |
| nj | molar flow rate of species j, mole s−1 |
| p | pressure, Pa |
| Q | heat transfer, W |
| R | universal gas constant, 8.314 J mol−1 K−1 |
| Rb | reactor radius, m |
| ri | kinetic rate of reaction i, mol kgcat s−1 |
| s | entropy, kJ mol−1 K−1 |
| T | temperature, K |
| W | catalyst weight, g |
| Wcomp | compressor work, W |
| Wpump | pump work, W |
| X | species conversion |
| x | mole fraction |
| Y | species yield |
| Subscript | |
| in | inlet |
| out | outlet |
| 0 | reference state |
| Greek symbols | |
| ΔH | heat of reaction, kJ/mol |
| η | efficiency |
References
- Raju, A.S.K.; Park, C.S.; Norbeck, J.M. Synthesis gas production using steam hydrogasification and steam reforming. Fuel Process. Technol. 2009, 90, 330–336. [Google Scholar] [CrossRef]
- Rathod, V.P.; Shete, J.; Bhale, P.V. Experimental investigation on biogas reforming to hydrogen rich syngas production using solar energy. Int. J. Hydrog. Energy 2016, 41, 132–138. [Google Scholar] [CrossRef]
- Su, B.; Han, W.; Jin, H. Proposal and assessment of a novel integrated CCHP system with biogas steam reforming using solar energy. Appl. Energy 2017, 206, 1–11. [Google Scholar] [CrossRef]
- Damanabi, A.T.; Bahadori, F. Improving GTL process by CO2 utilization in tri-reforming reactor and application of membranes in Fischer-Tropsch reactor. J. CO2 Util. 2017, 21, 227–237. [Google Scholar] [CrossRef]
- Dwivedi, A.; Gudi, R.; Biswas, P. An improved tri-reforming based methanol production process for enhanced CO2 valorization. Int. J. Hydrog. Energy 2017, 42, 23227–23241. [Google Scholar] [CrossRef]
- Song, C.; Pan, W. Tri-reforming of methane: A novel concept for catalytic production of industrially useful synthesis gas with desired H2/CO ratios. Catal. Today 2004, 98, 463–484. [Google Scholar] [CrossRef]
- Majewski, A.J.; Wood, J. Tri-reforming of methane over Ni@SiO2 catalyst. Int. J. Hydrog. Energy 2014, 39, 12578–12585. [Google Scholar] [CrossRef]
- Kumar, N.; Shojaee, M.; Spivey, J.J. Catalytic bi-reforming of methane: From greenhouse gases to syngas. Curr. Opin. Chem. Eng. 2015, 9, 8–15. [Google Scholar] [CrossRef]
- Choudhary, V.R.; Mondal, K.C.; Choudhary, T.V. Oxy-CO2 reforming of methane to syngas over CoOx/MgO/SA-5205 catalyst. Fuel 2006, 85, 2484–2488. [Google Scholar] [CrossRef]
- Weiland, P. Biogas production: Current state and perspectives. Appl. Microbiol. Biotechnol. 2010, 85, 849–860. [Google Scholar] [CrossRef] [PubMed]
- Nicoletti, G.; Arcuri, N.; Nicoletti, G.; Bruno, R. A technical and environmental comparison between hydrogen and some fossil fuels. Energy Convers. Manag. 2015, 89, 205–213. [Google Scholar] [CrossRef]
- Zhao, X.; Zhou, H.; Sikarwar, V.S.; Zhao, M.; Park, A.A.; Fennell, P.S.; Shen, L.; Fan, L. Biomass-based chemical looping technologies: The good, the bad and the future. Energy Environ. Sci. 2017, 10, 1885–1910. [Google Scholar] [CrossRef]
- Samson, R.; LeDuy, A. Biogas production from anaerobic digestion of spirulina maxima algal biomass. Biotechnol. Bioeng. 2012, 24, 1919–1924. [Google Scholar] [CrossRef] [PubMed]
- Rasi, S.; Veijanen, A.; Rintala, J. Trace compounds of biogas from different biogas production plants. Energy 2017, 32, 1370–1380. [Google Scholar] [CrossRef]
- Hagman, L.; Blumenthal, A.; Eklund, M.; Svensson, N. The role of biogas solutions in sustainable biorefineries. J. Clean. Prod. 2018, 172, 3982–3989. [Google Scholar] [CrossRef]
- Meyer, A.K.P.; Ehimen, E.A.; Holm-Nielsen, J.B. Future European biogas: Animal manure, straw and grass potentials for a sustainable European biogas production. Biomass Bioenergy 2018, 111, 154–164. [Google Scholar] [CrossRef]
- Molino, A.; Larocca, V.; Chianese, S.; Musmarra, D. Biofuels production by biomass gasification: A review. Energies 2018, 11, 811. [Google Scholar] [CrossRef]
- Chianese, S.; Loipersböck, J.; Malits, M.; Rauch, R.; Hofbauer, H.; Molino, A.; Musmarra, D. Hydrogen from the high temperature water gas shift reaction with an industrial Fe/Cr catalyst using biomass gasification tar rich synthesis gas. Fuel Process. Technol. 2015, 132, 39–48. [Google Scholar] [CrossRef]
- Molino, A.; Migliori, M.; Blasi, A.; Davoli, M.; Marino, T.; Chianese, S.; Catizzone, E.; Giordano, G. Municipal waste leachate conversion via catalytic supercritical water gasification process. Fuel 2017, 206, 155–161. [Google Scholar] [CrossRef]
- Chianese, S.; Fail, S.; Binder, M.; Rauch, R.; Hofbauer, H.; Molino, A.; Blasi, A.; Musmarra, D. Experimental investigations of hydrogen production from CO catalytic conversion of tar rich syngas by biomass gasification. Catal. Today 2016, 277, 182–191. [Google Scholar] [CrossRef]
- Vita, A.; Pino, L.; Cipitì, F.; Laganà, M.; Recupero, V. Biogas as renewable rawmaterial for syngas production by tri-reforming process over NiCeO2 catalysts: Optimal operative condition and effect of nickel content. Fuel Process. Technol. 2014, 127, 47–58. [Google Scholar] [CrossRef]
- Lau, C.S.; Tsolakis, A.; Wyszynski, M.L. Biogas upgrade to syn-gas (H2-CO) via dry and oxidative reforming. Int. J. Hydrog. Energy 2011, 36, 397–404. [Google Scholar] [CrossRef]
- Zhu, X.; Li, K.; Liu, J.; Li, X.; Zhu, A. Effect of CO2/CH4 ratio on biogas reforming with added O2 through an unique spark-shade plasma. Int. J. Hydrog. Energy 2014, 39, 13902–13908. [Google Scholar] [CrossRef]
- Corigliano, O.; Fragiacomo, P. Technical analysis of hydrogen-rich stream generation through CO2 reforming of biogas by using numerical modeling. Fuel 2015, 158, 538–548. [Google Scholar] [CrossRef]
- Hernández, B.; Martín, M. Optimal process operation for biogas reforming to methanol: Effects of dry reforming and biogas composition. Ind. Eng. Chem. Res. 2016, 55, 6677–6685. [Google Scholar] [CrossRef]
- Hajjaji, N.; Martinez, S.; Trably, E.; Steyer, J.; Helias, A. Life cycle assessment of hydrogen production from biogas reforming. Int. J. Hydrog. Energy 2016, 41, 6064–6075. [Google Scholar] [CrossRef]
- Zhang, Y.; Zhang, S.; Benson, T. A conceptual design by integrating dimethyl ether (DME) production with tri-reforming process for CO2 emission reduction. Fuel Process. Technol. 2015, 131, 7–13. [Google Scholar] [CrossRef]
- Solovev, S.A.; Kurilets, Y.; Orlik, S.N. Tri-reforming of methane on structured Ni-containing catalysts. Theor. Exp. Chem. 2012, 48, 199–205. [Google Scholar] [CrossRef]
- Cho, W.; Song, T.; Mitso, A.; McKinnon, T.J.; Ko, G.H.; Tolsma, J.E. Optimal design and operation of a natural gas tri-reforming reactor for DME synthesis. Catal. Today 2009, 139, 261–267. [Google Scholar] [CrossRef]
- York, A.P.E.; Xiao, T.; Green, M.L.H. Brief overview of the partial oxidation of methane to synthesis gas. Top. Catal. 2003, 22, 345–358. [Google Scholar] [CrossRef]
- Horn, R.; Williams, K.A.; Degenstein, N.J.; Bitsch-Larsen, A.; Dalle Nogare, D.; Tupy, S.A.; Schmidt, L.D. Methane catalytic partial oxidation on autothermal Rh and Pt foam catalysts: Oxidation and reforming zones, transport effects, and approach to thermodynamic equilibrium. J. Catal. 2007, 249, 380–393. [Google Scholar] [CrossRef]
- De Groote, A.M.; Froment, D. Simulation of the catalytic partial oxidation of methane to syngas. Appl. Catal. A 1996, 138, 245–264. [Google Scholar] [CrossRef]
- Scognamiglio, D.; Russo, L.; Maffettone, P.L.; Salemme, L.; Simeone, M.; Crescitelli, S. Modeling temperature profiles of a catalytic autothermal methane reformer with nickel catalyst. Ind. Eng. Chem. Res. 2009, 48, 1804–1815. [Google Scholar] [CrossRef]
- Chan, S.H.; Wang, M.H. Thermodynamic analysis of natural gas fuel processing for fuel cell applications. Int. J. Hydrog. Energy 2000, 25, 441–449. [Google Scholar] [CrossRef]
- Izquierdo, U.; García-García, I.; Gutierrez, Á.M.; Arraibi, J.R.; Barrio, V.L.; Cambra, J.F.; Arias, P.L. Catalyst deactivation and regeneration processes in biogas tri-reforming process. The effect of hydrogen sulfide addition. Catalysts 2018, 8, 12. [Google Scholar] [CrossRef]
- Xu, J.; Froment, G.F. Methane steam reforming, methanation and water-gas shift: I. Intrinsic kinetics. AIChE J. 1989, 35, 88–96. [Google Scholar] [CrossRef]
- Trimm, D.L.; Lam, C.W. The combustion of methane on platinum-alumina fibre catalysts. I. Kinetics and mechanism. Chem. Eng. Sci. 1908, 35, 1405–1413. [Google Scholar] [CrossRef]
- De Smet, C.R.H.; de Croon, M.H.J.M.; Berger, R.J.; Marin, G.B.; Schouten, J.C. Design of adiabatic fixed-bed reactors for the partial oxidation of methane to synthesis gas. Chem. Eng. Sci. 2001, 56, 4849–4861. [Google Scholar] [CrossRef]
- Bartholomew, C.H. Mechanisms of catalyst deactivation. Appl. Catal. A Gen. 2001, 212, 17–60. [Google Scholar] [CrossRef]
- Velasco, J.A.; Fernandez, C.; Lopez, L.; Cabrera, S.; Boutonnet, M.; Jaras, S. Catalytic partial oxidation of methane over nickel and ruthenium based catalysts under low O2/CH4 ratios and with addition of steam. Fuel 2015, 153, 192–201. [Google Scholar] [CrossRef]
- Ahmed, S.; Lee, S.H.E.; Ferrandon, M.S. Catalytic steam reforming of biogas e Effects of feed composition and operating conditions. Int. J. Hydrog. Energy 2015, 40, 1005–1015. [Google Scholar] [CrossRef]
- Barbieri, G.; Di Maio, F.P. Simulation of the methane steam re-forming process in a catalytic Pd-membrane reactor. Ind. Eng. Chem. Res. 1997, 36, 2121–2127. [Google Scholar] [CrossRef]
- Kim, J.H.; Choi, B.H.; Yi, J. Modified simulation of methane steam reforming in Pd-membrane/pack-bed type reactor. J. Chem. Eng. Jpn. 1999, 32, 760–769. [Google Scholar] [CrossRef]
- Lutz, A.E.; Bradshaw, R.W.; Keller, J.O.; Witmer, D.E. Thermodynamic analysis of hydrogen production by steam reforming. Int. J. Hydrog. Energy 2003, 28, 159–167. [Google Scholar] [CrossRef]
- Simpson, A.P.; Lutz, A.E. Exergy analysis of hydrogen production via steam methane reforming. Int. J. Hydrog. Energy 2007, 32, 4811–4820. [Google Scholar] [CrossRef]
- Chein, R.; Wang, C.; Yu, C. Parametric study on catalytic tri-reforming of methane for syngas production. Energy 2017, 118, 1–17. [Google Scholar] [CrossRef]
- Arab Aboosadi, Z.; Jahanmiri, A.H.; Rahimpour, M.R. Optimization of tri-reformer reactor to produce synthesis gas for methanol production using differential evolution (DE) method. Appl. Energy 2011, 88, 2691–2701. [Google Scholar] [CrossRef]
Figure 1.
Tri-reform process for syngas production using biogas as feedstock.

Figure 2.
Comparison of results predicted from Aspen Plus and two-dimensional model [46] using the optimized reactant composition reported by Arab Aboosadi et al. [47]. Tin = 1100 K, p = 20 atm, and reactant composition CH4/CO2/H2O/O2 = 1/1.3/2.46/0.47. (a) Temperature and (b) species mole fraction variations along the reactor center line.

Figure 3.
Performance of tri-reforming (TR) process obtained using the base operation conditions listed in Table 1. (a) Temperature variation along reactor with Tin = 900 °C; (b) CH4 and CO2 conversions; (c) H2 yield, CO yield, and H2/CO ratio; and (d) First- and second-law efficiencies.
Figure 3.
Performance of tri-reforming (TR) process obtained using the base operation conditions listed in Table 1. (a) Temperature variation along reactor with Tin = 900 °C; (b) CH4 and CO2 conversions; (c) H2 yield, CO yield, and H2/CO ratio; and (d) First- and second-law efficiencies.

Figure 4.
Variations of species mole fraction of the TR process using the base operation conditions listed in Table 1.
Figure 4.
Variations of species mole fraction of the TR process using the base operation conditions listed in Table 1.
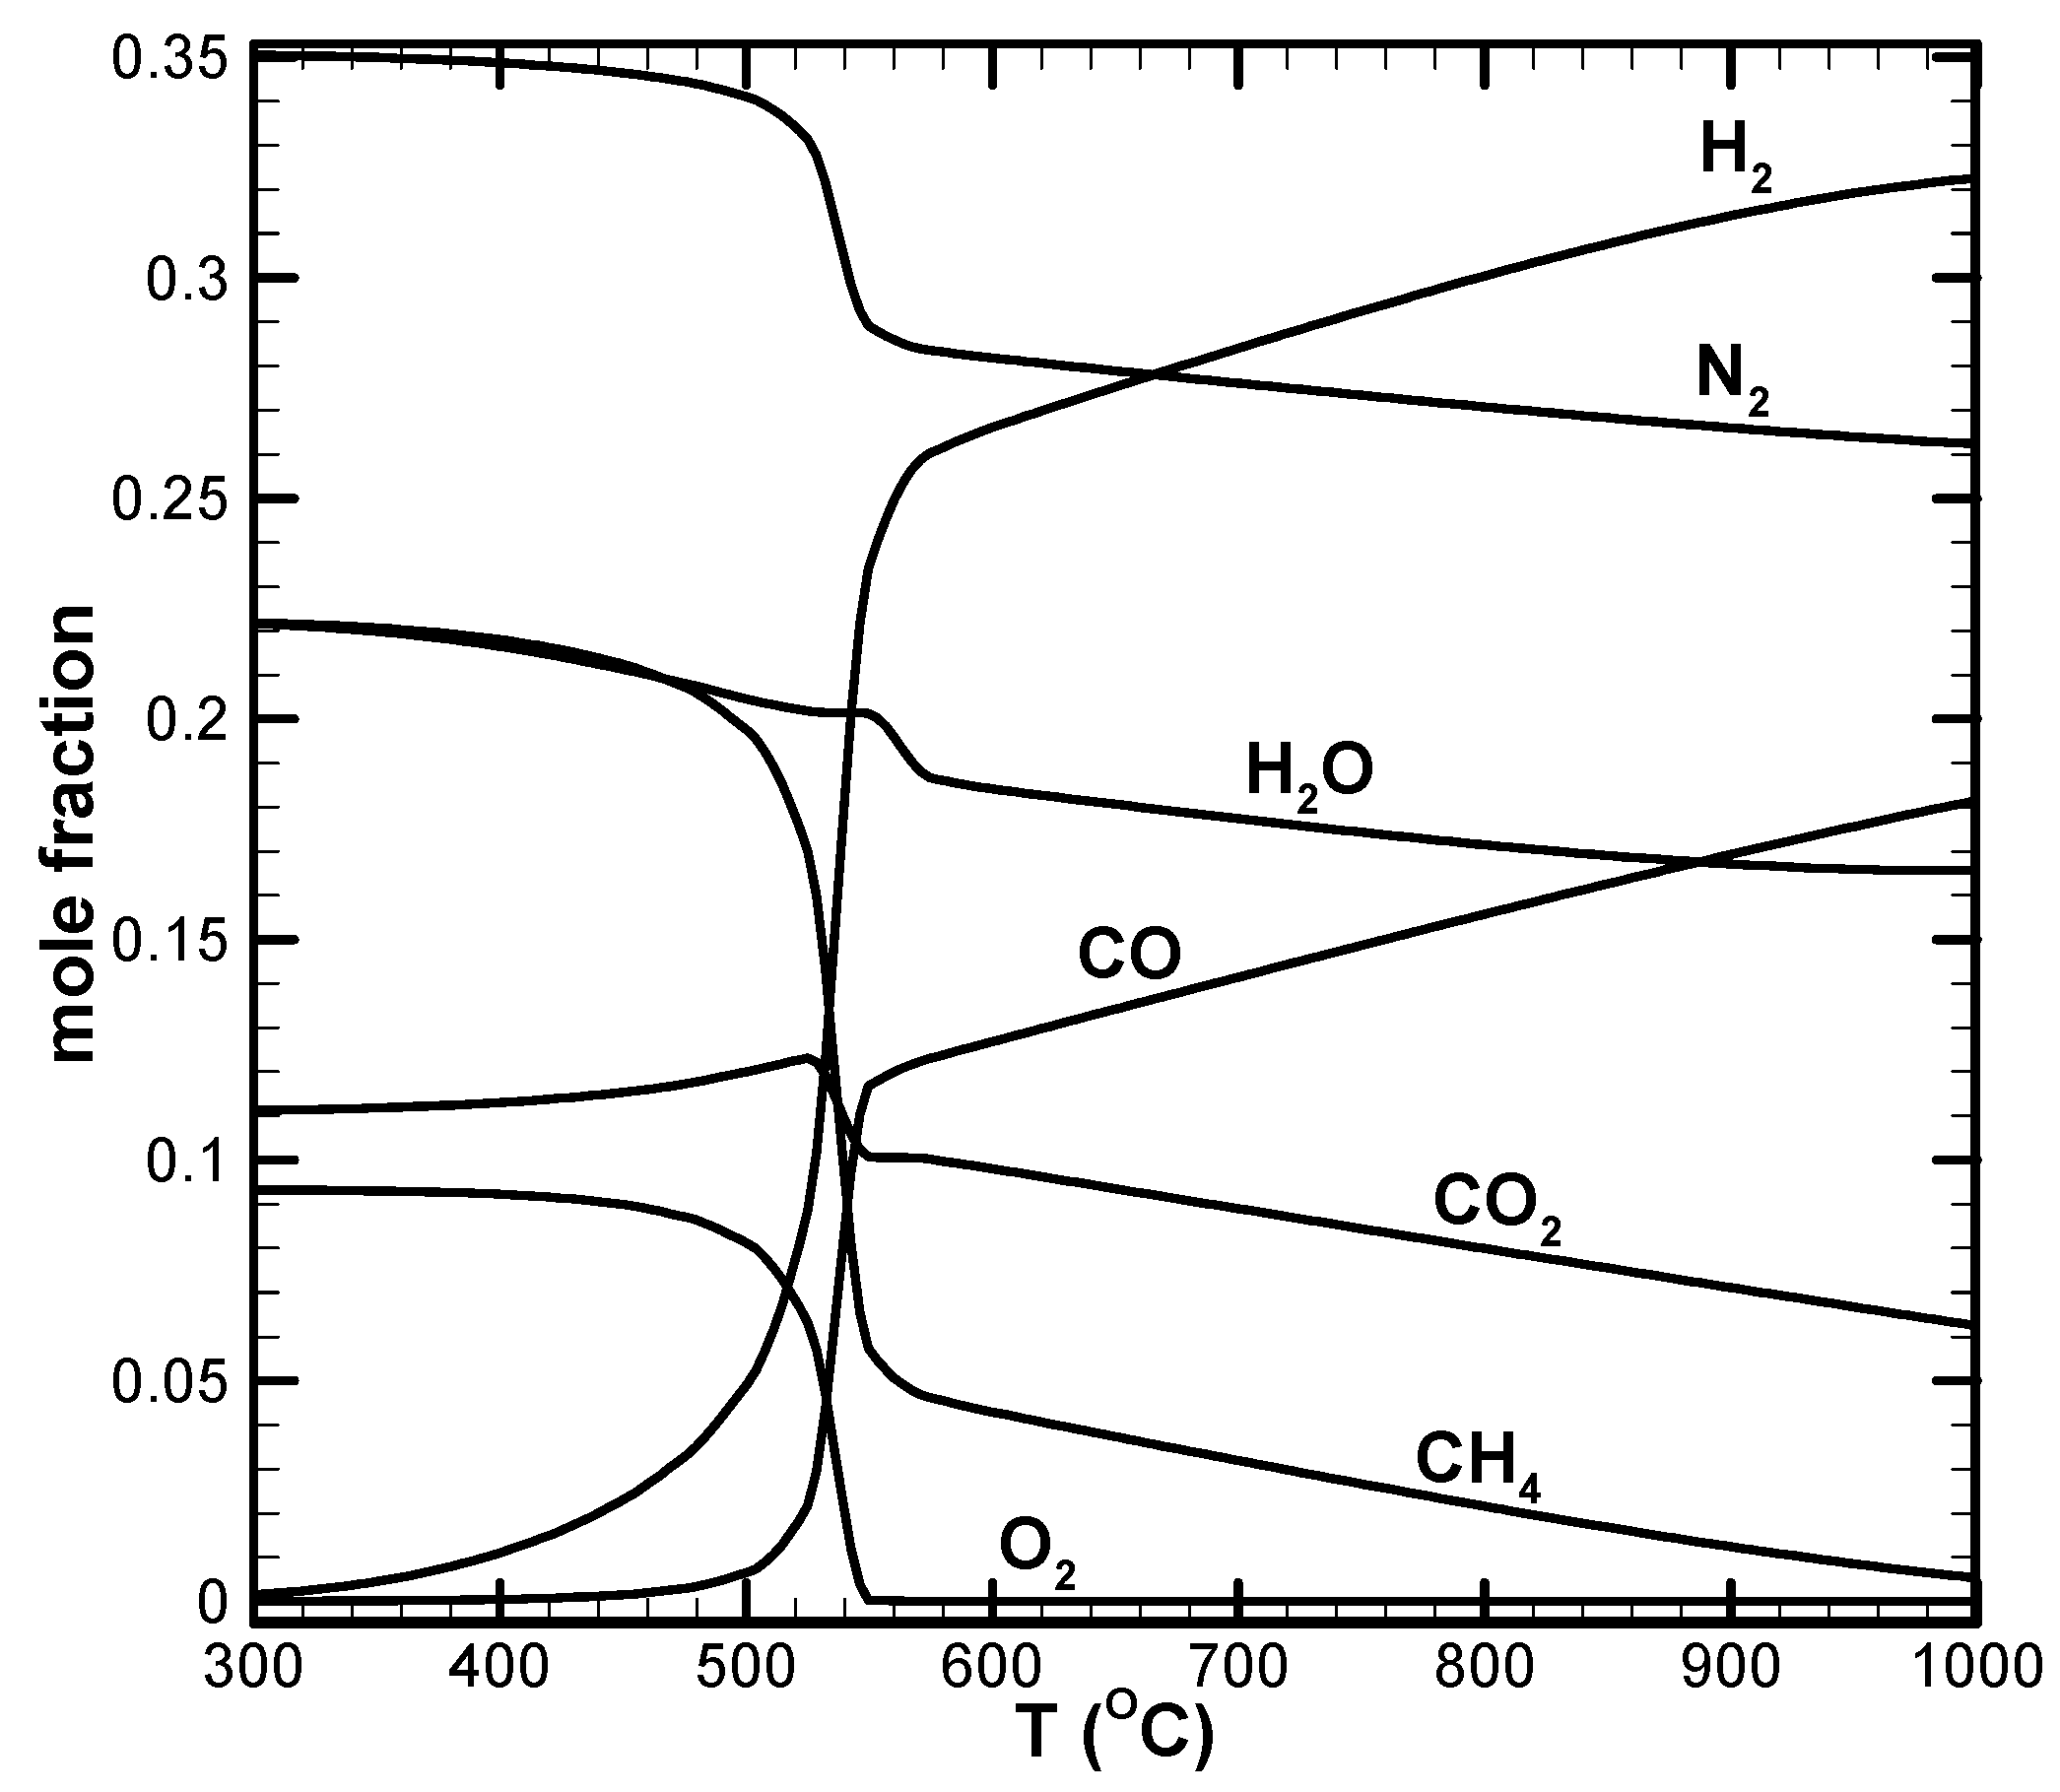
Figure 5.
Effect of catalyst weight/volume flow rate (W/F) ratios on the TR process. Catalyst weight is varied from 0.025 to 2.5 g while the other parameters were kept unchanged, as listed in Table 1. (a) Temperature variation along reactor with Tin = 900 °C; (b) CH4 and CO2 conversions; (c) H2/CO ratio; and (d) first- and second-law efficiencies.

Figure 6.
Effect of pressure on the TR process. Pressure is varied from 10 to 30 atm while the other parameters were kept unchanged, as listed in Table 1. (a) Temperature variation along reactor with Tin = 900 °C; (b) CH4 and CO2 conversions; (c) H2/CO ratio; and (d) first- and second-law efficiencies.
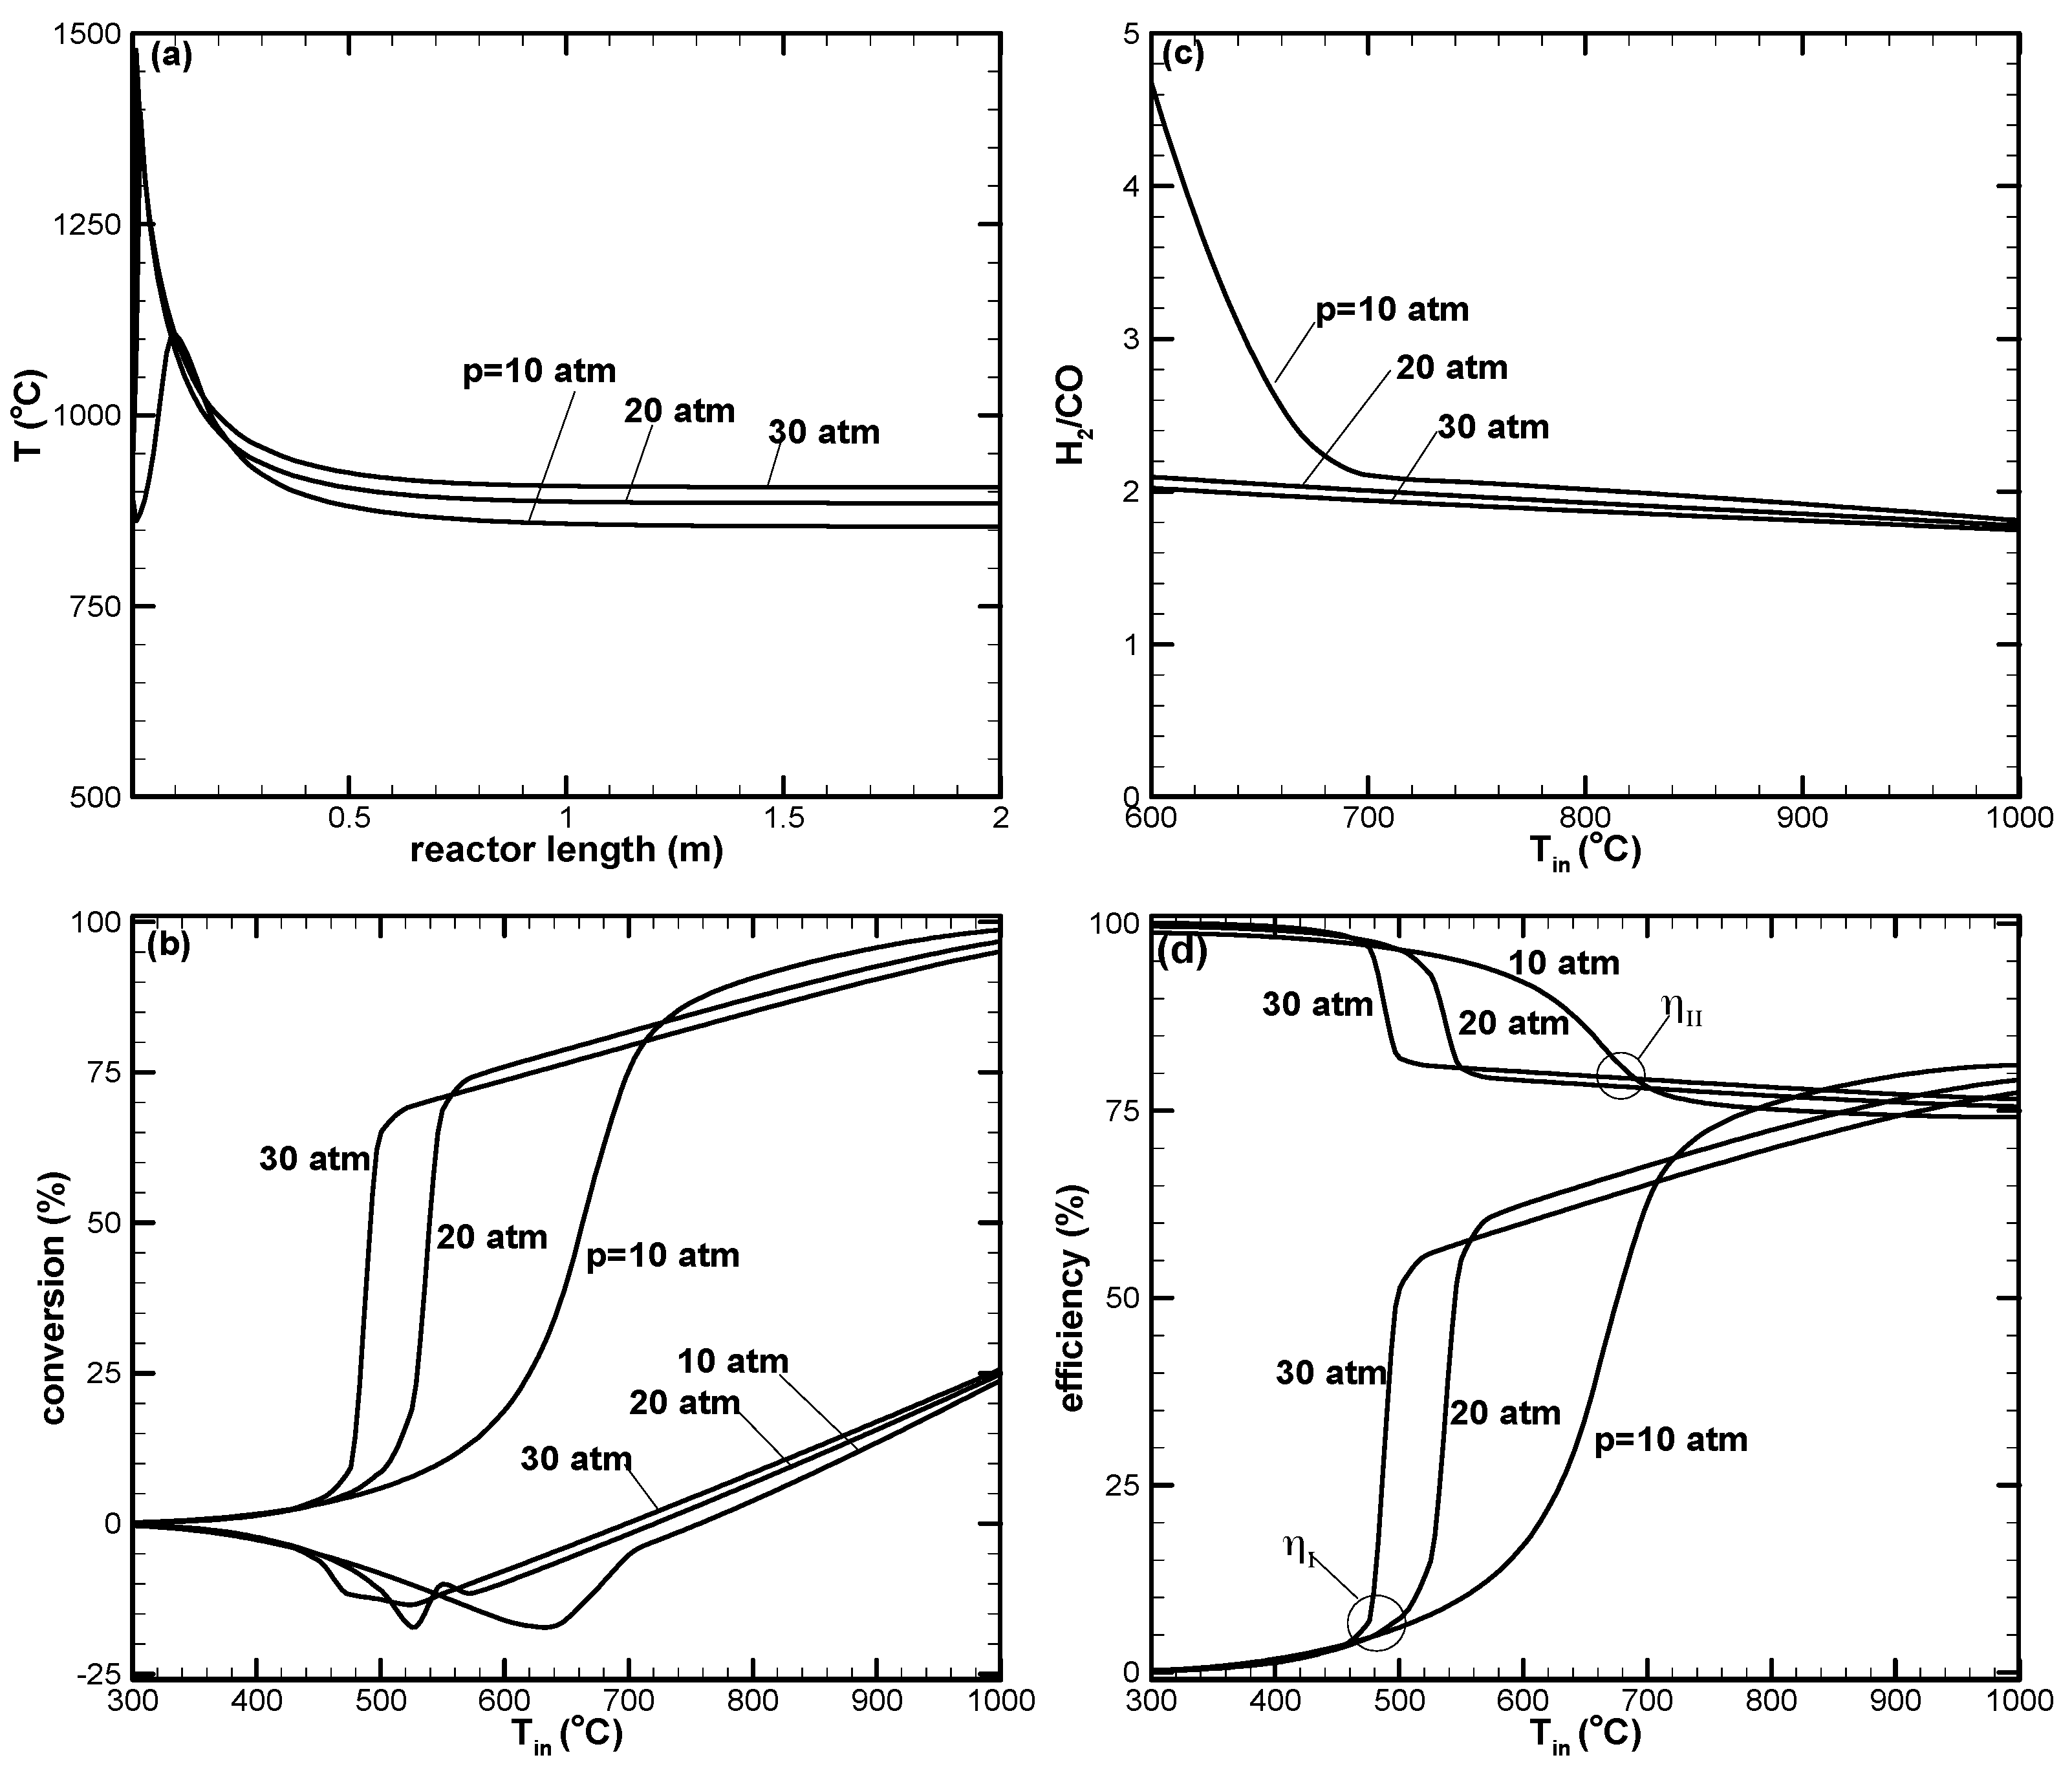
Figure 7.
Air/CH4 ratio effect on the TR process. The Air/CH4 ratio is varied from 1 to 3 while the other parameters are kept unchanged, as listed in Table 1. (a) Temperature variation along the reactor with Tin = 900 °C; (b) CH4 and CO2 conversions; (c) H2/CO ratio; and (d) first- and second-law efficiencies.
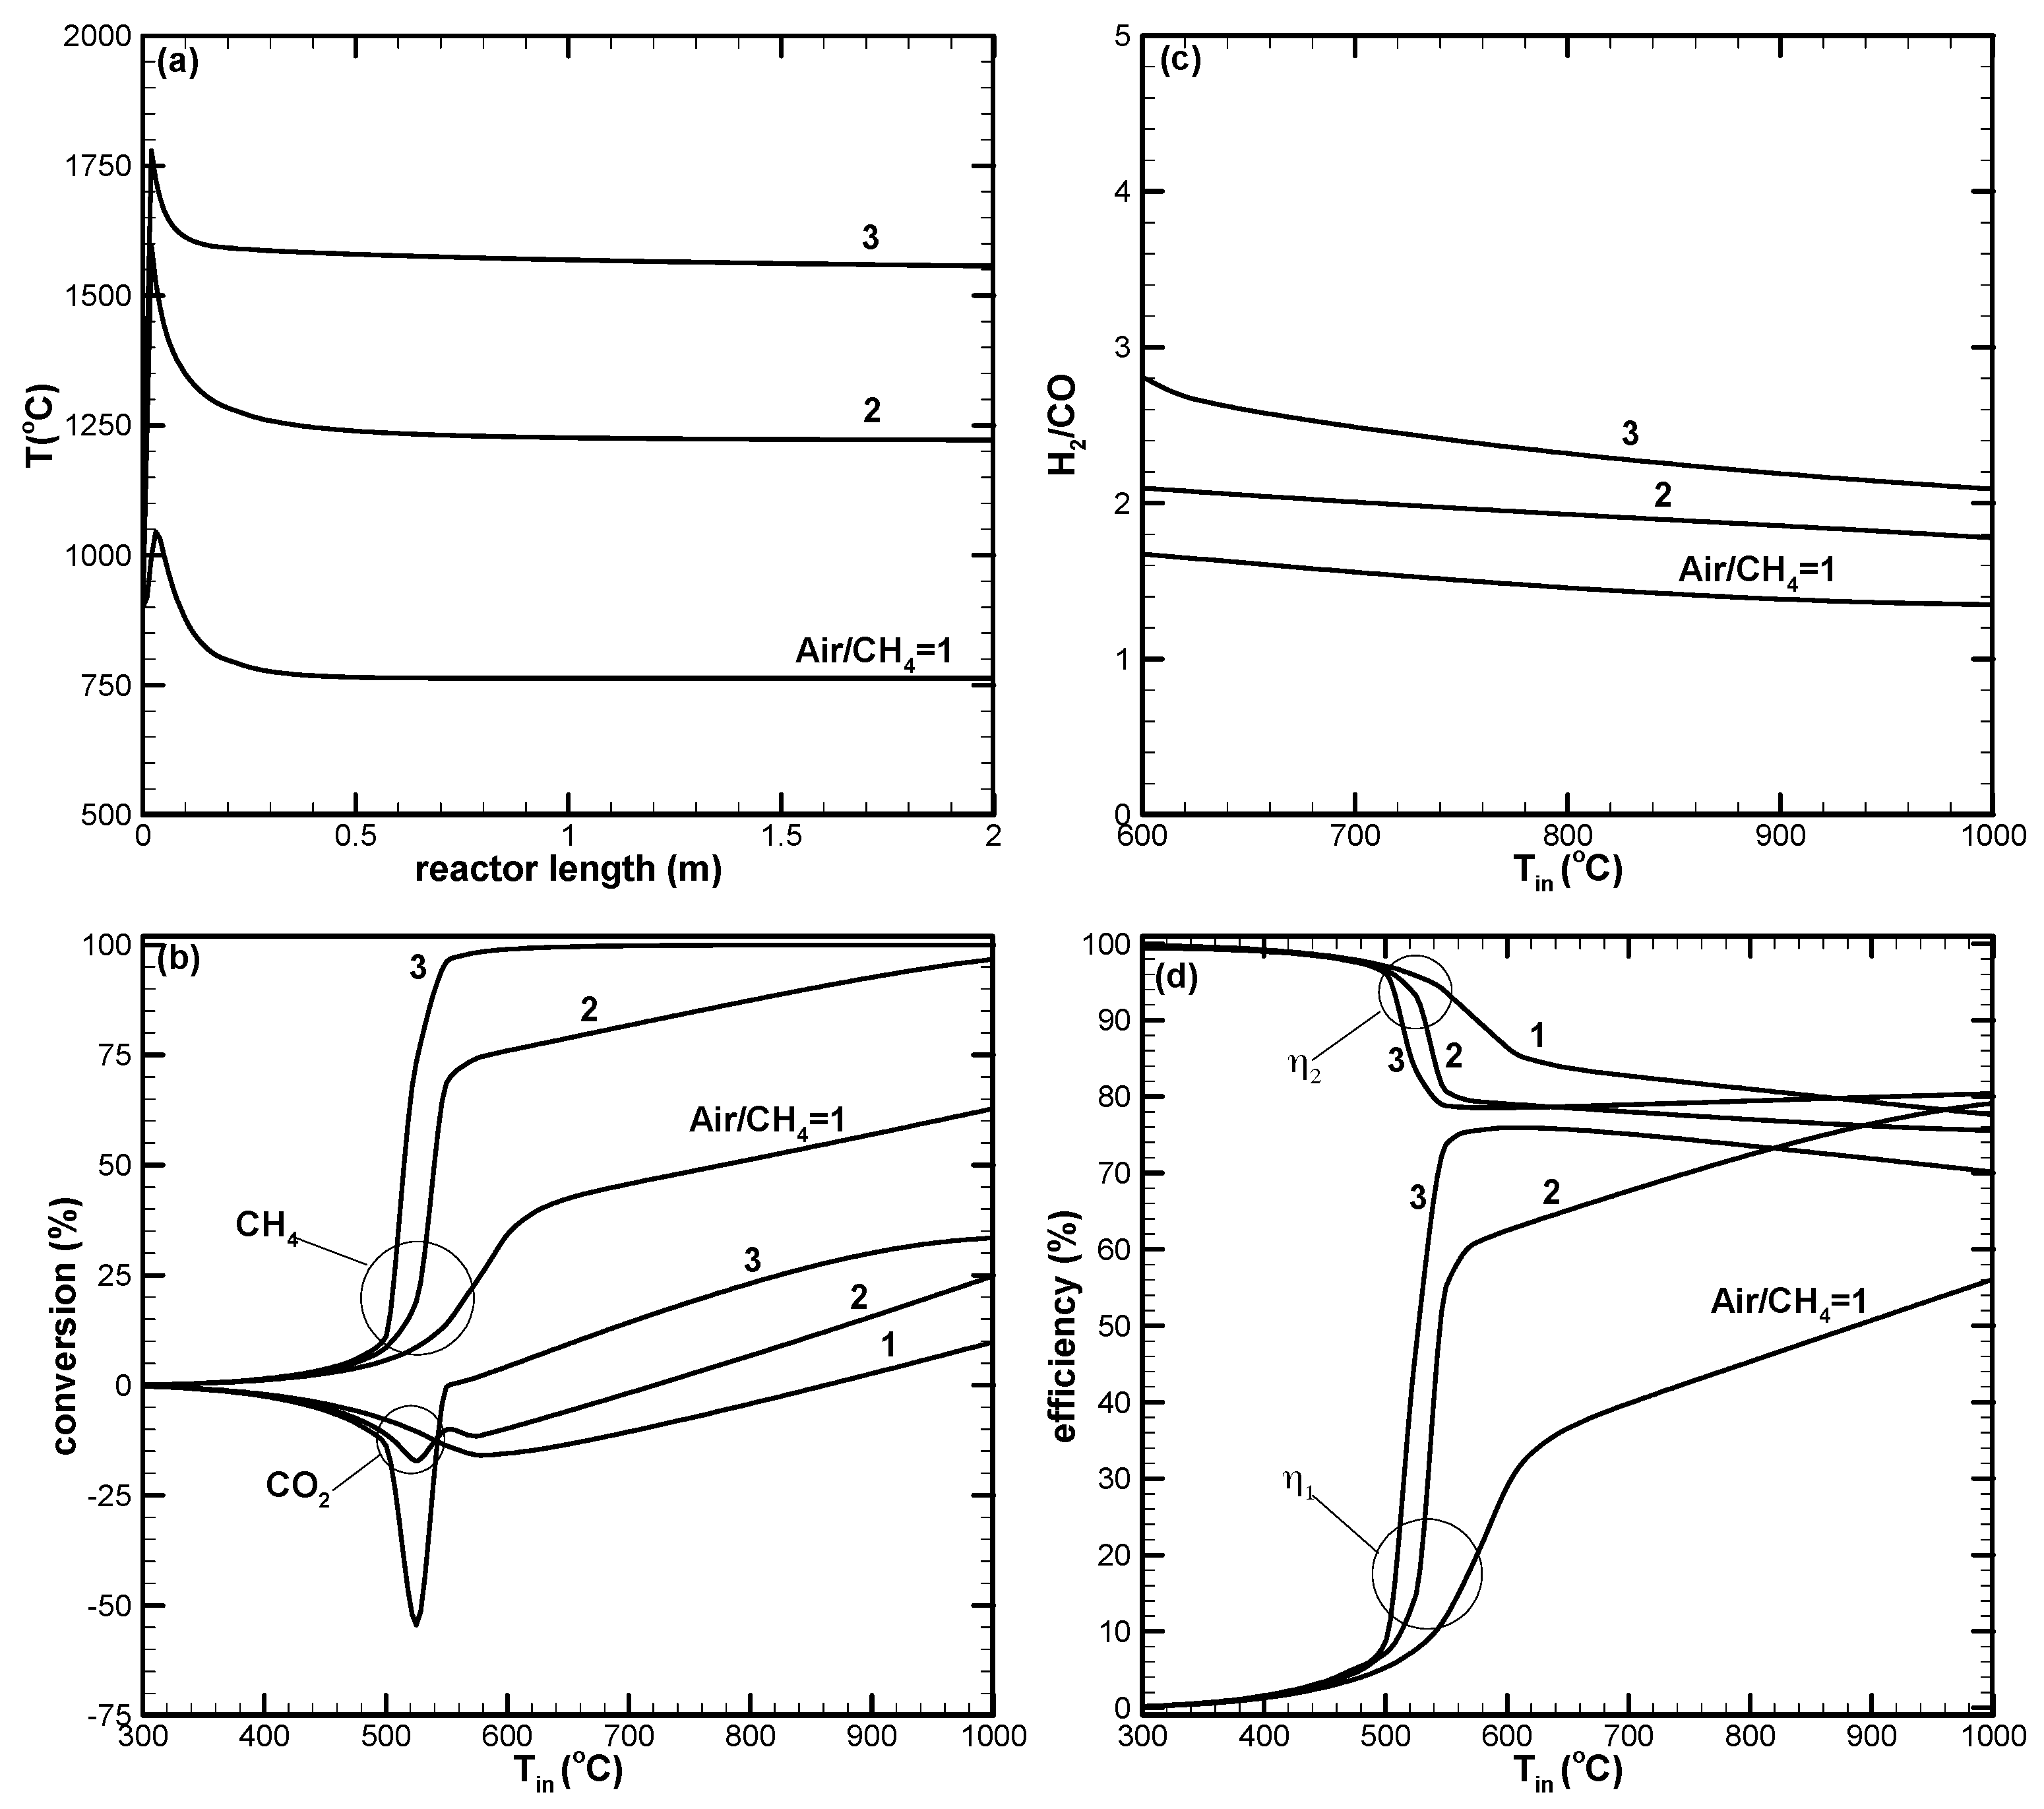
Figure 8.
Effect of H2O/CH4 ratios on the TR process. H2O/CH4 is varied from 1 to 3 while the other parameters were kept unchanged, as listed in Table 1. (a) Temperature variation along reactor with Tin = 900 °C; (b) CH4 and CO2 conversions; (c) H2/CO ratio; and (d) first- and second-law efficiencies.
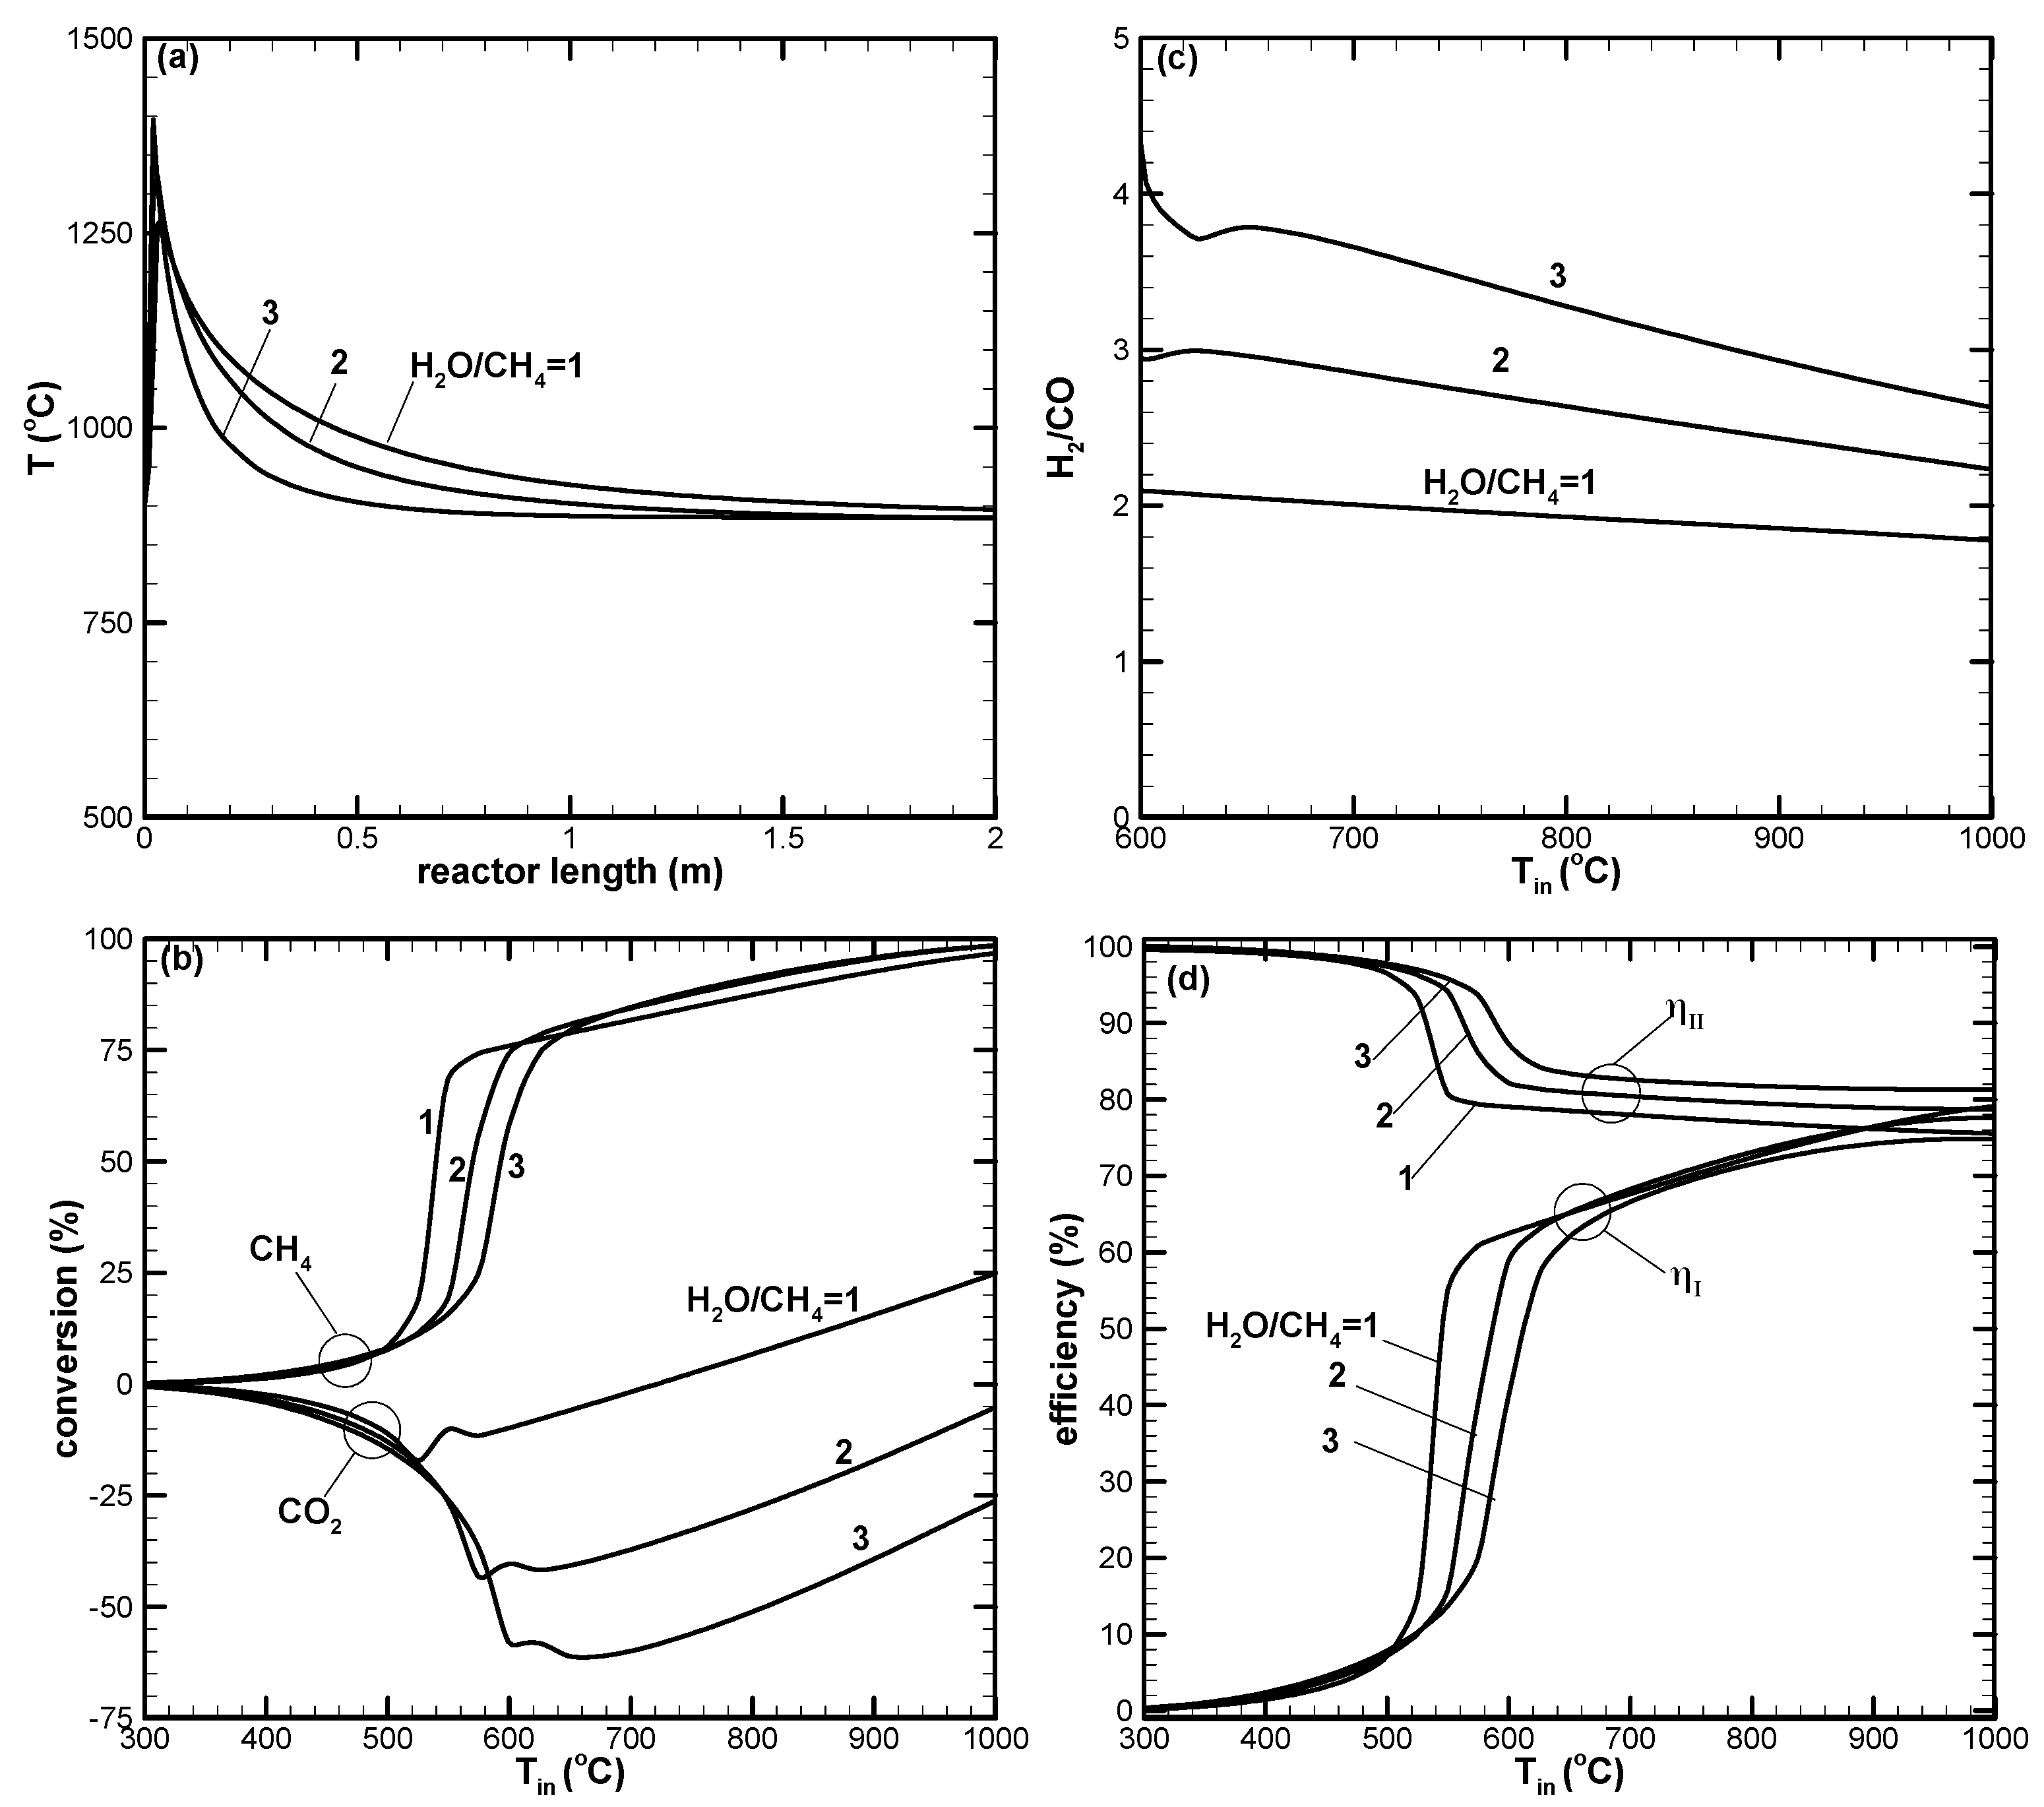
Figure 9.
Effect of CO2/CH4 ratios on the TR process. CO2/CH4 is varied from 0.25 to 0.75 while the other parameters were kept unchanged, as listed in Table 1. (a) Temperature variation along reactor with Tin = 900 °C; (b) CH4 and CO2 conversions; (c) H2/CO ratio; and (d) first- and second-law efficiencies.

Figure 10.
H2 and CO yields for various (a) air and (b) H2O amounts added.

Figure 11.
TR process with H2O/CH4 = 0.001 while the other parameters were kept unchanged, as listed in Table 1. (a) Temperature variation along reactor with Tin = 900 °C; (b) CH4 and CO2 conversions; (c) H2/CO ratio; and (d) first- and second-law efficiencies.
Figure 11.
TR process with H2O/CH4 = 0.001 while the other parameters were kept unchanged, as listed in Table 1. (a) Temperature variation along reactor with Tin = 900 °C; (b) CH4 and CO2 conversions; (c) H2/CO ratio; and (d) first- and second-law efficiencies.


| Parameter | Value |
|---|---|
| Reactor length, L | 2 m |
| Reactor diameter, d(=2Rb) | 10 mm |
| Inlet pressure, pin | 20 atm |
| Inlet temperature, Tin | 300~1000 °C |
| Reactant flow rate, F | 0.0723 L min−1 |
| Molar ratio of biogas CH4:CO2:Air:H2O | 1:0.5:2:1 |
| Catalyst | Ni/Al2O3 |
| Catalyst size, dp | 0.42 mm |
| Catalyst weight, W | 0.25 g |
| W/F ratio | 0.0576 ghL-1 |
| Heat-transfer condition | Adiabatic |
© 2018 by the authors. Licensee MDPI, Basel, Switzerland. This article is an open access article distributed under the terms and conditions of the Creative Commons Attribution (CC BY) license (http://creativecommons.org/licenses/by/4.0/).
Share and Cite
MDPI and ACS Style
Chein, R.-Y.; Hsu, W.-H. Analysis of Syngas Production from Biogas via the Tri-Reforming Process. Energies 2018, 11, 1075. https://doi.org/10.3390/en11051075
AMA Style
Chein R-Y, Hsu W-H. Analysis of Syngas Production from Biogas via the Tri-Reforming Process. Energies. 2018; 11(5):1075. https://doi.org/10.3390/en11051075
Chicago/Turabian StyleChein, Rei-Yu, and Wen-Hwai Hsu. 2018. "Analysis of Syngas Production from Biogas via the Tri-Reforming Process" Energies 11, no. 5: 1075. https://doi.org/10.3390/en11051075
Note that from the first issue of 2016, this journal uses article numbers instead of page numbers. See further details here.