Assessment of Energy Production Potential from Tidal Stream Currents in Morocco
by
 , ,
, ,
Mourad Nachtane
1,2,* ,
,
Mostapha Tarfaoui
2 ,
,
Karim Hilmi
3,
Dennoun Saifaoui
1 and
Ahmed El Moumen
2 1
Laboratory for Renewable Energy and Dynamic Systems, University of Hassan II, BP 5366, Maârif, Casablanca 20100, Morocco
2
ENSTA Bretagne, IRDL—FRE CNRS 3744, IRDL, F-29200 Brest, France
3
National Institute for Fisheries Research, Casablanca 20100, Morocco
*
Author to whom correspondence should be addressed.
Energies 2018, 11(5), 1065; https://doi.org/10.3390/en11051065
Submission received: 29 January 2018
/
Revised: 18 February 2018
/
Accepted: 8 March 2018
/
Published: 26 April 2018
(This article belongs to the Section L: Energy Sources)
Abstract
:Energy extracted from the ocean can provide a source of regular and foreseeable electrical production at higher energy densities than any other renewable energy resource. The marine current resource is potentially great and is focused in several sites around the world. The knowledge of the energy potential, its constraints and availability are all prerequisites to determine the possibilities for the implementation of infrastructure to produce energy. They are also required to anticipate the structuring of energy routes and to respond to increasing technological needs. Several Moroccan regions want to take advantage by their coastal domain and play a role in the development of the tidal energy sector. They also want to benefit from the associated economic advantages knowing that the Mediterranean coast length is 550 km and the Atlantic length is 3000 km, respectively. The Copernicus Marine Service ocean products provide key input for such technologies, as they can be employed to help evaluate the accessible ocean energy devices and choose the most attractive sites to exploit the tidal energy projects in Morocco. The goal of this research was to evaluate and analyze the tidal marine current resource at the sites which are potentially suitable for the installation of Horizontal Axis Marine Current Turbines in Morocco. Distributions of available power of tidal energy in the Moroccan region are provided, and three possible areas are suggested for installing tidal energy conversion systems.
1. Introduction
Covering 70% of our globe, the oceans are the world’s largest source of energy. Marine renewable energy technology has quickly developed to meet Morocco’s energy requirements and decrease its fossil fuel needs [1]. Many technologies have been developed to harness the energy of the seas. Morocco has two maritime frontages with stable and predictable marine currents with a total length equivalent to 3500 km [2]. All these resources make Morocco a country with several sites allowing the development of renewable marine energies. These natural energy sources provide very good opportunities to innovate and improve the performance of tidal energy converters from 20% to 30%. The development of a hydrokinetic sector will complement and diversify the Kingdom’s renewable energy mix [3]. Currently, its traditional partners are already mastering the energies of the seas on a large scale because their investments in R&D (research & development) and support of their industrial sectors. World leaders in marine energies include the United Kingdom, which hosts the world’s largest hydroelectric power reserve in the Pentland estuary, and has 3300 MW of offshore wind energy, followed by Canada, with an exceptional natural potential of 35.7 GW in marine energies (excluding offshore wind) [4]. New entrants have invested in this sector and have strong ambitions to develop their production capacities, such as the United States, China, Denmark, Spain, Portugal and France [5]. The greatest potential for wave energy is located where winds are strongest and the fetches are long. Until now, despite its great potential for wind and solar energy, only 10% of Morocco’s energy production comes from renewable sources, mainly hydro and wind. Sierra and co-workers [6] have found that the average power of the waves is important, with an annual energy 30 kW/m in Atlantic coast.
Studies have shown that there is a great potential in installing a tidal current generator in the Strait of Gibraltar [7]. One of the great advantages of this zone is the existence of exceptionally coherent and solid currents so the potential for electricity generation is considerable. Currently, despite the advantages of the Gibraltar’s zone as a natural energy distinction, this project is quite theoretical, without future plans. However, in the future, tidal production in the Strait of Gibraltar could be an important asset for the advancement of renewable energy use in Morocco [8].
Oceanic tides are the result of the interaction of the gravitational fields of the Earth, Moon, and Sun [9]. Capturing energy from tides is not a new idea. In 1981 Underwater Electric Kite (UEK) invented a new system to capture ocean, river, and tidal currents using hydrokinetic turbines [10]. The elevation variance between low and high tides can be employed for electricity production. Tidal energy brings great energy density, lower environmental impact and great predictability. Tidal current converters are very similar to wind turbines, unless they are located below the water surface instead of above or on land. The turbine transforms the flow of water coming from tide, the kinetic energy, into electricity. Water is 830 times denser than air and therefore can produce electricity at lower velocity than wind turbines. Figure 1 presents the tidal range resources worldwide. The exploitable tidal current power with actual technologies is evaluated about 75 GW in the world and 11 GW in Europe. UK and France have highest marine current potentials (6 GW and 3.4 GW respectively) among the European countries [11]. Tidal current turbine have observed a lot of research work in recent years and are indeed a technology close to the industrial stage but still in the experimental phase in test sites such as the European Center for Marine Energy (EMEC) in Scotland [12] and the Marine Energy Research Center in the Bay of Fundy in Canada, or the experimental site of Paimpol in France. However, only prototypes have been tested such as two-bladed SeaGen project turbines in the UK manufactured (Siemens and Bluewater Energy Services, Scotland, UK), Three-bladed Hammerfest Strom turbine (Andritz Hydro Hammerfest (AHH), Glasgow, Scotland, UK) and there multi-bladed Underwater Electric Kite (UEK, Annapolis, MD, USA) which currently work a wholly functional plant at Eagle, Alaska. The capture of the kinetic energy of tidal currents by tidal turbines is currently being investigated to exploit tidal energy however, currents must exceed 1.5 m/s for significant duration. Under lower speeds; tidal turbines are not profitable, while higher speeds can damage the turbines [13]. The most suitable areas to utilize tidal energy are very few; and they are concentrated in areas where the amplitude of the tidal wave is amplified like in the case of the Bay of Mont-Saint-Michel in France and the Bay of Fundy in Canada where the tidal current can exceeds 2.7 m/s [14].
This work is based on the statistical evaluation of marine current velocity characteristics and energy potential at three areas in Morocco (32°00′ N 5°00′ W). The objective of this research is to evaluate the potential of marine currents in Morocco and to identify the most suitable sites for the development of tidal energy. It also characterizes in detail the resource of the various sites of interest through the provision of relevant indicators using numerical model results provided by The Copernicus Marine Environment Monitoring Service (CMEMS).
2. Data and Methods
2.1. Study Area and Available Tidal Data
Morocco is located in the Maghreb region of North Africa and its geographic position has many advantages as it is located in the middle of two continents: Europe and Africa (Figure 1). Morocco is situated at the northwest corner of Africa, rimming the North Atlantic Ocean and the Mediterranean Sea. With a population of over 34 million and an area of 720,000 km2. Morocco fully plays its role at the regional level. It, thus, it intends to integrate into the Mediterranean Solar Plan and provides an opportunity for combining the availability of renewable resources, accessibility to industrial parks and poles of skilled labour [15,16].
Its strategic position is very important to consolidate the regional key, which is Morocco’s responsibility in the field of energy by giving this sector the necessary means to enable it to meet the challenges it faces in order to facilitate its integration into the world scenario. In addition, the energy market to become a key player in Euro-Mediterranean energy cooperation, in particular through the strengthening of electricity interconnections with neighboring countries and the establishment of the infrastructure needed to achieve regional integration [17]. The Sahara represents 36.57% of the total surface of Morocco. In these regions the solar potential is important and the density of the population is medium. The use of conventional energy sources requires high costs. The rate of rural electrification rose steadily to 97.4% by the end of 2011. The tariff of consumption of the electricity varies between 0.9010 MAD/kWh for up to 100 kWh, and 1542 MAD /kWh for up to 500 kWh. In the rural areas, diesel generators are used in most cases for power generation, although these devices have unwanted environmental effects [18,19]. Morocco has a Mediterranean climate that is generally hot and dry for most of the year. Geographical location has several advantages for the development of renewable energies (solar, wind, hydro, etc.); particularly with climatic conditions widely favorable [20].
2.2. Resource Assessment Methodology
Marine renewable energies comprise a large number of technologies encompassing tidal, and offshore wind technologies. Numerical modelling could contribute to promoting the development of such projects in various ways [21]. Through atmospheric, waves and hydrodynamic models, the regions with enough energetic resource for these industries could be classified. Furthermore, maintenance services and operation rely on the sea conditions that operational modelling is able to give through forecasting services. These forecasts could also be valuable for the survivability of the installed devices as extreme events could be identified and thus the possible damages could be mitigated by taking appropriate measures. Moreover, operational modelling could estimate the amount of energy that would be available and how much could be generated by the devices thus the electric system would be more efficient in supplying the produced energy. In this article, the tidal energy potential is determined by exploring the results of numerical models for The Copernicus Space Component. The numerical models shown in this research ran operationally and their results and forecasts can be accessed at [22]. The CMEMS database has been widely used by several researchers to evaluate wave and tidal energies. This simulation has some weaknesses in terms of accurately representing some storm events, but it generally represents mean values quite well, and this database proposes homogeneous long-term data and a higher spatial coverage than that achieved with single-point observations. Moreover, data from the CMEMS database have previously been used to identify tidal energy potential in different regions [23,24,25]. Three regions are analyzed for investigating their tidal energy potential, while their geographical coordinates and catalog using from the Copernicus Marine Environment Monitoring Service is provided in Table 1.
In this context, the examination of resource evaluation is limited to issues around maximizing energy extraction. It is recognized that in the real world there are other agents that may constrain the selection of sites, including access for maintenance; survival of equipment; environmental and ecological impacts; and integration with the power distribution network. Aside from these questions, it is recommended that the following steps (Table 2) are required in resource evaluation as part of an iterative design process [26]:
This research analyses the tidal energy resource in Morocco using a 5-year series of data obtained from numerical modeling (hindcasting). The spatial distribution of tidal power is analyzed using data from 2 areas (Irish-Biscay-Iberia, Mediterranean sea). This allows a fast evaluation of the feasibility of tidal energy locations. The location of these regions is presented in Figure 2.
To obtain the power potential of the Morocco Atlantic coast and the Mediterranean Sea the values were obtained for one square meter cross-sectional area, therefore using the following formula [27]:
where the density of water (kg/m3) and V is the instantaneous current velocity (m/s). The power of the resource increases very quickly with the speed of the current, and it is considered that tidal turbines become interesting if the current exceeds 2 m/s. A frequent assumption is that the speed varies according to the formula:
where z is the distance above the bottom, p the depth, the speed of the current at the surface. In fact, the maximum speed is usually located slightly below the free surface. Figure 3 shows the variation curve according to this law for a channel 50 m deep.
The depth at which the tidal turbines are installed is moderate (a few tens of meters). It would be possible to work on machines with divers. However, dive must have a minimum duration (because of the decompression stops) and cannot fit into a moderate current period. The strong currents pose big safety problems and require technicians perfectly trained to this type of intervention. It is essential to design all equipment so that any necessary interventions are reduced to a minimum.
The installation of tidal turbines in a bay, lagoon, and strait must take into consideration potential environmental effects. These areas are frequented by fish, some of which are migratory, and marine mammals. It is essential that the size and the number of machines do not hinder the passage. Similarly, the speed of the current has an influence on the development of aquatic life. The mixing of waters between different marine areas certainly has an effect on population movements, nutrient exchange, etc. For all these reasons, many of which remain to be studied, it is prudent to consider at this stage that the current which normally exists in these places should not be reduced by more than 10%.
3. Results and Discussion
Morocco presents a high potential for renewable marine energies, and some studies have analyzed the availability of energies due to wind [28]. Some studies assessed the wave energy resource in the whole Mediterranean. Thus [29] found at the Mediterranean Coast of Morocco wave energy powers between 2 kW/m and 6 kW/m, while [30] estimated a mean wave power of 6.3 kW/m at a point in the Moroccan Mediterranean. The results obtained by Sierra et al. [6] from the average power of the waves is important (up to 30 kW/m with an annual energy average waves up to 262 MWh/m) on the Atlantic coast. Nevertheless, as far as the authors know, there are no specific studies addressing the potential of tidal energy there. Almost all the eligible Moroccan sites are in the Mediterranean Sea. These specific and well-identified areas (straits ...) have geomorphologic features which force tidal currents and induce high velocities. Although, very localized, the sites exist and Morocco has great potential for them.
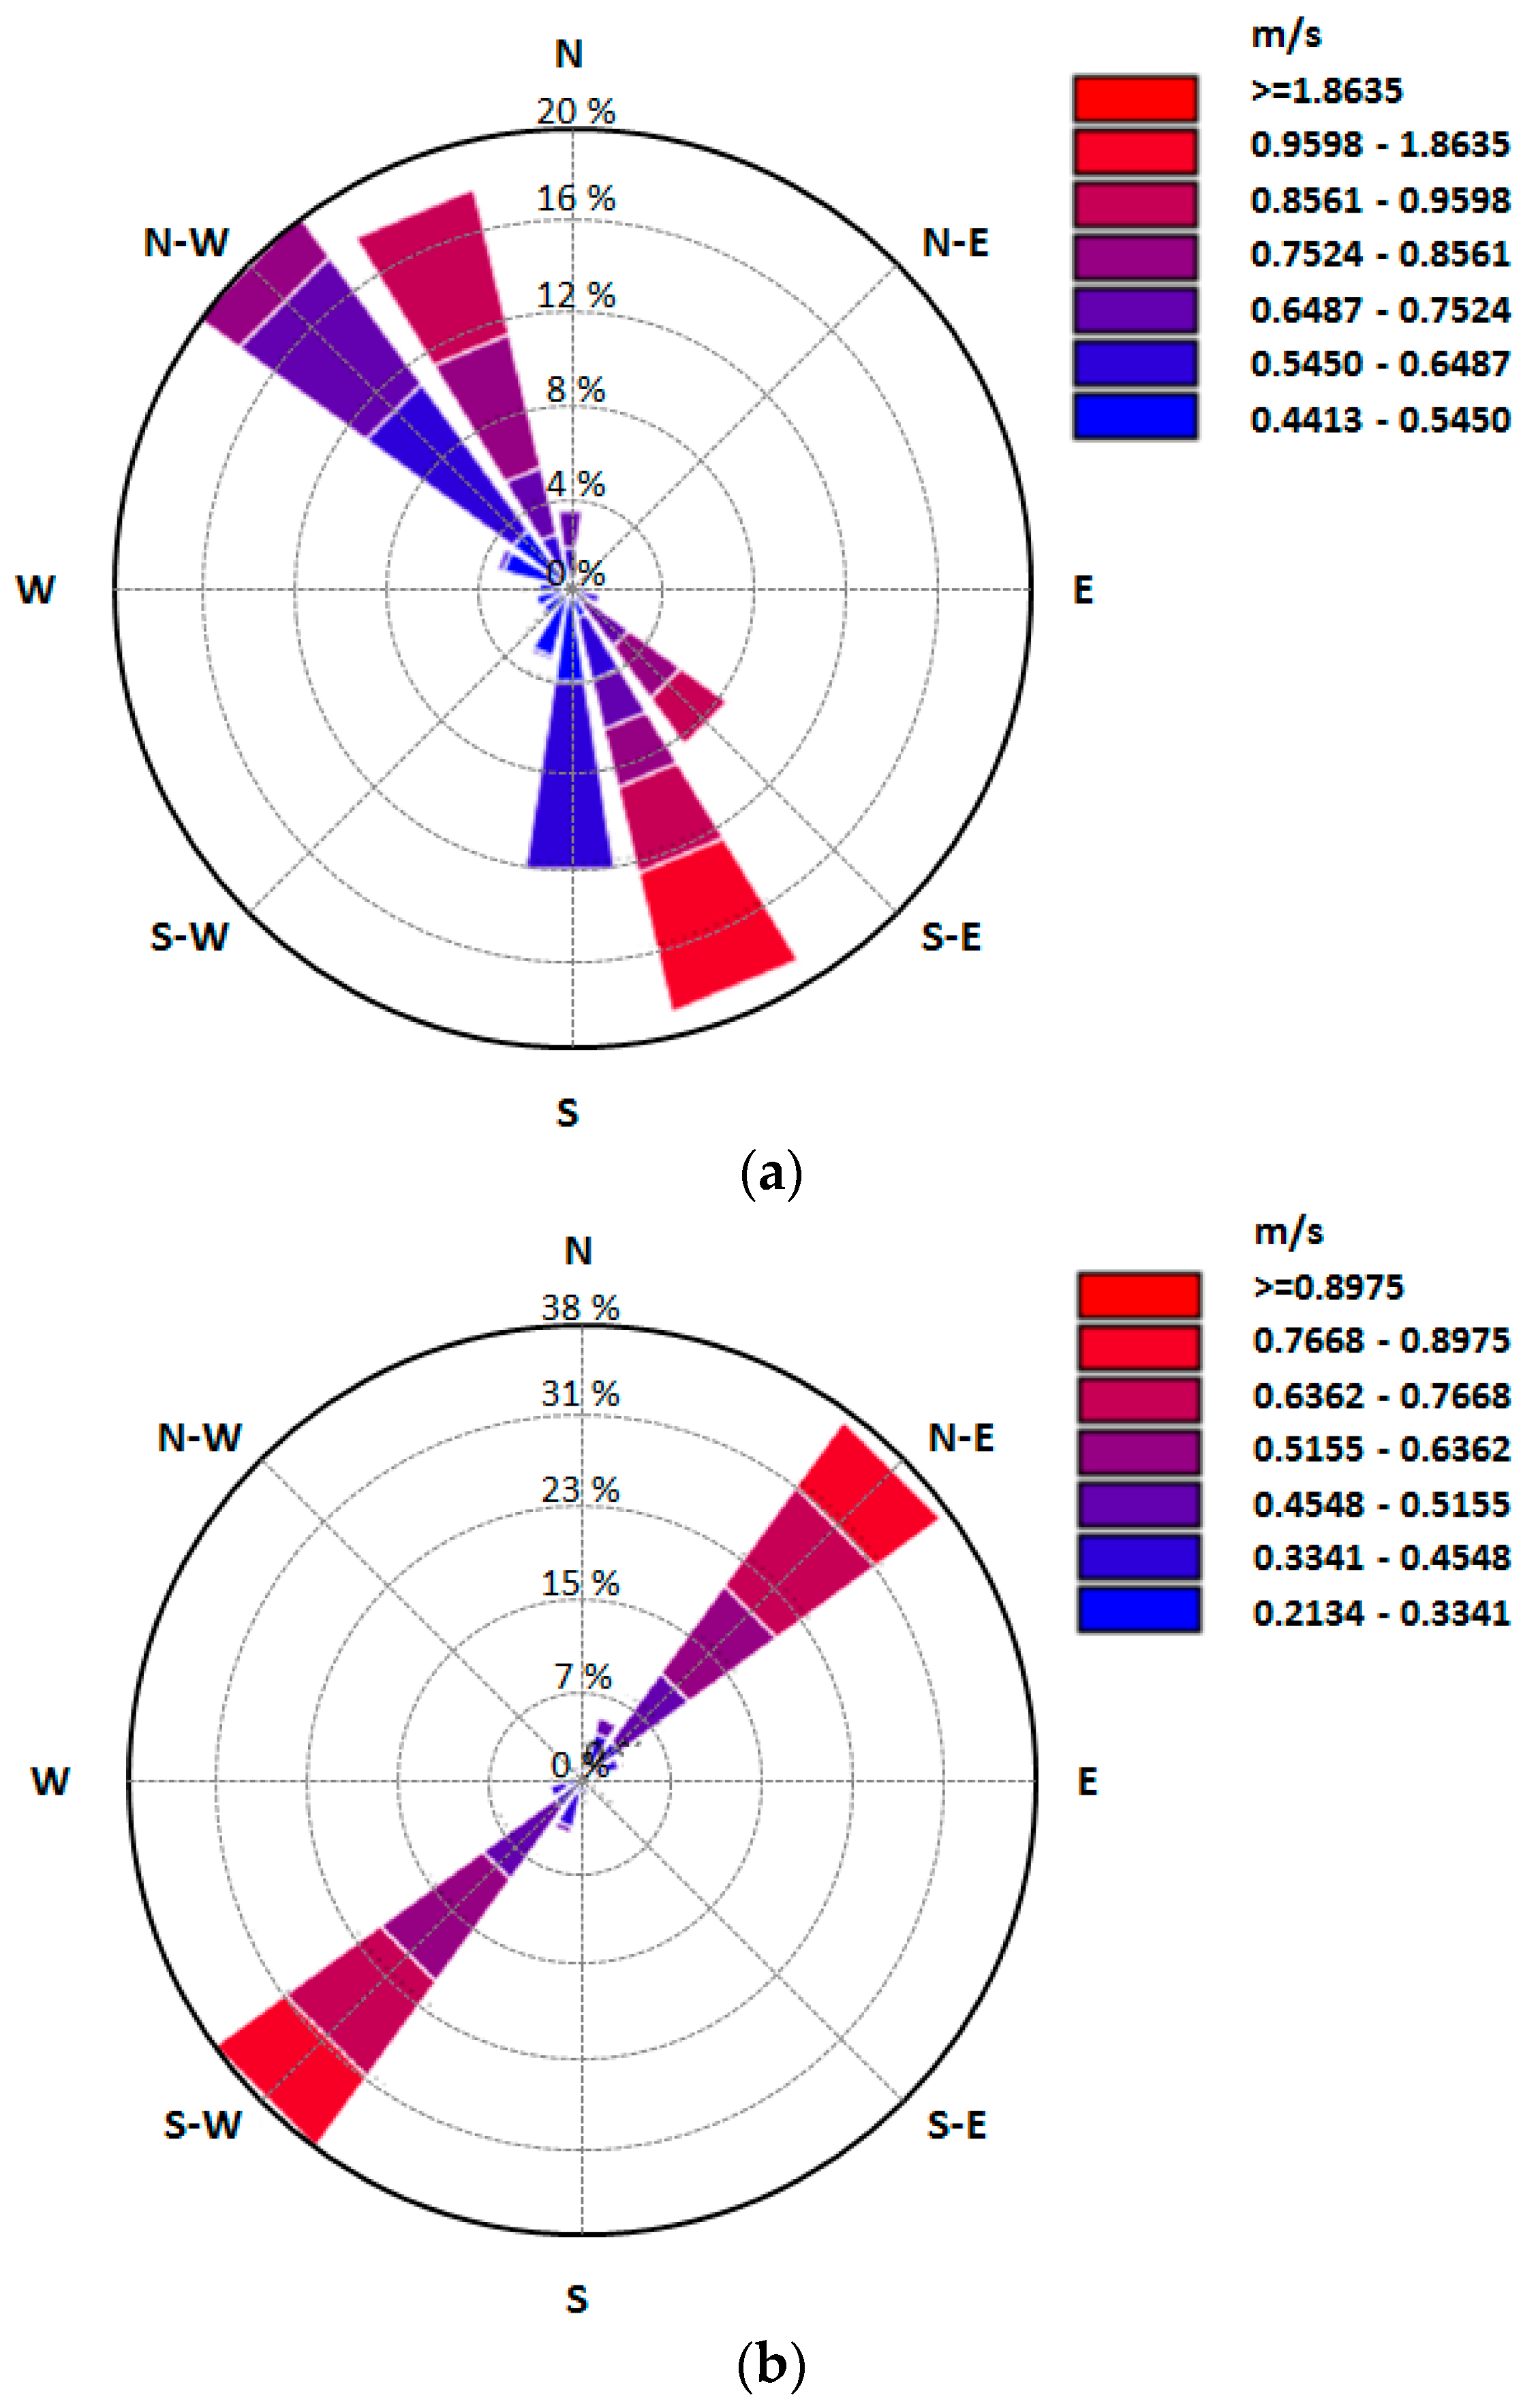
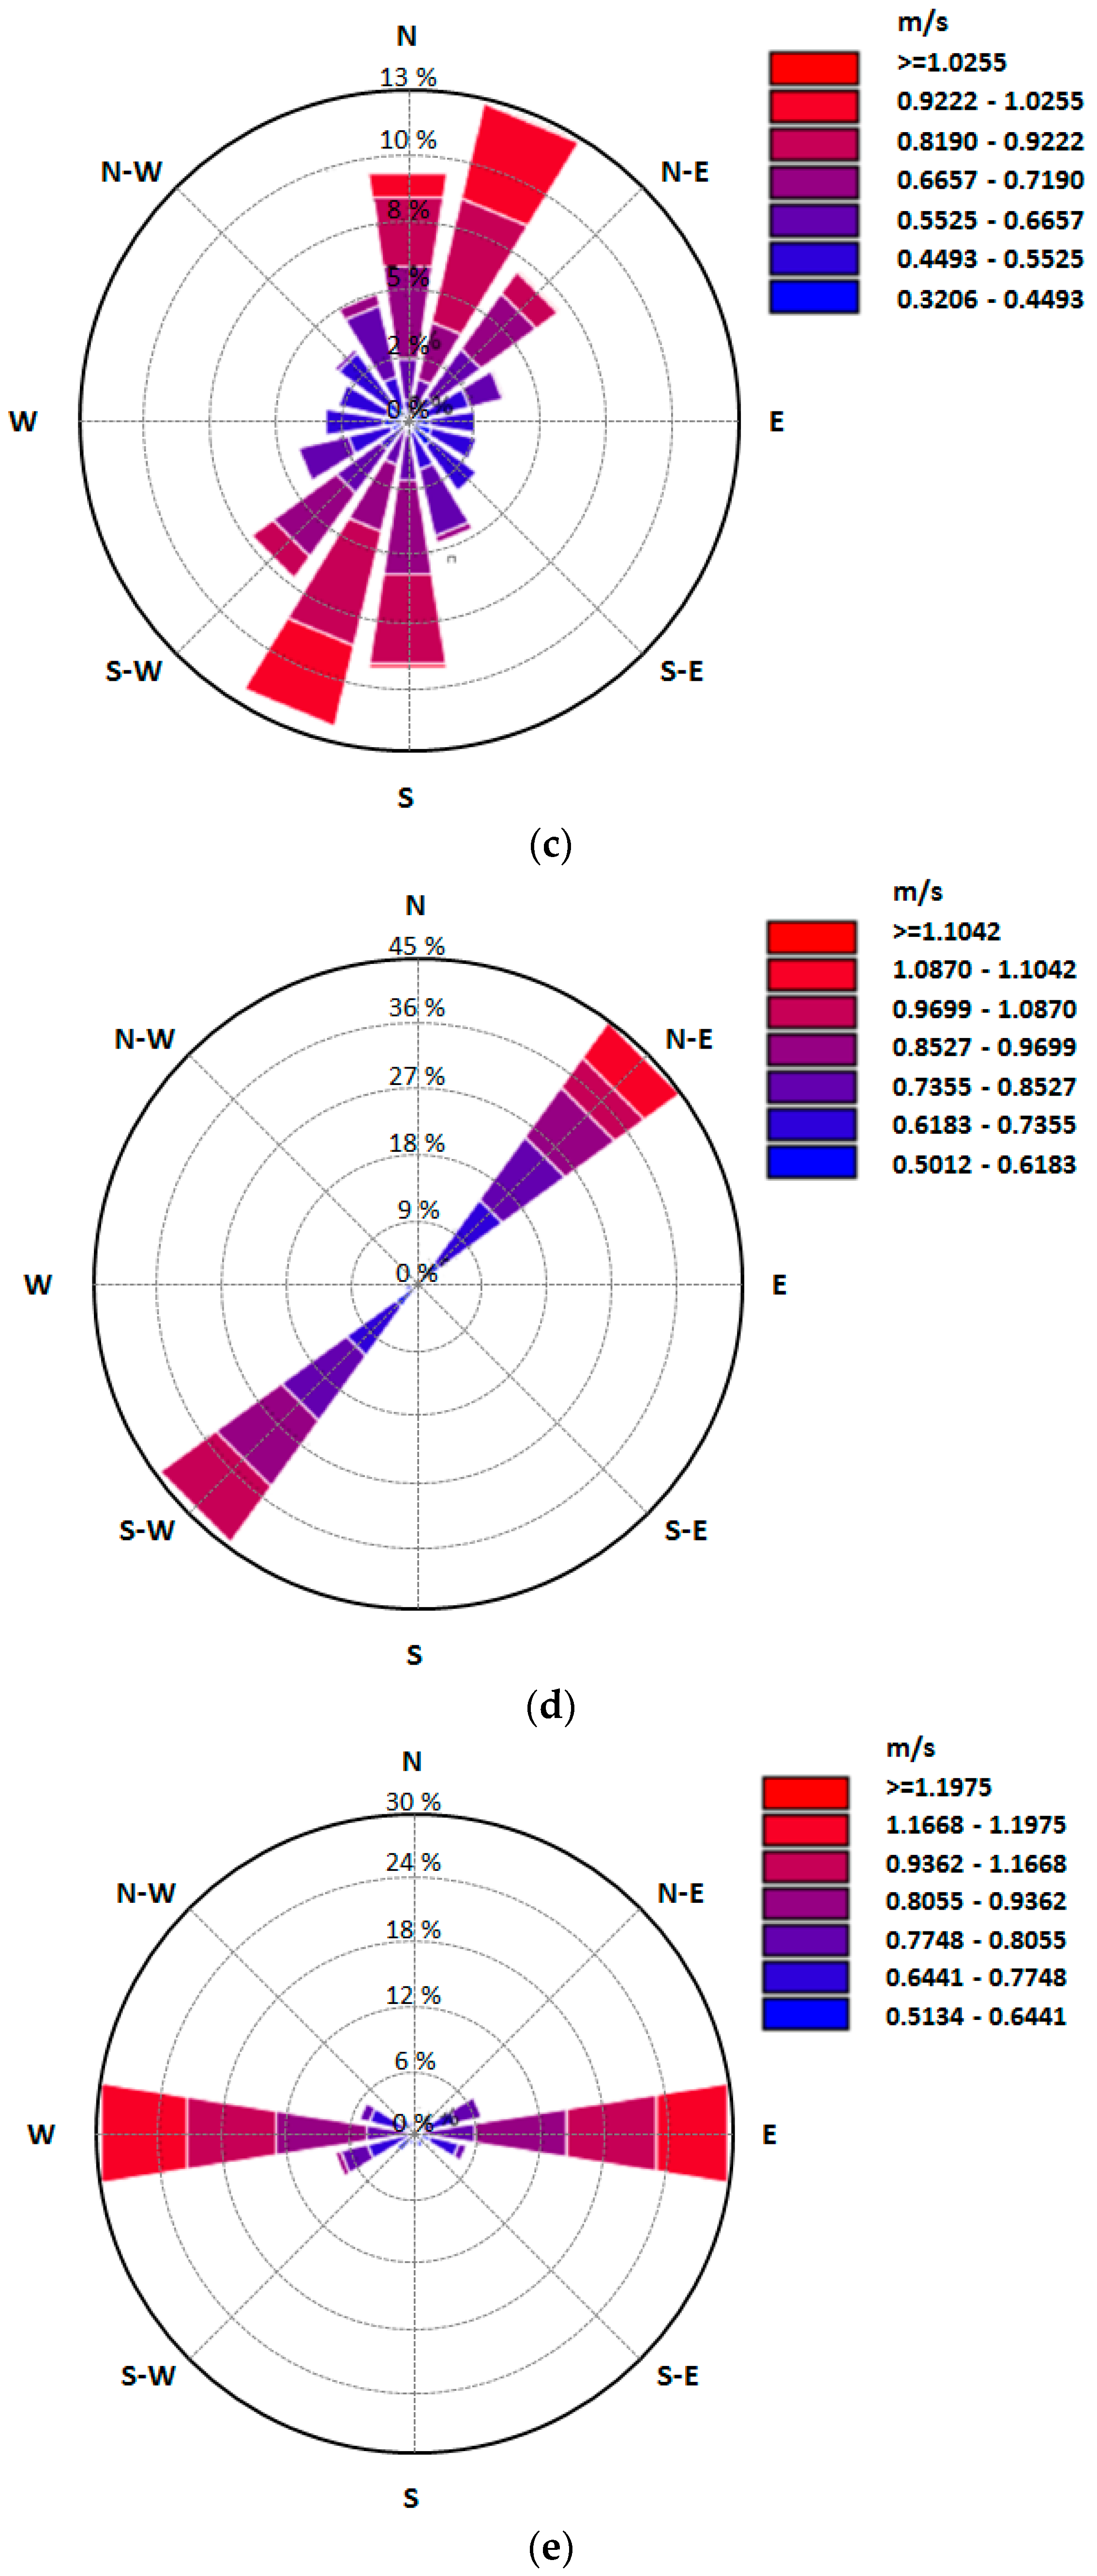
In addition, the energy of the currents has the advantage of being predictable because it is mainly correlated with the tidal coefficients. Cities like Agadir, Tangier, EL Hoceima, Oualidia and Dakhla are among the economically promising sites. Overseas, sites with spikes or pass effects are potentially interesting. The statistical study carried out shown that three more important areas where the current is more interesting, see Figure 4.
During the spring tides, the currents are very intense, especially at the entrance of the Dakhla Bay and the Oualidia lagoon in the surrounding areas (between 1 and 2 m/s). In its central part and towards the north of the bay, these currents decrease in intensity (<1 m/s). In the dead water, these tidal currents generally have intensities lower than 0.6 m/s in all the zones of the bay and subjected to the strong influence of the semi-diurnal tides.
Whatever the type of high and low water tides, the tidal currents are bidirectional in the North East—South West axis of the bay, following the cycles of the semi-diurnal tide. During the periods of spring tides and waves, it is found that the strongest currents generally occur downstream of the bay between latitudes 23°38′ N and 23°44′ N (i.e., between Lasarga and Dakhla on the West shore of the bay). On the eastern shore of the bay, the strongest currents with intensities between 1 and 2 m/s are mostly between Hoja Lalmera, El Argoub, and Puertito. Upstream of the bay and beyond latitudes higher than 23°44′ N (between Dakhla, Boutalha and towards aquaculture parks), current intensities are low, generally between 0.1 and 0.4 m/s. During the ebb and in the central zone and upstream of the bay, cyclonic gyratory cells towards the west bank and/or anticyclonic cells towards the east bank of the current are observed. These tides follow a non-regular and shallow bathymetry and present a multitude of channels in these areas. In periods of high tides, the tidal currents are thus weaker; whose intensities are less than 0.4 m/s in the bay. It is found that the strongest currents occur at the entrance of the bay, between La Sarga (west side of the bay) and Puertito-Argoub (east side of the bay). These gyratory cells of the current are also observed in the central zone and upstream of the bay during the ebbs. Although weak and due to the influence of the winds, these cells will generate drift currents near the coast. Another peculiarity of the marine circulation of the bay is that the outgoing tidal currents (ebb tides) are generally slightly more intense than the incoming currents (waves), either in tides of bright waters or dead waters. Figure 5 presents the marine current velocity rose diagrams.
3.1. Available Energy Potential
Once the velocity distribution in the region of concern has been evaluated, it can be practiced to the HAMCT power curve to calculate the annual power output.
The Horizontal Axis Marine Current Turbine (HAMCT) is the most advanced tidal stream technology available that can be employed to calculate the quantity of energy required [23,24]. In this study the rotor diameter is 22 m, so the swept area A, is 380 m2. Characteristics required are the power produced in various speed bin P(Ui), efficiency of the machine (ηR), rated speed, and electrical efficiencies.
The rotor efficiency (ηR) can be supposed to increase from 40% at the cut-in velocity to attain 55% at the rated velocity. The cut-in velocity is the minimum velocity needed for machine operation and is considered constant at 0.4 m/s. This hypothesis simplifies the analysis and does not impose significant constraints on accuracy, since the accessible power from marine currents at speeds below 0.4 m/s is usually smaller than 5% of the total accessible power. Finally, the mean powertrain efficiency (ηPT) can be supposed as 80% for a HACMT. All those parameters will be used to calculate the electrical power produced in each speed bin as follows [25,26]:
where:
: the water density (Kg m−3); A: represents the rotor swept area (m2); Ui: is the marine current velocity (m/s).
Tidal energy potential in the Mediterranean Sea is very quiet with a view to other regions of the world, where tidal energy field is previously existing (e.g., UK, France, Norway, China, and Canada) [10]. In the Mediterranean Sea, there is no industrial development of the marine current energy sector. As tidal turbines require a stream velocity of at least 1.5–2 m/s to work effectively, the tidal energy potential of the sea sets specific constraints. Based on the current speed limits presented, very few Mediterranean sites could be of special interest. The exceptions of the Straits of Dardanelles, Gibraltar, and especially the Strait of Messina (where the tidal stream energy resource offers its highest values in the Mediterranean) have been under consideration. Concise attention has been provided so far to the weak tides and tides remarked in the Mediterranean straits. Tides in the Mediterranean sea are typically semidiurnal and presents two highs/lows per day, although with differences in heights due to the diurnal inequality, variations of the declination of the Moon and other non-astronomical agents such as the depth, topography and size of ocean basins, shoreline configuration and meteorological requirements. The statistical study of tide presents a typical fortnight cycle of spring-neap tides, with higher mean sea level variability at Tetouan because of its westernmost location. This implies an excellent resource energy production that make this site more suitable for the installation of HAMCT. Maximum ranges of about 1.3 m are mentioned during the most active spring tides at Tetouan whereas minimum range is lower than 0.4 m that takes place during the weaker neap tides. This variation is also observed at Tetouan, showing amplitude much higher than that reached at the northern limit of the Strait. Moreover, a time lag of about two months is also remarked probably because of the wind regime. Months of May and September has been taken as representative of the annual MSL (Mean Sea Level) average at Tetouan and El Hoceima, respectively. Those months will be used to estimate the average power density during the year.
The Moroccan Atlantic coastline has a large potential for tidal energy production. It may contribute meaningful profits with less cost and fewer ecological influences as compared to traditional dam-. The present opportunity, however, lies in the strong and constant marine currents velocity of the Strait of Gibraltar. A seafloor mounted tidal energy converters in this area could suitable produce an important quantity of power.
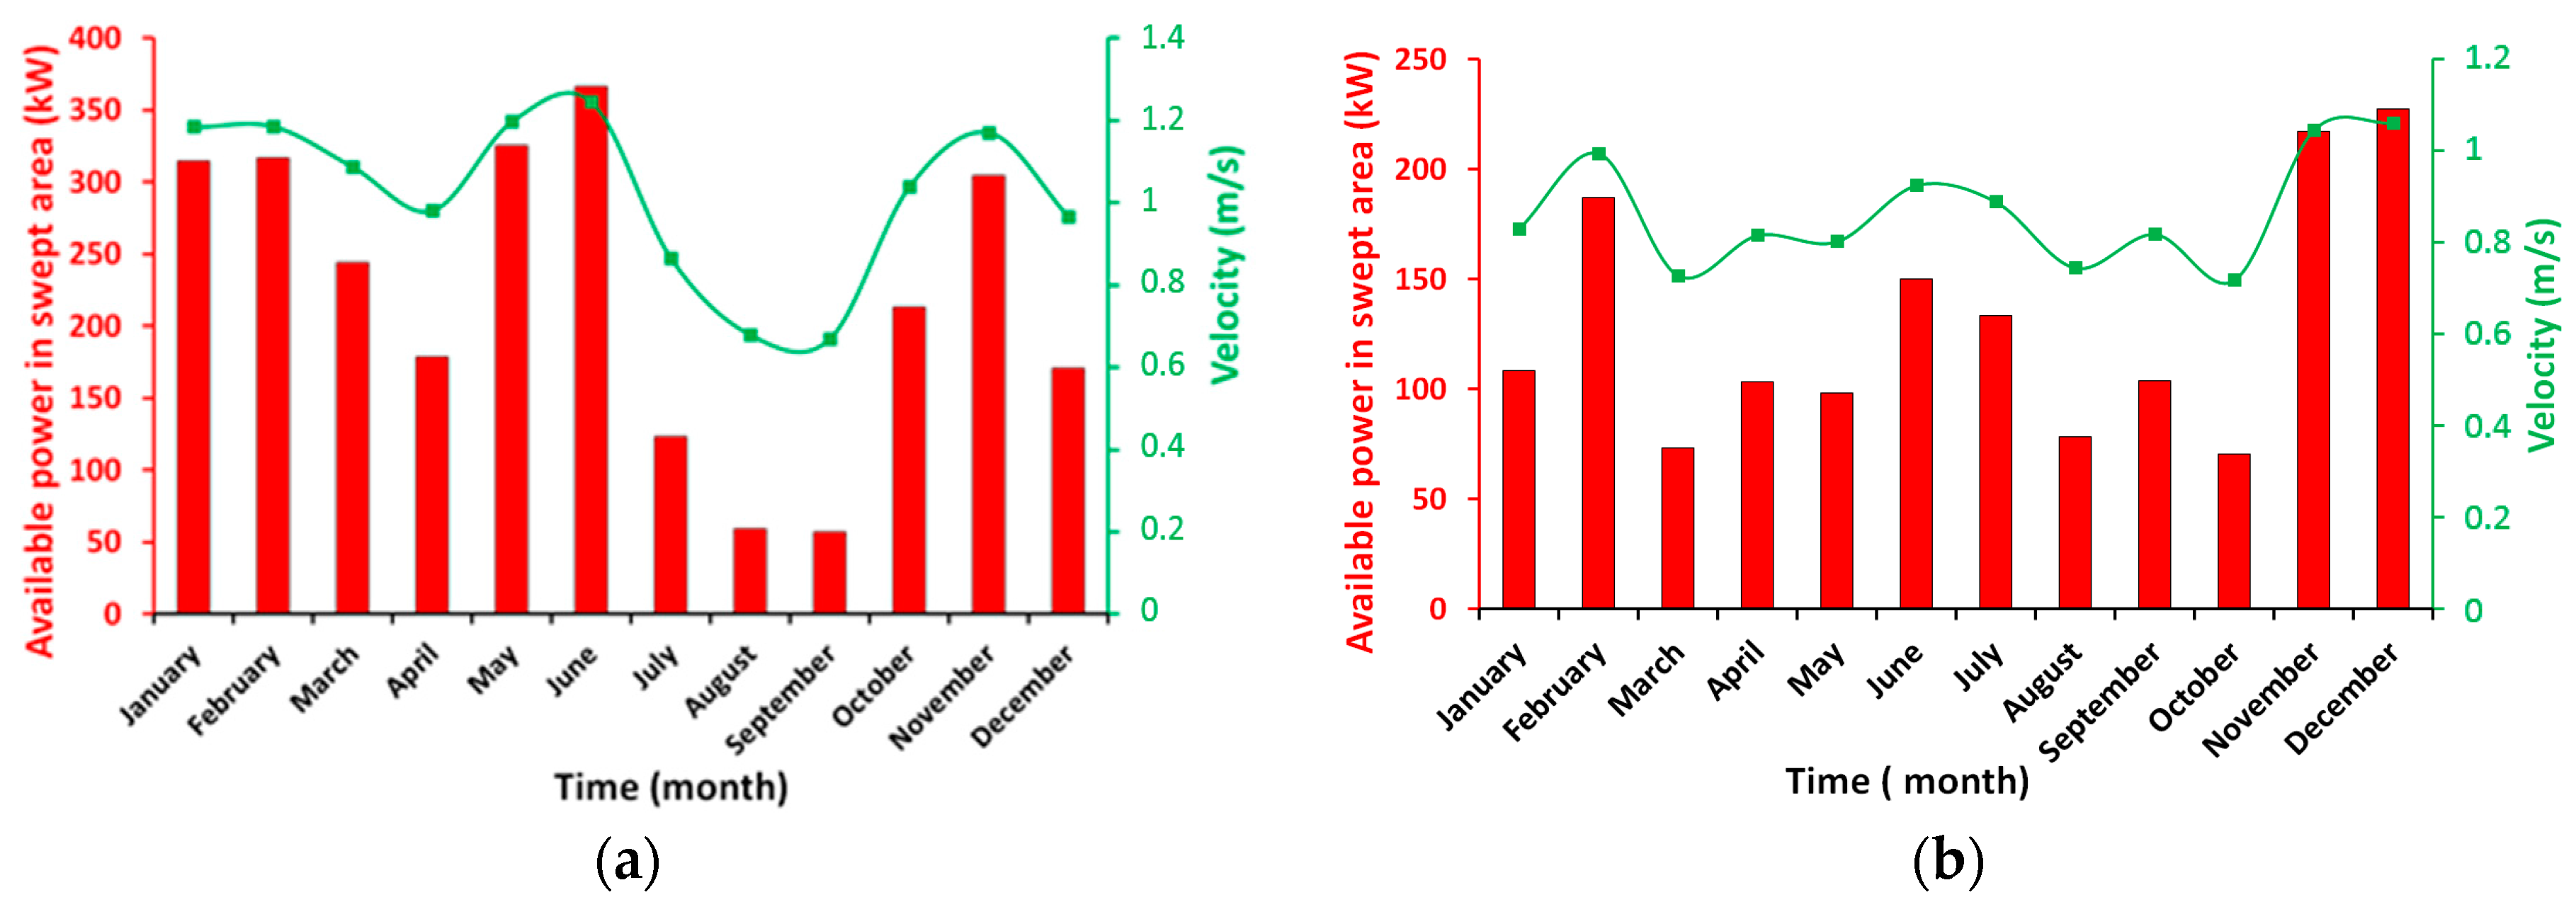
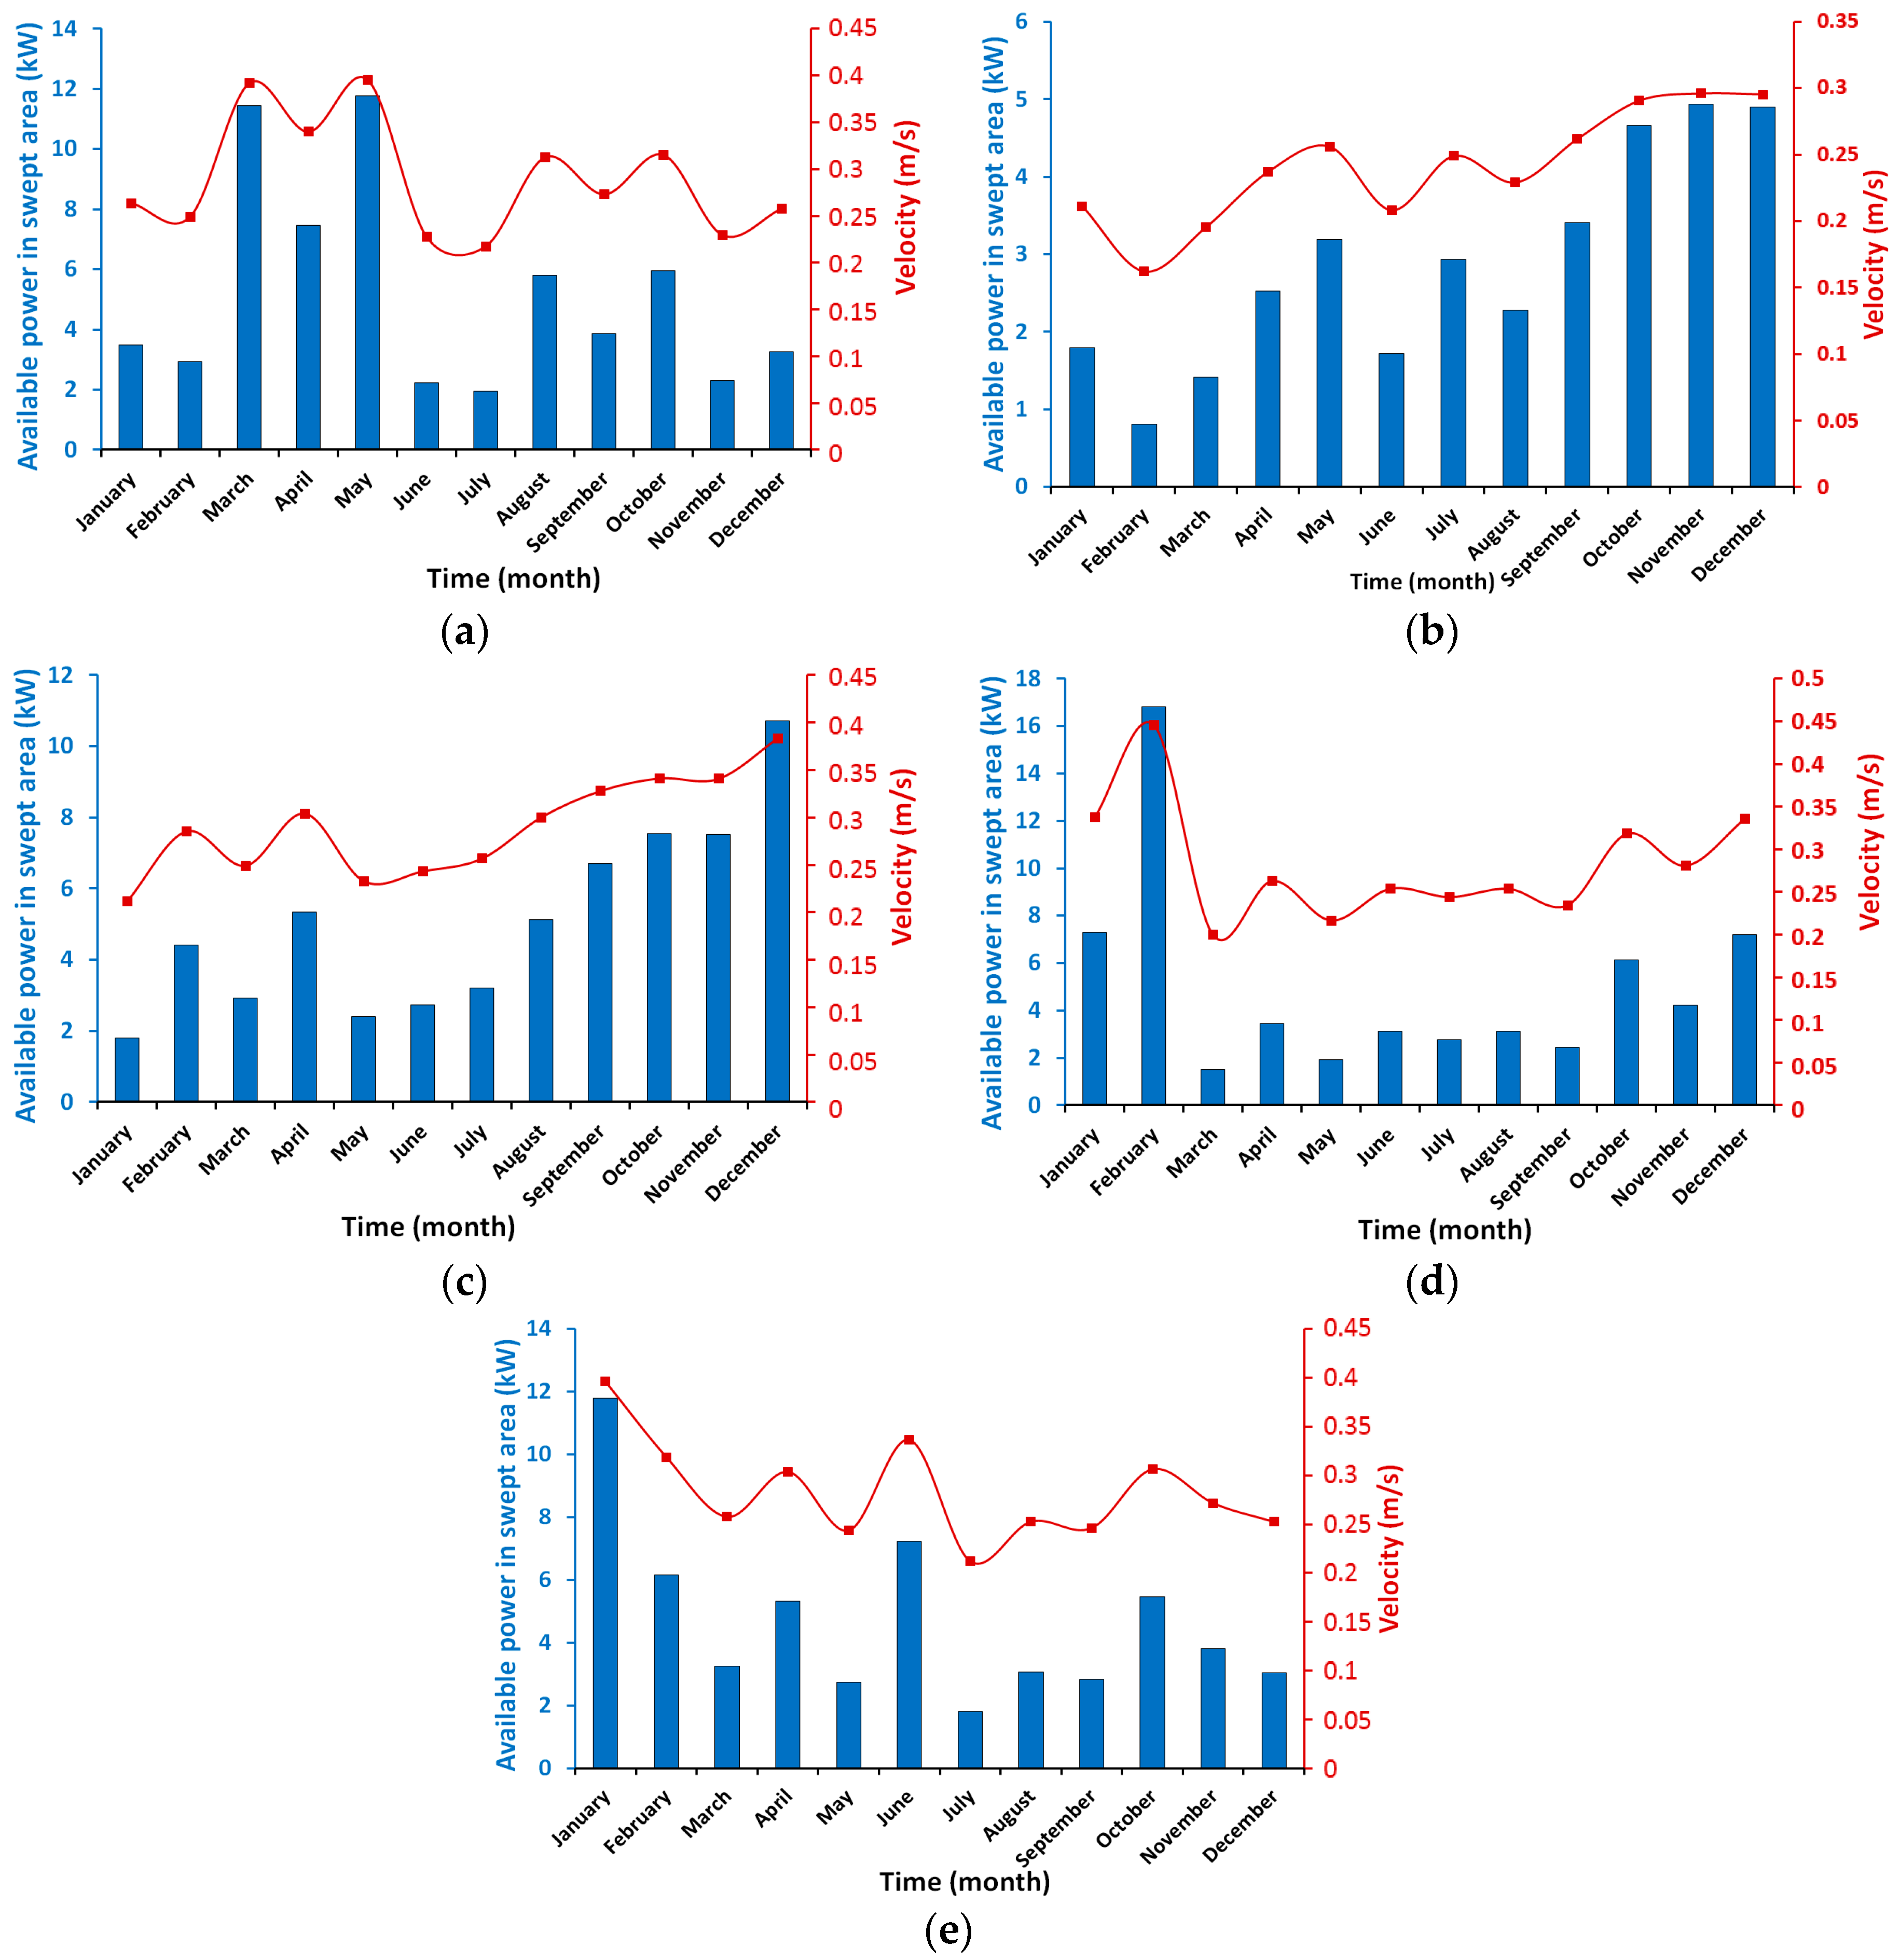
The amplitude of the tide obviously has an effect on the speed of the current. Near the coasts, we can consider as a first approximation that the maximum intensity reached by the current during a tide is proportional to the coefficient of this tide. Often, the speed of the flow is different from that of the ebb tide, but the speeds remain roughly proportional to the amplitude. In general, the flow has a higher intensity with rapid growth and decay, while the ebb is smaller in amplitude with a more stable regime over time. It is noted that a tidal turbine installed on a given site is subjected to highly variable currents and that the available power changes a lot from one tide to another. (Figure 6, Figure 7 and Figure 8). There are perfectly predictable periods of dead water during which the currents are very weak, these periods last 2 to 3 days and are renewed twice a month. In periods of production, the duration of the reversal of the current gives only about twenty minutes of relatively calm current. The frequency and timing of interventions can be accurately predicted from the tide tables, corrected for weather conditions. The installation and lifting technique as well as the corresponding procedures must take into account these particularities.
a. Mediterranean Sea
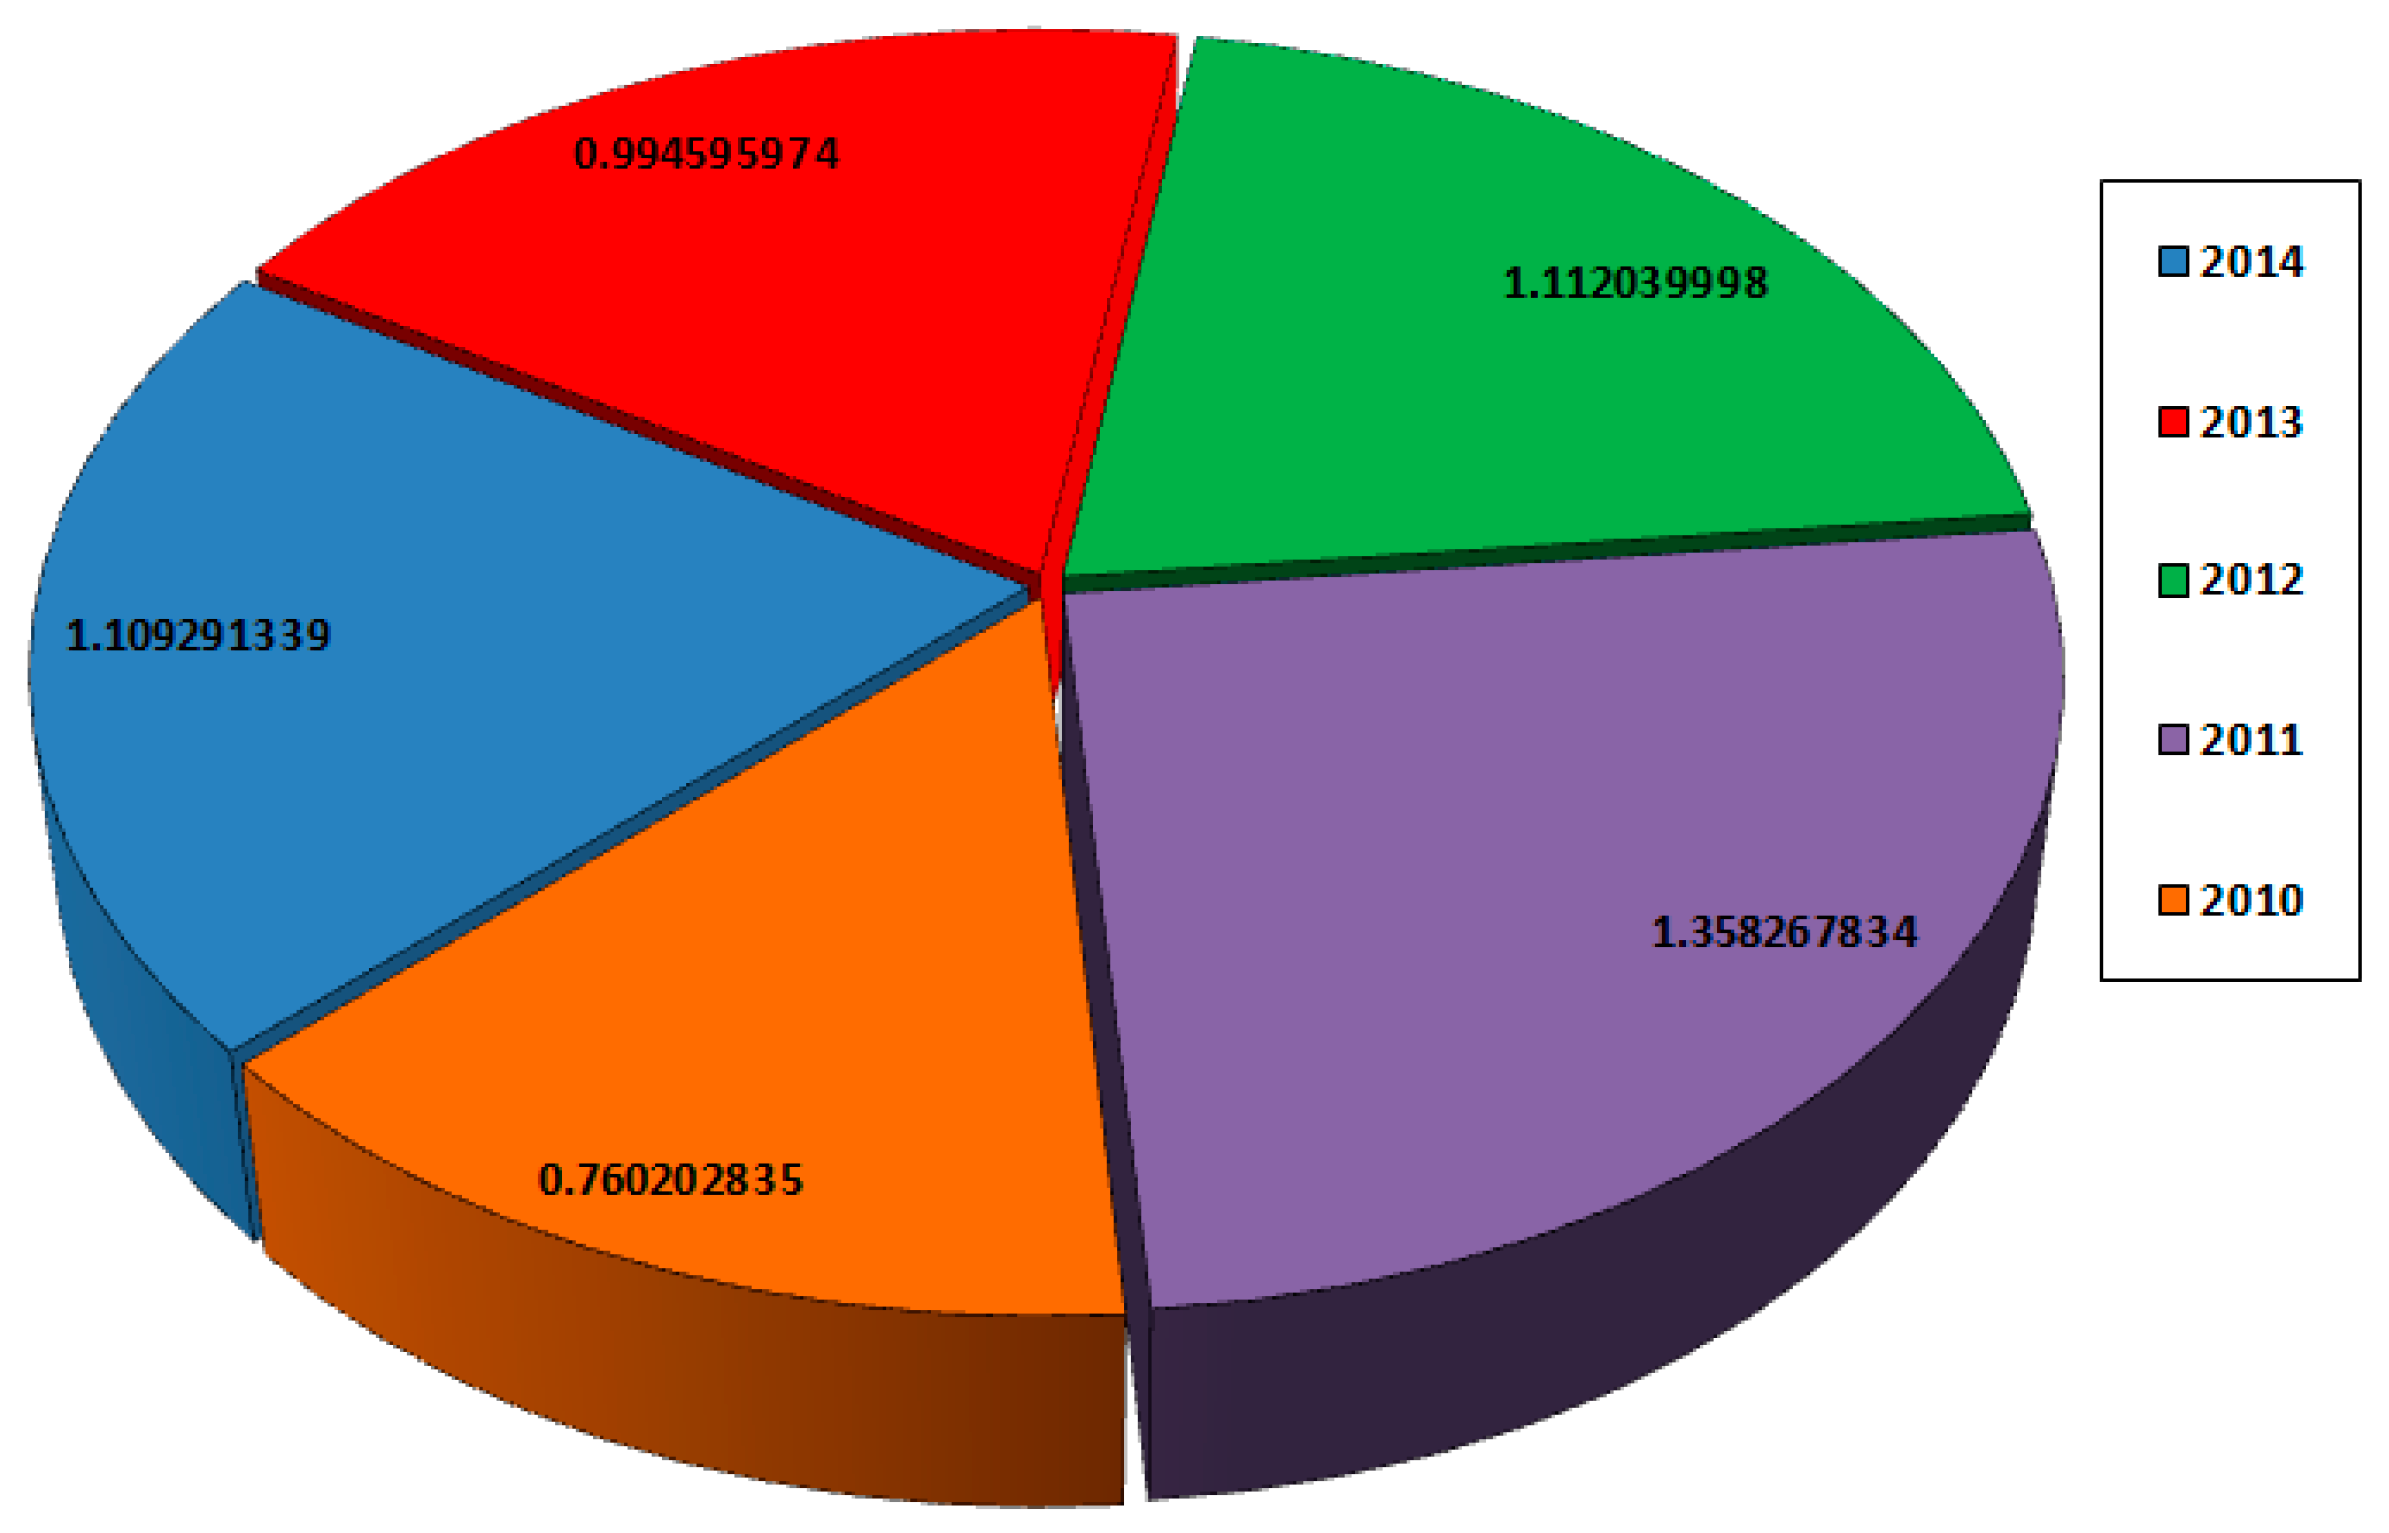
Figure 6 shows the variation of velocity and available power around the Mediterranean Sea. The maximal depth-average speed is higher than 1.4 m/s between the Strait of Gibraltar and Tanger when the available power is over 400 MW. It can be concluded that the Gibraltar strait is the excellent site for tidal current production. Analyses of the behavior of the intensity of the surface current in the Mediterranean Sea, which spread from 2010 to 2014, showed that the minimum current values are almost zero. On the other hand, the maximum intensities recorded reached strong values see 2.4 m/s, all found around the Strait of Gibraltar (Lat: 36.000, Lon: −5.250) and (Lat: 36.000, Lon: −5.333) close to Sebta and Tetouan.
- For the year 2010, it has been found that the minimum values of the intensity of the current are almost zero and the maximum values are between 0.669–1.196 m/s. This last value observed in May and at the latitude: 36.000° and the longitude: −5.250°. Average current intensities vary between 0.235 m/s (±0.054) in August and 0.316 m/s (±0.089) in the month of January.
- For the year 2011, it has been noted that the minimum intensities are almost zero and maximum intensities vary between 0.718–1.061 m/s. the maximum values are observed in December at latitude: 36.000° and longitude: −5.333°.
- For the year 2012, it has been observed that the minimum values are very low and the maximum intensities are between (0.739–1.178) m/s. The maximum value is observed in April at the latitude: 36.000° and the longitude: −5.333°.
- For the year 2013, the minimum values of the intensity of the current are almost zero and the maximum values are between 0.610–1.256 m/s. The value 1.256 m/s are observed in March at latitude: 36.000° and longitude: −5.333°.
- For the year 2014, it has been noted that the minimum intensities are almost zero and the maximum values are between 0.818–1.194 m/s. The value 1.194 m/s is located in September at latitude: 36.000° and longitude: −5.333°.
b. South Coast Atlantic
The same study, for the same period, was carried out in the south coast of the Atlantic in Morocco. Figure 7 shows the variation of velocity and available power in the south coast of the Atlantic. The study of the intensity of surface current in this area has covered five years (2002–2014); it has clearly shown that the minimum intensities are almost zero. The maximum values over the thirteen years are coastal and (0.119–0.445) m/s between the south of Dakhla (latitude: 21.004° and longitude: −17.245°) and Boujedour latitude: 25.875° and longitude: −17.375°. The results thus obtained are very close to the statistics carried out in 30 m depth.
- For the year 2010, it has been found the minimum values of the intensity of the current are almost zero and the maximum values are between 0.217 m/s and 0.395 m/s. This last value is of May and observed at the latitude: 21.004° and the longitude: −17.245°. Average current intensities vary between 0.067 m/s (±0.010) in July and 0.097 m/s (±0.017) in May.
- For the year 2011, it has been noted that the minimum intensities are almost zero. The highest peak intensities vary between (0.162–0.296) m/s. The maximum value is 0.296 m/s, taken in November at the latitude: 25.757° and the longitude: −16.495°. The average current values are recorded between 0.004 m/s (±0.018) in December and 0.107 m/s (±0.016) in November.
- For the year 2012, it has been found that the minimum values are very low and the maximum intensities are between 0.211 m/s and 0.383 m/s. This last value is observed in December at latitude: 21.004° and longitude: −17.245°. However, average current intensities varied between 0.066 m/s (±0.012) in January and 0.097 m/s (±0.023) in November.
- For the year 2013, the minimum values of the intensity of the current are almost zero and the maximum values are between (0.019–0.445) m/s. The value 0.445 m/s are observed in the month of February at the latitude: 21.004° and the longitude: 17.245. The average intensities range from 0.063 m/s (±0.011) in March to 0.087 m/s (±0.016) for the month of August.
- For the year 2014, it has been noticed that the minimum intensities are almost zero while the high maximum intensities take values between (0.212–0.395) m/s. The value 0.395 m/s are located in January at the latitude: 26.004° and the longitude: −18.495. The average intensities range from 0.073 m/s (±0.013) observed in February to 0.090 m/s (±0.015) in December.
c. North Coast Atlantic
Figure 8 shows the variation of velocity and available power on the north coast of the Atlantic in Morocco. The study of the intensity of surface current in the north coast of the Atlantic has covered five years (2010–2014); it has clearly shown that the minimum intensities are almost zero. The maximum values over the five years are very coastal and between 0.235 and 0.812 m/s all concentrated in (latitude: 26.416° and longitude: −14.416°) and (latitude: 26.116° and longitude: −14.500°).
- For the year 2010, it has been found that the minimum values of the intensity of the current are almost zero and the maximum values of the high intensities are between 0.290 m/s and 0.544 m/s. The last value is observed in May at the latitude: 24.416° and the longitude: −14.500°. Average current intensities vary between 0.015 m/s (±0.015) in January and 0.118 m/s (±0.017) in July.
- For the year 2011, it has been observed that the minimum intensities are almost zero whereas the maximum intensities vary between (0.281–0.679) m/s. The upper value of the maximums is located in October at latitude: 26.166° and longitude: −14.500°. The values regarding the average current are recorded between 0.061 m/s (±0.013) in January and 0.1209 m/s (±0.017) in August.
- For the year 2012, it was found that that the minimum values are very low and the higher intensities are between 0.319 m/s and 0.698 m/s. The last value observed was of May and was at the latitude: 26.416° and the longitude: −14.416°. Regarding average current intensities, they vary between 0.074 m/s (±0.015) in November and 0.126 m/s (±0.019) in August.
- For the year 2013, the minimum values of the intensity of the current are almost zero and the maximum values of these intensities take values between (0.266–0.681) m/s. The value 0.681 m/s are observed in the month of October at the latitude: 26.416° and the longitude: −14.416. The average intensities range from 0.063 m/s (±0.011) in March to 0.087 m/s (±0.016) for the month of August.
- For the year 2014, it has been noticed that the minimum intensities are almost zero while the high maximum intensities take values between (0.281–0.645) m/s. The value 0.645 m/s is located in August at the latitude: 26.416° and the longitude: −14.416°. The average intensities range from 0.072 m/s (±0.009) observed in December to 0.135 m/s (±0.025) in August.
3.2. Mean Annual Electrical Power
The average annual electrical power (Paverage) can be calculated by combining the speed distributions f(Ui) with the average consumed power for several velocities P(Ui) obtained using the following equation:
Figure 9 shows electrical power output in the Mediterranean Sea. The maximum depth-average speed is higher than 1.4 m/s between the Strait of Gibraltar and Tanger when the available power is over 355 MW. It can be concluded that the Gibraltar strait is the best site for the tidal current production.
Figure 10 shows the electrical power output of the south coast of the Atlantic. The maximum depth-average speed 0.42 m/s in Agadir and in Dakhla is higher than 1 m/s when the available power is over 13 MW.
Figure 11 shows the electrical power output on the north coast of the Atlantic. The maximum depth-average speed is higher than 0.8 m/s between Tanger and El Hoceima when the available power is over 63 MW.
4. Conclusions
This investigation provides preliminary results of an evaluation of the tidal stream power in different regions in Morocco in order to activate the country’s green energy industry. Our results are founded on data from Copernicus Marine Environment Monitoring Service. It was remarked that the main difficulty in the evaluations is the requirement of accurate bathymetric data, particularly at the various straits, bays, and lagoons. The results obtained approved that the strait under examination has tremendous potential for the development of renewable marine energy production.
The maximal and mean depth-average velocity around the Strait of Gibraltar is greater than 2 m/s and between 0.9 m/s~1.8 m/s, respectively. The maximal and mean power density are 1800 W/m2 and between 200 W/m2~600 W/m2. However, the mean velocity can reach 2.1 m/s in some places and the corresponding mean power density is 4746 W/m2. The investigation has also presented that according to the characteristics of the topography of the locality, it is possible to imagine a modular strategy to the establishment of size-dependent HAMCT to be used in phases leading into account technology improvement and progress. It is expected that this research will provide a complete overview of the potential of such a resource and a pointer to those considering the development of devices to utilize marine currents for power production. However, there are some constraints that have to be overcome prior to any deployment. It is important to emphasize that the results reported here were obtained with a simplified model that cannot claim to represent the physical reality. Rigorous modeling requires powerful means of calculation to account for the flow of water throughout the area, to a great distance from the site.
Author Contributions
Mourad Nachtane, Mostapha Tarfaoui, Karim Hilmi, Dennoun Saifaoui and Ahmed El Moumen contributed to the design and implementation of the research, to the analysis of the results and to the writing of the manuscript.
Conflicts of Interest
The authors of this paper declare that they have no conflict of interest, and compliance with ethical standards.
Abbreviations-Acronyms
| HAMCT | Horizontal Axis Marine Current Turbine |
| GW | Gigawatt |
| MW | Megawatt |
| R&D | Research and Development |
| TW | Terawatt |
| CMEMS | Copernicus Marine Environment Monitoring Service |
| MAD | Moroccan dirham |
| kWh | Kilowatt-hour |
| UK | United Kingdom |
| MSL | Mean Sea Level |
References
- Mourad, N.; Mostapha, T.; Dennoun, S. Promotion of Renewable Marines Energies in Morocco: Perspectives and Strategies. World Acad. Sci. Eng. Technol. Int. J. Energy Power Eng. 2018, 12. [Google Scholar] [CrossRef]
- Aroussy, Y.; Nachtane, M.; Saifaoui, D.; Tarfaoui, M. Numerical investigation of a reverse osmosis desalination system with cogeneration and renewable energy integration. Int. J. Sci. Eng. Res. 2016, 7, 129–133. [Google Scholar]
- Legrand, C. Assessment of Tidal Energy Resource: Marine Renewable Energy Guides; European Marine Energy Centre: Orkney, UK, 2009. [Google Scholar]
- Charlier, R.H. A “sleeper” awakes: Tidal current power. Renew. Sustain. Energy Rev. 2003, 7, 515–529. [Google Scholar] [CrossRef]
- Do-Seong, B.; Hart, D.E.; Jeong, W.-J. Tidal current energy resources off the South and West coasts of Korea: Preliminary observation-derived estimates. Energies 2013, 6, 566–578. [Google Scholar]
- Sierra, J.P.; Martín, C.; Mösso, C.; Mestres, M.; Jebbad, R. Wave energy potential along the Atlantic coast of Morocco. Renew. Energy 2016, 96, 20–32. [Google Scholar] [CrossRef]
- Sutherland, G.; Foreman, M.; Garrett, C. Tidal current energy assessment for Johnstone strait, Vancouver island. Proc. Inst. Mech. Eng. Part A J. Power Energy 2007, 221, 147–157. [Google Scholar] [CrossRef]
- Nachtane, M.; Tarfaoui, M.; El Moumen, A.; Saifaoui, D. Numerical investigation of damage progressive in composite tidal turbine for renewable marine energy. In Proceedings of the 2016 International Renewable and Sustainable Energy Conference (IRSEC), Marrakech, Morocco, 14–17 November 2016; pp. 559–563. [Google Scholar]
- Ng, K.W.; Lam, W.H.; Ng, K.C. 2002–2012: 10 years of research progress in horizontal-axis marine current turbines. Energies 2013, 6, 1497–1526. [Google Scholar] [CrossRef]
- Soukissian, T.H.; Denaxa, D.; Karathanasi, F.; Prospathopoulos, A.; Sarantakos, K.; Iona, A.; Georgantas, K.; Mavrakos, S. Marine Renewable Energy in the Mediterranean Sea: Status and Perspectives. Energies 2017, 10, 1512. [Google Scholar] [CrossRef]
- Soukissian, T.; Karathanasi, F.; Axaopoulos, P. Satellite-based offshore wind resource assessment in the Mediterranean Sea. IEEE J. Ocean. Eng. 2017, 42, 73–86. [Google Scholar] [CrossRef]
- Tarfaoui, M.; Nachtane, M.; Khadimallah, H.; Saifaoui, D. Simulation of Mechanical Behavior and Damage of a Large Composite Wind Turbine Blade under Critical Loads. Appl. Compos. Mater. 2017, 1–18. [Google Scholar] [CrossRef]
- Nachtane, M.; Tarfaoui, M.; Saifaoui, D.; El Moumen, A.; Hassoon, O.H.; Benyahia, H. Evaluation of durability of composite materials applied to renewable marine energy: Case of ducted tidal turbine. Energy Rep. 2018, 4, 31–40. [Google Scholar] [CrossRef]
- El-Katiri, L. Les Atouts du Maroc dans le Domaine de l’Energie Verte/Morocco’s Green Energy Opportunity; OCP Policy Centre: Rabat, Morocco, 2016. [Google Scholar]
- Amry, Y.; El Gaidi, M.; Nachtane, M. Design and optimization of a smart meter to meet the growing needs of energy in Morocco. In Proceedings of the 2016 International Renewable and Sustainable Energy Conference (IRSEC), Marrakech, Morocco, 14–17 November 2016; pp. 1115–1118. [Google Scholar]
- Manasseh, R.; Sannasiraj, S.A.; McInnes, K.L.; Sundar, V.; Jalihal, P. Integration of wave energy and other marine renewable energy sources with the needs of coastal societies. Int. J. Ocean Clim. Syst. 2017, 8, 19–36. [Google Scholar] [CrossRef]
- Hassoon, O.H.; Tarfaoui, M.; El Moumen, A.; Benyahia, H.; Nachtane, M. Numerical Evaluation of Dynamic Response for Flexible Composite Structures under Slamming Impact for Naval Applications. Appl. Compos. Mater. 2017, 1–18. [Google Scholar] [CrossRef]
- Amegroud, T. Morocco’s Power Sector Transition: Achievements and Potential; Istituto Affari Internazionali: Roma, Italy, 2015. [Google Scholar]
- Sotillo, M.G.; Lorente, P.; Levier, B.; Drevillon, M.; Chanut, J.; Amo Baladrón, A. Quality Information Document for Atlantic—Iberian Biscay Irish—Ocean Physics Analysis and Forecasting Product. Available online: http://marine.copernicus.eu/services-portfolio/access-to-products/ (accessed on 30 November 2017).
- Lecornu, F.; Pineau-Guillou, L.; Dumas, F.; Le Traon, P.Y.; Gohin, F.; Menesguen, A. PREVIMER: A coastal operational oceanography system coupled to the Copernicus Marine Service. In Proceedings of the GODAE OceanView Symposium 2013 5 years of GODAE OceanView—Current Progress and Future Priorities, Baltimore, MD, USA, 4–6 November 2013. [Google Scholar]
- Rusu, E. Evaluation of the wave energy conversion efficiency in various coastal environments. Energies 2014, 7, 4002–4018. [Google Scholar] [CrossRef]
- NOVELTIS’Global Marine Tidal Currents. Available online: http://tips.noveltis.com/ (accessed on 30 November 2017).
- Nachtane, M.; Tarfaoui, M.; Saifaoui, D. Matériaux Composites Pour les Energies Marines Renouvelables. Available online: https://www.editions-ue.com/ (accessed on 21 December 2017).
- Aroussy, Y.; Nachtane, M.; Saifaoui, D.; Tarfaoui, M.; Farah, Y.; Abid, M. Using renewable energy for seawater desalination and electricity production in the site ocp Morocco. J. Sci. Arts 2016, 16, 395–406. [Google Scholar]
- Nachtane, M.; Tarfaoui, M.; El Moumen, A.; Saifaoui, D. Damage prediction of horizontal axis marine current turbines under hydrodynamic, hydrostatic and impacts loads. Compos. Struct. 2017, 170, 146–157. [Google Scholar] [CrossRef]
- Blunden, L.S. New Approach to Tidal Stream Energy Analysis at Sites in the English Channel. Ph.D. Thesis, University of Southampton, Southampton, UK, 2009. [Google Scholar]
- Chen, W.B.; Liu, W.C.; Hsu, M.H. Modeling evaluation of tidal stream energy and the impacts of energy extraction on hydrodynamics in the Taiwan Strait. Energies 2013, 6, 2191–2203. [Google Scholar] [CrossRef]
- Allouhi, A.; Zamzoum, O.; Islam, M.R.; Saidur, R.; Kousksou, T.; Jamil, A.; Derouich, A. Evaluation of wind energy potential in Morocco’s coastal regions. Renew. Sustain. Energy Rev. 2017, 72, 311–324. [Google Scholar] [CrossRef]
- Liberti, L.; Carillo, A.; Sannino, G. Wave energy resource assessment in the Mediterranean, the Italian perspective. Renew. Energy 2013, 50, 938–949. [Google Scholar] [CrossRef]
- Arena, F.; Laface, V.; Malara, G.; Romolo, A.; Viviano, A.; Fiamma, V.; Sannino, G.; Carillo, A. Wave climate analysis for the design of wave energy harvesters in the Mediterranean Sea. Renew. Energy 2015, 77, 125–141. [Google Scholar] [CrossRef]
- Hilmi, K.; Orbi, A.; Makaoui, A.; Bouksim, H.; Idrissi, M.; Ettahiri, O.; Benyounes, A.; Ait Chattou, M. Circulation marine de la baie de Dakhla (Sud du Maroc) par modèle hydrodynamique 2D. Eur. Sci. J. 2017, 13, 69–82. [Google Scholar]
- Jayed, M.; Benbrahim, S.; Bakkas, S.; Ramdani, M.; Flower, R. Accumulation of Organochlorines in the European Clam (Ruditapes decussatus) and Sediment of the Oualidia Lagoon (Morocco). Bull. Environ. Contam. Toxicol. 2015, 94, 614–621. [Google Scholar] [CrossRef] [PubMed]
- A l’Approche du Détroit de Gibraltar. Available online: http://sailing.morisseauconsulting.com/a-lapproche-du-detroit-de-gibraltar/ (accessed on 30 December 2017).
Figure 1.
Tidal range resources worldwide. Source: www.aviso.com.
Figure 1.
Tidal range resources worldwide. Source: www.aviso.com.
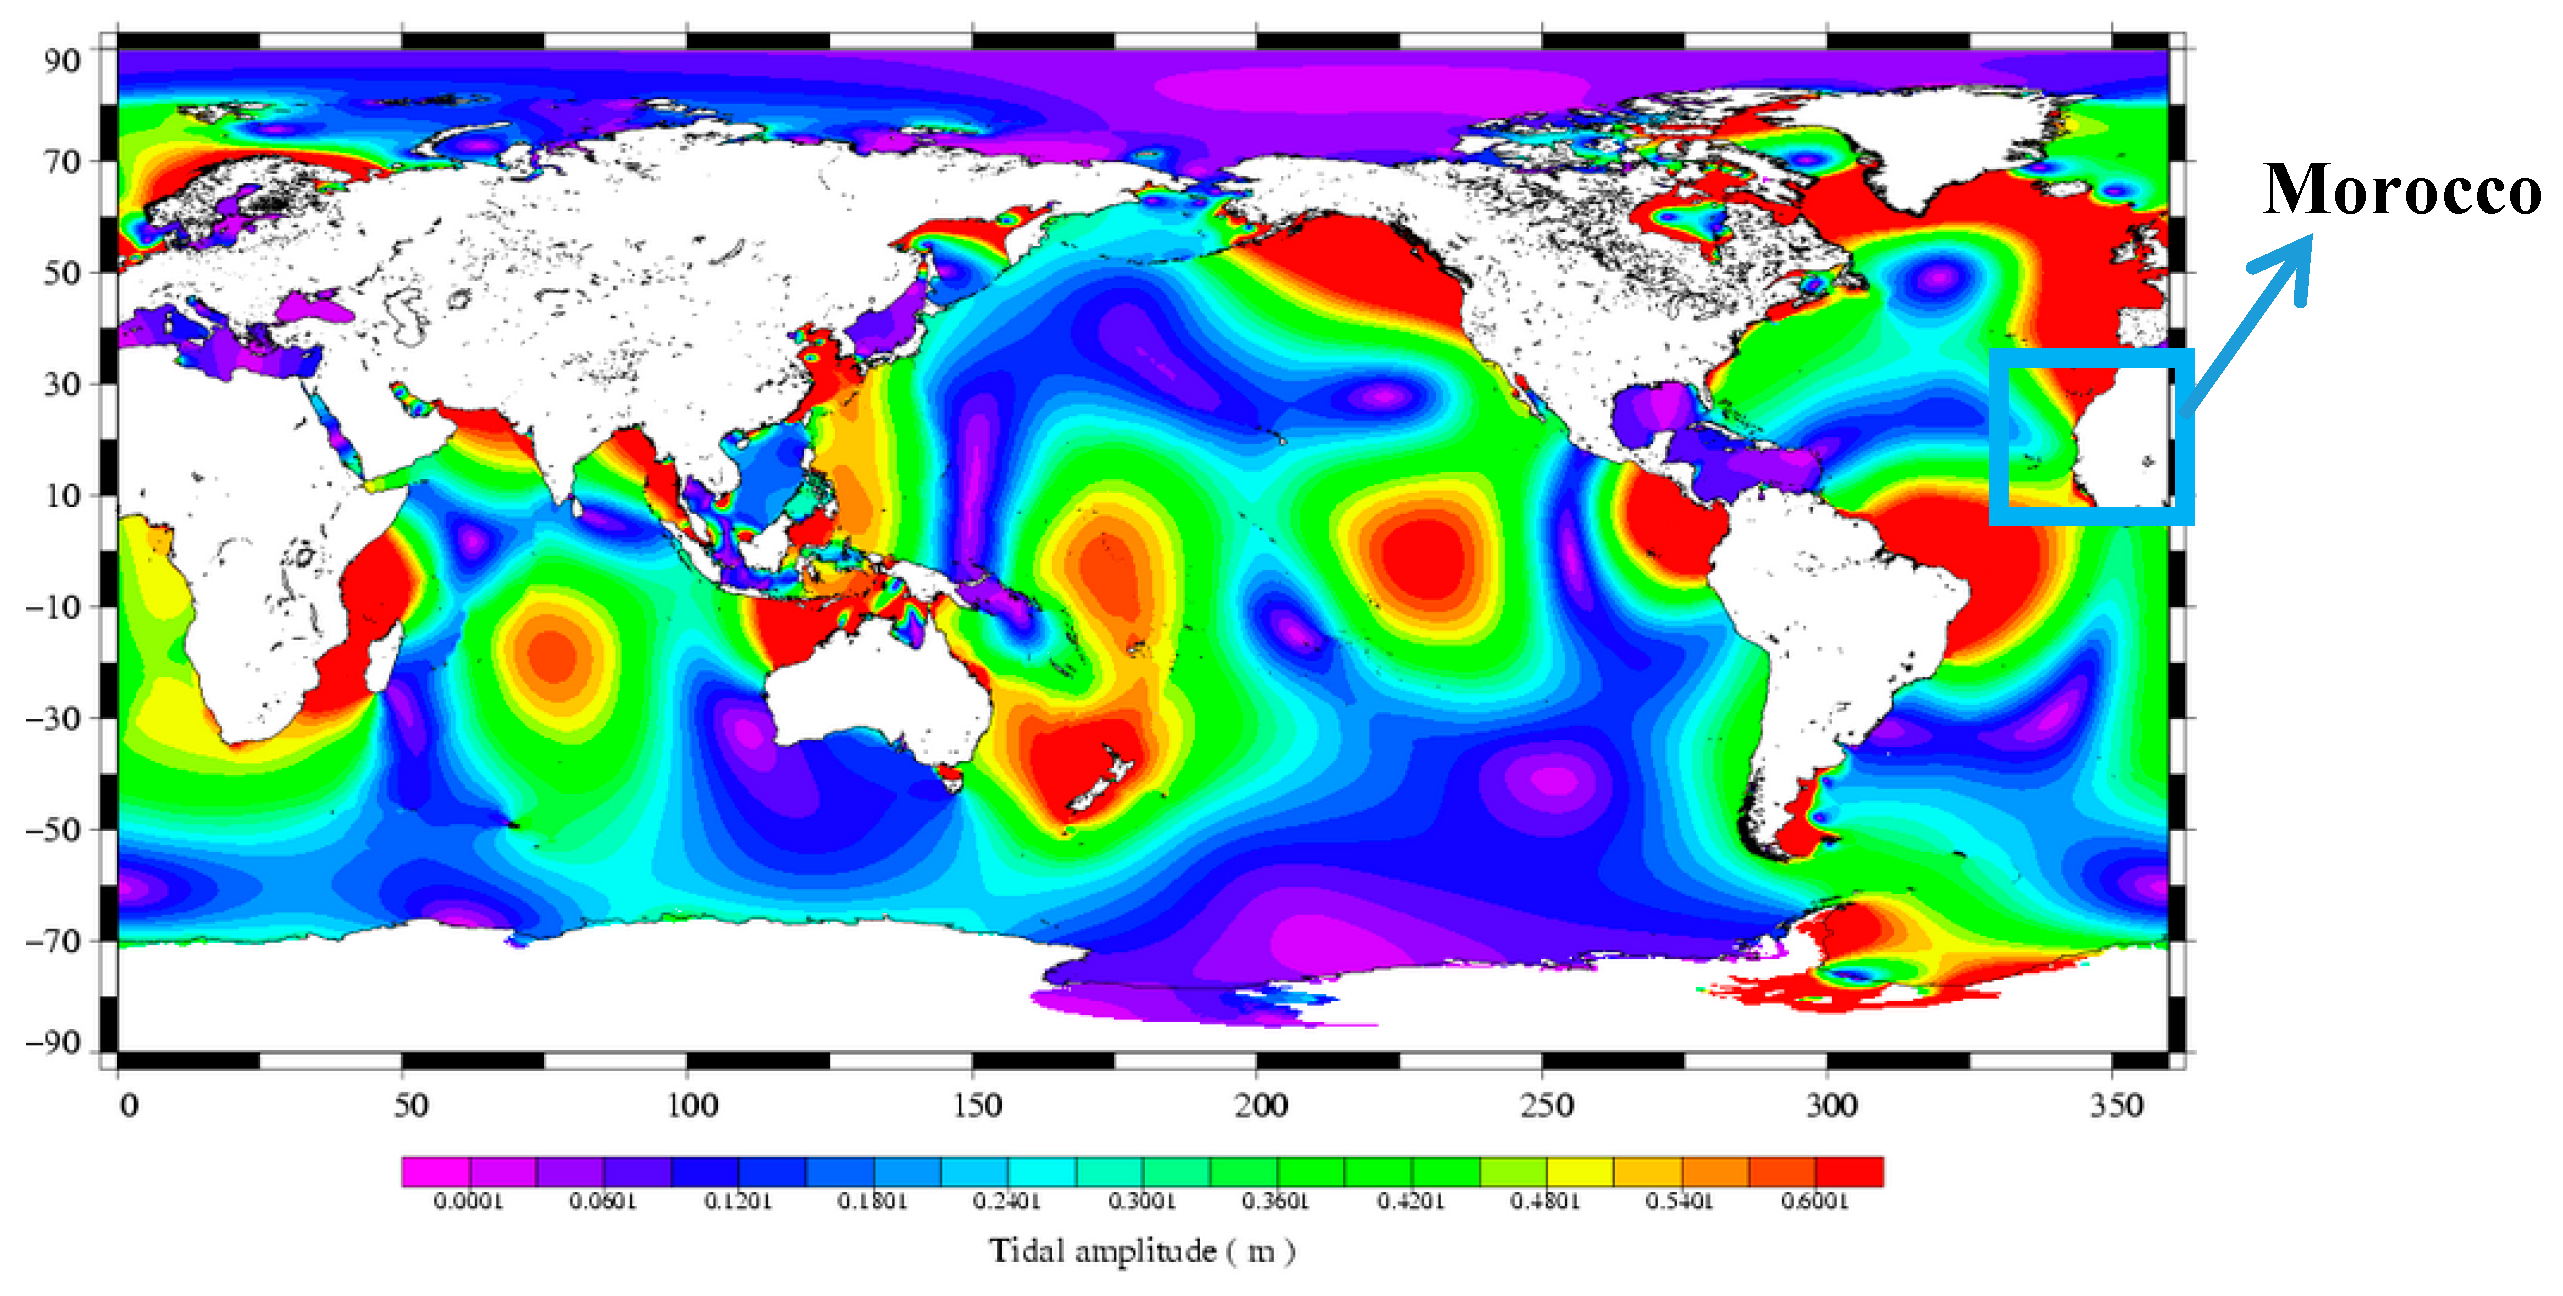
Figure 2.
Map of the Moroccan coast with the location of the different regions.
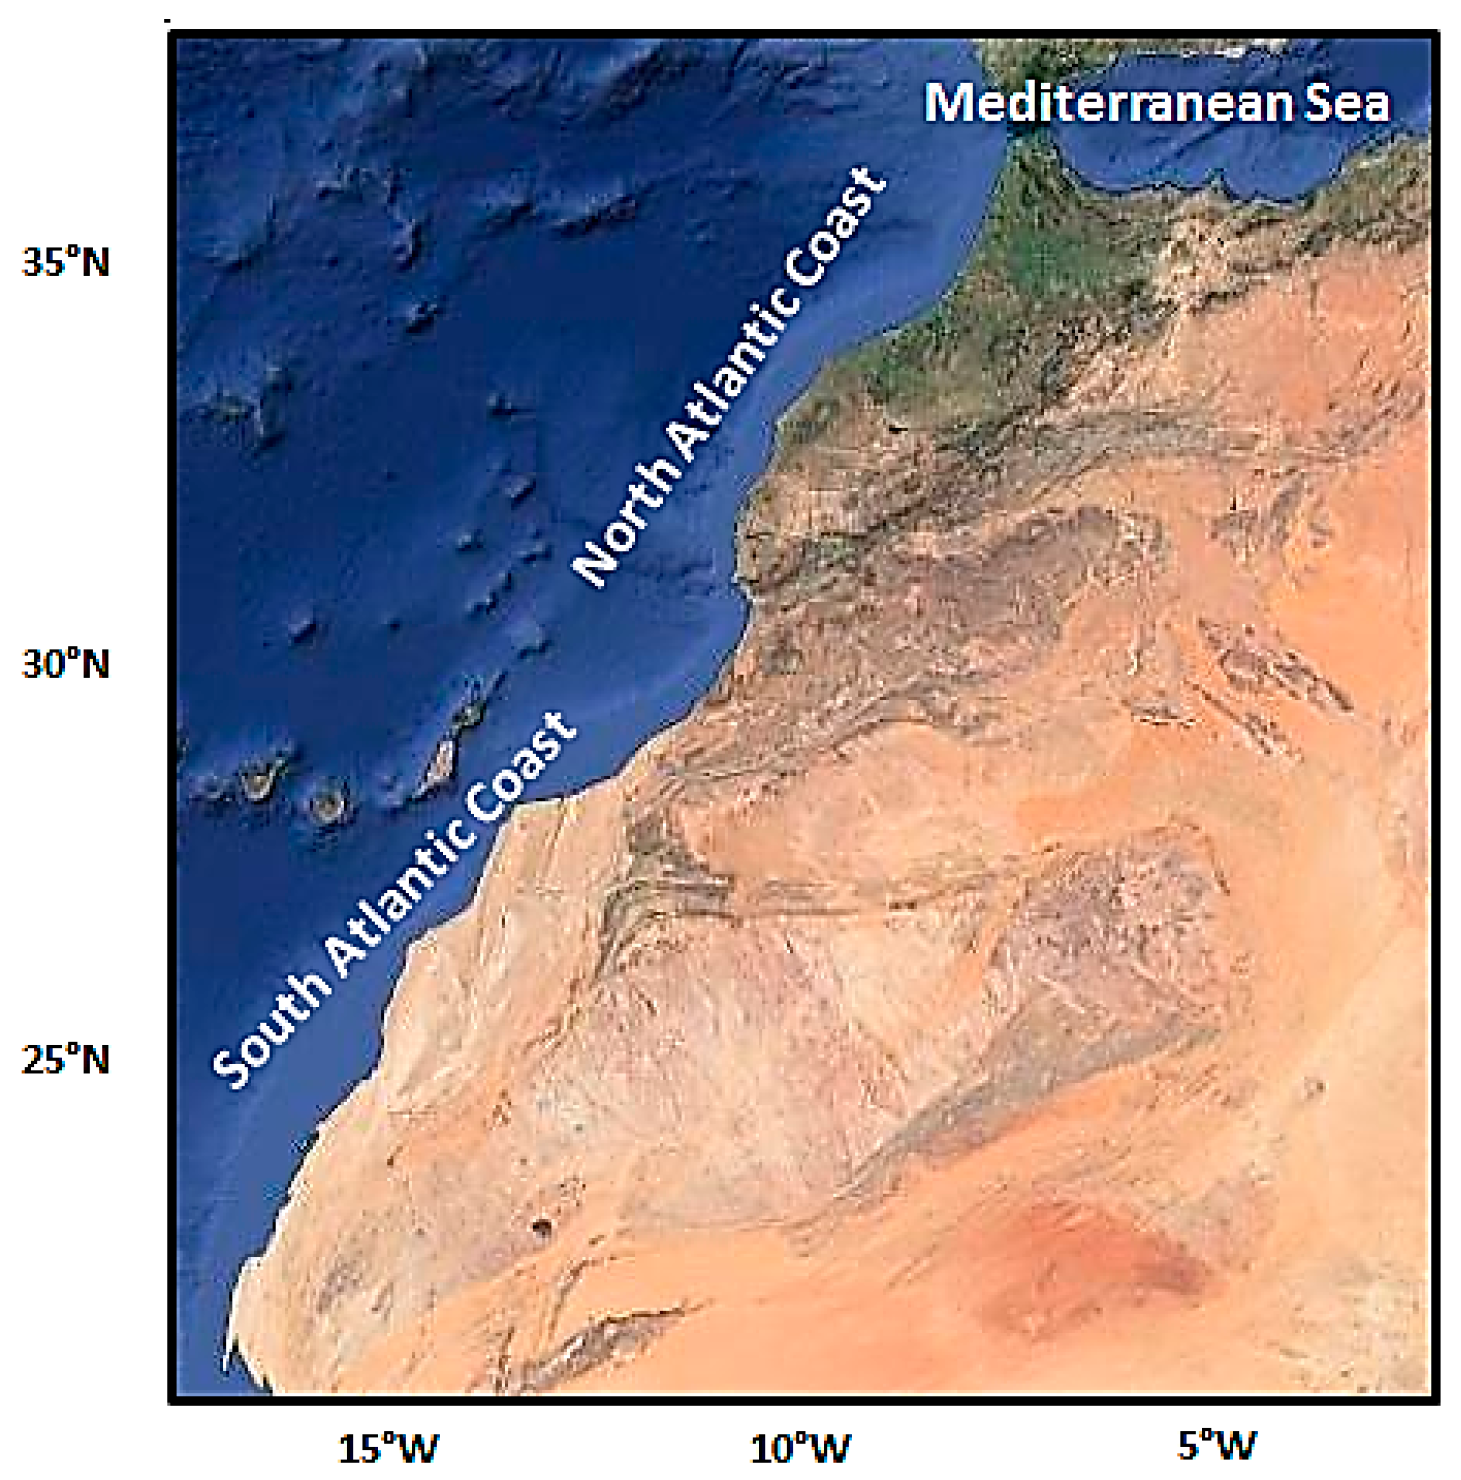
Figure 3.
Water speed vs. depth.
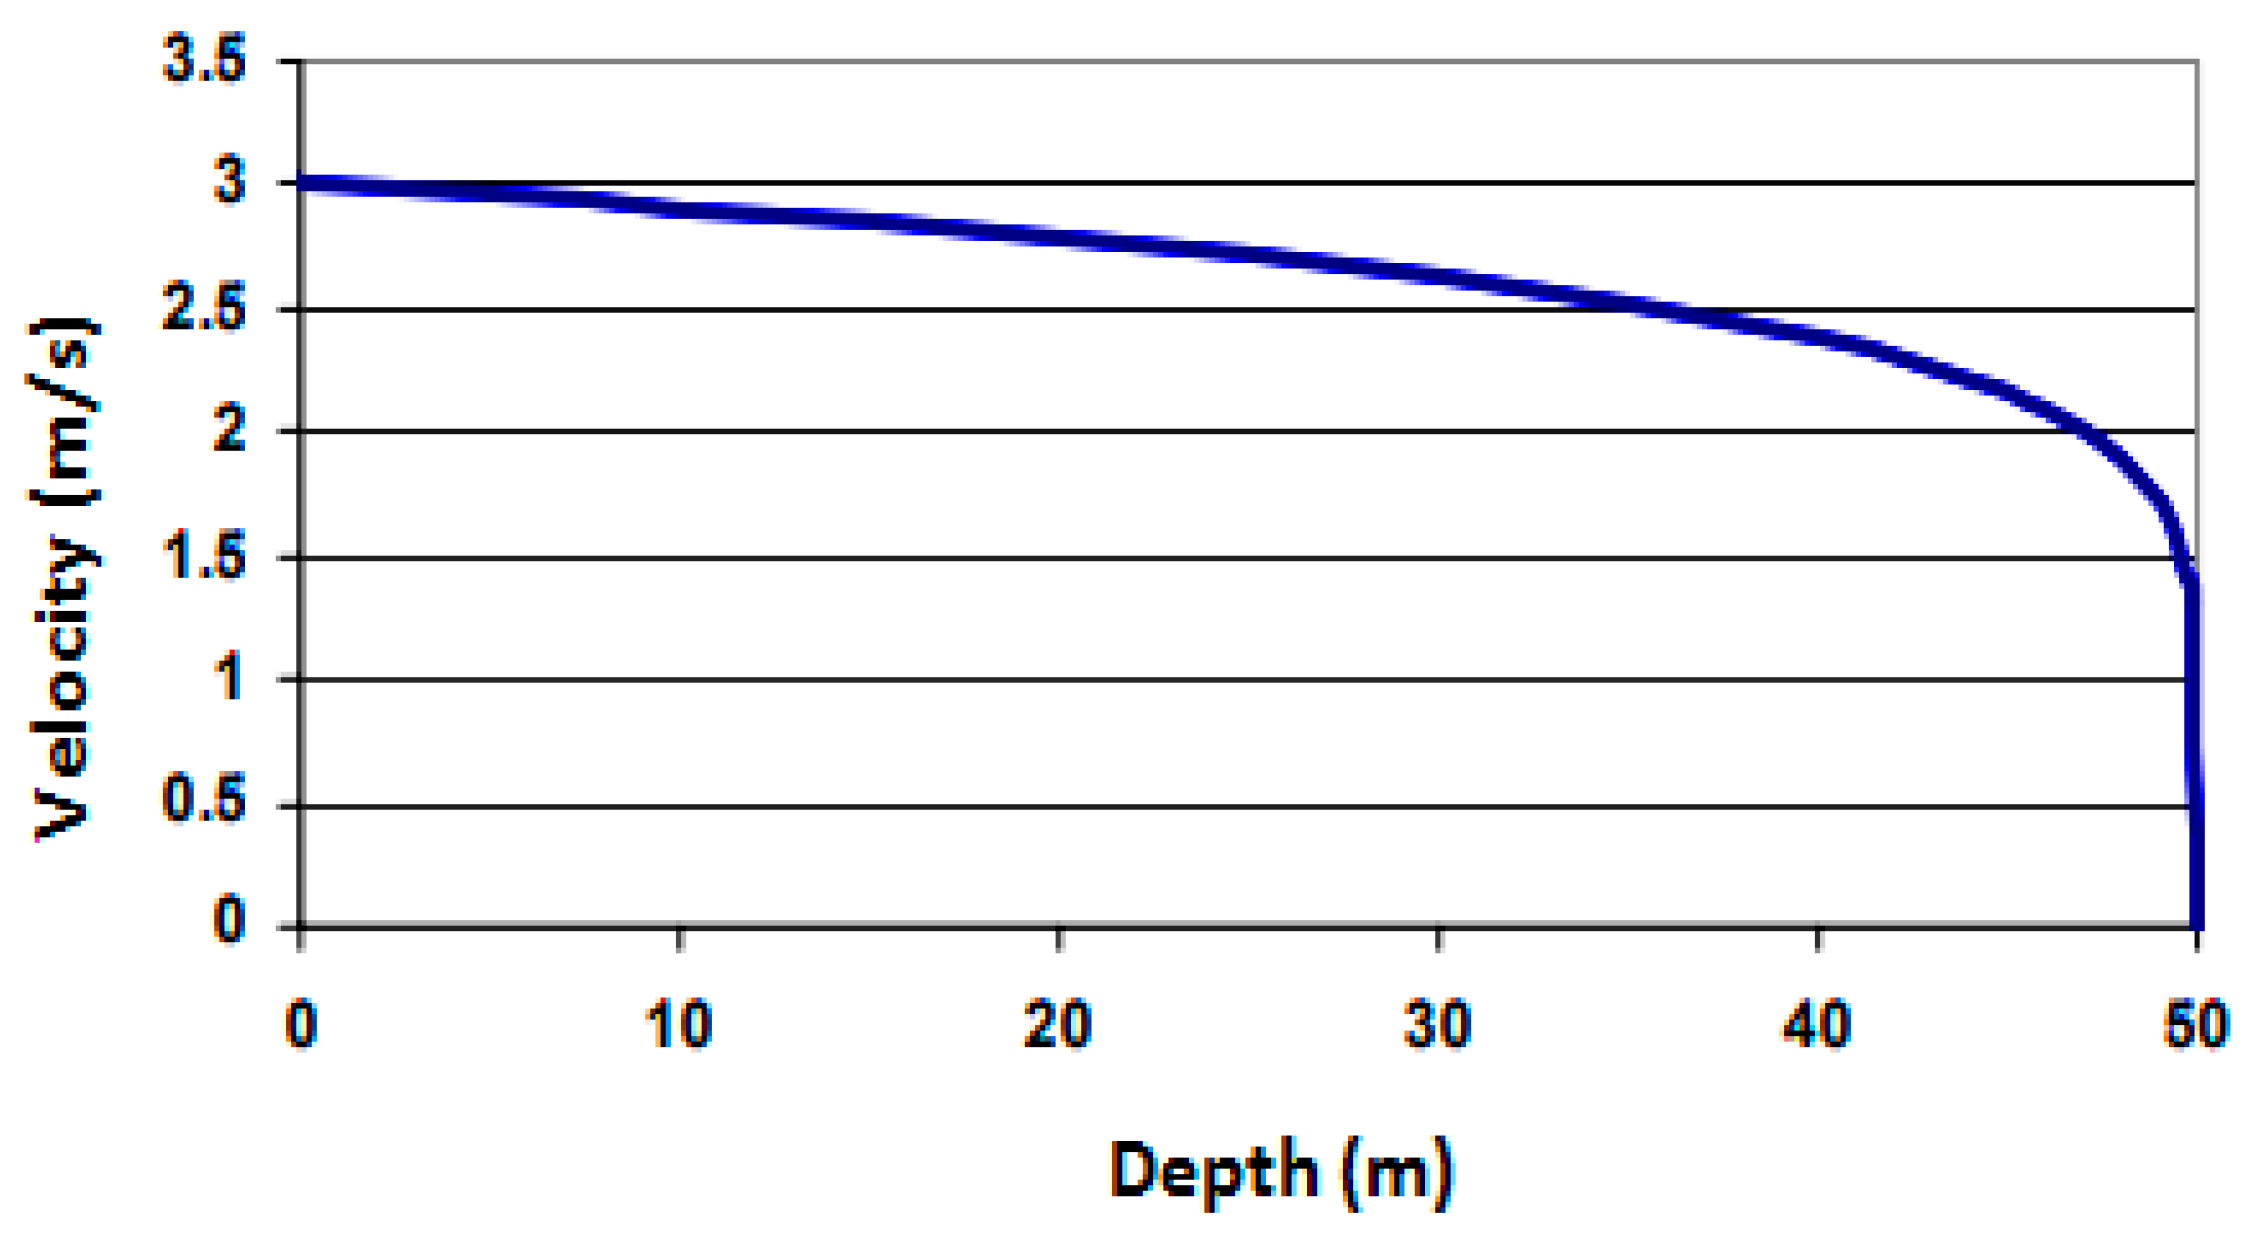
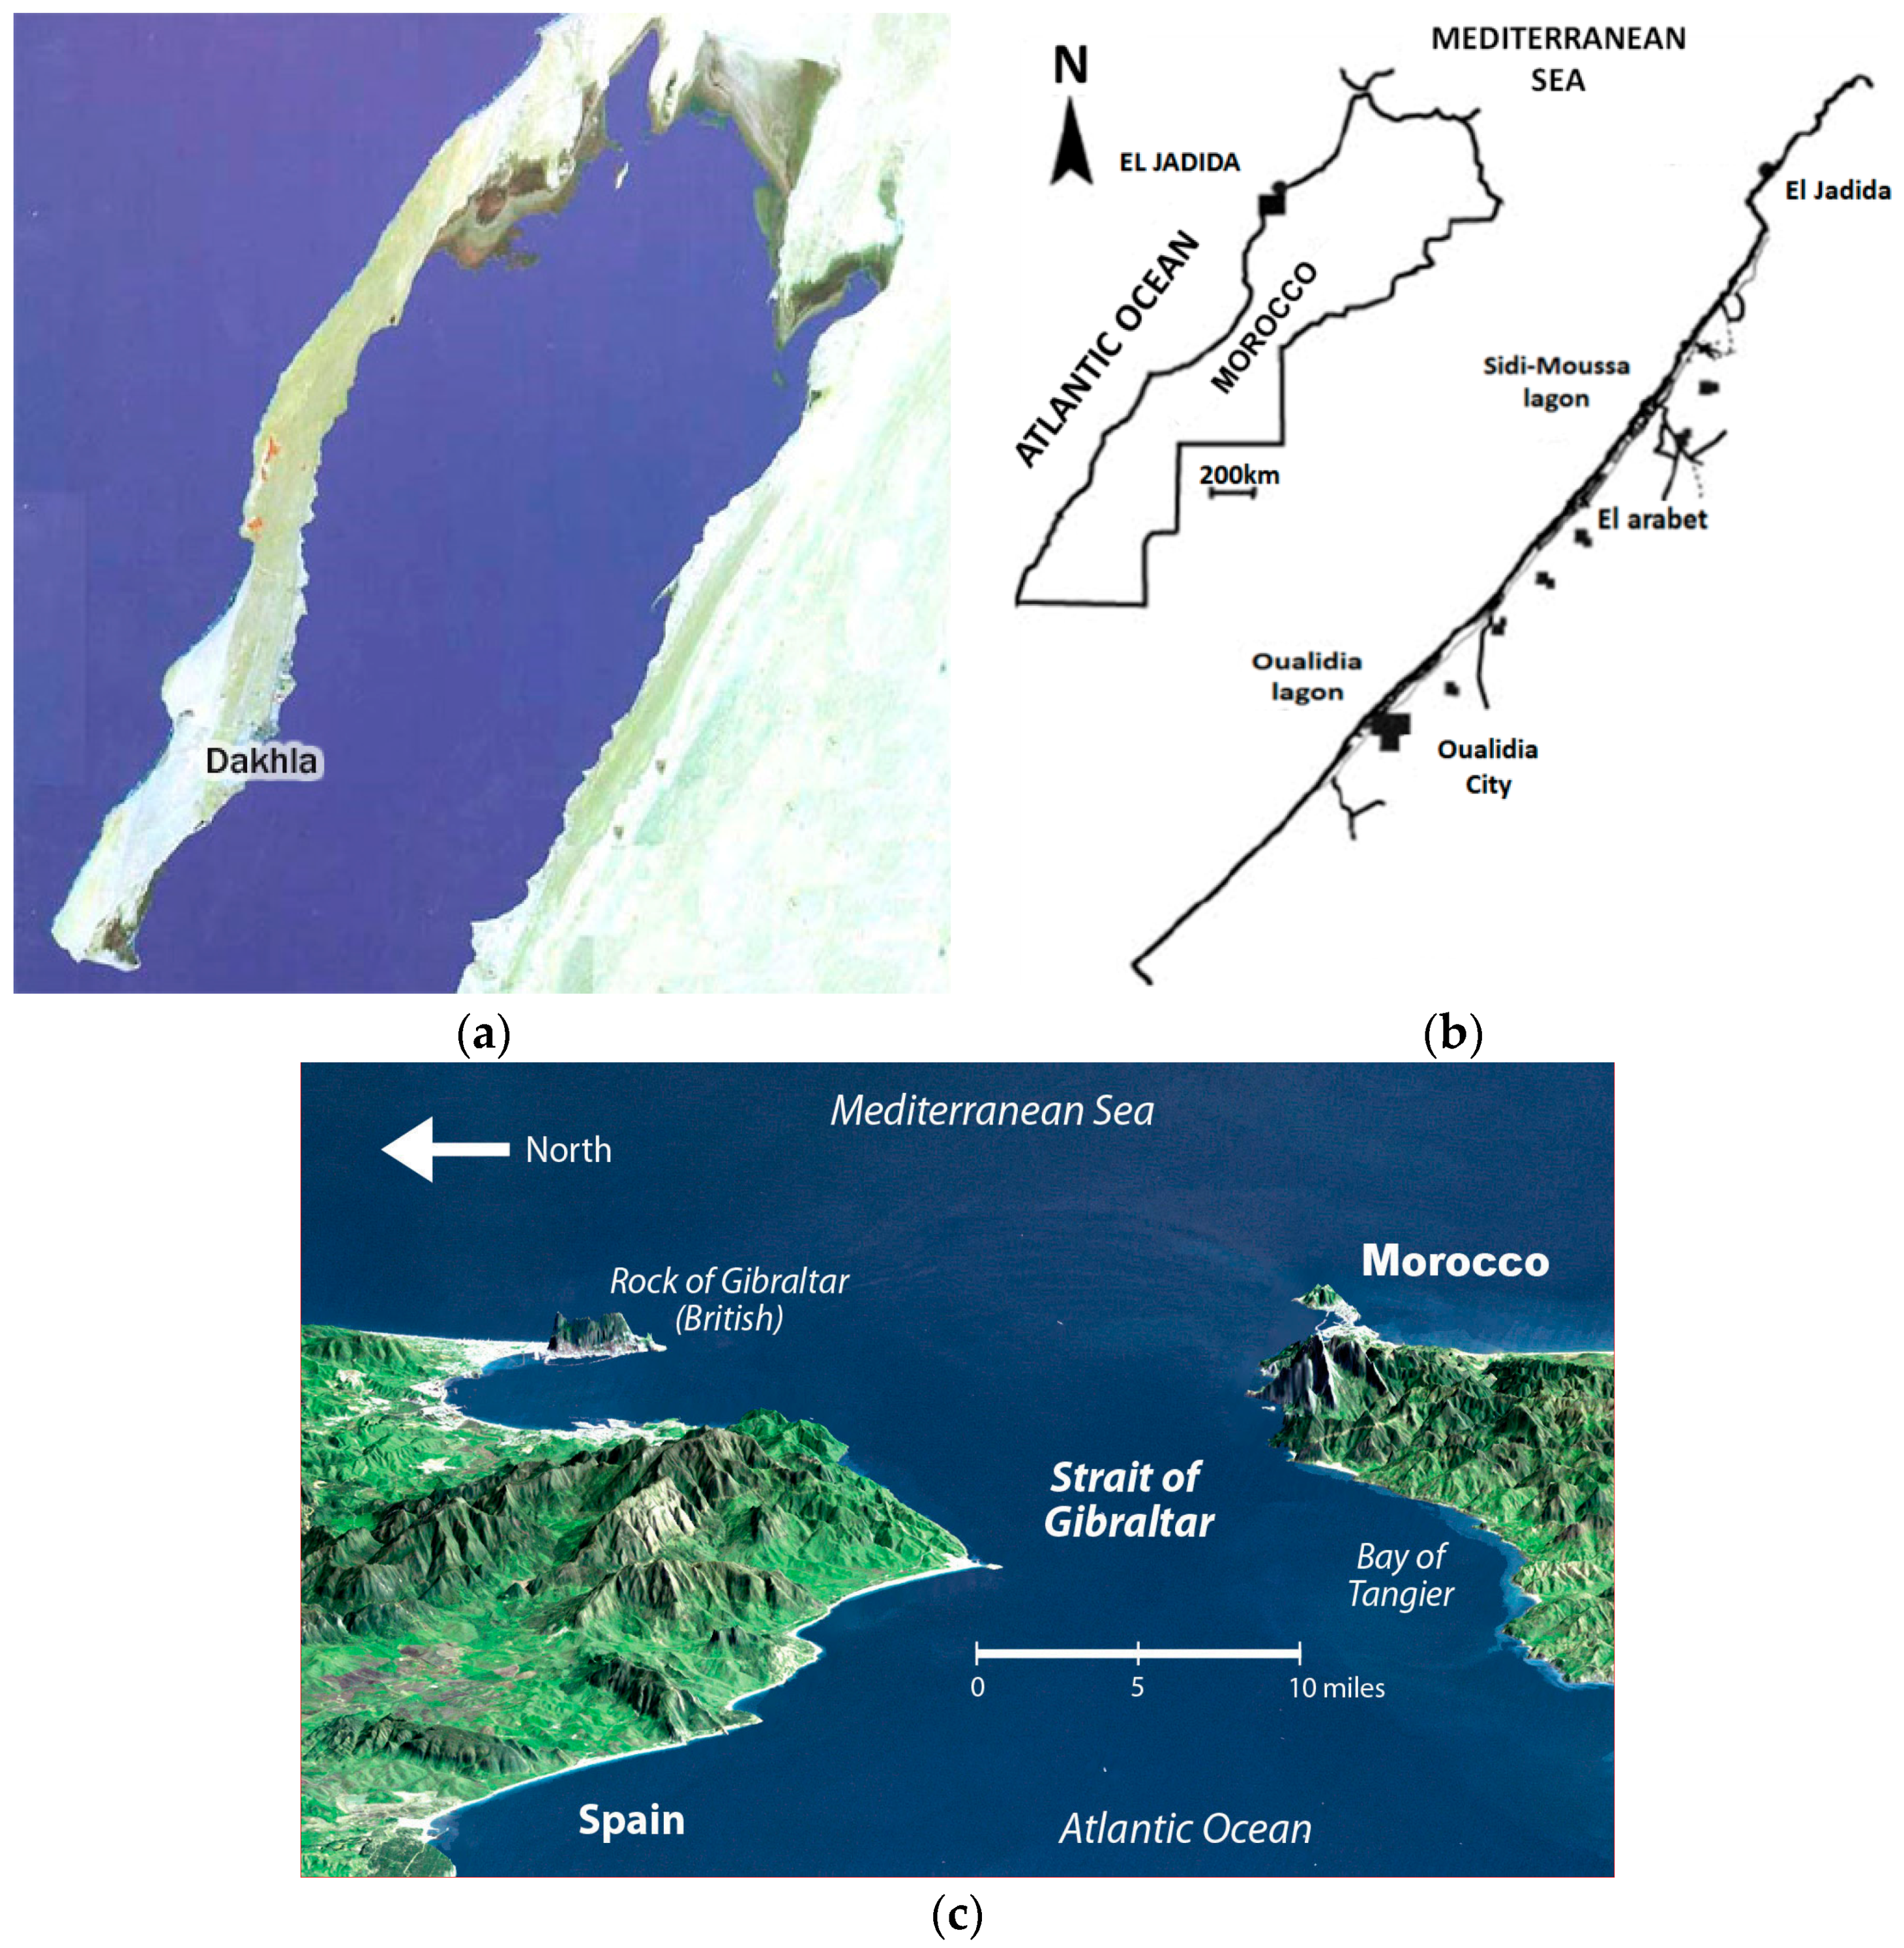
Figure 4.
Potential areas for tidal power generation in Morocco. (a) Dakhla bay (23°30′ N; 16° W) [31]; (b) Oualidia lagoon (32°45′ N; 9°3′ W) [32]; (c) The southern coast of the Strait of Gibraltar [33].

Figure 5.
Marine current velocity rose diagrams. (a) Tanger; (b) Agadir; (c) El Hoceima; (d) Dakhla; (e) El Jadida.
Figure 5.
Marine current velocity rose diagrams. (a) Tanger; (b) Agadir; (c) El Hoceima; (d) Dakhla; (e) El Jadida.


Figure 6.
Tidal energy resource in the Mediterranean Sea. (a) 2010; (b) 2011; (c) 2012; (d) 2013; (e) 2014.
Figure 6.
Tidal energy resource in the Mediterranean Sea. (a) 2010; (b) 2011; (c) 2012; (d) 2013; (e) 2014.

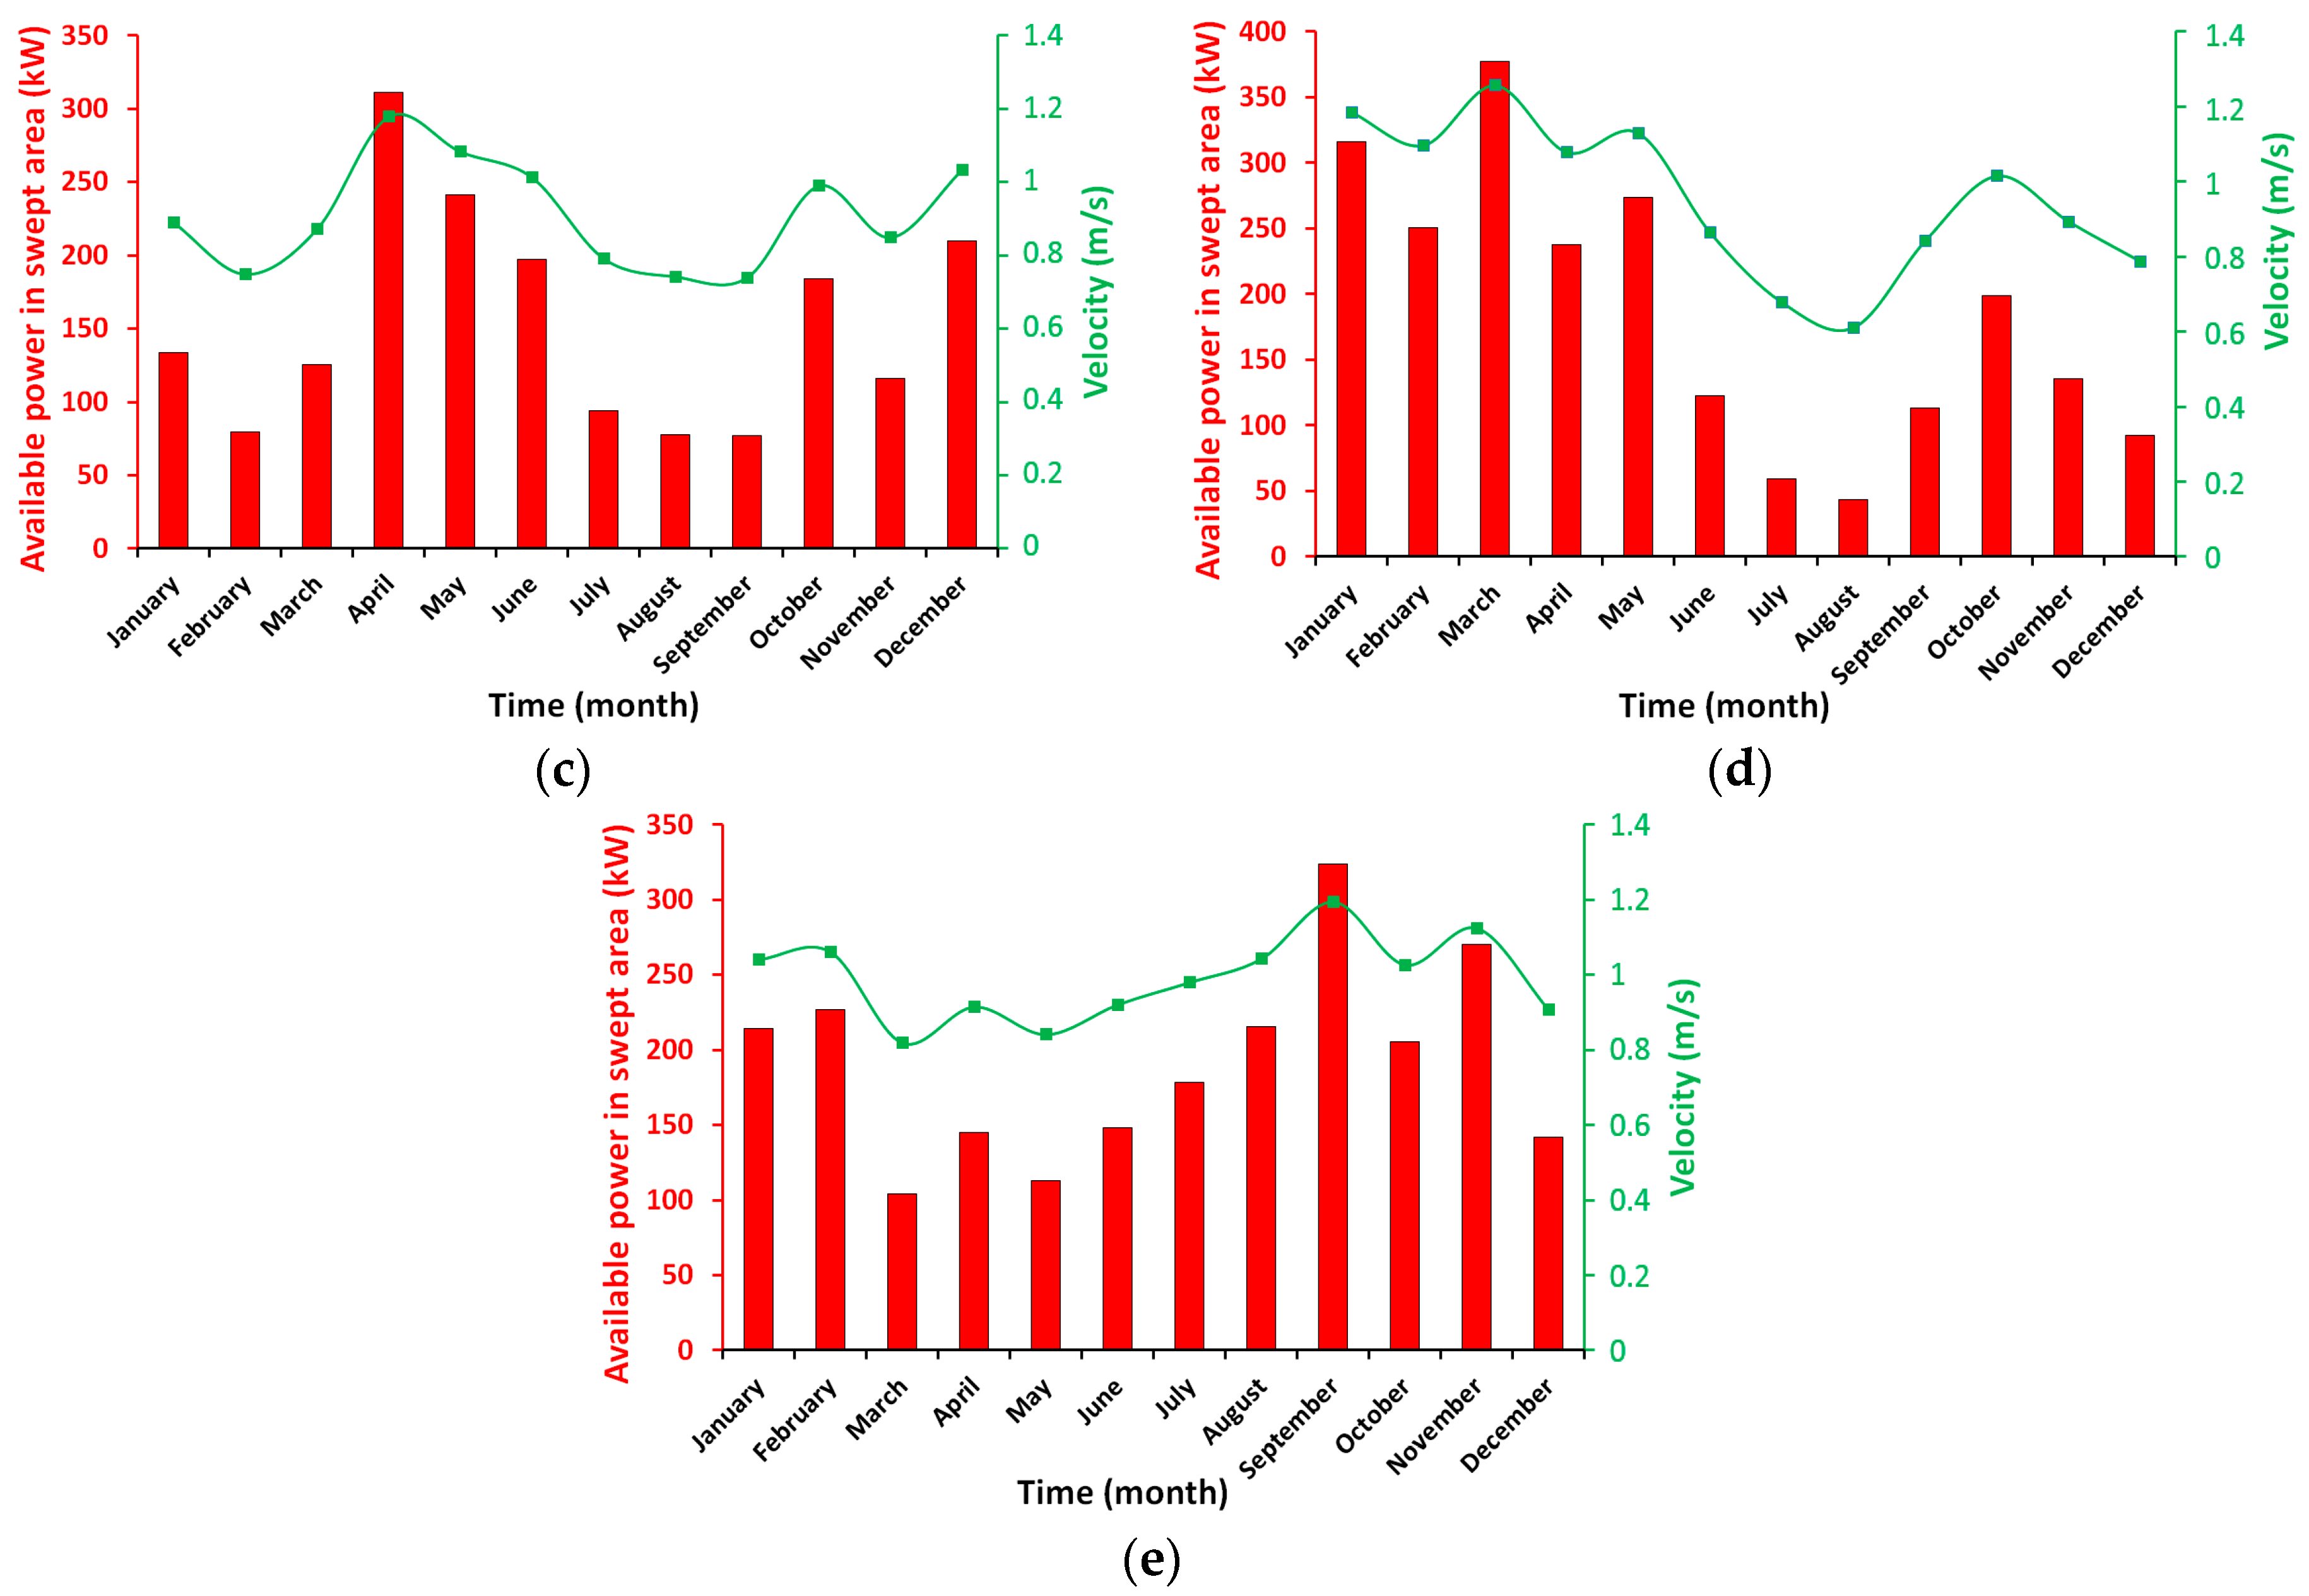
Figure 7.
Tidal energy resource in the south coast of Atlantic. (a) 2010; (b) 2011; (c) 2012; (d) 2013; (e) 2014.
Figure 7.
Tidal energy resource in the south coast of Atlantic. (a) 2010; (b) 2011; (c) 2012; (d) 2013; (e) 2014.

Figure 8.
Tidal energy resource in the north coast of Atlantic. (a) 2010; (b) 2011; (c) 2012; (d) 2013; (e) 2014.
Figure 8.
Tidal energy resource in the north coast of Atlantic. (a) 2010; (b) 2011; (c) 2012; (d) 2013; (e) 2014.
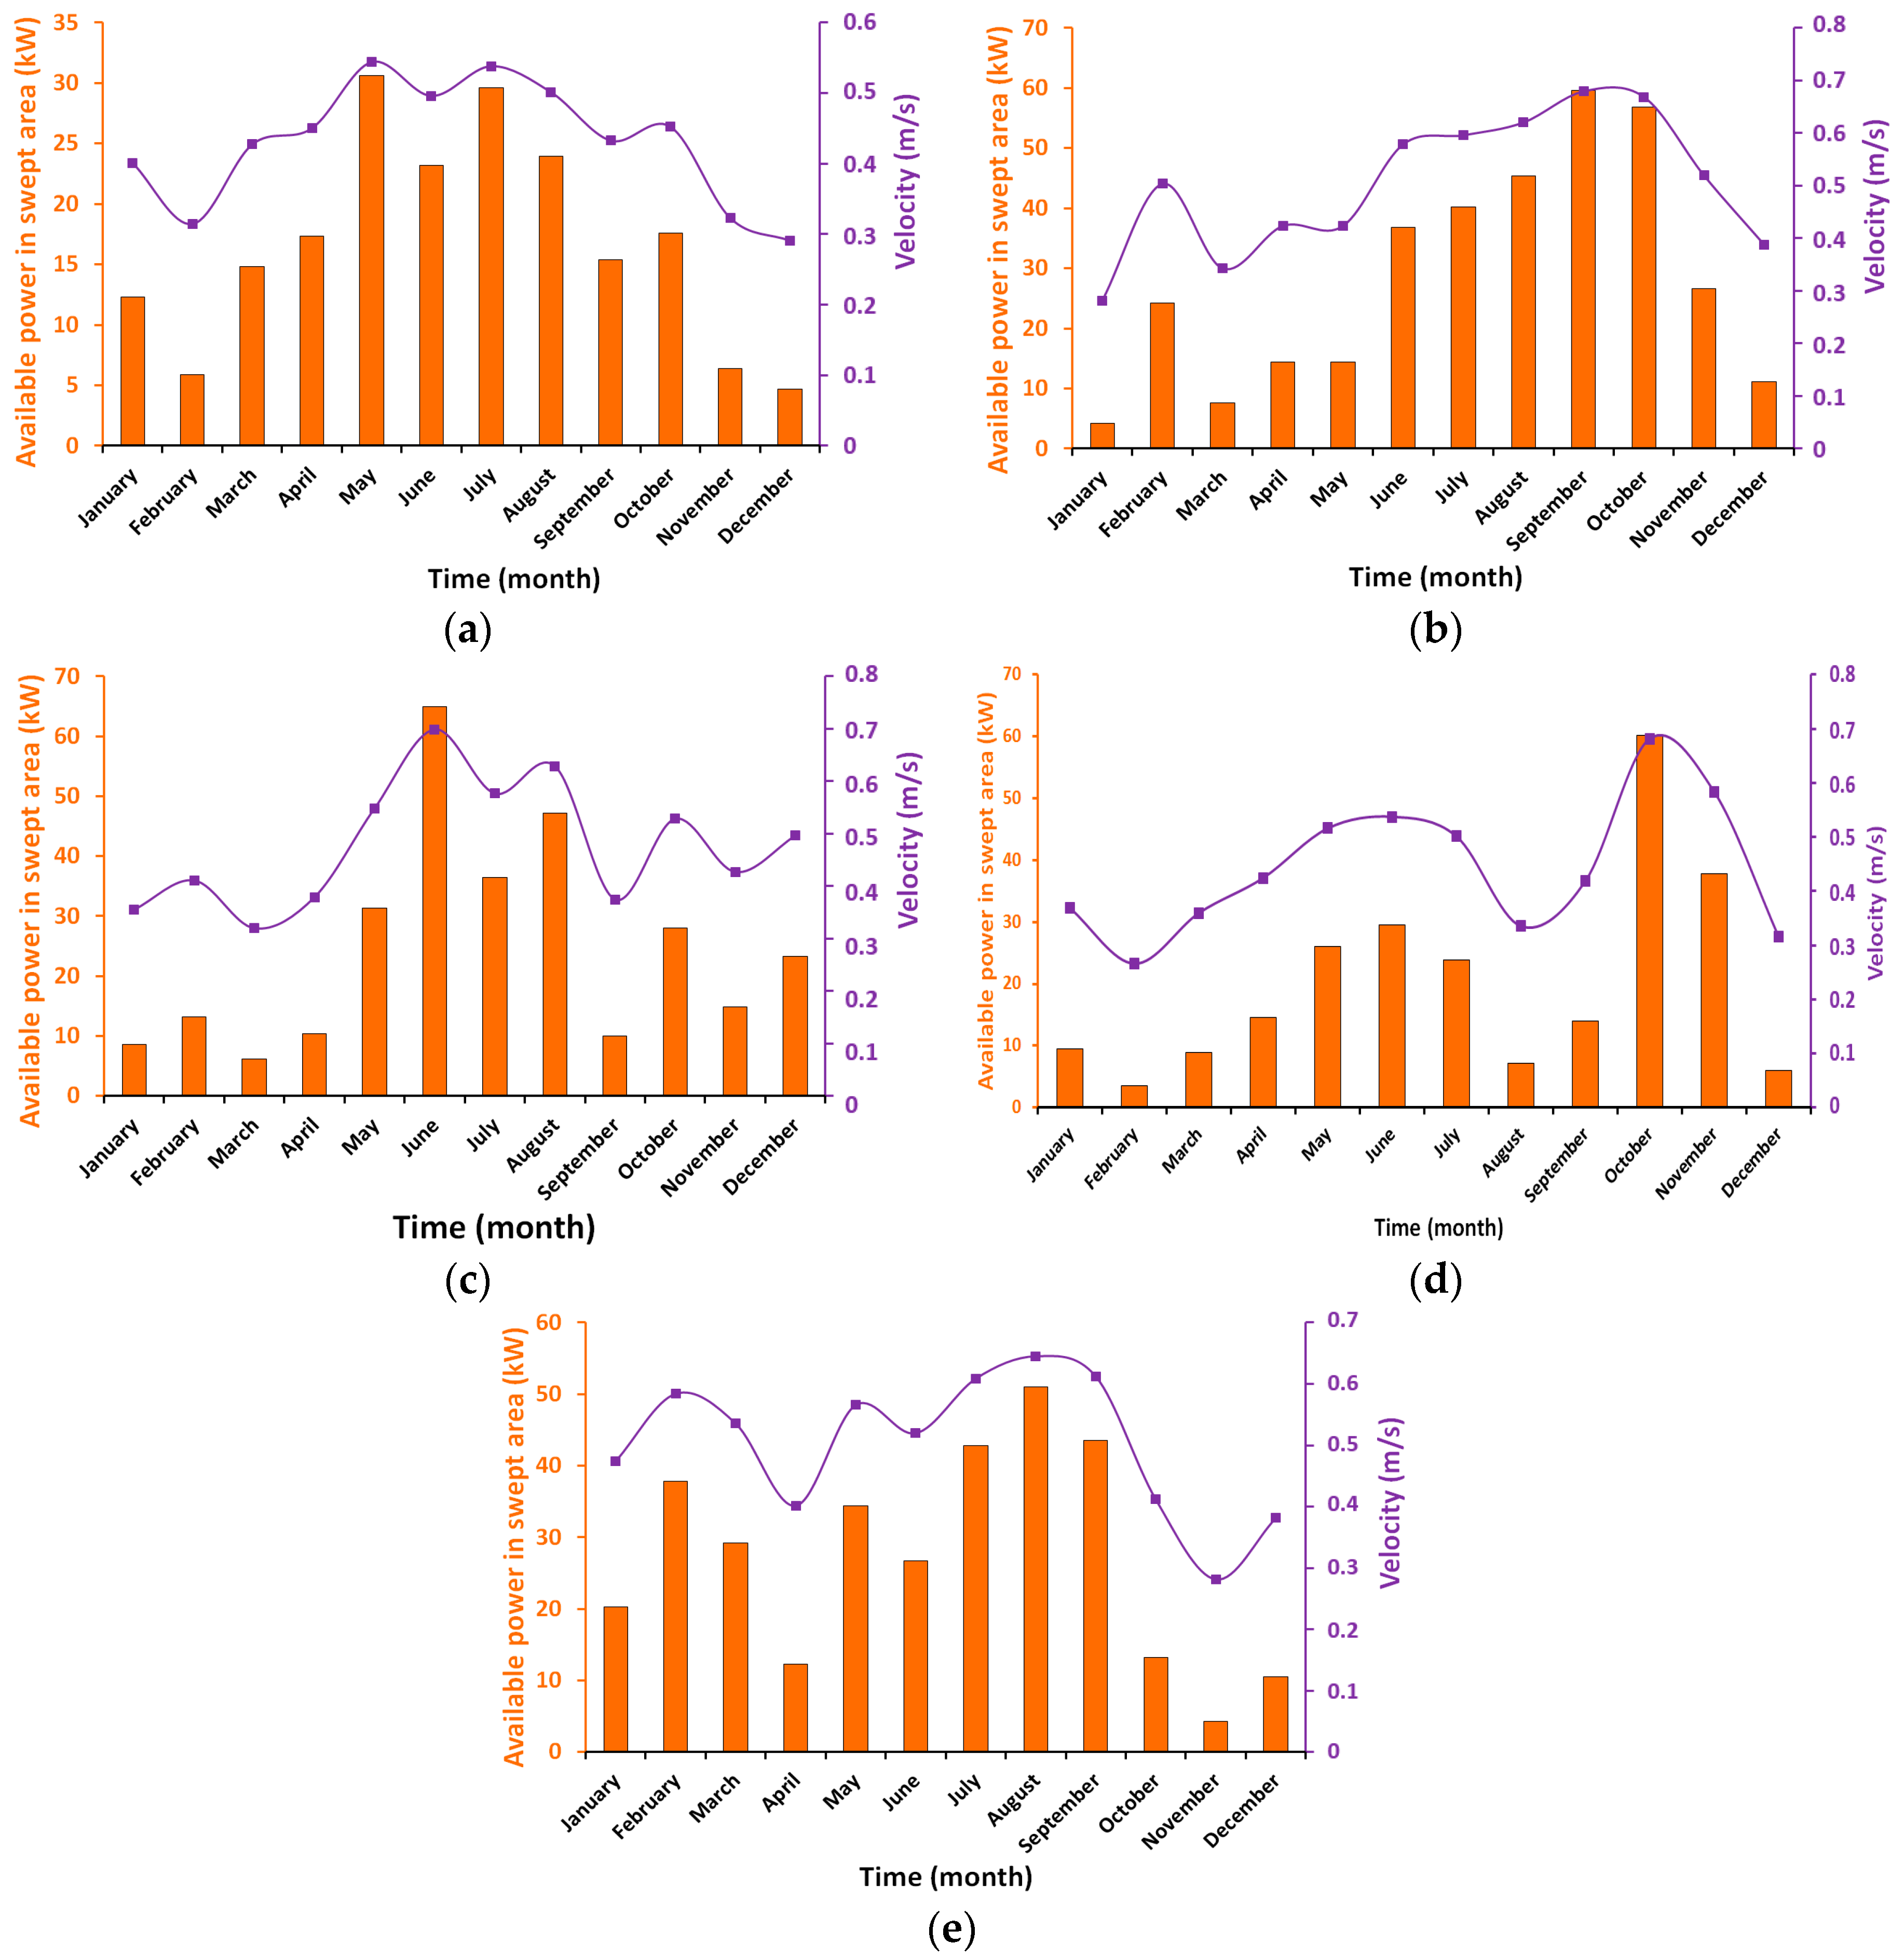
Figure 9.
Electrical power output in the Mediterranean Sea (MW).

Figure 10.
Electrical power output in the south coast of the Atlantic (MW).
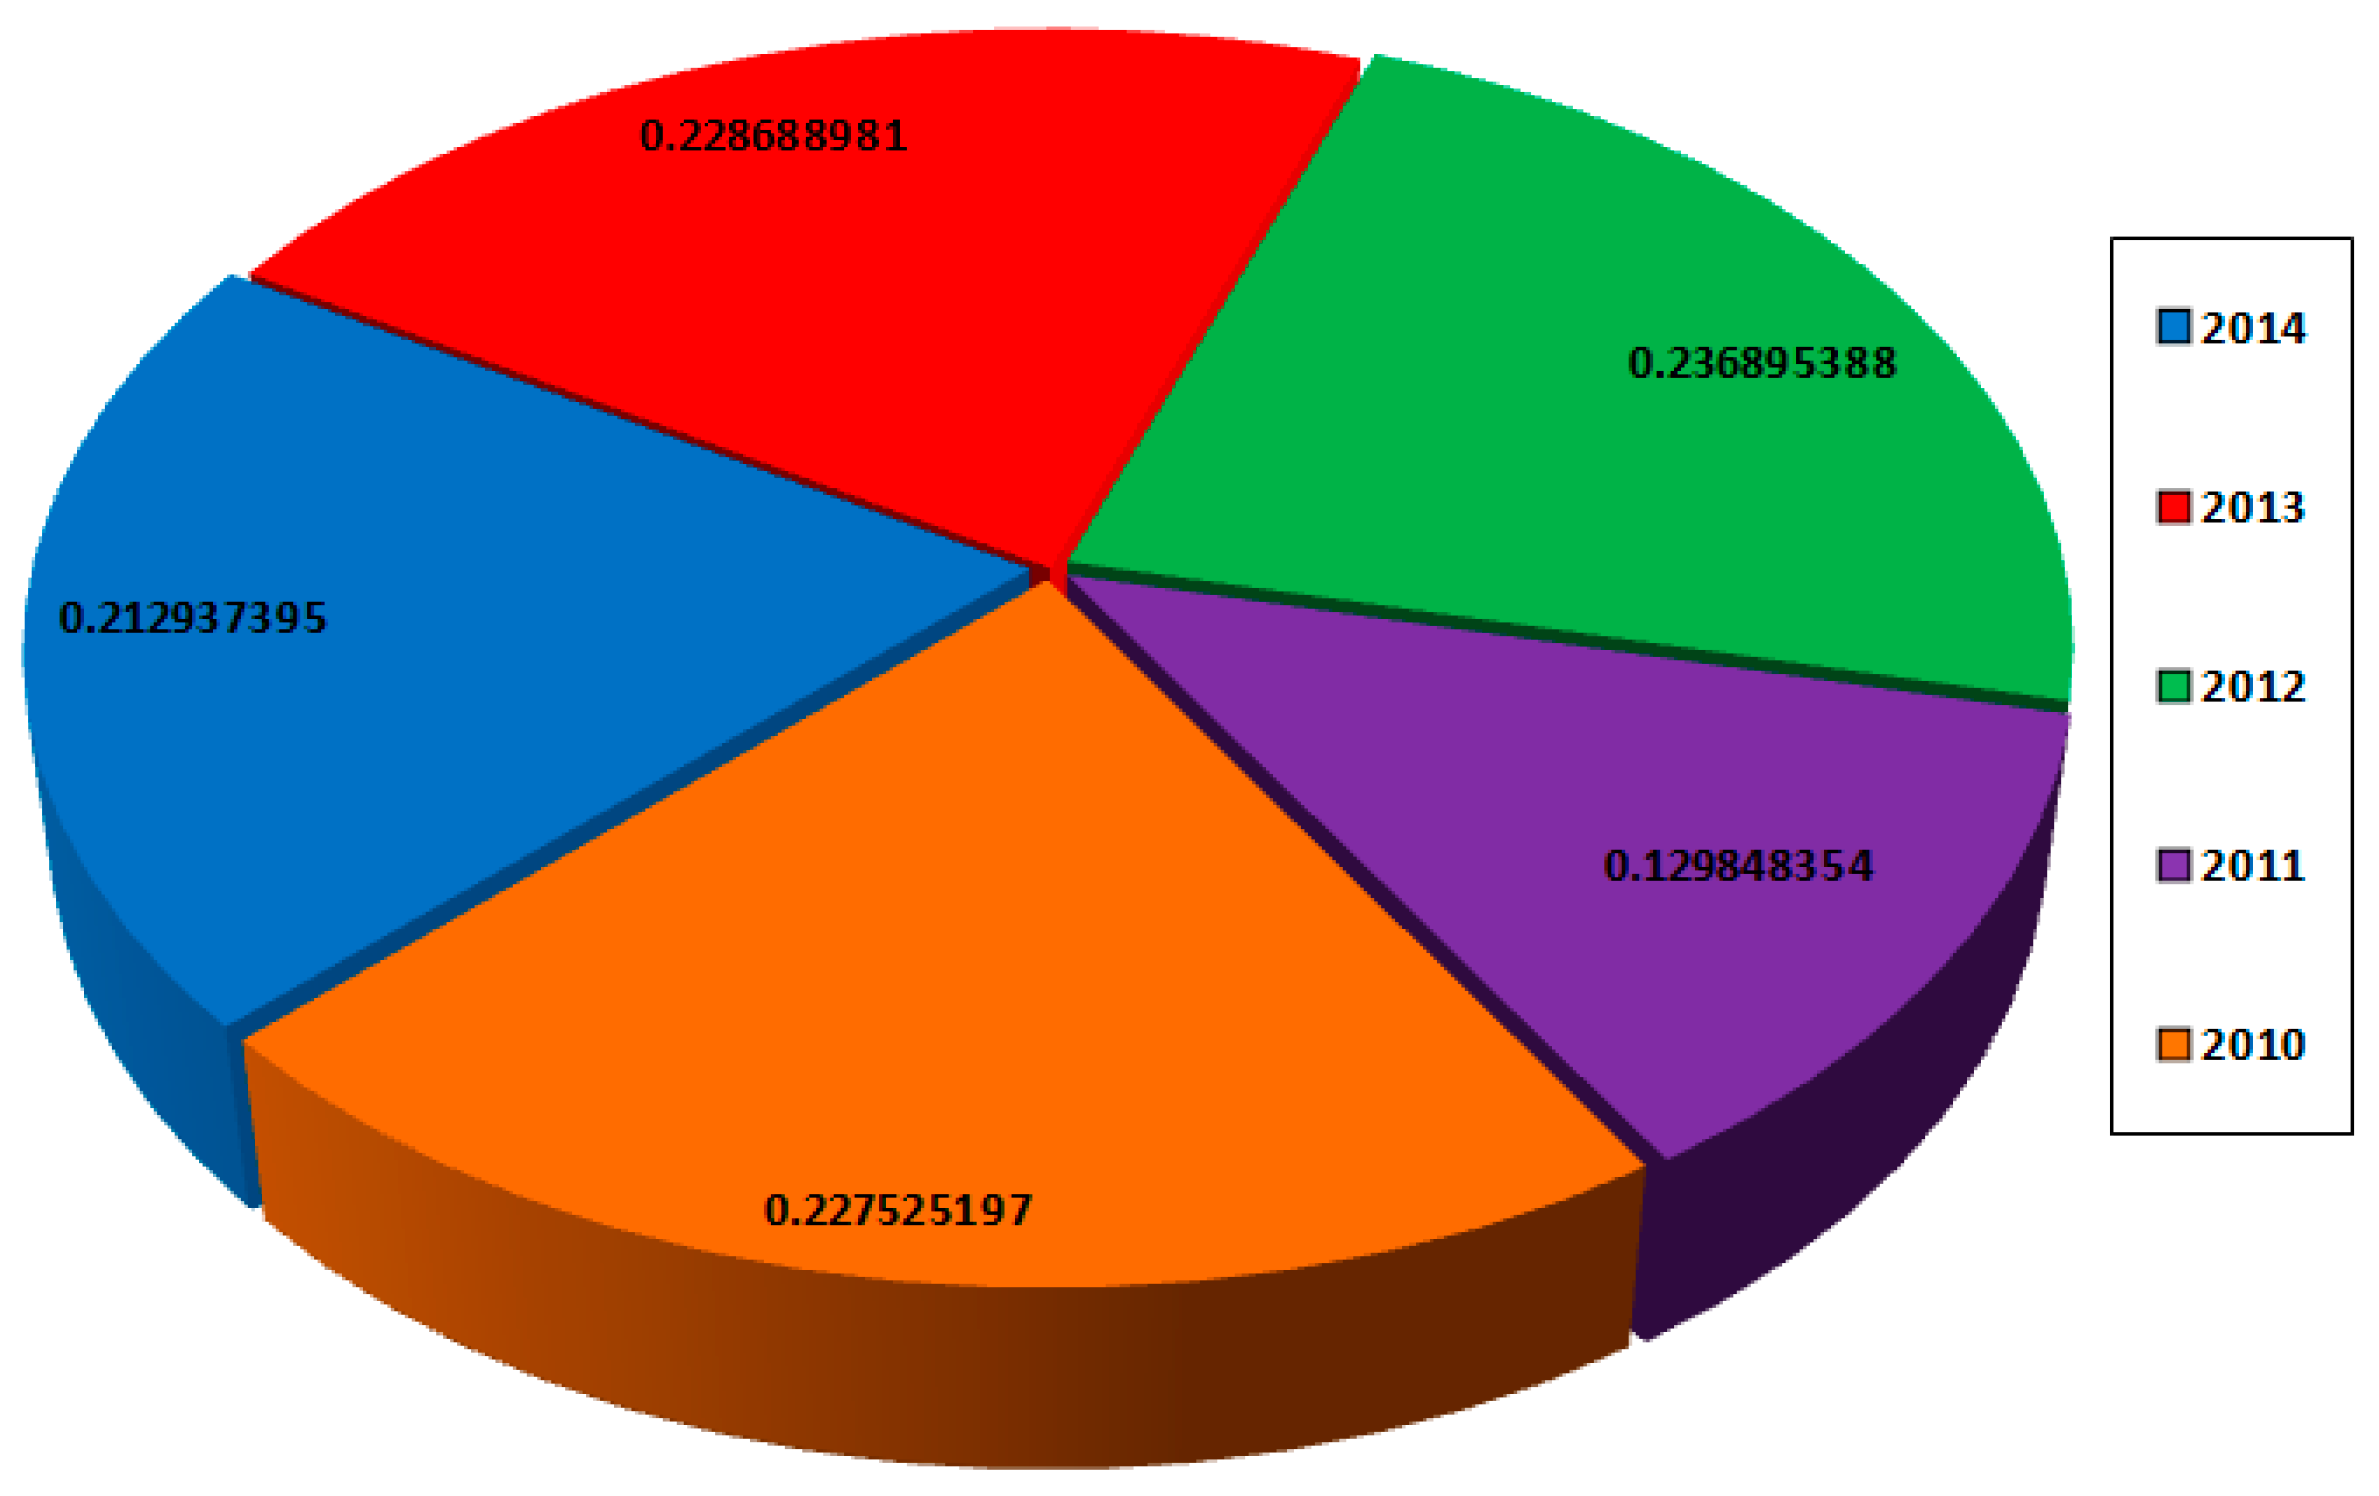
Figure 11.
Electrical power output in the north coast of the Atlantic (MW).

Table 1.
Locations and catalog employed for the region considered.
| Regions | Geographical Coordinates | Catalog |
|---|---|---|
| Mediterranean Sea | 6° W–2° W; 37° N 35° N | IBERIA-BISCAY-IRELAND REGIONAL SEAS (IBI) |
| South Atlantic Coast | 22° W–13° W; 26° N 21° N | GLOBAL_REP_PHY_001_021 |
| North Atlantic Coast | 19° W–5° W; 35° N 26° N | GLOBAL_REP_PHY_001_021 |
Table 2.
Steps required in tidal energy resource evaluation.
| Steps | Description |
|---|---|
| Step 1 | Selection of sites suitable for establishing arrays of tidal current generators. This is mainly restricted by a minimum value of mean cube flow velocity and an appropriate range of depths for a specific kind of generator. |
| Step 2 | Initial sizing and evaluating of the generating device to maximize energy captured from the life of the device taking into account elements such as the long-term variations in flow velocity; a vertical profile of flow velocity; deviation of the flow from rectilinear motion. |
| Step 3 | Given the device parameters above, the study of various arrangements (longitudinal spacing, lateral spacing, and orientation) of generators within the chosen site to maximize coupled power output. Revision of generator parameters if needed. |
| Step 4 | Survey of the extent of the significant impact of the proposed tidal current generator array on tidal parameters. If requisite, improvements made to power output evaluate due to resulting changes in boundary conditions. |
© 2018 by the authors. Licensee MDPI, Basel, Switzerland. This article is an open access article distributed under the terms and conditions of the Creative Commons Attribution (CC BY) license (http://creativecommons.org/licenses/by/4.0/).
Share and Cite
MDPI and ACS Style
Nachtane, M.; Tarfaoui, M.; Hilmi, K.; Saifaoui, D.; El Moumen, A. Assessment of Energy Production Potential from Tidal Stream Currents in Morocco. Energies 2018, 11, 1065. https://doi.org/10.3390/en11051065
AMA Style
Nachtane M, Tarfaoui M, Hilmi K, Saifaoui D, El Moumen A. Assessment of Energy Production Potential from Tidal Stream Currents in Morocco. Energies. 2018; 11(5):1065. https://doi.org/10.3390/en11051065
Chicago/Turabian StyleNachtane, Mourad, Mostapha Tarfaoui, Karim Hilmi, Dennoun Saifaoui, and Ahmed El Moumen. 2018. "Assessment of Energy Production Potential from Tidal Stream Currents in Morocco" Energies 11, no. 5: 1065. https://doi.org/10.3390/en11051065
Note that from the first issue of 2016, this journal uses article numbers instead of page numbers. See further details here.