Investigation of Stratified Thermal Storage Tank Performance for Heating and Cooling Applications


Science and Engineering Faculty, Queensland University of Technology, Brisbane CBD, QLD 4001, Australia
*
Author to whom correspondence should be addressed.
Energies 2018, 11(5), 1049; https://doi.org/10.3390/en11051049
Submission received: 28 March 2018
/
Revised: 16 April 2018
/
Accepted: 18 April 2018
/
Published: 25 April 2018
(This article belongs to the Section D: Energy Storage and Application)
Abstract
:A large amount of energy is consumed by heating and cooling systems to provide comfort conditions for commercial building occupants, which generally contribute to peak electricity demands. Thermal storage tanks in HVAC systems, which store heating/cooling energy in the off-peak period for use in the peak period, can be used to offset peak time energy demand. In this study, a theoretical investigation on stratified thermal storage systems is performed to determine the factors that significantly influence the thermal performance of these systems for both heating and cooling applications. Five fully-insulated storage tank geometries, using water as the storage medium, were simulated to determine the effects of water inlet velocity, tank aspect ratio and temperature difference between charging (inlet) and the tank water on mixing and thermocline formation. Results indicate that thermal stratification enhances with increased temperature difference, lower inlet velocities and higher aspect ratios. It was also found that mixing increased by 303% when the temperature difference between the tank and inlet water was reduced from 80 °C to 10 °C, while decreasing the aspect ratio from 3.8 to 1.0 increased mixing by 143%. On the other hand, increasing the inlet water velocity significantly increased the storage mixing. A new theoretical relationship between the inlet water velocity and thermocline formation has been developed. It was also found that inlet flow rates can be increased, without increasing the mixing, after the formation of the thermocline.
1. Introduction
Heating and cooling systems are required to maintain comfortable thermal conditions within built environments for the occupants of commercial and office buildings. Traditional heating, ventilating, air-conditioning and cooling (HVAC) systems are subject to high costs and contribute to peak demand. Most HVAC systems operate in the daytime and therefore contribute to the demand peak. The daytime peak electricity load is in great excess compared to the daily average load [1,2]. Utility companies must have larger capacities to meet this demand, that go unused most of the time. The requirement to meet peak demand eventually is met either by constructing new generation facilities or by purchasing power from competitors. Both options results in higher customer rates. Thermal energy storage (TES) is an advanced method to generate the heating and cooling energy in the off-peak hours and deliver to buildings during peak-hours and thus shifts the electricity demand to off-peak hours. With TES, heating and cooling systems are run at off-peak times (mostly at night) to store the required energy in the storage tanks. During the peak times, heating/cooling energy is supplied from the storage tanks without running heaters and chillers. On the other hand, concern about climate change and greenhouse emissions, as well as the increase in power costs and pressures on current infrastructure forces utilities and governments to use more renewable energy, particularly solar energy [3,4]. Solar thermal energy has many applications, including space heating [5], power generation [6] and solar drying of agricultural products [7,8,9]. However, one of the major drawbacks of solar energy is that it can only be utilised in the daytime and on clear days. To maximise the utilization of solar energy, proper energy storage must be developed. Therefore, it can be argued that thermal energy storage is most essential for the best utilization of traditional as well as solar energy.
Thermal energy storage (TES) systems are used as a temporary energy storage that allows energy to be held and used for later use. In the literature, several concepts of thermal storage have been developed [10,11]. Based on the medium of storage, water, oil and phase change materials have been utilized for thermal storage applications. However, due to its availability, high specific heat and low cost, water has the highest potential for use as storage medium [2]. Moreover, storage systems using water have some significant advantages over other mediums including:
- Controls are simpler than phase change storage systems.
- Water can also serve as a water reservoir for fire protection.
- Stored water can serve as a standby source for heating/cooling in the case of power outage.
- Less costly than other mediums.
The separation of the cold/hot water stored in the storage tank and the cold/warm water returning from the building HVAC system is the key factor that contribute to the performance of water storage systems. Various methods such as the use of two tanks (one for cold and one for warm water), a membrane or diaphragm to separate cold and warm water in the same tank and natural stratification have been used. In the stratification method, cold and warm water are stored in the same tank and are separated by natural stratification and reported to have better or similar performance compared to other methods [2].
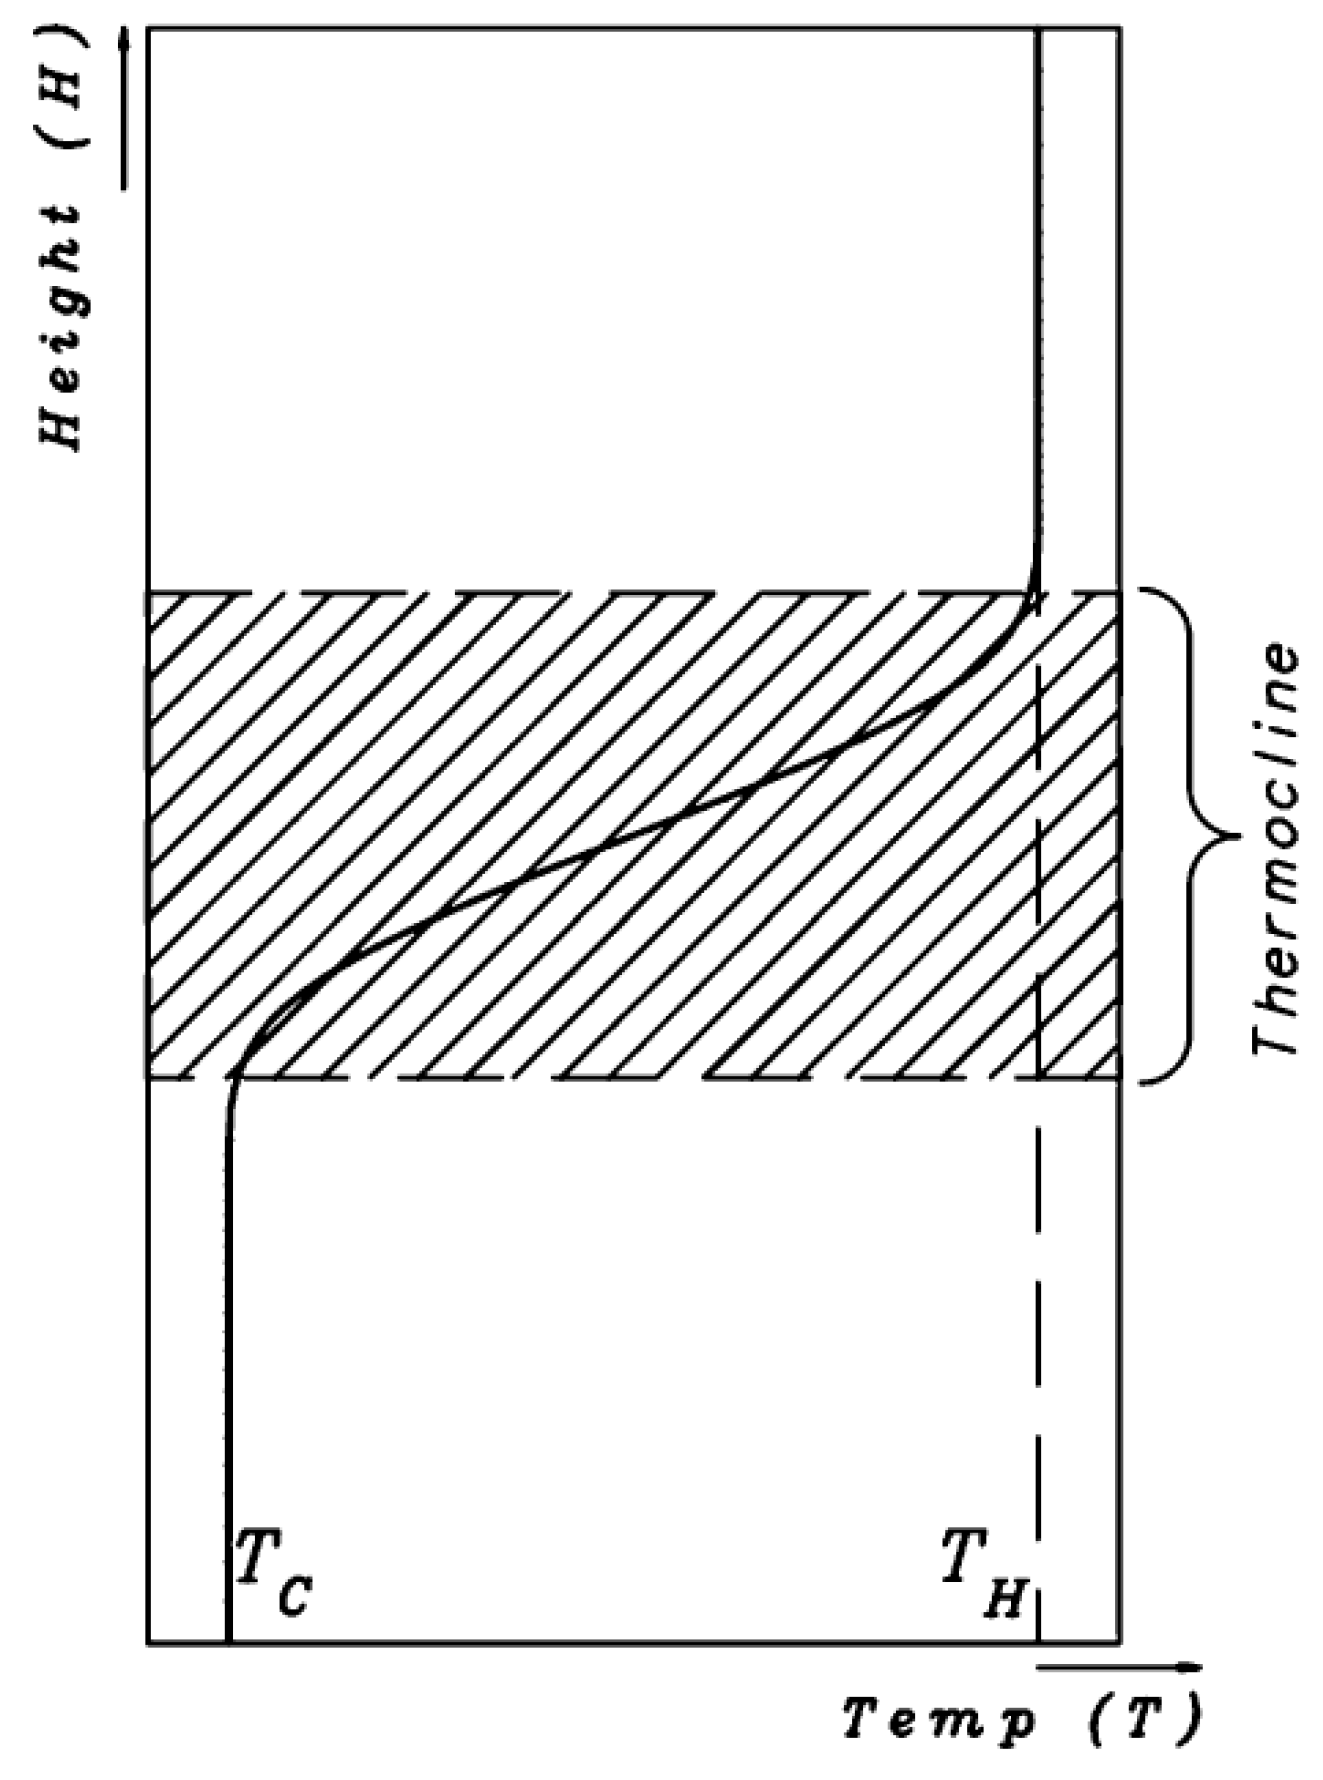
The principle of higher temperature water being less dense and therefore lighter than lower temperature water (up to 4 °C), being dense and hence heavier, allows for separation to occur. Between these low and high temperature zones, a transitional zone known as the thermocline exists. The thermocline consists of a mixture of hot and cold storage medium and consequently has intermediate density. Figure 1 shows the temperature profiles of a typical stratified storage tank [12]. It can be seen that a temperature gradient exists between the hot and cold zones, which makes the thermocline. Thermocline thickness is one of the measures of the degree of stratification occurring in the storage tank. Highly stratified systems have a narrow thermocline with a low temperature gradient, whereas lowly stratified systems have thick thermocline with a high temperature gradient.
Thermocline thickness determines the extent of mixing between warm and cold water. A small stable thermocline also reduces the amount of heat transferred between warm and cold water inside the tank during charging and discharging providing better stratification. Mechanisms that destroy stratification of TES systems include [13]:
- Natural convection from the tank to the surrounding environment.
- Mixing of hot and cold water due to the kinetic force of water entering from the top or bottom of the tank.
- Thermal diffusion and conduction within the water inside the tank and with storage tank wall, piping and other materials inside the tank.
- Aspect ratio of the storage tanks.
Mixing is the most important cause of capacity loss in stratified tanks [14]. Heat transfer between hot and cold water through the thermocline causes loss of thermal storage capacity and is also a major cause of stratification degradation in TES systems [15]. Careful analysis of the operating variables and storage tank design is required to minimise fluid mixing. Highly stratified TES systems can provide enhanced capacity to store quality thermal energy for heating and cooling systems through minimising heat losses. The first author Karim has developed a stratified chilled water thermal storage system and demonstrated that a stratified storage tank for an air conditioning system consistently stratified in the absence of any physical barrier [2]. He also investigated the effect of flow rates on storage efficiency and showed that storage efficiency decreased at higher flow rate due to increased mixing. However, the effect of temperature range and tank design were not investigated in that study. The present study is the continuation of the previous study and aims to investigate the effect of the design and operating parameters on the mixing and degradation of thermal stratification. The investigation was conducted for both hot and cold water storage and hence applicable to any HVAC system.
2. Analysis
Better stratification can be ensured with the appropriate design of the tank, proper control of temperature differences, maintaining the right inlet velocity and the introduction of cold water from the bottom of the tank. If these are ensured, mechanical disturbances will be minimum, and the density differences should create a region of vertical temperature gradient, called the thermocline that separates warm and cold waters. The higher temperature water is introduced from the top of the tank during discharge cycle and the cold water from the bottom of the tank during the charging cycle. In this study, the mixing and thermocline behaviours of TES were investigated for changes in inlet velocity, the temperature difference between the inlet water and stored water and the tank aspect ratio. As mentioned earlier, five different tank geometries were examined in this study. Table 1 shows the details of the tank geometries investigated in this study.
Tank diameter and height varied to provide different aspect ratios determined by:
Inlet water temperature was set at 283 K. The thermal properties of the inlet water at that temperature are:
- Density
- Dynamic viscosity
- Thermal expansion coefficient
The three initial tank water temperatures used for analysis are: 293, 323, and 363 K. Temperature-dependent properties for water were considered for the simulations. Inlet flow velocities ranged between 0.5 cm/s and 6 cm/s.
The effects of different parameters such as inlet water velocity were examined using the dimensionless parameters of the Richardson and Reynolds numbers. Nelson et al. [16] found that the ‘mixing coefficient’ is closely related to the thermocline decay and can be expressed as the ratio of the Reynolds number and the Richardson number. They suggested that mixing coefficient Z can be expressed as shown in Equation (2):
where the Reynolds number, , and Richardson number, , are expressed as:
A mixing coefficient of one represents a perfectly stratified system with no mixing [16]. As the ratio of decreases, the mixing is reduced. The ratio of Re and Ri can be written as:
As can be seen in Equation (5), a strong influence of flow velocity exists on the storage mixing, as shown in Equation (5).
The parameters of water density, viscosity and thermal expansion are temperature dependent. Therefore, reducing the mixing results in:
- Reduced inflow velocity.
- Increased temperature difference.
- Increased distance between ports (increasing the aspect ratio).
3. Simulation
Modelling and simulation of the thermal storage tank were conducted using ANSYS-CFX (ANSYS CFX-Solver Modeling, Release 12.1, ANSYS Inc., Canonsburg, PA, USA, 2009) [17]. The governing transport equations for a mass, momentum and energy conservation for a fluid are:
- Continuity:
- Momentum:
Thermal energy is being transferred in the storage system. It only considers the transfer of enthalpy.
Due to the heat being transferred based on the temperature differences of the stored water, the buoyancy effects of the water must be considered as a result of the density differences:
Buoyancy differences are governed by gravity. The “Boussinesq” model is used to account for these small density changes through the use of varying thermal expansion , based on the temperature differences:
The CFX model will be one-dimensional in nature as the degree of stratification and thermocline thickness is only dependent on one dimension. The energy equation is described in scalar components:
Boundary conditions that influence the system and hence model simulation are the inlet, outlet and tank wall conditions and the conditions at the interface between the liquid and solid at the inlet, outlet and wall. Total enthalpy is determined from the static enthalpy and the boundary conditions of energy and pressure and enthalpy as a function of pressure and temperature [17]. Inlet and outlet flows are considered to be subsonic and are specified to have static pressure. The simulation is considered to be transient due to the changing water characteristics and heat transfer with time.
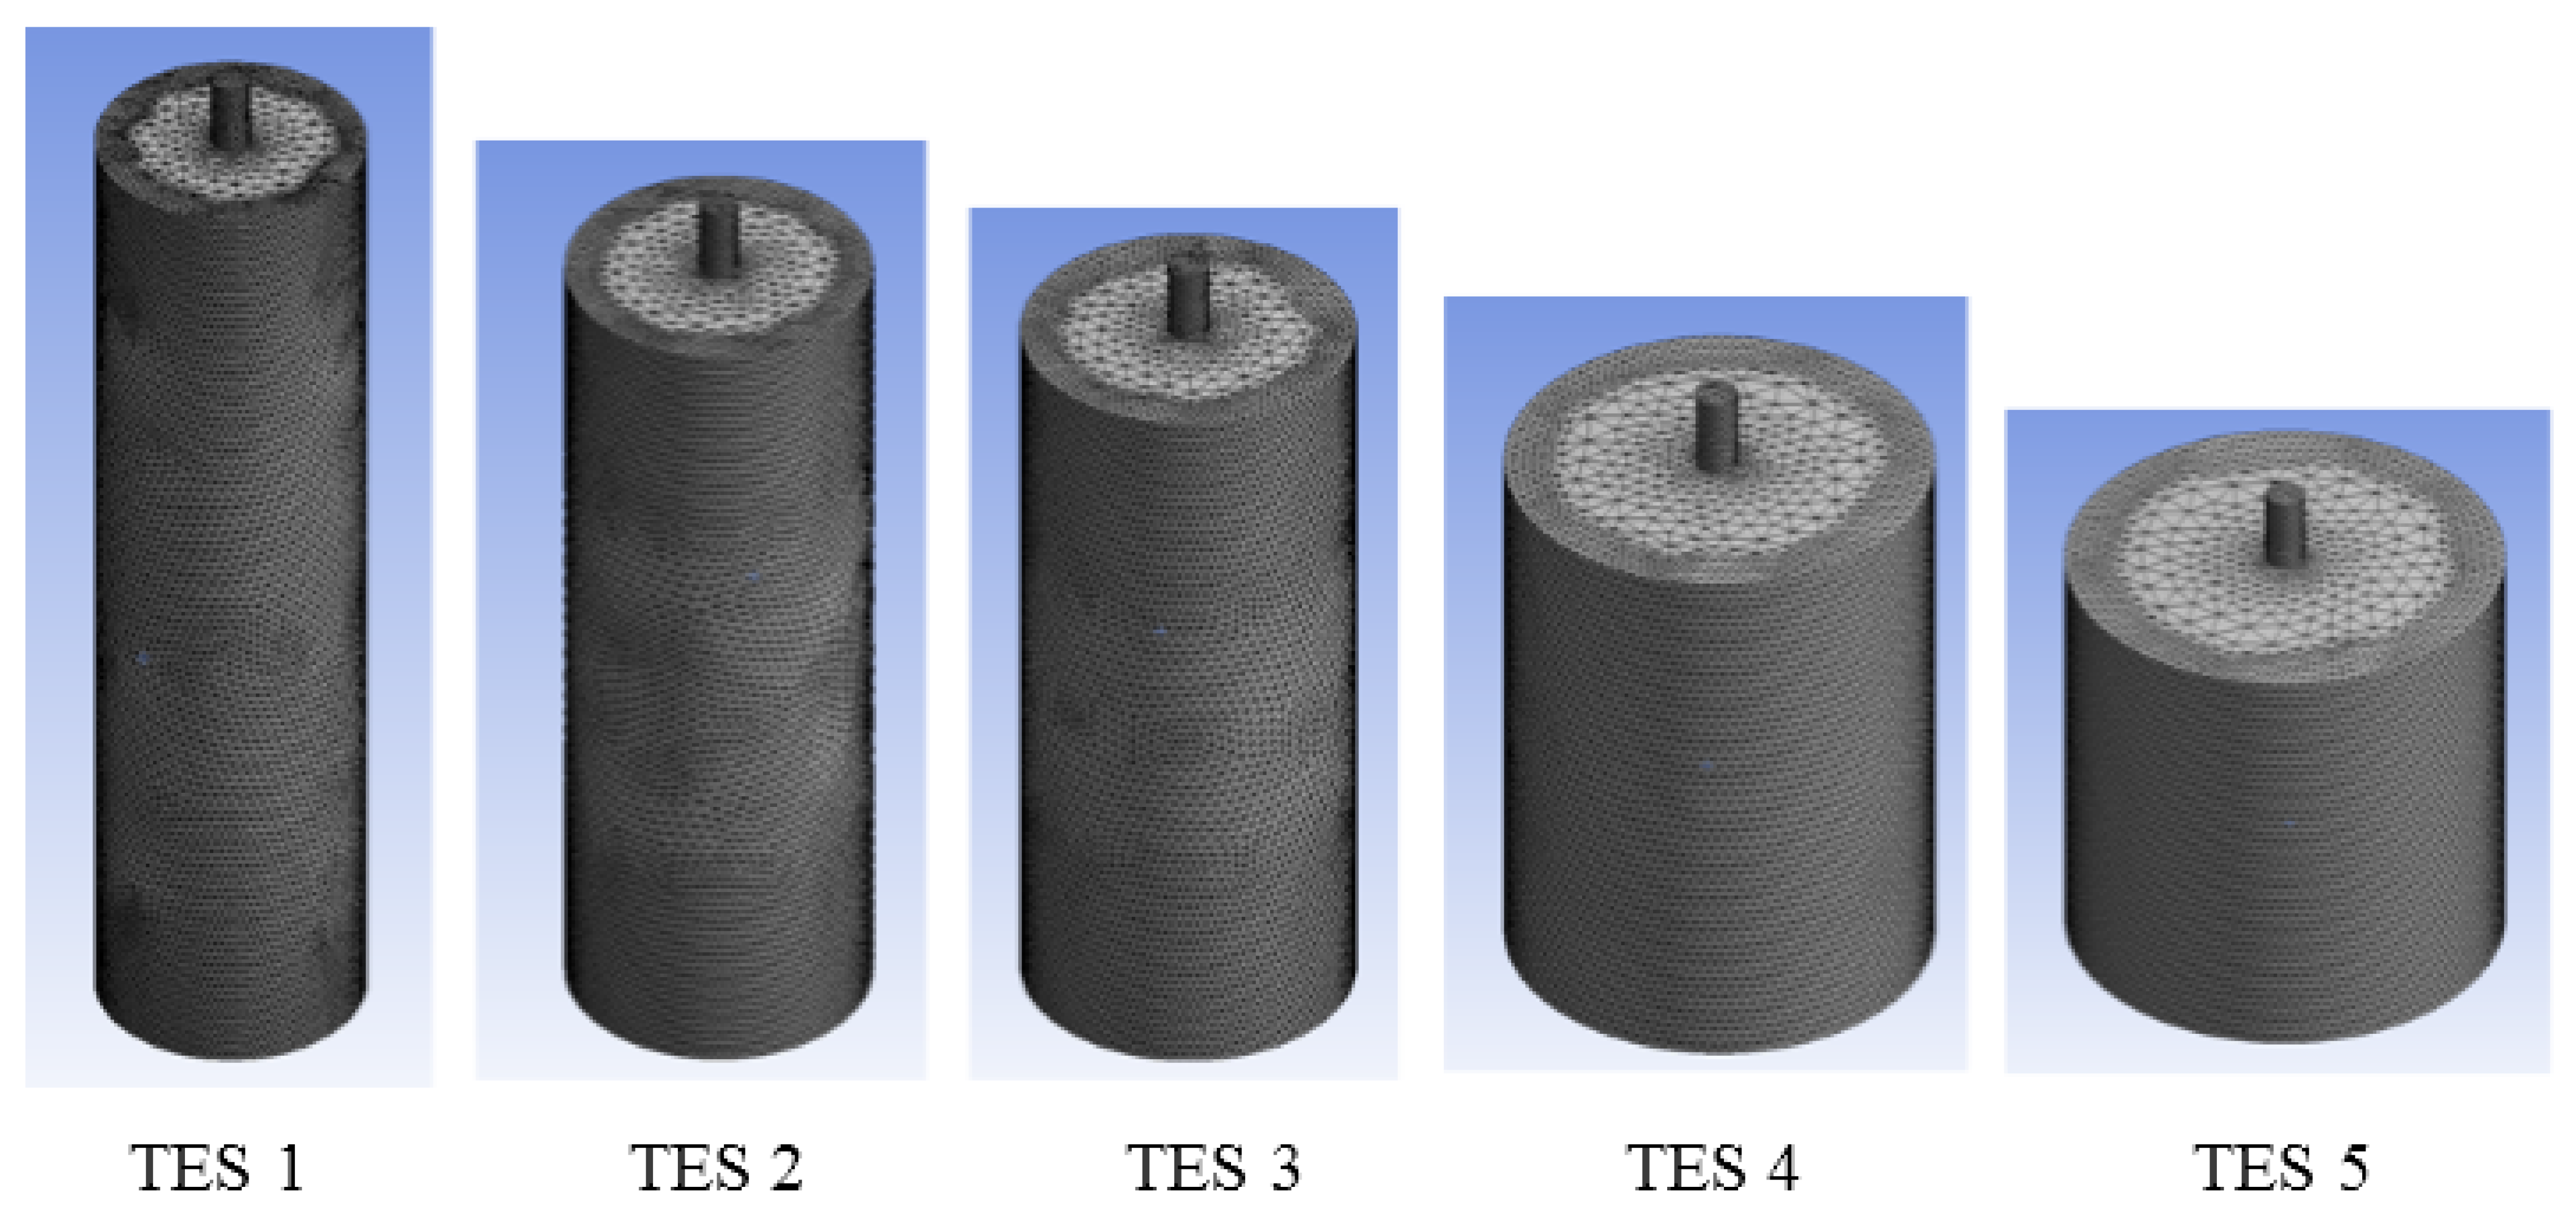
Tank geometries were constructed, using the CFX modeller, for the five TES systems according to the dimensions provided in Table 1. As the tank geometries studied are simple and cylindrical in shape, uniformity throughout the volume of tank was considered to provide consistent representation of heat transfer during charging. For greater accuracy, a smaller element size was implemented around the inlet/outlet connections with the tank. For initial simulations, the default ANSYS meshing plan was adopted. However, with default meshing, results were not very accurate as temperatures in the thermoclines were not uniform. It was assumed that to achieve better results, the number of meshing elements needs to be increased. Therefore, an additional meshing configurations was implemented, through refinement to the degree of three. This meshing scheme provided much better results, and the results were validated with published results [2]. Figure 2 shows the meshing for the five TES systems. In the model, a convergence criterion was selected as 10−4 for pressure and momentum and 10−6 for the rest of the values.
4. Results and Discussions
4.1. Analytical
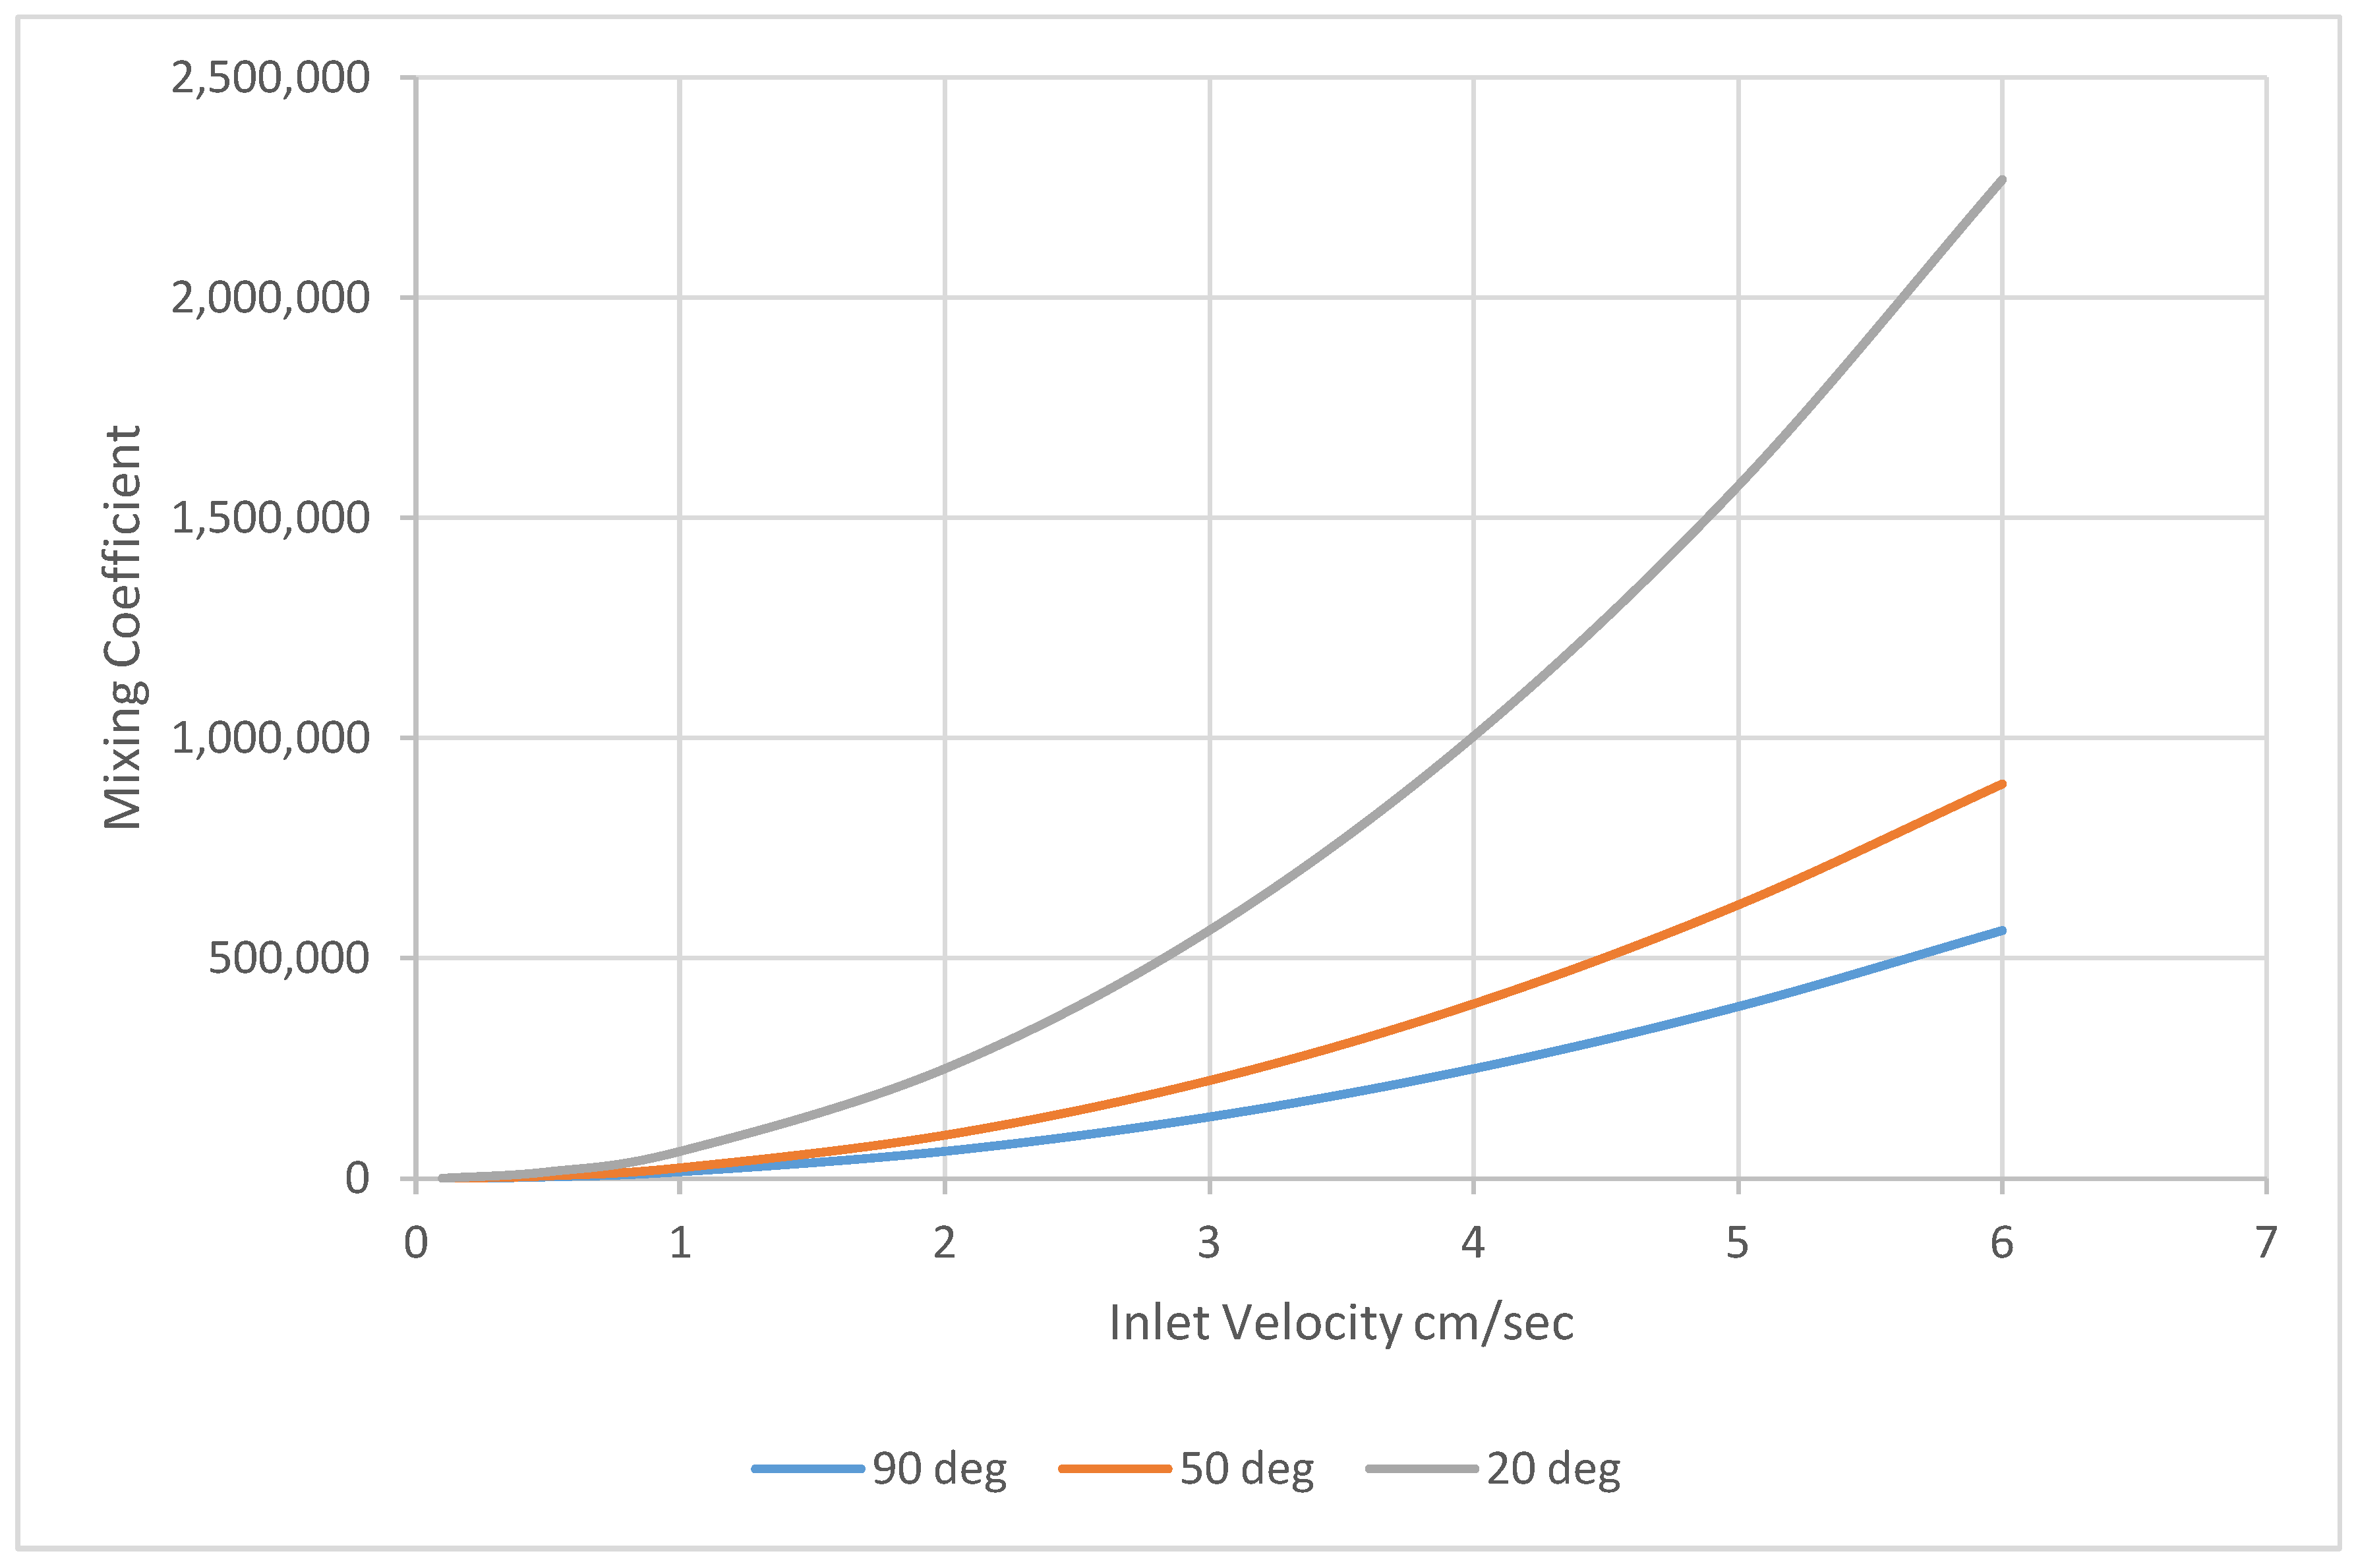
The mixing coefficient was calculated for different design and process variables using Equation (2), which was solved in the MS Excel programme. The results presented in Figure 3 show the effect of different tank water temperatures (20 °C, 50 °C and 90 °C) and inlet velocities on the mixing coefficient. As can be seen, mixing is reduced when the temperature difference between the cool inlet water and warm stored water is increased. Mixing is more volatile at lower temperature differences with greater mixing. At higher temperature differences, mixing is lower. Overall mixing increases by 303% when the temperature differential is reduced from 80 °C to 10 °C. These results clearly imply that a very low temperature differential between the inlet and tank water must be avoided in order to improve the performance of the stratified tanks. In practice, the temperature difference will be low in the cooling system, as this will be limited by the chilled water temperature and building return temperature. This range is usually between 10 and 20 °C. However, a higher temperature difference is possible for a heating system, and the above limitation does not apply to a heating system. Therefore, it can be concluded that stratified TES will have better performance in a heating system compared to a cooling system. The results presented in Figure 3 will help designers in determining the suitable temperature difference for their system.
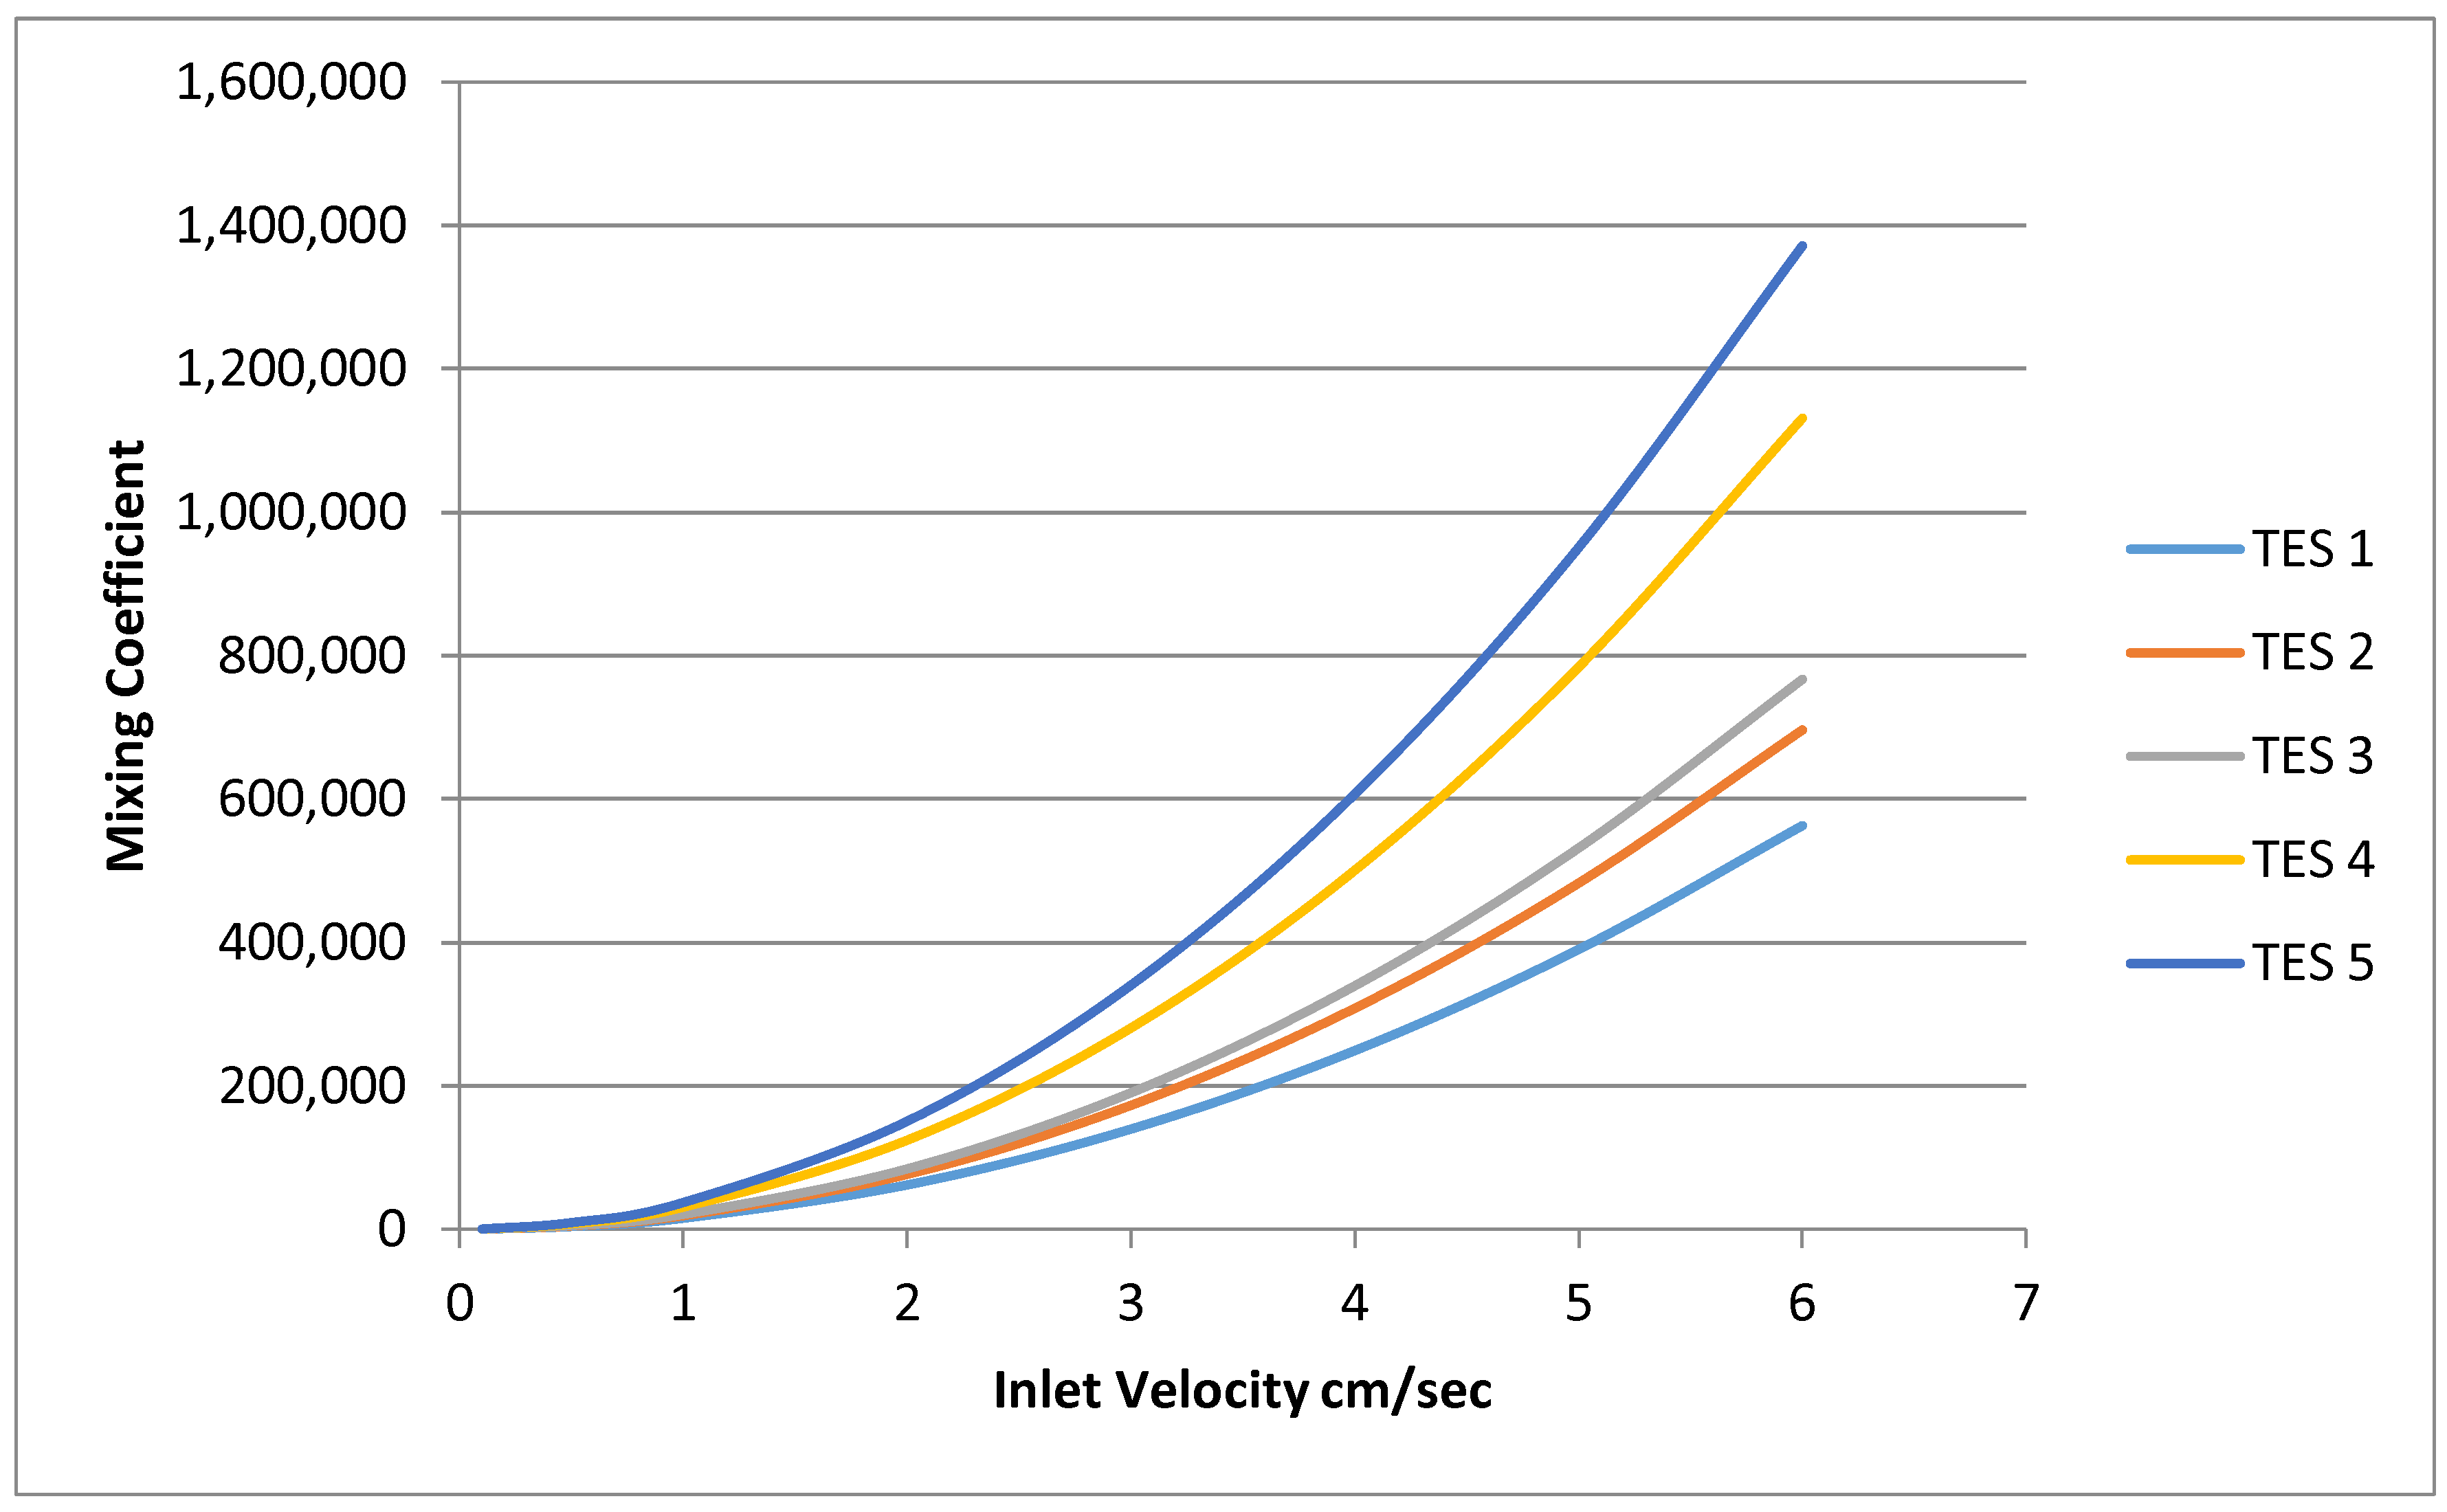
The results in Figure 4 show the effect of the aspect ratio and inlet velocities on mixing in a TES system.
As can be seen in the figure, mixing is gradually reduced when the aspect ratio is increased. Moreover, mixing in high aspect ratio systems (TES-1) is less affected by inlet velocity changes, while the effects of velocity increase in low aspect ratio tanks is significant. As can be seen, TES-2 (aspect ratio of 2.75) has a 24% higher mixing coefficient compared to TES-1 (AR of 3.8) at the same inlet velocity. Similarly, replacing a TES-2 system with a TES-3 system (AR = 2.38) increased the mixing coefficient by 10%; replacing a TES-3 system with a TES-4 system (AR = 1.33) increased the mixing coefficient by 48%; and replacing a TES-4 system with a TES-5 system (AR = 1.00) increased the mixing coefficient by 21%. Mixing increase for all the tanks was compared at the same inlet velocity (6 cm/s). Overall mixing increases by 143% when comparing a TES-5 system with a TES-1 system.
4.2. Simulation
4.2.1. Model Validation
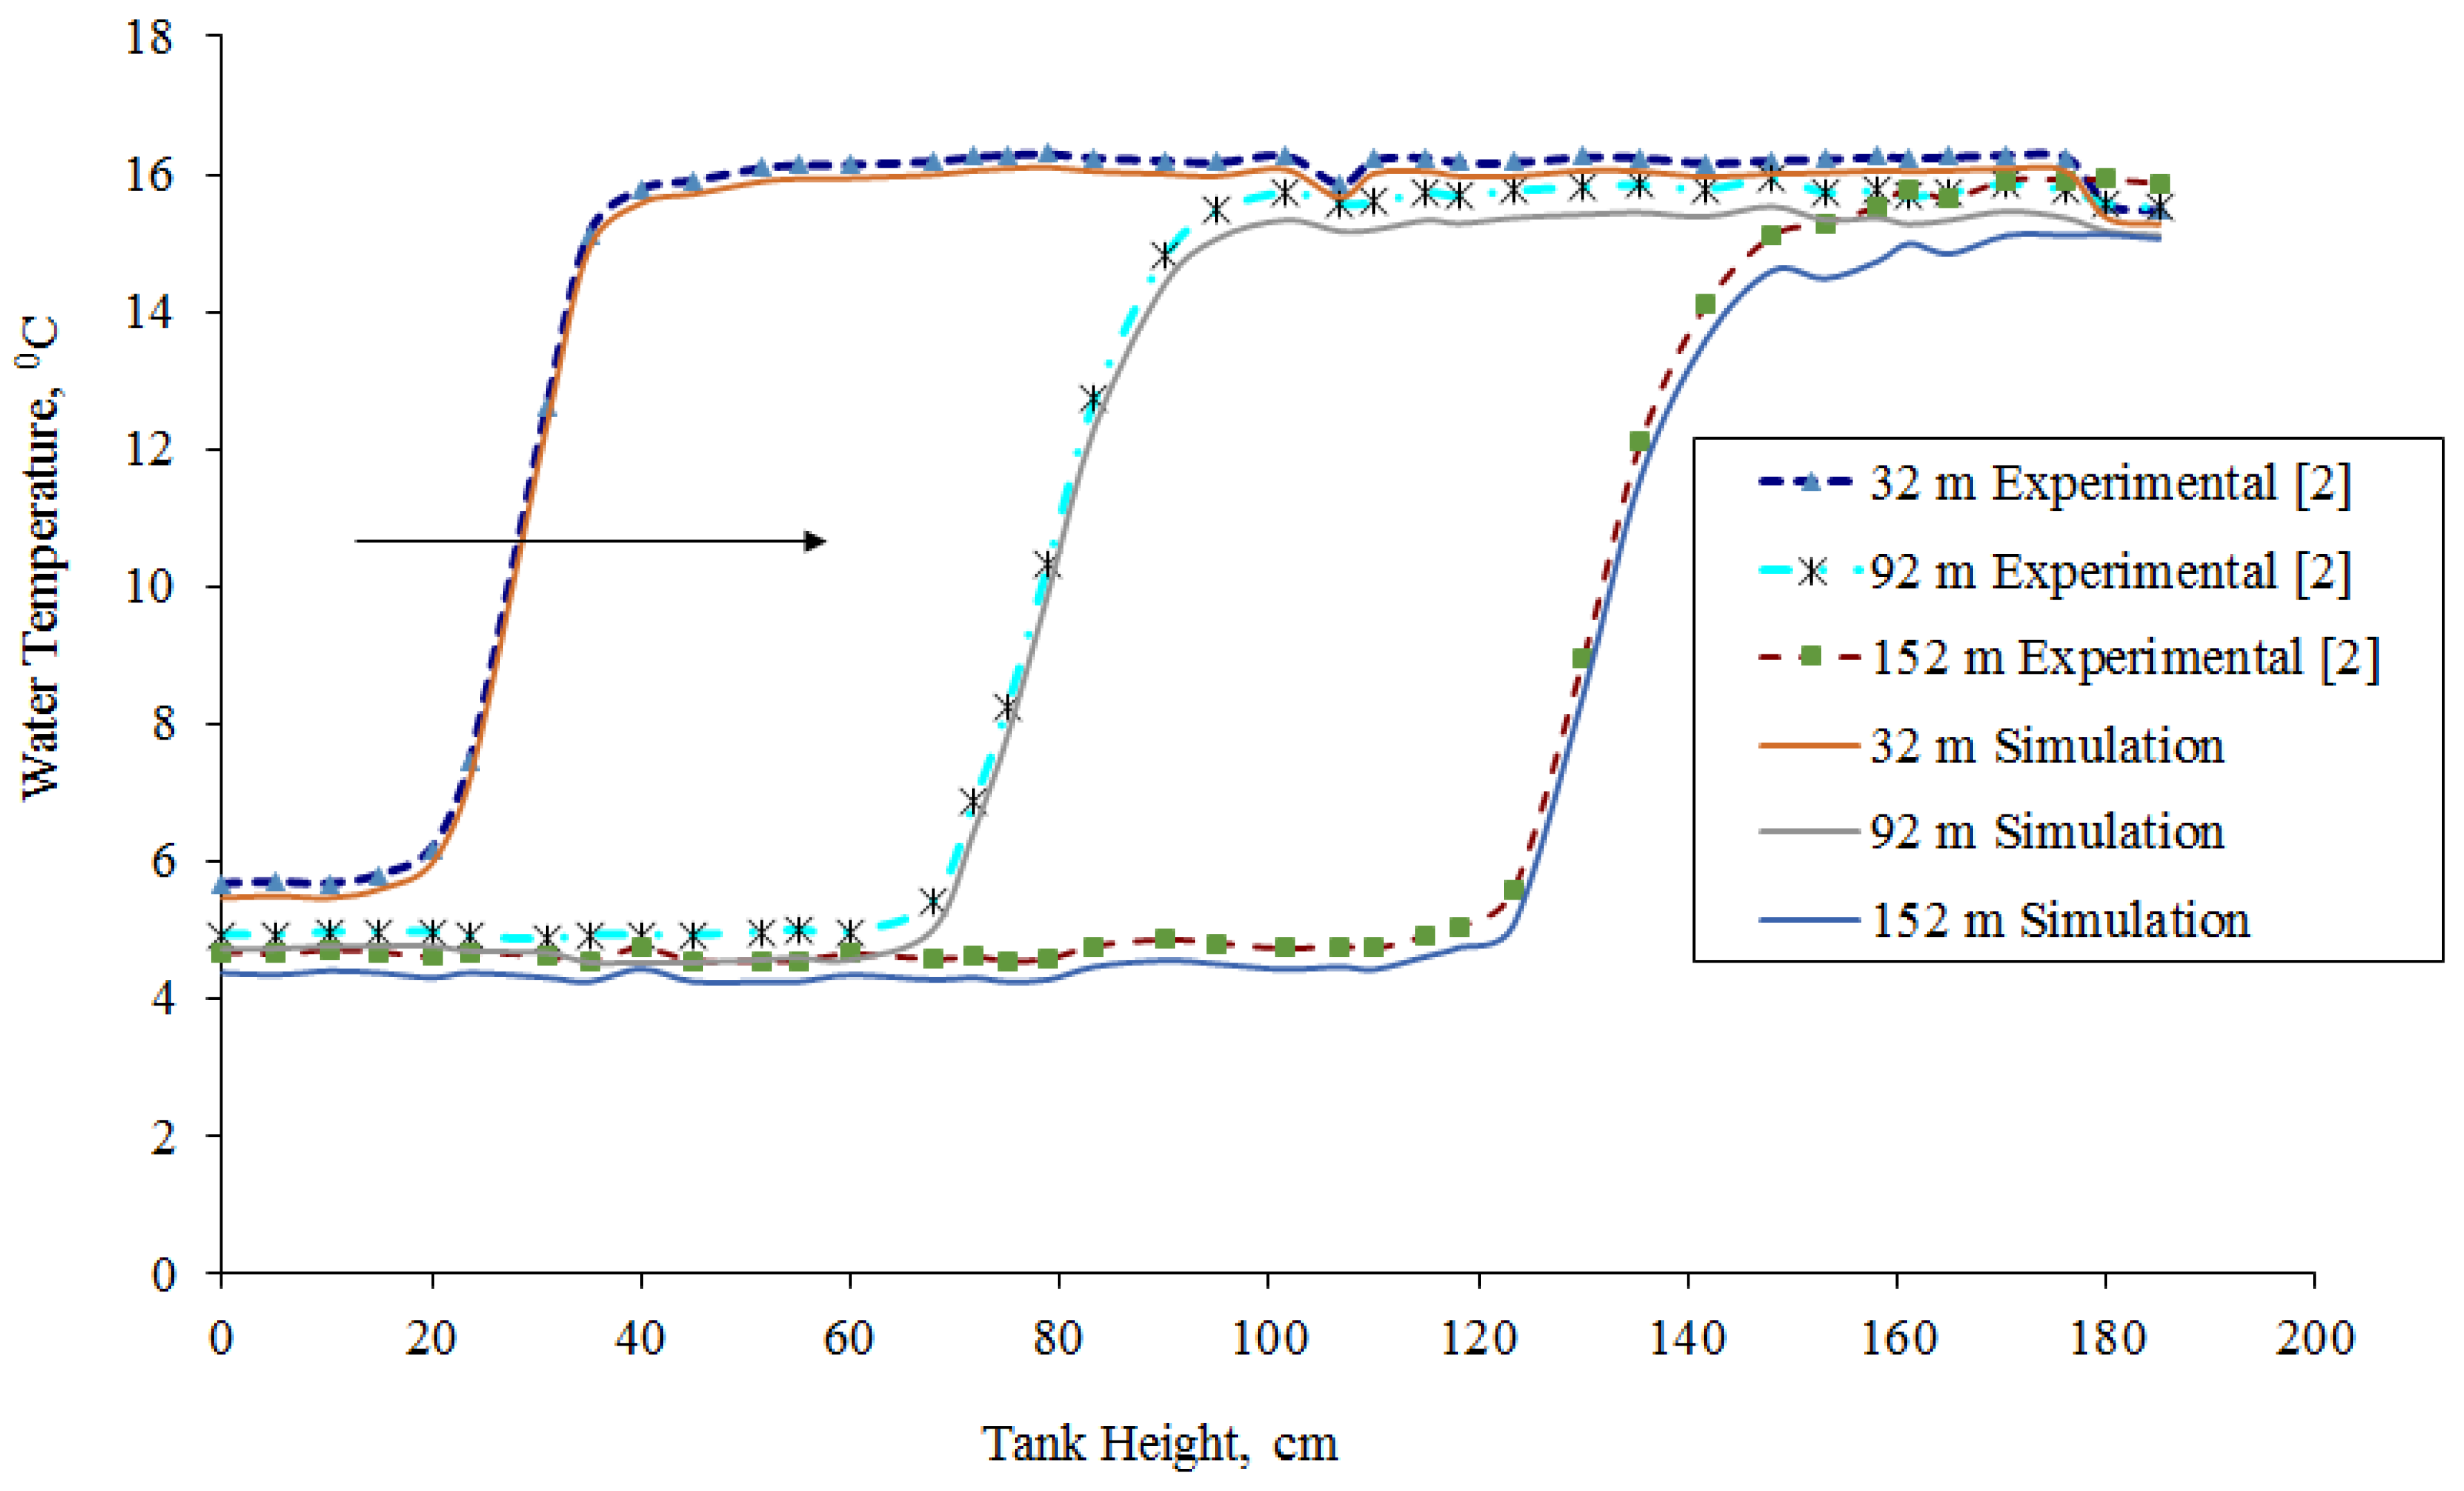
In order to validate the simulation model developed, predicted temperature profiles in a chilled water storage tank are compared with the authors’ previously published experimental data [2]. The comparison of the experimental results to the simulation results is shown in Figure 5. The tank dimensions, water flow rate, inlet and tank water temperature and other properties used in [2] were also used in this simulation for comparison purposes. It can be seen in Figure 5 that simulation results closely agreed with experimental results and hence validated the model proposed.
4.2.2. Simulation Results
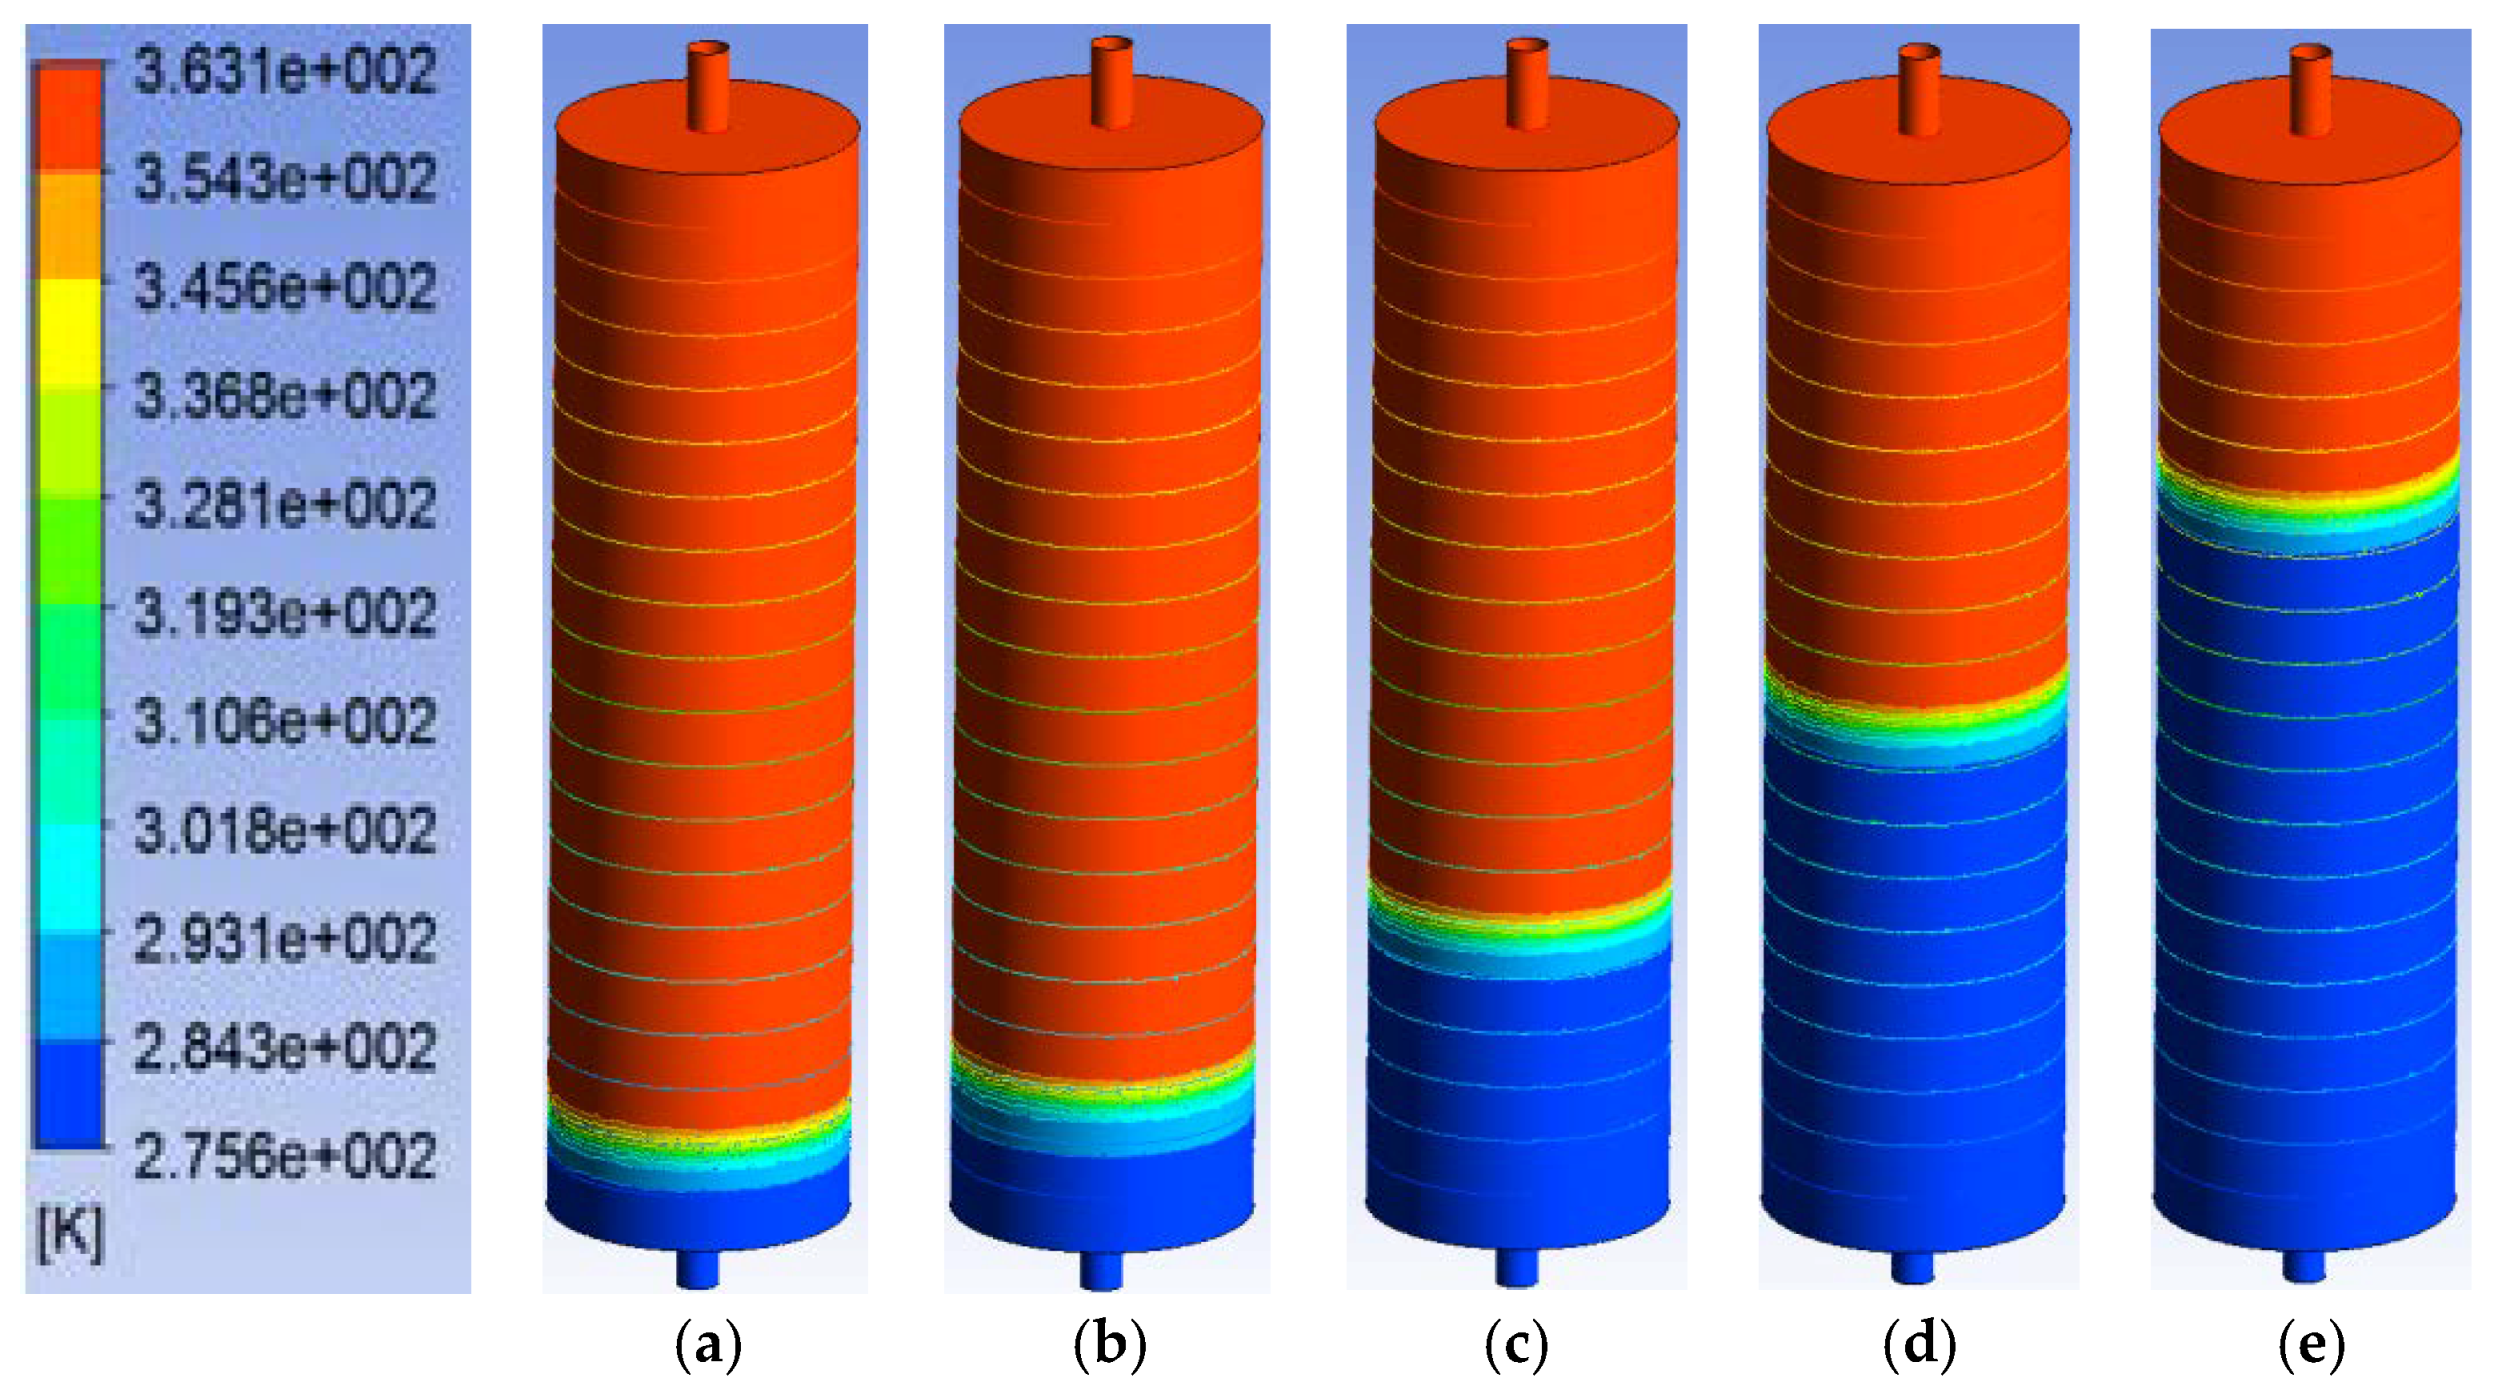
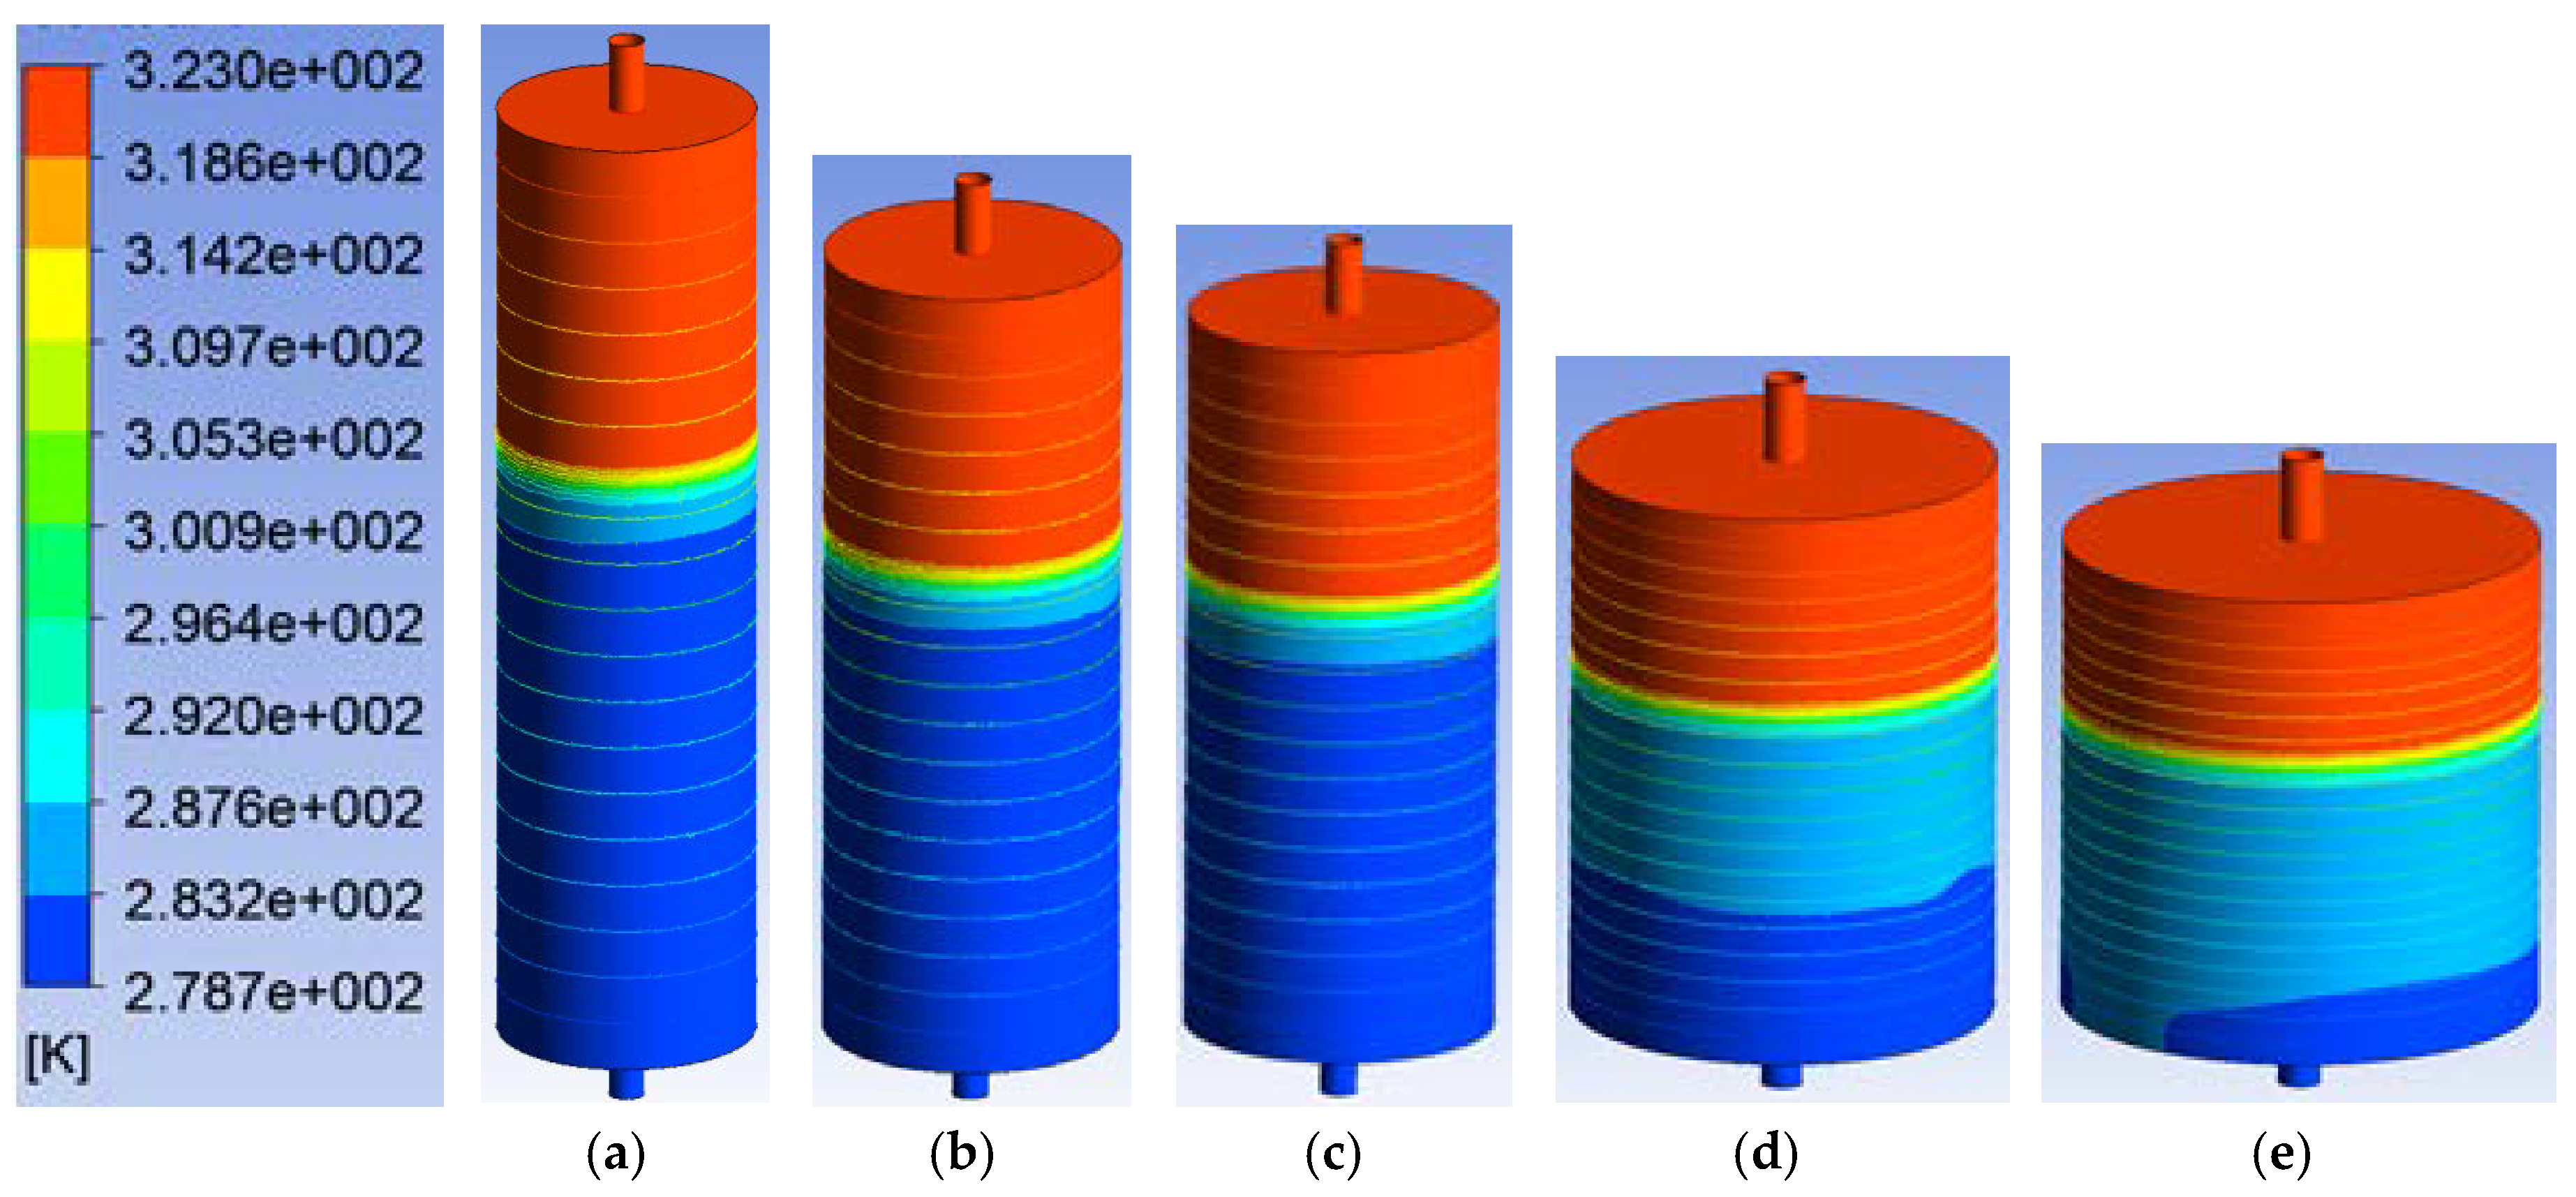
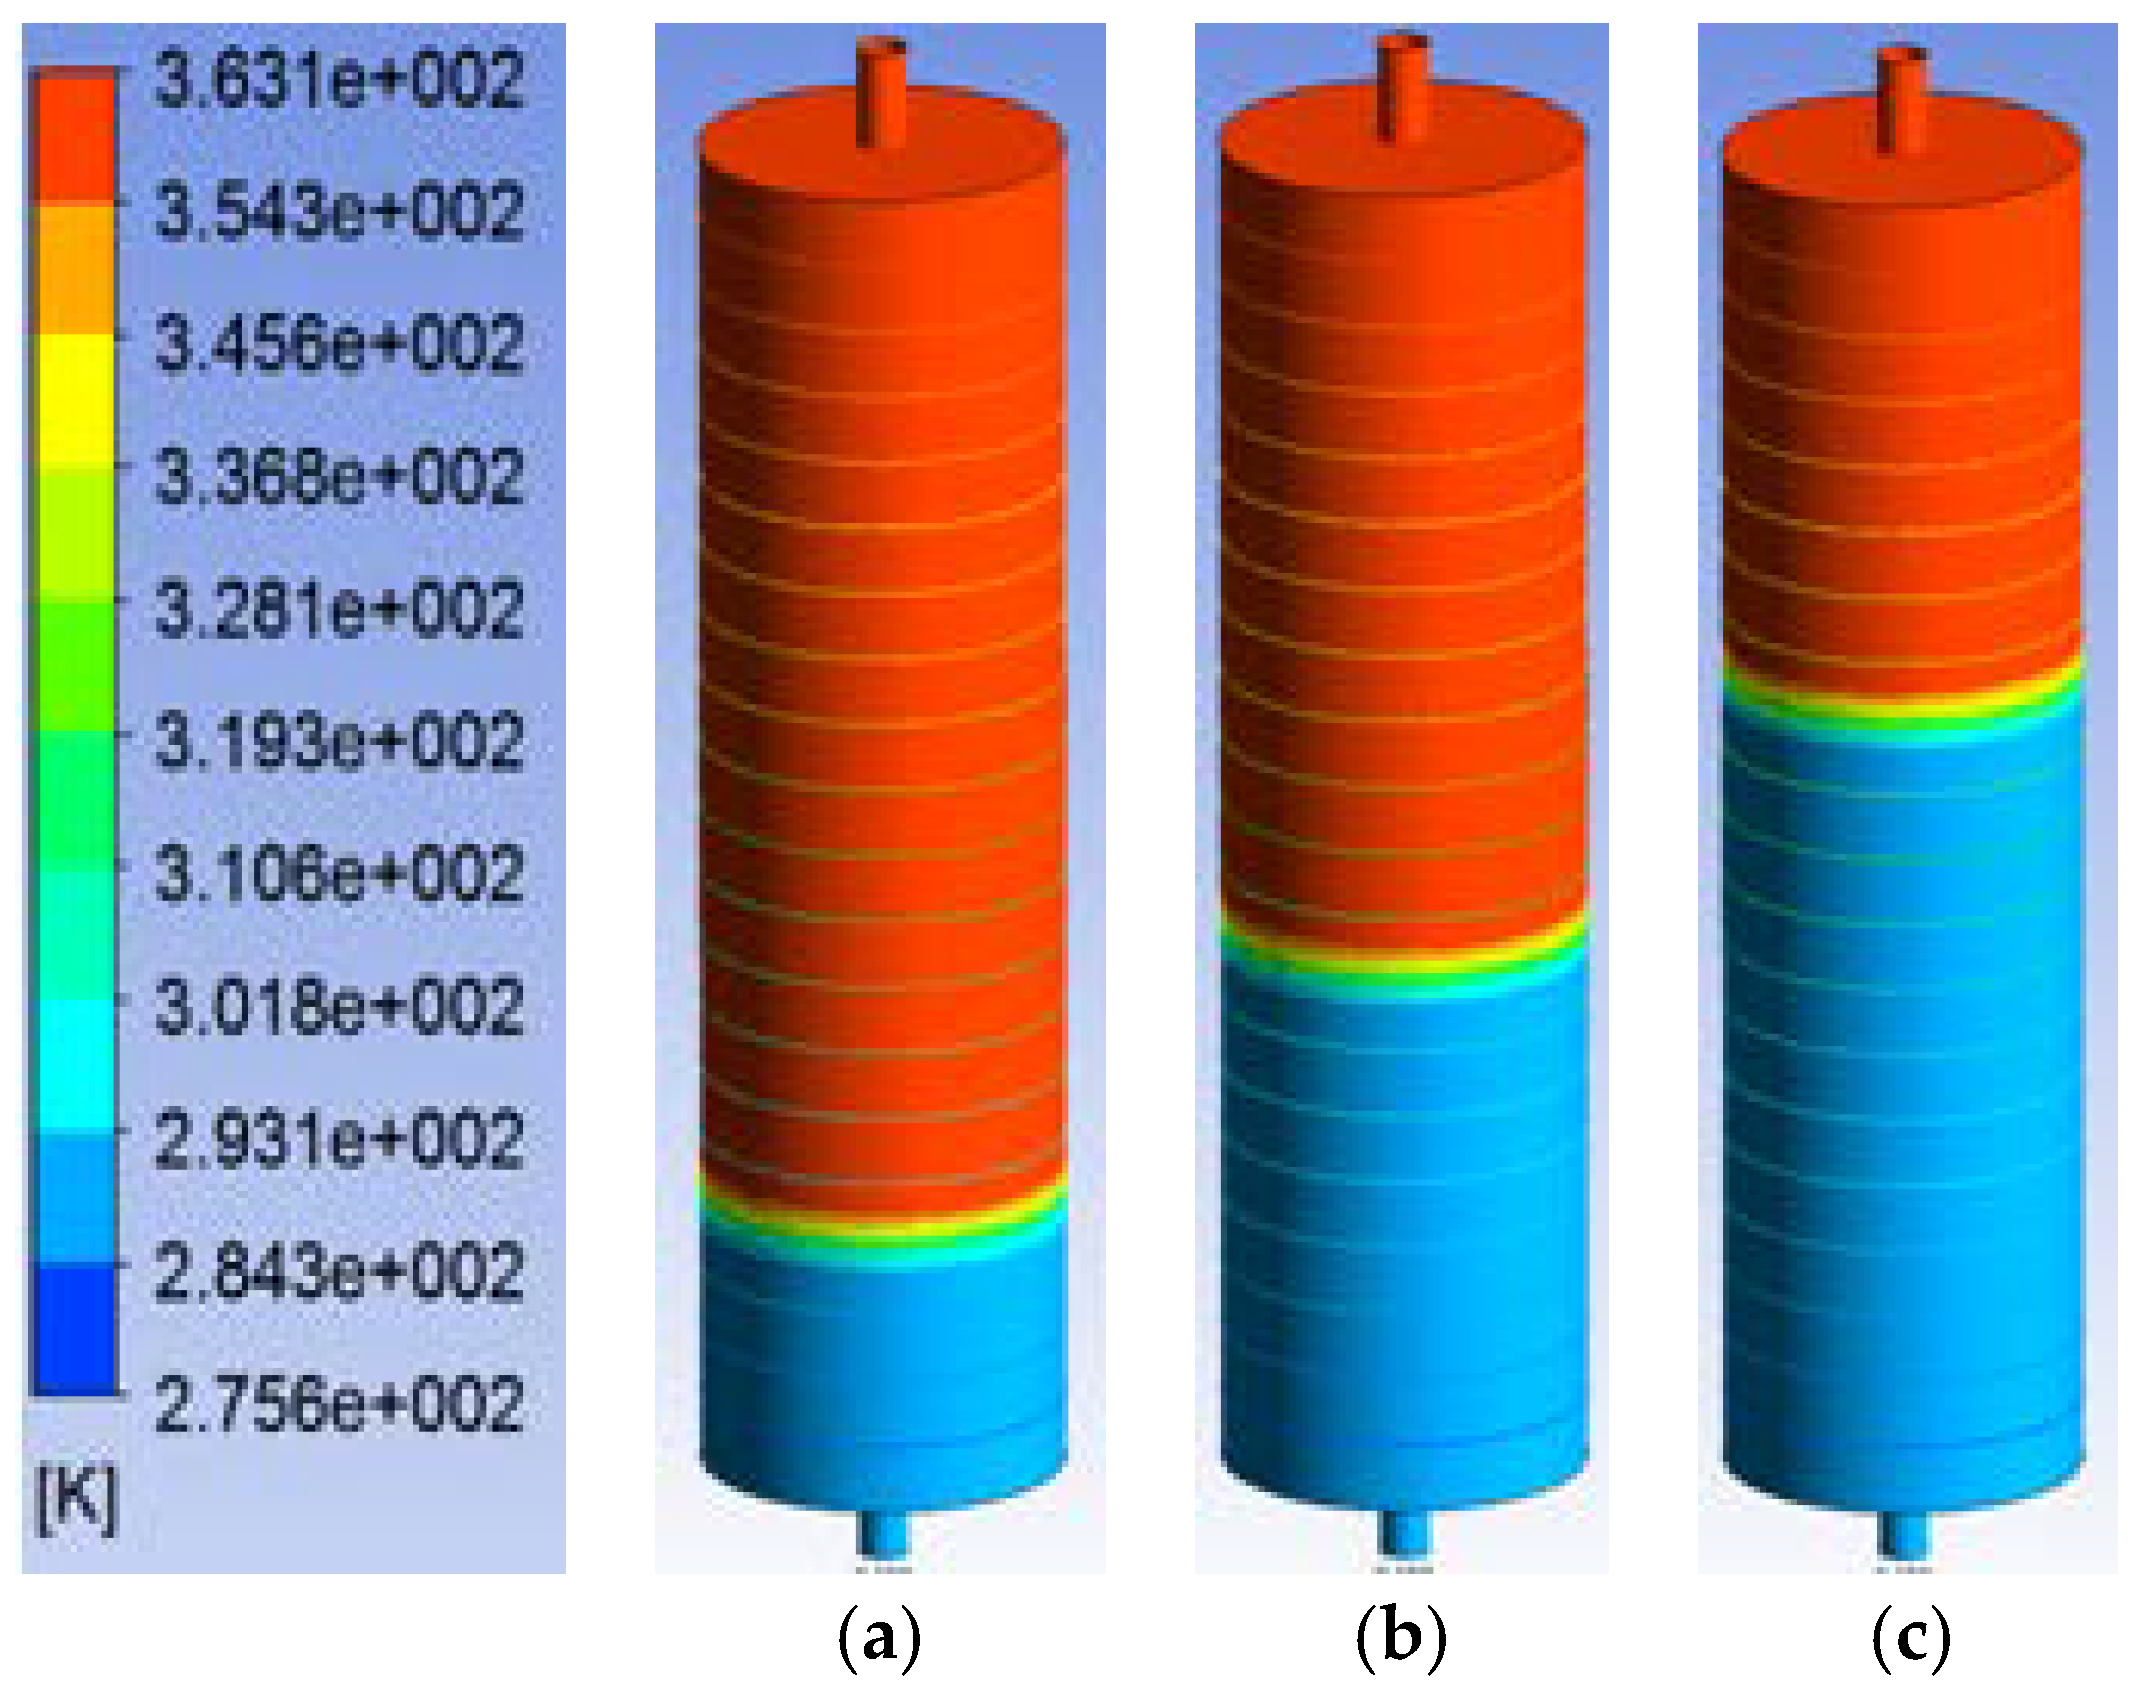
Simulation results of thermocline formation in tanks of different aspect ratios at inlet water velocity of 1.5 cm/s are presented in Figure 6. In these simulations, the tank water temperature was 50 °C, and the inlet water temperature was 6 °C.
It can be seen that mixing of hot and cold water increases with the reduction of the tank aspect rations. In Tank 5, although a thermocline is formed, much mixing can be observed below the thermocline. The above results support the theoretical analysis presented in Figure 4, showing that TES systems with higher aspect ratios are characterised by reduced mixing and more developed thermoclines.
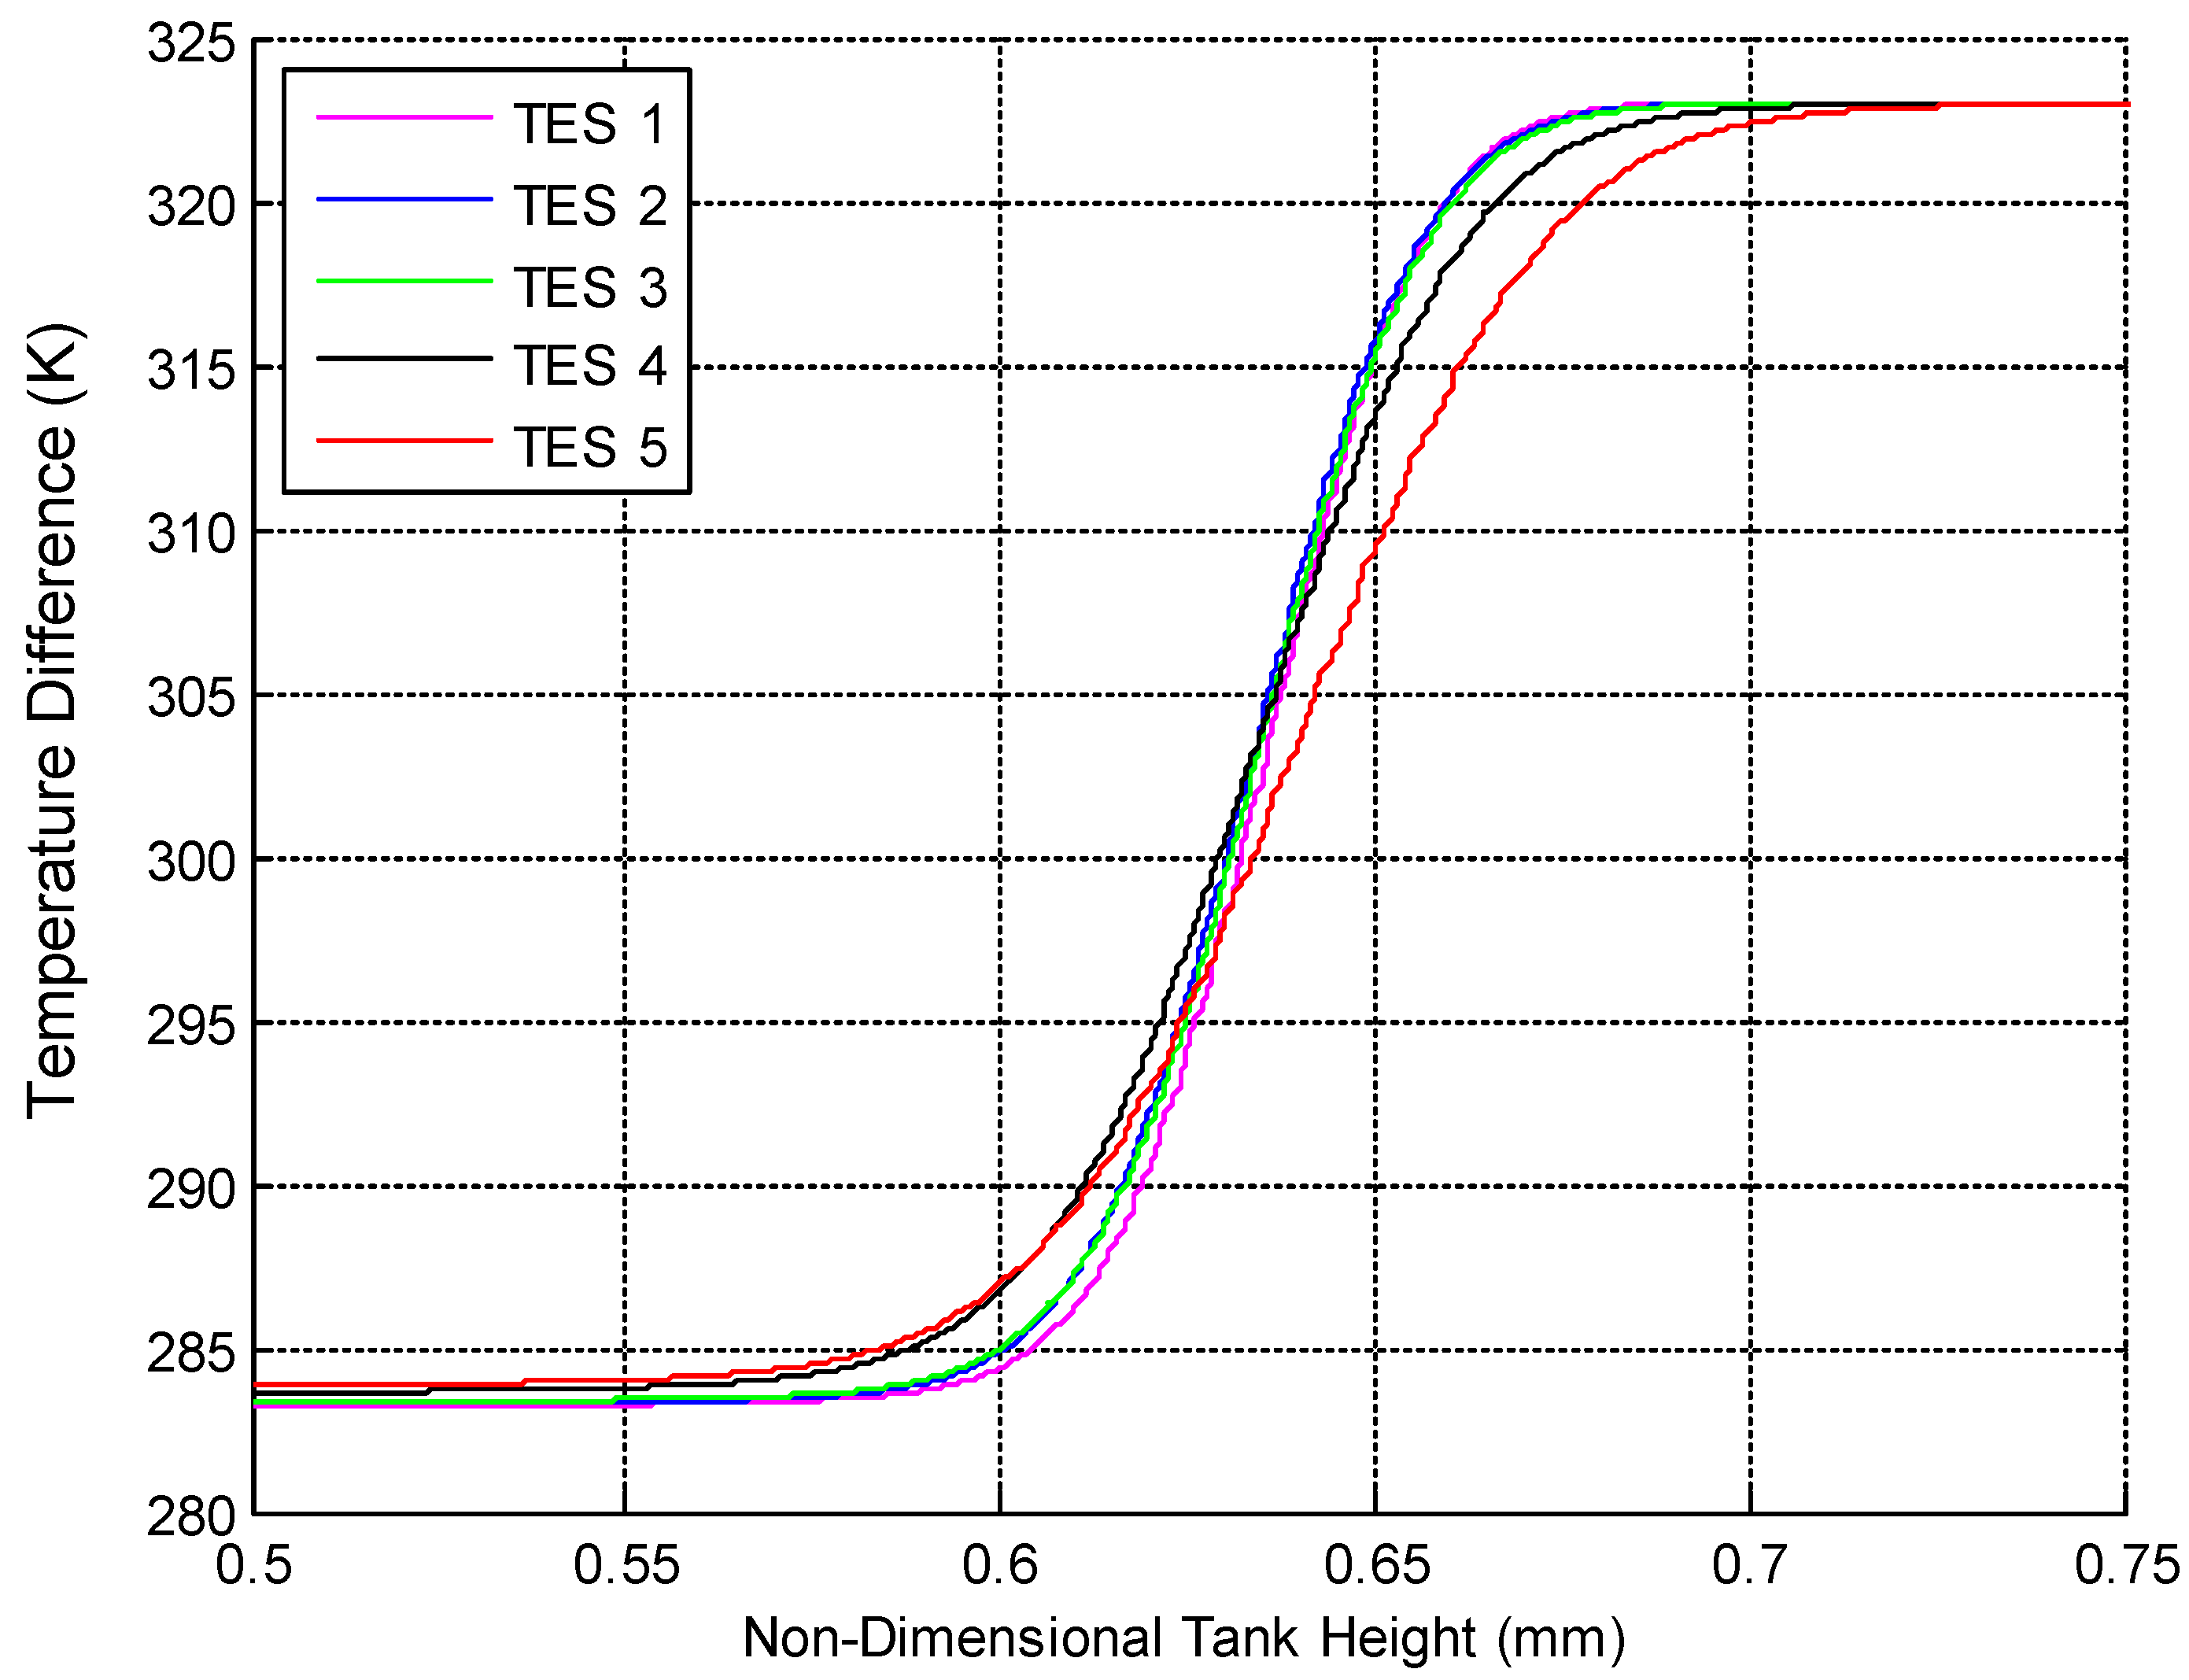
Figure 7 shows the non-dimensional thermocline thickness for different TES designs. The thermocline with the steepest temperature gradient is observed in TES-1 (highest aspect ratio). TES-2 and 3 have a slightly thicker and less developed thermocline than TES-1. TES-4 has a larger thermocline, whilst TES-5 (smallest aspect ratio) has the thickest thermocline.
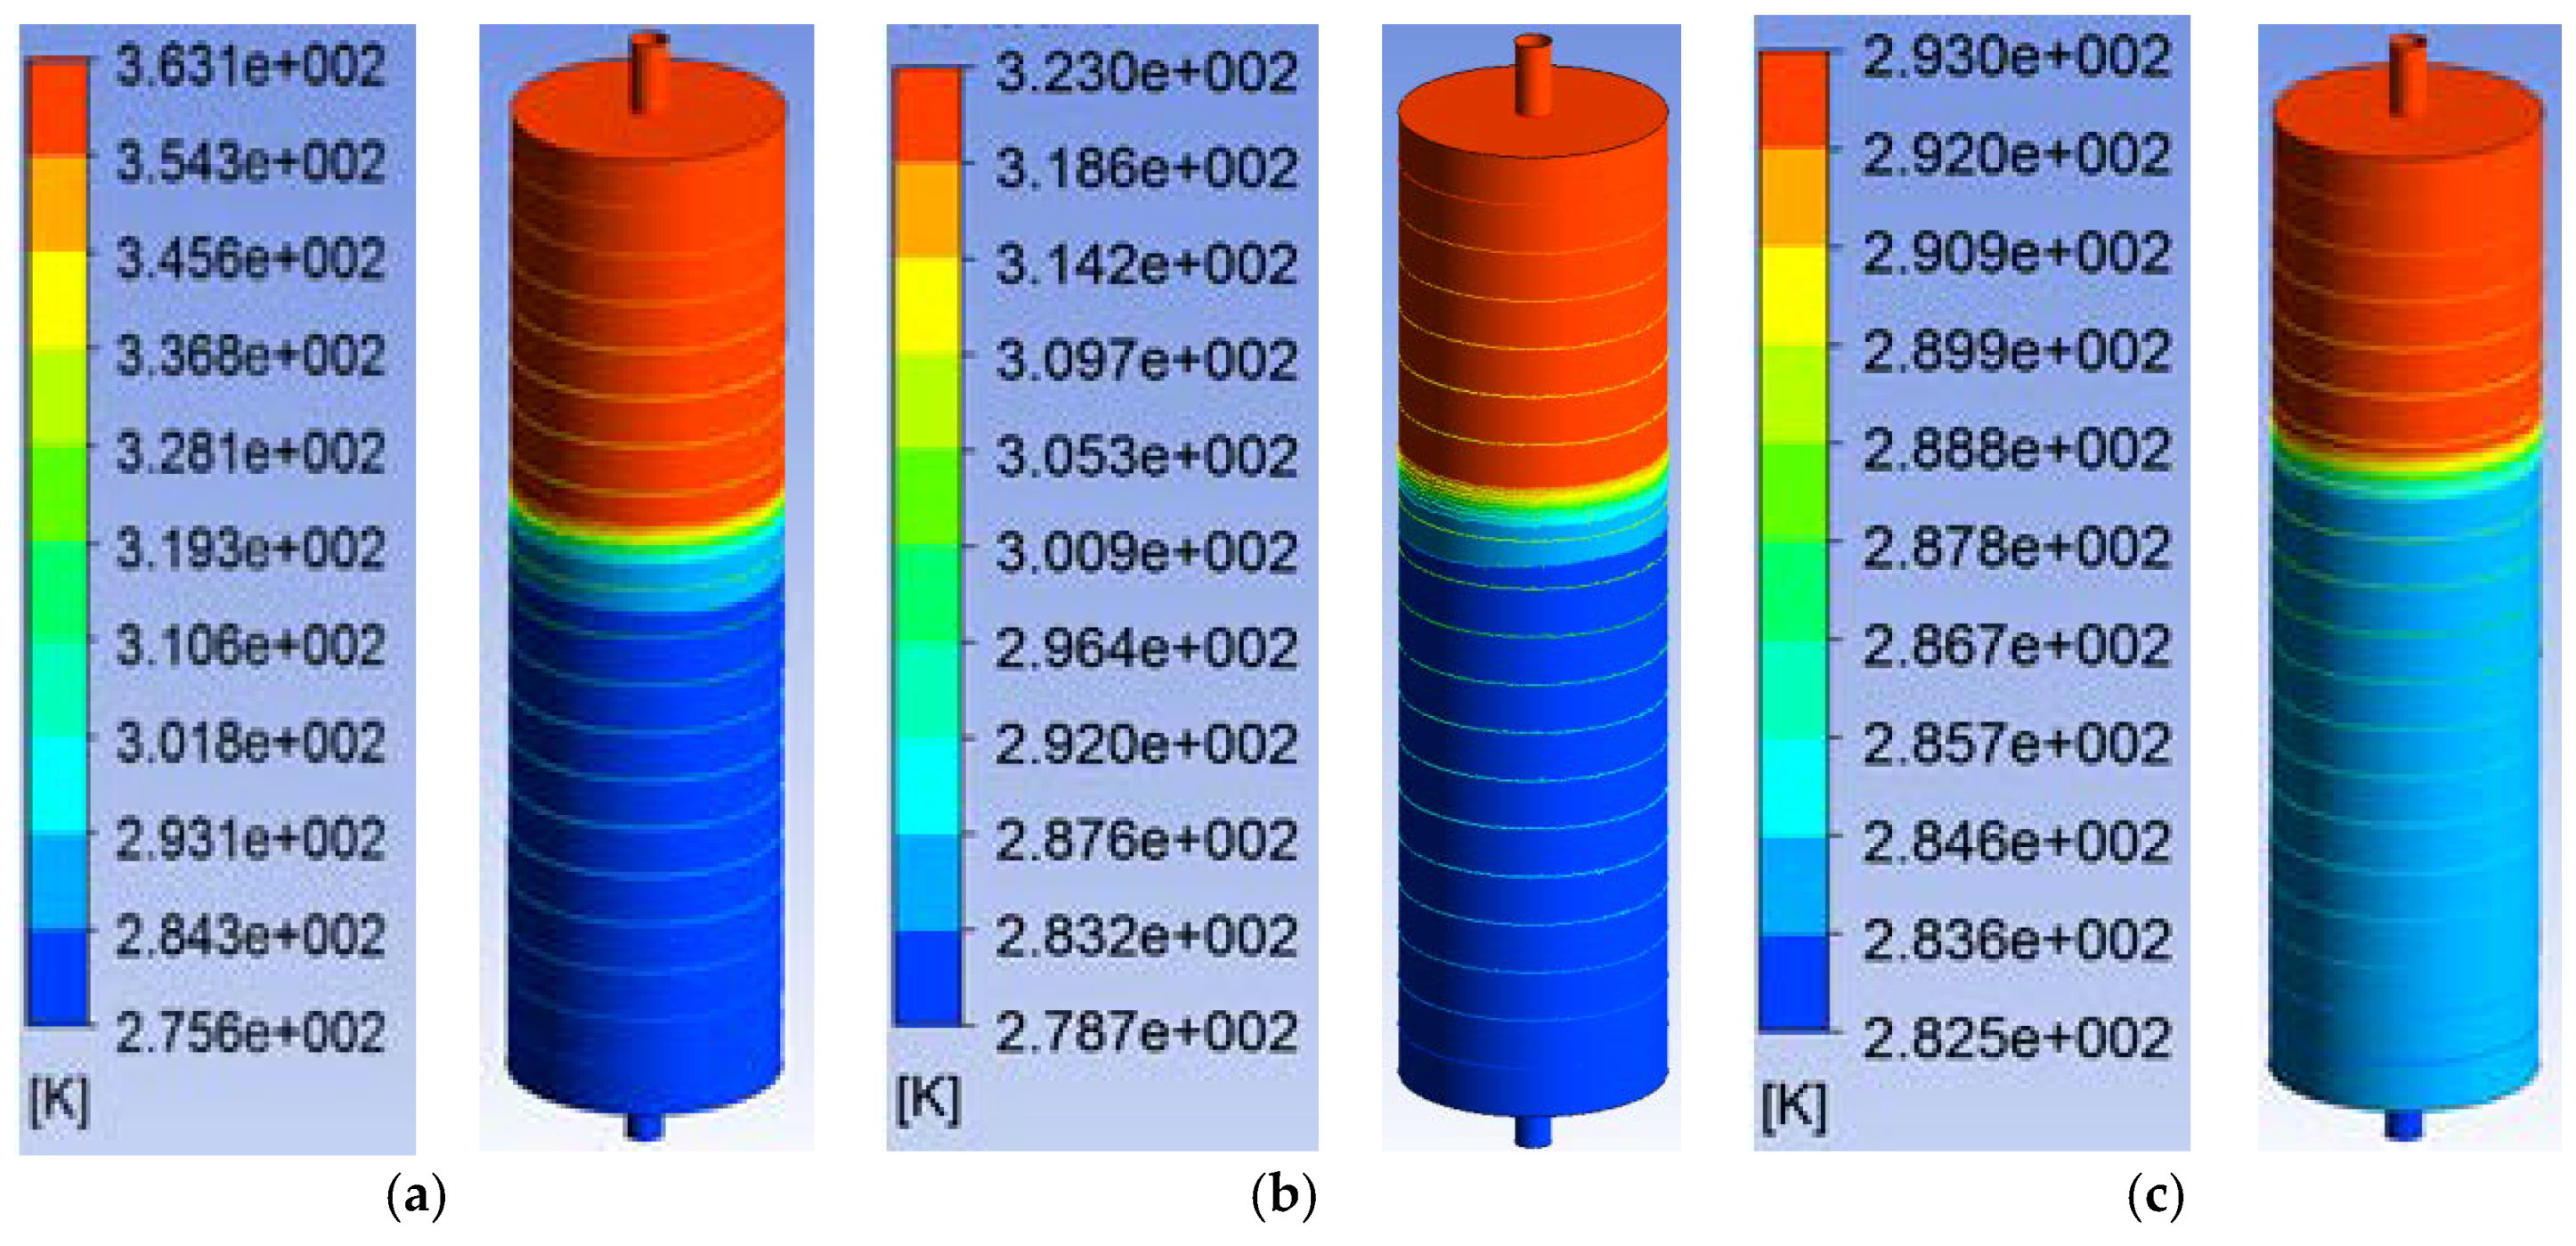
In order to investigate the impact of temperature differential between tank and inlet temperatures, TES-1 was simulated for three temperature differences (84 °C, 44 °C and 14 °C) at a constant inlet velocity of 1.5 cm/s. It can be assumed that these ranges of temperature difference (14 °C to 84 °C) cover both hot and cold water storage systems. The results are presented in Figure 8.
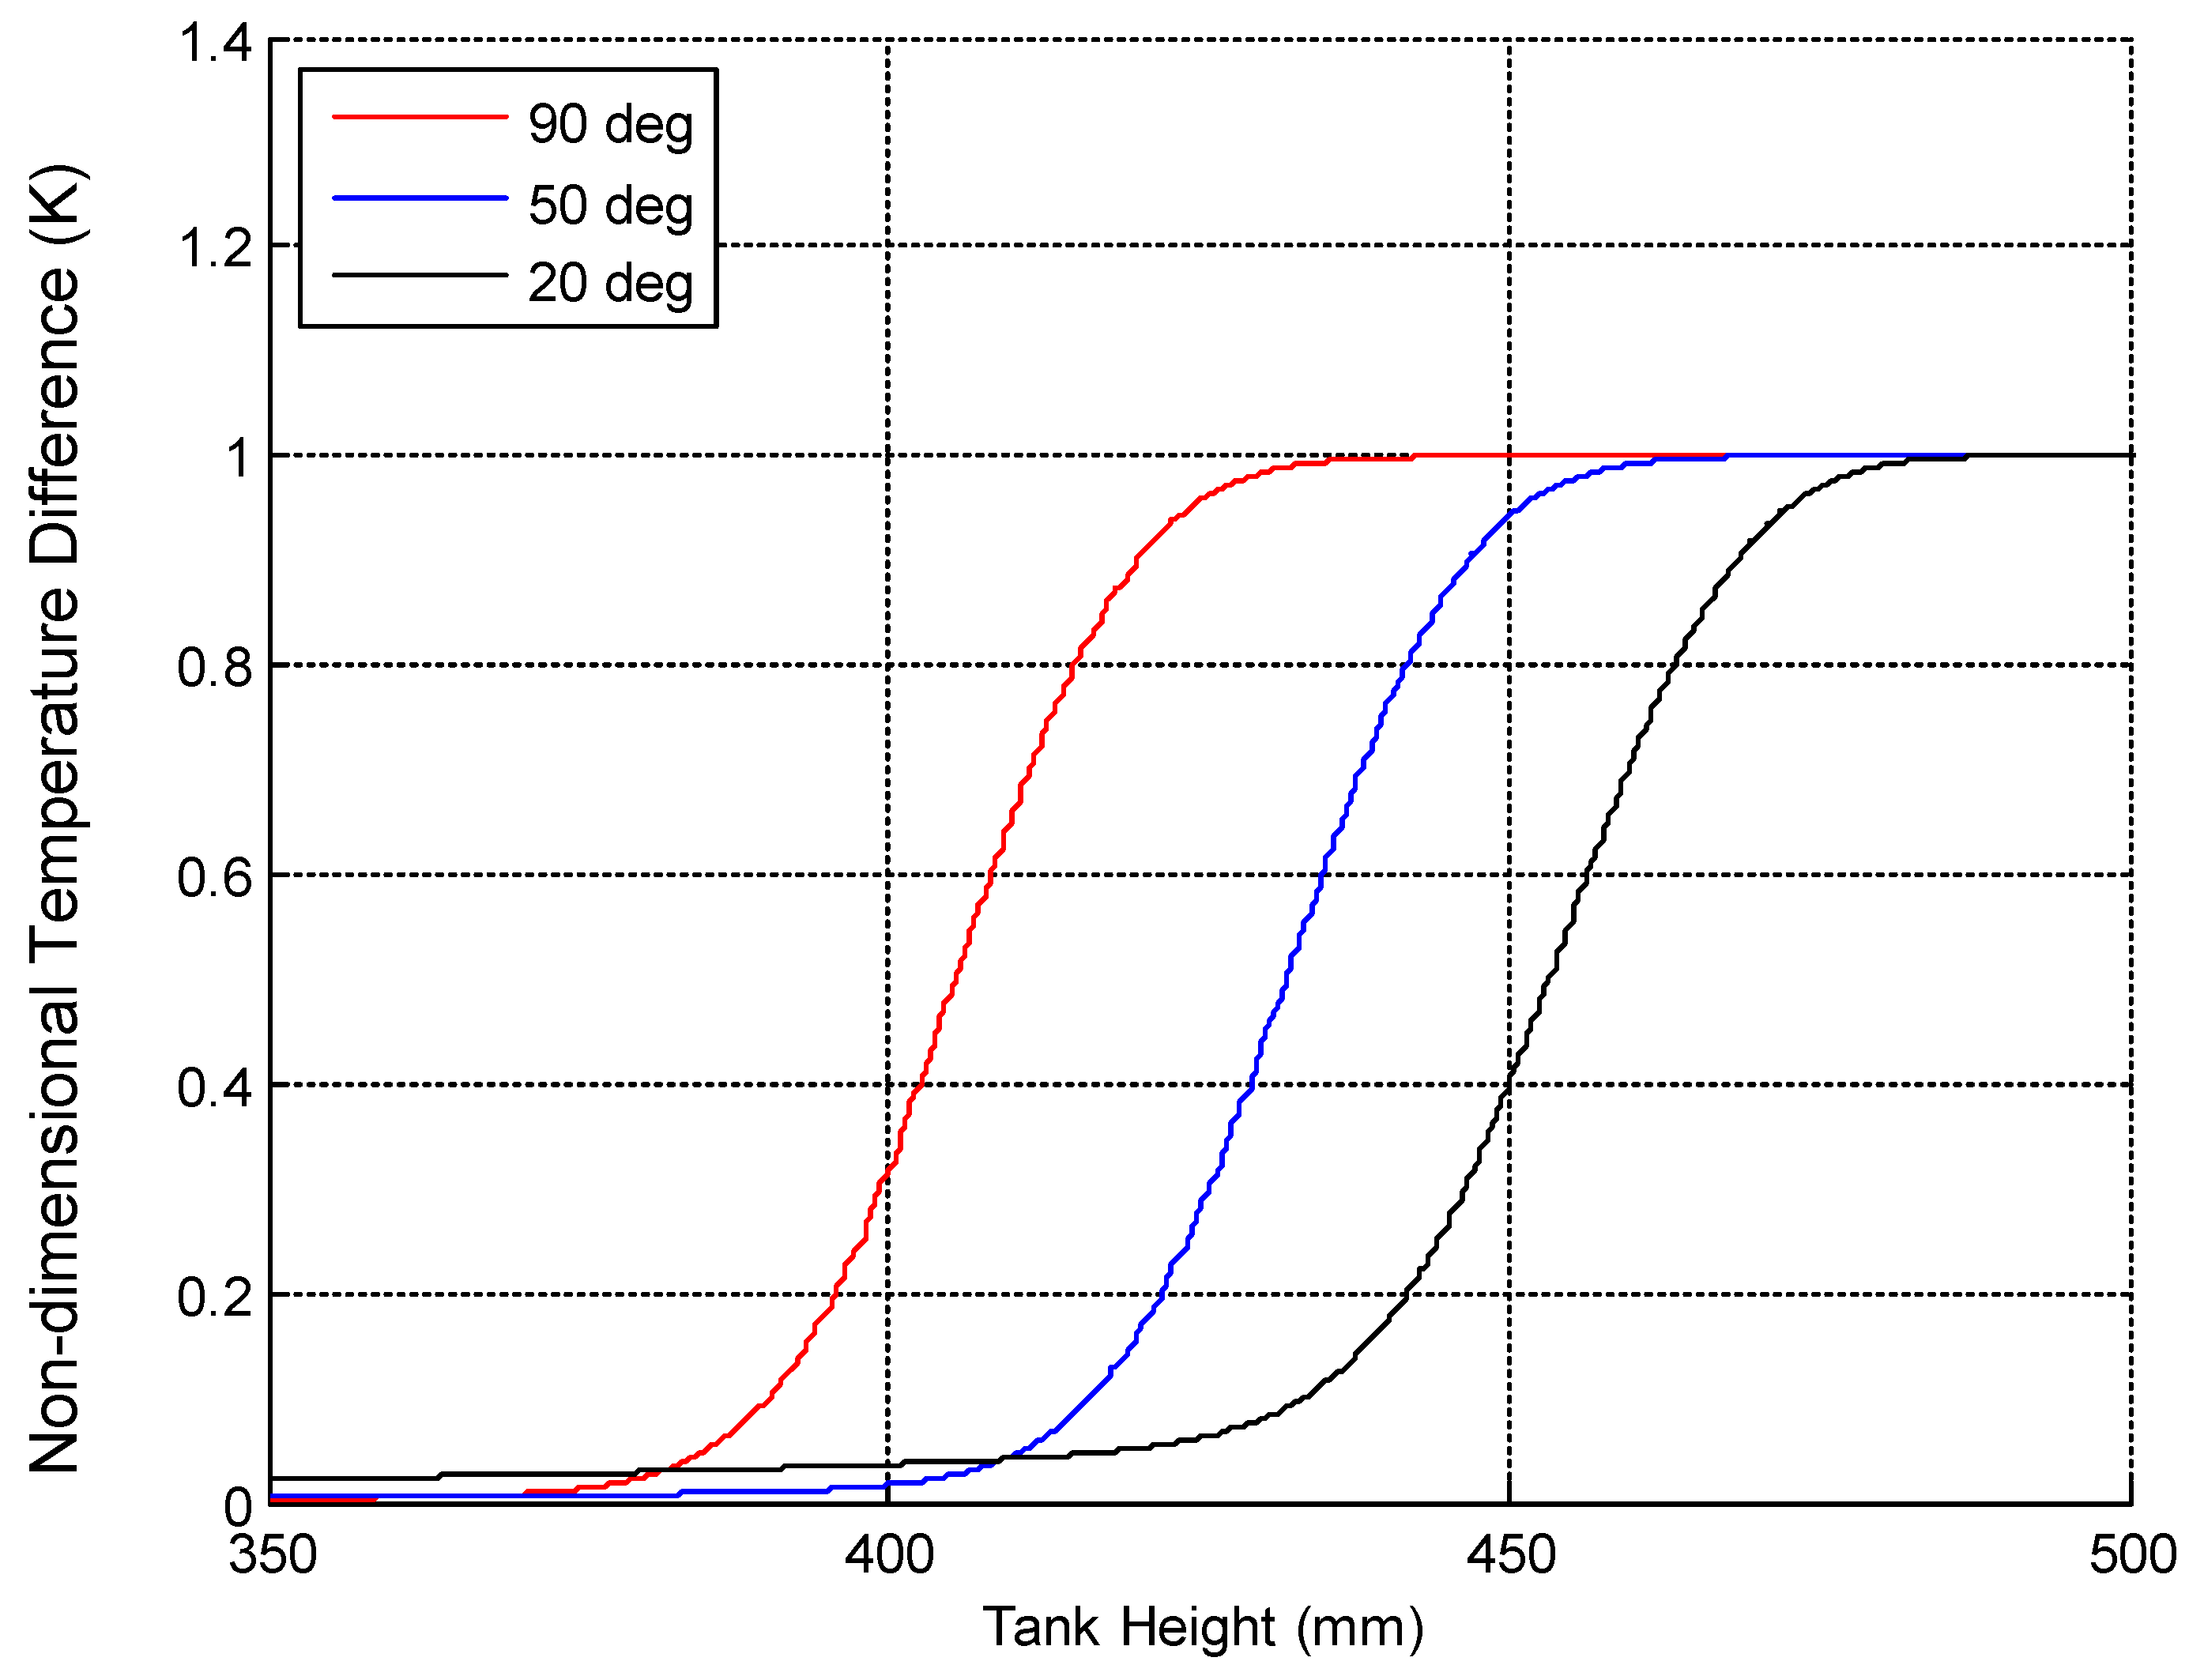
The results presented in Figure 8 and Figure 9 show that the temperature gradient is thin at higher temperature differences and gradually becomes thicker with the reduction in temperature difference. These simulation results compared well with the theoretical results presented in Figure 3, showing higher mixing for TES systems when the temperature difference is low.
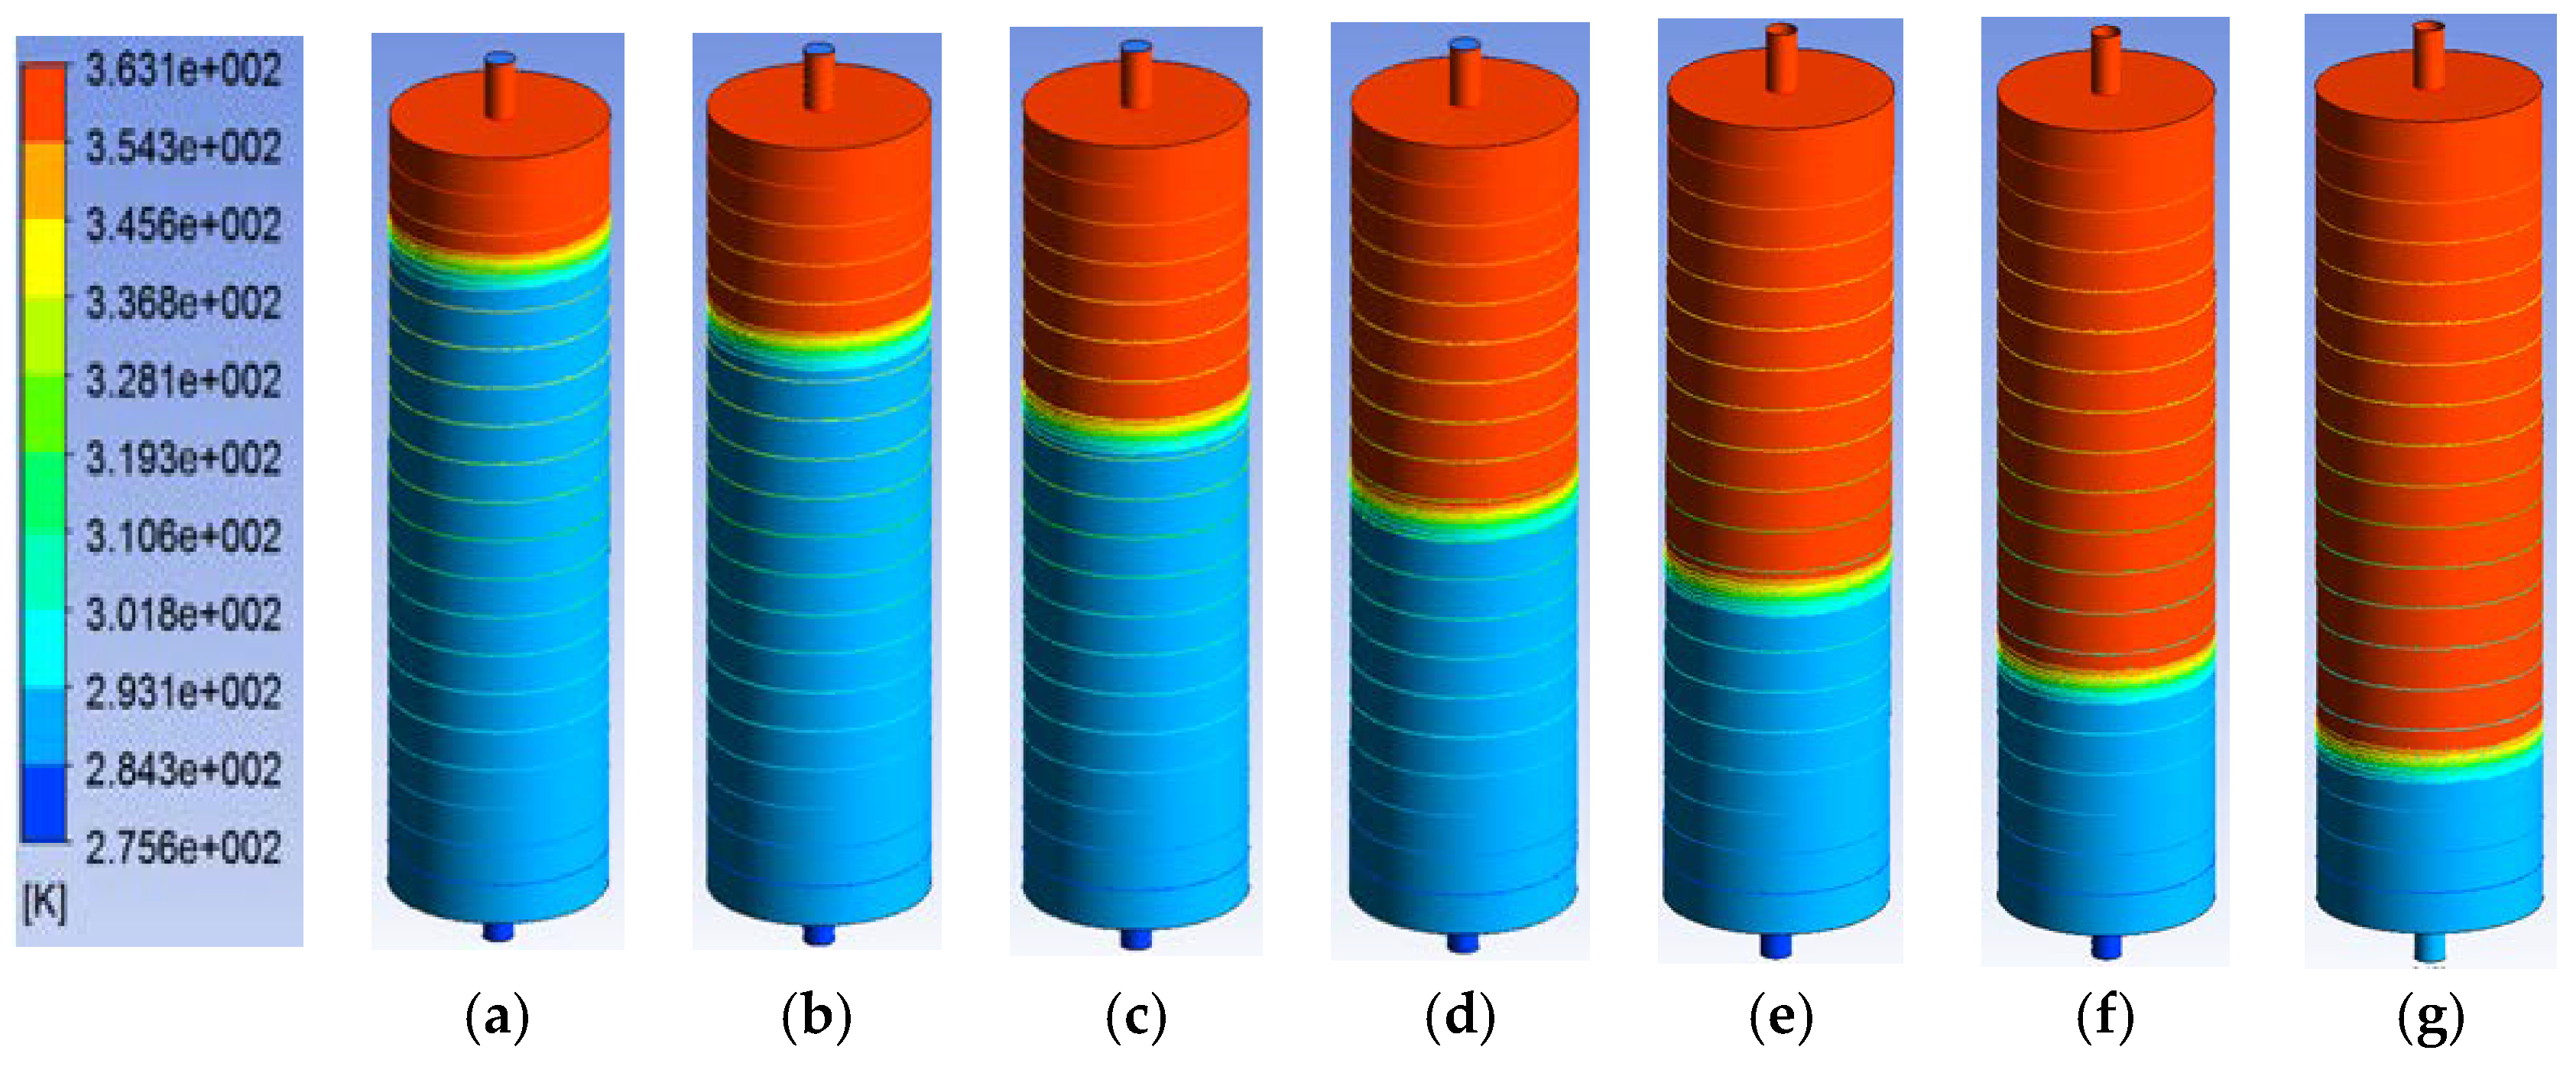
The effects of varying inlet velocities on thermocline formation and stratification were investigated by varying inlet velocity for TES-1 at a constant tank temperature of 90 °C.
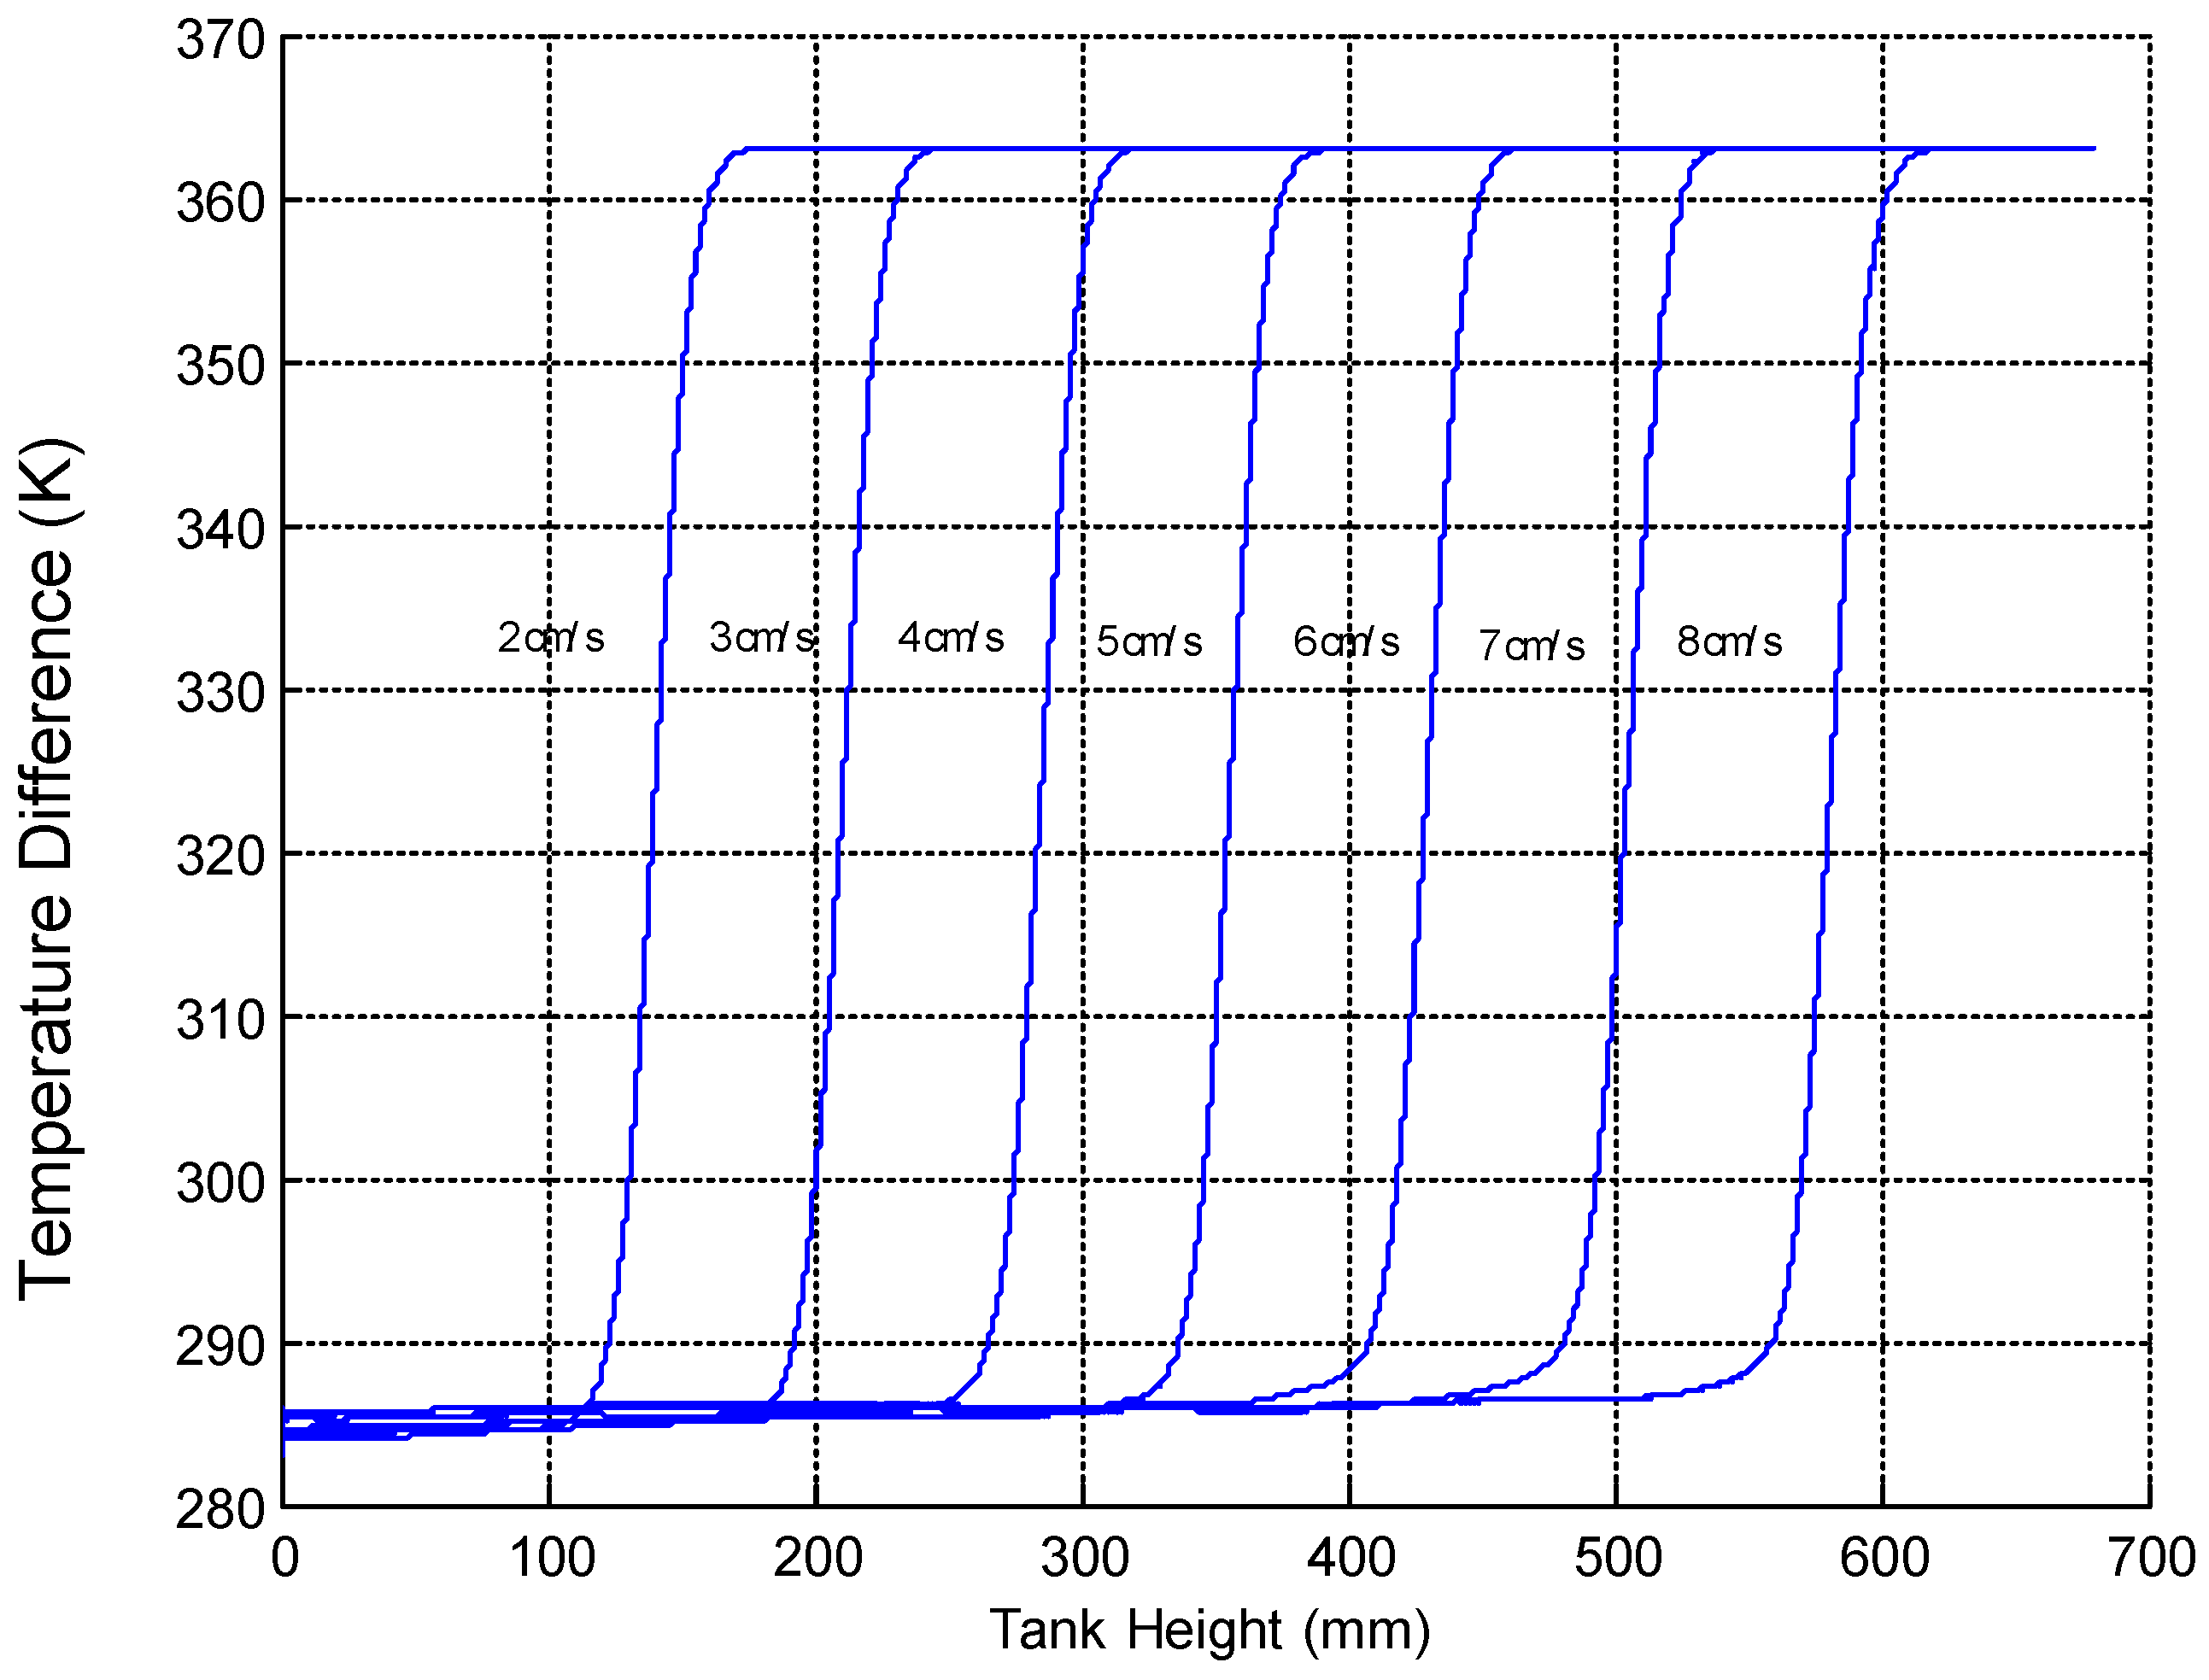
The results in Figure 10 and Figure 11 show that as the inlet velocity decreases, less mixing occurs. The best thermocline formation occurred when the temperature gradient separating the hot and the cold zones of the water storage tank was perfectly linear. A summary of the simulation results when full thermocline formation occurred are shown below in Table 2.
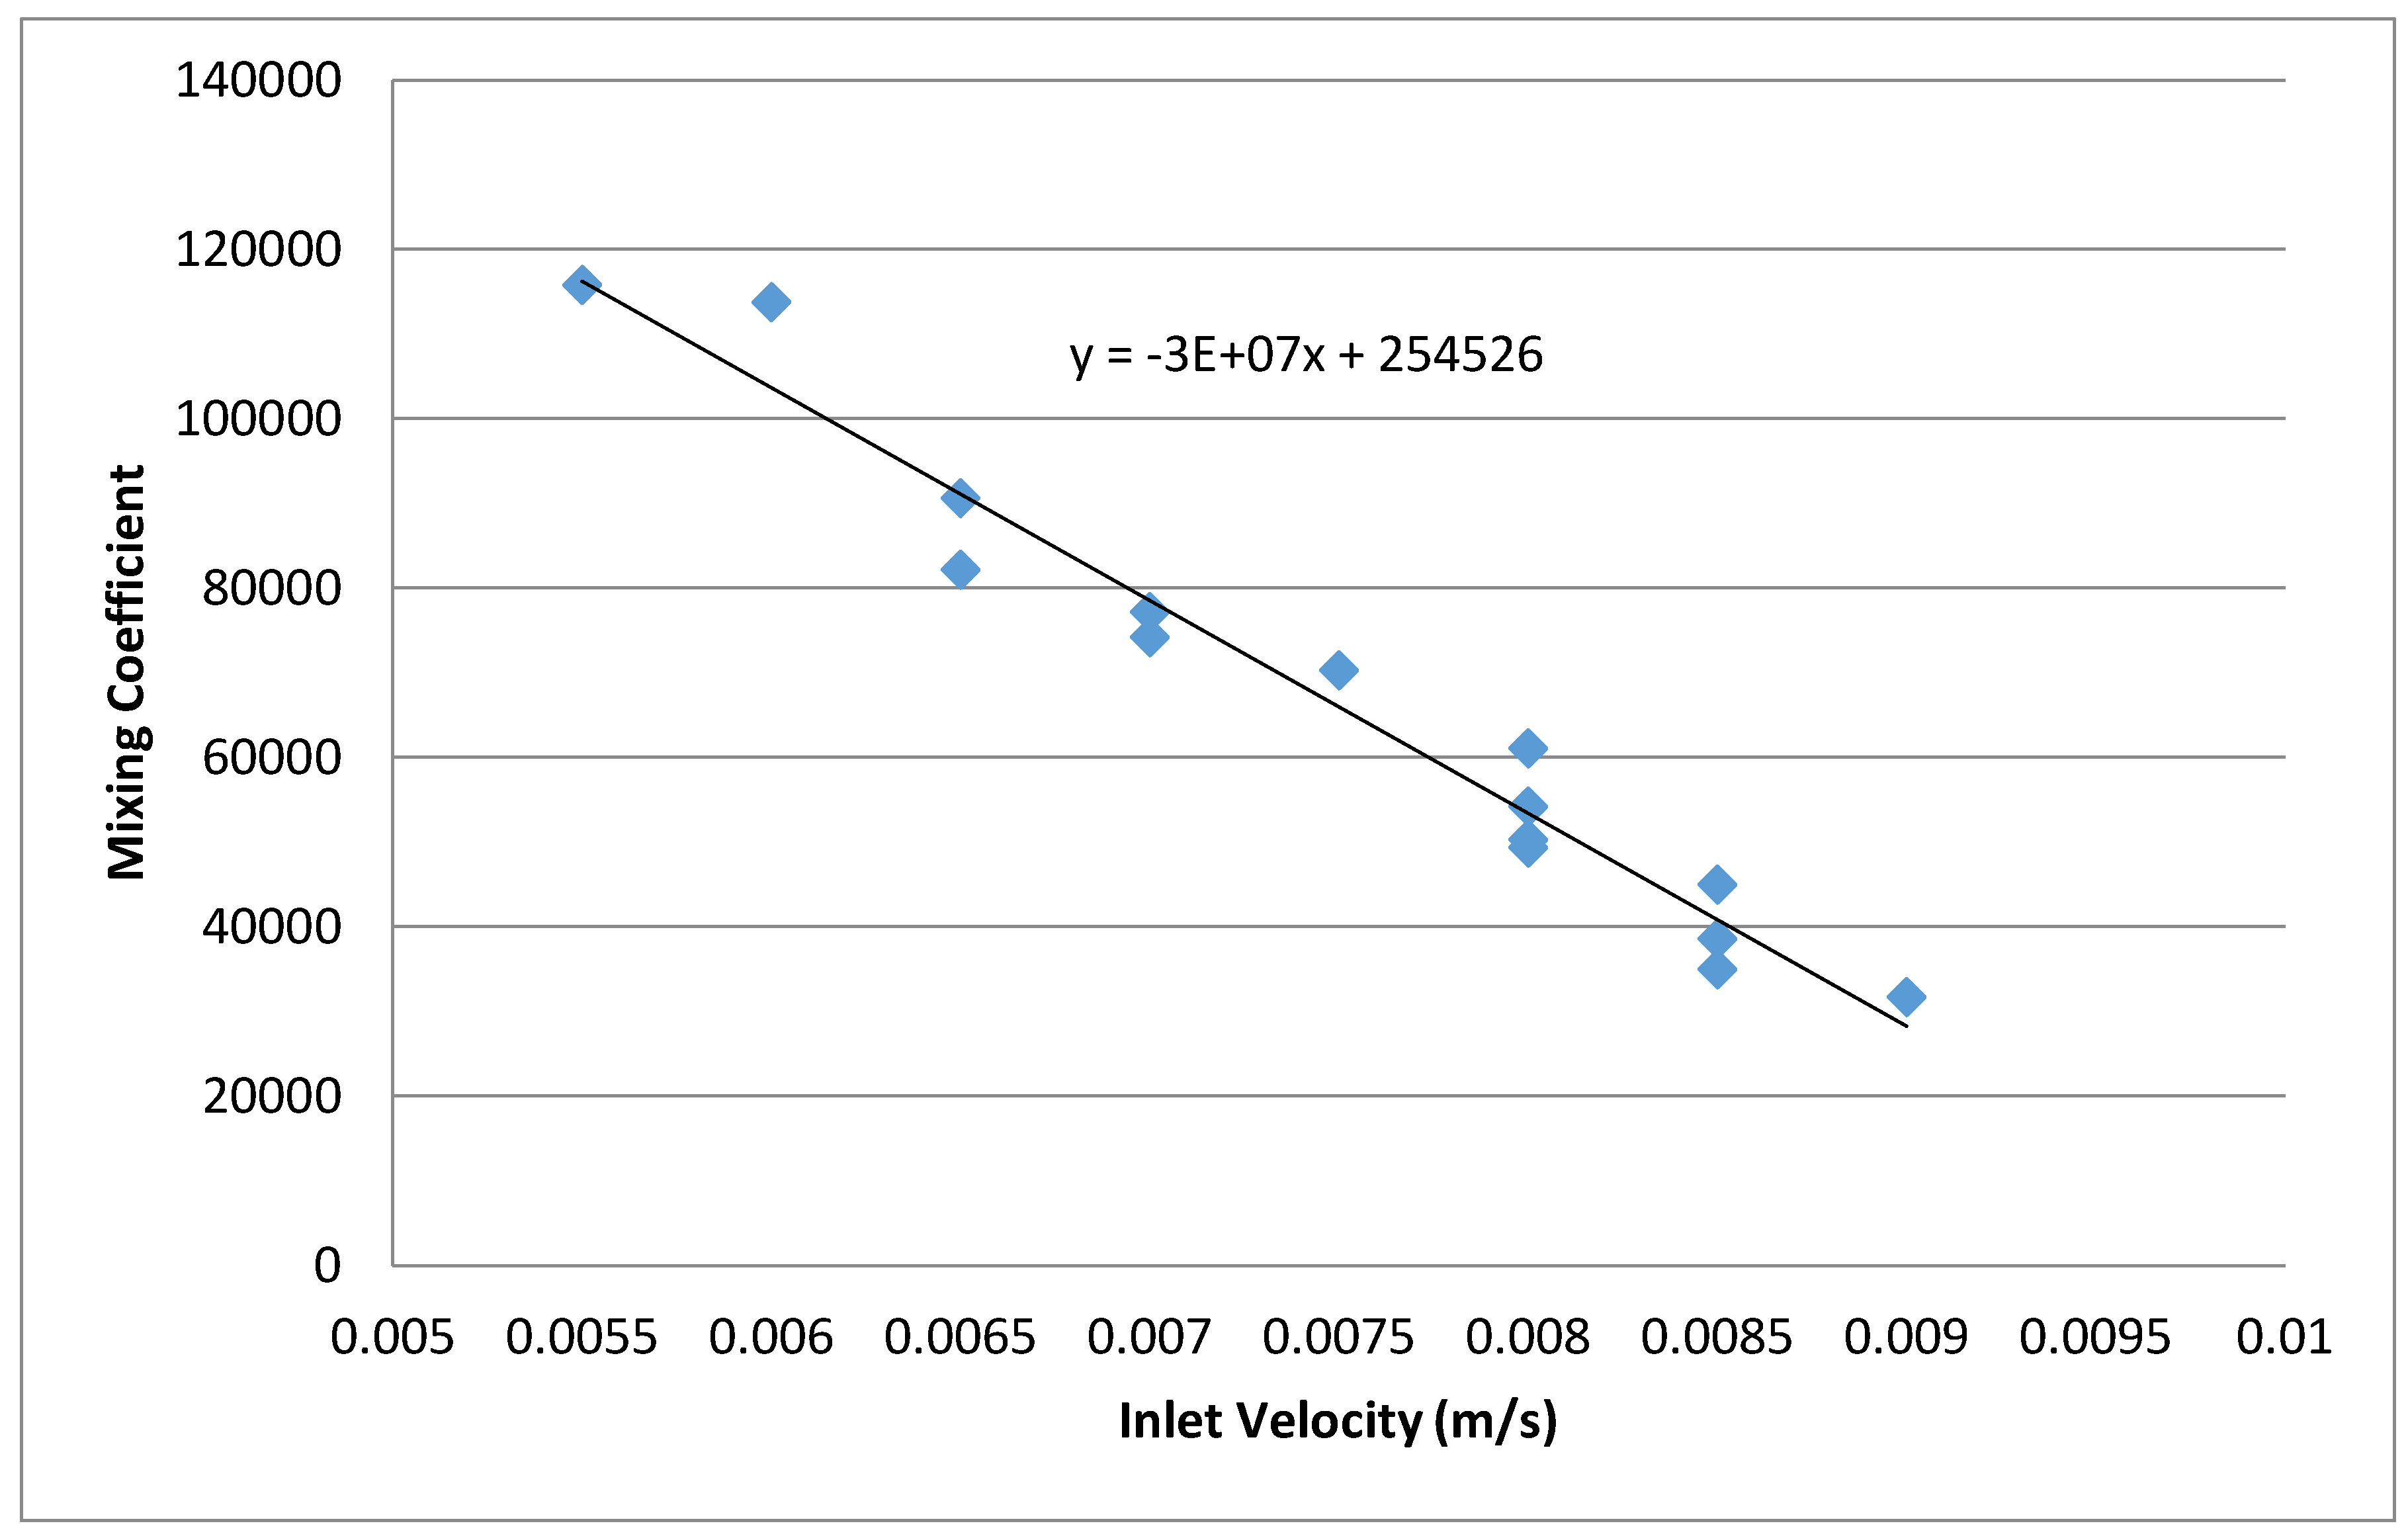
These results show a general trend of increased mixing as the temperature difference is reduced. In Figure 12 below, a general equation for the relationship between the mixing coefficient and inlet velocity for fully-developed thermoclines is presented.
The relationship shown above represents the expected mixing when a fully-developed thermocline is formed. Therefore, for any system, the inlet flow velocity required to fully form a thermocline can be determined.
Once the thermocline is formed for the TES systems, increases in inlet flow velocity allow the tank to charge more quickly without degrading the temperature distribution. The results below in Figure 13 show that significant mixing is occurring (light blue colour of water) at 2 cm/s.
However, when the fully-developed thermocline is formed in Figure 14 (inlet velocity of 0.9 cm/s), the inlet velocity was then increased to 2 cm/s at 414 s. A small effect is observed with a larger thermocline at 500 s as a result of the velocity increase; however, as charging continues, the thermocline stabilises and does not degrade significantly. This result is consistent with the experimental results reported by the first author Karim [2].
5. Discussion
The stream of water entering the thermal storage tank causes mixing at the entry point and thus affects the formation of the thermocline. Therefore, introducing the water at the right velocity is a prime concern in TES. The work in [16] reports that mixing causes the loss of heating/cooling capacity during charging and discharging cycles, which depends on the inlet velocity, the temperature difference between incoming and stored water and the distance between the outlet and inlet ports.
Analytical and simulated results in this study confirm that mixing is influenced by inlet velocity, tank aspect ratio and the temperature differential between stored and inlet water. Both analyses showed that mixing was reduced by increasing the tank aspect ratio, increasing the water temperature differential and reducing inlet water velocity. The temperature difference is shown to greatly influence mixing and thermocline formation. For example, at a temperature difference of 84 °C, the effect of the tank aspect ratio in mixing was minimum. However, as the temperature difference is reduced, the effects of the tank aspect ratio resulted in a greater mixing. Simulation results show that differences in mixing and the thermocline between TES-1 2, and 3 systems are minimal, as supported by the theoretical analysis. TES-4 and 5 show significantly higher mixing than the other systems. The mathematical relationship proposed in Equation (13) for a fully-developed thermocline will provide designers with general guidelines for developing thermally-efficient systems by choosing the right operating and design parameters.
Inlet flow velocity can be measured using dimensionless parameters of Re and Ri. Mixing reduces when Re is lowered and Ri is increased. Re values ranged between 7000 and 2000 for thermocline formation in this analysis. It can be mentioned here that for the same value of the Reynolds number, it is possible to have several values of the velocity as the Reynolds number depends on other variables, as shown in Equation (3). However, Re is mainly dominated by the velocity, as other changes are negligible for the same tank (characteristic length constant). For example, if temperature is increased, both the viscosity and density of water will decrease, and the combined effect of these two variables will be minimal. CFD modelling done by Walmsley et al. showed that increasing inlet flow rate caused the thickness of the thermocline to be larger, indicating more mixing [18]. Richardson’s number has been used to determine the effect of mixing under different conditions. Bouhdjar and Hardad state that stratification performance is improved with higher Richardson numbers [19].
The findings of this study should be of tremendous help to designers. They should make an optimum balance between the flow rate (inlet velocity), temperature difference and tank aspect ratio in designing TES systems. A lower flow rate will require a longer time to fill the tank, but will have better efficiency for TES. Moreover, at a lower flow rate, a smaller chiller or heater will be required for the same heating/cooling capacity. Therefore, a lower flow rate in TES systems outweighs the disadvantage of longer charging cycles. Similarly, tanks with a higher aspect ratio (i.e., taller tanks) will take up a much smaller space compared to tanks with a lower aspect ratio.
6. Conclusions
The analysis of stratified thermal storage systems allows several conclusions to be drawn:
- Higher inlet velocities result in increased mixing of water.
- TES tanks with higher aspect ratios result in reduced mixing and heat loss due to smaller relative contact area between water temperature layers.
- Higher temperature differences between inlet water and stored tank water reduce mixing because of greater density differences between layers.
- Thermoclines can form at higher inlet velocities when the aspect ratio and temperature difference are greater.
Other aspects affecting mixing and stratification such as placement of inlet and outlet ports, diffuser design and charging and recharging duration have not been investigated in this study. Future studies considering these factors will bring better insight to stratification and storage performance.
Author Contributions
Azharul Karim in the leader of the project and developed and progressed the concept. Ashley Burnett conducted the simulation work and prepared the report of the results. Azharul Karim and Sabrina Fawzia drafted the manuscript and managed the submission and review process.
Conflicts of Interest
The authors declare no conflict of interest.
Nomenclature
| d | tank diameter |
| g | acceleration due to gravity |
| h | vertical distance between ports (tank height) |
| Re | Reynolds Number |
| Ri | Richardson Number |
| ΔT | temperature difference of inlet and tank water |
| v | inlet velocity |
| Z | mixing coefficient |
| Greek Letters | |
| β | thermal expansion coefficient |
| ρ | fluid density |
| μ | dynamic viscosity |
| Abbreviations | |
| AR | Aspect Ratio |
| CFD | Computational Fluid Dynamics |
| TES | Thermal Energy Storage |
References
- Shin, M.S.; Kim, H.S.; Jang, D.S.; Lee, S.N.; Lee, H.S.; Yoon, H.G. Numerical and experimental study on the design of a stratified thermal storage system. Appl. Therm. Eng. 2004, 24, 17–27. [Google Scholar] [CrossRef]
- Karim, M.A. Experimental investigation of a stratified chilled-water thermal storage system. Appl. Therm. Eng. 2010, 31, 1853–1860. [Google Scholar] [CrossRef]
- Karim, M.A.; Hawlader, M.N.A. Mathematical modelling and experimental investigation of tropical fruits drying. Int. J. Heat Mass Transf. 2005, 48, 4914–4925. [Google Scholar] [CrossRef]
- Karim, M.A.; Hawlader, M.N.A. Development of solar air collectors for drying applications. Energy Convers. Manag. 2004, 45, 329–344. [Google Scholar] [CrossRef]
- Karim, M.A.; Perez, E.; Amin, Z.M. Mathematical modelling of counter flow v-grove solar air collector. Renew. Energy J. 2014, 74, 116–123. [Google Scholar] [CrossRef]
- Islam, M.; Miller, S.; Yarlagadd, P.K.D.V.; Karim, M.A. Investigation of the effect of physical and optical factors on the optical performance of a parabolic trough collector. Energies 2017, 10, 1907. [Google Scholar] [CrossRef]
- Khan, M.I.H.; Nagy, S.A.; Karim, M.A. Transport of cellular water during drying: An understanding of cell rupturing mechanism in apple tissue. Food Res. Int. 2018, 105, 772–781. [Google Scholar] [CrossRef] [PubMed]
- Kumar, C.; Karim, M.A. Microwave-convective drying of food materials: A critical review. Crit. Rev. Food Sci. Nutr. 2017, 1–16. [Google Scholar] [CrossRef] [PubMed]
- Kumar, C.; Joardder, M.U.H.; Farrell, T.W.; Karim, M.A. Multiphase porous media model for intermittent microwave convective drying (IMCD) of food. Int. J. Therm. Sci. 2016, 104, 304–314. [Google Scholar] [CrossRef]
- Mawire, M. McPherson, Experimental and simulated temperature distri-bution of an oil-pebble bed thermal energy storage system with a variable heat source. Appl. Therm. Eng. 2009, 2, 1086–1095. [Google Scholar] [CrossRef]
- Guyer, E.C.; Brownell, D.L. Review of Heat Storage Materials; Final Report (No. EPRI-EM-3353); Dynatech R/D Co.: Cambridge, MA, USA, 1983. [Google Scholar]
- Njoku, H.O.; Ekechukwu, O.V.; Onyegegbu, S.O. Analysis of stratified thermal storage systems: An overview. Heat Mass Transf. 2014, 50, 1017–1030. [Google Scholar] [CrossRef]
- Haller, M.Y.; Cruickshank, C.A.; Streicher, W.; Harrison, S.J.; Anderson, E.; Furbo, S. Methods to determine stratification efficiency of thermal energy storage processes—Review and theoretical comparison. J. Sol. Energy 2009, 83, 1847–1860. [Google Scholar] [CrossRef]
- Osman, K.; Khaireed, S.M.N.A.; Ariffin, M.K.; Senawi, M.Y. Dynamic modelling of stratification for chilled water storage. J. Energy Conserv. Manag. 2008, 49, 3270–3273. [Google Scholar] [CrossRef]
- Dincer, I.; Rosen, M. Thermal Energy Storage: Systems and Applications, 2nd ed.; Wiley: Hoboken, NJ, USA, 2011. [Google Scholar]
- Nelson, J.E.B.; Balakrishnan, A.R.; Murthy, S.S. Experiments of stratified chilled-water tanks. Int. J. Refrig. 1999, 22, 216–234. [Google Scholar] [CrossRef]
- ANSYS. (2009). ANSYS CFX—Solver Theory Guide. Available online: http://www1.ansys.com/customer/content/documentation/120/cfx/xthry.pdf (accessed on 1 March 2017).
- Walmsley, M.; Atkins, M.; Linder, J.; Neale, J. Thermocline Movement Dynamics and Thermocline Growth in Stratified Tanks for Heat Storage. Chem. Eng. Trans. 2010, 21, 991–996. [Google Scholar]
- Bouhdjar, A.; Hardad, A. Numerical analysis of transient mixed convection flow in storage tank: influence of fluid properties and aspect ratios on stratification. J. Renew. Energy 2002, 25, 555–567. [Google Scholar] [CrossRef]
Figure 1.
Typical temperature profile in a stratified thermal storage tank [12].
Figure 1.
Typical temperature profile in a stratified thermal storage tank [12].
Figure 2.
Meshed tanks used in TES simulations.
Figure 3.
Graph showing the mixing effect for different tank water temperatures and inlet velocities (inlet water temperature is 10 °C).
Figure 3.
Graph showing the mixing effect for different tank water temperatures and inlet velocities (inlet water temperature is 10 °C).
Figure 4.
Graph showing the mixing effect for aspect ratios and inlet velocities.
Figure 5.
Variation of the temperature profile in a chilled water storage tank: predicted and measured values [2].
Figure 5.
Variation of the temperature profile in a chilled water storage tank: predicted and measured values [2].
Figure 6.
Simulation results of different TES systems after 1600 s: (a) TES-1; (b) TES-2; (c) TES-3; (d) TES-4; (e) TES-5.
Figure 6.
Simulation results of different TES systems after 1600 s: (a) TES-1; (b) TES-2; (c) TES-3; (d) TES-4; (e) TES-5.

Figure 7.
Temperature profile and thermocline in different tank designs (water velocity of 1.5 cm/s, tans water temperature 50 °C, inlet water temperature 6 °C).
Figure 7.
Temperature profile and thermocline in different tank designs (water velocity of 1.5 cm/s, tans water temperature 50 °C, inlet water temperature 6 °C).
Figure 8.
Temperature profiles in TES-1 at temperature differences of (a) 84 °C, (b) 44 °C and (c) 14 °C.
Figure 8.
Temperature profiles in TES-1 at temperature differences of (a) 84 °C, (b) 44 °C and (c) 14 °C.
Figure 9.
Temperature profiles with tank height in TES-1 at different temperature differences.
Figure 10.
Temperature profiles in TES-1 at different inlet velocities: (a) 8 cm/s; (b) 7 cm/s; (c) 6 cm/s; (d) 5 cm/s; (e) 4 cm/s; (f) 3 cm/s; (g) 2 cm/s.
Figure 10.
Temperature profiles in TES-1 at different inlet velocities: (a) 8 cm/s; (b) 7 cm/s; (c) 6 cm/s; (d) 5 cm/s; (e) 4 cm/s; (f) 3 cm/s; (g) 2 cm/s.
Figure 11.
Temperature profiles in TES-1 at different inlet velocities: non-dimensional temperature difference versus tank height.
Figure 11.
Temperature profiles in TES-1 at different inlet velocities: non-dimensional temperature difference versus tank height.
Figure 12.
Development of an equation for the mixing coefficient based on inlet velocity.
Figure 13.
TES-1 at 90 °C, 2.0 cm/s: (a) 400 s; (b) 800 s; (c) 1200 s.
Figure 14.
TES-1 at 90 °C: (a) 400 s; (b) 500 s; (c) 800 s; (d) 1200 s; (e) 1600 s.

Table 1.
Geometrical dimensions of the five different tanks investigated.
| Tank Number | Diameter, d (m) | Height, h (m) | Area, a | Volume, V | Aspect Ratio, AR (h/d) |
|---|---|---|---|---|---|
| TES-1 | 0.180 | 0.680 | 0.025 | 0.0173 | 3.778 |
| TES-2 | 0.200 | 0.550 | 0.031 | 0.0173 | 2.750 |
| TES-3 | 0.210 | 0.500 | 0.035 | 0.0173 | 2.381 |
| TES-4 | 0.255 | 0.340 | 0.051 | 0.0173 | 1.333 |
| TES-5 | 0.280 | 0.280 | 0.062 | 0.0173 | 1.000 |
Table 2.
Summary of the results: thermocline formation.
| TES | Stored Water Temperature (°C) | Inlet Velocity (cm/s) | Flow Rate ( | Reynolds Number Re | Richardson’s Number Ri | Mixing Coefficient Z |
|---|---|---|---|---|---|---|
| 1 | 90 | 0.90 | 3.97 | 1239 | 482 | 31,757 |
| 50 | 0.85 | 3.75 | 1170 | 270 | 45,045 | |
| 20 | 0.70 | 3.09 | 964 | 100 | 77,186 | |
| 2 | 90 | 0.85 | 3.75 | 1300 | 437 | 35,022 |
| 50 | 0.80 | 3.53 | 1123 | 246 | 49,331 | |
| 20 | 0.65 | 2.87 | 994 | 94 | 82,270 | |
| 3 | 90 | 0.85 | 3.75 | 1365 | 398 | 38,572 |
| 50 | 0.80 | 3.53 | 1285 | 224 | 54,330 | |
| 20 | 0.65 | 2.87 | 1044 | 85 | 90,609 | |
| 4 | 90 | 0.80 | 3.53 | 1560 | 305 | 50,358 |
| 50 | 0.75 | 3.32 | 1463 | 174 | 70,276 | |
| 20 | 0.60 | 2.65 | 1170 | 68 | 113,767 | |
| 5 | 90 | 0.80 | 3.53 | 1713 | 251 | 61,063 |
| 50 | 0.70 | 3.09 | 1499 | 164 | 74,286 | |
| 20 | 0.60 | 2.42 | 1178 | 66 | 115,816 |
© 2018 by the authors. Licensee MDPI, Basel, Switzerland. This article is an open access article distributed under the terms and conditions of the Creative Commons Attribution (CC BY) license (http://creativecommons.org/licenses/by/4.0/).
Share and Cite
MDPI and ACS Style
Karim, A.; Burnett, A.; Fawzia, S. Investigation of Stratified Thermal Storage Tank Performance for Heating and Cooling Applications. Energies 2018, 11, 1049. https://doi.org/10.3390/en11051049
AMA Style
Karim A, Burnett A, Fawzia S. Investigation of Stratified Thermal Storage Tank Performance for Heating and Cooling Applications. Energies. 2018; 11(5):1049. https://doi.org/10.3390/en11051049
Chicago/Turabian StyleKarim, Azharul, Ashley Burnett, and Sabrina Fawzia. 2018. "Investigation of Stratified Thermal Storage Tank Performance for Heating and Cooling Applications" Energies 11, no. 5: 1049. https://doi.org/10.3390/en11051049
Note that from the first issue of 2016, this journal uses article numbers instead of page numbers. See further details here.