Corona Onset Characteristics of Bundle Conductors in UHV AC Power Lines at 2200 m Altitude


1
Hebei Provincial Key Laboratory of Power Transmission Equipment Security Defense, North China Electric Power University, No. 619 North of Yonghua Street, Baoding 071003, China
2
State Key Laboratory of Alternate Electrical Power System with Renewable Energy Sources, North China Electric Power University, No. 2 Beinong Road, Beijing 10206, China
3
State Grid Hebei Maintenance Branch, No. 98 Fuqiang Road, Shijiazhuang 050070, China
4
State Grid Xinjiang Electric Power Research Institute, No. 33 Changchun Middle Road, Wulumuqi 830001, China
*
Authors to whom correspondence should be addressed.
Energies 2018, 11(5), 1047; https://doi.org/10.3390/en11051047
Submission received: 7 April 2018
/
Revised: 19 April 2018
/
Accepted: 19 April 2018
/
Published: 25 April 2018
(This article belongs to the Section F: Electrical Engineering)
Abstract
:The corona onset characteristic of bundle conductors is an important limiting factor for the design of UHV AC power lines in high-altitude areas. An experimental study on the corona characteristics of 8 × LGJ630, 6 × LGJ720, 8 × LGJ720 and 10 × LGJ720 bundle conductors commonly used in UHV power lines under dry and wet conductor conditions, as well as artificial moderate and heavy rain conditions, was conducted in Ping’an County, Xining City (elevation 2200 m). By using the tangent line method, the corona onset voltages and onset electric field of four types of conductors at high altitudes are obtained for the first time. In addition, the calculation model of corona onset voltage considering the outer strands’ effect on the electric field and the geometric factor in the corona cage in high altitude areas is established. The comparison of the calculation results and experimental results under dry conditions verifies the model’s correctness. Based on the results, an optimal selection scheme for high altitudes is proposed. The roughness coefficient was also calculated and analysed: the roughness coefficient of bundled conductors was between 0.59 and 0.77, and the roughness coefficient of the wet conductor was between the dry and rainy conditions. Both the experimental data and the calculation model can provide a reference for conductor selection for UHV AC power lines for use in high-altitude areas.
1. Introduction
When the field strength around the conductor exceeds that of the air, the air near the conductor is ionised, thus generating corona discharge. The corona discharge may produce corona effects, such as: corona loss, audible noise, radio interference, etc. which influence the environment and line operation [1,2,3,4,5,6]. With increasing voltage, the corona effect becomes more serious, especially in UHV lines.
Furthermore, China has complex terrain and non-uniformly distributed energy resources and productivity, where 75% of the land sits above an elevation of 1000 m. UHV AC lines currently under construction and in planning will inevitably cross such high-altitude areas [7,8]. In high-altitude areas, the air density decreases, and therefore the average free path of electrons increases. As a result, electrons are liable to obtain greater kinetic energy between adjacent collisions, which means that ambient air molecules begin to dissipate at lower field strengths and produce corona discharge. Additionally, the climate is harsher in high-altitude areas, and the number of hours of annual rainy weather is greater than over lower areas. This climatic characteristic provides favourable conditions [9] for corona discharge in the air, resulting in a decrease of the onset voltage and the development of the corona. Therefore, it causes more energy loss, stronger audible noise, and radio interference, enhancing the corona effect. Considering these problems, the corona around a conductor in high-altitude areas is more prominent than in low-altitude areas.
Corona onset characteristics, as an important characteristic of corona discharge in power lines, affect the selection of the cross-section and structure of bundled conductors. It is also an important factor to be considered in the theoretical analysis of the corona effect, and safe operation of the power grid. In line design, the electric field on the conductor of the power line should be lower than the experimental value of the corona onset gradient. With regard to the corona onset characteristics of AC power lines in high-altitude areas, current research is mainly focused on those of bundled conductors at EHV and lower voltages (cross-section smaller than LGJ-500 and number of conductor bundles n ≤ 6) [10,11,12,13,14,15,16]. The construction of UHV power lines is planned in high altitude areas, so it is necessary to conduct experimental and theoretical studies of the corona onset characteristics to provide reference data for conductor selection for 1000 kV UHV AC power lines in high-altitude areas. With the support of the national Power Grid Corp project, in this study, in order to obtain the corona onset characteristics of UHV AC transmissions lines in high altitude areas, four types of bundle conductors commonly used in UHV power lines tests were experimentally investigated in a UHV corona cage set at an altitude point of 2200 m. A calculation model considering the outer strands for corona onset voltage was established for high altitude areas, and the roughness coefficient was also calculated and analysed.
2. Test Arrangement in High-Altitude Areas
2.1. UHV Corona Cage
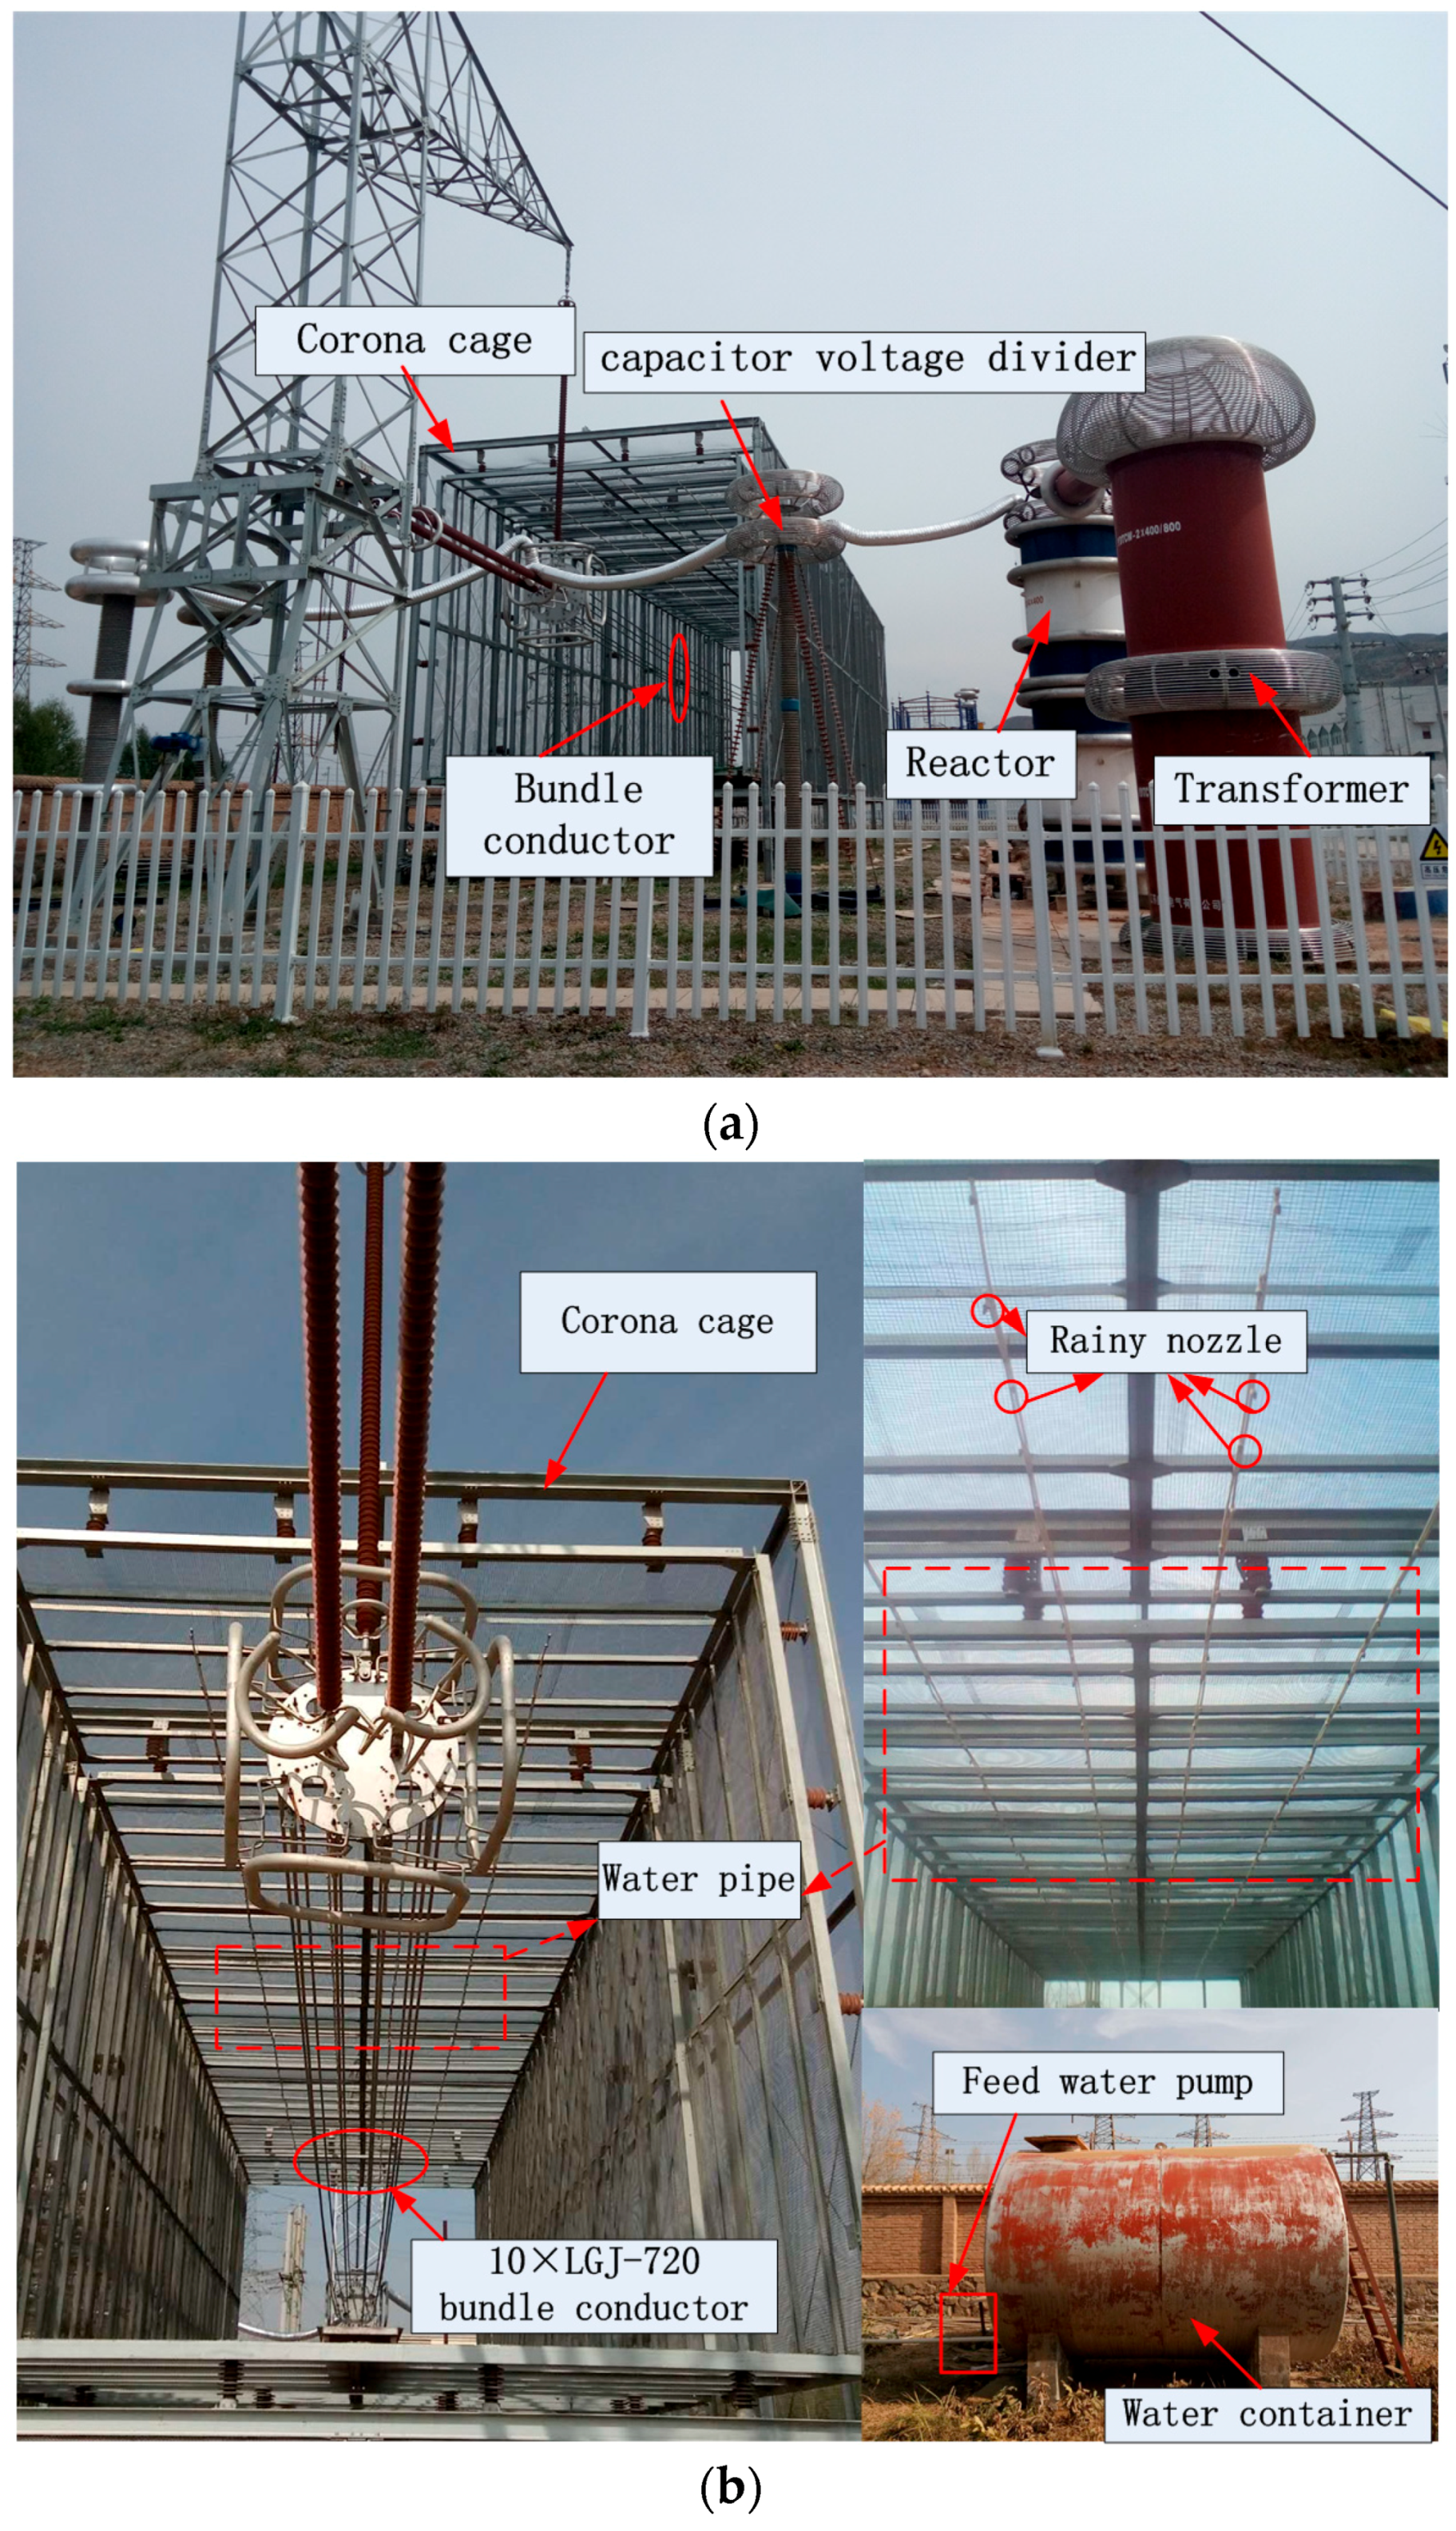
The UHV AC corona cage of the State Grid Corporation of China constructed in Xining (Qinghai, China) at an altitude of 2200 m, with a square cross-section (8 m × 8 m) and a total length of 35 m, was employed, as shown in Figure 1. The corona cage is composed of a 25 m long measuring section and two protective sections on each side of the measuring section, each being 5 m long. The corona cage is equipped with an artificial rainfall system, with which the corona characteristics of bundled conductors can be investigated under dry, rainy, and wet conditions. On the top of the corona cage, above the bundle conductor, four water pipes are arranged in parallel; for each water pipe, the rain nozzles are arranged at intervals of 10 cm. The rainfall intensity can be controlled by adjusting the feed pump motor frequency at the outlet to the water container. In the experiment, the rainfall rate, temperature, humidity, air pressure, and other meteorological data were recorded by weather stations (HOBO, Onset company, Massachusetts, USA) set around the corona cage, and the definitions of weather conditions were as defined in the IEEE Standards [17]. The test was carried out on a calm day without wind; first, the bundle conductor was tested under dry conditions; secondly, by adjusting the water intake in the pipe, the corona characteristic test of the conductor under different rainfall rate conditions was conducted to analyse the corona characteristics in moderate rain (rainfall rate of about 6 mm/h) and heavy rain (rainfall rate of about 12 mm/h); and finally, after the corona measurement test in heavy rain, in this case, the conductor surface was covered with water droplets, and the corona characteristics for wet conductors were measured.
2.2. Resistive Current Measuring System
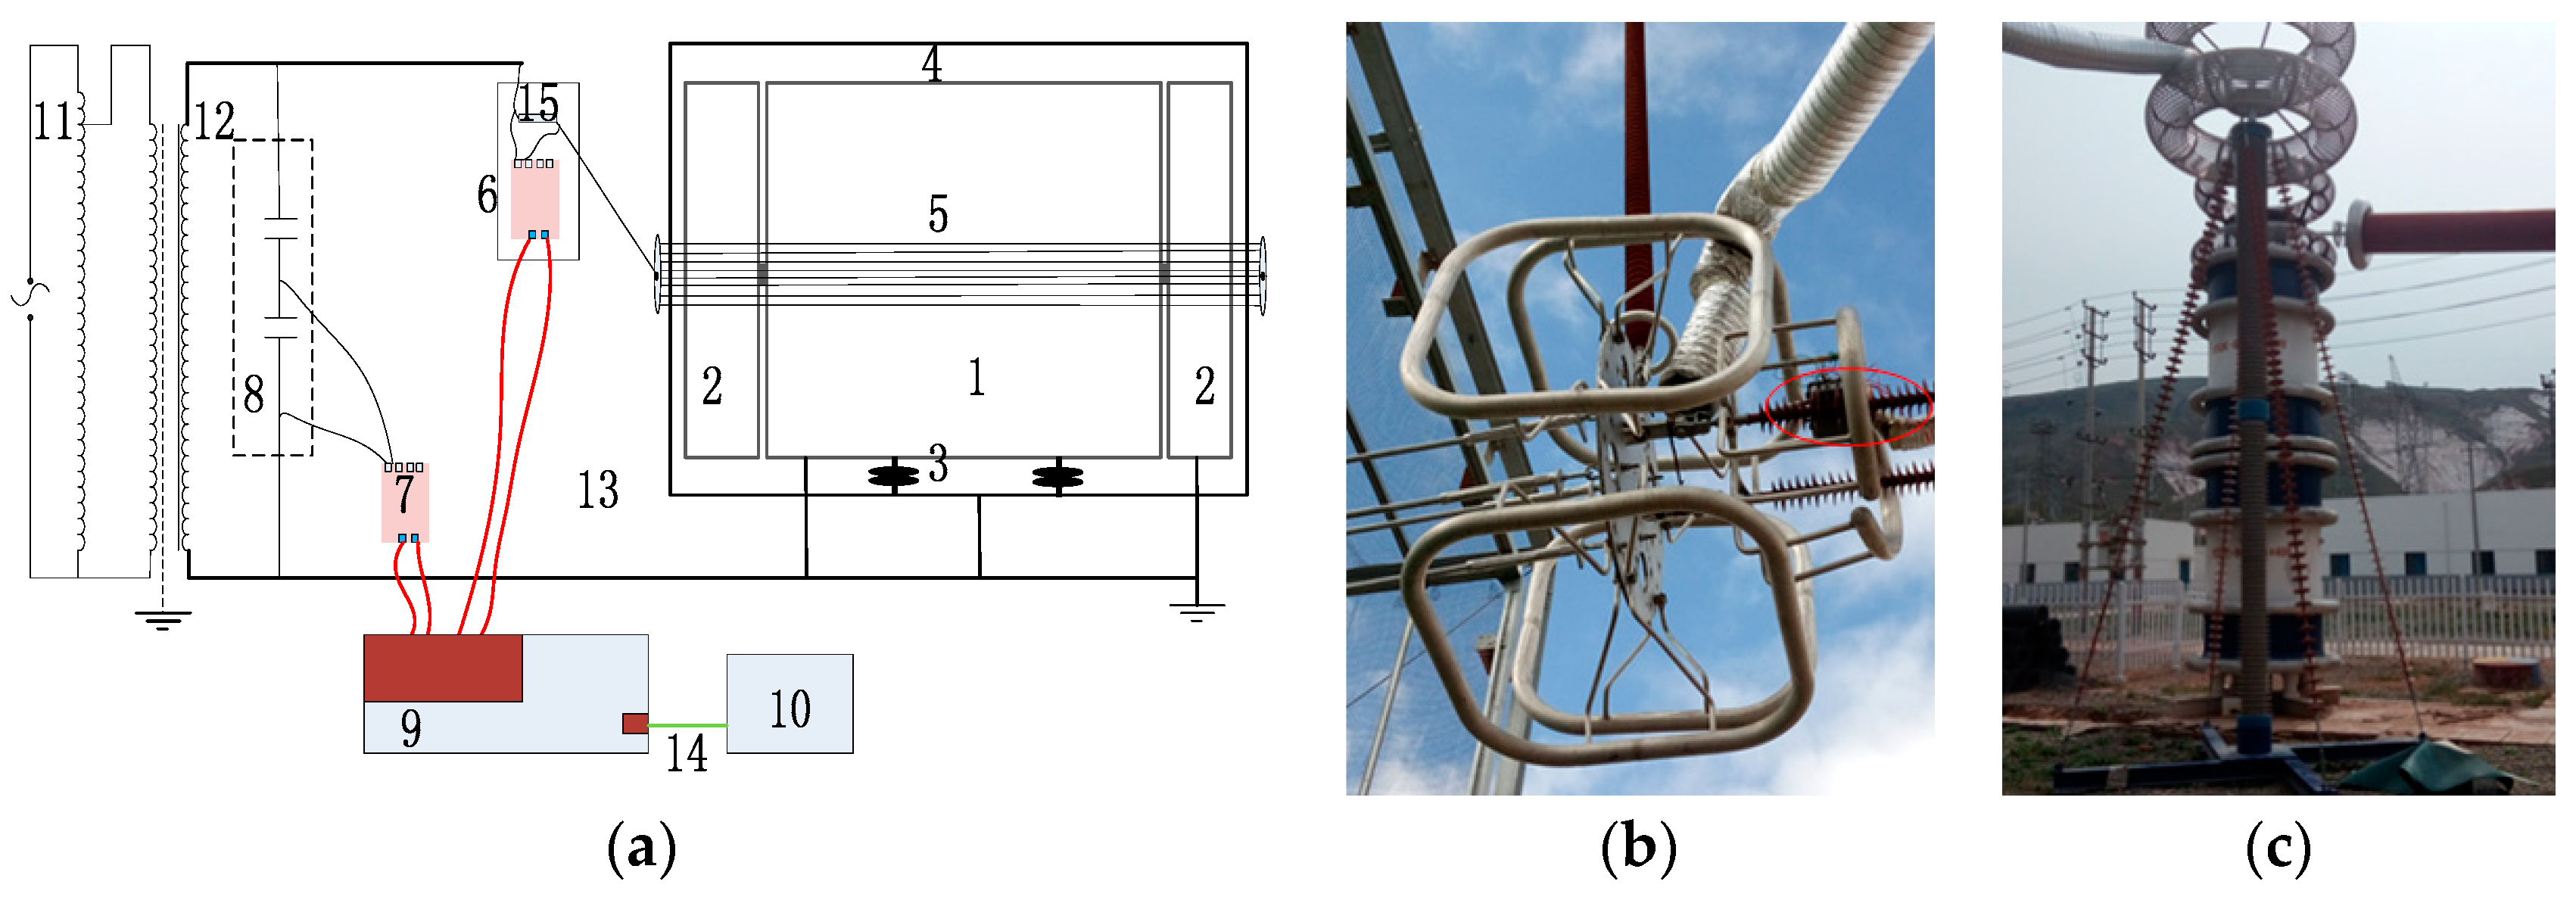
A self-developed integrated photoelectric resistive current measuring system was used [18]; the measuring system consisted of a remote data acquisition module for optical communication, a local merging unit module, and a PC host computer, the structure of the resistive current measuring system is illustrated in Figure 2a, and the measuring ends for current and voltage are shown in Figure 2b,c. The 0.5 Ω high-power non-inductive, high-precision resistor was used to sample the current signals. The current measurement end included an over-voltage protection circuit, a battery, and a remote data acquisition module for optical communication, all of which were encapsulated in the metal shielding box to avoid external interference. A TRF-800 capacitive voltage divider was adopted to measure the voltage applied to the conductor, with a rated voltage ratio of 3750:1.
Through use of a UDP (User Datagram Protocol) communication protocol, the collecting synchronisation pulse signal was sent to achieve high-precision synchronous acquisition of voltage and current signals. An instantaneous power control method was used on the PC host computer to obtain the resistive current of the test conductors.
Assuming that the instantaneous conductor current is i(t), and the instantaneous voltage of the conductor is u(t), then the corona loss P is:
where T is line period, T = 0.02 s, and n is number of calculation periods. The effective value U of the test voltage was measured, and then the resistive current I is: I = P/U.
2.3. Test Method
The test was performed for four types of bundled conductor: a bundle of six LGJ-720 ACSR conductors with 450 mm spacing (6 × LGJ720), a bundle of eight LGJ720 ACSR conductors with 400 mm spacing (8 × LGJ720), a bundle of ten LGJ720 ACSR conductors at 400 mm spacing (10 × LGJ720) and a bundle of eight LGJ630 ACSR conductors at 400 mm spacing (8 × LGJ630). The parameters of two common conductors used in UHV power lines are displayed in Table 1 [19].
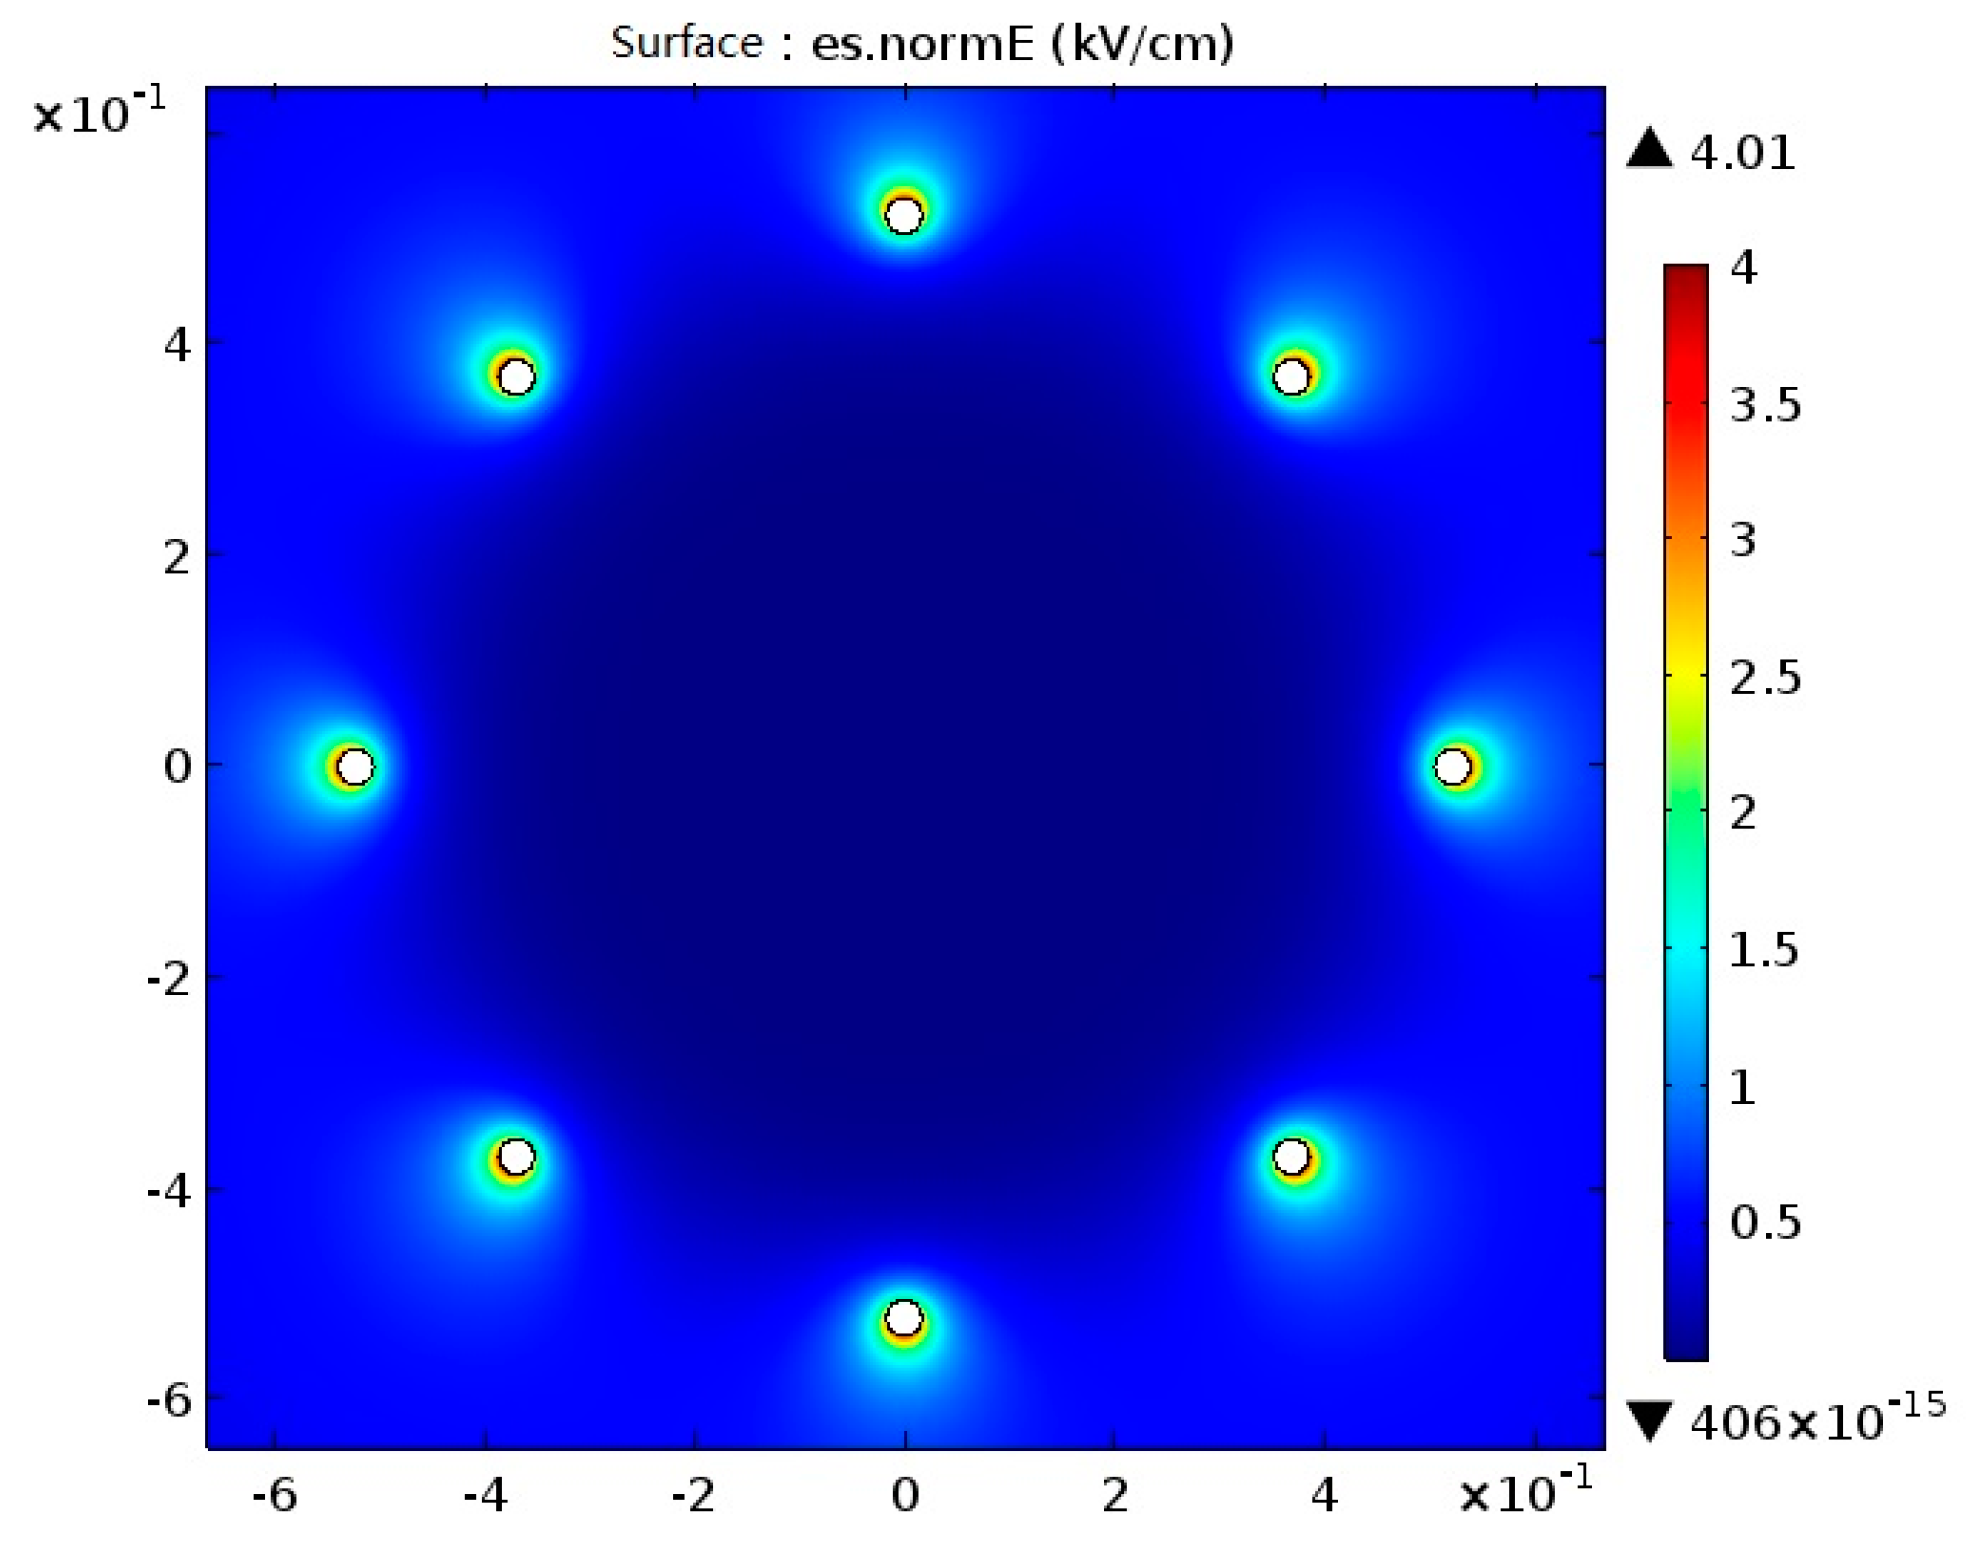
In this study, by adopting an increasing ladder voltage on the conductor surface with the average maximum electric strength interval of 1 kV/cm. Finite-element analysis was used to simulate the surface field strength. As shown in Figure 3, the applied voltage across the conductors was 100 kV, and the electrical-field strength on the surface of the bundled conductors was non-uniform, because of the skin/proximity effects, the electrical-field strength of the inner parts of bundled conductors was smaller than that on the outer parts, the maximum of gradient of each sub-conductor was selected, and the average of these gradients was calculated as a variable from which to derive the corona resistive current from the corona cage. The results, and maximum average field strengths, of the four distinct bundled conductor surfaces are shown in Table 2.
Corresponding to each electric field strength point, it can be converted into voltage applied to the conductor surface following Table 2, and the resistive currents in each of the four distinct bundled conductors were investigated. Meteorological parameters including the temperature, humidity, and air pressure at the test site are shown in Table 3.
3. Test Results
3.1. Measurement Result of Resistive Current
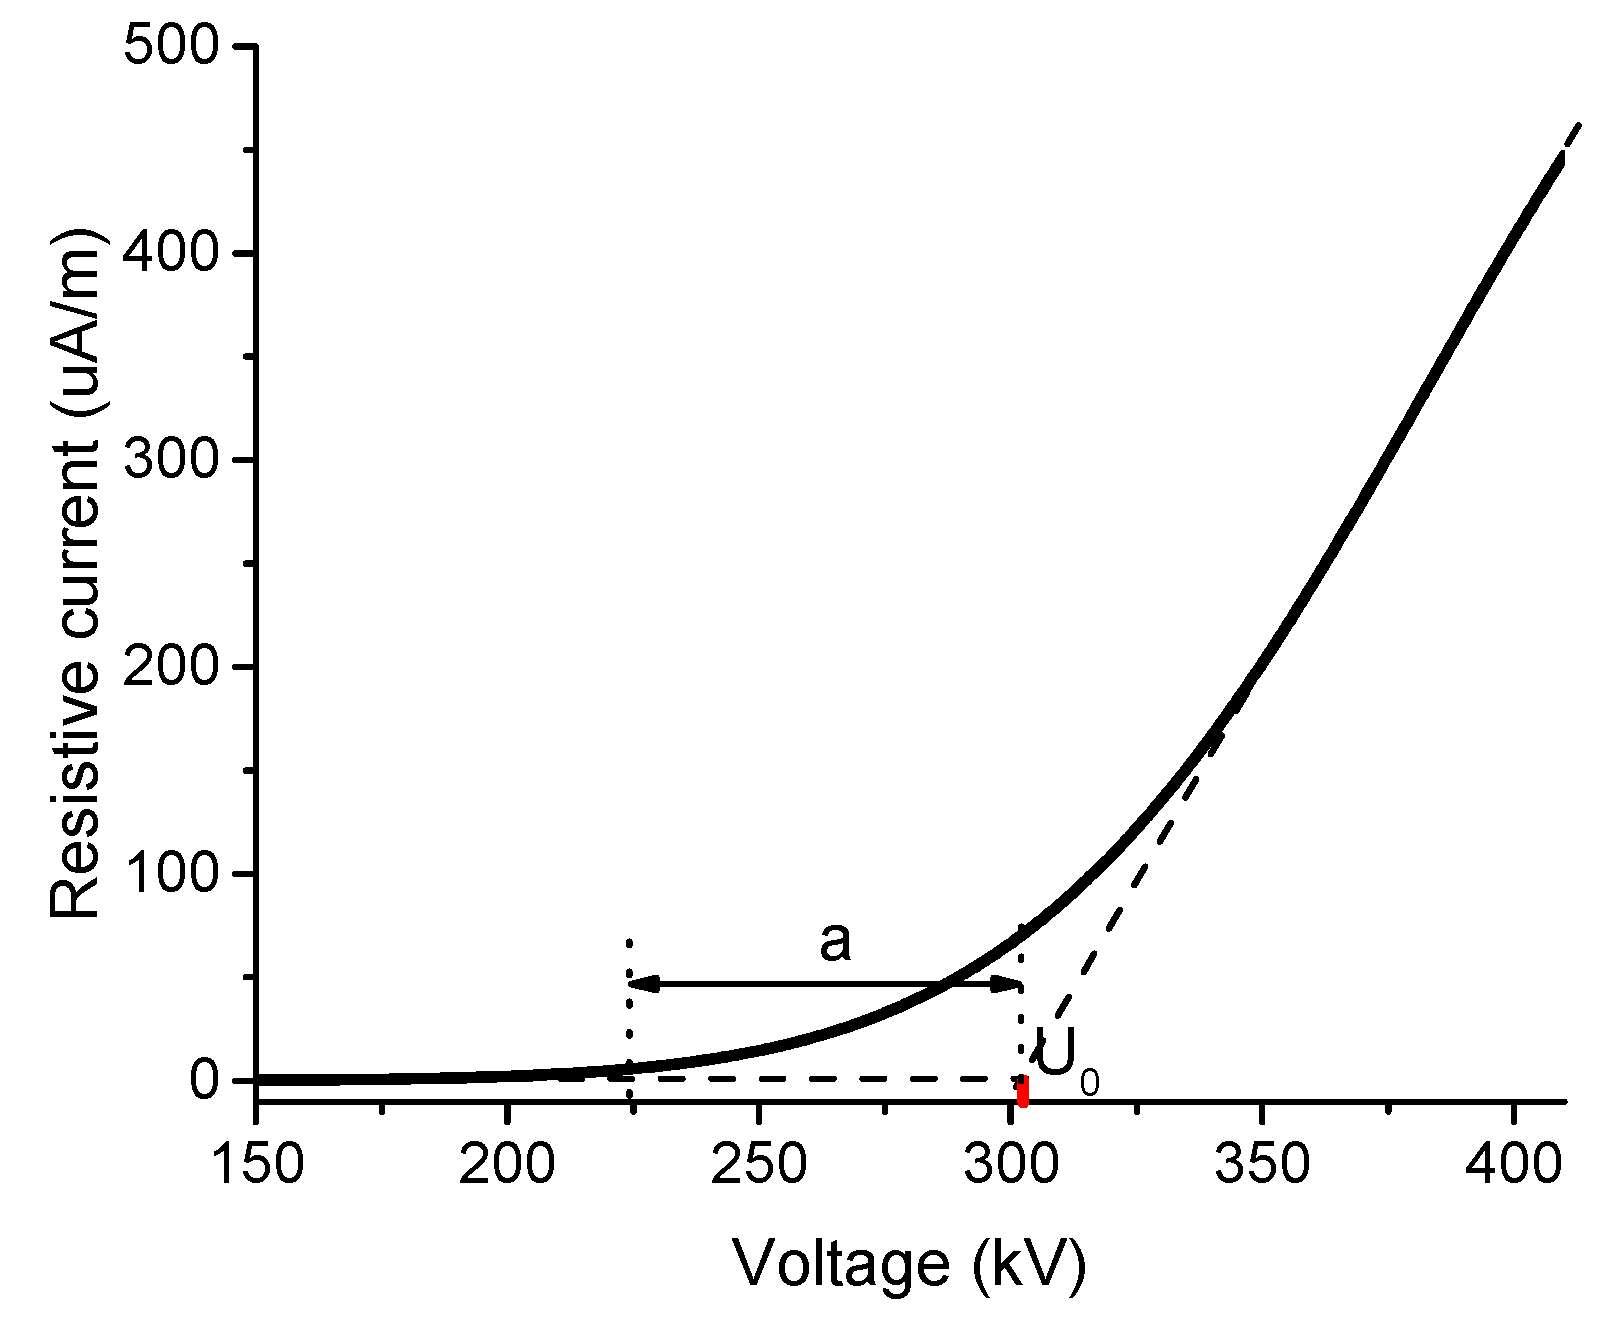
The U-I curve tangent line method was adopted to obtain corona onset voltages of bundle conductors, as shown in Figure 4. When the voltage is smaller than U0 in the section ‘a’, the resistive current is very small, and the resistive current is produce by random and discrete corona discharge points, including burrs and scratch on the conductor’s surface, joints between conductor and fittings, etc., according to Peek’s law, the phenomenon occurring in section ‘a’ is called ‘disruptive voltage’. When the voltage is higher than U0, the corona discharge occurs on the whole surface of the conductor and the resistive current grows rapidly, which is called ‘visual discharge’ in Peek’s law, and the voltage U0 is defined as the corona onset voltage.
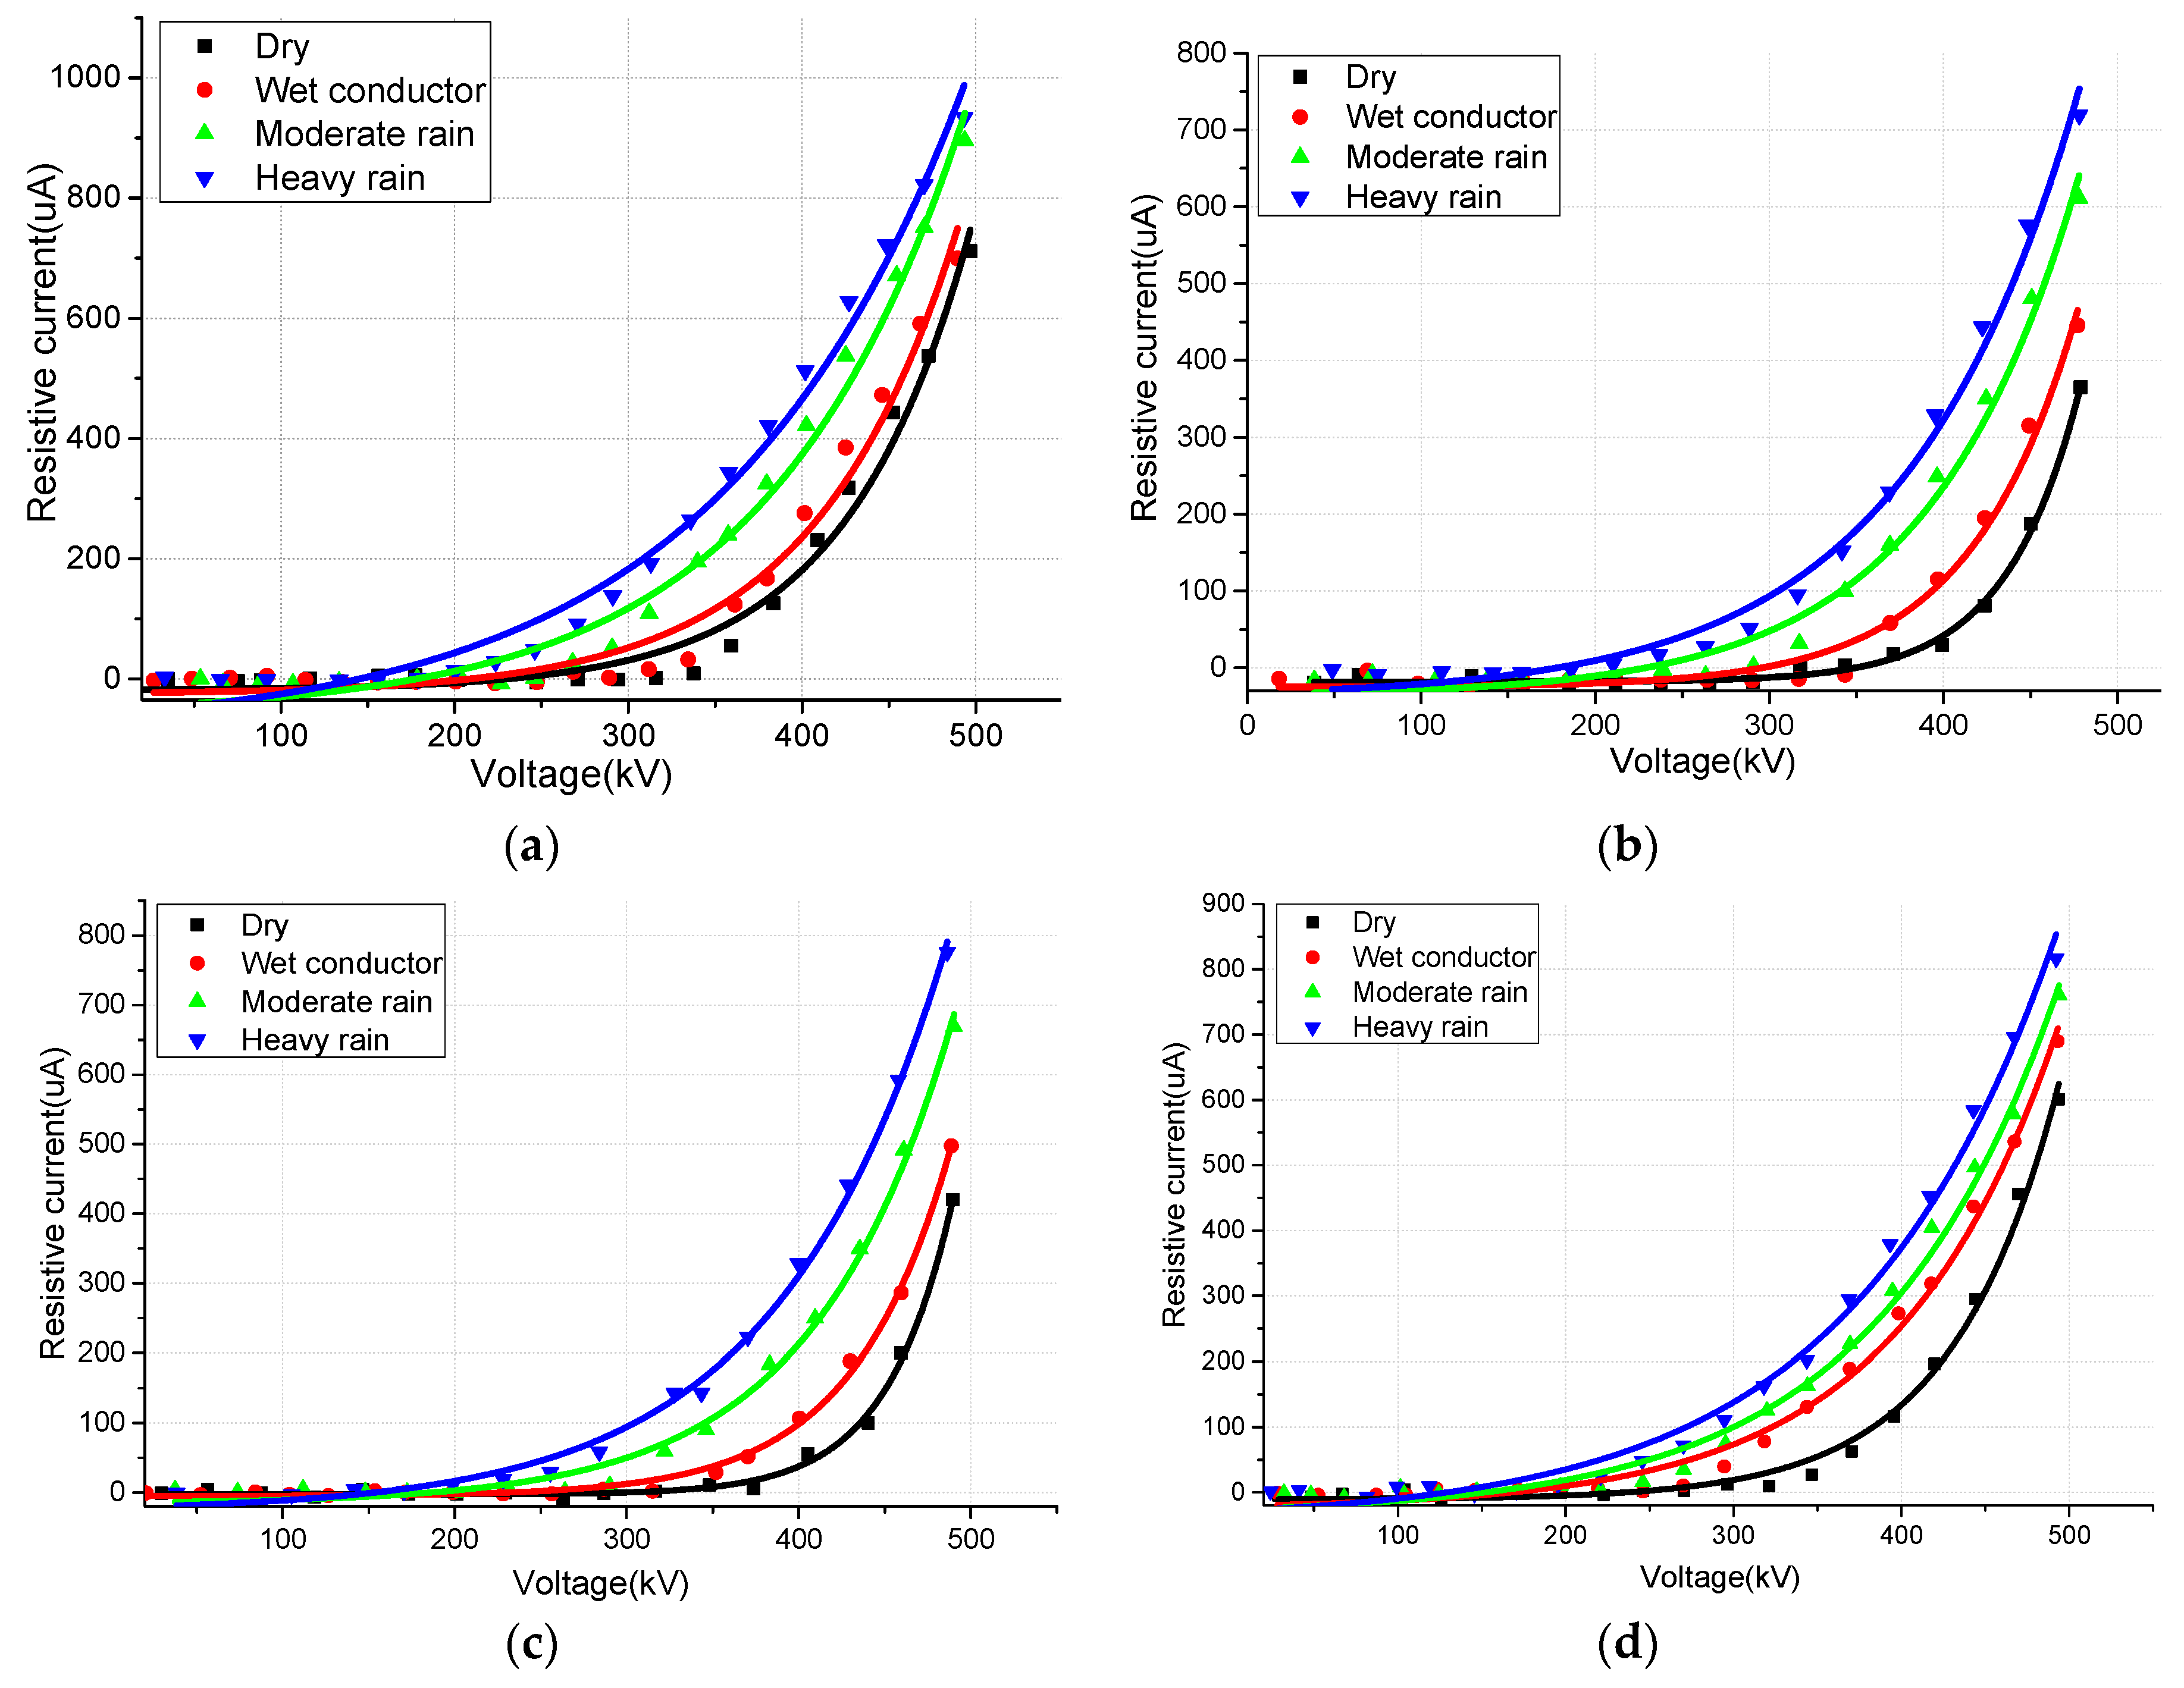
The resistive current curves of dry and wet 6 × LGJ720, 8 × LGJ720, 10 × LGJ720 and 8 × LGJ630 bundled conductors, as well as those in moderate and heavy rain, are illustrated in Figure 5.
3.2. Test Results for Corona Onset Voltage and Gradient
By using the tangent method, the corona onset values of dry and wet 8 × LGJ630, 6 × LGJ720, 8 × LGJ720 and 10 × LGJ720 conductors, as well as those in moderate and heavy rain, were obtained in the experiment. The corona onset voltages under different weather conditions are shown in Table 4. Combined with the analysis in Section 2.3, the experimental results of the corresponding corona onset gradients are shown in Table 5.
For the same types of conductor, the corona onset voltages are listed in decreasing order, as dry conditions > wet conductor > moderate rain > heavy rain. Among them, 6 × LGJ720 and 8 × LGJ630 conductors had similar corona onset voltages.
For the 8 × LGJ630 conductor, the corona onset voltages were measured at 461 kV and 406 kV in dry and heavy rain conditions, respectively, using a UHV corona cage in the Wuhan UHV AC test base (19 m above sea level) [20]. By comparing the reduction of the corona onset voltage of the 8×LGJ630 conductor as the altitude is increased to 2200 m, it was found that the corona onset voltage decreases by about 16.7% and 17.49% under dry and heavy rain conditions, respectively. 8 × LGJ630 bundle conductors are used in plain areas of the UHV AC power line, but continuing using 8 × LGJ630 in high-altitude areas will significantly increase the corona effect.
Compared to 8 × LGJ630, the corona onset voltage of the 8 × LGJ720 conductor increases by about 30 kV (7.25%) and 27 kV (6.73%) under dry and wet conditions, respectively. The corona onset voltage increases significantly; therefore, increasing the cross-section of the conductors can increase the corona onset voltage and reduce the corona effect.
With the increase of the number of bundles, the corona onset voltage gradually increases. For the LGJ720 conductor in dry conditions, for example, compared with 6-bundle conductors, the corona onset voltage of the 8-bundle conductors increases by about 8.09%, while that of the 10-bundle conductors increases by about 4.6% in comparison with the 8-bundle conductors, and the rate of increase reduces.
In summary, the corona onset voltage of bundled conductors increases with increasing cross-sectional area and number of bundles. To reduce the corona effect, by referring to the corona onset voltage value of UHV double-circuit lines (8 × LGJ630 bundle conductors) used in plain areas in the Wuhan UHV AC base, the 10 × LGJ720 bundled conductor is the optimal choice in high-altitude areas, according to data from tests on the four types of bundled conductor. To reduce the corona effect further, and to provide reference data for constructing UHV AC power lines in high-altitude areas, the authors plan to study the corona onset characteristics of LGJ-900 and other conductors with even larger cross-sections, next.
From Table 5, with regard to LGJ630, it can be seen that increasing the bundle number can decrease the corona onset electrical field intensity. For 8 × LGJ720 and 8 × LGJ630 bundled conductors, with increasing conductor section, the corona onset electrical field intensity should, in theory, decrease; however, the corona onset electrical field intensity value for 8 × LGJ720 is very close to that for 8 × LGJ630, and one possible reason for the result described above is that the surface roughness of the bundled conductors from the factory is non-uniform.
4. Calculation and Analysis
4.1. Calculation Model for Corona Onset Voltage Considering the Outer Strand of the Conductors
As the AC corona discharge has a polar effect, the conductors’ negative polarity corona discharge precedes positive polarity corona discharge, so the negative corona discharge model was used here. The negative corona discharge model has been described in detail in references [21,22,23,24,25]; therefore, in this paper, only the sections of the model that have been improved are discussed:
In high-altitude areas, the corona onset characteristic is mainly influenced by the collision ionisation coefficient α and the electron attachment coefficient η at different atmospheric pressures; eventually the ionised boundary surface (α(r) = η(r)) was changed, where r is the distance between the ionised boundary and the conductor.
The parameters of α and η are functions of E (the electric field strength, kV/cm) and p (the air pressure, kPa). The collision ionisation coefficient α and the electron attachment coefficient η are given, for different ranges of E/p, in reference [23]. In the experiments, the temperature changed within the range from 12.8 to 14.3 °C (the difference is less than 1.5 °C), therefore, the influence of temperature can be ignored in the analysis of the experimental results. The parameters α and η, considering relative humidity, are also given in reference [25].
The air pressure p can be transformed by the relationship between altitude and air pressure is:
where H is the altitude (km), in this paper, H = 2.2 km, p0 represents the standard atmospheric pressure (101.325 kPa), and k = 10.7 [20].
The former study assumed that stranded conductors have a smooth cylindrical structure, ignoring the influence of outer strands on the electric field E and the geometric factor g(r) in the model.
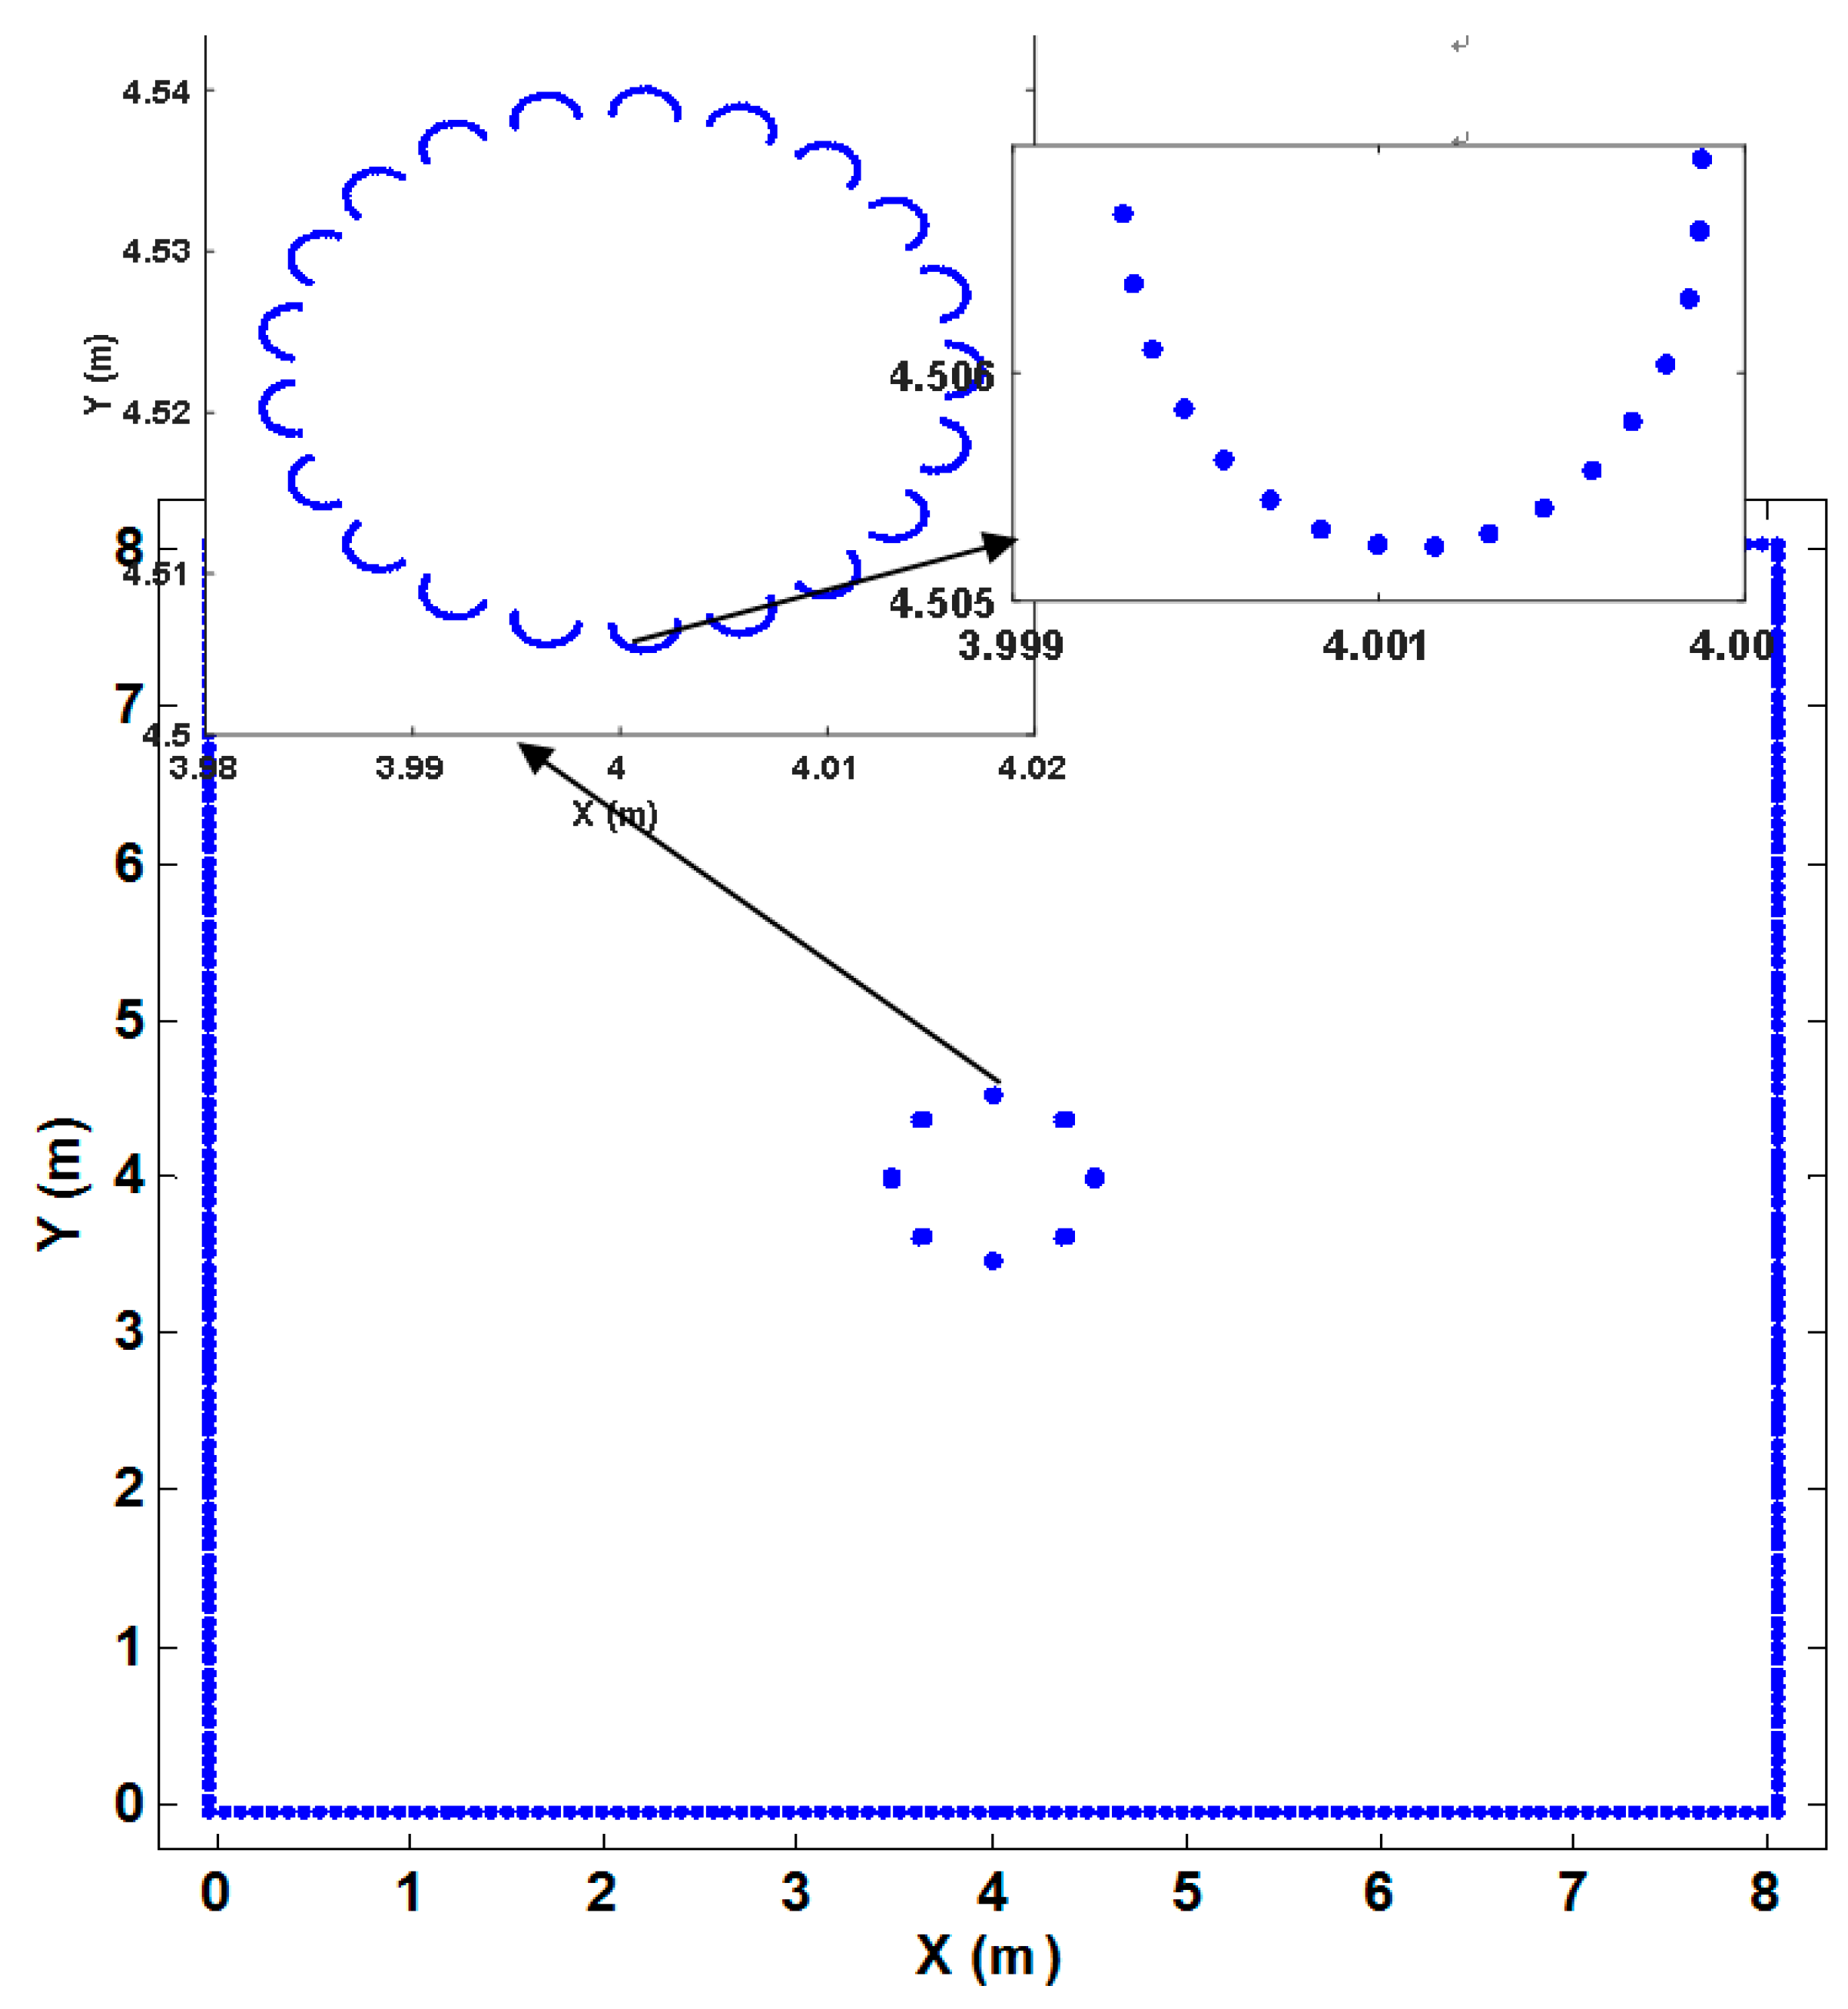
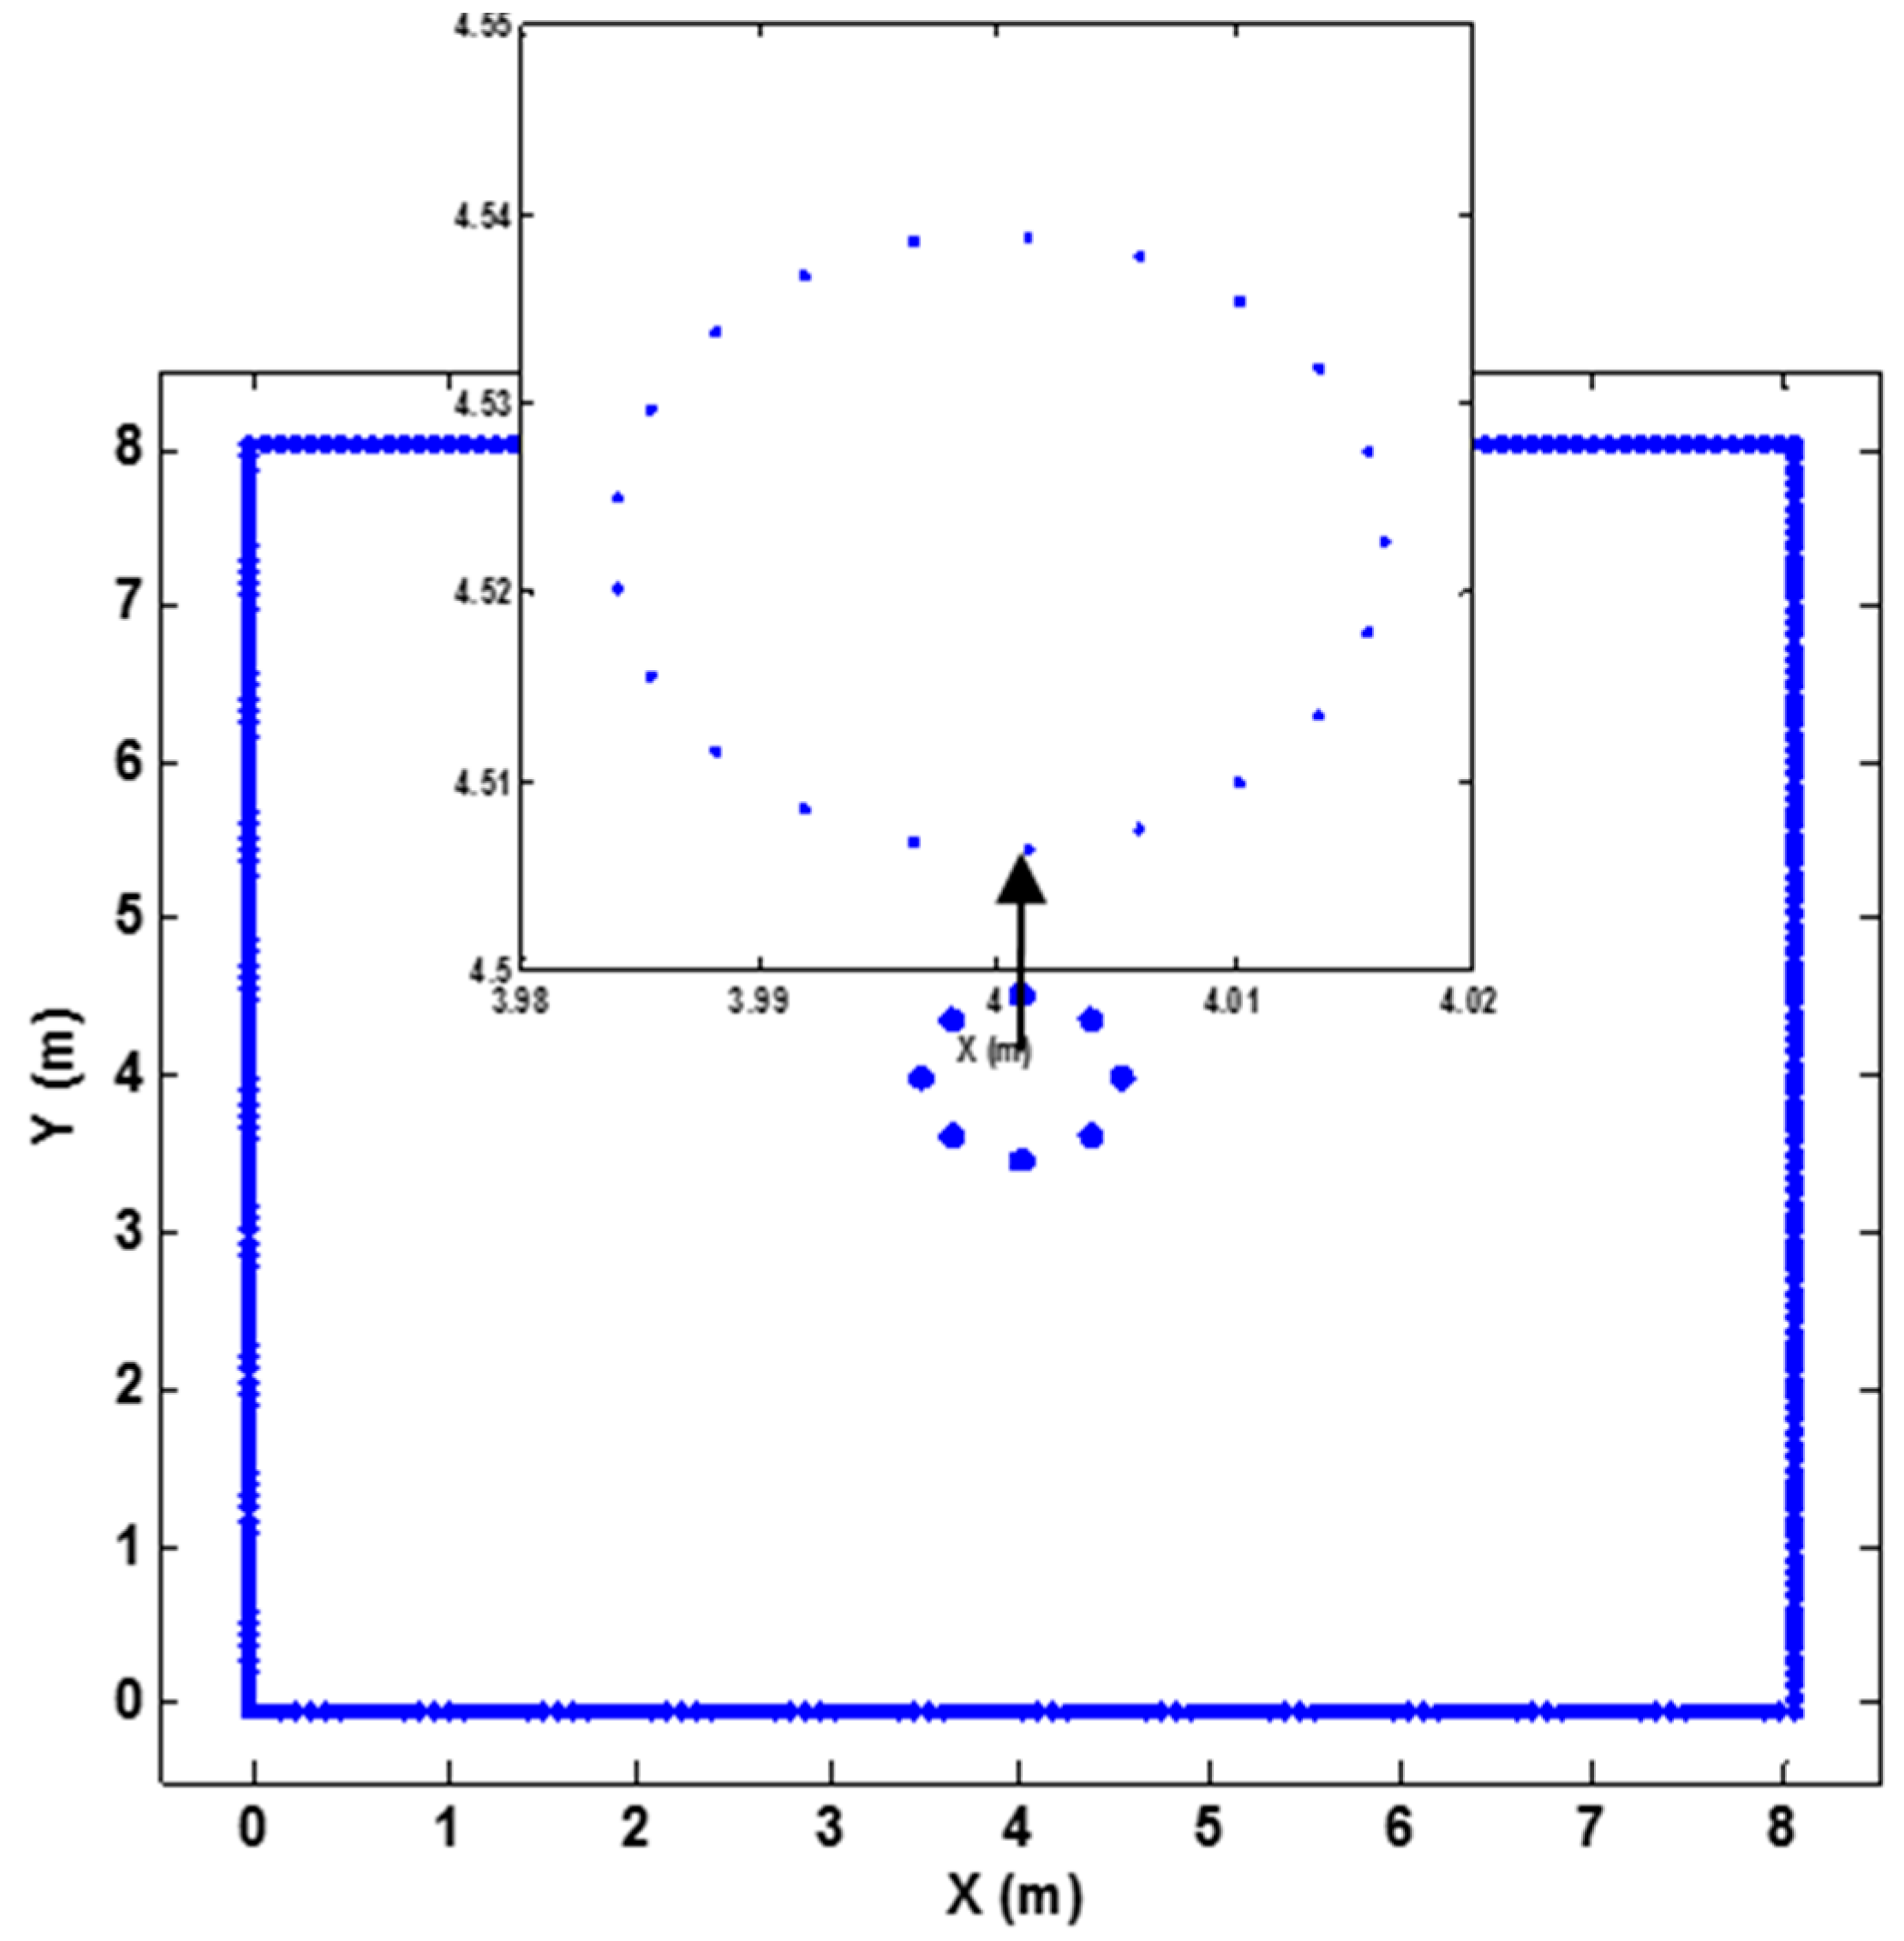
In this paper, the authors calculated the electric field strength E around the bundle conductors considering the outer strands based on the charge simulation method, as shown in Figure 6.
Assuming that the voltage applied to the conductor was Ut, then:
where Qcond is the simulated charge on the conductor; Qcage is the simulated charge on the walls of the corona cage; Pcond1 and Pcond2 are the potential coefficients of Qcond at the charge-emitting points on the conductor surfaces and charge-matching points on the corona cage walls; Pcage1 and Pcage2 are the potential coefficients of Qcage at the charge-emitting points on the conductor surfaces and charge-matching points on the corona cage walls. fx_cond and fy_cond denote the field intensity coefficients of Qcond in the X- and Y-directions at any point in the field, fx_cage and fy_cage are the field intensity coefficients of Qcage in the X- and Y-directions at any point in the field.
Qcond and Qcage can be obtained by solving Formulae (3) and (4) simultaneously, and then the electric field distribution at any point in the field can be obtained from Formulae (5) and (6) based on the superposition principle:
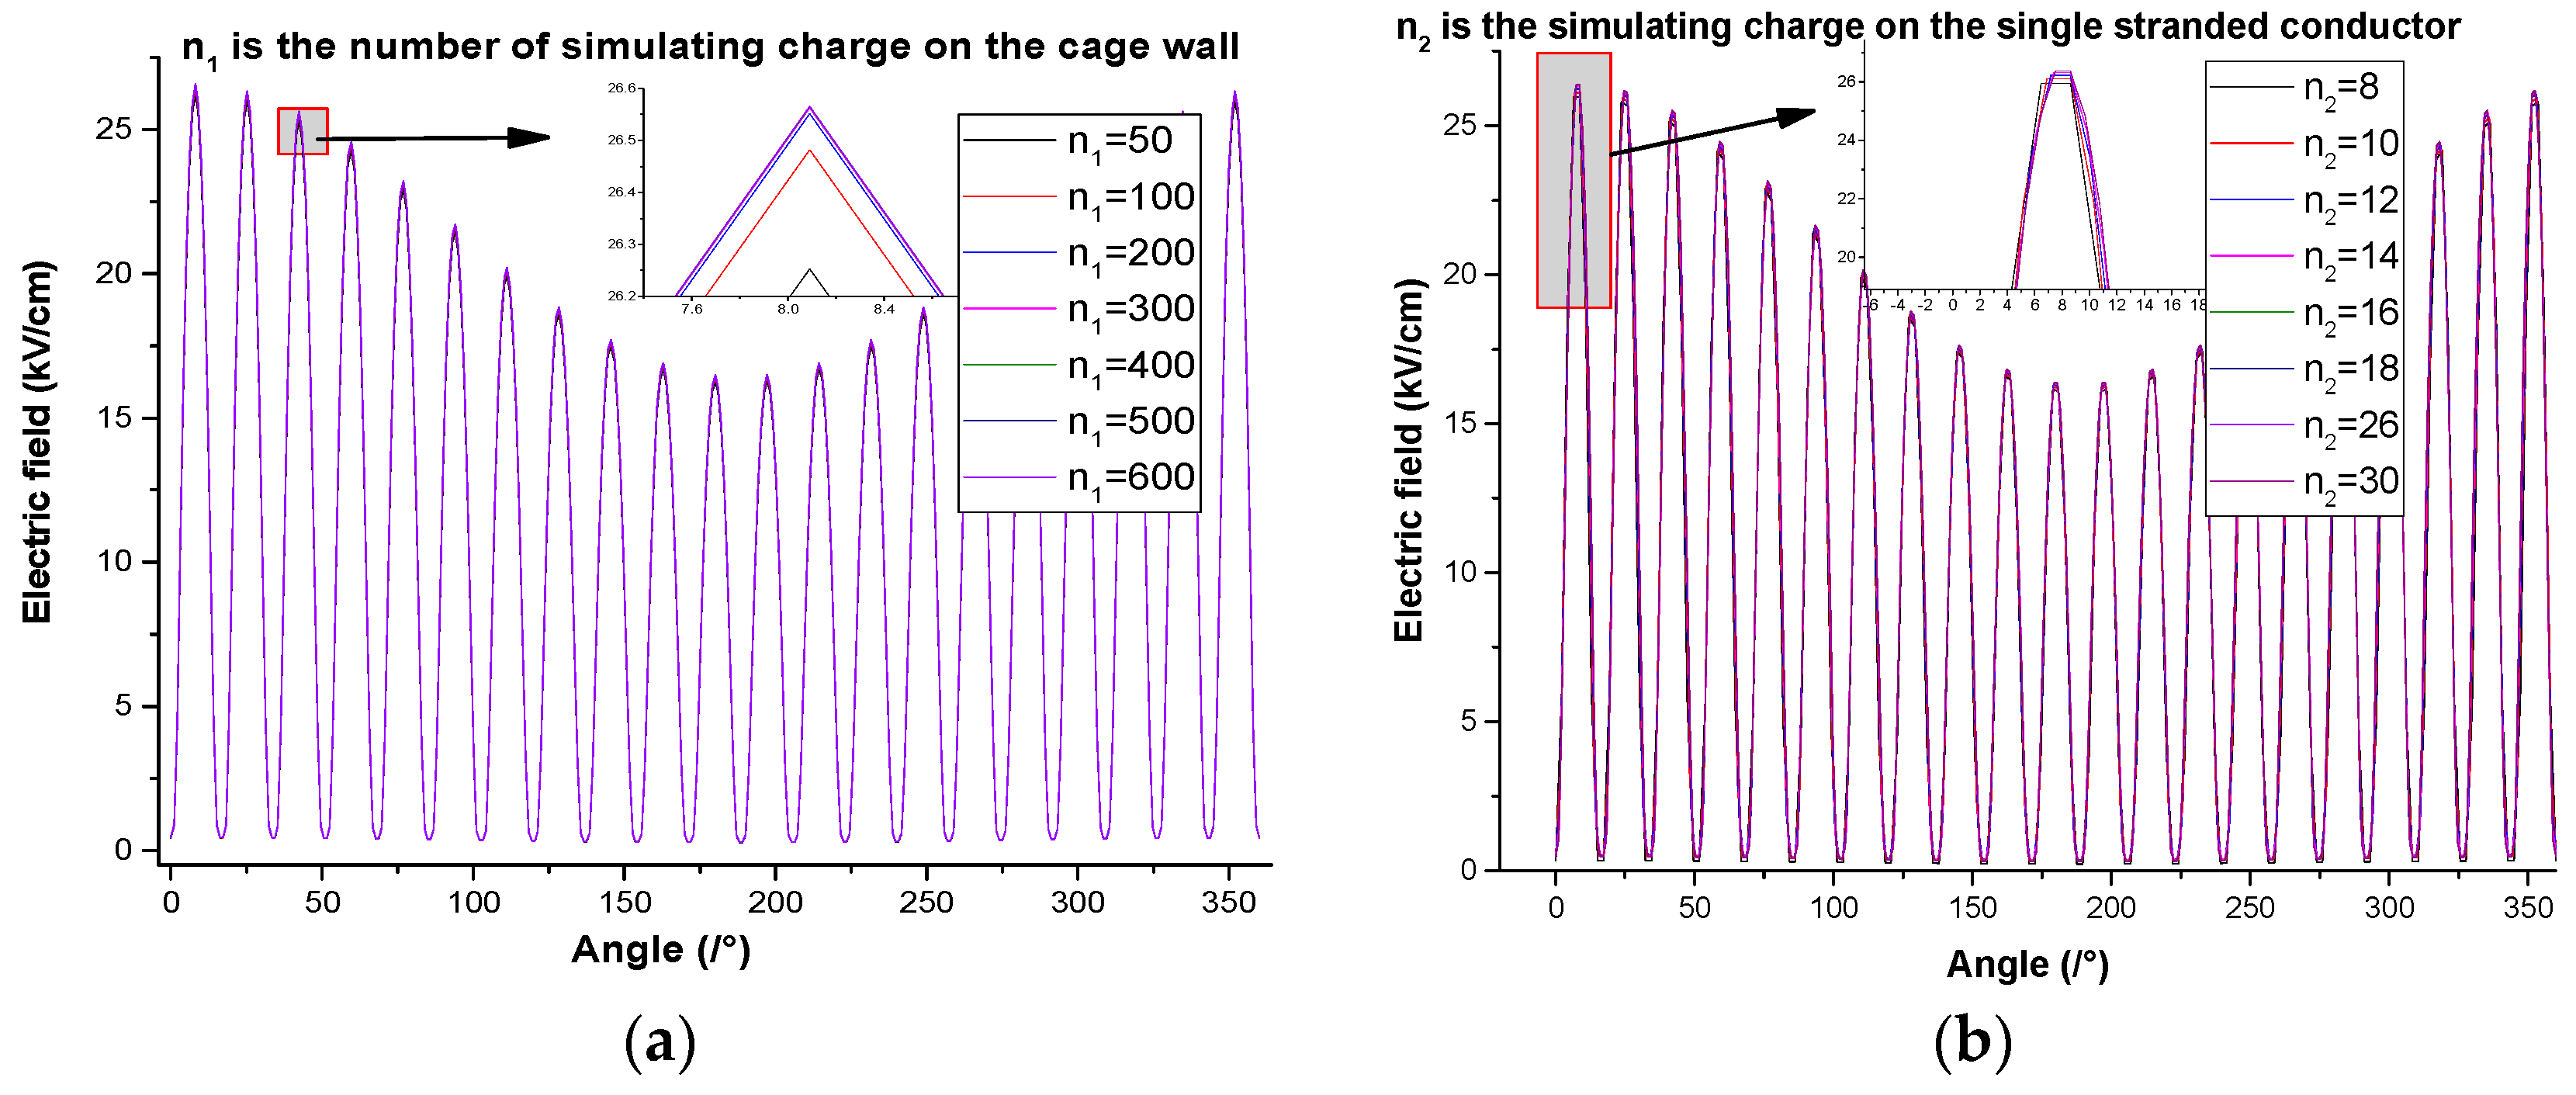
Figure 7a illustrates the electric fields on the walls of the corona cage calculated using different simulated charges, the computation error of the electric field between two adjacent calculation results is shown in Table 6; when the number of simulated charges on the corona cage exceeds 300, the electric field intensity of the stranded conductor remains unchanged. Figure 7b shows the calculated electric field distribution on the surface of the stranded conductor calculated by using different charges on each strand, the computation error of electric field between two adjacent calculation results is shown in Table 7; when the number of charges on a single strand exceeds 14, the calculated electric field on the strand surface remains unchanged. Therefore, 17 simulated charges were applied to each strand of the outer strands of sub-conductors for these simulations, and 400 simulated charges were applied to the corona cage wall. In this way, the electric field on the surface of the stranded conductor was determined.
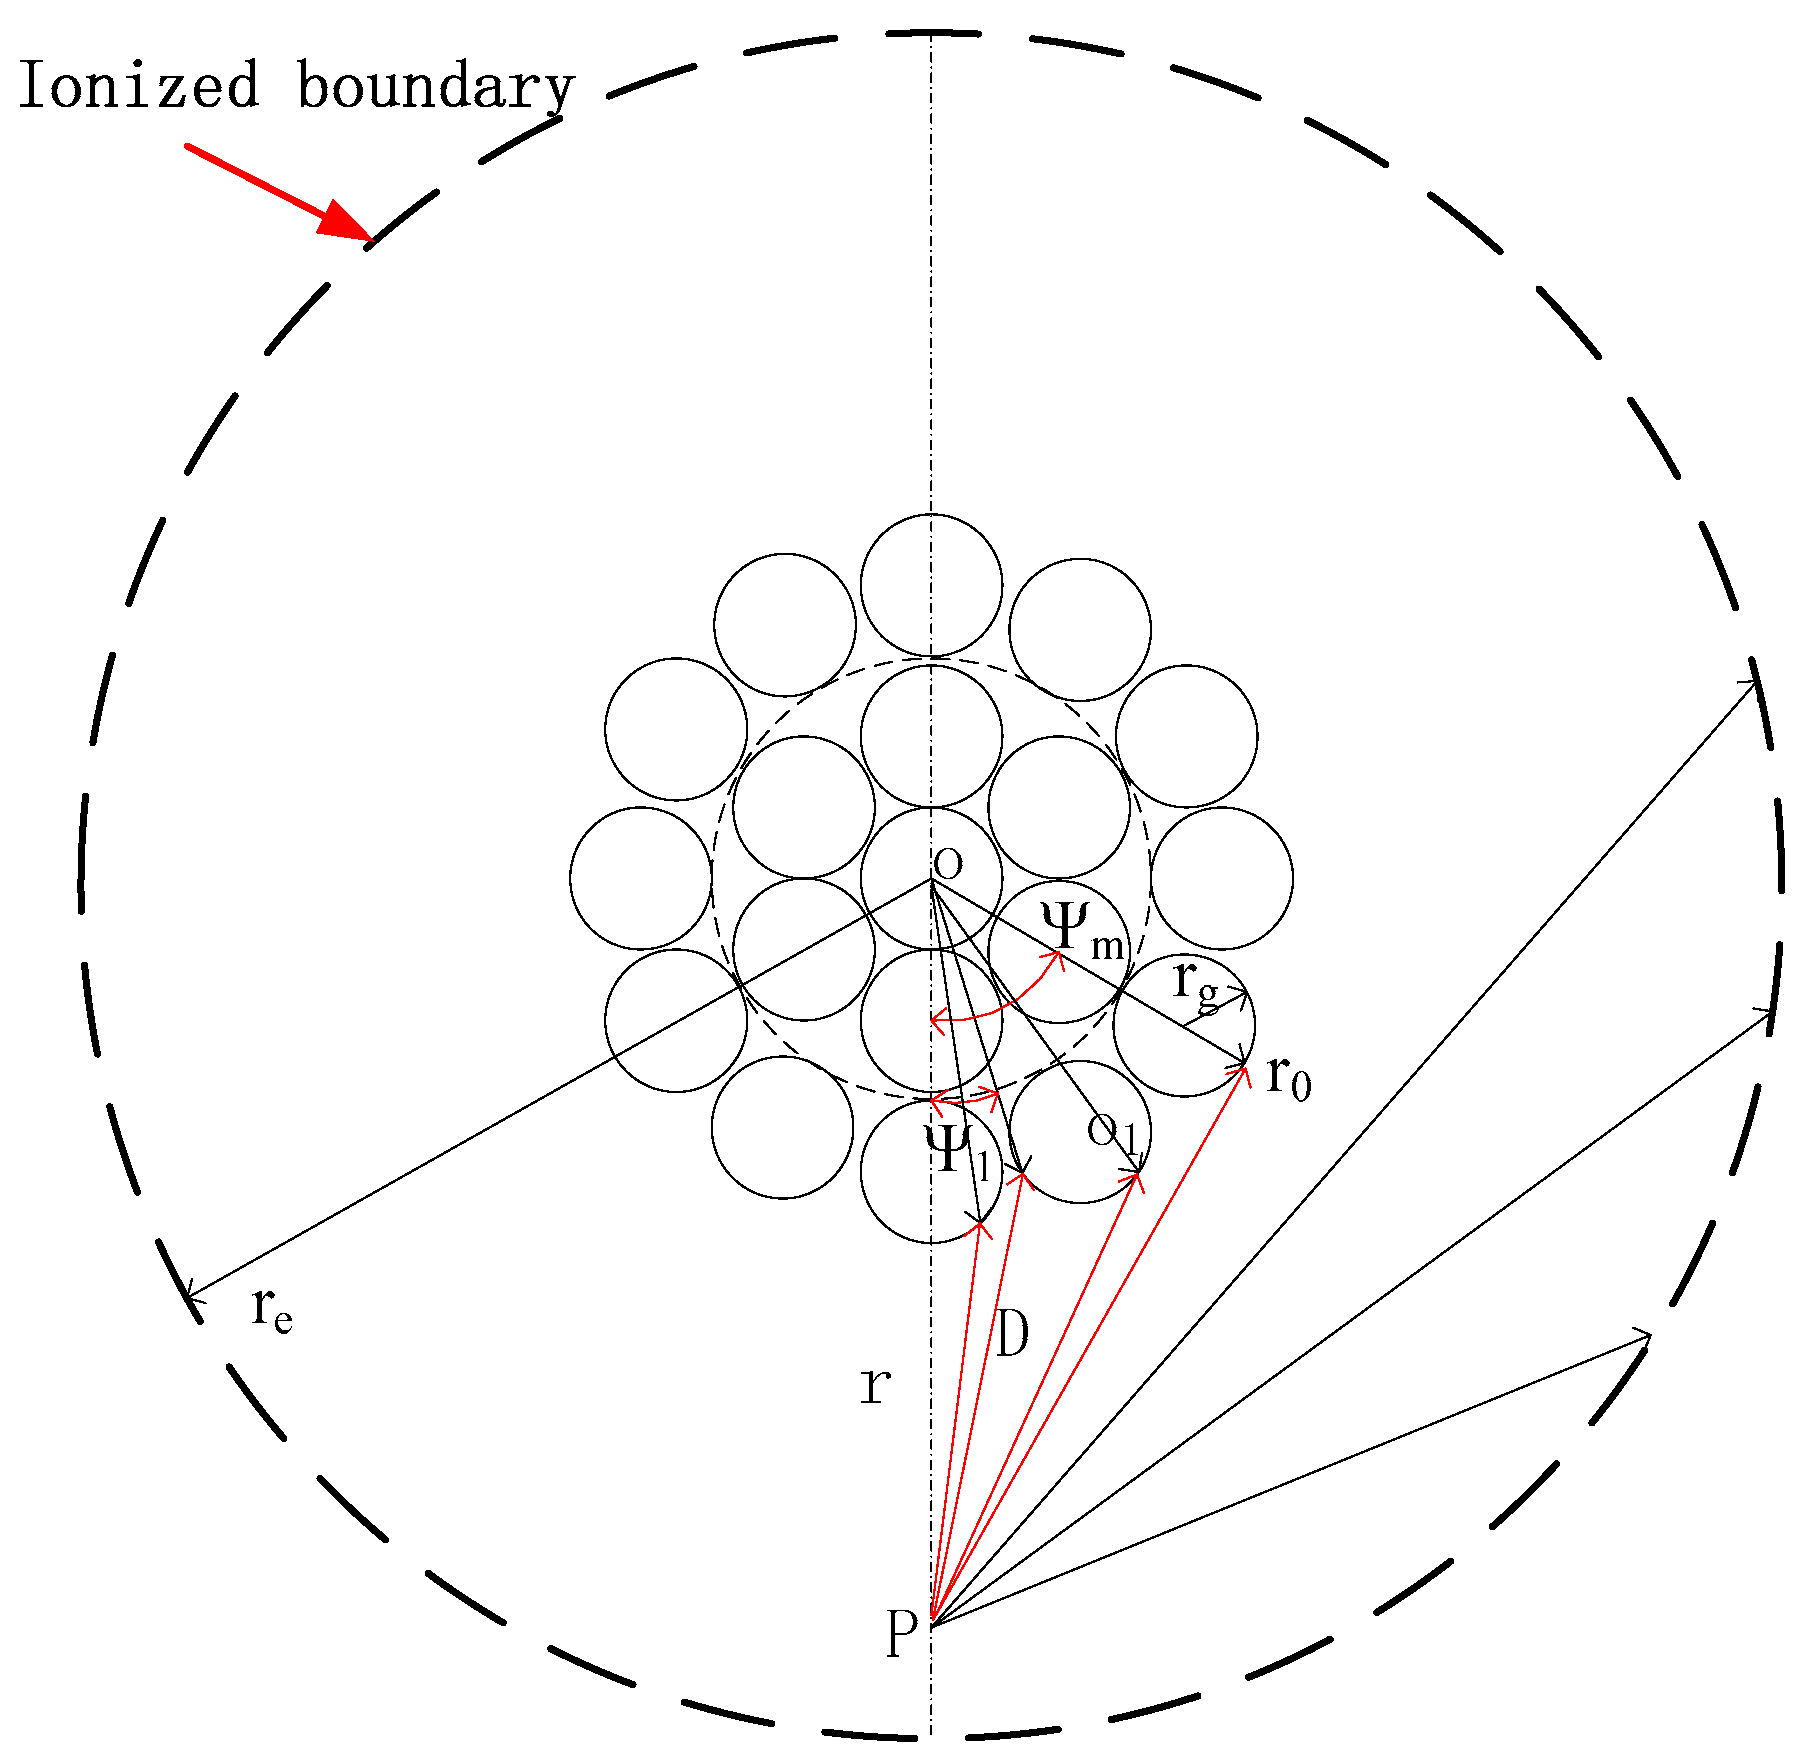
For the stranded conductor, the geometric factor g(r) can also be decomposed into the product of the radial component grad(r) and the axial component gaxial(r). The axial component gaxial(r) is the same as that of the smooth conductor, but the radial component grad(r) is different, as shown in Formula (8). Photon emission in the radial direction in the ionised zone is shown in Figure 8.
In the formula,
where, rg the radius of the outer strand, n is the number of strands in the outer layer.
4.2. Calculation Results of Corona Onset Voltage
By using the calculation method proposed in Section 4.1, the values of the corona onset voltages of the four types of bundled conductor at an altitude of 2200 m were computed and then compared with the experimental values under dry conditions (Table 8).
It can be seen from the table that the maximum deviation of tested and calculated corona onset voltage for the four types of conductors under dry conditions was 5.7%, with a narrow range measured. This also verifies the correctness of the improved calculation model.
4.3. Equivalent Roughness Coefficient of Bundled Conductors
The equivalent roughness coefficient of the conductor, m, is defined by:
where, Uincc is the corona onset voltage of the stranded conductor, kV; and Uincs is the corona onset voltage of ideal conductors having the same outer diameter as the stranded conductor, kV.
For the 6 × LGJ720, 8 × LGJ720, 10 × LGJ720 and 8 × LGJ630 bundled conductors, due to the number of outer stands being 21, 21 simulation charges were evenly arranged on the periphery of the circle with the same radius of each sub-conductor to simulate the electric field around an ideal smooth conductor, as seen in Figure 9. The comparison of the conductor surface electric fields between ideal smooth cylindrical conductors and stranded conductors is shown in Figure 10.
The corona onset voltage of the ideal smooth conductor with the same radius and bundle type (roughness coefficient m = 1) is calculated for an altitude of 2200 m above sea level. In addition, the surface roughness coefficients for the four different weather conditions were calculated (Table 9), whereby the roughness coefficient of the wet conductor and that under rainy conditions was the ratio of the tested corona onset voltage to the calculated corona onset voltage of the ideal smooth conductor under the dry weather conditions. It can be seen from Table 6 that, for the LGJ720 bundled conductor, the roughness coefficient shows a decreasing trend with increasing numbers of bundles under the same meteorological conditions.
For wet conductors, or under rainy conditions, there are suspended, or fixed, water droplets on the conductor surface. The presence of water droplets changes the surface state and reduces the equivalent roughness coefficient of a conductor. Due to the joint effects of gravity, adhesion, surface tension, and the electric field force, water droplets will be deformed and vibrate at a frequency of twice that of the electric field frequency [26]; near the peak AC voltage, water droplets are flattened, while near the zero-crossing point of the voltage, they become conical and finally drop, forming smaller droplets, which are ejected to surrounding areas.
The roughness of the wet conductor lies between that of the dry conductor and the conductor under rainy conditions. This can be explained as follows: the conductor surface gradually dries, owing to the “Asakawa effect” with longer application of voltage under wet conductor conditions, and the number of water droplets on the conductor surface decreases such that the surface irregularities are reduced and the roughness is increased, but remains smaller than that in a dry conductor. Under rainy conditions, the roughness coefficient of the conductor decreases with increasing rainfall intensity and tends to reach saturation. The number of water droplets on the conductor surface increases with rising rainfall intensity at low rainfall intensities, which alters the electric field on the conductor surface and reduces the corona onset voltage. With further increases in rainfall intensity, the surface tends to reach saturation, and the continuously increasing rainfall intensity plays a limited role in reducing the roughness coefficient, as the water droplets are quickly replaced after falling.
5. Conclusions
Based on the UHV corona cage, an experimental study of the corona characteristics of dry and wet 8 × LGJ630, 6 × LGJ720, 8 × LGJ720 and 10 × LGJ720 bundled conductors, as well as under artificial rainfall conditions, was conducted in Ping’an County, Xining City (elevation 2200 m). The resistive current curves of the four types of bundled conductor were measured under different conditions. By using the tangent method, the corona onset voltages and onset gradients of the four types of bundled conductors at an elevation of 2200 m were obtained for the first time.
Considering the influence of the outer strands on the electric field E and the geometric factor g(r) in the model, an improved calculation model for the corona onset voltage was established. The test results under dry conditions showed that the calculation model could calculate the corona onset voltage of stranded conductors in the corona cage in high-altitude areas. Furthermore, the roughness coefficient decreases with increasing rainfall intensity and eventually reaches saturation. Moreover, the roughness coefficient of a wet conductor lies between that of a dry conductor and a conductor under rainy conditions.
Acknowledgments
The authors would like to thank the reviewers of this paper for their useful comments. This work is supported by the National Natural Science Foundation of China (51577069, 51277073), the National Basic Research Program of China (2011CB209401) and the National Grid Corporation of Science and Technology (Grant no. SGTYHT/15-JS-191).
Author Contributions
Shilong Huang and Yunpeng Liu conceived and designed the experiments; Shilong Huang, Shaoshuai Chen, Guangyang Zhou and Wenbing Zhuang performed the experiments and analysed the data; Shilong Huang and Yunpeng Liu established the calculation model; Shaoshuai Chen, Guangyang Zhou contributed reagents/materials/analysis tools; Shilong Huang, Yunpeng Liu and Shaoshuai Chen wrote the paper.
Conflicts of Interest
The authors declare no conflict of interest.
References
- Kumar, K.B.; Thomas, M.J. Computation of audible noise from a 1200 kV UHV power power line. IEEE Trans. Dielectr. Electr Insul. 2016, 23, 974–978. [Google Scholar] [CrossRef]
- He, W.L.; He, J.J.; Wan, B.Q.; Chen, Y.C.; Pei, C.M.; Chen, Y.L. Influence of altitude on radio interference level of AC power lines based on corona cage. IET Sci. Meas. Technol. 2015, 9, 861–865. [Google Scholar] [CrossRef]
- Wan, B.Q.; He, W.L.; Pei, C.M.; Wu, X.R.; Chen, Y.C.; Zhang, Y.M.; Lan, L. Audible noise performance of conductor bundles based on cage test results and comparison with long term data. Energies 2017, 10, 958. [Google Scholar] [CrossRef]
- He, W.L.; Wan, B.Q.; Lan, L.; Pei, C.M.; Zhang, J.G.; Chen, Y.C.; Chen, X.Y.; Wen, X.S. Effect of altitude on the audible noise level of AC power lines. Energies 2017, 10, 1055. [Google Scholar] [CrossRef]
- Zhang, B.; Li, W.; He, J.L.; Zeng, R. Analysis of ion flow field of UHV/EHV AC power lines. IEEE Trans. Dielectr. Electr Insul. 2013, 20, 496–504. [Google Scholar] [CrossRef]
- Lü, F.C.; You, S.H.; Liu, Y.P.; Wan, Q.F.; Zhao, Z.B. AC conductors’ corona-loss calculation and analysis. IEEE Trans. Power Del. 2012, 27, 877–885. [Google Scholar] [CrossRef]
- Liu, Z.Y. UHV AC Power Line; China Economic Press: Beijing, China, 2005. [Google Scholar]
- Liu, Z.Y. Building the Global Energy Internet; China Electric Power Press: Beijing, China, 2015. [Google Scholar]
- Maruvada, P.S. Corona and Gap Discharges; Research Studies Press Ltd.: London, UK, 2000. [Google Scholar]
- Wan, Q.F.; Chen, Y.; Gu, L.L. Research on section and split way of conductors for UHV AC transmission project. High Volt. Eng. 2008, 34, 432–437. [Google Scholar]
- Liu, Y.W.; Li, J.H.; Li, B. Influence of air density and humidity on the corona performance of conductor. Power Syst. Technol. 1990, 14, 46–50. [Google Scholar]
- Liu, Y.P.; You, S.H.; Lü, F.C.; Wan, Q.F.; Bian, X.M.; Wang, L.M. 500-kV EHV bundle conductors’ corona onset voltage calculation and analysis in corona cage at different altitudes. IEEE Trans. Power Del. 2012, 27, 2090–2097. [Google Scholar] [CrossRef]
- Liu, Z.X.; Lu, C.H. The influence of altitude on corona-starting voltages. High Volt. Eng. 1988, 14, 38–41. [Google Scholar]
- He, J.Y. Experimental study on corona at high altitude of Long-West line. High Volt. Appl. 1983, 03, 26–30. [Google Scholar]
- Zheng, Y.S.; He, J.L.; Zhang, B. Photoemission replenishment criterion for inception of negative corona discharges in air. IEEE Trans. Power Del. 2011, 26, 1980–1987. [Google Scholar] [CrossRef]
- Liu, Y.P.; Zhu, L.; Lv, F.C. Negative Corona Onset Characteristic of the UHV Conductors Based on the Corona Cage. J. Electr. Eng. Technol. 2014, 9, 2089–2097. [Google Scholar] [CrossRef]
- IEEE Standards Association. IEEE Standard Definitions of Terms Related Corona and Field Effects of Overhead Power Lines; IEEE Standard No. 539; IEEE Standards Association: Piscataway, NJ, USA, 1990. [Google Scholar]
- Liu, Y.P.; Huang, S.L.; Chen, S.S. Corona Losses Monitoring System of Bundle Conductors Using UHV Corona Cage Based on Optical Fiber Transmission. High Volt. Appl. 2017, 10, 1–6. [Google Scholar]
- People’s Republic of China National Standards Association. Aluminum. Stranded Conductors and Aluminum Conductors Steel-Reinforced; GB 11179-83; Chinese Standard Press: Beijing, China, 1983. [Google Scholar]
- You, S.H. Corona Cage-Based Corona Loss Characteristics of Conductors for UHV AC Power Line. Ph.D. Thesis, North China Electric Power University, Beijing, China, 2012. [Google Scholar]
- Sarma, M.P.; Janischewsky, W. DC corona on smooth conductors in air: Steady-state analysis of the ionization layer. Proc. Inst. Elect. Eng. 1969, 116, 161–166. [Google Scholar] [CrossRef]
- Sanders, F.H. Measurement of the Townsend coefficient for ionization by collision. Phys. Rev. 1933, 44, 1020–1024. [Google Scholar] [CrossRef]
- Harrison, M.A.; Geballe, R. Simultaneous measurement of ionization and attachment coefficients. Phys. Rev. 1953, 91, 1–7. [Google Scholar] [CrossRef]
- Abdel-Salam, M. Calculating the effect of high temperatures on the onset voltages of negative discharges. J. Phys. D Appl. Phys. 1976, 9, 149–154. [Google Scholar] [CrossRef]
- Abdel-Salam, M. Positive wire-to-plane coronas as influenced by atmospheric humidity. IEEE Trans. Ind. Appl. 1985, 21, 35–40. [Google Scholar] [CrossRef]
- Zhi, W. Influences of Water Droplets on Corona Discharge Characteristics of Power Line. Master’s Thesis, Chongqing University, Chongqing, China, 2014. [Google Scholar]
Figure 1.
General layout of experimental platform. (a) Corona cage; and (b) Artificial rainfall system.
Figure 1.
General layout of experimental platform. (a) Corona cage; and (b) Artificial rainfall system.

Figure 2.
Measuring ends for current and voltage. (a) Sketch of the experimental platform: 1—Measuring section of the corona cage, 2—Protection sections of the corona cage, 3—Insulated support, 4—Shielding cage, 5—Test conductor, 6—Current measurement end, 7—Remote data acquisition module for communication at the voltage measurement end, 8-TRF-800 high-voltage standard voltage divider, 9—Local merging unit, 10—Host computer, 11—Voltage regulator, 12—Transformer, 13—Fibre-optic link, 14—Network cable, 15—Sampling resistor; (b) Current measuring end; (c) Voltage measuring end.

Figure 3.
Contour surface of electric-field strength (kV/cm) of the 8 × LGJ630 bundle in the UHV corona cage.
Figure 3.
Contour surface of electric-field strength (kV/cm) of the 8 × LGJ630 bundle in the UHV corona cage.

Figure 4.
The diagram for determining the onset voltage using the U-I curve tangent line method.

Figure 5.
Test results: resistive currents. (a) 6 × LGJ720; (b) 8 × LGJ720; (c) 10 × LGJ720; (d) 8 × LGJ630.
Figure 5.
Test results: resistive currents. (a) 6 × LGJ720; (b) 8 × LGJ720; (c) 10 × LGJ720; (d) 8 × LGJ630.

Figure 6.
Simulation charge arrangement in the corona cage with eight bundled conductors.

Figure 7.
(a) Surface electric field on a stranded conductor with different numbers of simulated charges on the corona cage walls; (b) Surface electric field on a stranded conductor with different numbers of simulated charges on each single strand.
Figure 7.
(a) Surface electric field on a stranded conductor with different numbers of simulated charges on the corona cage walls; (b) Surface electric field on a stranded conductor with different numbers of simulated charges on each single strand.

Figure 8.
Photon emission in the radial direction in the ionised zone.

Figure 9.
Simulation charge arrangement around an ideal smooth cylindrical conductor.

Figure 10.
Comparative analysis of surface electric field on a sub-conductor: smooth vs. stranded conductors.
Figure 10.
Comparative analysis of surface electric field on a sub-conductor: smooth vs. stranded conductors.


Table 1.
Parameters of two common stranded conductors.
| Conductors | Aluminium Strands | Radius of Conductor R (mm) | |
|---|---|---|---|
| Number of Outer Strands n | Radius of Outer Strands rg (mm) | ||
| LGJ630 | 21 | 2.1 | 16.8 |
| LGJ720 | 21 | 2.2645 | 18.115 |
Table 2.
Field strength of bundled conductors in the UHV corona cage.
| No. | Bundled Conductors | Bundle Spacing (mm) | Maximum Average Field Strength of Bundle Conductors (kV/cm) |
|---|---|---|---|
| 1 | 6 × LGJ720 | 450 | 4.42 |
| 2 | 8 × LGJ720 | 400 | 3.78 |
| 3 | 10 × LGJ720 | 400 | 3.42 |
| 4 | 8 × LGJ630 | 400 | 4.01 |
Table 3.
Temperature, humidity, and air pressure at test site.
| Conductor Type | 6 × LGJ720 | 8 × LGJ720 | 10 × LGJ720 | 8 × LGJ630 |
|---|---|---|---|---|
| Temperature (°C) | 12.8 | 13.3 | 14.0 | 14.3 |
| Humidity (%) | 75.8 | 70.3 | 61.4 | 73.5 |
| Air pressure (kPa) | 78.3 | 78.4 | 78.6 | 78.5 |
Table 4.
Experimental values: the corona onset voltage under different weather conditions (kV).
| Conductor Type | 6 × LGJ720 | 8 × LGJ720 | 10 × LGJ720 | 8 × LGJ630 |
|---|---|---|---|---|
| Wet conductor | 373 | 401 | 416 | 374 |
| Moderate rain | 352 | 374 | 394 | 356 |
| Heavy rain | 340 | 358 | 374 | 342 |
Table 5.
Experimental value: the corona onset gradient (kV/cm).
| Conductor Type | 6 × LGJ720 | 8 × LGJ720 | 10 × LGJ720 | 8 × LGJ630 |
|---|---|---|---|---|
| Dry | 16.93 | 15.65 | 14.81 | 15.39 |
| Wet conductor | 16.49 | 15.16 | 14.23 | 14.79 |
| Moderate rain | 15.56 | 14.14 | 13.47 | 14.28 |
| Heavy rain | 15.03 | 13.53 | 12.79 | 13.43 |
Table 6.
Computation error: change in electric field with number of charges on the corona cage.
| Number of Charges on the Corona Cage (n1) | 50 | 100 | 200 | 300 | 400 | 500 | 600 |
|---|---|---|---|---|---|---|---|
| Max Electric field calculated (kV/cm) | 26.24 | 26.47 | 26.55 | 26.56 | 26.56 | 26.56 | 26.56 |
| Error (%) | / | 0.88 | 0.30 | 0.04 | 0 | 0 | 0 |
Table 7.
Computation error: change in electric field with number of charges on a single strand.
| Number of Charges on a Single Strand (n2) | 8 | 10 | 12 | 14 | 16 | 18 | 26 | 30 |
|---|---|---|---|---|---|---|---|---|
| Max Electric field calculated (kV/cm) | 25.94 | 26.12 | 26.24 | 26.32 | 26.33 | 26.33 | 26.33 | 26.33 |
| Error (%) | / | 0.69 | 0.46 | 0.30 | 0.03 | 0 | 0 | 0 |
Table 8.
Comparison between the test results and calculated values under dry conditions.
| Conductor Type | 6 × LGJ720 | 8 × LGJ720 | 10 × LGJ720 | 8 × LGJ630 |
|---|---|---|---|---|
| Test values (kV) | 383 | 414 | 433 | 384 |
| Calculated values (kV) | 361 | 407 | 449 | 363 |
| Error (%) | −5.7 | −1.6 | 3.7 | −5.4 |
Table 9.
Equivalent roughness coefficient under different weather conditions.
| Conductor Type | 6 × LGJ720 | 8 × LGJ720 | 10 × LGJ720 | 8 × LGJ630 |
|---|---|---|---|---|
| Condition | Equivalent Roughness Coefficient | |||
| dry | 0.77 | 0.72 | 0.68 | 0.72 |
| Wet conductor | 0.75 | 0.69 | 0.65 | 0.69 |
| Moderate rain | 0.71 | 0.65 | 0.62 | 0.67 |
| Heavy rain | 0.69 | 0.62 | 0.59 | 0.63 |
© 2018 by the authors. Licensee MDPI, Basel, Switzerland. This article is an open access article distributed under the terms and conditions of the Creative Commons Attribution (CC BY) license (http://creativecommons.org/licenses/by/4.0/).
Share and Cite
MDPI and ACS Style
Huang, S.; Liu, Y.; Chen, S.; Zhou, G.; Zhuang, W. Corona Onset Characteristics of Bundle Conductors in UHV AC Power Lines at 2200 m Altitude. Energies 2018, 11, 1047. https://doi.org/10.3390/en11051047
AMA Style
Huang S, Liu Y, Chen S, Zhou G, Zhuang W. Corona Onset Characteristics of Bundle Conductors in UHV AC Power Lines at 2200 m Altitude. Energies. 2018; 11(5):1047. https://doi.org/10.3390/en11051047
Chicago/Turabian StyleHuang, Shilong, Yunpeng Liu, Shaoshuai Chen, Guangyang Zhou, and Wenbing Zhuang. 2018. "Corona Onset Characteristics of Bundle Conductors in UHV AC Power Lines at 2200 m Altitude" Energies 11, no. 5: 1047. https://doi.org/10.3390/en11051047
Note that from the first issue of 2016, this journal uses article numbers instead of page numbers. See further details here.