1. Introduction
Owing to the significant growth of the population, transportation, and the basic industry sectors, the demand for fossil fuel continues to increase [
1]. Its growth began as the Industrial Revolution took off in the 18th century, when vast quantities of fossil fuel were used to power the economy. However, based on the report, it is becoming a global problem as crude oil stock is depleting and its price is increasing. Therefore, significant environmental problems can be seen as the consumption of fossil fuel increases. Based on a British Petroleum (BP) Statistical Review of World Energy in June 2014, the global primary energy consumption in 2013 accelerated by approximately 2.3% over 2012 despite stagnant global economic growth. Moreover, the consumption and production of all fuels increased, reaching record levels for every fuel type except nuclear power. Global consumption rose more rapidly than the production of each type of fossil fuel. In 2013, the data suggests that growth in global carbon dioxide (CO
2) emissions from energy use also accelerated, although it remained below average [
2]. On the other hand, global energy consumption will rise by 37% by 2040, whereas crude oil consumption is expected to rise from the current 90 million barrels a day to 104 million barrels a day. However, demand for oil will plateau by 2040 according to the International Energy Agency (IEA) in its latest World Energy Outlook released on 12 November 2014, in London. Interestingly, the report also stated that the global supply of crude oil, other liquid hydrocarbons, and biofuels is expected to be sufficient to meet world demand for liquid fuel for at least the next 25 years. However, there is substantial uncertainty about the levels of future liquid fuel supply and demand. After the oil crises in the 1970s and 1980s, much of the debate about world oil markets focused on the limitations of supply [
3].
One of the main contributors to air pollution is the diesel engine. However, diesel engines are attractive power units used widely in many fields because of their great advantages over gasoline engines such as lower fuel consumption, lower carbon monoxide emissions, better torque characteristics, and higher reliability [
4,
5,
6,
7,
8,
9]. These characteristics make diesel engines the main contributor to total petroleum consumption. In contrast, owing to its lean-burning nature and high temperatures and pressures in the combustion process, diesel engines are the main contributors to air pollution for a large amount of emissions, especially particulates and nitrogen oxides (NOx). Thus, controlling these emissions is one of the most important aspects of modern air quality management.
Research has shown that diesel engines fuelled with palm oil could decrease the emissions produced in terms of smoke, PM, hydrocarbon, sulfur oxide, and carbon monoxide [
10,
11]. However, there are growing concerns surrounding the negative impact of PM emissions from diesel engines on human health and the environment. Moreover, since the great smog of 1952 in London, tremendous research on adverse health effects of air pollution have been recorded and have led to several changes in practices and regulations, including Clean Air Acts in most countries [
12]. Thus, many scientists and policy-makers have worked together to solve the problems from different perspectives. The investigation has included the epidemiological and the toxicological effect of airborne pollutants. Diesel vehicles contribute significantly to the particulate air pollution problem, especially in metropolitan areas of developing Asian countries [
13]. The size of the particle determines where it will deposit in the human respiratory tract when inhaled [
14]. Moreover, Peng et al. reported that PM with a size of 10 µm (PM
10) can enter the lungs and cause health problems ranging from coughing and wheezing, to asthma attacks and severe bronchitis, to high blood pressure and heart attacks. Similarly, PM that is 2.5 µm (PM
2.5) or smaller tends to penetrate the lungs, causing damage to the alveoli tissues and resulting in coughing and other severe respiratory problems for individuals with asthma or heart diseases. Smaller particles with a diameter less than 100 nm may pass through the lungs and affect other vital organs such as the brain [
15,
16]. Many toxicological and epidemiological studies have reported that adverse health effects of PM (PM
10, PM
2.5) have been established [
17]. There is significant evidence of health effects associated with ultrafine particles with a diameter less than 100 nm [
18], some of which can penetrate cell membranes, enter the blood, and even reach the brain [
19].
Thus, reducing PM concentration in diesel exhaust gas has become crucial among industrial societies and researchers at universities [
20,
21]. On the other hand, it is important to investigate the PM concentration of biodiesel and other alternative fuels, which is likely to have a different chemical composition [
20,
22]. Many researchers have reported that the main factor affecting PM emissions is the fuel oxygen content. However, some researchers have concluded that the differences depend on the chemical structure or volatility of a given oxygenate [
23]. Diesel PM can be divided into two main components: dry soot or solid carbon material and volatile or soluble organic compound, commonly described as soluble organic fraction (SOF). According to the conceptual model by [
24], PM can be divided into non-volatile—which is mainly generated in the engine—and volatile/soluble—which forms later in the exhaust. Generally, dry soot is highly agglomerated solid carbonaceous material and ash. The typical chemical formula is C
8H, C
9H, and C
10H. Approximately 5–10% oxygen and 0.5% nitrogen by mass are also present. Dry soot results from several processes, such as pyrolysis, dehydrogenation, and condensation of fuel molecules. Meanwhile, SOF, which originates from fuel and oil hydrocarbons, can be extracted by a solvent such as dichloromethane. SOF comes from a tiny fraction of the fuel comprising atomized and evaporated lube oil that escapes oxidation and appears in the exhaust. The SOF contains polycyclic aromatic compounds containing oxygen, nitrogen, and sulfur [
25].
Most of the sulfur in the fuel is oxidized to SO2. However, a small fraction is oxidized to SO3, which leads to sulfuric acid and sulfates in the exhaust particles. In addition to SOF, sulfates originating from fuel sulfur, NO2, and water are also absorbed on the particle core to form soot. Typically, SOF has an empirical formula of CH1.65O0.1N0.007. The concentration mass content of SOF varies depending on engine design and operating conditions, and the range is mostly from 20 to 45%. SOF values are increased with light engine loads when the exhaust temperature is low.
According to National Biodiesel Board (NBB), biodiesel is the only alternative fuel to have fully completed the health effects testing requirements of the Clean Air Act [
26]. Thus, the aim for using biodiesel is to reduce petroleum consumption and greenhouse gas effects [
27,
28]. However, there are many important advantages and disadvantages to using POME compared to diesel fuel. The real advantages are the greater cetane number for POME compared to diesel fuel because it is free of sulfur and aromatics. Furthermore, the absence of sulfur prevents sulfur poisoning of after-treatment systems and reduces corrosion. Moreover, the high viscosity and low energy content are the main disadvantages of biodiesel fuel. In addition, it has higher pour point and cloud points, limiting operation; lower oxidative stability, shortening storage life; and higher organic carbon emissions. In order to address these problems, many studies have focused on diesel-biodiesel blends [
29].
Biodiesel fuel is well known to be biodegradable and nontoxic, and its use provides a reduction of many harmful exhaust emissions. A nearly complete absence of sulfur oxide (SOx) emissions, PM and soot, and reduced unburned hydrocarbon emissions can be achieved by using biodiesel [
30]. Moreover, biodiesel contains substantially more energy than what is required for its production and also significantly reduces net carbon dioxide (CO
2) emissions. However, using biodiesel blends in unmodified engines typically emit higher levels of nitrogen oxides (NOx) [
31]. Furthermore, the “biodiesel NOx and PM effect” continues to be a main subject of a great deal of scientific research in which a consensus for the reasons behind this increase has not yet been reached.
Buyukkaya investigated the performance, combustion, and emission trends of biodiesel from rapeseed oil and its blend. It was found that CO emissions of B5 and B100 were 9% and 32% lower than diesel fuel, respectively. The brake specific fuel consumption (BSFC) of biodiesel at maximum torque and rated power conditions were found to be 8.5% and 8% higher than that diesel fuel, respectively. The study also found that the combustion characteristics of biodiesel and its blends were quite similar to those of petroleum diesel [
32]. Biodiesel also reduce PM, visible smoke, odor, and polyaromatic hydrocarbon emissions. Furthermore, biodiesel does not contain undesirable elements, such as sulfur, compared to petro-diesel, which may have sulfur content [
33]. Numerous studies to investigate the effect of biodiesel fuel for diesel engines with different types of feedstock have been conducted worldwide. There are many potential feedstocks, which include various types of vegetable oils, as well as animal fats available to be used as biodiesel. The common sources for biodiesel currently under widespread research by many researchers around the world are soybeans, sunflowers, jathropa [
8,
34,
35,
36], peanuts, rapeseed [
37], palm [
38], corn, canola [
39], cottonseed, tallow [
40], and waste cooking oil [
41,
42].
Moreover, a high cetane number generally results in a shorter ignition delay. The shorter ignition delay for B100 fuel results in a higher premixed peak pressure. In addition, an increase in fuel viscosity, specifically for petroleum-derived fuels, results in poor atomization, slower mixing, reduced cone, and increased penetration angle. These phenomena lead to longer ignition delay. However, biodiesel is not derived from crude petroleum, and the opposite trend is seen in the cases of biodiesel and its blends [
43]. These results are in line with previous studies [
44,
45]. B100, or biodiesel fuel with a higher oxygenated nature content similar to other biodiesel blends compared to mineral diesel, results in complete burning of air-mixed fuel in the cylinder and increases the maximum cylinder pressure [
45].
On the other hand, one possible explanation for the decrease in the production of PM is the oxygen content of biodiesel. Moreover, the oxygen content in the fuel helps increase the temperature and pressure inside the combustion chamber, thus reducing PM formation and enhancing PM oxidation during the diffusion stage of combustion [
46]. This phenomenon can be interpreted as extending the combustion timing and causing a complete combustion reaction when using biodiesel, which could be a result of a higher combustion temperature that triggers PM concentration as well. Therefore, less PM in the exhaust gas can be achieved as the percentage of biodiesel blend increases. This effect has been illustrated in many papers, and it is believed that the high cetane number for B100 resulted in the lower PM concentration. Moreover, the reduction of PM with increased biodiesel in the fuel blend can be attributed to the decrease in carbon content and the increase of oxygen content in the blended fuel [
47].
In term of SOF, it is increasingly produced in the exhaust gas as the percentage of biodiesel blend increases. This is due to the unburned or partially burned hydrocarbon emissions. These hydrocarbon emissions will condense and be absorbed on the PM surface, thus resulting in increased SOF, which is the main component of PM [
48]. The higher SOF value of POME fuel is also due to its lower volatility compared to diesel fuel. However, the increased mass is mainly a result of unburned esters in the fuel itself. Since biodiesel is nontoxic, the increased SOF concentration may not be hazardous [
49]. Moreover, the present study is in agreement with the research conducted by Lapuerta et al. [
50], in which the SOF increased as the biodiesel percentage increased.
In summary, most researchers have reported a slight decrease in PM emissions for biodiesel. It is quite obvious that with biodiesel, owing to the improved combustion, the temperature in the combustion chamber can be expected to be higher, and a higher amount of oxygen is also present, which leads to the formation of less PM in POME-fuelled engines. In this study, a POME-fuelled engine plays an important role in terms of the performance, combustion, emission, and PM formation. Based on the fuel property results, engine performance, combustion, and emissions characteristics of the diesel engine, it is a critical indicators to determine the suitability of the fuel for engine operation to improve PM emissions. Thus, most of the studies on this subject indicate that the increase of biodiesel concentration in diesel engine operation affects PM formation. Controlling PM emissions requires the development of more efficient diesel engines and better fuel. In order to achieve this, a better understanding of the chemical and physical aspects of the diesel combustion process is needed. In this study, the performance (brake power, BSFC, and BTE), trade off PM-NOx emissions, PM components, and combustion characteristics of a diesel engine were investigated in engines with the same type of injection system and fuelled with mineral diesel, pure palm oil biodiesel (B100), and their B5, B10, B20 blends.
3. Results and Discussion
3.1. Analysis of Fuel Properties
Fuel density is a function of the chemical composition of the fuel. The density of blended fuel varies in the range of 837.0 to 879.9 kg/m
3 for B0 (diesel) and B100 (POME), respectively, as shown in
Table 1. Thus, it is obvious that increases in the density of the blended fuel are due to the increased biodiesel content in the blend mixture. According to Moraes et al., biodiesel and mineral diesel have very similar densities [
52]. In contrast, Atabani et al. mentioned that the density of biodiesel is affected by the sources of raw material (feedstock) used in their production processes [
53]. Moreover, as a comparison, the difference in density between mineral diesel (B0) and biodiesel (B100) is approximately 4.8%. From the analysis, the density of POME is the highest; the density of the blended fuels B5, B10, and B20 are 2.9%, 2.8%, 2.4% respectively, lower than that of B100 owing to the effect of blending with diesel.
The lubricity of oil or fuel is mainly related on kinematic viscosity. The viscosity of blended fuel varies in the range of 4.24–4.74 mm
2/s for B0 (diesel) and B100 (POME), respectively, as shown in
Table 1. Thus, as the viscosity of the blend increases, the methyl ester amounts also increase in the fuel mixture. The viscosity of the blended fuel B100 is 4.74 mm
2/s, which is higher than that of diesel fuel by 10.5%. From the analysis, the density of POME is the highest; accordingly, the viscosity of the blended fuels B5, B10, B20 are 8.0%, 7.2%, 5.3%, respectively, lower than that of B100 due to the effect of blending with diesel.
Previous studies concluded that fuel viscosity and lubricity play a crucial role in the lubrication of fuel injection systems, especially those utilizing rotary distributor injection pumps that fully rely on the fuel lubrication level in the high-pressure pumping mechanism. Fuel with lower viscosities contribute to the maximum fuel delivery reduction and engine power output decrease owing to injector and pump leakage. Fuel viscosity also influences the atomization and spray characteristics within the combustion chamber. Smaller Sauter mean droplet diameters are affected by the lower fuel viscosities, leading to increased droplet surface area and influencing the evaporation characteristic duration.
Table 1 shows that a lower heating value (HV) is recorded for POME while mineral diesel fuel has the highest HV; the difference between the two is approximately 17.1%. The heating value of any fuel is the energy released per unit mass or per unit volume of the fuel when the fuel is completely burned. Thus, it is obvious that the HV decreases as the biodiesel fraction increases in the blend. This is due to the relative composition of the fuel, in which biodiesel has oxygen present in the structure, which is not a component of conventional diesel and results in a reduction in carbon and hydrogen content. By depending on the raw material source (biodiesel feedstock), biodiesel fuels have different HVs [
54]. Typically, the HV of biodiesel is 9.4–17.1% lower than that of conventional diesel. The measured HVs of the blended fuels B5, B10, B20, and B100 are lower than that of the diesel fuel by 9.4%, 10.1%, 12.7%, and 17.1%, respectively, owing to the effect of blending with POME.
The prime indicator of the quality of diesel or biodiesel fuel is the cetane number or CN, which is related to the ignition delay time of a fuel upon injection into the combustion chamber. The calculated cetane number formula represents a means for directly estimating the ASTM cetane number of distillate fuels from API gravity and mid-boiling point [
55]. A higher CN produces a shorter ignition delay duration, which results in an easy cold start and low idling noise. Conversely, when the ignition occurs late in the expansion process the result is an incomplete combustion, as well as power output reduction, fuel conversion inefficiency, and increased engine noise. The CN of blended fuel varies in the range of 46–57 for B0 (diesel) and B100 (POME), respectively, as shown in
Table 1. Thus, as the CN of the blend increases, the methyl ester amounts also increase in the fuel mixture. The CN of blended fuel B100 is 57, which is higher than that of diesel fuel by 19.3%. From the analysis, the CN of POME is the highest. The CNs of blended fuels B5, B10, and B20 are 17.5%, 15.8%, and 12.3%, respectively, lower than that of B100, owing to the effect of blending with diesel.
3.2. Analysis of Engine Performance
In this research, brake power can be calculated by using engine torque for each speed. Thus, a correction factor is considered according to SAE J1349—Engine Test Code for Diesel Engines [
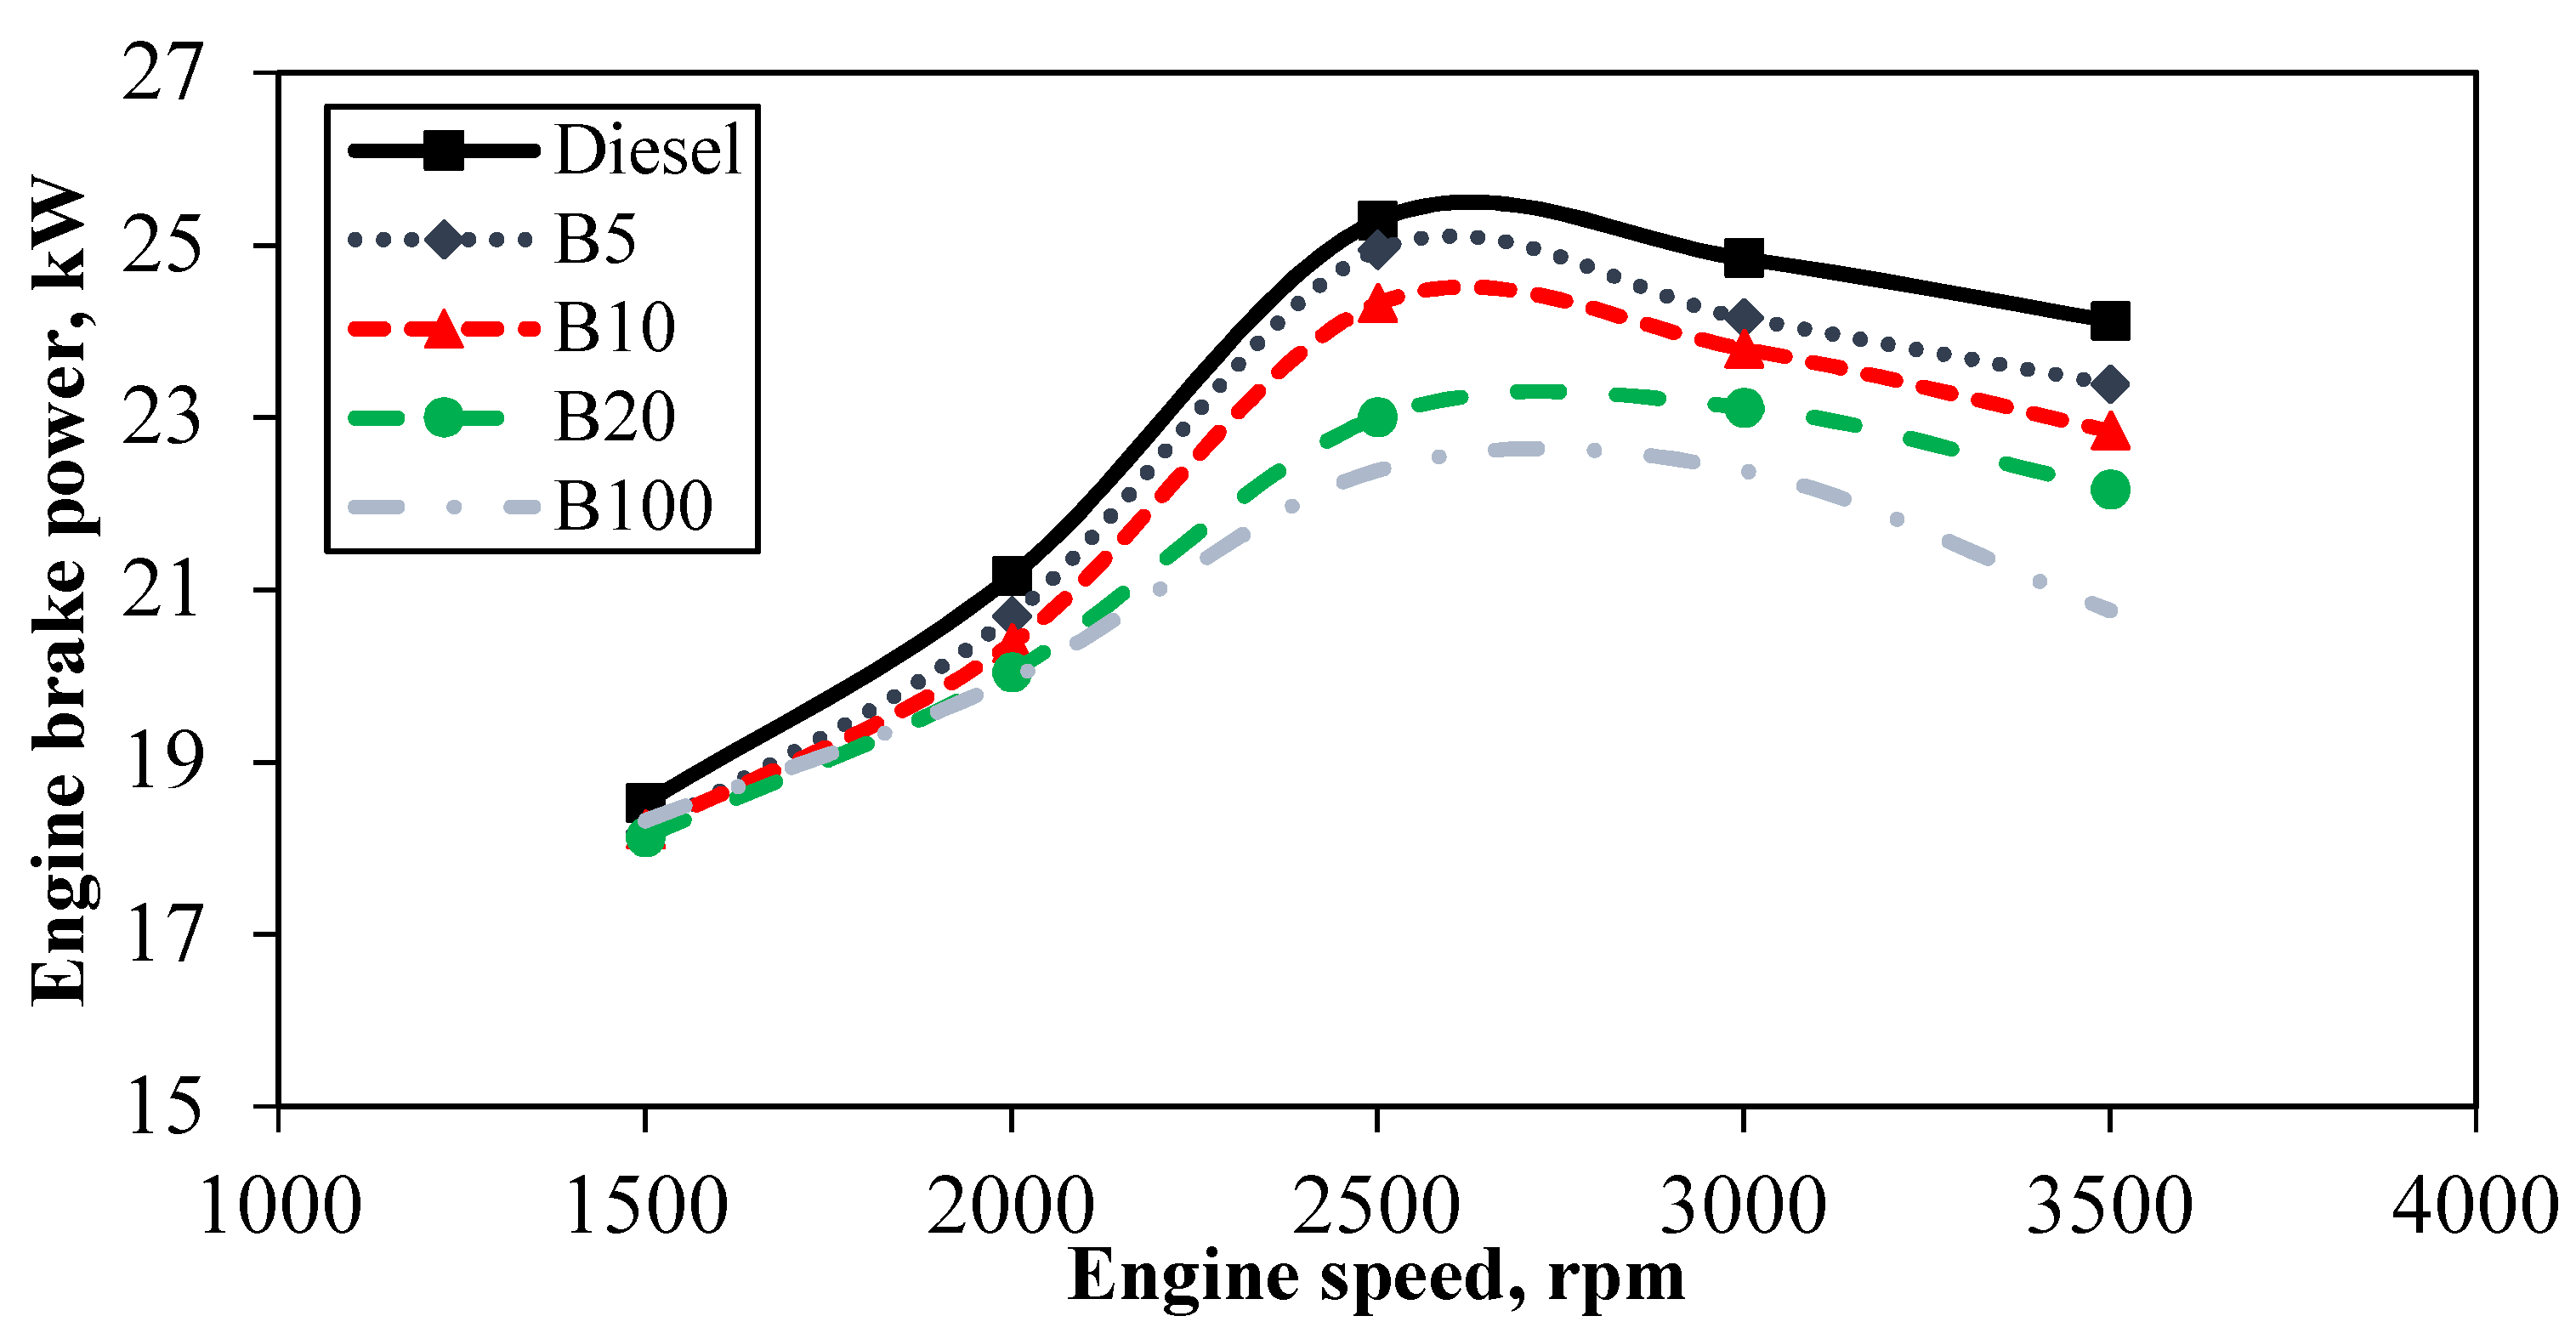
56]. Five types of fuel were used during the experiments: mineral diesel, B100, B5, B10, and B20. The engine was tested under the operating conditions of the first test. The maximum brake power produced by mineral diesel was observed at an engine speed of 2500 rpm. The effect of different blended fuels on brake power seems to be clear at a high blending ratio, which is higher than 11.5%, at 2500 rpm. This difference lies in the effect of the blending ratio on the engine power owing to the effect of two conflicting factors: the effect of blended fuel on reducing the fuel viscosity and the effect of blended fuel on reducing the fuel energy content. This difference was due to the higher viscosity (10.5%) and lower HV (17.1%) of B100 fuel compared to diesel fuel. The low viscosity at lower percentages of blended fuel will improve the blended fuel viscosity and, thus, enhance the droplet evaporation and improve the fuel combustion. The higher oxygen content in B100 leads to low peak brake power, which is in agreement with Sharon et al. [
44].
Figure 2 presents the engine brake power at increasing engine speeds under a half load for mineral diesel, B5, B10, B20, and B100. Generally, the results show that brake power increased with increasing speed for all tested fuels. The maximum brake power was achieved at roughly 2500 rpm. The brake power available at each speed depended on the torque generated by the engine at the corresponding speeds. Moreover, from the tested fuels, mineral diesel had the maximum brake power at all engine speeds. The brake torques obtained in this test ranged from 50.77 Nm to 117.9 Nm with corresponding speeds from 1500 to 3500 rpm. It can be seen clearly from the figure that mineral diesel has higher brake power compared to other test fuels with a maximum brake power of 25.28 kW at 2500 rpm. The performance of POME is observed to not surpass the performance generated by mineral diesel. However, the performance of B5, B10, B20, and B100 were comparable to the mineral diesel in terms of their thermal efficiencies, which were improved and shown to fuel the engine without any difficulty. This is concrete evidence that biodiesel fuel originating from organic sources can be a replacement for mineral diesel.
BSFC is described as the fuel flow rate per unit of power output. Most diesel engines have their own optimum speeds, which provide the minimal BSFC at the minimal usage. BSFC can also be used to measure engine efficiency through the usage of fuel. Moreover, BSFC is a key to evaluate engine performance using several fuels by calculating the brake power and mass flow rate of the fuel for each test speed. Generally, if the engine speed is higher or lower than the optimum speed, it will result in a larger BSFC because the initial engine speed requires more fuel to overcome the mechanical friction, whereas at higher engine speeds, the heat losses are greater, resulting in higher fuel consumption [
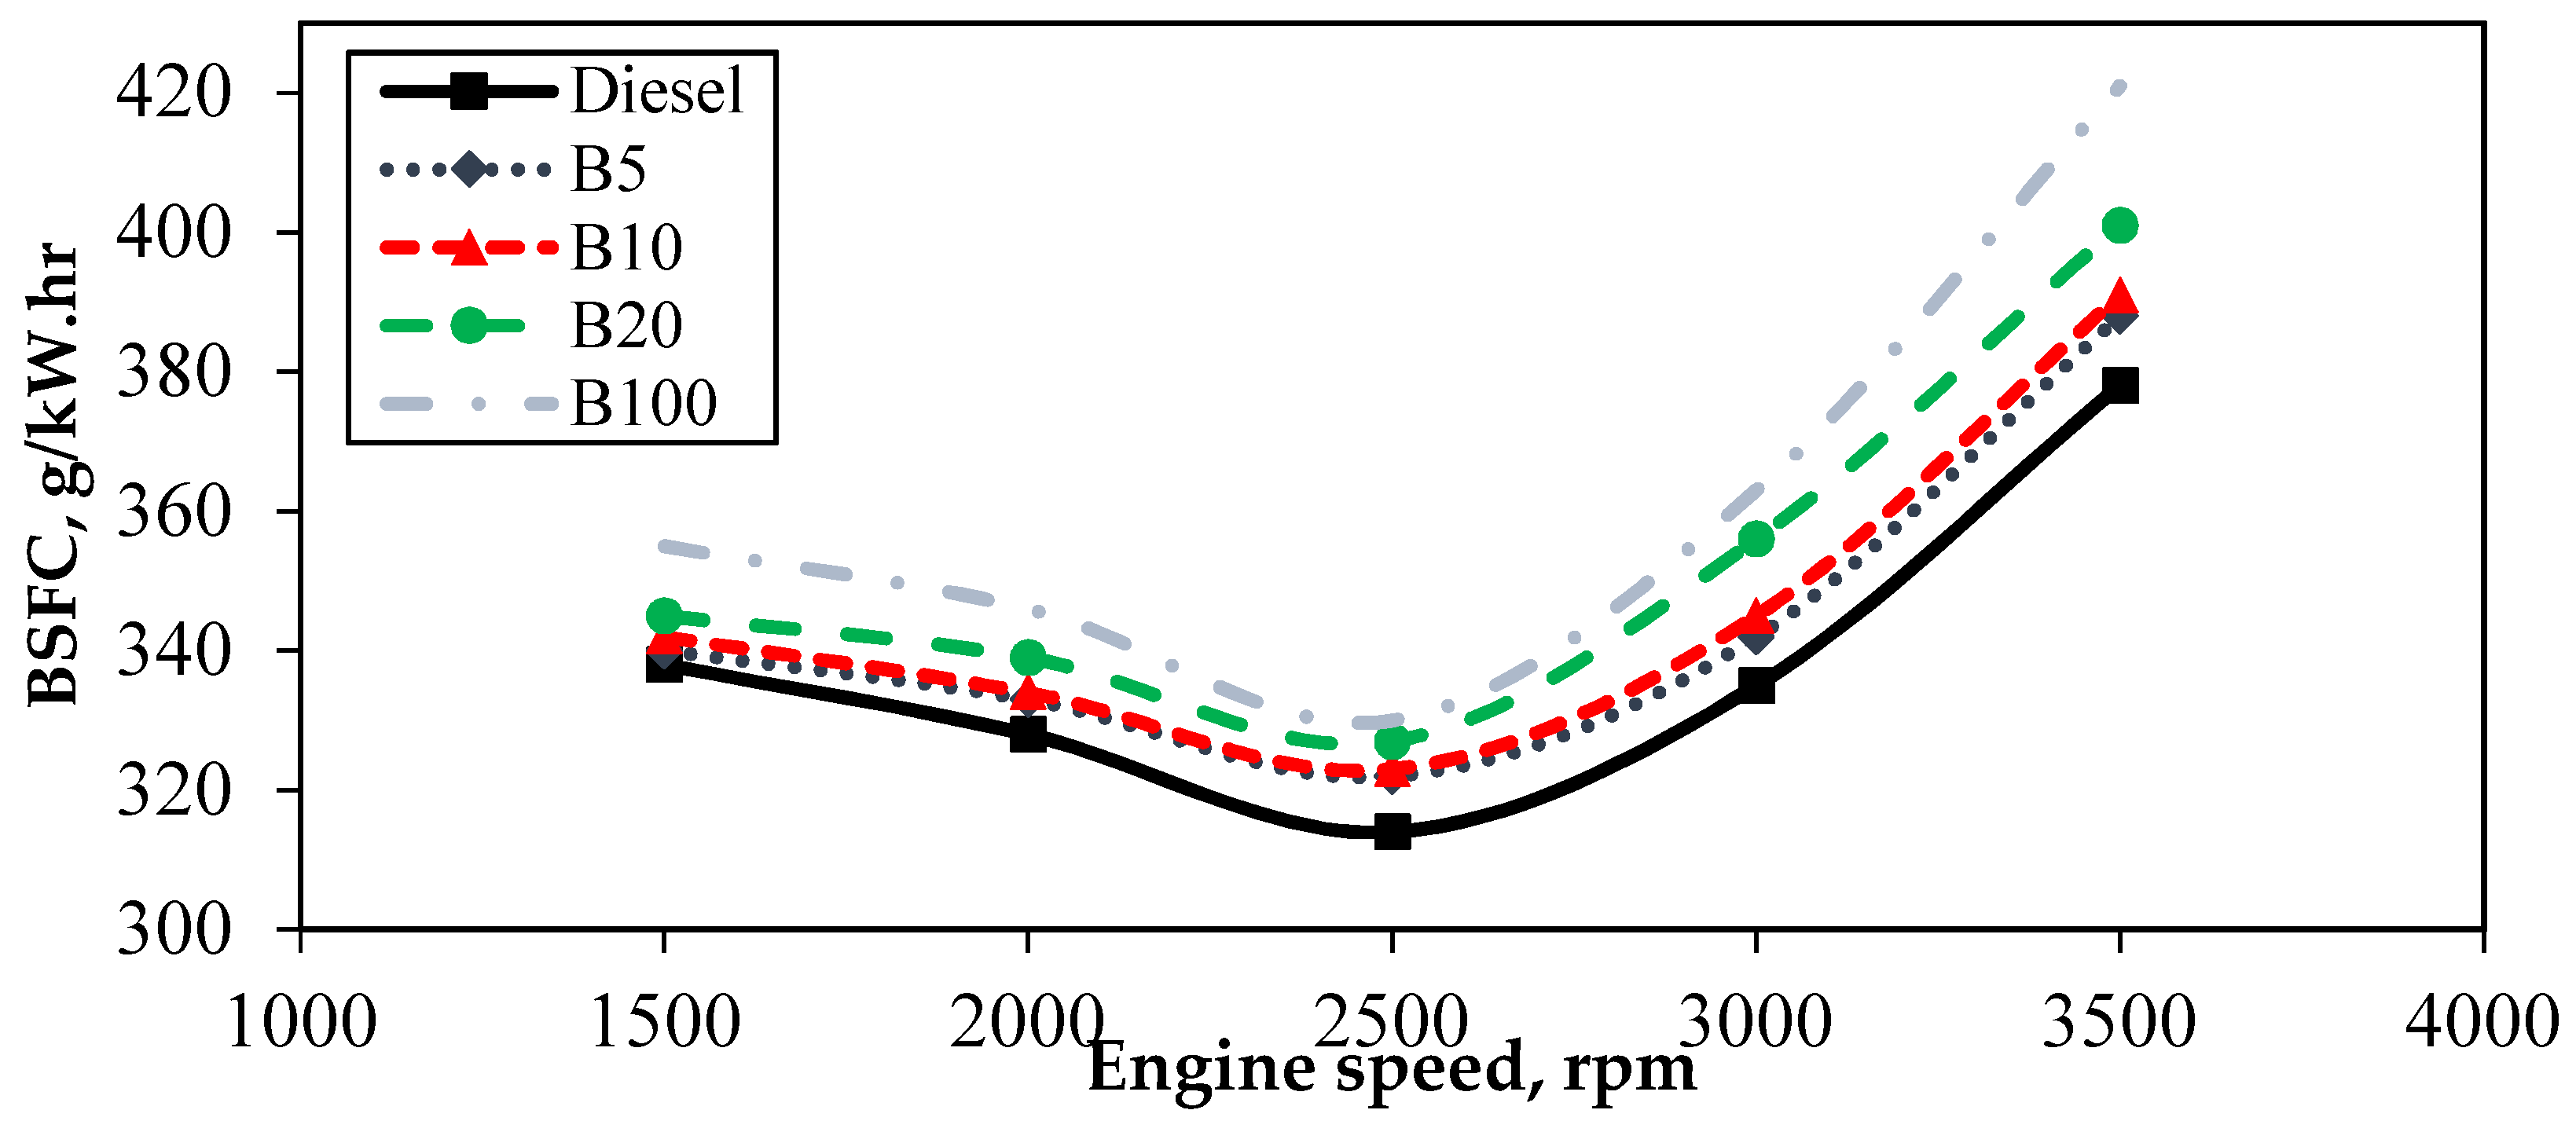
57]. From the results obtained, mineral diesel had the lowest BSFC over all engine speeds, which was observed at 2500 rpm. This is approximately 5.1% lower than B100 fuel at the same engine speed. This difference was due to higher the HV (20.5%) of mineral diesel fuel compared to B100. Thus, to maintain the brake power output, the BSFC of B100 must be increased in order to compensate for the lower energy content in the fuel.
The variations of BSFC are depicted in
Figure 3 for mineral diesel, B5, B10, B20, and B100 at zero engine loads. It shows that the BSFC for B5, B10, B20, and B100 are comparable, but slightly higher, than that of mineral diesel. The increase of BSFC is understandable because of the lower HVs of pure B100 compared to mineral diesel. Most studies have found that biodiesel with lower HVs powering light-duty and heavy-duty engines caused significant increases in BSFC [
58,
59]. Thus, more fuel must be injected to attain a comparable power output to mineral diesel when operating with biodiesel fuels and their lower HVs. It is clearly observed that HV and the engine speed play a significant role in the increase or decrease of BSFC.
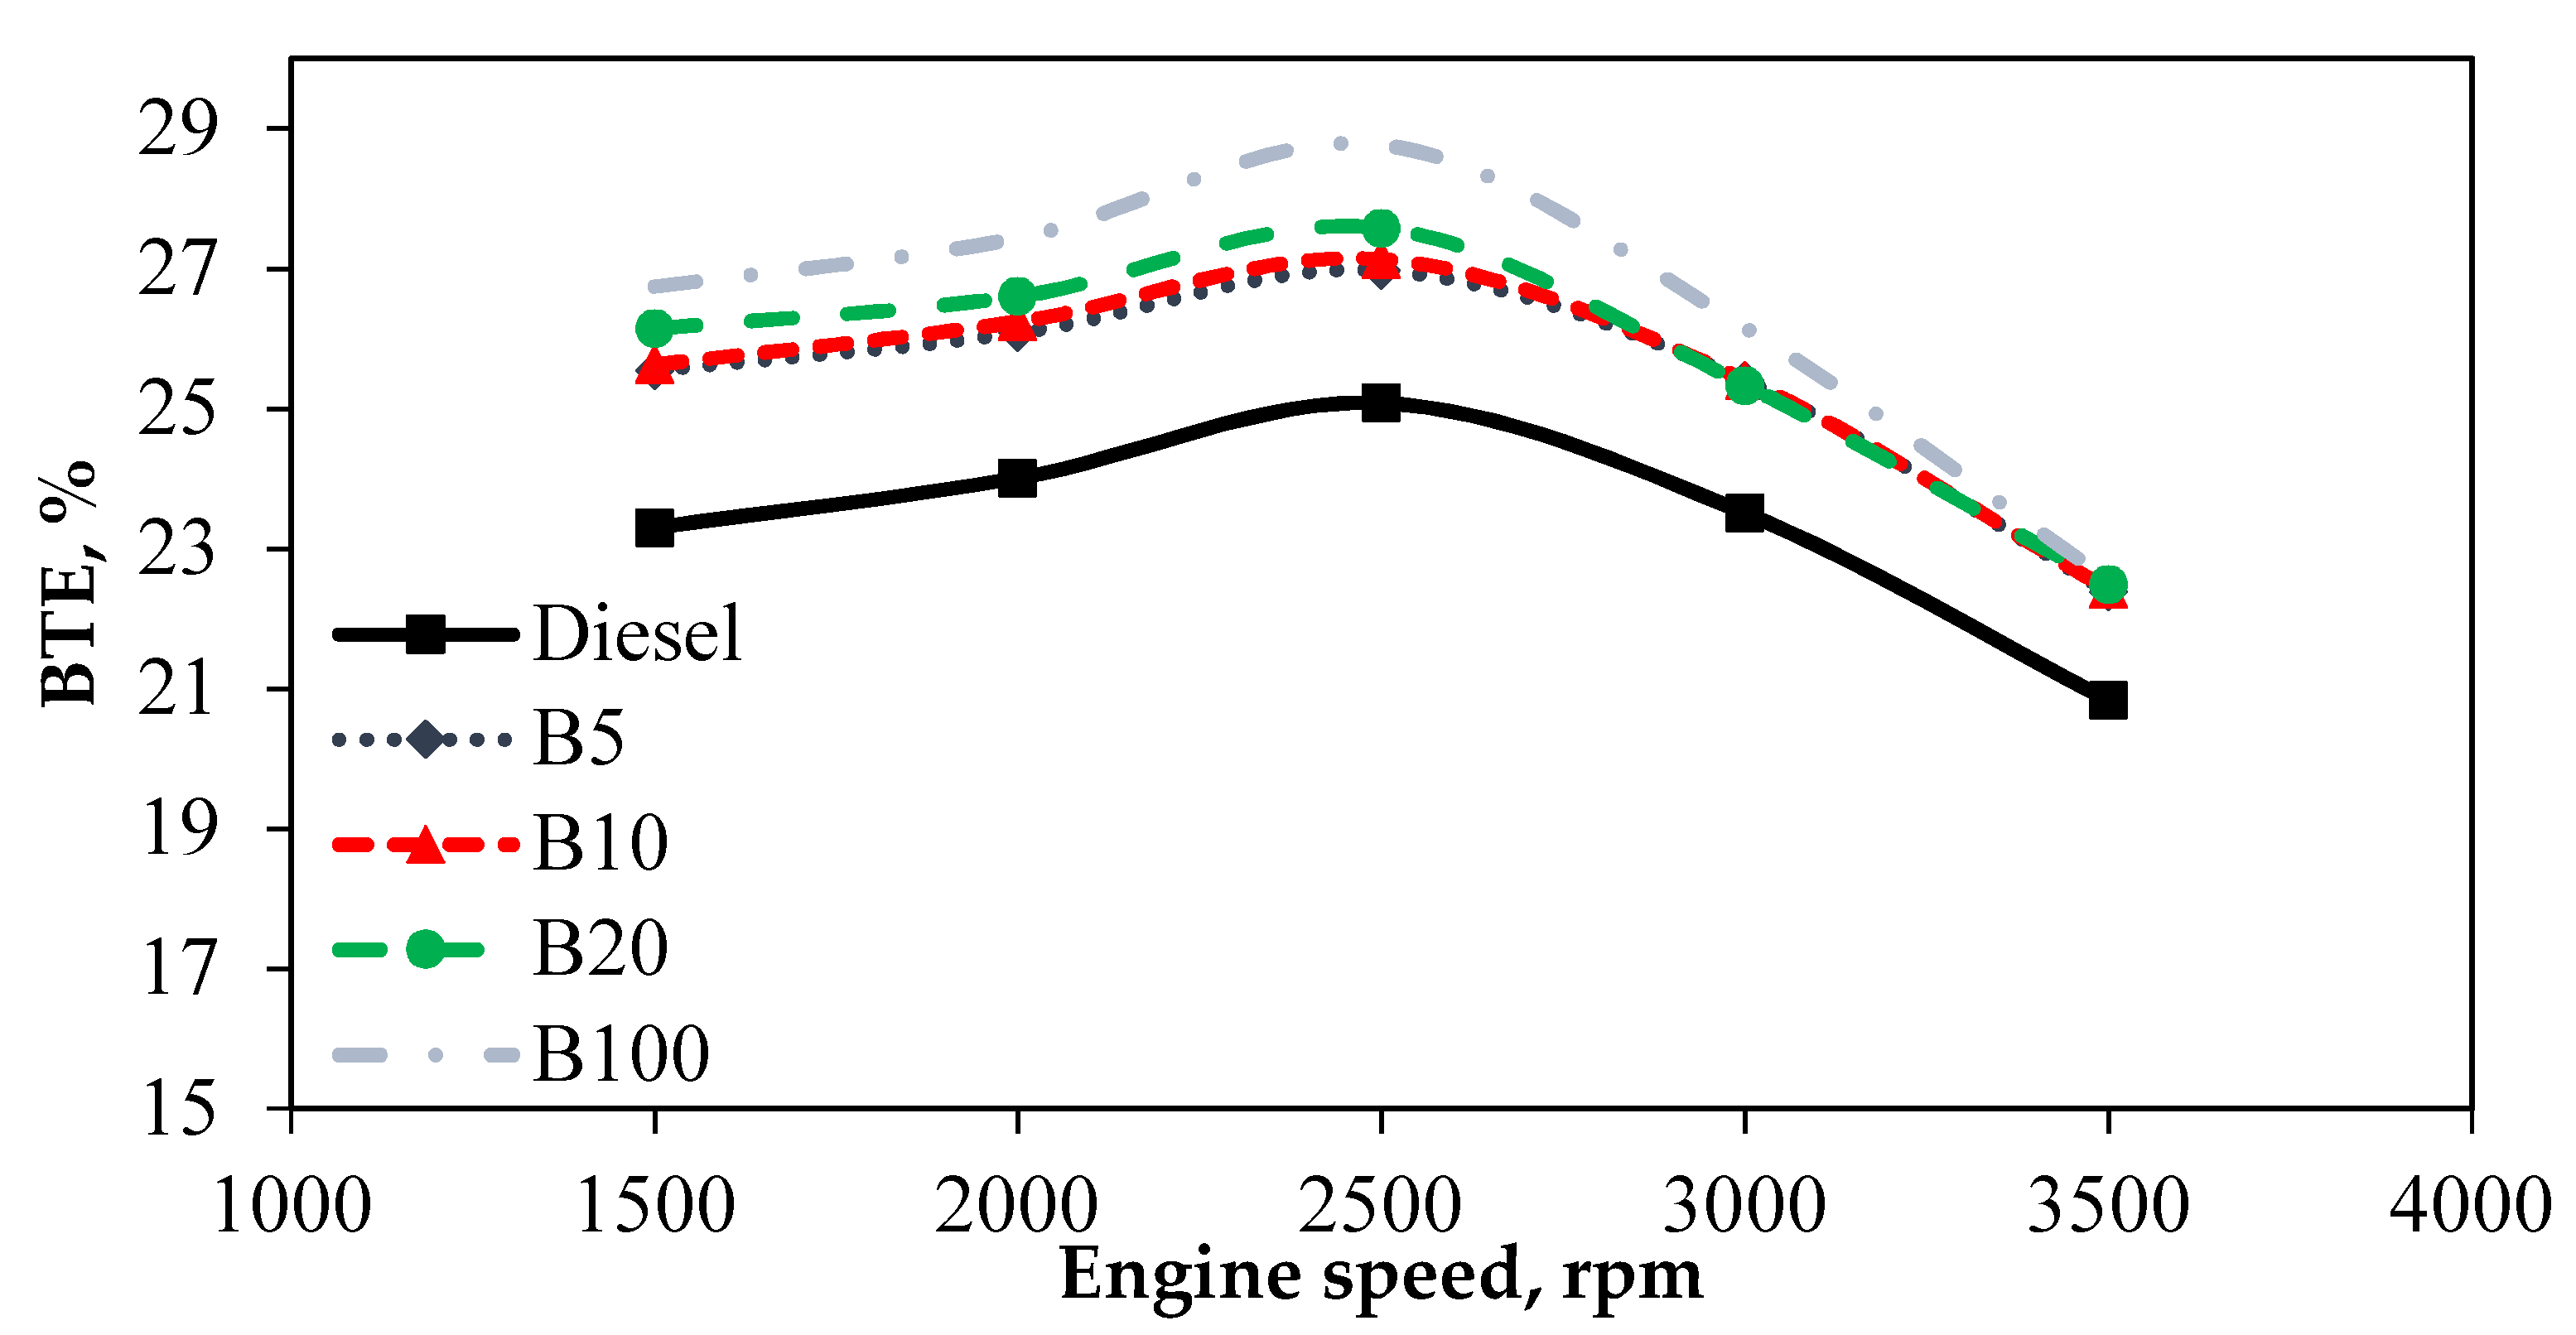
Brake thermal efficiency (BTE) is an indicator of how well an engine operates with the test fuels. Thus, different BTEs affect the ratio of thermal power inside the fuel to the power the engine delivers to the crankshaft. Different properties in test fuels have a significant effect on the BTE of the engine and, thus, lead to better combustion and lower emissions. Since fuel HV is used in thermal efficiency, it depends on how the energy is converted. BTE calculations are determined based on the calculated brake power and measured energy content at a certain speed with a tested fuel. Generally, as engine speed increases to 2500 rpm, BTE increases. In the tested fuels, the BTE of B100 was 12.79% higher than that of mineral diesel fuel at 2500 rpm. The high oxygen content of B100 compared to mineral diesel enhances the combustion process. A previous study found that increasing the biodiesel in fuel blends improved the BTE in diesel engines [
32]. However, by increasing the engine speed higher than 2500 rpm, the BTE decreased for all tested fuels. This was due to insufficient air, which caused incomplete combustion [
32].
Figure 4 presents the variation of BTE. BTE is an indicator of how well an engine operates with the test fuels. Thus, different BTEs affect the ratio of thermal power inside the fuel to the power the engine delivers to the crankshaft. Different properties in test fuels have a significant effect on the BTE of the engine and, thus, lead to better combustion and lower emissions. Since fuel HV is used in thermal efficiency, it depends on how the energy is converted. BTE calculations are determined based on the calculated brake power and measured energy content at a certain speed with a tested fuel. Generally, as engine speed increases to 2500 rpm, BTE increases. Increasing engine speeds increase the BTE up to 2500 rpm but decrease the BTE beyond 2500 rpm. Mineral diesel has a lower BTE, owing to its lower combustion efficiency. More oxygenated fuels—including B5, B10, B20, and B100—had better BTE than mineral diesel in all test modes at engine speeds up to 3500 rpm. From the graph, B5 exhibited comparable BTE results to B10 for all tested engine speeds. The variation of BTE is understood to be caused by the oxygenation of B100 and other blends, which improves the combustion in the engine and increases the BTE significantly. Moreover, the use of biodiesel fuel helps extend the ignition delay, which causes a larger amount of fuel to be burned in the premixed mode, which could increase the BTE. Furthermore, the performance of B5, B10, and B20 was comparable to B100, thus proving that biodiesel can improve the BTE of diesel engines without any engine modifications.
3.3. Experimental Analysis of Fuel Combustion
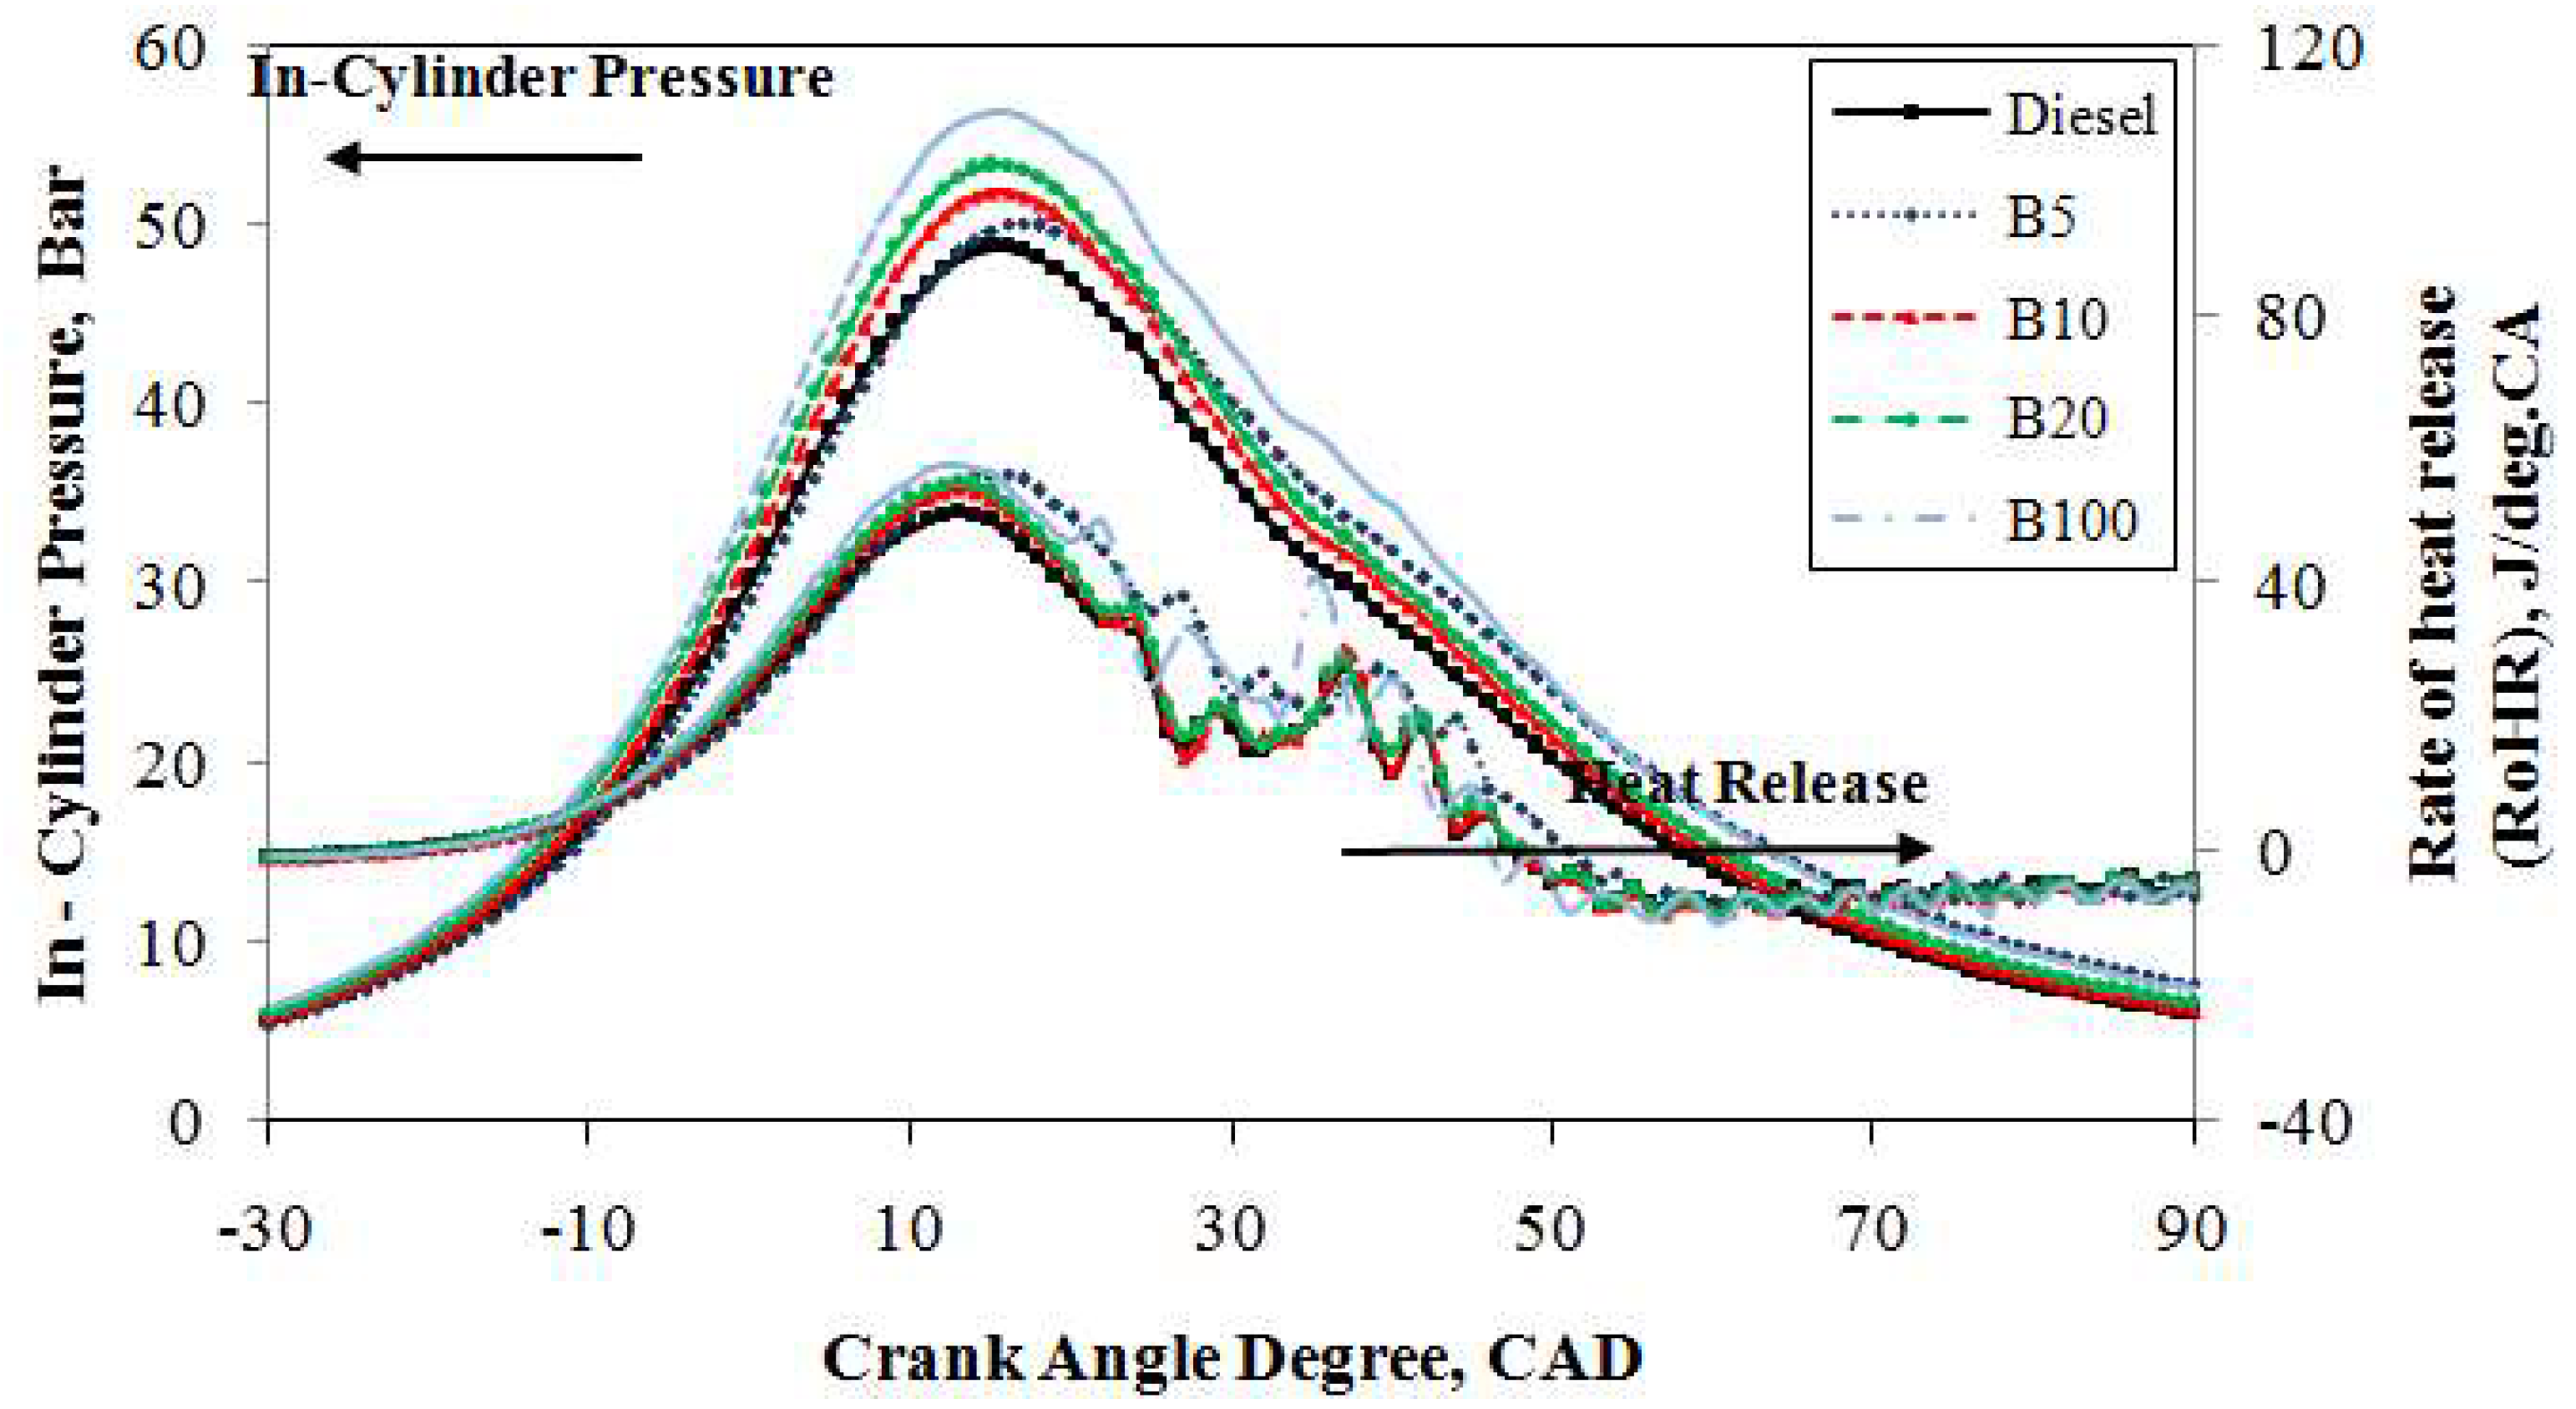
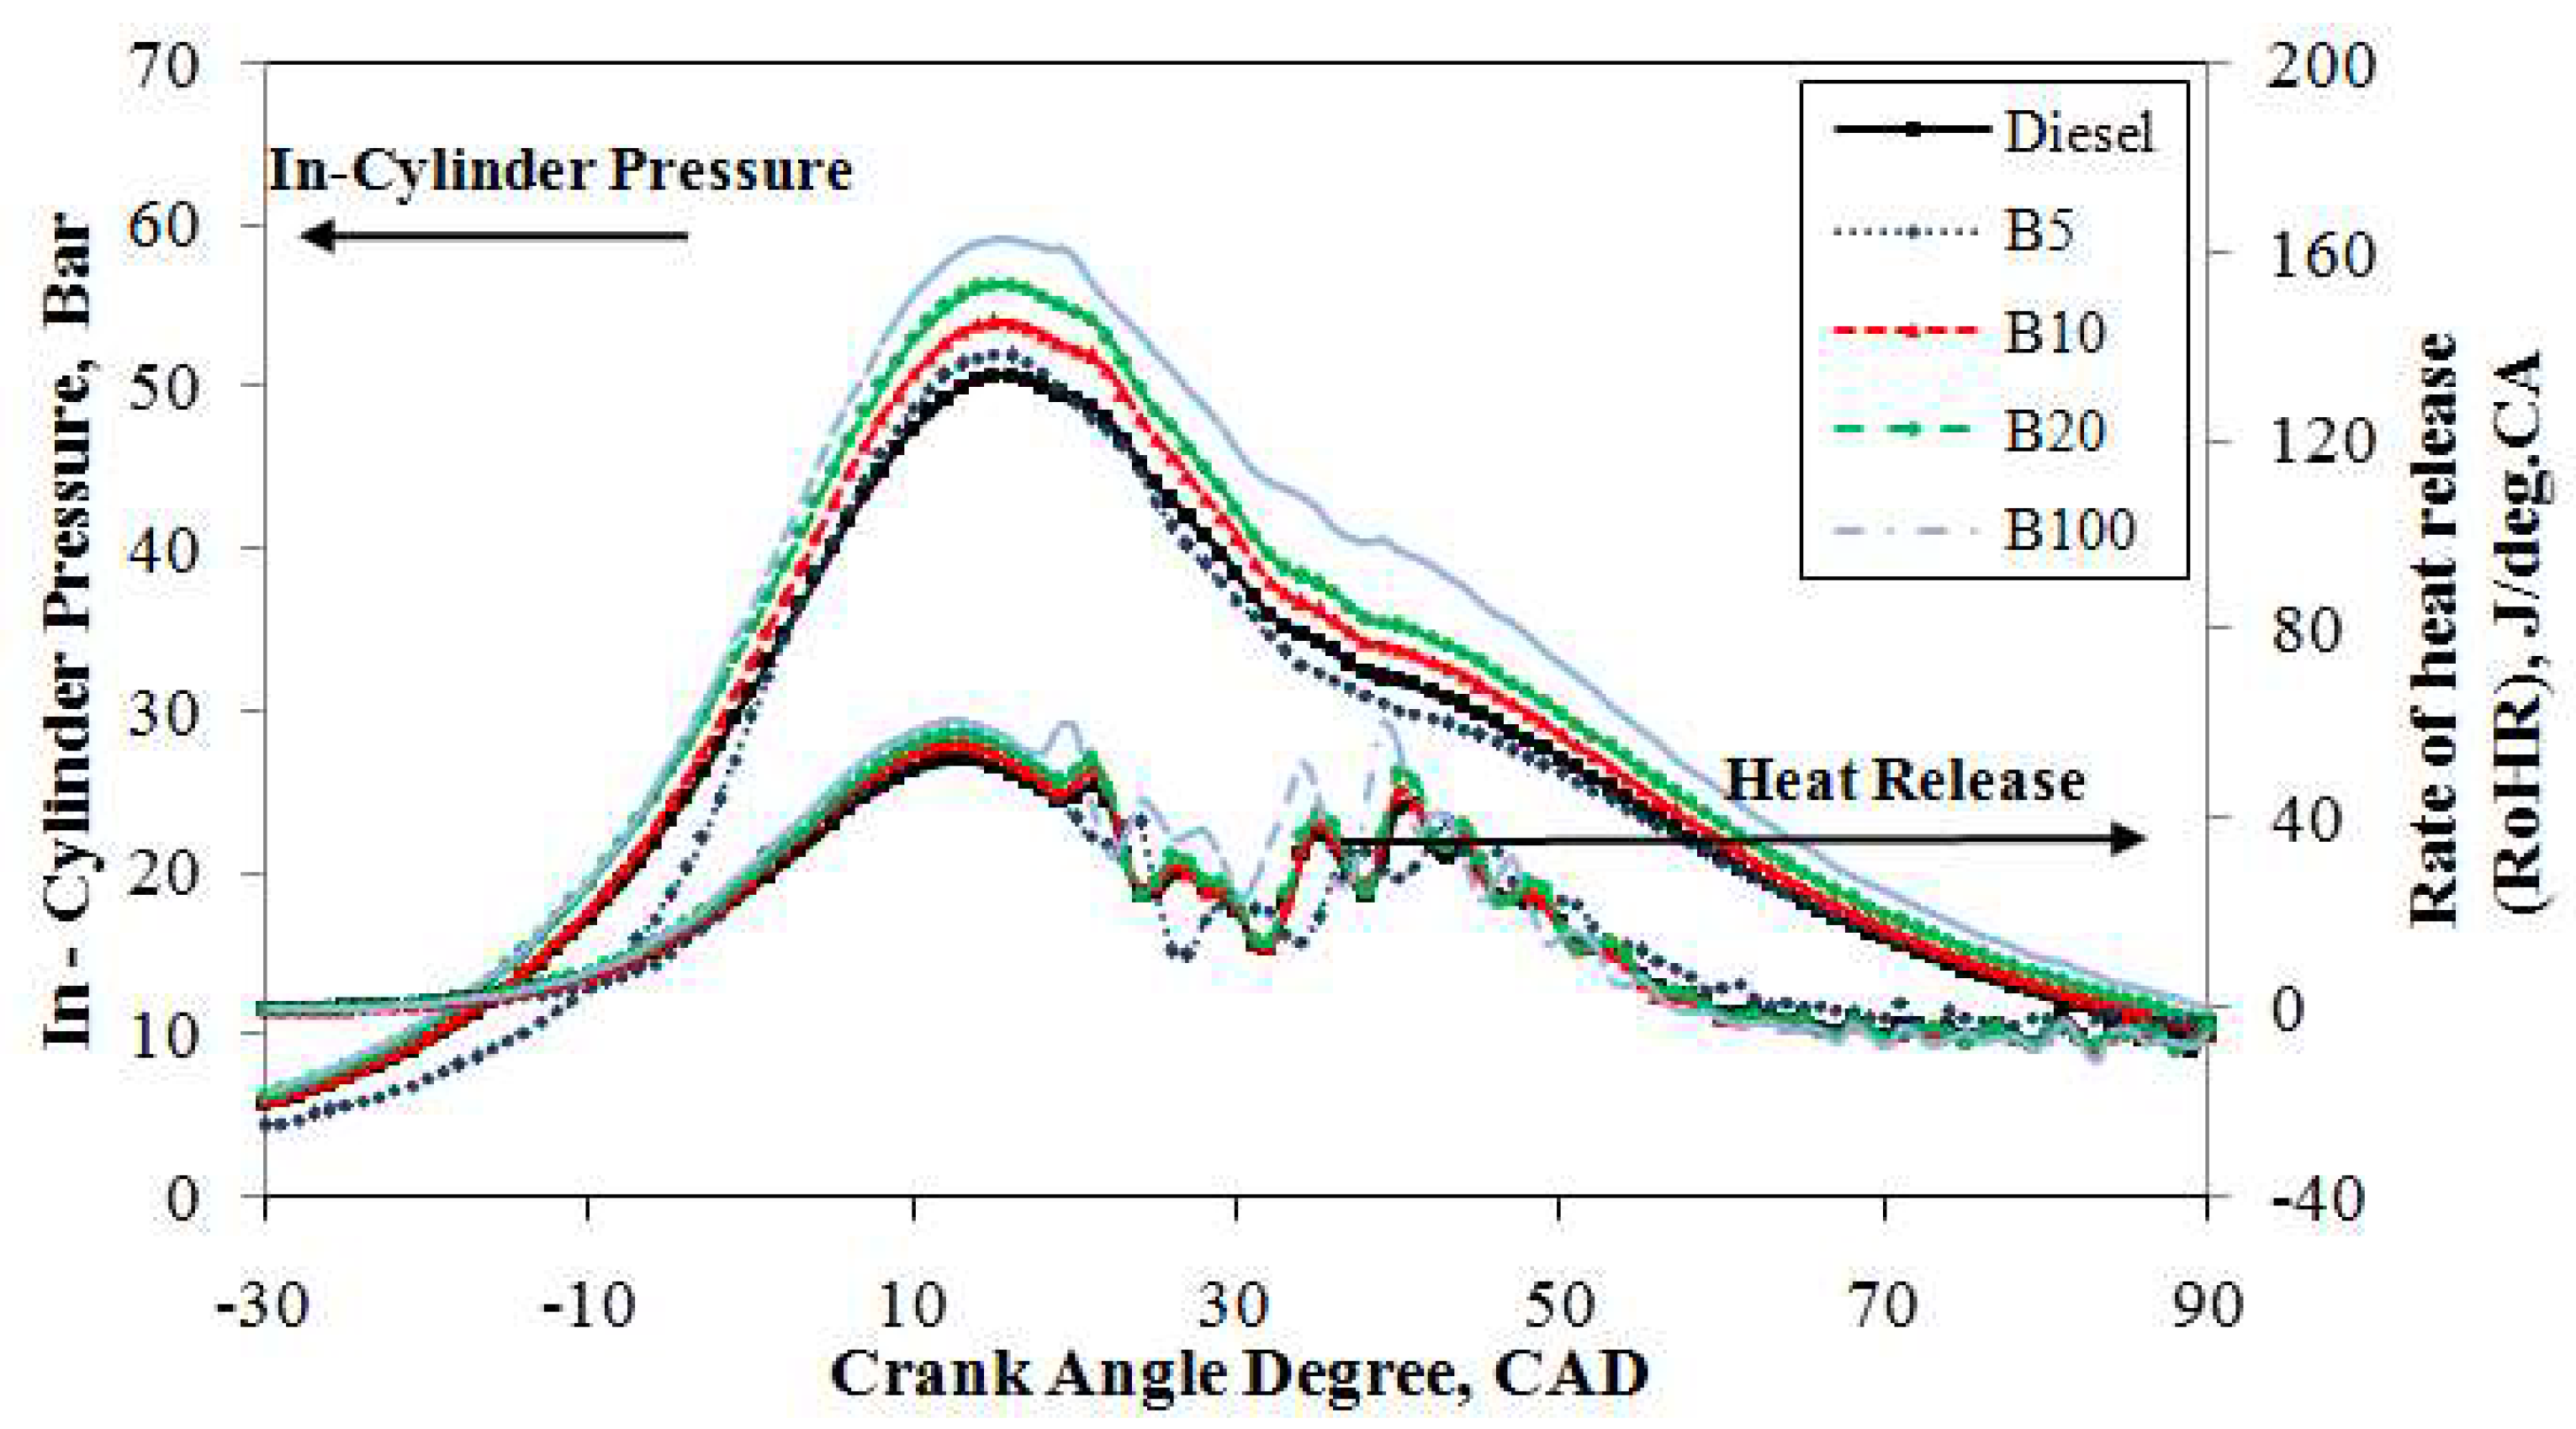
Figure 5 depicts the traces of the in-cylinder pressure curves averaged from 1000 consecutive cycles of mineral diesel, B5, B10, B20, and B100 against the crank angle with an engine load of 20% at 2500 rpm. Under the same engine operating conditions, it is obvious that the in-cylinder pressure traces are identical for the compression and expansion strokes. However, in the combustion stroke, it is slightly different. It can be seen from the figure that, under the same operating conditions, the peak in-cylinder pressure of mineral diesel reached 48.7 bar at 15° ATDC whereas B100 achieved 56.3 bar at 15° ATDC. Thus, the increase of peak pressure is due to the high oxygen content and CN in B100 fuel; the peak pressure was approximately 13.5% higher than that of mineral diesel fuel. A higher CN generally results in a shorter ignition delay. The shorter ignition delay of the B100 fuel results in a higher premixed peak pressure. Moreover, an increase in fuel viscosity, specifically for petroleum-derived fuels, results in poor atomization, slower mixing, reduced cone, and increased penetration angle. These phenomena lead to longer ignition delays. However, biodiesel is not derived from crude petroleum, and the opposite trend is seen in the case of biodiesel and its blends [
43]. These results are consistent with previous studies [
44,
45]. The peak in-cylinder pressure curves of B5, B10, and B20 blends are comparable to those of mineral diesel. Moreover, the enriched oxygen content in the fuels increases the pressure as well as the cylinder temperature after the combustion and along the expansion stroke.
The first law of thermodynamics was applied to the closed part of the engine cycle to compute the net rate of heat release figures from the measured in-cylinder pressure. Heat release refers to the amount of heat needed to be added to the cylinder in order to produce the pressure variation. The net rate of heat release is used to characterize the combustion for the used engine. Heat release analysis computes the heat that must be added to the cylinder contents in order to produce the observed pressure variations. The value of heat release is useful to investigate the combustion characteristics of diesel engines and as an indicator of the fuel usage. This related considerably to the sensible enthalpy corresponding per unit time resulting from the conversion of the chemical energy of a fuel to heat in a combustion duration. The start of combustion (SOC) is defined as the start of the heat release, and the end of combustion (EOC) is defined as at the degree of crank angle at which the heat release rate exceeds 95% of the total heat release [
60]. The time interval from the SOC to the EOC along the crank angle degrees can be defined as the combustion duration. The basis of the heat release rate calculation was found by Krieger and Borman [
61]. Extended work on the calculation of heat release rates has being investigated by many researchers. Since fuel vaporization begins during the ignition delay, a negative heat release rate is observed at the beginning, before the start of combustion, at which point the heat release rate becomes positive. The ignition time is the beginning of the heat release during combustion. The time interval from the beginning of the heat release to the end of the heat release can be called the total combustion duration.
The averaged heat release rate over 1000 consecutive cycles for the test fuels are compared in
Figure 5 under an engine load of 20% at 2500 rpm. It can be seen that under the same operating conditions, the heat release rates for the test fuels are identical during the compression and expansion strokes. The combustion process consists of a premixed combustion phase followed by a diffusion combustion phase. In the diffusion combustion phase, there is a significant difference in the rate of heat release. It can be found that the rate of heat release in the diffusion combustion phase increased from 50.4 J/deg.CA at 13° ATDC for mineral diesel fuel to 57.6 J/deg.CA at 12° ATDC for B100 fuel owing to the higher oxygen content of B100 fuel [
44]. However, B10 and B20 exhibit the maximum heat release rate of 53.9 J/deg.CA at 13° ATDC and 55.0 J/deg.CA at the same ATDC angle. For B5 blended fuel, the rate of heat release increases and reaches 52.2 J/deg.CA at 16° ATDC, which is farther away from TDC compared to mineral diesel. This is because the higher oxygen content has improved the diffusion combustion phase and decreased the combustion duration.
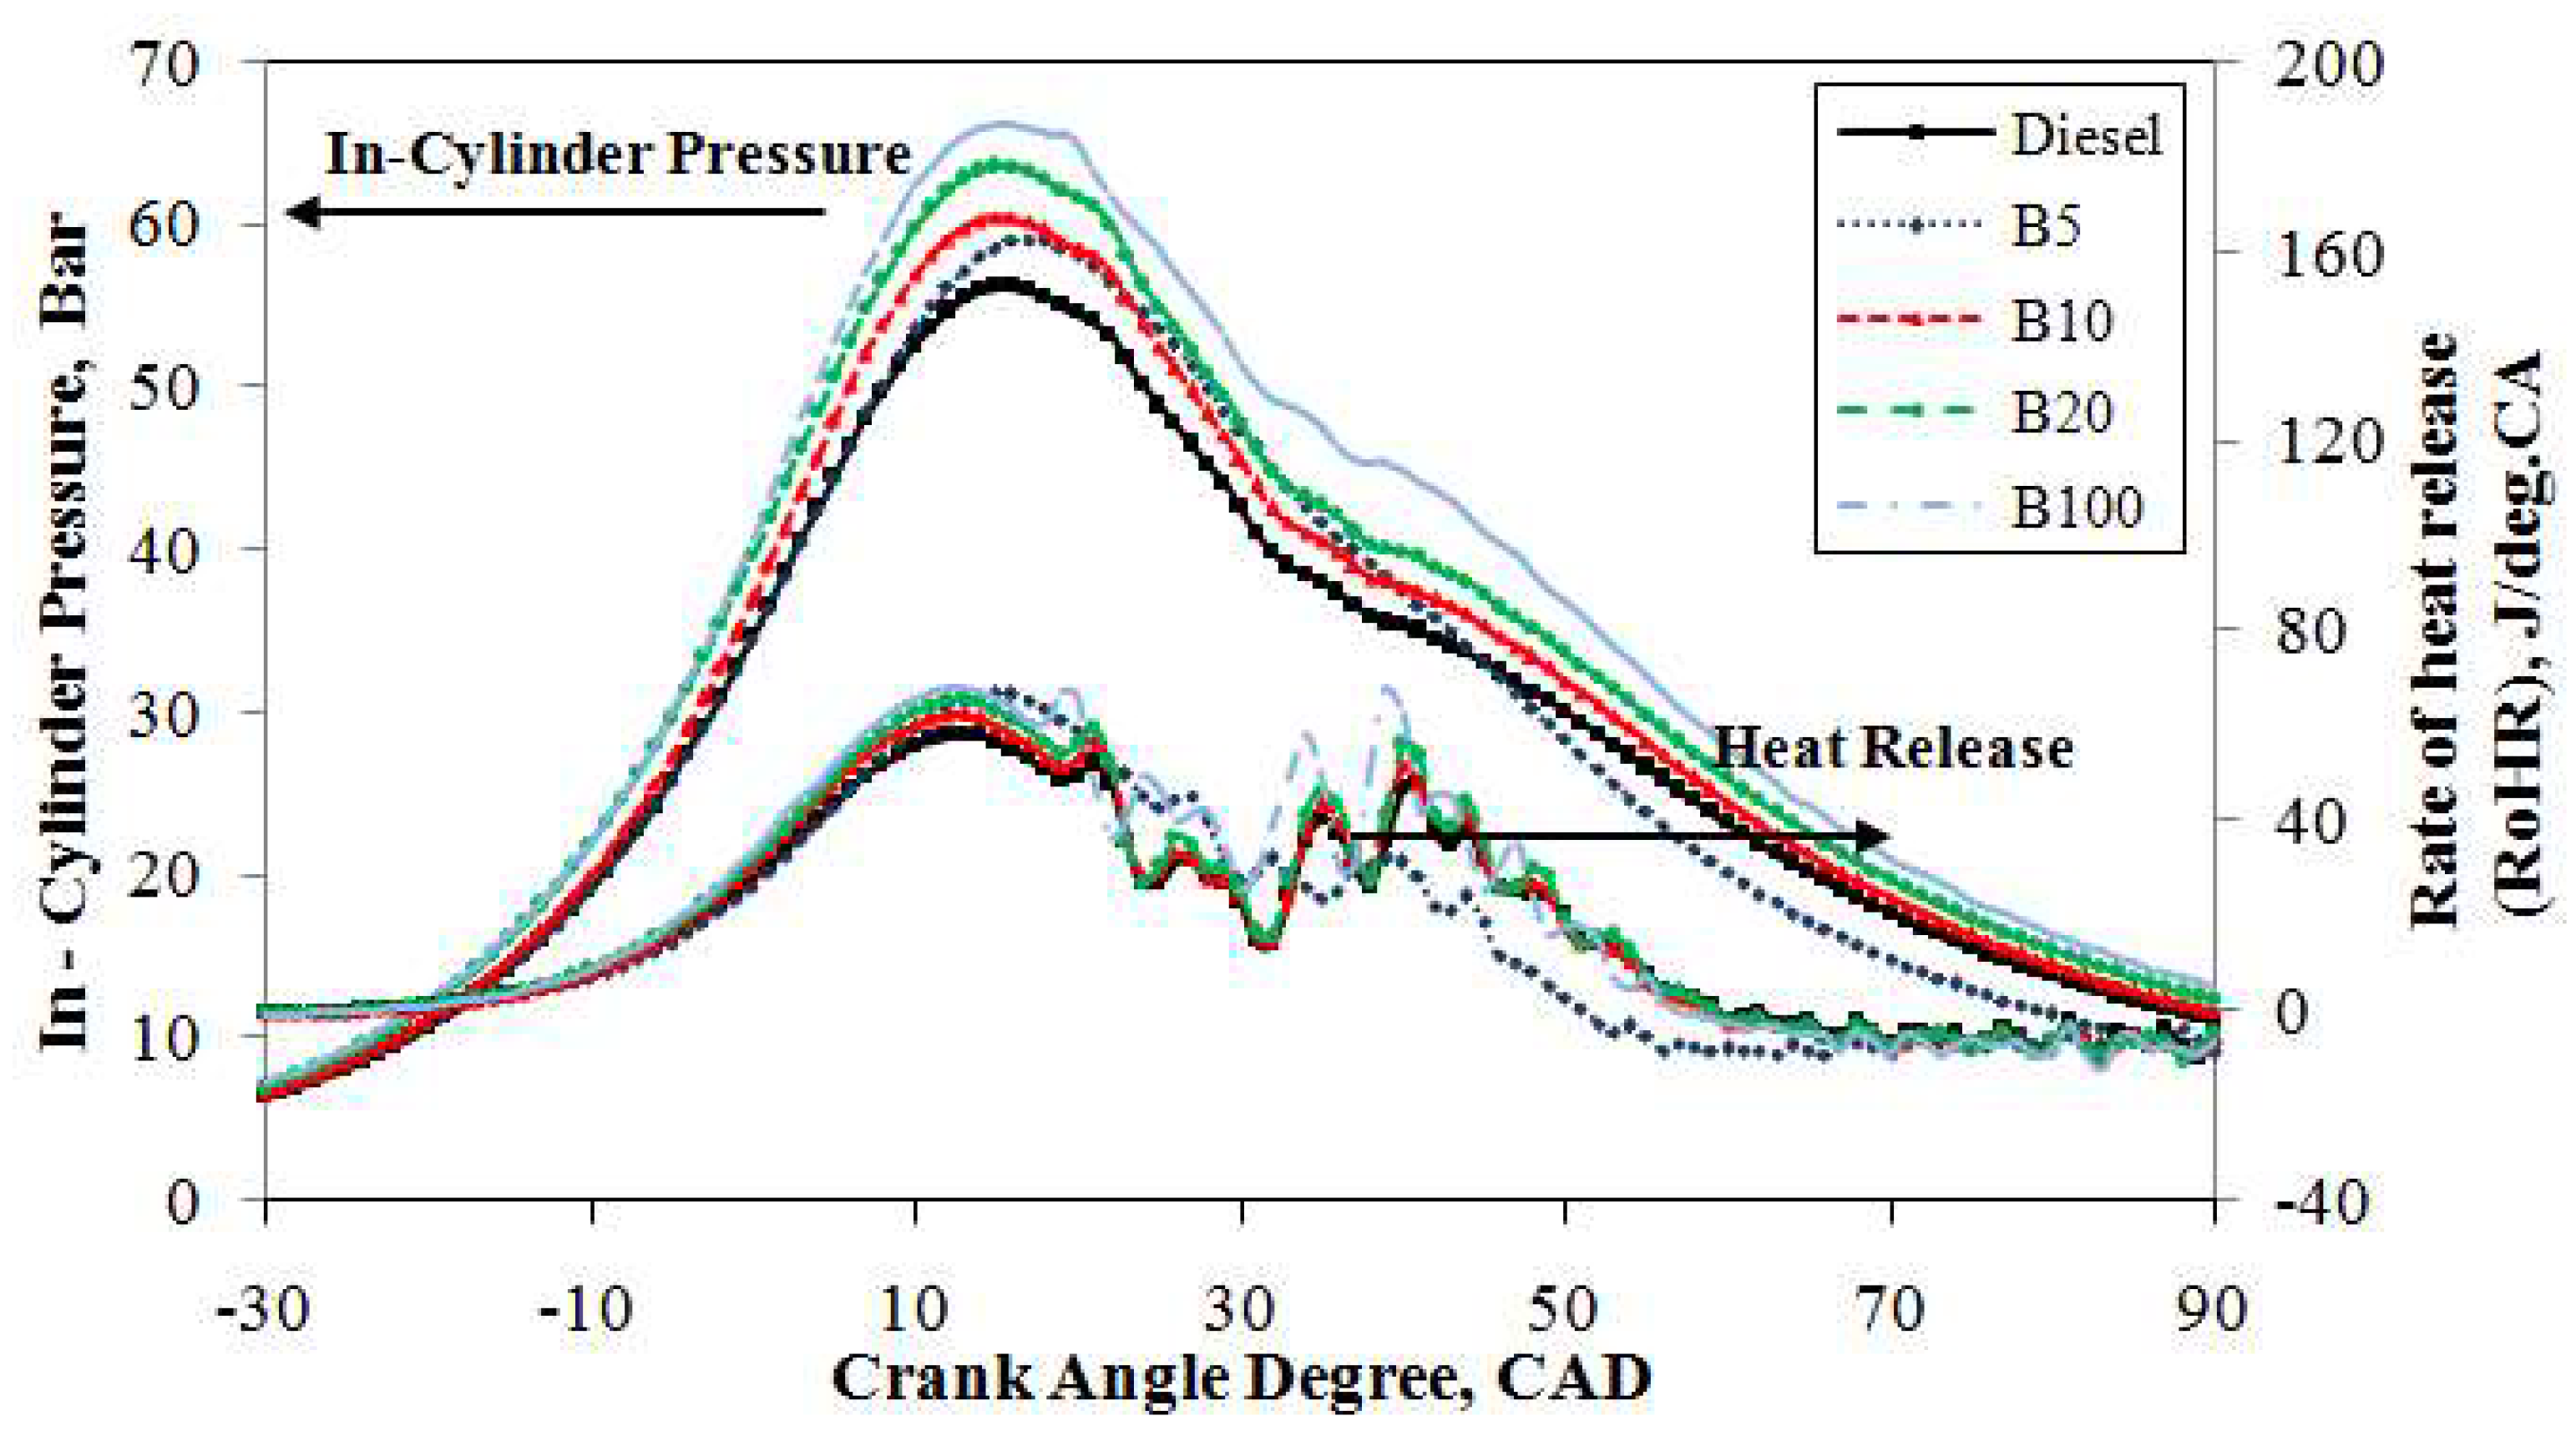
The averaged in-cylinder pressure trace curves over 1000 consecutive cycles for the test fuels are compared in
Figure 6 at a constant speed of 2500 rpm under an engine load of 40%. The in-cylinder pressure traces are identical for the compression and expansion strokes. However, in the combustion stroke, it is slightly different. The peak in-cylinder pressure increased as the engine load increased for all tested fuels. It can be seen clearly from the figure that mineral diesel and B100 reached their maximum cylinder pressures at 15° ATDC with 50.5 bar and 59.0 bar, respectively, a difference of 14.4%. An improvement in complete combustion was achieved by the higher oxygen content in B100 compared to that of mineral diesel. Moreover, the peak pressure increased compared to the diesel fuel at 15° ATDC for all blended fuels. Furthermore, the peak pressures of B5, B10, and B20 were 2.7%, 6.3%, and 10.1%, respectively, higher than that of mineral diesel fuel. This shows that the presence of biodiesel with the mineral diesel helps increase the maximum cylinder pressure during combustion and increases the power stroke significantly.
The rate of heat release against the crank angle for all test fuels under an engine load of 40% is presented in
Figure 6. It can be seen from the figure that there is a significant increase in the rate of heat release for the test fuels when the engine load changes from 20% to 40%. The maximum rate of heat release for B100 is 60.5 J/deg.CA at 13° ATDC, which is higher than that of the other test fuels. The heat release rate of mineral diesel under the same operating conditions was 50.9 J/deg.CA at 15° ATDC. However, there was a significant ignition delay and a shorter combustion duration for B100 compared to mineral diesel. This is because, with a higher density and viscosity, B100 fuel vaporizes more slowly compared to mineral diesel, resulting in less air-fuel mixture for the combustion. Moreover, a 7.3%, 5.7%, and 9.8% increase in the maximum rate of heat release for B5, B10, and B20, respectively, under a medium engine load compared to mineral diesel fuel is reasonable. This is because an increase in engine load results in increased cylinder pressure. Compared to mineral diesel, there is a significant influence by the maximum heat release rate of B100 fuel on the cylinder pressure.
Figure 7 demonstrates the in-cylinder pressure trace curves of the diesel engine corresponding to the crank angle operated with mineral diesel, B5, B10, B20, and B100 at 2500 rpm under an engine load of 60%. It is observed that the in-cylinder pressure traces are identical in the compression and expansion strokes. However, in the combustion stroke, it is slightly different. The maximum peak in-cylinder pressure for B100 is observed to reach 66.1 bar at 15° ATDC whereas for the mineral diesel the peak in-cylinder pressure reaches 56.1 bar at 15 CAD, which is 15.1% lower compared to the B100 fuel. For B5, B10, and B20, the test fuels reached the maximum cylinder pressures of 59.0 bar, 60.4 bar, and 63.5 bar at 18° ATDC, 15° ATDC, and 15° ATDC, respectively. It can be concluded that biodiesel blends cause a significant increase in maximum cylinder pressure. An increase in the cylinder pressure curve results in an increase in the cylinder temperature. These results prove that B100—or biodiesel fuel with a high oxygen content similar to other biodiesel blends compared to mineral diesel—results in complete burning of air-mixed fuel in the cylinder and increases the maximum cylinder pressure [
45]. It can be concluded from the overall results that there is an increase in the maximum cylinder pressure with an increase in engine load at 20%, 40%, and 60%. Furthermore, B100 produces a higher maximum cylinder pressure curve compared to other test fuels with an increase in engine load. Moreover, the biodiesel-diesel blend fuels B5, B10, and B20 exhibit higher maximum cylinder pressure compared to mineral diesel with an increase in engine load. Higher oxygen content in the biodiesel is among the major factors that contribute to the increase in maximum cylinder pressure [
44].
Figure 7 illustrates the averaged maximum rate of heat release over 1000 cycles relative to the crank angle for mineral diesel, B5, B10, B20, and B100 at a high engine load of 60% with a constant engine speed of 2500 rpm. It can be seen that the increase in engine load increases the rate of heat release for all test fuels. With regard to B100, the maximum rate of heat release is 67.7 J/deg.CA at 12° ATDC, and the diffusion combustion phase is higher than that of mineral diesel, which is 58.1 J/deg.CA at 13° ATDC, owing to the increases in the reaction zone pressure, as well as temperature. Compared to mineral diesel, B100 achieves an earlier start of the combustion and shorter combustion duration owing to its oxygen content, which burns rapidly during combustion. The increase in rate of heat release for B5, B10, B20, and B100 under a high engine load is understandable given their higher oxygen content. Therefore, the start of combustion is delayed, which causes more fuel to be combusted, resulting in a higher maximum cylinder temperature. It can be concluded from the results that the maximum rate of heat release for the test fuels increases with the increase in engine load. Moreover, the diffusion combustion phase for mineral diesel is longer than that of B5, B10, B20, and B100. This is because the higher CN for biodiesel results in a decreased ignition delay and higher fuel consumption for combustion after the start of ignition.
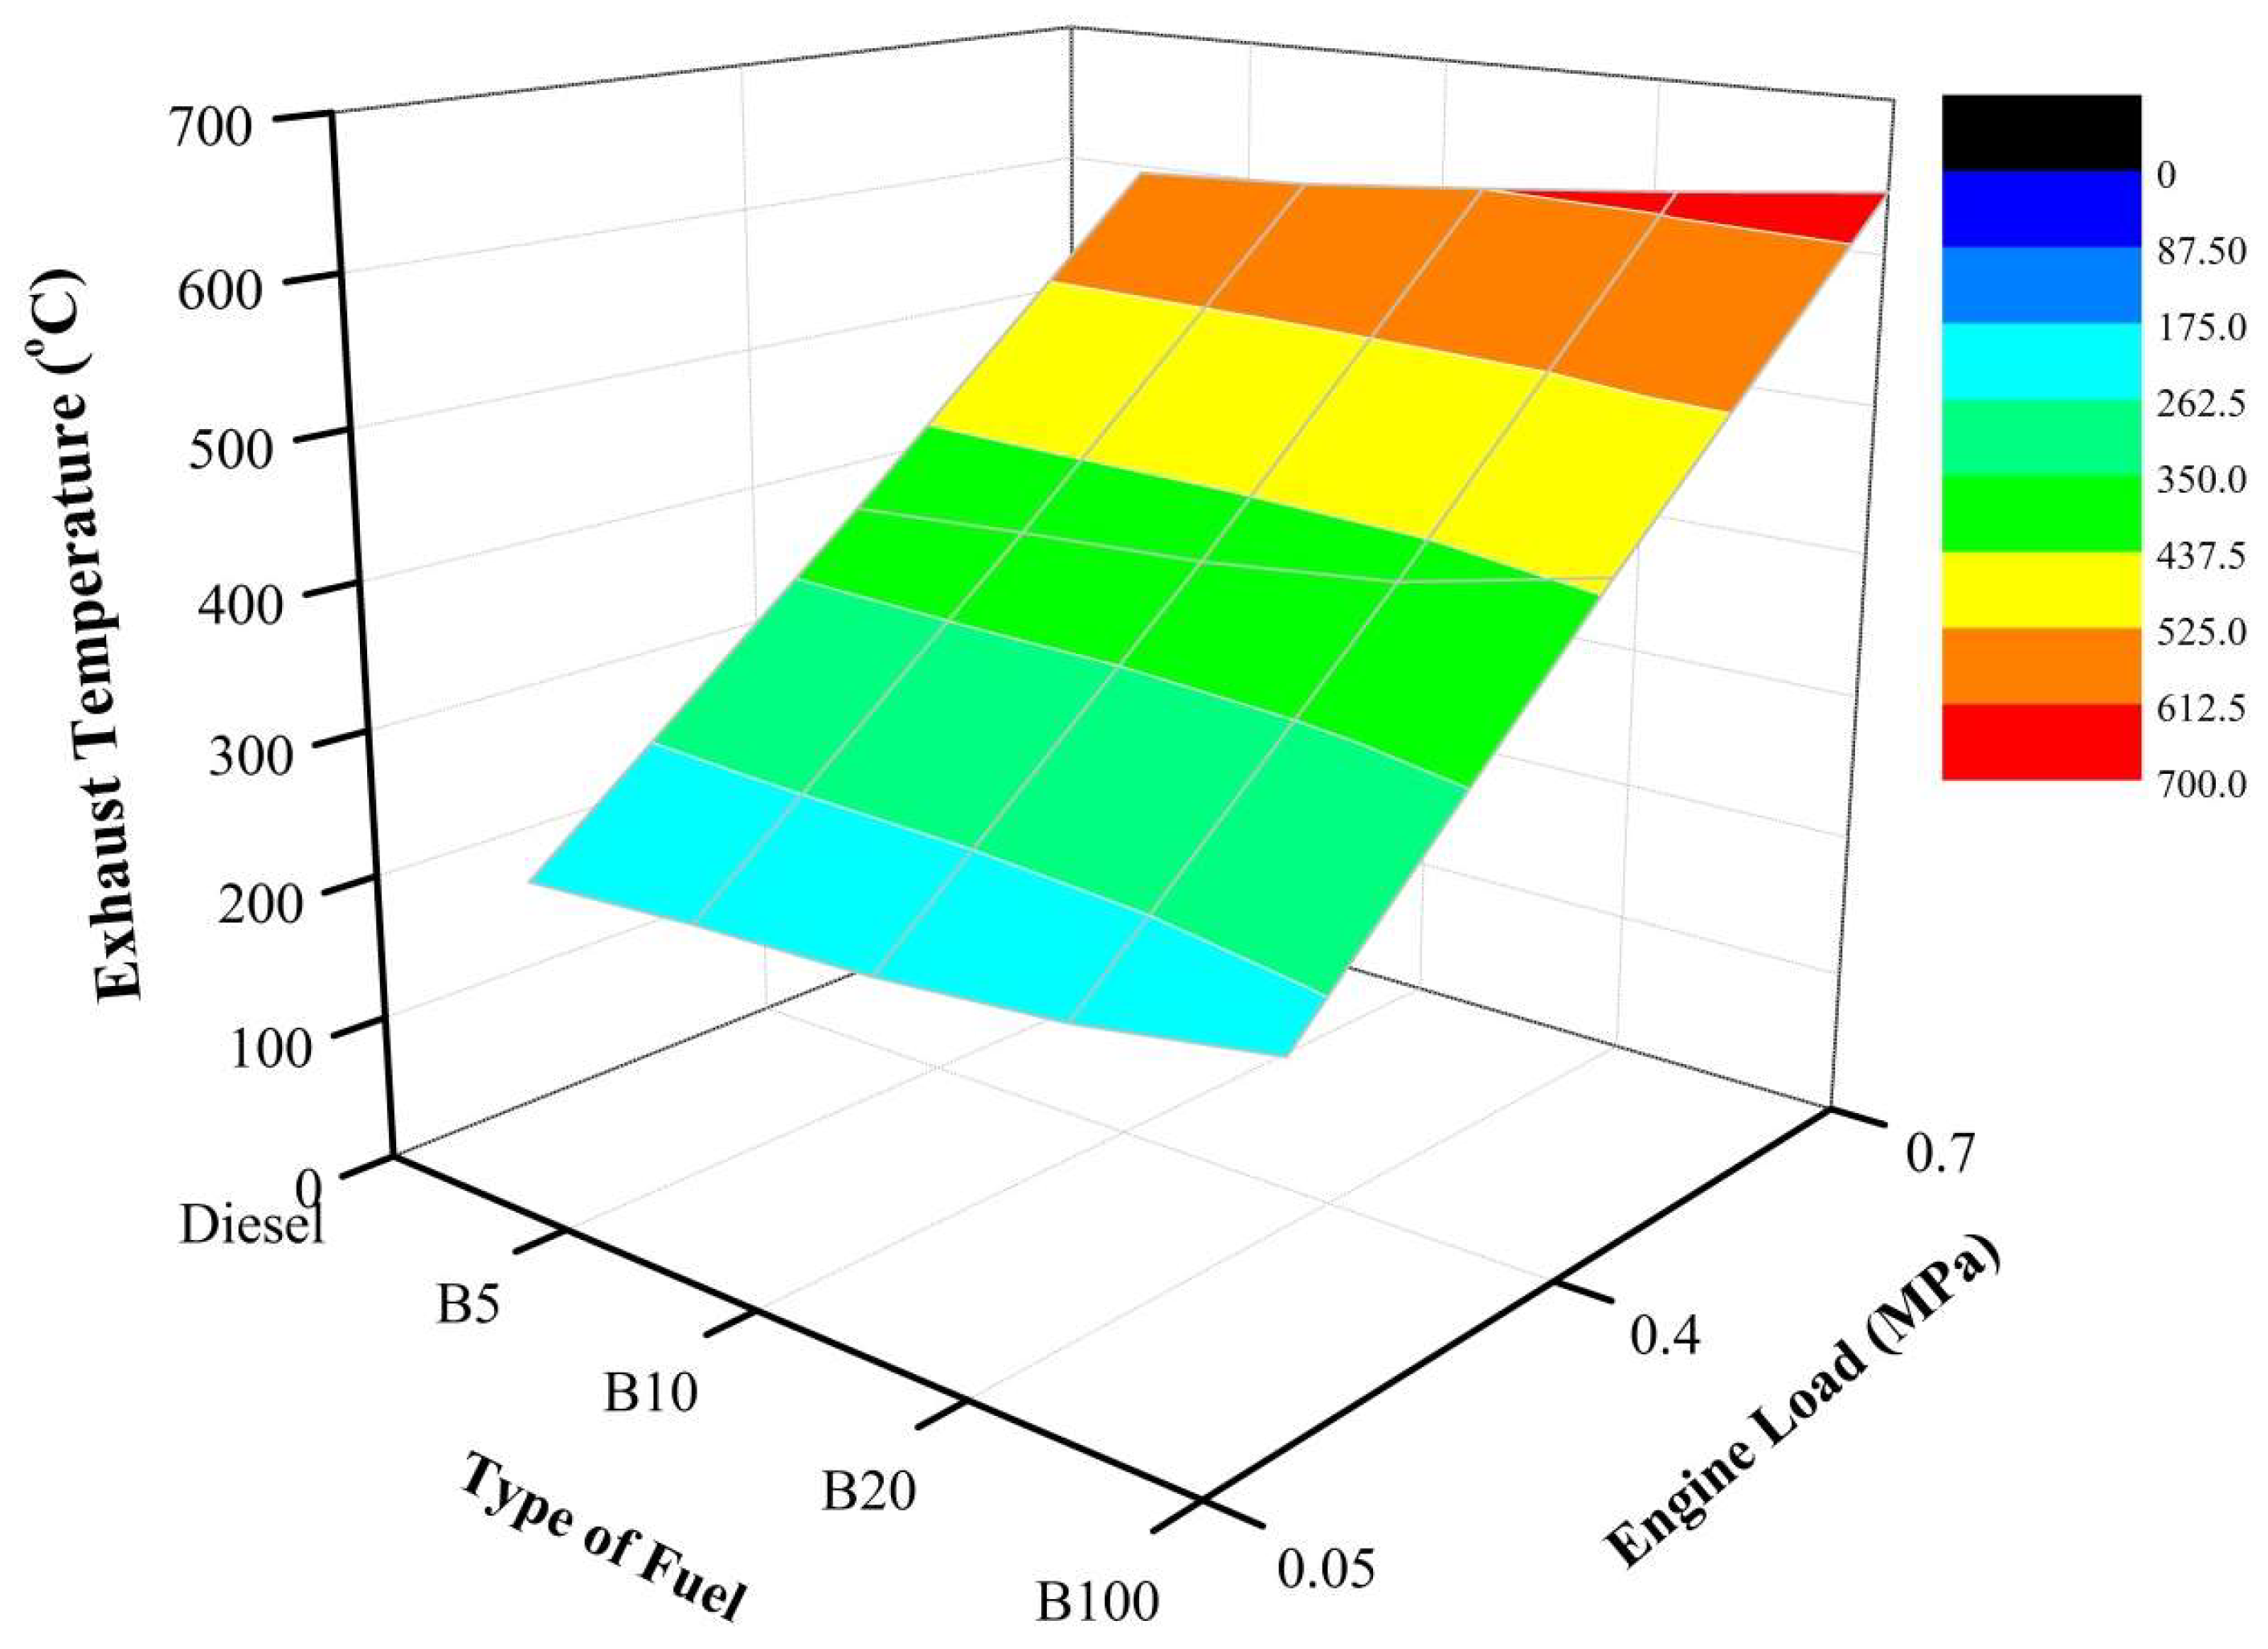
Additionally, observation of exhaust temperature in this study is important because it is an indication of the amount of energy released during combustion [
62]. The exhaust temperature of the diesel fuel and POME blend was measured at different blends and engine loads. All fuel blends under all engine loads had significantly different exhaust temperatures from diesel fuel.
Figure 8 depicts the variation of exhaust temperature for the fuels blends under different engine loads. As depicted, at every engine load—20%, 40%, and 60%—B100 recorded the highest exhaust temperature among the tested fuels at 239 °C, 446 °C, and 641 °C, respectively. Moreover, as the load increases, a sharp slope in the exhaust temperature can be seen clearly in
Figure 8. This indicates that higher loads produce high temperatures and, thus, affect the performance of the engine, as well as the PM components.
Under an engine load of 20%, the exhaust temperatures of B5, B10, B20, and B100 were 4.1%, 6.7%, 12.4%, and 23.8%, respectively, higher than that of mineral diesel fuel. This is because of oxygen content, which contributed to complete combustion, thus improving the diffusion combustion rate. As a result, the in-cylinder pressure increased as discussed earlier. As the engine load increased to 40%, the exhaust temperatures of B5, B10, B20, and B100 were 2.1%, 3.6%, 6.9%, and 14.7%, respectively, higher than that of mineral diesel fuel. Moreover, as the engine load increased, the exhaust temperature continued to increase. This is due to the oxygen content, which contributed to complete combustion, thus improving the diffusion combustion rate. As a result, the in-cylinder pressure increased as discussed earlier. Moreover, at the engine load of 60%, the exhaust temperatures of B5, B10, B20, and B100 were 1.0%, 3.0%, 5.2%, and 7.7%, respectively, higher than that of mineral diesel fuel. As the engine load increased, the exhaust temperature continued to increase. This is due to the oxygen content, which contributed to complete combustion, thus improving the diffusion combustion rate. As a result, the in-cylinder pressure increased as discussed earlier. High engine load results in increasing exhaust temperature, owing to the rising in-cylinder pressure.
3.4. Particulate Matter Components
From previous research conducted by Frijters et al., good correlation has been found between PM emissions and the oxygen content of various biodiesel fuel [
63]. If there is less oxygen content, the PM emission level will increase due to unburned or partially burned hydrocarbon (HC) emissions. These HCs will condense and be absorbed on the PM surface, and this phenomenon results in increased PM emissions. The oxygen content in the biodiesel fuel allows better combustion in order to reduce PM emissions. There is one known method to separate the PM into SOF and soot according to a previous study [
51].
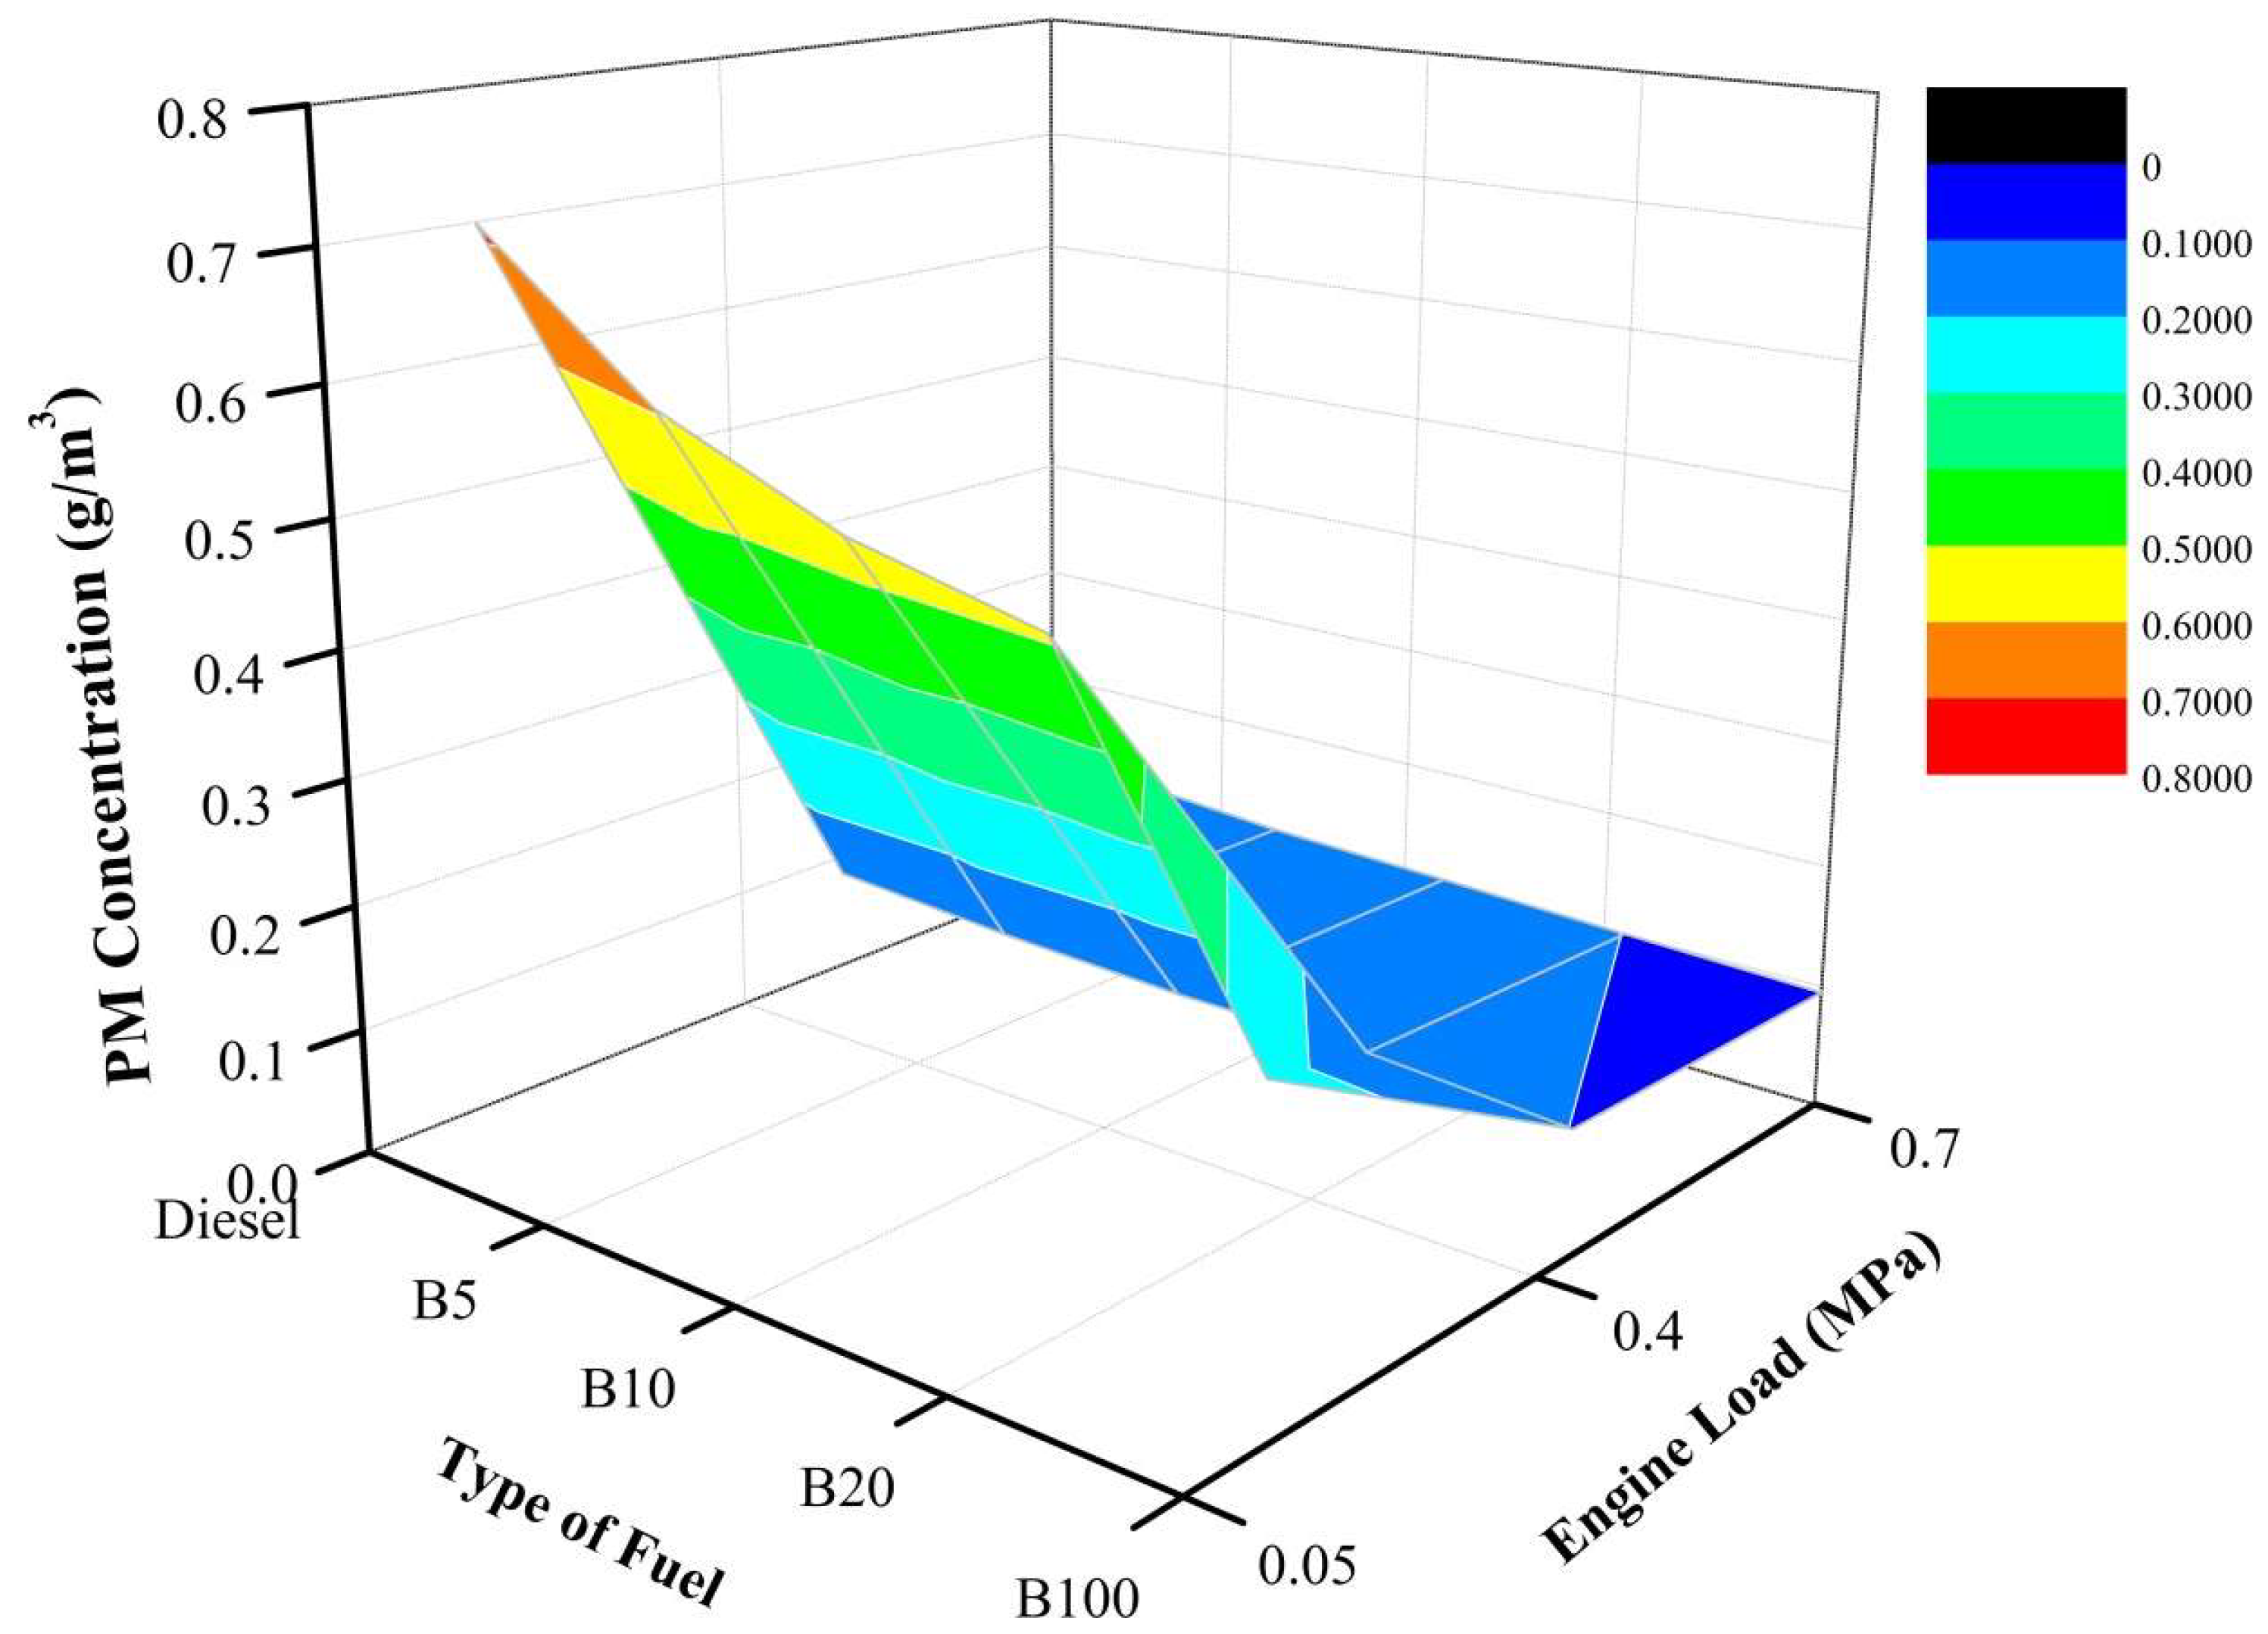
The PM concentration as illustrated in
Figure 9 decreases as the percentage of biodiesel increases under the engine load of 20%. As depicted, B100 has the lowest PM concentration at 0.26 g/m
3. At the same engine load, the PM concentrations of B5, B10, B20, and B100 are 15.4%, 23.8%, 28.7%, and 64.3%, respectively, lower than that of mineral diesel fuel. Moreover, the same trends are also recorded at an engine load of 40%. As the engine load is increased, the PM concentration tends to decrease. As depicted, B100 still has the lowest PM concentration. At the same engine load, the PM concentrations of B5, B10, B20, and B100 are 8.0%, 12.0%, 12.0%, and 20.0%, respectively, lower than that of mineral diesel fuel. At an engine load of 60%, the PM concentration decreases as the percentage of biodiesel increases. As depicted, B100 has a lower PM concentration than all other tested fuel. At the same engine load, the PM concentration of PME100 is 0.095 g/m
3 vs. 0.120 g/m
3 for mineral diesel fuel. At the same engine load, the PM concentration of B5, B10, B20, and B100 are 8.3%, 12.5%, 16.7%, and 20.8%, respectively, lower than that of mineral diesel fuel. This is due to high temperatures in the combustion chamber, which lead to increased peak pressure as mentioned earlier. One possible explanation for the decrease of PM is the oxygen content of biodiesel. Moreover, the oxygen content in the fuel helps increase the temperature, as well as pressure inside the combustion chamber, which reduces PM formation and enhances PM oxidation during the diffusion stage of combustion [
46]. This phenomenon can be interpreted as extending the combustion timing and causing a complete combustion reaction when using biodiesel, which could be a result of a higher combustion temperature that triggers PM concentration. Therefore, less PM in the exhaust gas can be achieved with an increased percentage of biodiesel. This effect has been demonstrated in many papers, and it is believed that the high CN of B100 causes the lower PM concentration. Moreover, the reduction of PM with increased biodiesel in the fuel blend can be attributed to the decreased carbon content and the increased oxygen content in the blended fuel [
47].
In conclusion, B100 has a lower PM concentration than all other tested fuels under all engine loads. Moreover, at a high engine load, the increased percentage of biodiesel is less noticeable. This is due to the high temperature, which led to a low PM concentration. Furthermore, high temperatures in the combustion chamber lead to increased peak pressure. One possible explanation for the decrease of PM is the oxygen content of biodiesel. Moreover, the oxygen content in the fuel helps increase the temperature, as well as pressure inside the combustion chamber, which reduces PM formation and enhances PM oxidation during the diffusion stage of combustion [
46]. Therefore, as the engine load is increased from 20% to 40%, the PM concentration tends to decrease.
The SOF in diesel PM consists of aldehydes, alkenes and alkanes, HC aliphatic, PAH, and PAH derivatives [
64]. These elements come from unburned fuel, which still contains organic material that must be oxidized, and lubrication oil, some of which appears in the exhaust unchanged or un-combusted and escapes the process of oxidation. In PM aggregation, the SOF sticks to the surface or inside of the aggregate [
51]. Moreover, some researchers have found that the percentage of SOF in PM increases by increasing the amount of biodiesel [
65,
66]. This may be due to the chemical characteristics of the fuel’s oxygen content and the chemical structure of POME present in biodiesel fuel.
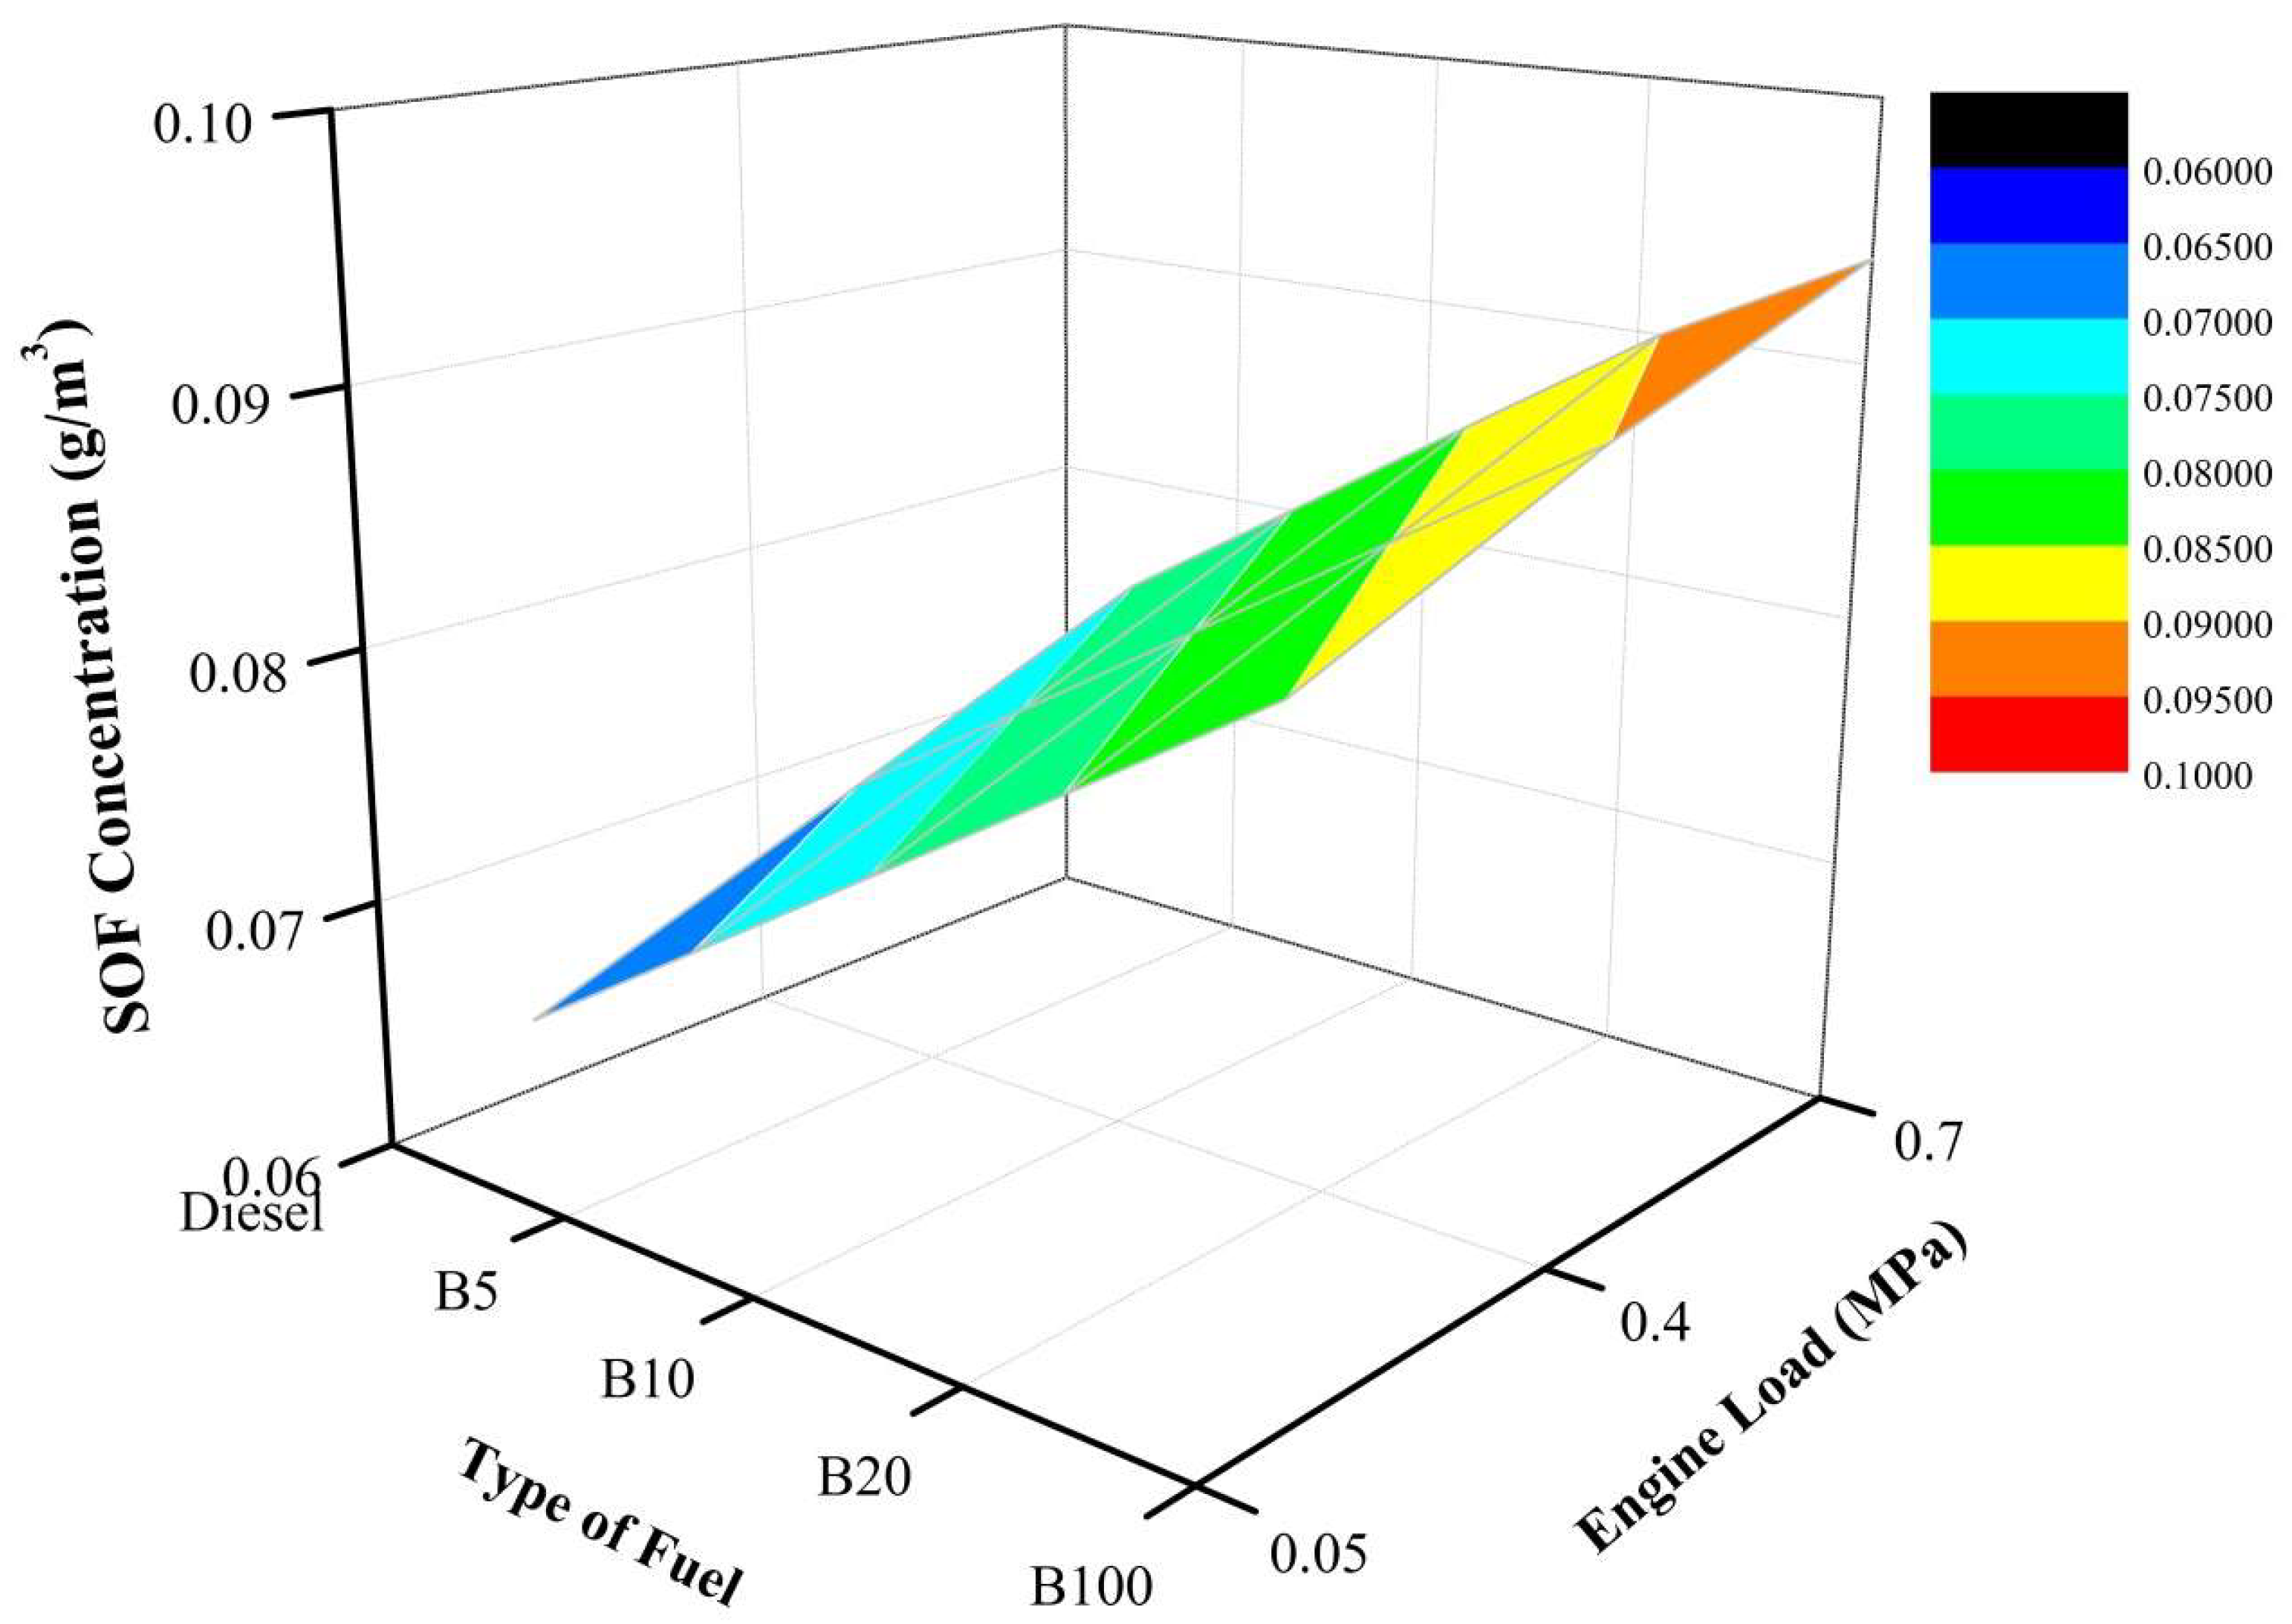
The SOF concentration increases as the percentage of biodiesel increases for an engine load of 20%. As depicted in
Figure 10, B100 has the highest SOF concentration. By comparing the tested fuels at the same engine load, the SOF concentrations of B5, B10, B20, and B100 are 7.7%, 15.4%, 23.1%, and 30.8%, respectively, higher than that of mineral diesel fuel. At an engine load of 40%, the SOF concentration increases as the percentage of biodiesel increases. Moreover, as the engine load is increased from 20% to 40%, the SOF concentration tends to increase. As depicted, B100 has the highest SOF concentration. By comparing the tested fuels at the same engine load, the SOF concentrations of B5, B10, B20, and B100 are 7.1%, 14.3%, 21.4%, and 28.6%, respectively, higher than that of mineral diesel fuel. Additionally, the same trends also occur at an engine load of 60% where the SOF concentration increases as the percentage of biodiesel increases. Moreover, as the engine load is increased from 40% to 60%, the SOF concentration tends to increase. Furthermore, at the same engine load, the SOF concentrations of B5, B10, B20, and B100 are 6.7%, 13.3%, 20.0%, and 25.3%, respectively, higher than that of mineral diesel fuel. Thus, more SOF is produced in the exhaust gas as the percentage of biodiesel increases. This is due to the unburned or partially burned HC emissions. These HCs will condense and be absorbed on the PM surface, thus resulting in increased SOF, which is the main component of PM [
48]. The higher SOF value of POME fuel is also caused by its lower volatility compared to diesel fuel. However, the mass is increased mainly because of unburned esters from the fuel itself. Since biodiesel is nontoxic, the increase of SOF concentration may not be hazardous [
49]. Moreover, the present study is in agreement with the research conducted by Lapuerta et al. [
50], in which the SOF increased as the biodiesel percentage increased.
In a nutshell, the SOF concentration increases as the percentage of biodiesel increases. As illustrated, B100 has a higher SOF concentration than all other tested fuels under all engine loads. Moreover, as the percentage of POME increases, the slope of the load remains the same for all three loads. Moreover, as the engine load is increased, the SOF concentration tends to increase.
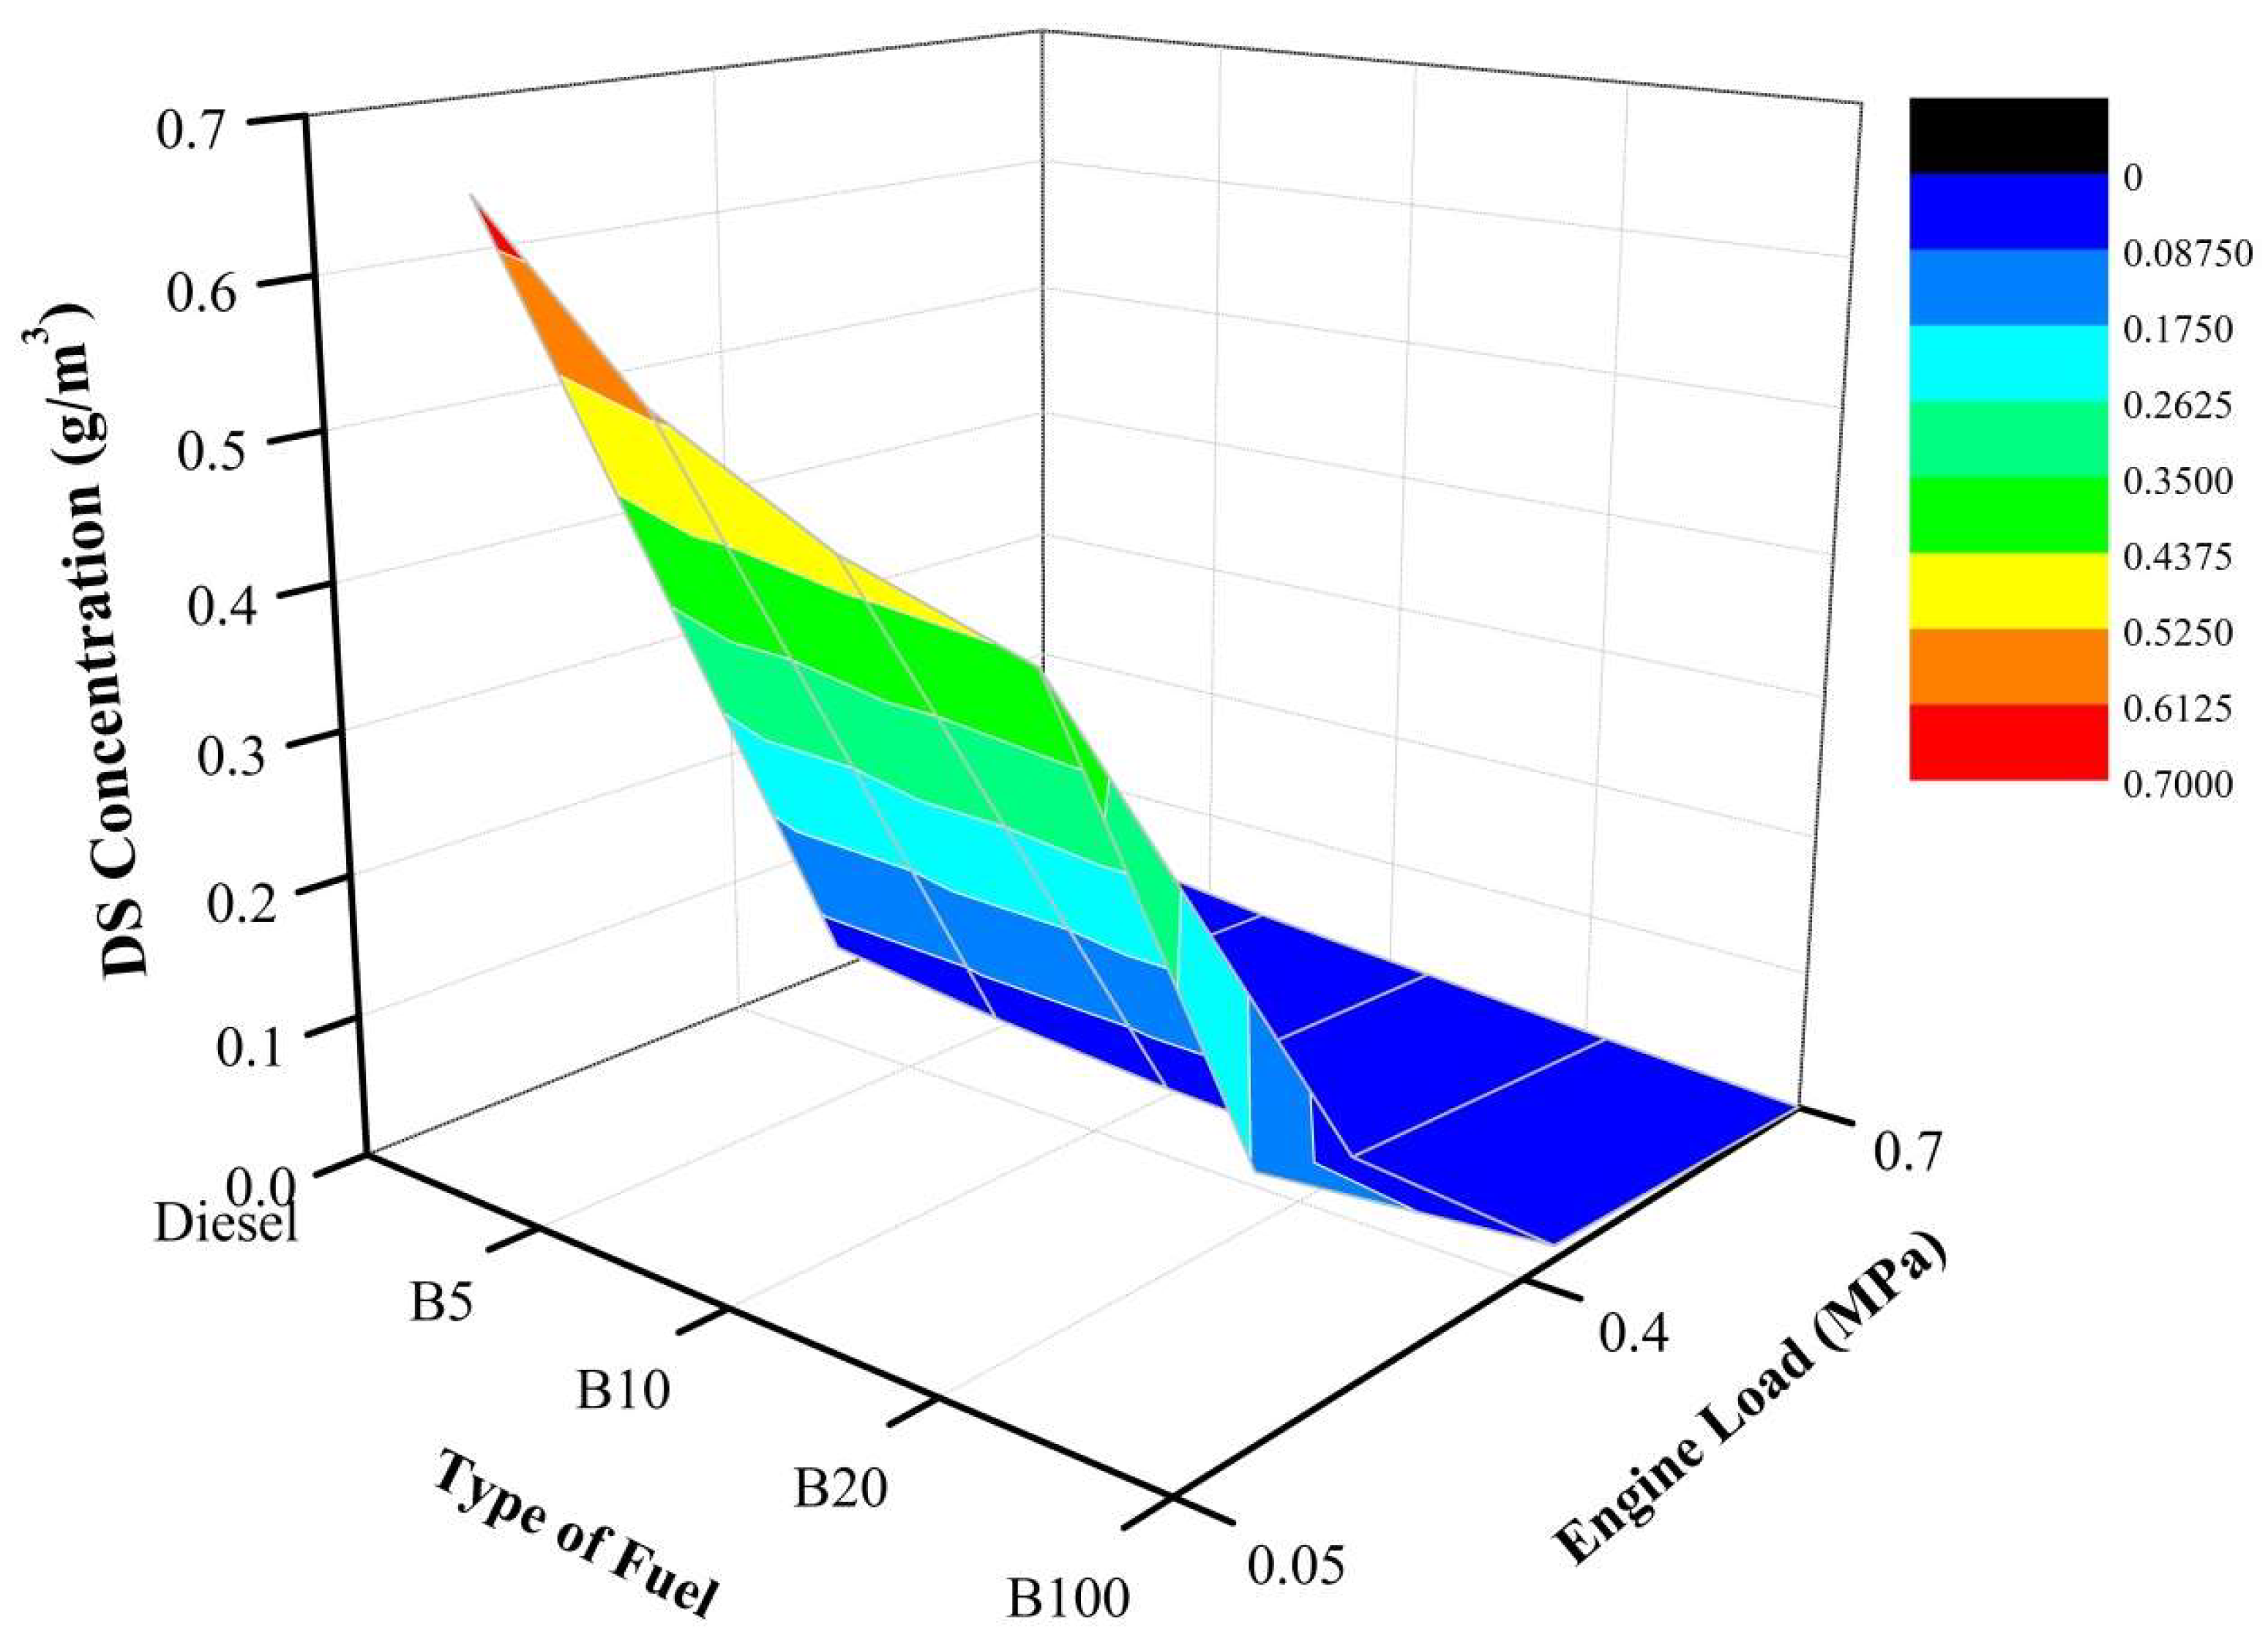
In this study, dry soot (DS) consists of a few elements, such as small solid carbon particles, sulfate, and metal, which are formed during fuel combustion. DS is mainly the carbonaceous fraction of the particulate, and its typical chemical formulae are C8H, C9H, and C10H. Moreover, almost 5–10% oxygen and 0.5% nitrogen by mass are also present in DS. The typical empirical formula of DS would be CH0.11 O0.065 N0.005. DS results from several processes, such as pyrolysis, dehydrogenation, and condensation of fuel molecules.
As illustrated in
Figure 11, the DS concentration decreases as the percentage of biodiesel increases for an engine load of 20%. More fuel is combusted in the diffusion phase if the engine load is increased, resulting in the formation of more particles. By comparing the tested fuels at the same engine load, the DS concentrations of B5, B10, B20, and B100 are 17.7%, 27.7%, 33.8%, and 73.8%, respectively, lower than that of mineral diesel fuel. For an engine load of 40%, the DS concentration decreases as the percentage of biodiesel increases. More fuel is combusted in the diffusion phase if the engine load is increased, resulting in the formation of more particles. By comparing the tested fuels at the same engine load, the DS concentrations of B5, B10, B20, and B100 are 27.3%, 45.5%, 54.5%, and 81.8%, respectively, lower than that of mineral diesel fuel. Moreover, at an engine load of 60%, the DS concentration decreases as the percentage of biodiesel increases. By comparing the tested fuels at the same engine load, the DS concentrations of B5, B10, B20, and B100 are 33.3%, 55.6%, 77.8%, and 97.8%, respectively, lower than that of mineral diesel fuel. The results show that POME has the capability to effectively reduce DS compared to diesel fuel. Previous research has reported that biodiesel decreases DS emissions and increases SOF emissions [
50]. Moreover, DS is formed owing to high-temperature decomposition, which mainly occurs in the fuel-rich zone, especially within the region of fuel spray. POME fuel, whose oxygen content could reduce locally fuel-rich regions and limit soot formation, can reduce DS emissions. Therefore, DS in the exhaust gas can be reduced by increasing the percentage of biodiesel.
In general, B100 has the lowest DS concentration. Moreover, at high engine loads, the increase of the POME has a smaller effect on DS concentration. Furthermore, the DS concentration decreases as the percentage of biodiesel increases. The results show that POME has the capability to effectively reduce DS compared to diesel fuel.
PM-NOx Trade Off
The formation of NOx and PM is strongly influenced by the combustion temperature. Moreover, soot particles, which heavily contribute to the total mass of PM emitted by the engine, are formed in the cylinder in locally fuel-rich regions of the inhomogeneous combustion. Owing to high temperature, subsequent soot burns at the boundary of the diffusion flame. Conversely, the formation of NOx is favored by this high temperature. Thus, decreasing the combustion temperature in order to reduce NOx emissions will lead to increased PM. This phenomenon is known as the NOx-PM trade off [
67]. It is very difficult to reduce both NOx and PM emissions simultaneously during the combustion process. Many of the emissions-reduction technologies developed thus far tend to increase PM emissions while reducing NOx emissions, or vice versa [
68].
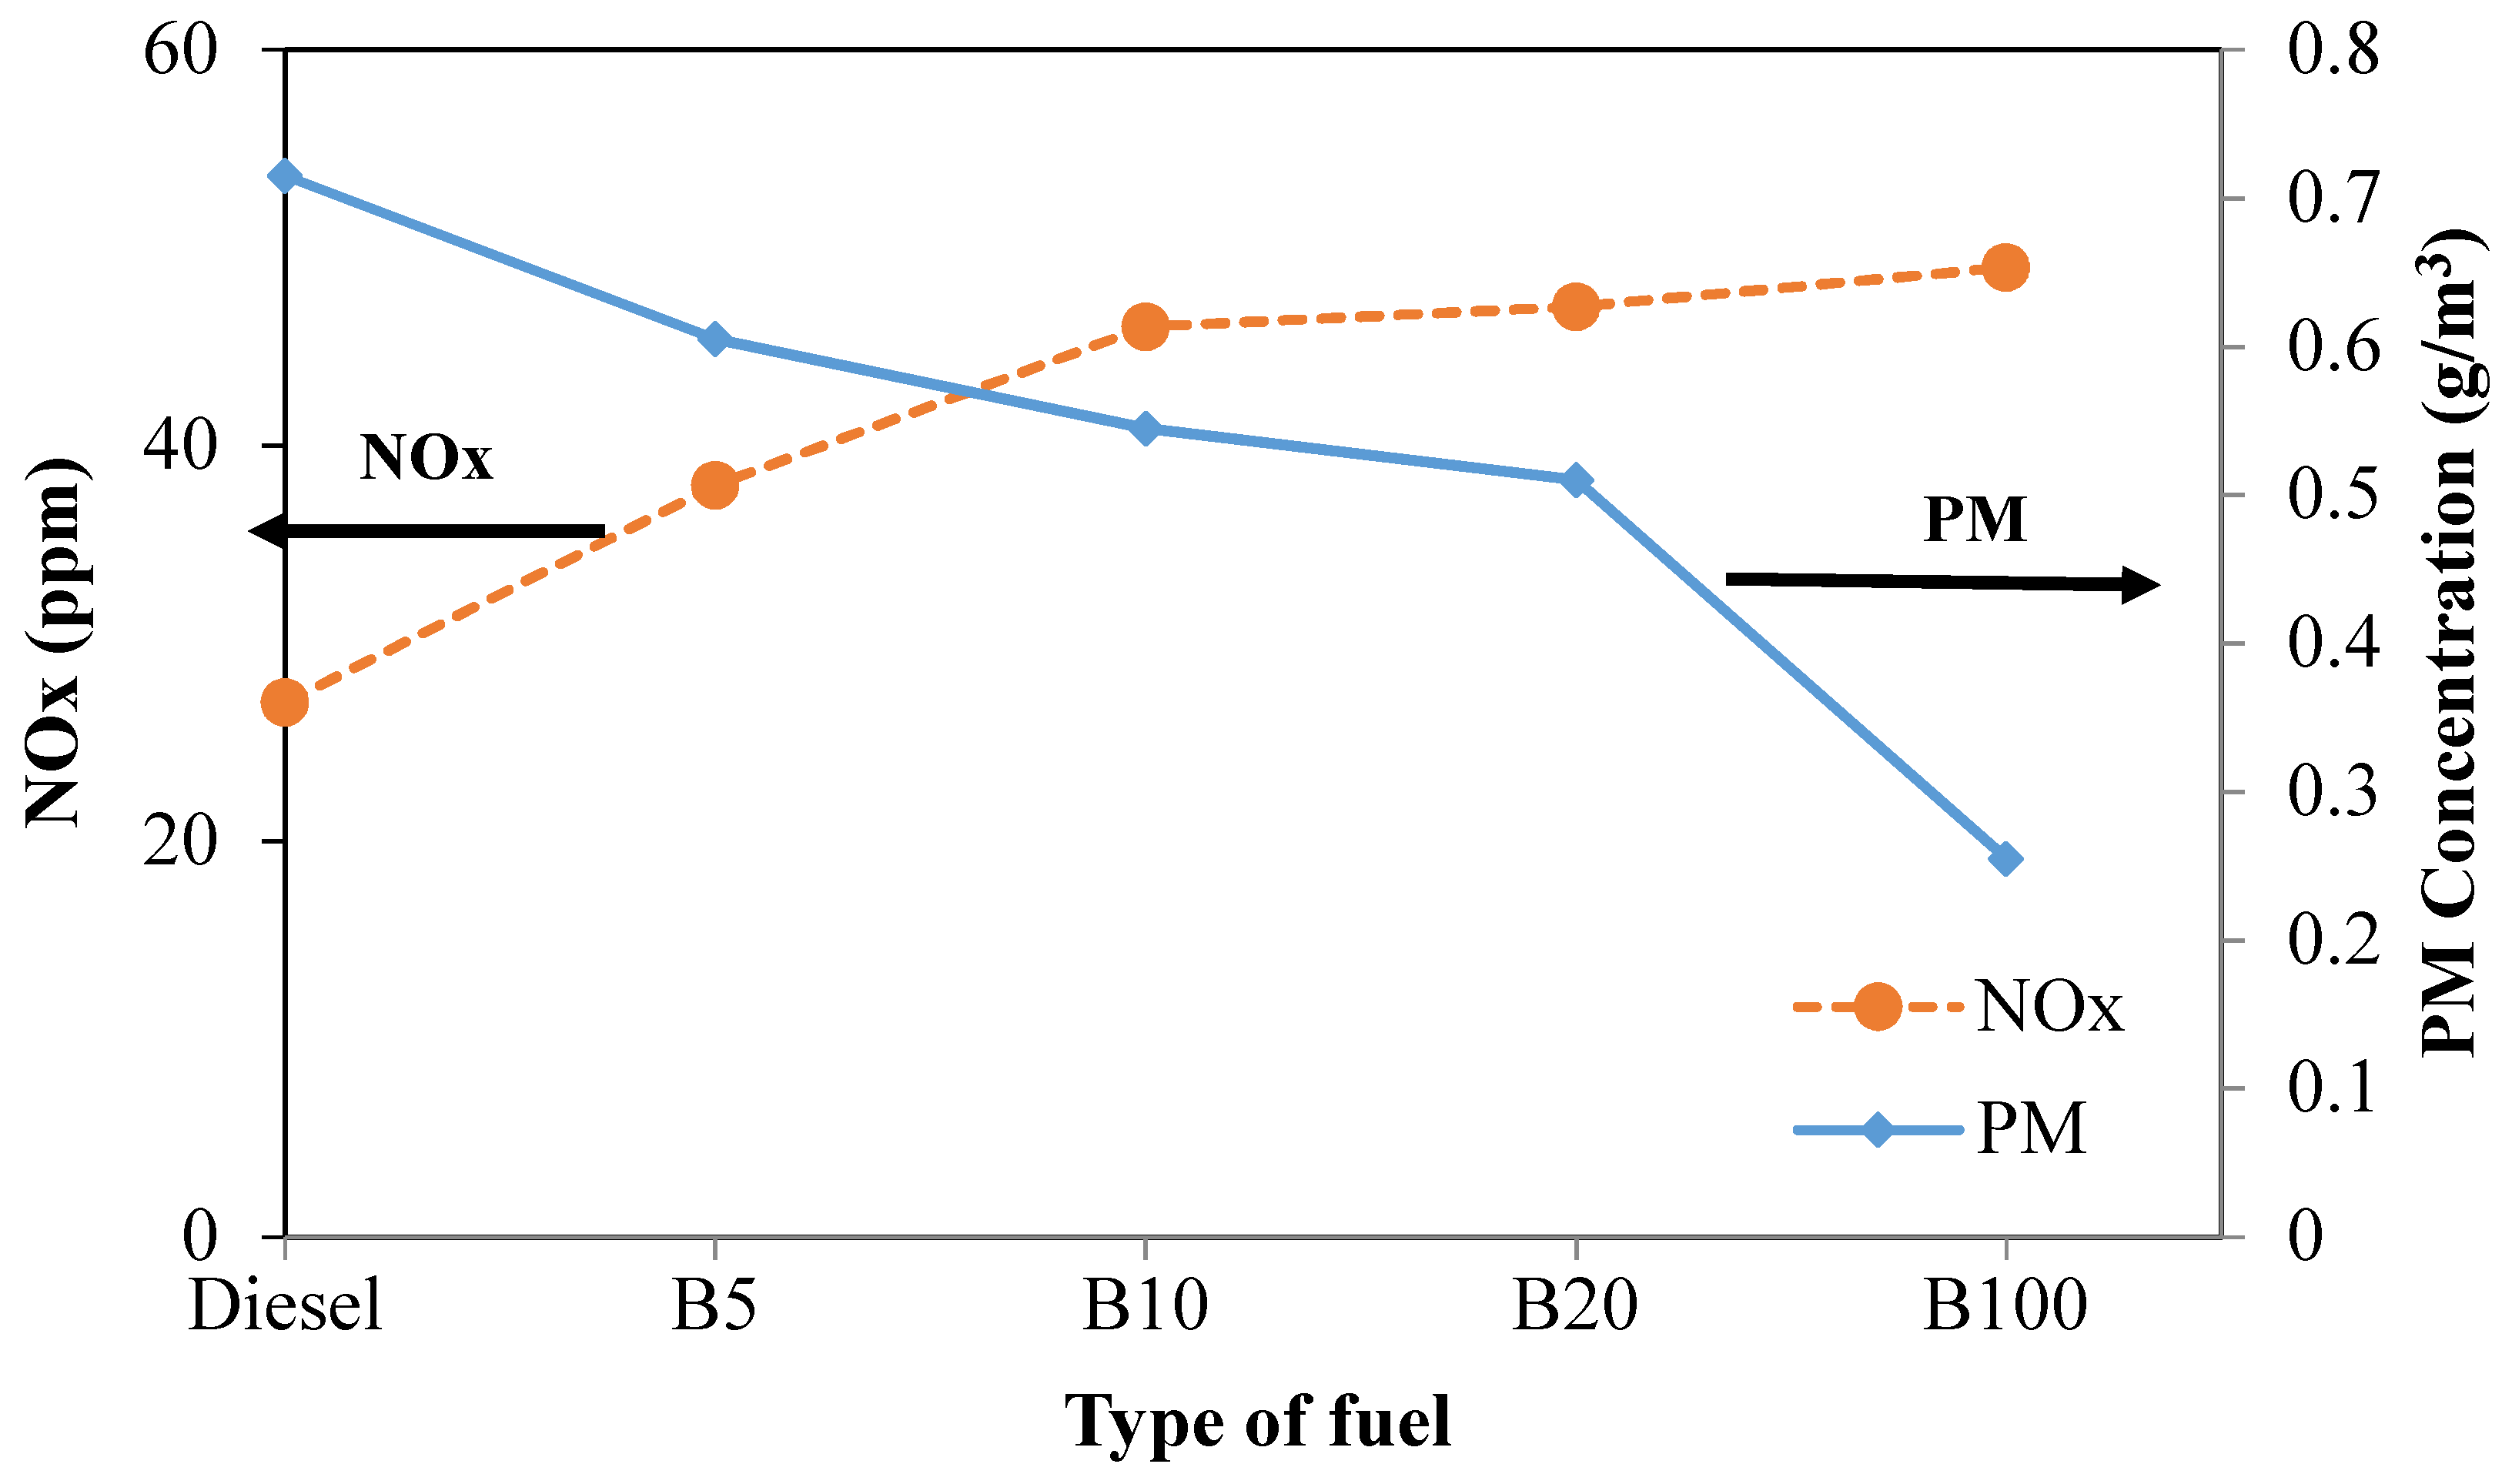
Figure 12 illustrates the trade-off between PM and NOx emissions produced from the experiment under a load of 20% for all tested fuels. It can be seen that the lines representing NOx and PM intersect between B5 and B10. The intersection occurs at the point where NOx and PM are 43 ppm and 0.585 g/m
3, respectively. Thus, a good balance of NOx and PM will help reduce NOx and PM efficiently. At the same engine load, the PM concentrations of B5, B10, B20, and B100 are 15.4%, 23.8%, 28.7%, and 64.3%, respectively, lower than that of mineral diesel fuel. Moreover, NOx increased by 40.7%, 70.4%, 74.1%, and 81.5% for B5, B10, B20, and B100, respectively, compared to that of mineral diesel fuel. As mentioned earlier, the reduction of PM and the increase of NOx with increased biodiesel in the fuel blend can be attributed to the lower carbon content and the higher oxygen content in the blended fuel [
47,
69].
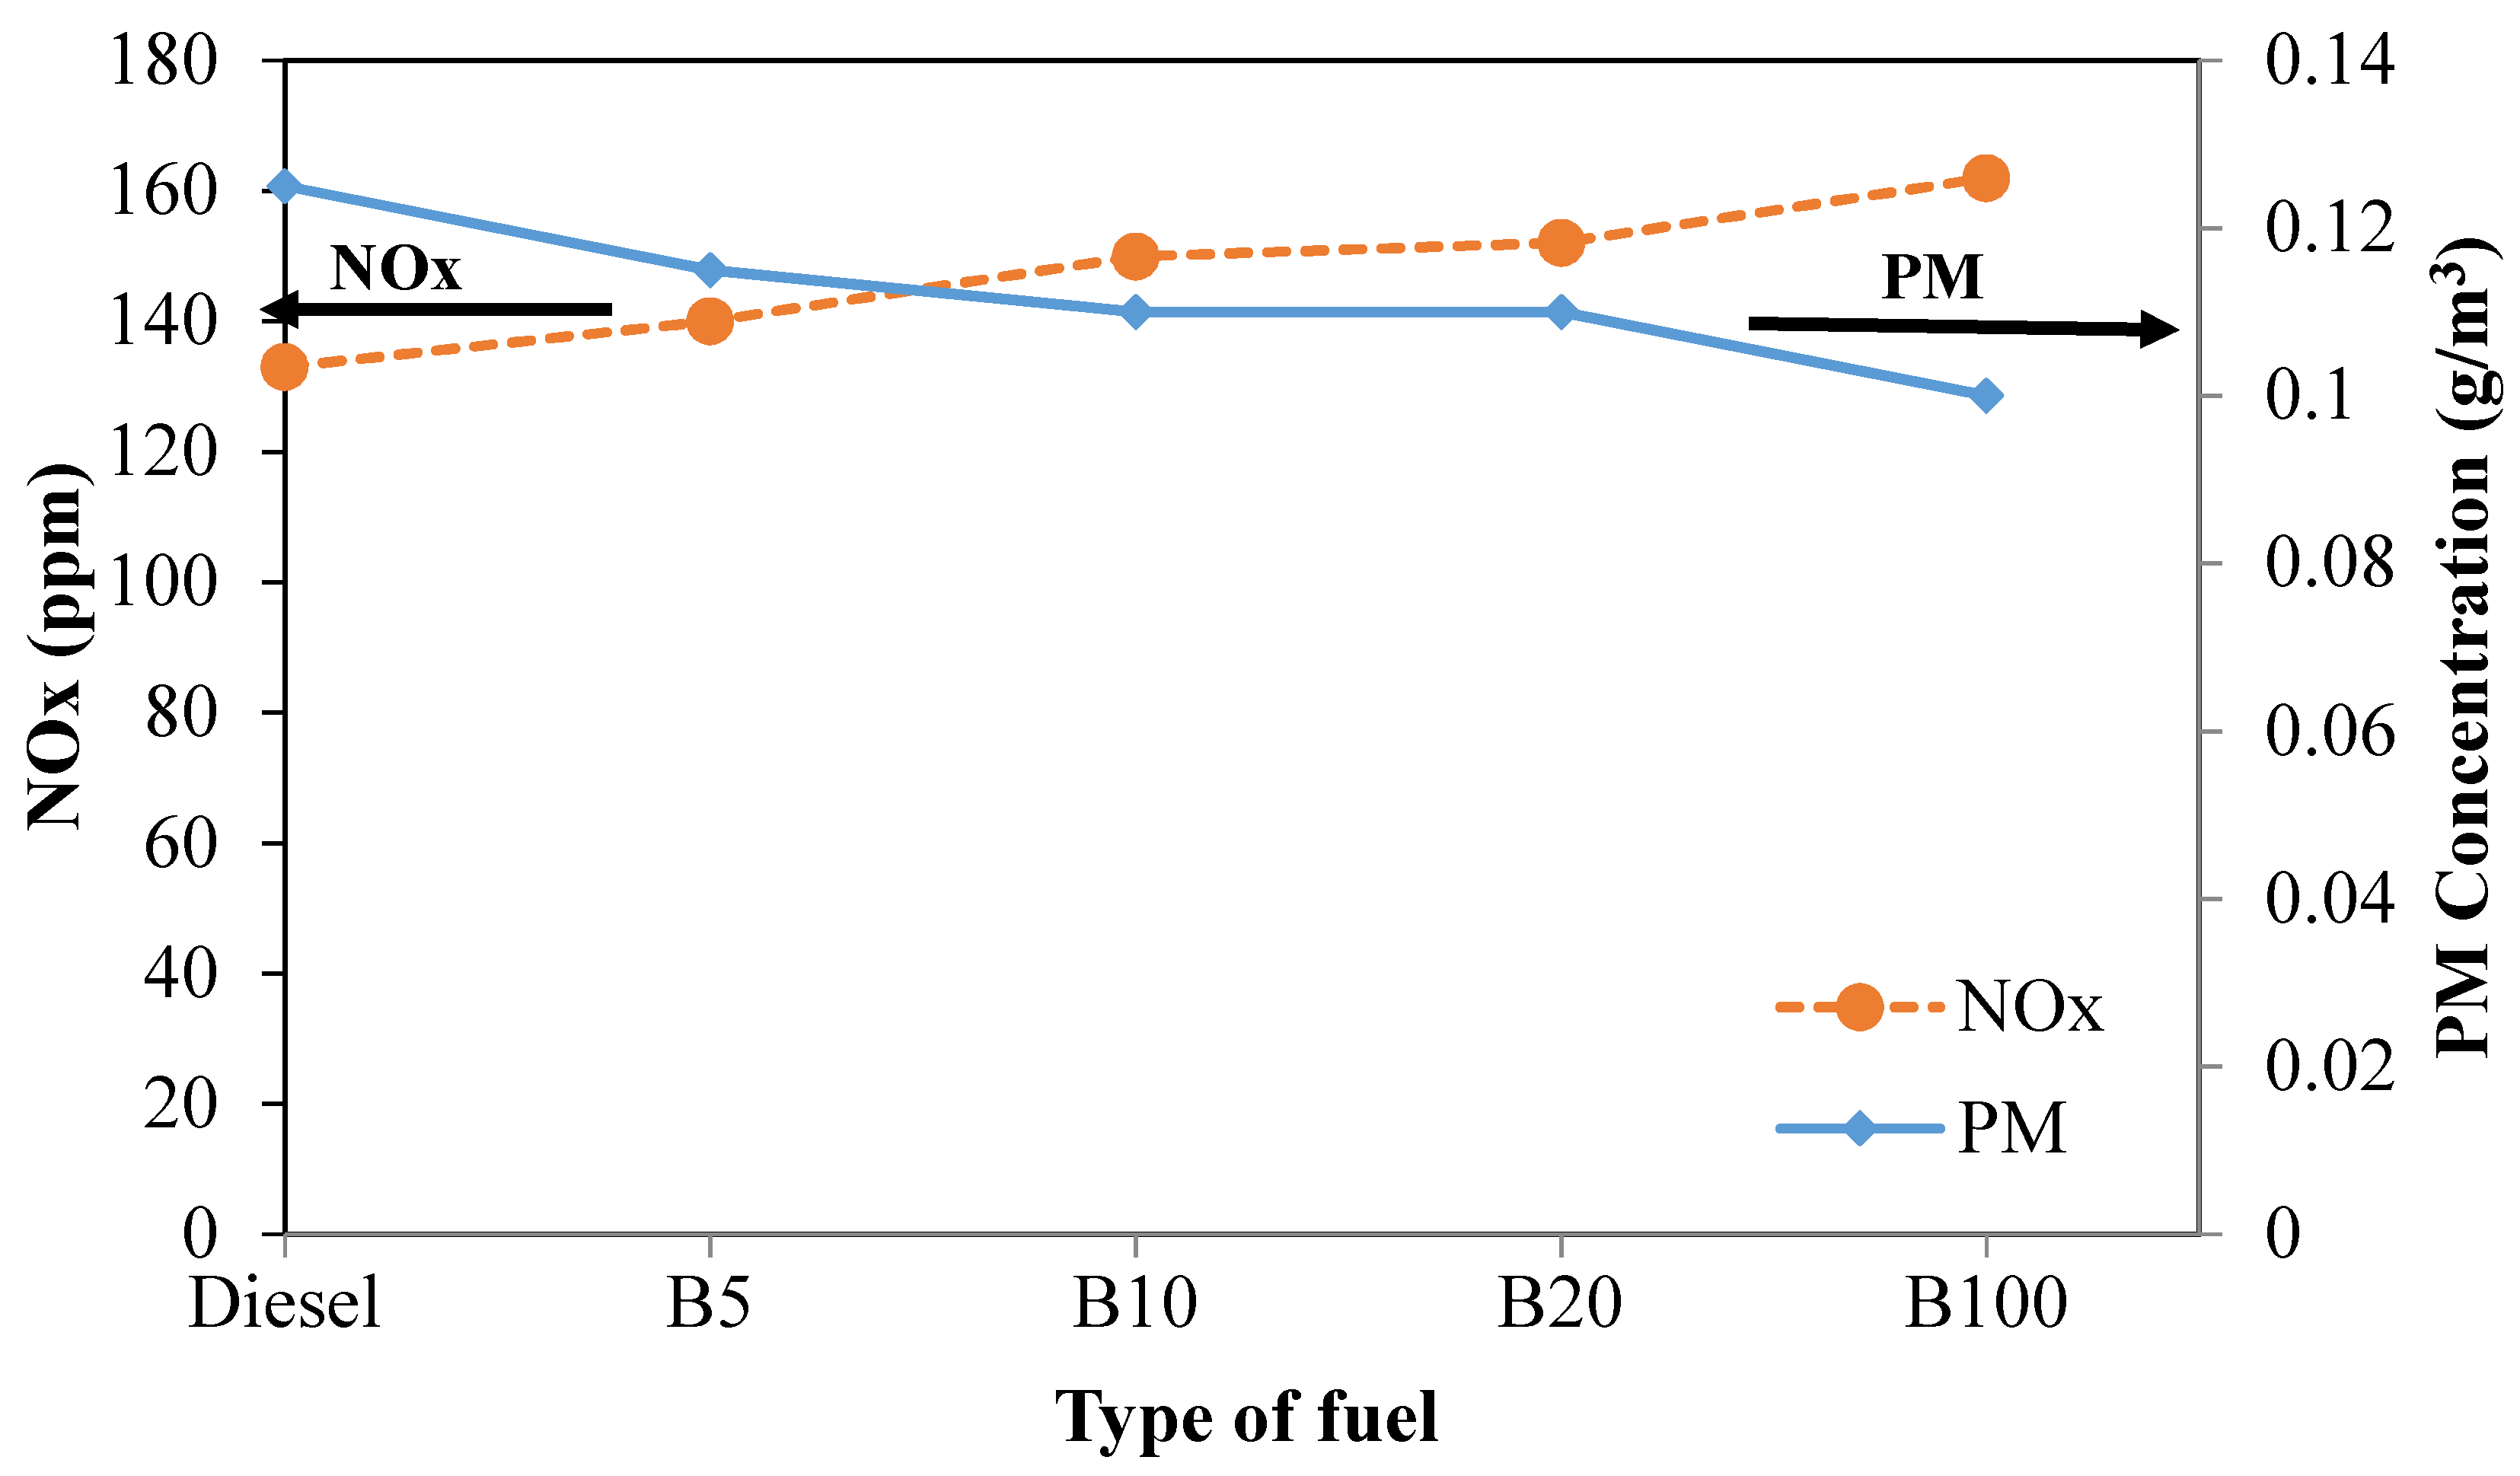
Figure 13 illustrates the trade-off between PM and NOx emissions produced from the experiment under a load of 40% for all tested fuels. It can be seen that the lines representing NOx and PM intersect between B5 and B10. Moreover, as the engine load is increased from 20% to 40%, the intersection of the line tends to shift toward the left. The intersection occurs at the point where NOx and PM are 145 ppm and 0.113 g/m
3, respectively. Thus, a good balance of NOx and PM will help reduce NOx and PM efficiently. At the same engine load, the PM concentrations of B5, B10, B20, and B100 are 8.0%, 12.0%, 12.0%, and 20.0%, respectively, lower than that of mineral diesel fuel. Moreover, the NOx emissions of B5, B10, B20, and B100 increased by 5.3%, 12.8%, 14.3% and 21.8%, respectively, compared to that of mineral diesel fuel. As mentioned earlier, the reduction of PM and the increase of NOx with increased biodiesel in the fuel blend can be attributed to the lower carbon content and the higher oxygen content in the blended fuel [
47,
69].
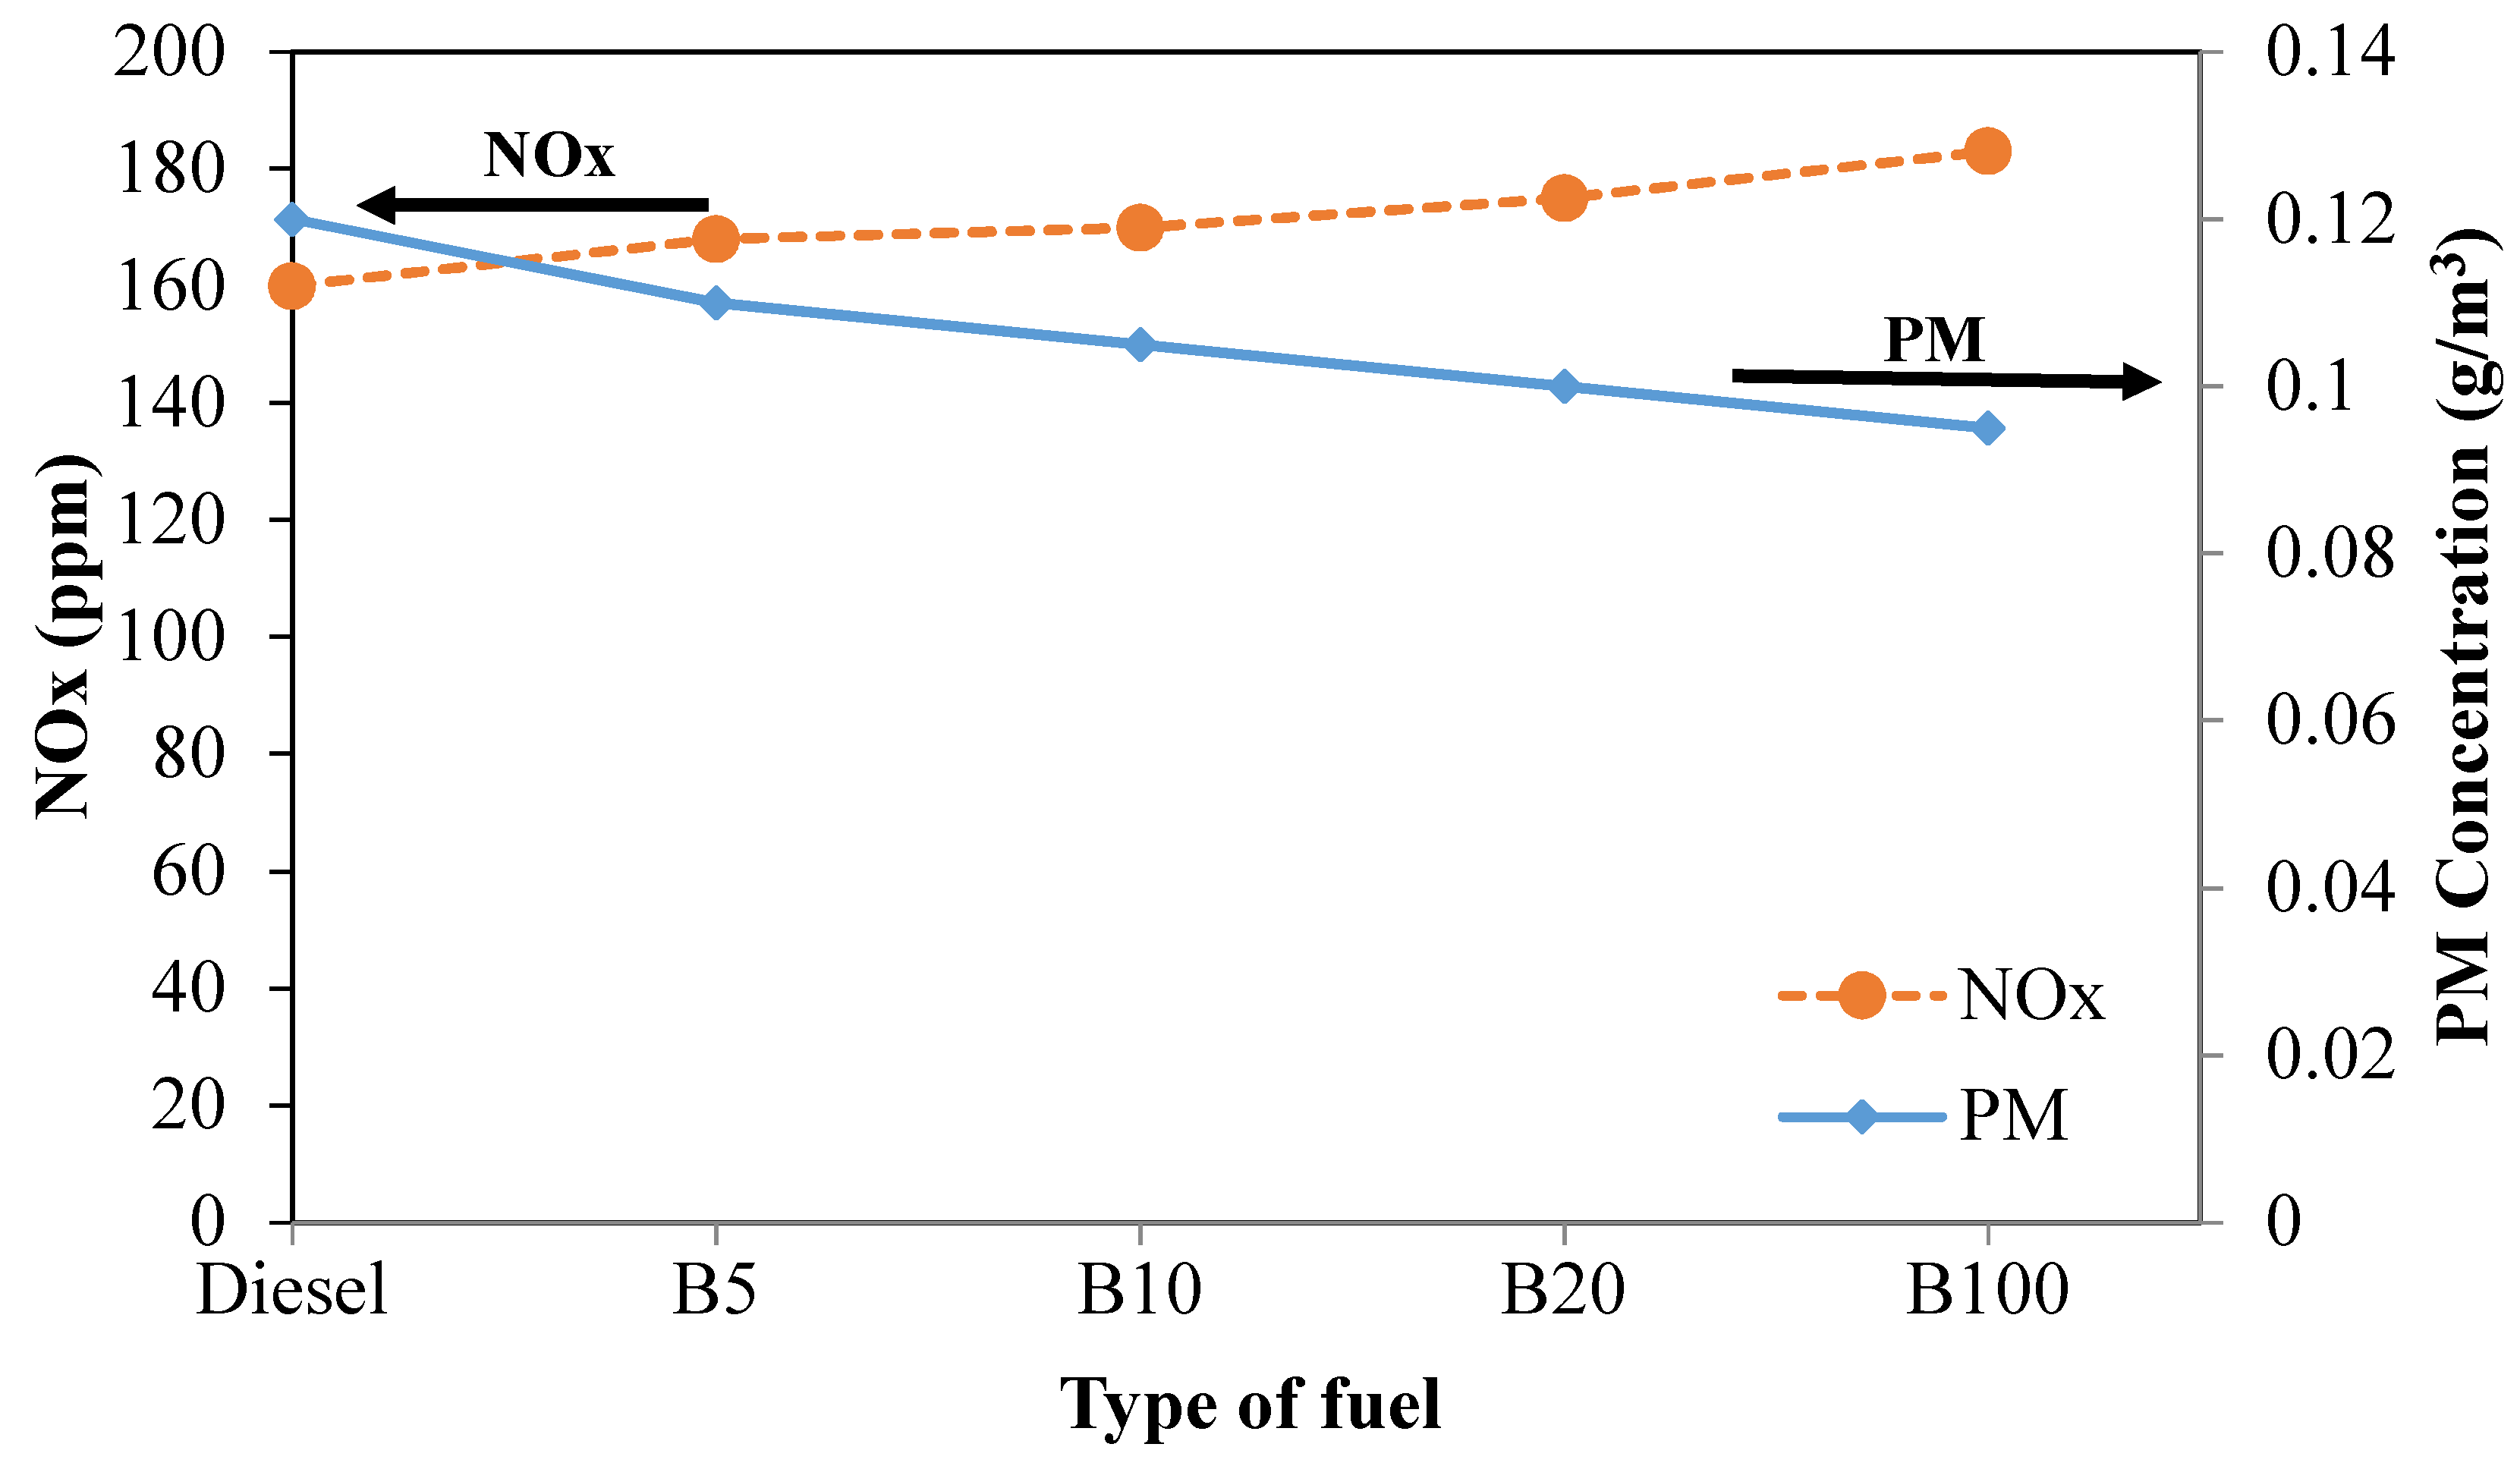
The trade-off between PM and NOx emissions produced from the experiment under a load of 60% for all tested fuels is depicted in
Figure 14. It can be seen that the lines representing NOx and PM intersect between diesel and B5. Moreover, as the engine load is increased from 40% to 60%, the intersection of the line tends to shift toward the left. The intersection occurs at the point where NOx and PM are 164 ppm and 0.115 g/m
3, respectively. Thus, a good balance of NOx and PM will help reduce NOx and PM efficiently. At the same engine load, the PM concentrations of B5, B10, B20, and B100 are 8.3%, 12.5%, 16.7%, and 20.8%, respectively, lower than that of mineral diesel fuel. Moreover, the NOx emissions of B5, B10, B20, and B100 increased by 5.0%, 6.3%, 9.4%, and 14.4%, respectively, compared to that of mineral diesel fuel. As mentioned earlier, the reduction of PM and the increase of NOx with increased biodiesel in the fuel blend can be attributed to the lower carbon content and the higher oxygen content in the blended fuel [
47,
69].
4. Summary and Conclusions
The results obtained from the experimental part and numerical models are presented. The experimental results from the fuel property measurements are employed to characterize the measured properties of the blended POME fuel with different percentages. These properties are compared to the blended fuel standard specifications EN14214. A statistically significant increase in the density of POME was achieved by increasing the percentage of POME fuel. Accordingly, the density of the blended fuels B5, B10, and B20 were 2.9%, 2.8%, and 2.4%, respectively, lower than that of B100, owing to the effect of blending with diesel. Accordingly, the viscosity of blended fuels B5, B10, and B20 were 8.0%, 7.2%, and 5.3%, respectively, lower than that of B100, owing to the effect of blending with diesel. Moreover, blended POME resulted in a reduced heating value. The measured HVs of blended fuels B5, B10, B20, and B100 were lower than that of diesel fuel by 9.4%, 10.1%, 12.7%, and 17.1%, respectively, owing to the effect of blending with POME. The POME fuel resulted in the improvement of the CN as the percentage of POME increased. For instance, the CNs of blended fuels B5, B10, and B20 were 17.5%, 15.8%, and 12.3%, respectively, lower than that of B100, owing to the effect of blending with diesel. Furthermore, the experimental results of the engine performance and emissions tests of different fuels are used to evaluate the effect of property changes on the engine brake power, fuel consumption, thermal efficiency, exhaust emissions, and in-cylinder pressure correlated parameters. The peak brake power produced decreased by approximately 9% when using B20 compared to mineral diesel. The difference in peak power produced could be explained by the lower energy content of B100 compared to mineral diesel; however, the percent difference in peak power was less than the percent difference in fuel energy content. Generally, as the engine speed increased to 2500 rpm, the BTE results increased. From the tested fuel, the BTE of B100 was 12.79% higher than that of mineral diesel fuel at 2500 rpm. The presence of high oxygen content in B100 relative to mineral diesel enhanced the combustion process. Therefore, the increase of biodiesel content improved the BTE in the diesel engine. The brake-specific fuel consumption for B5, B10, B20, and B100 was comparable, but slightly higher than that of mineral diesel. The increased BSFC was understandable, owing to the lower heating values of pure B100 compared to mineral diesel. Most studies have found that biodiesel with lower HVs operating in light-duty and heavy-duty engines caused significant increases in BSFC.
It could be concluded from the overall results that there was an increase in the maximum cylinder pressure with increasing engine load at 20%, 40%, and 60%. Furthermore, B100 produced a higher maximum cylinder pressure curve than the other tested fuels with increasing engine load. Moreover, the blended fuels exhibited higher maximum cylinder pressure compared to mineral diesel with increasing engine load. Higher oxygen content in the biodiesel was among the major factor contributing to increasing maximum cylinder pressure. Furthermore, the increased rate of heat release for blended fuel at high engine loads was understandable owing to increased oxygenated fuel content. Therefore, the start of combustion was delayed, which caused more fuel to be combusted, resulting in a higher maximum cylinder temperature. It could be concluded from the results that the maximum rate of heat release (RoHR) for the test fuels increased with increasing engine load. Moreover, the diffusion combustion phase for mineral diesel was longer than the blended fuels. This was because the higher CN for biodiesel caused a decreased ignition delay and higher fuel consumption for combustion after the start of ignition.
In terms of PM concentration, as the engine load was increased, the PM concentration tended to decrease. B100 emitted the lowest PM concentration among all tested fuels for all engine speeds. This was because the oxygen content in the fuel helped reduce PM formation and enhance PM oxidation during the diffusion stage of combustion. Therefore, less PM in the exhaust gas could be achieved by increasing the percentage of biodiesel. However, in terms of SOF concentration, B100 emitted the highest SOF concentration among all tested fuels. As the engine load was increased, the SOF concentration tended to increase. Thus, more SOF was produced in the exhaust gas as the percentage of biodiesel increased. The present studies are in agreement with this finding. In term of DS concentration, less DS in the exhaust gas could be achieved by increasing the percentage of biodiesel. Thus, it was revealed that POME had the capability to reduce DS effectively compared to mineral diesel fuel. As the engine load was increased, the DS concentration tended to decrease. POME fuel, which had a high oxygen content, could reduce locally fuel-rich regions and limit soot formation, thus reducing DS emissions.


