Intrinsic Variability in the Degradation of a Batch of Commercial 18650 Lithium-Ion Cells


1
Maxim Integrated, San Jose, CA 95134, USA
2
Hawaii Natural Energy Institute, School of Ocean and Earth Science and Technology, University of Hawaii at Mānoa, Honolulu, HI 96822, USA
*
Author to whom correspondence should be addressed.
Energies 2018, 11(5), 1031; https://doi.org/10.3390/en11051031
Submission received: 31 March 2018
/
Revised: 20 April 2018
/
Accepted: 20 April 2018
/
Published: 24 April 2018
(This article belongs to the Section D: Energy Storage and Application)
Abstract
:The use of lithium batteries for power and energy-hungry applications has risen drastically in recent years. For such applications, it is necessary to connect the batteries in large assemblies of cells in series and parallel. With a large number of cells operating together, it is necessary to understand their intrinsic variabilities, not only at the initial stage but also upon aging. In this study, we studied a batch of commercial cells to address their initial cell-to-cell variations and also the variations induced by cycling. To do so, we not only tracked several metrics associated with cell performance, the maximum capacity, the resistance, and the rate capability but also the degradation mechanism via a non-invasive quantification of the loss of lithium inventory (LLI), the loss of active material (LAM) and the kinetic degradation on both electrodes. We found that, even with small initial cell-to-cell variations, significant variations will be observed upon aging because the cells degrade at a different pace. We also observed that these variations were not correlated with the initial variations.
1. Introduction
Lithium-ion batteries have numerous applications in today’s world. Some key markets for lithium-ion batteries include cell phones, notebook personal computers (PCs), electric vehicles [1], and grid storage [2]. In high output voltage applications, a number of lithium-ion cells are generally assembled in series to meet system requirements. For notebook PCs, two to four cell strings are usually required; whereas, in vehicle applications, this number can be as high as 100. Even larger series of cells can be necessary for grid storage. This convenient scalability in battery pack design comes with some drawbacks. One of them is the fact that a string of lithium-ion cells will only be as durable as the weakest of its components. This axiom is true with regards to both short-term (e.g., capacity) and long-term (e.g., degradation) considerations. As a result, to optimize the performance of a battery pack, it is desirable to match the intrinsic characteristics of the cells that constitute the battery pack. Regarding short-term considerations, impedance and capacity matching can be implemented at the end of the assembly line, in the factory, or upon delivery to the customer within its facility. Long-term considerations are more challenging to manage. Maximizing the lifetime of a battery pack stipulates that all of its cells degrade in nearly identical fashion so that there are no weak links. To date, variations between cells upon aging were shown to exist [3,4,5,6], and it is very difficult, if not impossible, to forecast the cycle-life of millions of cells in a timely and resource-efficient manner.
This is a problem because an intrinsic degradation variability that is too large or has yet to be quantified has several implications. For battery designers, it makes it difficult to compare competing cell designs and to identify a superior design. For battery integrators, it poses serious challenges with regards to charge-balancing strategies [7] and warranty terms. For academic researchers and prospective industrial buyers, it questions if a sound conclusion can be reached in durability studies with little to no repeatability. For customers of battery-powered devices, it could cause loss of use and financial hardship should a cell wear out prematurely.
A discussion on the state of the art techniques to quantify as-received cell-to-cell variations is out of the scope of this paper. For such a discussion, the reader is referred to the article by Rumpf et al. [8]. The extent of initial cell-to-cell variations within a batch of cells, although not reported often enough, has been the topic of multiple studies in the literature [4,5,6,8,9,10,11,12,13]. Researchers have reported statistical studies on 12 [14], 50 [5,15,16], 100 [17,18,19,20], and 1000 [8,9,10,21] cells. All of these studies determined that cells within a batch are different and that these differences need to be quantified and taken into consideration. These studies focused on variations of capacity and resistance among the cells but did not address variations in the balance of the electrodes. This issue was recently investigated and the cell-to-cell variations on the electrode matching for a batch of 51 cells based on low rate cycling data were reported [22]. Previous literature showed that these initial variations could be characterized and thus quantified. To accommodate this spread of intrinsic degradation characteristics, some mitigation strategies can be implemented.
Few studies focused on long-term considerations [3,4,5,6]. In these studies, a noticeable spread in cycle-lives was reported. The conclusions of these investigations supported the hypothesis that, despite minimal cell-to-cell variations at the beginning-of-life (BOL), there existed an intrinsic variability in cycle aging and calendar aging of these cells. However, these studies failed to identify the actual origin of the observed degradation spread. To enable better back level durability modeling [23,24], it was crucial to examine further the actual extent of the degradation spread in commercial batteries. For this study, lithium-ion 18650-format cells were ideally suited by virtue of their very-high-volume production, the relative maturity of the production processes due to the ubiquity of these commodities, and their use in battery packs for current electric vehicles [25].
The aim of this study was to elucidate whether a set of commonly sourced lithium-ion batteries can experience significant variations within their degradation behavior over cycle-aging. There are two aspects to this question: first, are all cells degrading at the same pace; second, are all the cells degrading the same way. To answer this question, cells were cycled for 1000 cycles under identical conditions and analyzed on a capacity and resistance basis but also by non-invasive electrochemical voltage spectroscopies [26,27].
2. Materials and Methods
A batch of fifty-one 18650-format lithium ion cells was purchased from a commercial vendor. These cells were manufactured by LG Chemical Limited, (Seoul, Korea), under the model denomination “ICR18650 C2” and intended for notebook PC applications. The negative electrode (NE) was made of a graphitic intercalation compound (GIC), while the positive electrode (PE) was a blend of LiCoO2 (LCO) and LiNi4Co4Mn2O2 (NMC). The electrolyte composition was not disclosed. The recommended charge cut-off voltage was 4.30 V (associated with a 50 mA cut-off current). The recommended charge rate was C/2 and the maximum charge rate was 1 C. The recommended discharge cut-off voltage was 3.00 V and the maximum discharge rate was 2 C at ambient temperatures (5 to 45 °C). The nominal capacity was 2800 mAh and the maximum weight was 50 grams. The calculated energy density was approximately 208 Wh/kg classifying it as a high-energy cell by current standards.
2.1. Cell Conditioning and Cell-Aging Protocols
Upon reception, these cells were submitted to a set of conditioning procedures [18]. First, weights and as-shipped open-circuit voltages (OCV) were recorded. Second, the cells were exposed to a series of C/2 formation cycles within the recommended voltage window, 3.0–4.3 V, until a stable capacity was measured. Third, a reference performance test (RPT) was performed on every cell. This initial RPT schedule consisted of successive symmetrical constant-current cycles at C/25, C/5, and C/1 rates, within the recommended voltage window. Using the data collected as part of the RPT, some key cell performance metrics were derived for each cell in the batch. The collected data included the thermodynamic capacity, the capacity ration, the pseudo-OCV curve (the average of the C/25 charge and discharge curves), the internal series resistance, and the rate capability [18]. For convenience, the pseudo-OCV curve will be referred as OCV in the rest of this work.
Fifteen out of the 51 eligible cells were selected for a cycle-aging experiment based on the results of the conditioning test. These fifteen cells were concurrently cycled 1000 times in a controlled atmosphere at 25 °C between 3.0 and 4.3 V. The charge was performed in a conventional CC-CV fashion, and the rate was C/2, while the discharge rate was 1.5 C, both within the manufacturer’s recommendations. There were no rest periods between cycles. Cycle-aging was carried out in 10 sequences of 100 cycles. After each sequence, a simplified RPT was carried out. These simplified RPTs were the basis for our periodic characterization protocol and consisted of a C/25 discharge followed by a C/25 charge and a final C/25 discharge. The initial C/25 discharge was used to record the remnant capacity at the end of the 1.5 C discharge which preceded the RPT. This measurement served as an indication of the cell’s polarization evolution via probing the SOC at the end of a fast discharge. The following C/25 charge and discharge were used to track the same key metrics taken during the conditioning step.
In addition to these RPTs, each cell was subjected to an extended cycle every 25 cycles of the cycle-aging schedule. These extended cycles were still carried out at a C/2 charge rate and the discharge rate was 1.5 C but a total of three 4-h rest periods were imposed before the charge, after the charge, and after the discharge. The rest cell voltages (RCVs) measured at the end of each of these three rest periods were later used to track the evolution of both the SOC at the end-of-charge (EOC) and the SOC at the end-of-discharge (EOD) as cycle aging progressed.
For all of the full-cell experiments, the test setup consisted of a multi-channel Arbin battery tester (College Station, TX, USA) and two Amerex climate chambers (Concord, CA, USA). The 18650 cells were connected to the testing channels using Arbin low-resistance cylindrical battery holders. Both voltage and current calibration procedures were carried out prior to the experiment.
2.2. Half-Cell Preparation and Testing
To conduct degradation diagnosis using incremental capacity (IC) analysis [27], ad-hoc data for both electrodes’ materials was needed. A sixteenth cell was slowly discharged to 3.0 V and carefully disassembled in an Argon-filled glove box. The electrodes, separator, and casing were harvested. Electrode discs (11.1 mm in diameter) were punched from the harvested PE and mounted in a polytetrafluoroethylene (PTFE) Swagelok cell assembly (12.7 mm in diameter). Prior to mounting, electrodes discs were rinsed in a dimethyl carbonate (DMC) solution, the back-side of the two-sided harvested electrode was wiped clean using cotton swabs soaked in N-methyl-2-pyrrolidone (NMP) solvent and then rinsed again in a fresh DMC solution. Metallic lithium scrapped onto a stainless steel pellet was used as counter and reference electrode in a two-electrode configuration. An electrolyte solution of 1.0 M LiPF6 in ethylene carbonate (EC) + DMC (1:1 by weight) + 2% wt. vinylene carbonate (VC) was used to soak into the separator, which consisted of two layers of GF-D fiberglass discs (12.7 mm in diameter, Whatman, Kent, UK). Once sealed, the Swagelok cells were taken out of the glove box and connected to a multi-channel VMP3 potentiostat (Bio-Logic, Claix, France) for testing. Formation cycles were performed at C/3 with a voltage range of 3.0–4.4 V for the NMC-based half-cells. Upon receiving stable reversible capacity, half-cells were then subjected to an extensive RPT schedule consisting of successive cycles at C/30, C/20, C/10, C/5 and C/2. In addition, the PE was studied by scanning electron microscopy (SEM) using a S-4800 Field Emission Scanning Electron Microscope (Hitachi, Tokio, Japan) equipped with an INCA X-Act EDS System (Oxford Instruments, Abingdon, UK) for energy-dispersive X-ray spectroscopy (EDX).
Emulations of the full-cell voltage response were performed using the ‘alawa toolbox [28] that is based on a mechanistic degradation model published in a previous paper [29]. The PE data was imported from the half-cell experiments. Stock data was used for the NE (taken from [22], cycled between 0.01 V to 1.2 V). Experimental validation supporting our simulation results based on loss of lithium inventory (LLI) and loss of active material (LAM) degradation modes has been reported by other groups [30,31,32].
3. Results
3.1. Initial Characterization
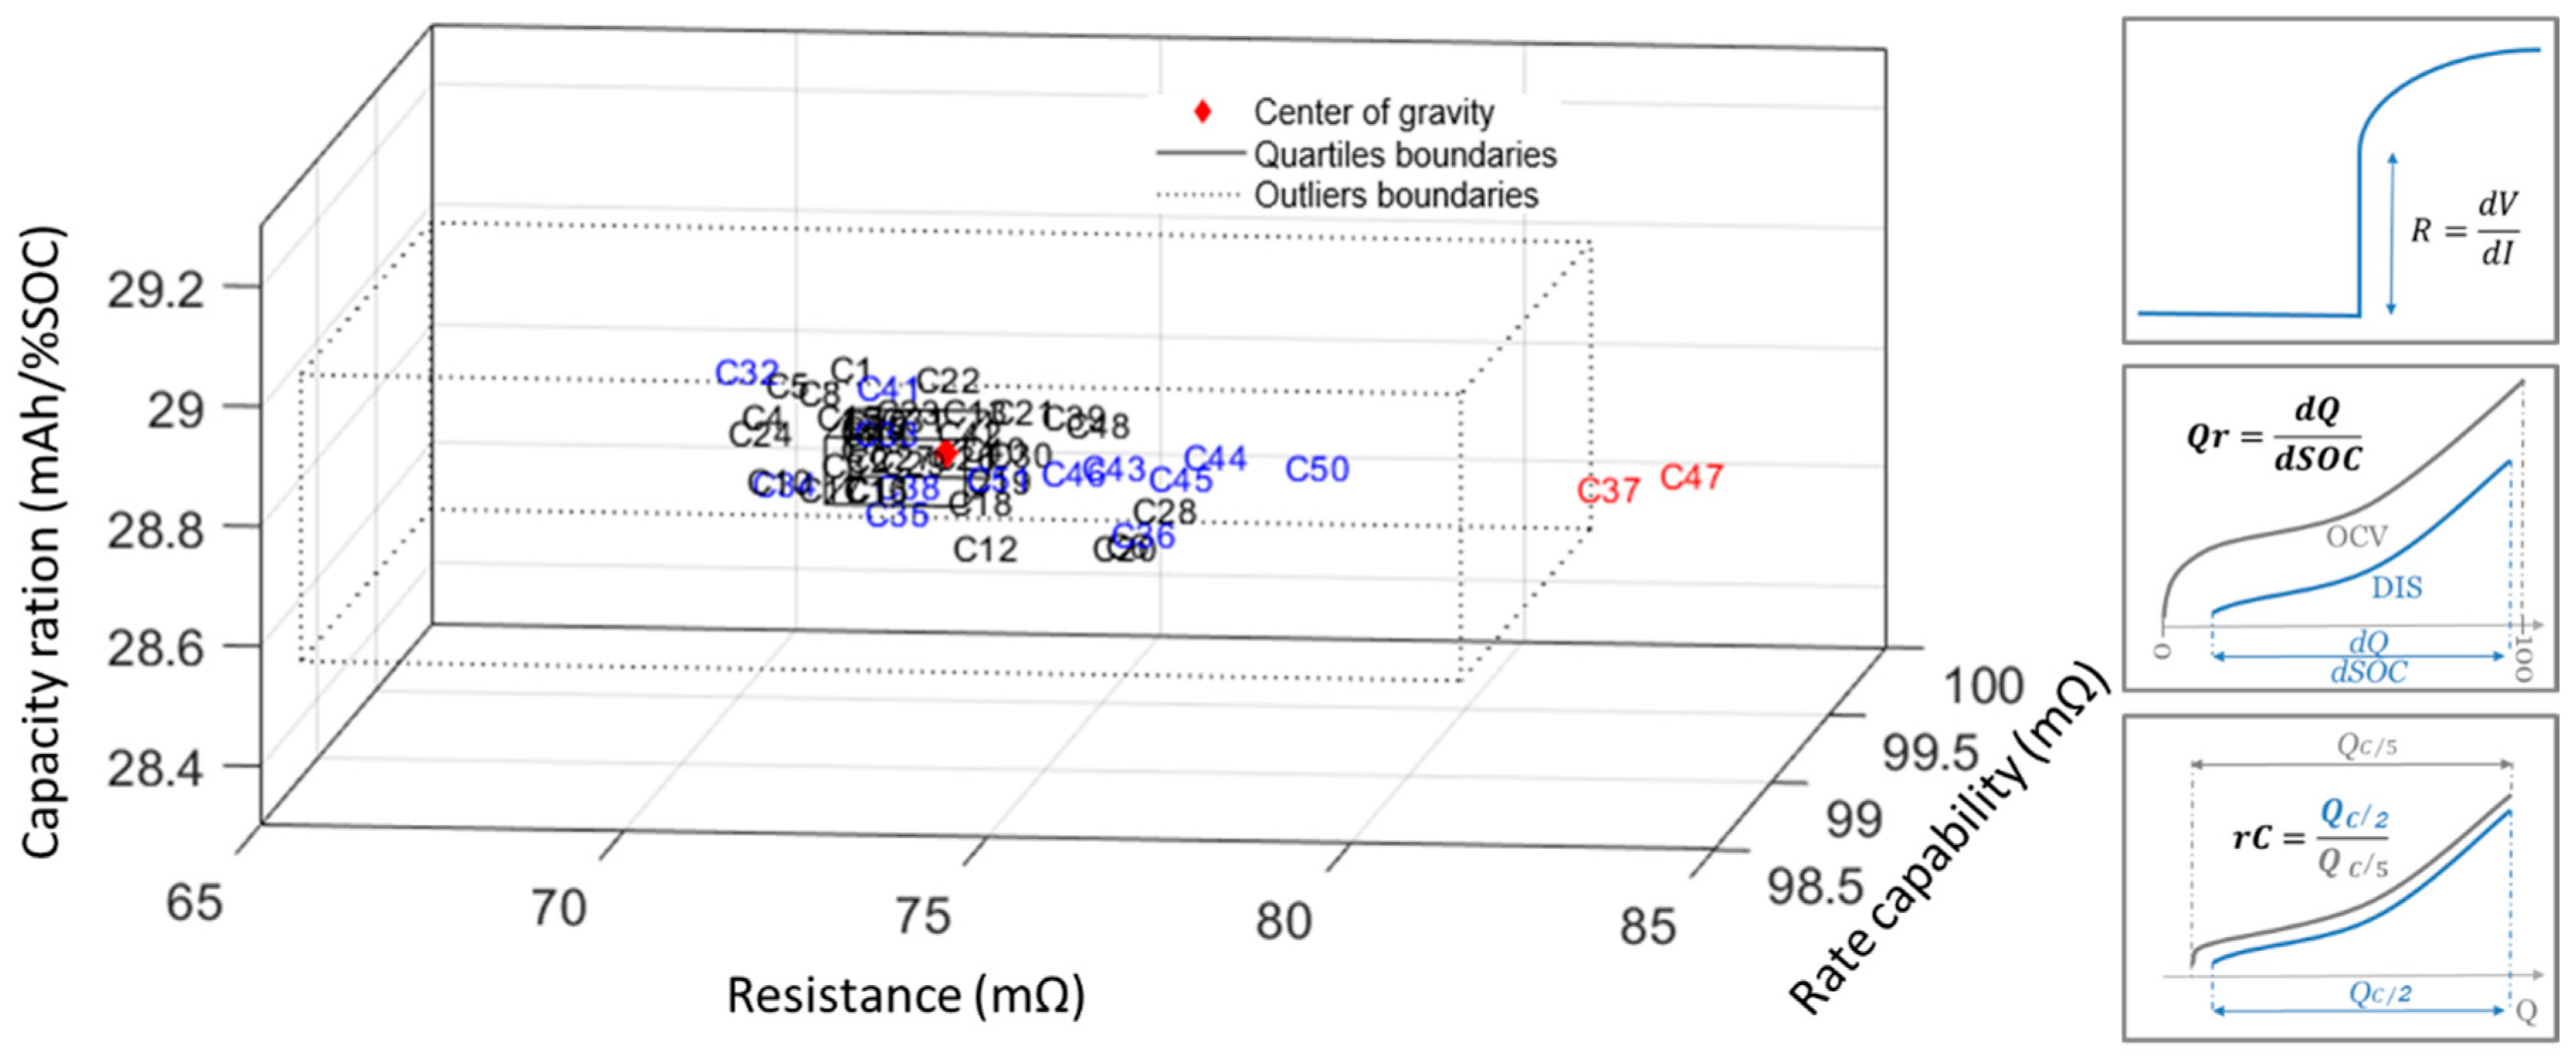
The cell-to-cell variations of the batch upon reception were analyzed using the data collected during the cell conditioning step [18]. The results of the initial conditioning and characterization tests (ICCTs) are compiled in Table 1. The cells weighed 45.8 ± 0.1 g on average and all were below the specified maximum weight of 50 g. The average as-received OCV was 3.726 ± 0.177 V. This spread was significant since this data corresponded to an average SOC of 26.7% ± 8.3% with some cells almost fully discharged when received. The capacities at C/5 and C/2 were consistent with the specified capacity of 2.8 Ah with averages of 2.86 and 2.84 Ah, respectively. To quantify the variability within the batch, a trio of cell characteristics were assessed, namely, the resistance (in mΩ), rate capability (unitless), and capacity ration (in mAh/%SOC), Figure 1. The resistance, R, was calculated from the ohmic drop between the RCV and the 1st point of the discharge at C/5. The average was 73.2 ± 2.6 mΩ. The rate capability, RC, was calculated by dividing the C/5 capacity by the C/2 capacity. The average was 99.3 ± 0.2. Finally, the capacity ration, Qr, was calculated by dividing the C/2 discharged capacity by the corresponding SOC range, as calculated from the RCV prior and after the discharge and an OCV curve. The average was 28.7 ± 0.1 mAh/%SOC. The findings are summarized in Figure 1 which displays a 3D map of the 51 cells assessed in this study associated with the different mean of calculation for the three attributes for cell-to-cell variations. This analysis suggested that two cells (in red font on Figure 1) exhibit resistances that were considered outliers (more than three times the standard deviation compared to the mean). These two cells were not used in the rest of this study. The cells tested are in blue font.
3.2. Cycle Aging Characterization
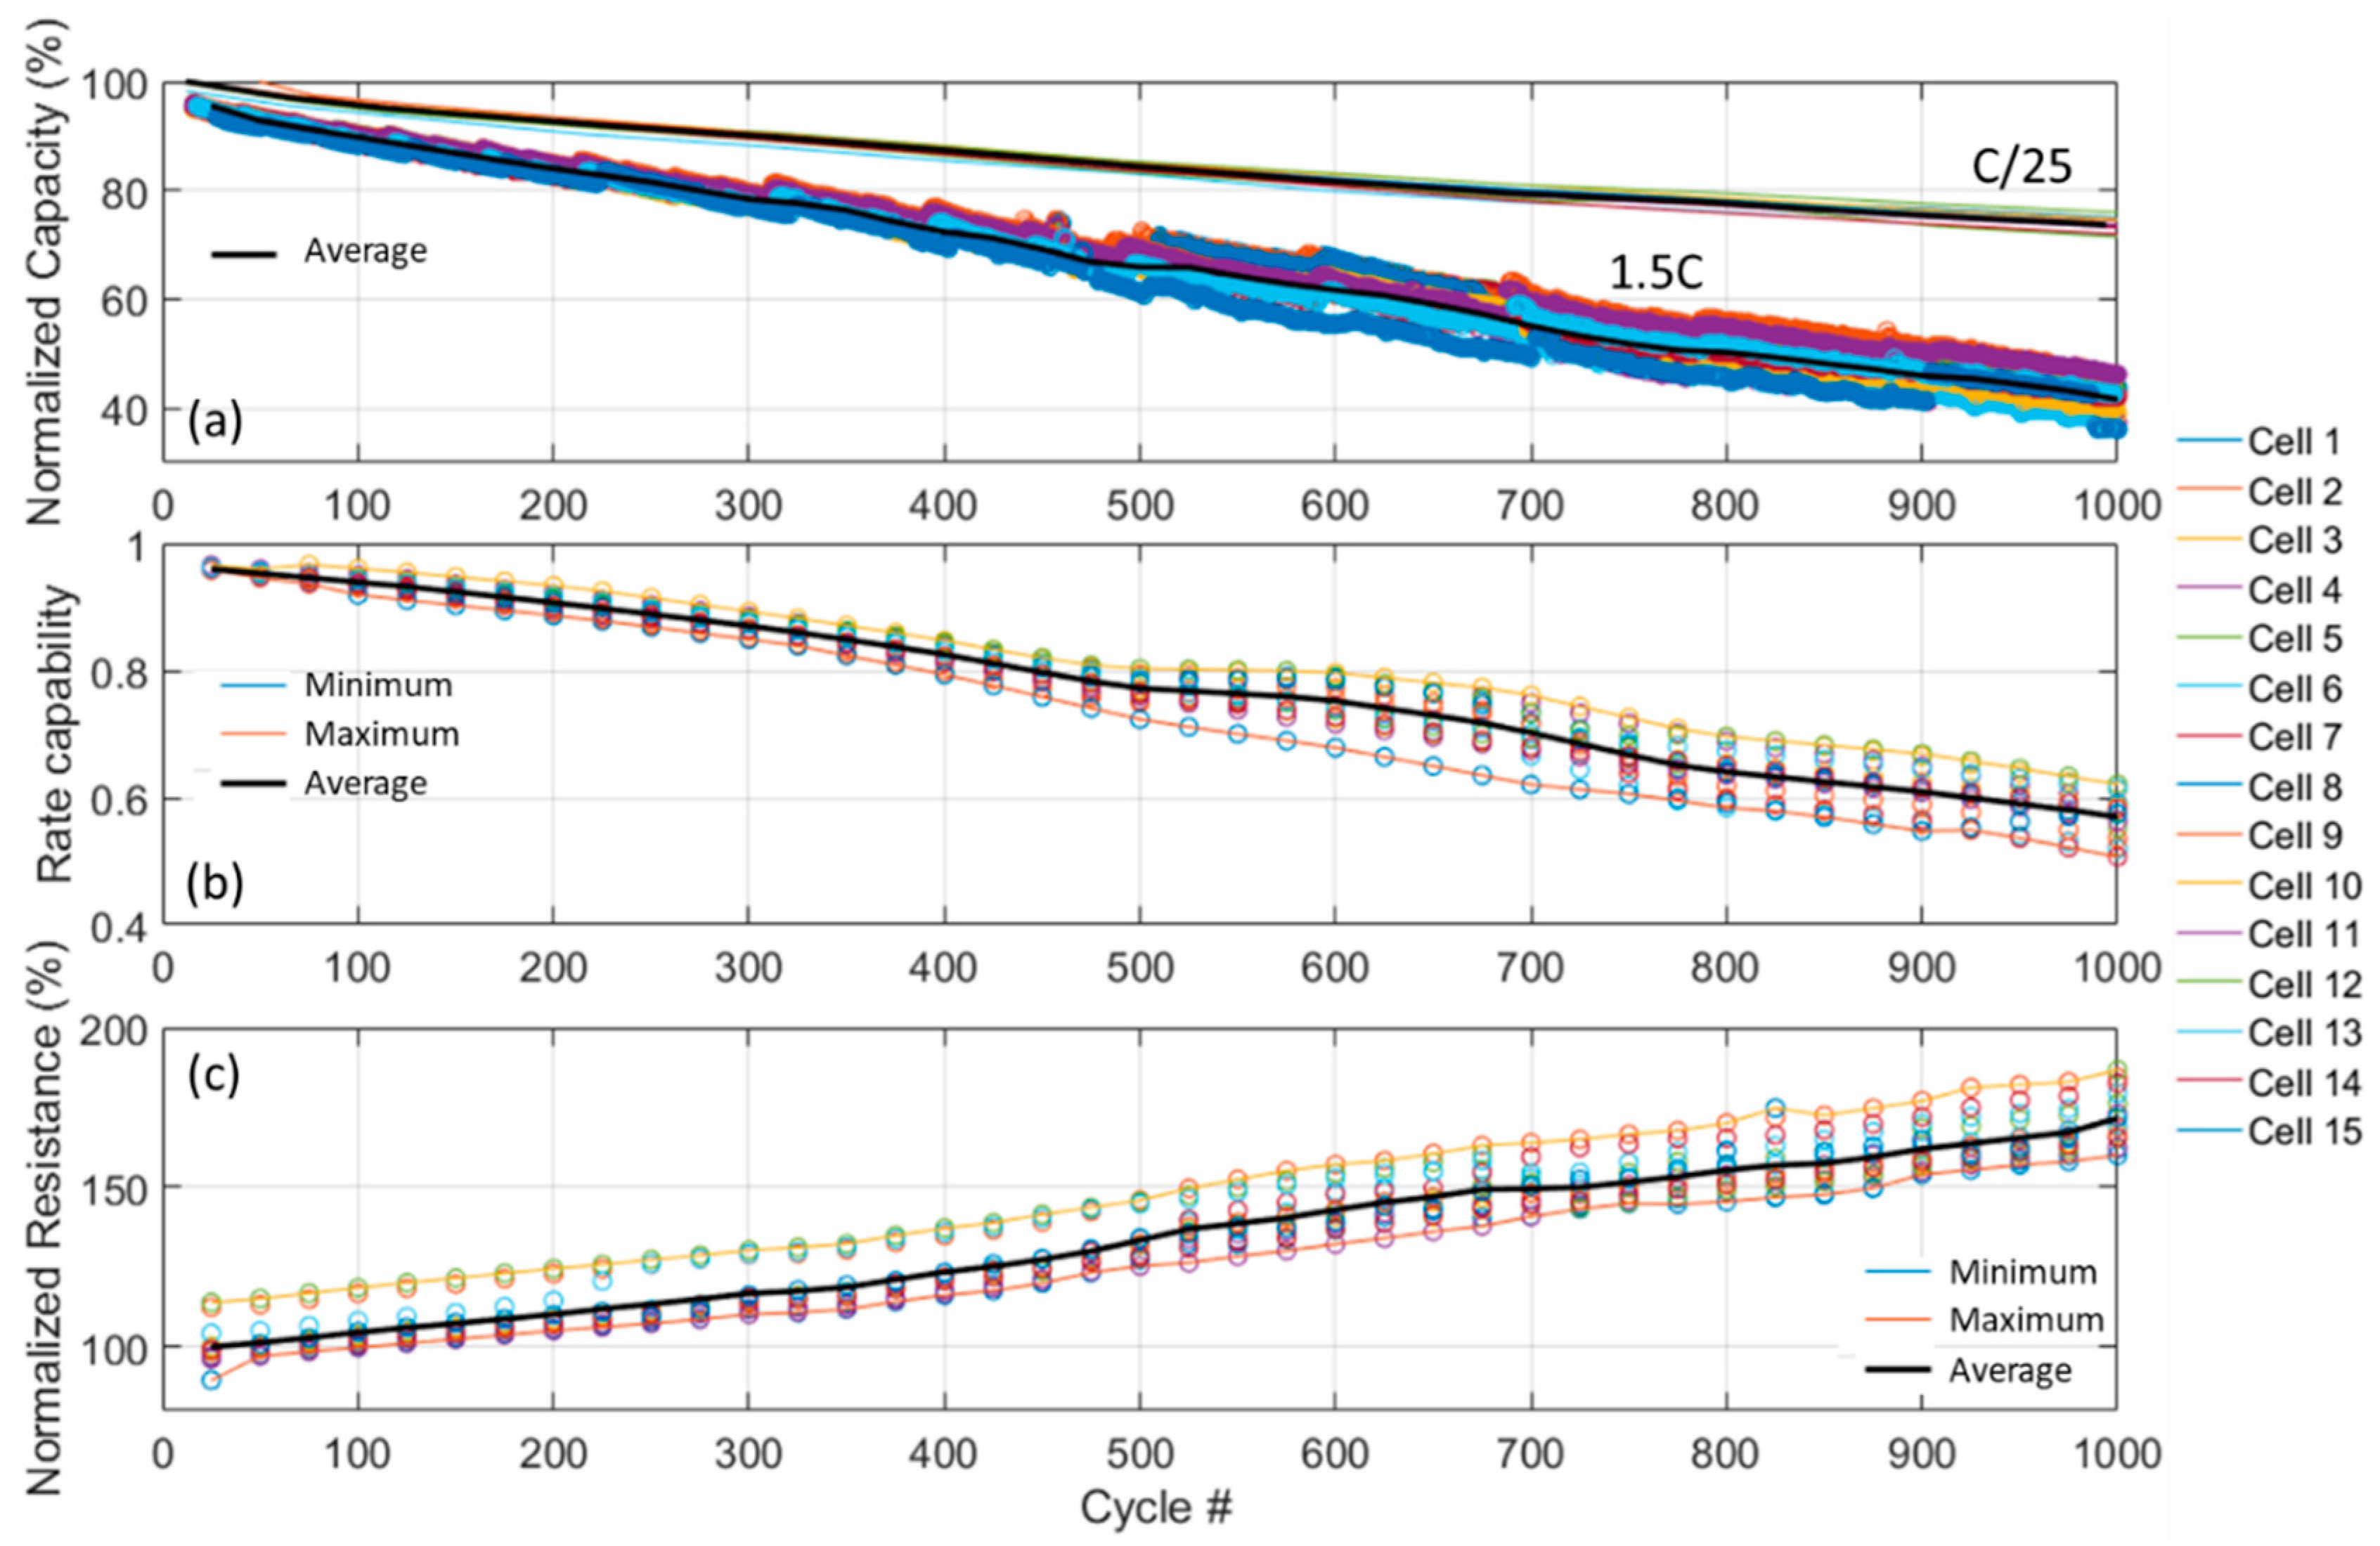
For this study, fifteen cells underwent 1000 1.5 C discharge and C/2 charge cycles. The data was analyzed using the same metrics as the ICCT. Figure 2 presents the results of the cycle-aging study. Figure 2a displays the associated capacity loss at C/25 and 1.5 C. Figure 2b,c showcase the evolution of the rate capability and the resistance, respectively, throughout the study. The cells did not all lose capacity at the same pace and the final capacity lost was between 50% and 60% for the 1.5 C cycling and between 25% and 30% for the C/25 cycling with a 2% standard deviation. This result implied that the worst degraded cell lost capacity 25% faster than the slowest one. The resistance increased on average by 70 ± 5% depending on the cell and the spread remained rather constant. The rate capability, the ratio of the 1.5 C capacity to the C/25 capacity, diminished on average from 96% to 57% with a 7% standard deviation. Results are summarized in Table 2.
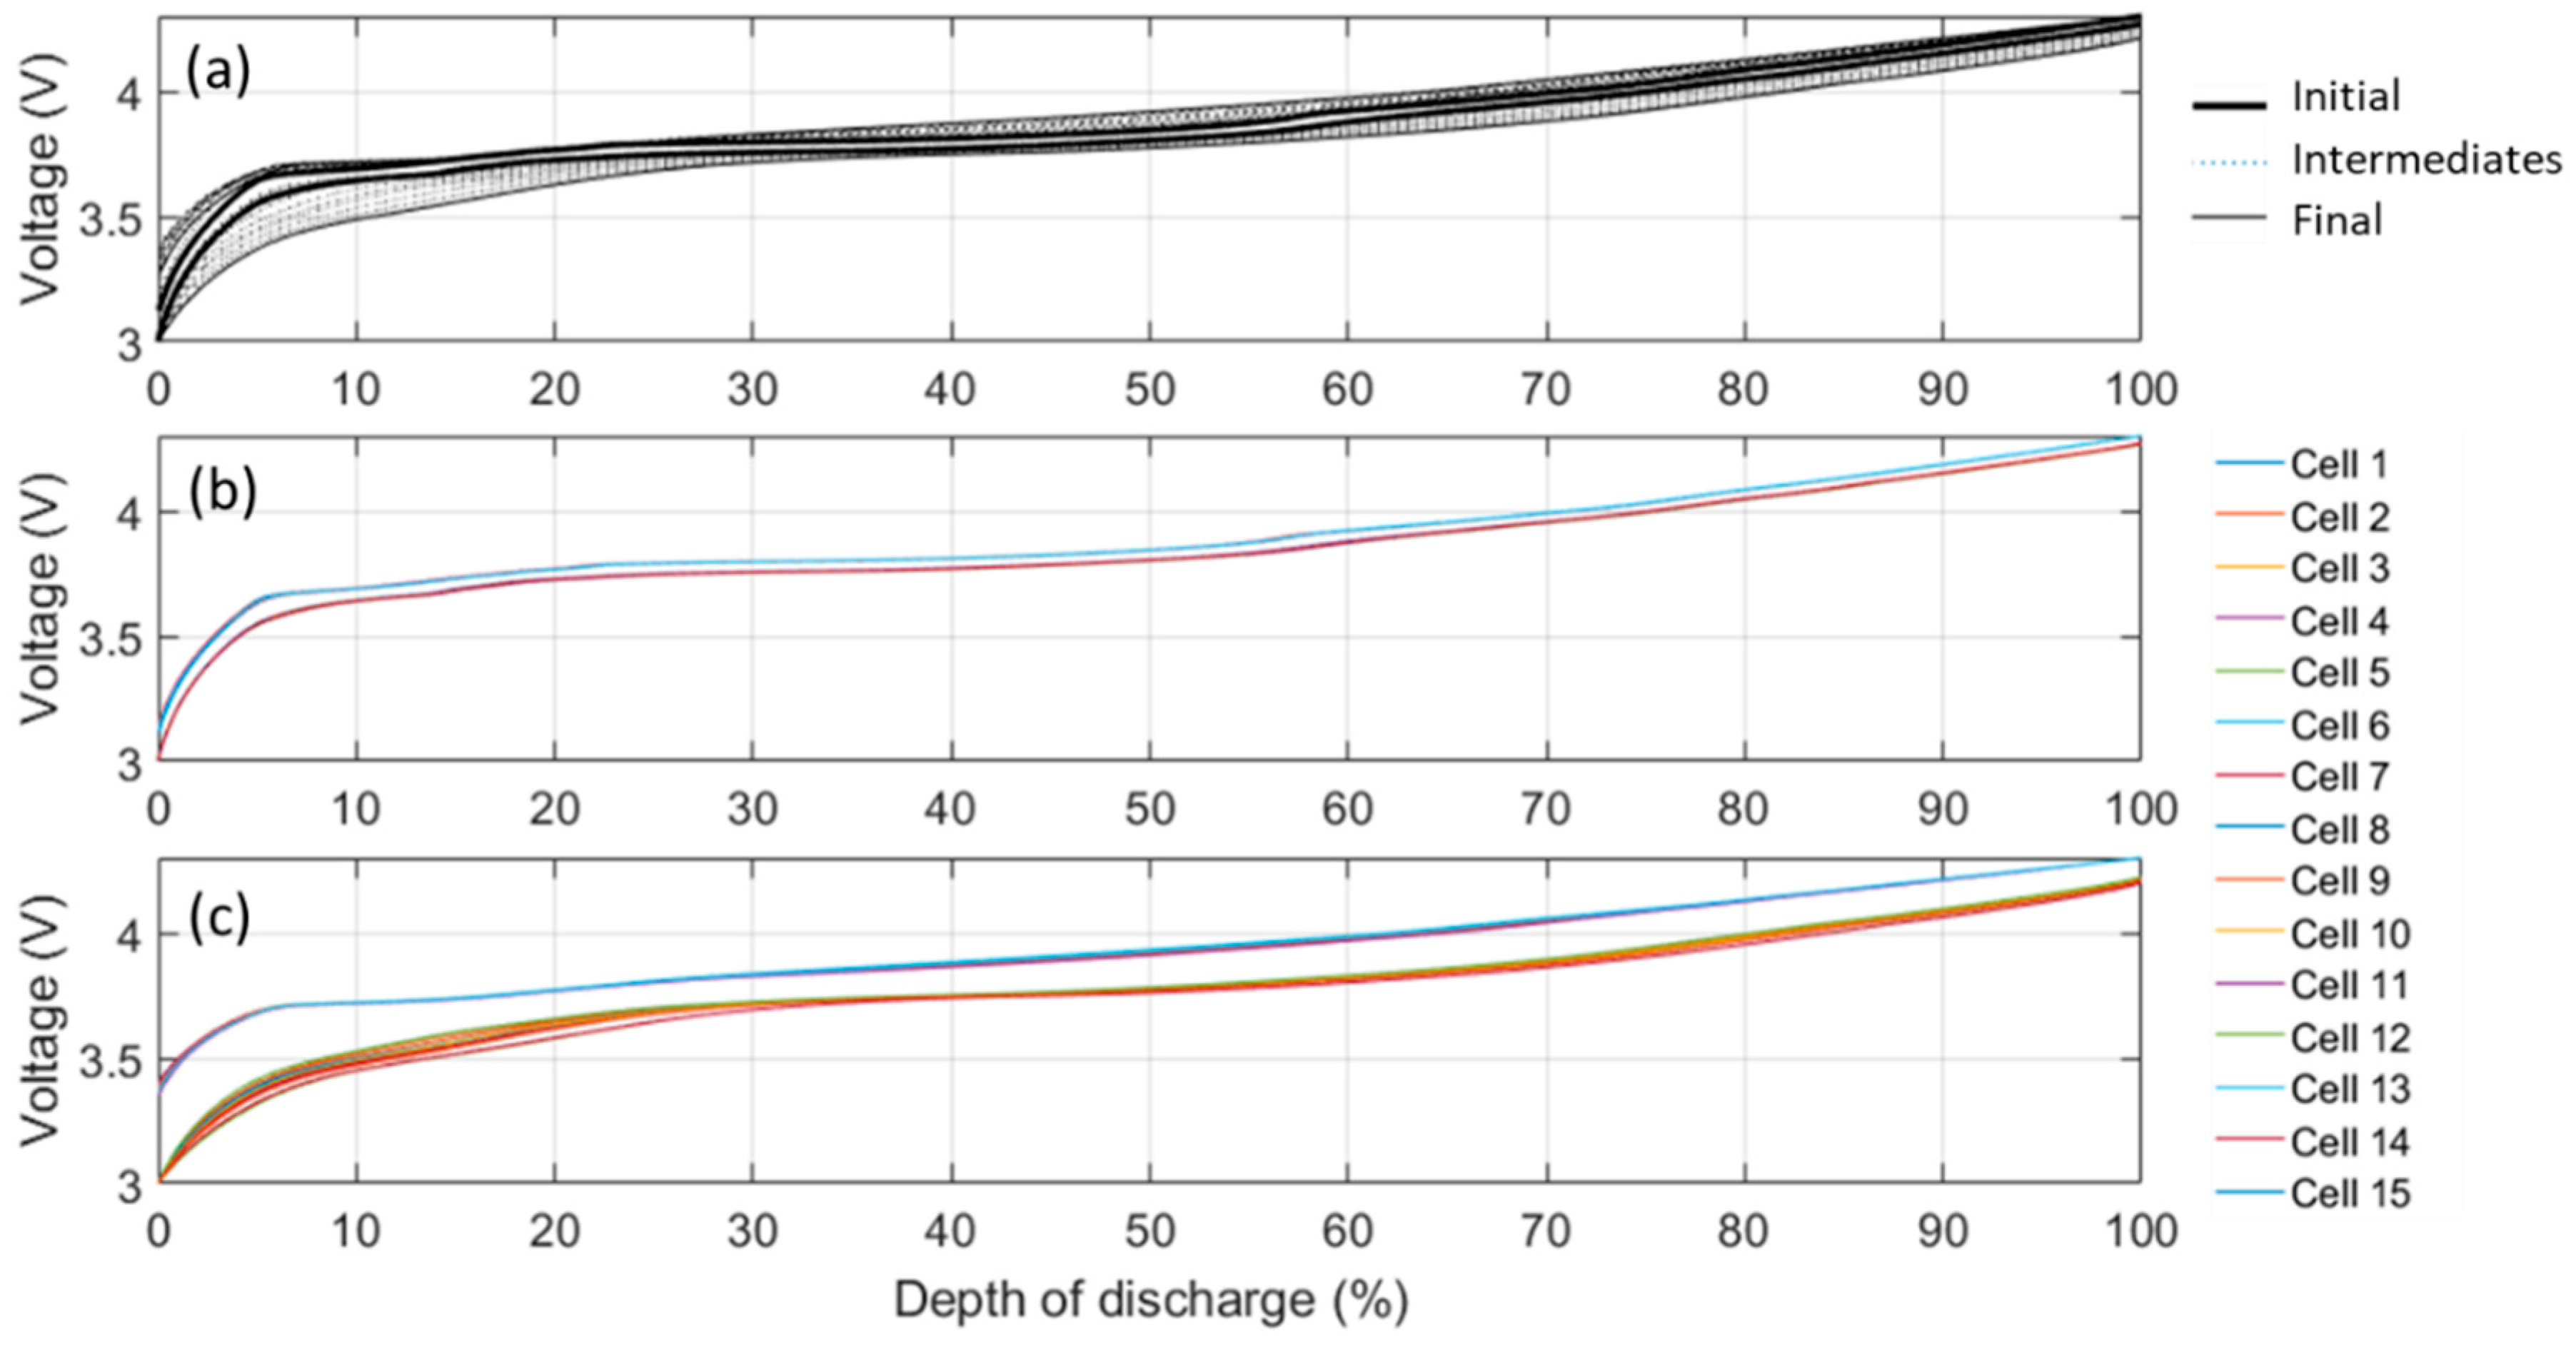
To characterize the cells further, their electrochemical behavior at C/25 was analyzed on a depth of discharge (DOD) scale. Figure 3a shows the evolution of the normalized C/25 voltage response upon aging in charge and discharge. The signature of the cell changed a lot upon cycling, especially the discharge curve. The potential at the beginning-of-discharge decreased by 58 mV which could either be related to undercharge or to the increase of polarization. A resistance increase of 80% on average accounted for only an 8 mV difference at C/25; therefore, the potential decrease was most likely imputable to undercharge. The EOD was also highly affected by aging with a gradual decrease of the potential below 30% DOD, far above what was induced by the increase of the resistance alone. The charge curve was less affected by the aging than the discharge one. The beginning-of-charge voltage increased, which was indicative of slight under-discharge. Additionally, the voltage in the mid-section of the charge curve rose as seen in Figure 3a. As a result, the charge and discharge curves became less and less symmetric with aging. Because of this growing asymmetry, the pseudo-OCV curves were not deemed accurate upon aging to infer SOC and the DOD scale was used instead.
A cell-by-cell comparison at the initial stage, Figure 3b, revealed that all curves were nearly overlapping. At the end of life, Figure 3c, the cells were all still similar, although there were areas where the curves differ, specifically in discharge below 3.7 V.
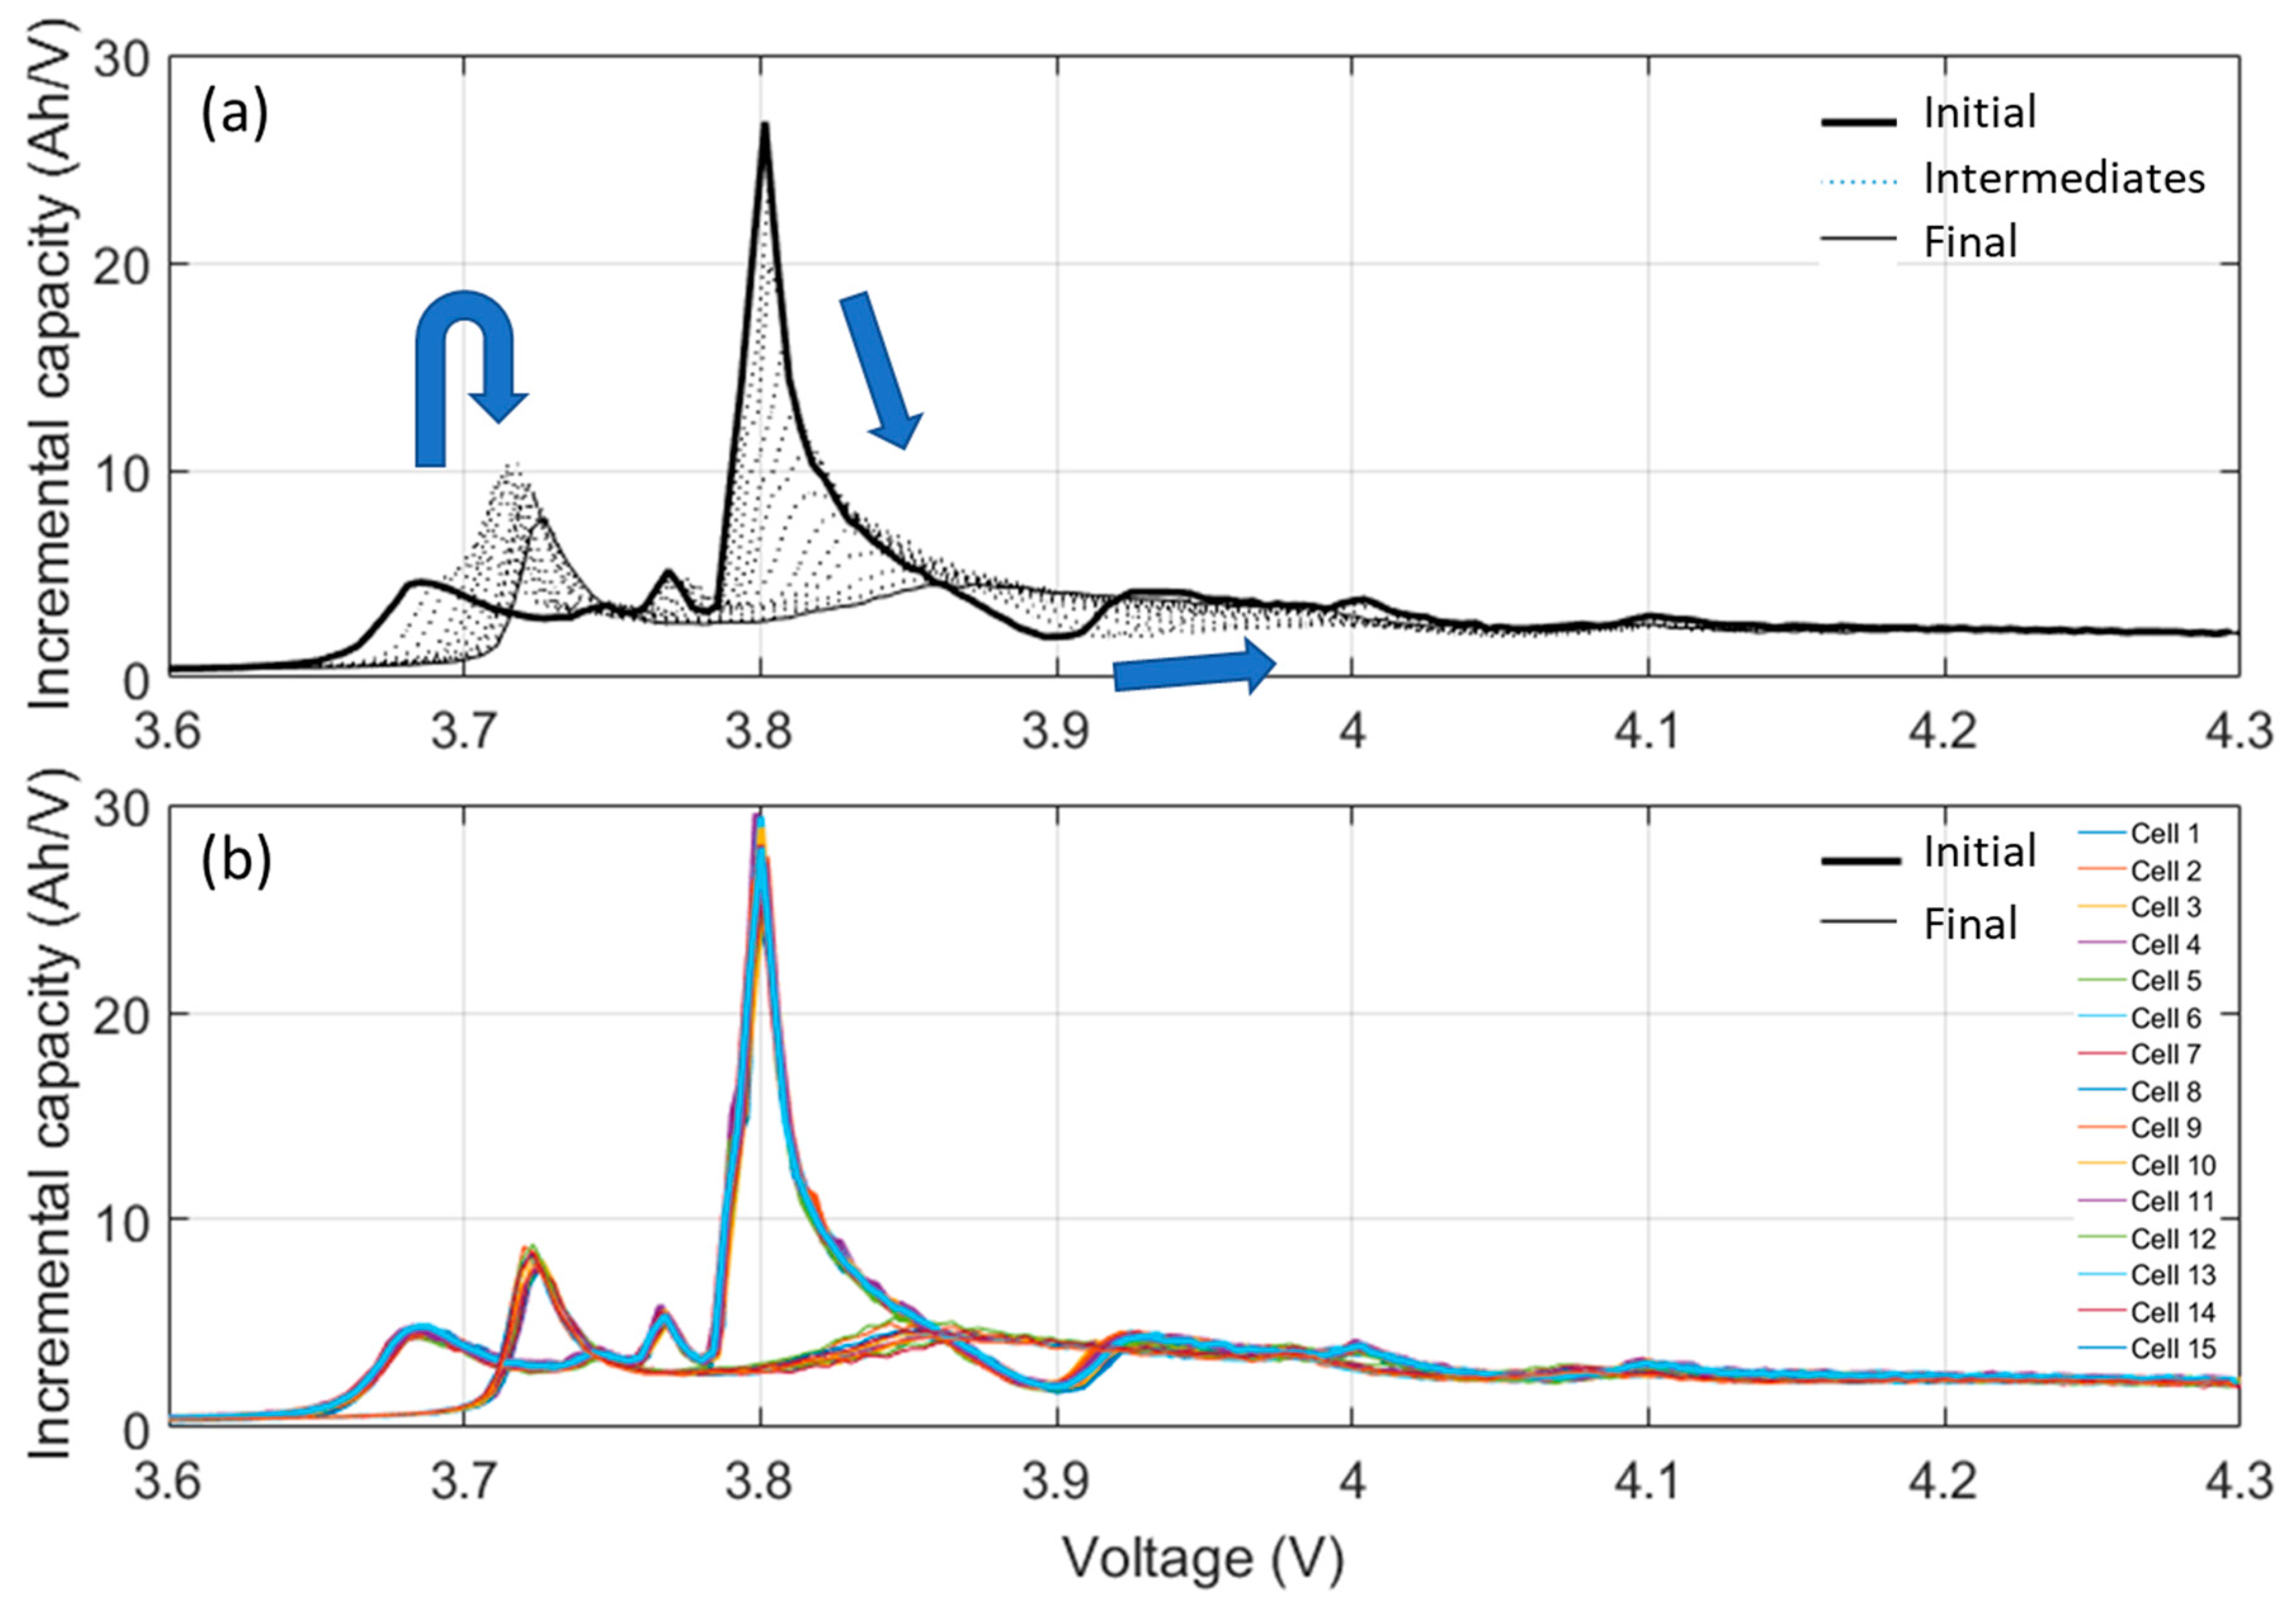
The impact of aging was more evident in the incremental capacity (IC) signatures of the cells. Figure 4a presents the evolution of the voltage response for cell 1 as changes in the IC curves. The most salient change to the curves occurred below 3.9 V. The peak at 3.7 V became sharper with aging, the intensity of main peak at 3.8 V decreased, and the intensity of the minimum at 3.9 V increased. All three features also shifted towards higher potentials. Overall, the variations exhibited by each of the cells were similar, Figure 4b. The only marked difference after aging between the cells was the shape of the peak at 3.85 V in the final IC curve.
3.3. Full Cell Emulation
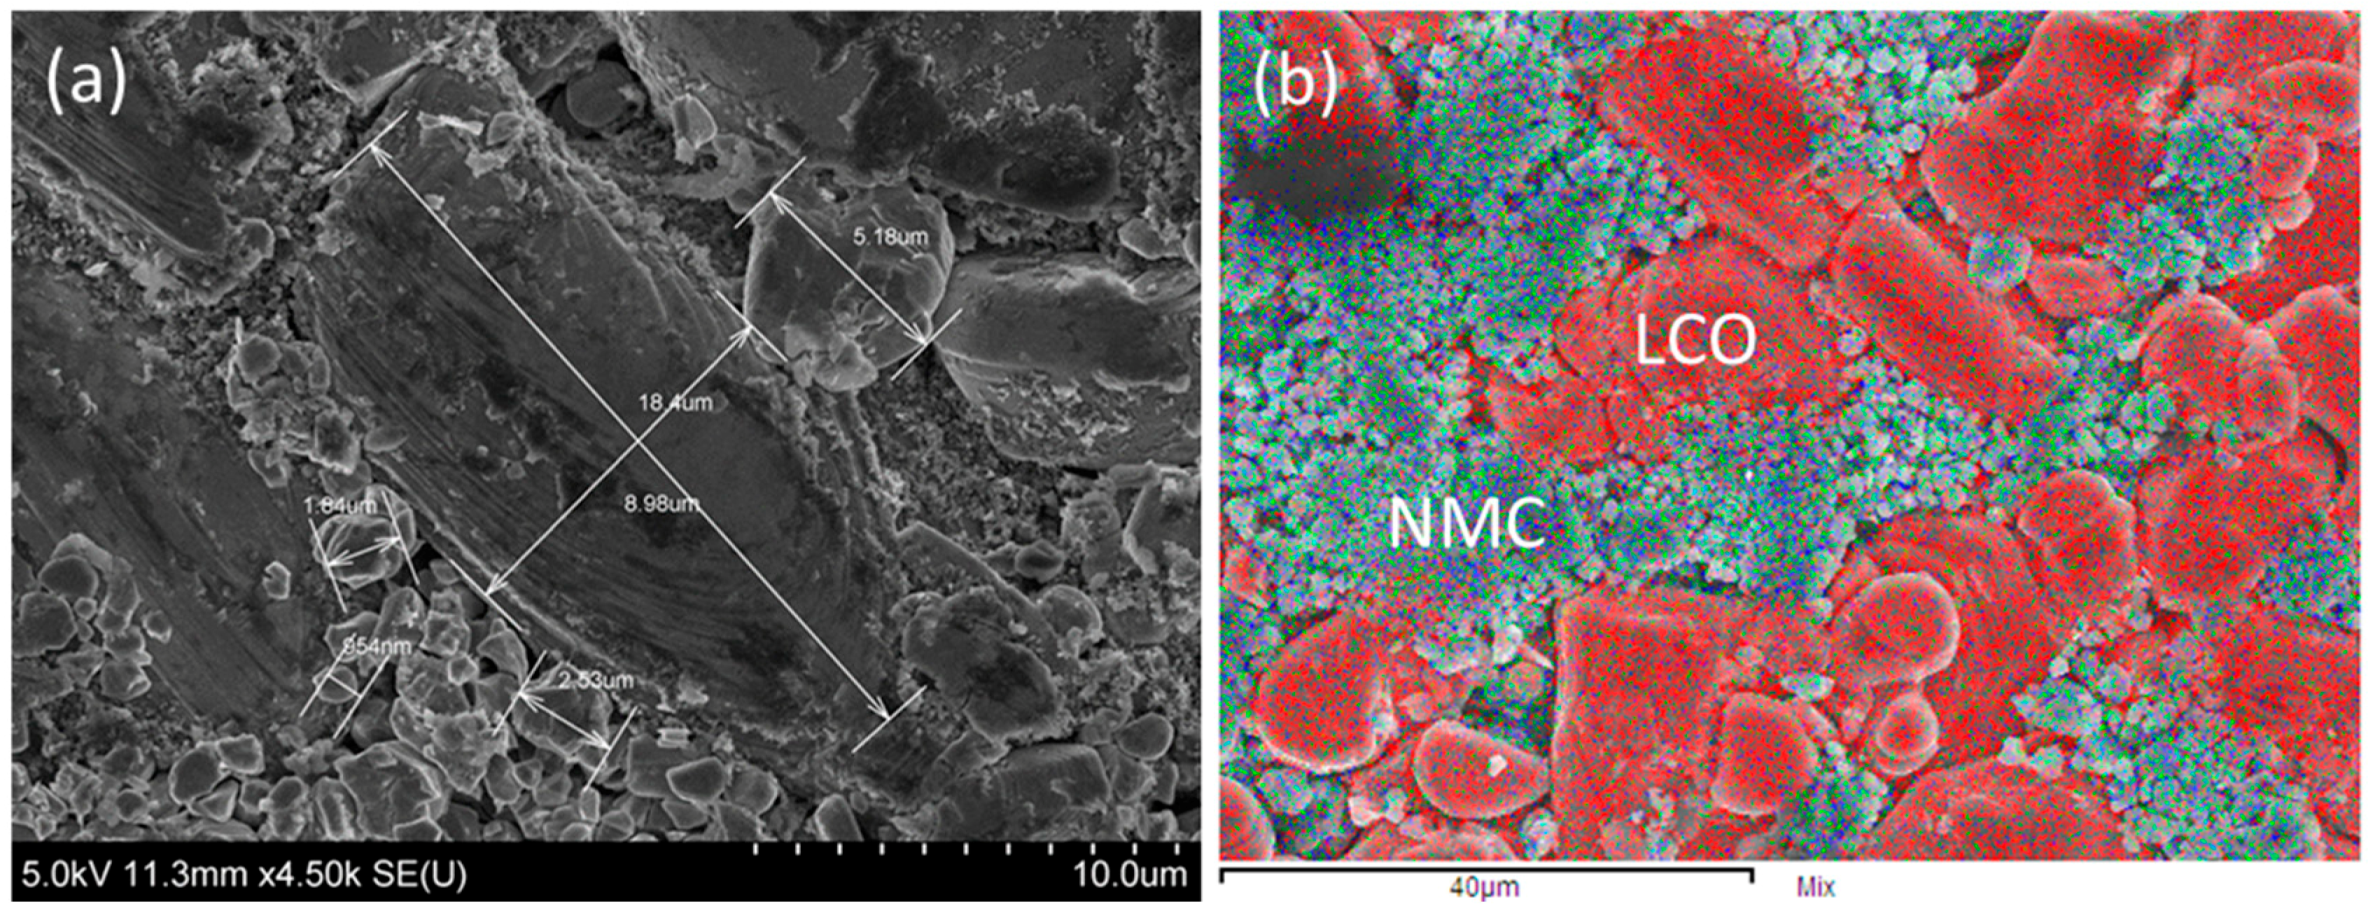
To analyze the complex evolution of the IC curves, it was essential to understand first the matching of the PE and the NE at the initial stage; then the dominant degradation mechanisms were investigated individually. The first step was to determine the electrode materials in this cell. The exact chemistry of the PE was not specified by the manufacturer specification sheet, although the safety data sheet (SDS) reported the presence of cobalt, nickel, and manganese. From the shape of the C/25 curve, Figure 3a, it appeared that the PE was a composite electrode. Indeed, the voltage response did not correspond to pure NMC. To decipher the exact chemistry of the PE, it was analyzed using SEM and EDX (Figure 5).
The SEM picture depicted two different types of grains with some large in the 10 µm range and some in sub-micrometer range. The EDX analysis proved that the only transition metal in the large grains was cobalt; whereas, the small ones contained nickel, manganese, and cobalt. From this analysis, the PE was determined to be a composite of LiNi0.4Mn0.2Co0.4O2 and LiCoO2.
The ratio between the two phases of the composite electrode could not be measured accurately from the SEM analysis. However, it was estimated to be 60% LCO/40% NMC from the analysis of the voltage response of the PE based on the length of the LCO plateau at 3.8 V, which represented about 50% of the LCO capacity, compared to the full capacity of the electrode.
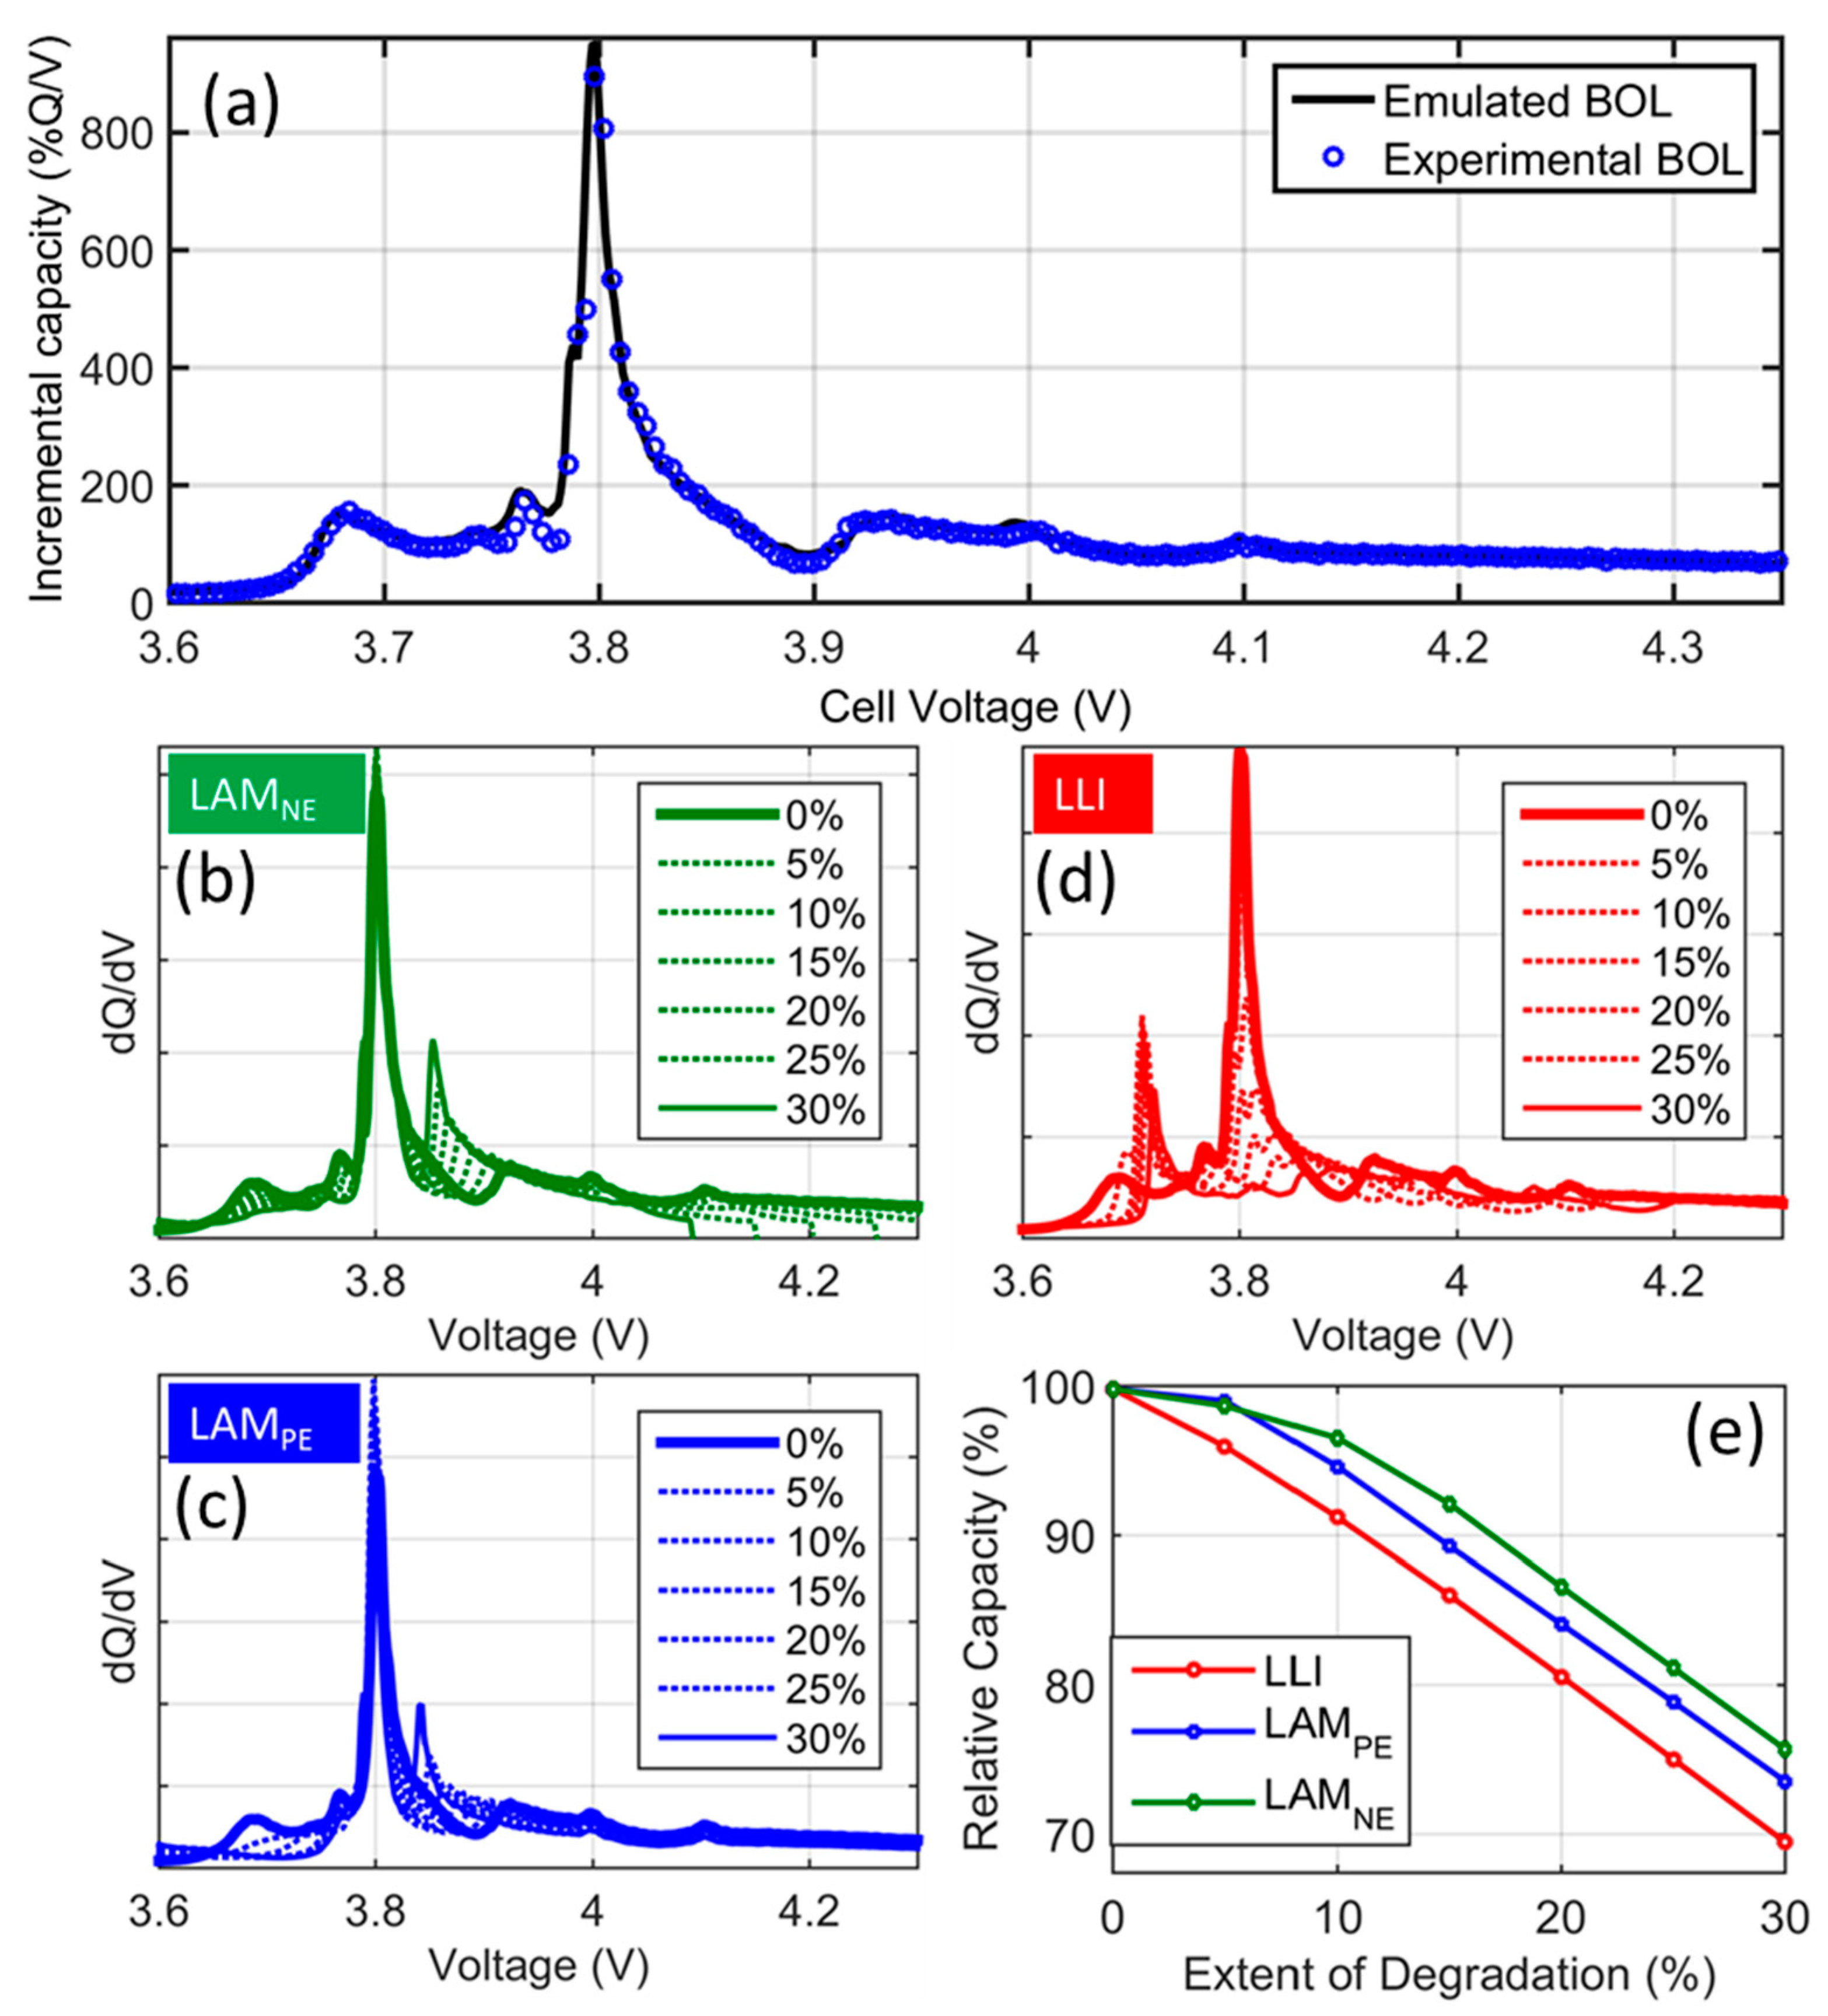
The half-cell data obtained for the PE as well as data from a stock NE were used to build an emulated version of the full cell using the alawa toolbox [28] that allowed matching the full cell with the half-cell data based on two parameters, the loading ratio and the offset [29]. The loading ratio corresponds to the capacity ratio between the PE and the NE and the offset to electrode slippage induced by the formation of the SEI layer. Figure 6a presents the obtained match for the cell at the beginning of life. To reach this match, the loading ratio was set at 0.95 and the offset at 4.5%. Repeating the matching on the 14 other cells, offset variations were below 1% and the loading ratio was found to be between 0.95 and 0.975. This similarity in the cell emulations corroborated the small initial variations observed on Figure 3a. The emulated version of the cell was then used to elucidate the voltage changes that would be associated with up to 30% LAM on the NE, Figure 6b; the PE, Figure 6c; and the LLI, Figure 6d. The capacity losses associated with these degradations are reported in Figure 6e. If occurring alone, LAMNE would drastically change the voltage response of the cell at high potential and induce plating [29,33]. A new peak would also appear around 3.9 V and the low potential peak at 3.7 V would broaden. If occurring alone, LAMPE would make the 3.7 V peak disappear and reduce the intensity of the high voltage portion of the curve. Finally, if occurring alone, LLI would increase then decrease the intensity of the 3.7 V peak while shifting its voltage towards higher potentials, drastically reducing the main peak at 3.8 V and shifting the minimum intensity at 3.9 V towards higher potentials. However, only LLI would induce capacity loss immediately. There will be a delay in the effect of the LAMPE because the offset was positive; while, the effect of the LAMNE will be delayed because of the excess active material at high potential.
4. Discussion
4.1. Cell-to-Cell Variations
The standard deviation for the three main attributes to the initial cell-to-cell variations, Figure 1 and Table 1, were below 0.5% for both the rate capability and the capacity ration and below 3% for the resistance. These values were small compared to previous studies and in the literature [8,16,18,22]. The deviations in loading ratio values were small, below 2.5%, and no offset variations were measured (Figure 2b). The variations in loading ratio were higher than the ones reported in previous work; in contrast, the offset variations were lower [22]. Therefore, the cells were of high quality.
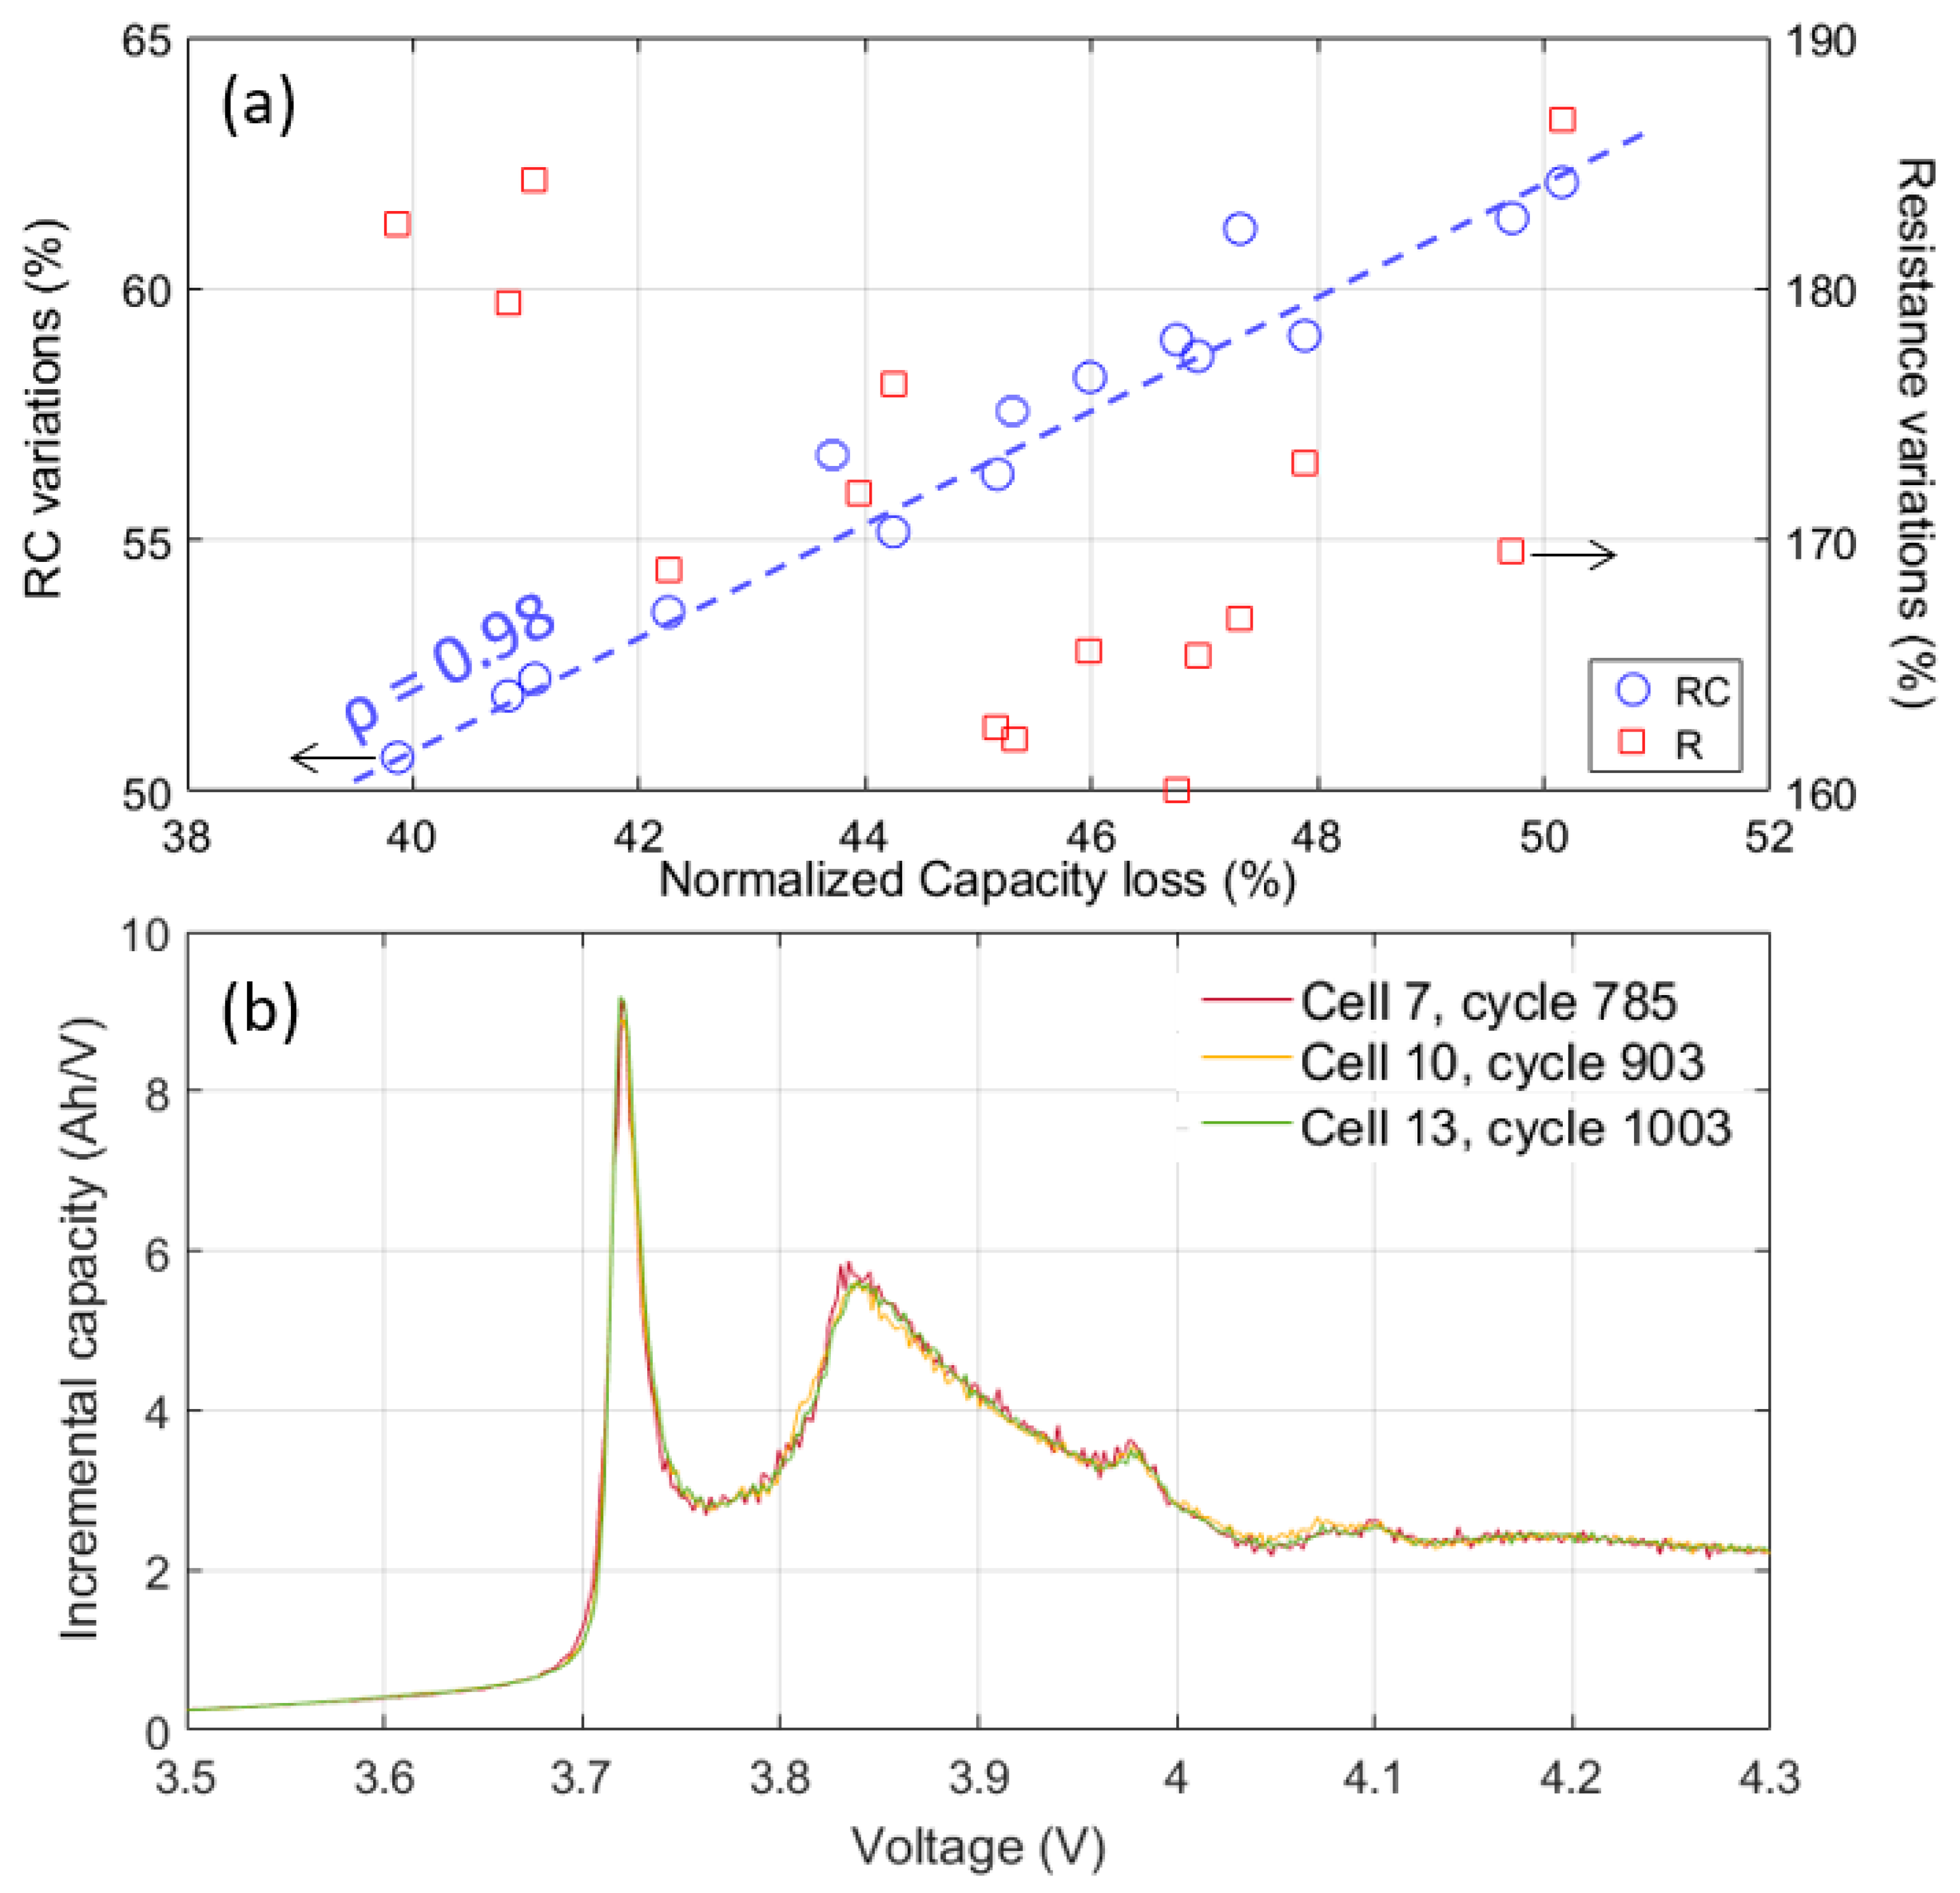
Despite the high quality of the cells, non-uniformity in aging was still observed. The nonuniform aging of the cells was apparent in their final properties. Some cells degraded up to 25% faster than the others did. The rate capability was strongly correlated with the normalized capacity loss evidenced by a correlation coefficient close to unity (0.98), Figure 7a. This finding was corroborated by an analysis of the RCVs as well as the remnant capacity measurement (not shown) where the capacity difference between low-rate and high-rate cycling was attributed to a diminishing SOC usage window at high rate. However, the resistance increase indicated no correlation with capacity loss. The correlation coefficient was calculated to be −0.32 which suggested, if anything, that the cells that degraded the most demonstrated the lowest resistance increase. No correlations were found between the initial values of resistance and rate capability with the final values, or any combination thereof, which implied that the initial properties had no impact on the degradation and that it would not be possible to select cells to degrade uniformly based on their initial characteristics.
A detailed analysis of the degradation was necessary to determine if the differences in capacity loss were induced by the same degradation mechanisms at a different pace or if they were induced by different degradation mechanisms.
4.2. Degradation Mechanisms
The cells tested lost capacity at different rates. To determine if the different degradation rates were due to different degradation modes, the IC response of the cells at an equivalent capacity loss were compared. An example is provided in Figure 7b with three disparate cells after 24% capacity loss. Cell 13 was among the cells that degraded the least; it exhibited 24% capacity loss after 1000 cycles. Cell 10 was among the cells that degraded the most and it took it less than 800 cycles to reach 24% capacity loss. Cell 13 was near the mean and required 900 cycles to reach 24% capacity loss. The IC signatures of the three cells were essentially overlapping. Therefore, it was concluded that the cells degraded similarly, but at different paces.
The analysis of the cell IC response (Figure 4a) using the information provided by the alawa analysis (Figure 6), allowed the determination of the cell degradation mechanisms. The experimental changes in the IC curves most resembled the changes associated with LLI, but it was necessary to check if LAM was occurring on the PE or the NE. Starting with the PE, the quantification was made by examining the IC intensity at the EOC (Figure 4a).
From Figure 6b–d it can be seen that LLI did not affect the EOC, that LAMNE changes the shape considerably, and that LAMPE decreased the intensity. Since the shape of the IC curves was not changing but their intensity only slightly decreased, a slight LAMPE was occurring throughout aging. However, for LAMPE to induce any capacity loss, it needed to be overcome the effects of the LLI [29,34]. This requirement would imply more than 25% loss of the positive electrode material. With only small observed variations of intensities, LAMPE was not responsible for the observed capacity loss. LAMNE was also ruled out as a source for capacity loss because the predicted shape of the curves did not match with what was found experimentally. Therefore, the capacity loss had to be induced solely by LLI. Since capacity loss and percent degradation due to LLI were directly proportional, it was calculated to be between 25% and 30% with a 1.7% standard deviation (Figure 2a). The evolution of LLI was linearly proportional to cycle number with slightly different slopes for the different cells.
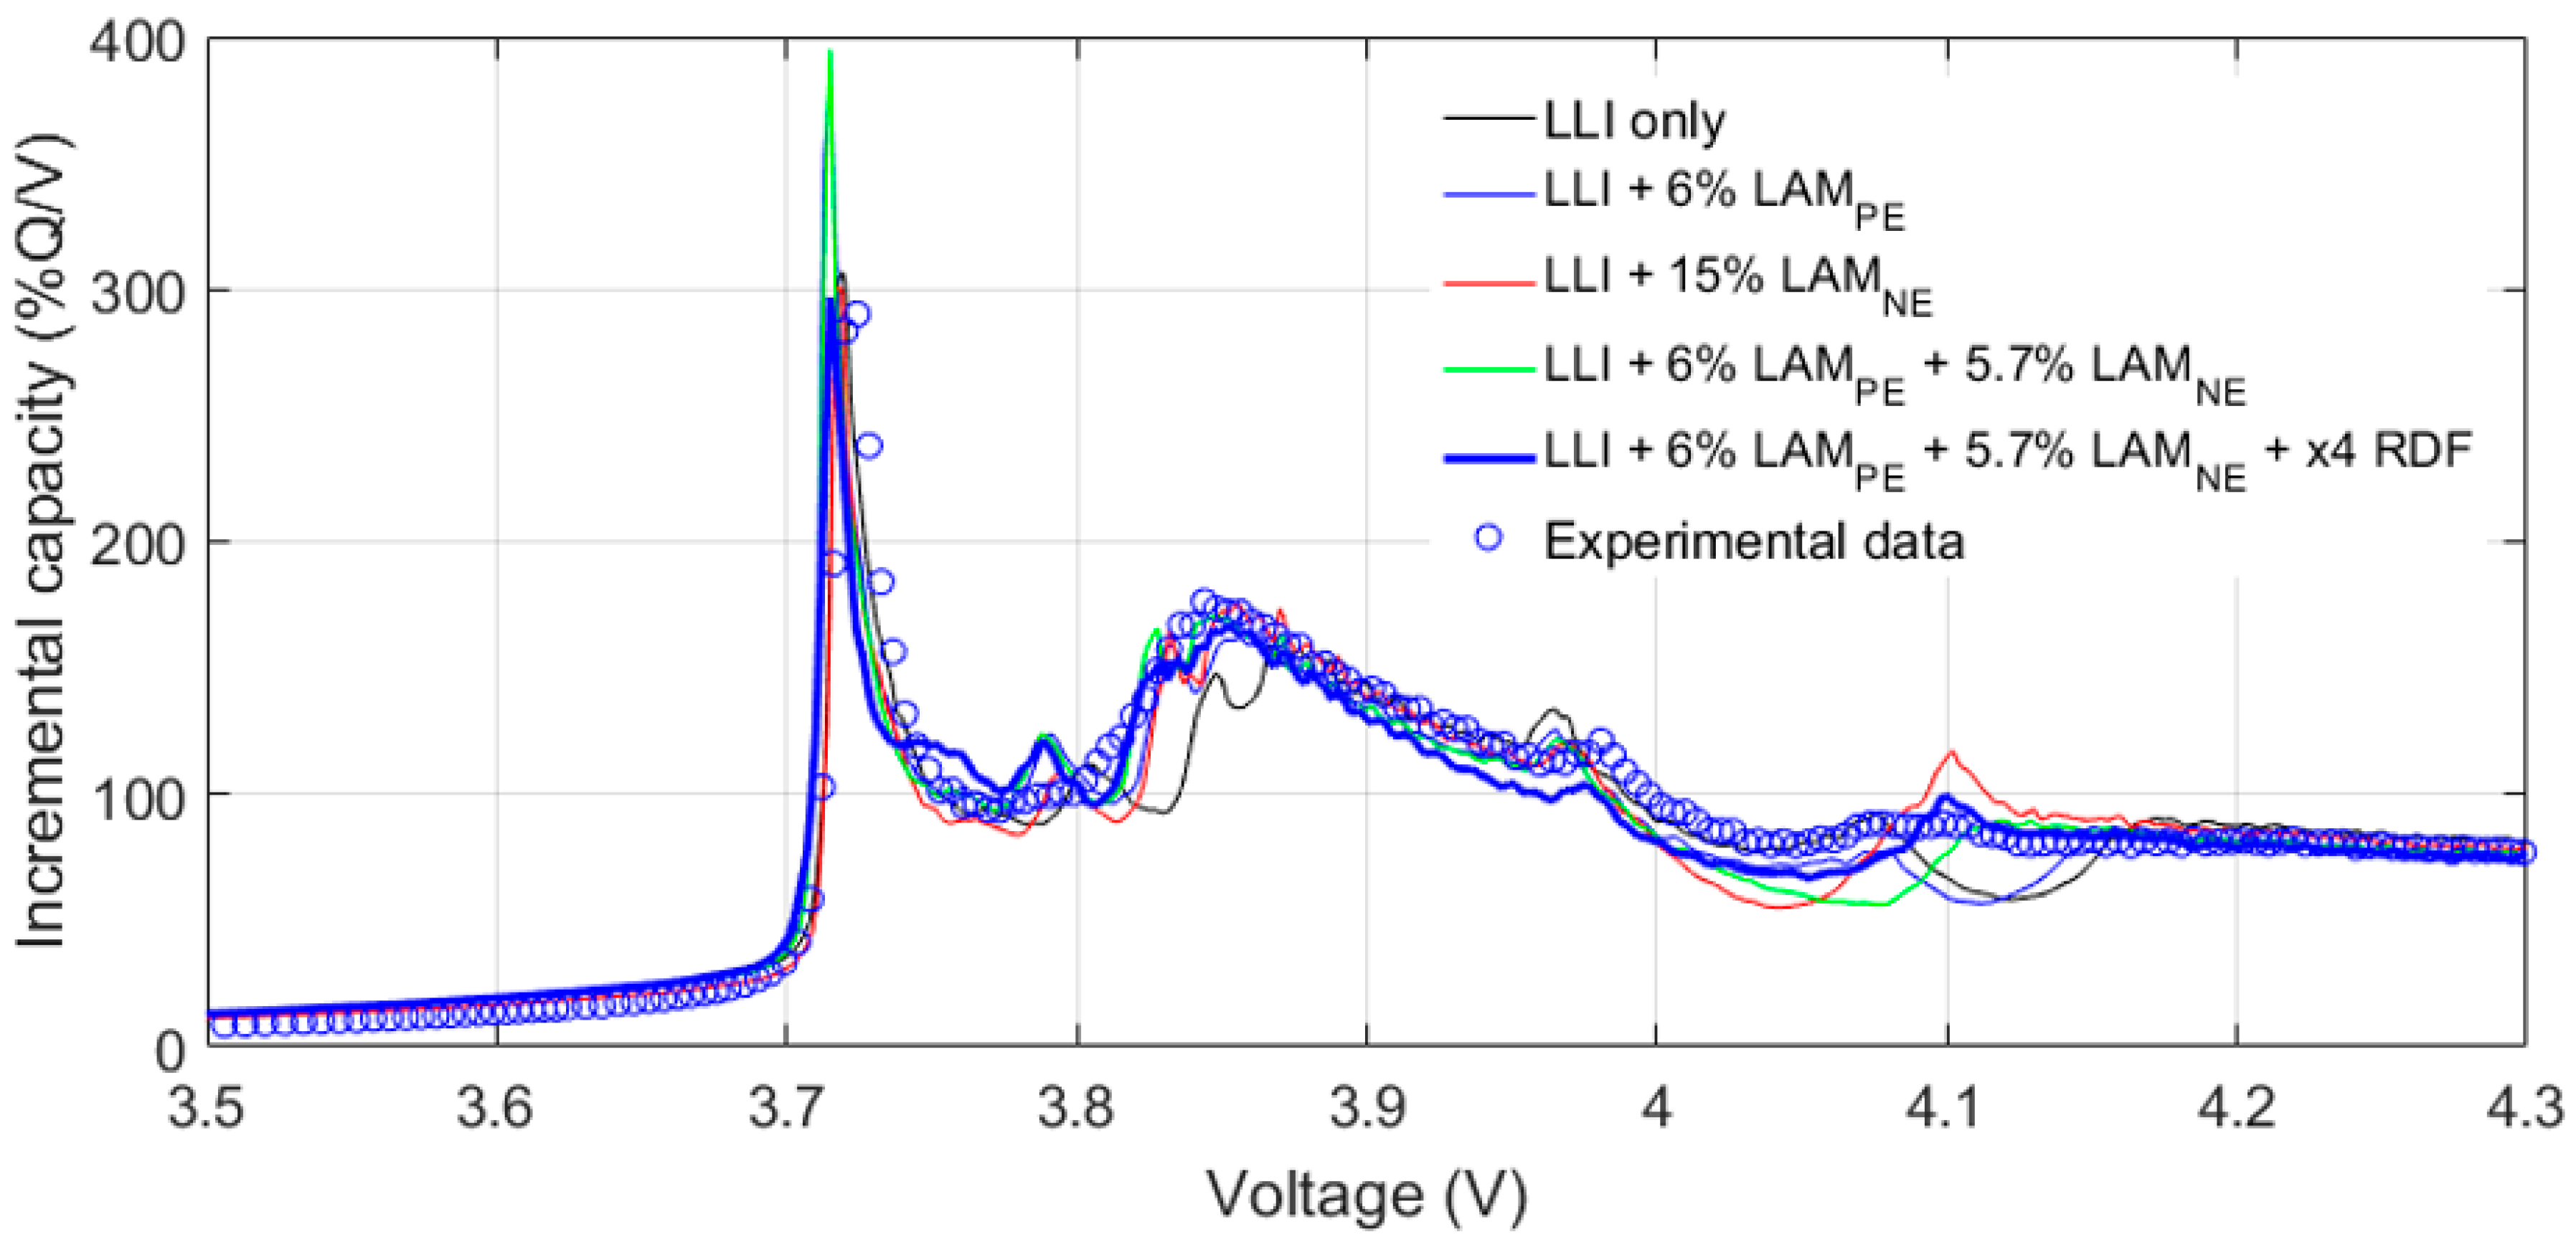
Figure 8 presents example fits after 1000 cycles for cell 1 under different degradation modes. The black curves present the simulation for LLI alone, as quantified from the capacity loss. The overall simulation was good, especially for the low voltage peak at 3.7 V but there were some discrepancies in the peak at 3.85 V and the position of the minimum above 3.1 V. To improve the matching, some LAMs needed to be introduced. Adding 6% LAMPE (thin blue curve) improved the fit of the 3.85 V peak but it also resulted in the overestimation of the intensity of the 3.7 V peak. Adding 15% LAMNE (red curve) also improved matching of the 3.85 V peak but it resulted in a poor estimation of the minimum at 4.05 V and overestimation of a peak at 4.1 V. The combination of both LAMs, each around 6% (green curve), was found to be even better fit to experimental data. It provided a good match for the 3.85 V peak but overestimated the intensity at 3.7 V and underestimated the minimum of intensity at 4.05 V. As discussed in a previous work, the position of this minimum of intensity was sensitive to the kinetics of the NE [34]. After adjustment of the NE kinetics (thick blue line) by a factor 4, the changes in the minimum position and intensity were properly matched. Accounting for the NE kinetics also reduced the intensity of the 3.7 V peak to a value similar to the experimental one. The resulting fit was considered optimum. Kinetic limitations on the PE were also identified from Figure 3a, but were difficult to estimate from the charge response.
The capacity loss and its spread whereas unambiguously introduced by LLI and some variations thereof in between cells but there also were some LAM. This LAM was especially interesting because it was about the same for the positive and NE. In fact, the loss on the negative was estimated at 0.95 times the loss on the positive which corresponded to the value of the loading ratio between the two electrodes. This relationship suggested that these losses were not spread out throughout the entire electrodes but localized in some areas where either the electronic or the ionic conductivity were compromised. This feature was already observed on overcharged commercial titanate-based pouch cells [35,36] where gas bubbles were proven to separate electrodes and reduced the ionic conduction. The origin of the mechanism was still unclear, but it could be linked to gassing, unwinding of the jellyroll, or electronic/ionic isolation of part of the electrodes. To elucidate this issue, a C/25 cycle was performed at end of life on one of the cells with a C/250 remnant capacity step at the end of charge and discharge. From this experiment, the C/250 step added a significant amount of capacity to the C/25 capacity, in the order of 7%. This suggests that the LAM is induced by isolation and that, given more time, some of it is accessible. This also implies that there are two sources for the LLI. The majority is consumed irreversibly by the growth of the SEI but some must be trapped in the inaccessible active material, otherwise, no additional capacity would have been measured during the C/250 step. It also has to be noted that this dual LAM also explains part of the decrease of the rate capability because, with less active material, the local current increased on the electrodes. This surge in local current will increase the resistance and lower the available capacity.
5. Conclusions
In this study, a 51-cell batch of commercial 18650 lithium-ion cells (LG ICR18650C2) from a top-tier manufacturer was analyzed. An initial screening of the cell-to-cell variations was conducted and 15 of the cells were individually cycle-aged in a controlled temperature environment for 1,000 cycles. The goal was to characterize cell-to-cell variations throughout the cycling experiment. Prior to cycling, the cells’ properties were tightly distributed: the C/5 capacities were 2 863 Ah on average with a 0.4% standard deviation, the C/2 capacities were 99.3% of those measured at C/5 with a 0.3% standard deviation, indicative of an excellent rate capability, and finally the resistances were 73.2 mΩ on average with a 3.6% standard deviation. This set of metrics was tracked throughout cycling and it was found that the resistance rose 80% to 112.3 mΩ while maintaining a rather stable 5.0% standard deviation. On the other hand, the C/5 capacities decreased to 1.862 Ah on average with a 2.8% standard deviation. Finally, the rate capability decreased to 56.9% on average with a 6.8% standard deviation. Overall, these observations are indicative of a severe and inhomogeneous degradation of the cells’ kinetics, far beyond the sole contribution of the resistance increase.
Another key observation is that no correlation was found between the initial cell-to-cell variations and the subsequent rate of degradation of the cells used in this study. This is a critical finding as it implies that cells matching at the factory do not offer a viable strategy towards mitigating the intrinsic degradation variability among cells.
Another important contribution of this study is the determination of the thermodynamic degradation modes of these cells using an incremental capacity analysis. All the cells degraded primarily from a severe LLI, with the addition of some symmetrical losses of active material. A critical aspect of this thermodynamic degradation is that the modes are identical to all cells but the pace at which these degradation modes took place varied from cell to cell, therefore highlighting the fact that lithium-ion cells’ degradation exhibits a non-trivial amount of intrinsic variability.
The practical consequence of this intrinsic variability in the degradation of cells in a pack is that the overall pack capacity will be increasingly limited by the cell degrading at the fastest pace and not necessarily by the cell with the lowest initial capacity.
Author Contributions
Arnaud Devie (A.D.) and Matthieu Dubarry (M.D.) conceived and designed the experiments; A.D. and George Baure (G.B). performed the experiments; A.D. and M.D. analyzed the data; M.D. and A.D. wrote the paper. G.B. proofed the paper and provided discussion.
Acknowledgments
This work was supported by ONR Asia Pacific Research Initiative for Sustainable Energy Systems (APRISES), award number N00014-13-1-0463. The authors are grateful to the Hawaiian Electric Company for their ongoing support to the operations of the Hawai’i Sustainable Energy Research Facility (HiSERF). The authors also would like to thank BorYann Liaw for his support throughout the course of this study.
Conflicts of Interest
The authors declare no conflict of interest. The founding sponsors had no role in the design of the study; in the collection, analyses, or interpretation of data; in the writing of the manuscript, and in the decision to publish the results.
References
- Sripad, S.; Viswanathan, V. Evaluation of Current, Future, and Beyond Li-Ion Batteries for the Electrification of Light Commercial Vehicles: Challenges and Opportunities. J. Electrochem. Soc. 2017, 164, E3635–E3646. [Google Scholar] [CrossRef]
- Hesse, H.; Schimpe, M.; Kucevic, D.; Jossen, A. Lithium-Ion Battery Storage for the Grid—A Review of Stationary Battery Storage System Design Tailored for Applications in Modern Power Grids. Energies 2017, 10, 2107. [Google Scholar] [CrossRef]
- Rohr, S.; Müller, S.; Baumann, M.; Kerler, M.; Ebert, F.; Kaden, D.; Lienkamp, M. Quantifying Uncertainties in Reusing Lithium-Ion Batteries from Electric Vehicles. Procedia Manuf. 2017, 8, 603–610. [Google Scholar] [CrossRef]
- Harris, S.J.; Harris, D.J.; Li, C. Failure statistics for commercial lithium ion batteries: A study of 24 pouch cells. J. Power Sources 2017, 342, 589–597. [Google Scholar] [CrossRef]
- Baumhöfer, T.; Brühl, M.; Rothgang, S.; Sauer, D.U. Production caused variation in capacity aging trend and correlation to initial cell performance. J. Power Sources 2014, 247, 332–338. [Google Scholar] [CrossRef]
- Cripps, E.; Pecht, M. A Bayesian nonlinear random effects model for identification of defective batteries from lot samples. J. Power Sources 2017, 342, 342–350. [Google Scholar] [CrossRef]
- Velho, R.; Beirao, M.; Calado, M.D.; Pombo, J.; Fermeiro, J.; Mariano, S. Management System for Large Li-Ion Battery Packs with a New Adaptive Multistage Charging Method. Energies 2017, 10, 605. [Google Scholar] [CrossRef]
- Rumpf, K.; Naumann, M.; Jossen, A. Experimental investigation of parametric cell-to-cell variation and correlation based on 1100 commercial lithium-ion cells. J. Energy Storage 2017, 14, 224–243. [Google Scholar] [CrossRef]
- An, F.; Chen, L.; Huang, J.; Zhang, J.; Li, P. Rate dependence of cell-to-cell variations of lithium-ion cells. Sci. Rep. 2016, 6, 35051. [Google Scholar] [CrossRef] [PubMed]
- Schuster, S.F.; Brand, M.J.; Berg, P.; Gleissenberger, M.; Jossen, A. Lithium-ion cell-to-cell variation during battery electric vehicle operation. J. Power Sources 2015, 297, 242–251. [Google Scholar] [CrossRef]
- Santhanagopalan, S.; White, R.E. Quantifying Cell-to-Cell Variations in Lithium Ion Batteries. Int. J. Electrochem. 2012, 2012, 395838. [Google Scholar] [CrossRef]
- Kim, J.; Shin, J. Screening Process of Li-Ion Series Battery Pack for Improved Voltage SOC Balancing. In Proceedings of the 2010 International Power Electronics Conference, Sapporo, Japan, 21–24 June 2010. [Google Scholar]
- He, X. A Facile Consistency Screening Approach to Select Cells with Better Performance Consistency for Commercial 18650 Lithium Ion Cells. Int. J. Electrochem. Sci. 2017, 12, 10239–10258. [Google Scholar] [CrossRef]
- Miyatake, S.; Susuki, Y.; Hikihara, T.; Itoh, S.; Tanaka, K. Discharge characteristics of multicell lithium-ion battery with nonuniform cells. J. Power Sources 2013, 241, 736–743. [Google Scholar] [CrossRef] [Green Version]
- Gogoana, R.; Pinson, M.B.; Bazant, M.Z.; Sarma, S.E. Internal resistance matching for parallel-connected lithium-ion cells and impacts on battery pack cycle life. J. Power Sources 2014, 252, 8–13. [Google Scholar] [CrossRef]
- Dubarry, M.; Truchot, C.; Cugnet, M.; Liaw, B.Y.; Gering, K.; Sazhin, S.; Jamison, D.; Michelbacher, C. Evaluation of commercial lithium-ion cells based on composite positive electrode for plug-in hybrid electric vehicle applications. Part I: Initial characterizations. J. Power Sources 2011, 196, 10328–10335. [Google Scholar] [CrossRef]
- Zheng, Y.; Han, X.; Lu, L.; Li, J.; Ouyang, M. Lithium ion battery pack power fade fault identification based on Shannon entropy in electric vehicles. J. Power Sources 2013, 223, 136–146. [Google Scholar] [CrossRef]
- Dubarry, M.; Vuillaume, N.; Liaw, B.Y. Origins and accommodation of cell variations in Li-ion battery pack modeling. Int. J. Energy Res. 2010, 34, 216–231. [Google Scholar] [CrossRef]
- Dubarry, M.; Devie, A.; McKenzie, K. Durability and reliability of electric vehicle batteries under electric utility grid operations: Bidirectional charging impact analysis. J. Power Sources 2017, 358, 39–49. [Google Scholar] [CrossRef]
- Campestrini, C.; Keil, P.; Schuster, S.F.; Jossen, A. Ageing of lithium-ion battery modules with dissipative balancing compared with single-cell ageing. J. Energy Storage 2016, 6, 142–152. [Google Scholar] [CrossRef]
- Paul, S.; Diegelmann, C.; Kabza, H.; Tillmetz, W. Analysis of ageing inhomogeneities in lithium-ion battery systems. J. Power Sources 2013, 239, 642–650. [Google Scholar] [CrossRef]
- Devie, A.; Dubarry, M. Durability and Reliability of Electric Vehicle Batteries under Electric Utility Grid Operations. Part 1: Cell-to-Cell Variations and Preliminary Testing. Batteries 2016, 2, 28. [Google Scholar] [CrossRef]
- Zhou, L.; Zheng, Y.; Ouyang, M.; Lu, L. A study on parameter variation effects on battery packs for electric vehicles. J. Power Sources 2017, 364, 242–252. [Google Scholar] [CrossRef]
- Zhang, C.; Jiang, Y.; Jiang, J.; Cheng, G.; Diao, W.; Zhang, W. Study on battery pack consistency evolutions and equilibrium diagnosis for serial-connected lithium-ion batteries. Appl. Energy 2017, 207, 510–519. [Google Scholar] [CrossRef]
- Berdichevsky, G.K.K.; Straubel, J.B.; Toomre, E. The Tesla Roadster Battery System; Tesla Motors: Palo Alto, CA, USA, 2007; pp. 1–5. [Google Scholar]
- Bloom, I.; Jansen, A.N.; Abraham, D.P.; Knuth, J.; Jones, S.A.; Battaglia, V.S.; Henriksen, G.L. Differential voltage analyses of high-power, lithium-ion cells. 1. Technique and Applications. J. Power Sources 2005, 139, 295–303. [Google Scholar] [CrossRef]
- Dubarry, M.; Svoboda, V.; Hwu, R.; Liaw, B.Y. Incremental capacity analysis and close-to-equilibrium OCV measurements to quantify capacity fade in commercial rechargeable lithium batteries. Electrochem. Solid-State Lett. 2006, 9, A454–A457. [Google Scholar] [CrossRef]
- HNEI Alawa Central. Available online: https://www.soest.hawaii.edu/HNEI/alawa/ (accessed on 23 April 2018).
- Dubarry, M.; Truchot, C.; Liaw, B.Y. Synthesize battery degradation modes via a diagnostic and prognostic model. J. Power Sources 2012, 219, 204–216. [Google Scholar] [CrossRef]
- Kassem, M.; Delacourt, C. Postmortem analysis of calendar-aged graphite/LiFePO4 cells. J. Power Sources 2013, 235, 159–171. [Google Scholar] [CrossRef]
- Schmidt, J.P.; Tran, H.Y.; Richter, J.; Ivers-Tiffée, E.; Wohlfahrt-Mehrens, M. Analysis and prediction of the open circuit potential of lithium-ion cells. J. Power Sources 2013, 239, 696–704. [Google Scholar] [CrossRef]
- Birkl, C.R.; Roberts, M.R.; McTurk, E.; Bruce, P.G.; Howey, D.A. Degradation diagnostics for lithium ion cells. J. Power Sources 2017, 341, 373–386. [Google Scholar] [CrossRef]
- Anseán, D.; Dubarry, M.; Devie, A.; Liaw, B.Y.; García, V.M.; Viera, J.C.; González, M. Operando lithium plating quantification and early detection of a commercial LiFePO4 cell cycled under dynamic driving schedule. J. Power Sources 2017, 356, 36–46. [Google Scholar] [CrossRef]
- Dubarry, M.; Baure, G.; Devie, A. Durability and Reliability of EV Batteries under Electric Utility Grid Operations: Path Dependence of Battery Degradation. J. Electrochem. Soc. 2018, 165, A773–A783. [Google Scholar] [CrossRef]
- Devie, A.; Dubarry, M.; Wu, H.-P.; Wu, T.-H.; Liaw, B.Y. Overcharge Study in Li4Ti5O12 Based Lithium-Ion Pouch Cell II. Experimental Investigation of the Degradation Mechanism. J. Electrochem. Soc. 2016, 163, A2611–A2617. [Google Scholar] [CrossRef]
- Devie, A.; Dubarry, M.; Liaw, B.Y. Overcharge Study in Li4Ti5O12 Based Lithium-Ion Pouch Cell: I. Quantitative Diagnosis of Degradation Modes. J. Electrochem. Soc. 2015, 162, A1033–A1040. [Google Scholar] [CrossRef]
Figure 1.
Summary of the cell-to-cell variations analysis presenting the combined variations in measured rate capability, capacity ration, and ohmic resistance. A graphical representation of each of the three metrics is shown on the right.
Figure 1.
Summary of the cell-to-cell variations analysis presenting the combined variations in measured rate capability, capacity ration, and ohmic resistance. A graphical representation of each of the three metrics is shown on the right.
Figure 2.
Evolution with cycling of (a) the capacity loss; (b) the rate capability; and (c) the ohmic resistance.
Figure 2.
Evolution with cycling of (a) the capacity loss; (b) the rate capability; and (c) the ohmic resistance.
Figure 3.
C/25 charge and discharge curves for (a) cell 1 upon cycling and associated changes; for the fifteen tested cells (b) at the initial stage and (c) after 1000 cycles.
Figure 3.
C/25 charge and discharge curves for (a) cell 1 upon cycling and associated changes; for the fifteen tested cells (b) at the initial stage and (c) after 1000 cycles.
Figure 4.
(a) Change in the voltage response at C/25 for cell #1 as a function of cycle number; (b) IC signature for all cells at the initial and final C/25 charge.
Figure 4.
(a) Change in the voltage response at C/25 for cell #1 as a function of cycle number; (b) IC signature for all cells at the initial and final C/25 charge.
Figure 5.
(a) Scanning electron microscopy (SEM) and (b) associated energy-dispersive X-ray spectroscopy (EDX) for the positive electrode (PE).
Figure 5.
(a) Scanning electron microscopy (SEM) and (b) associated energy-dispersive X-ray spectroscopy (EDX) for the positive electrode (PE).
Figure 6.
(a) Comparison of the experimental and the emulated voltage response for a C/25 charge at the beginning of life (BOL). The impact of up to 30% (b) LAMNE; (c) LAMPE; (d) LLI and (e) each of their associated capacity losses.
Figure 6.
(a) Comparison of the experimental and the emulated voltage response for a C/25 charge at the beginning of life (BOL). The impact of up to 30% (b) LAMNE; (c) LAMPE; (d) LLI and (e) each of their associated capacity losses.
Figure 7.
(a) Spread of rate capability and resistance after 1000 cycles; (b) Comparison of three disparate cells at 24% capacity loss.
Figure 7.
(a) Spread of rate capability and resistance after 1000 cycles; (b) Comparison of three disparate cells at 24% capacity loss.
Figure 8.
Final emulation results after 1000 cycles for cell #1.

Table 1.
Summary of the initial conditioning and characterization test (ICCT) test results.
| Result | Mean | Standard Deviation (%) | Minimum | Maximum |
|---|---|---|---|---|
| Weight (g) | 45.8 | 0.2 | 45.7 | 45.9 |
| As received OCV (V) | 3.726 | 4.8 | 3.088 | 3.785 |
| As received SOC (%) | 26.7 | 31.1 | 0.5 | 34.7 |
| C/5 capacity (Ah) | 2.863 | 0.4 | 2.890 | 2.836 |
| C/2 capacity (Ah) | 2.842 | 0.3 | 2.863 | 2.824 |
| C/5 beginning-of-discharge voltage (V) | 4.331 | 0.02 | 4.328 | 4.332 |
| C/5 end-of-discharge (EOD) voltage (V) | 3.231 | 0.3 | 3.208 | 3.253 |
| C/2 beginning-of-discharge voltage (V) | 4.330 | 0.02 | 4.327 | 4.332 |
| C/2 EOD voltage (V) | 3.287 | 0.5 | 3.258 | 3.316 |
| Resistance (mΩ) | 73.2 | 3.6 | 70.1 | 83.1 |
| Rate capability (%) | 99.3 | 0.2 | 98.9 | 99.7 |
| Capacity ration (mAh/%SOC) | 28.7 | 0.3 | 28.6 | 29.0 |
Table 2.
Summary of the observed variations after 1000 cycles.
| Observation | Mean | Standard Deviation (%) | Minimum | Maximum |
|---|---|---|---|---|
| C/5 capacity (Ah) | 1.862 | 2.8 | 1.767 | 1.928 |
| Resistance (mΩ) | 112.5 | 5.0 | 105.1 | 122.6 |
| Rate capability (%) | 56.9 | 6.8 | 50.7 | 62.1 |
| Capacity ration (mAh/%SOC) | 22.3 | 1.7 | 21.7 | 23.1 |
© 2018 by the authors. Licensee MDPI, Basel, Switzerland. This article is an open access article distributed under the terms and conditions of the Creative Commons Attribution (CC BY) license (http://creativecommons.org/licenses/by/4.0/).
Share and Cite
MDPI and ACS Style
Devie, A.; Baure, G.; Dubarry, M. Intrinsic Variability in the Degradation of a Batch of Commercial 18650 Lithium-Ion Cells. Energies 2018, 11, 1031. https://doi.org/10.3390/en11051031
AMA Style
Devie A, Baure G, Dubarry M. Intrinsic Variability in the Degradation of a Batch of Commercial 18650 Lithium-Ion Cells. Energies. 2018; 11(5):1031. https://doi.org/10.3390/en11051031
Chicago/Turabian StyleDevie, Arnaud, George Baure, and Matthieu Dubarry. 2018. "Intrinsic Variability in the Degradation of a Batch of Commercial 18650 Lithium-Ion Cells" Energies 11, no. 5: 1031. https://doi.org/10.3390/en11051031
Note that from the first issue of 2016, this journal uses article numbers instead of page numbers. See further details here.