Article

Boundary Detection and Enhancement Strategy for Power System Bus Bar Stabilization—Investigation under Fault Conditions for Islanding Operation

by
Aref Pouryekta
1,
Vigna K. Ramachandaramurthy
1,
Sanjeevikumar Padmanaban
2,*,
Frede Blaabjerg
3 and
Josep M. Guerrero
4
1
Institute of Power Engineering, Department of Electrical Power Engineering, Universiti Tenaga Nasional, Kajang 43000, Malaysia
2
Department of Energy Technology, Aalborg University, 6700 Esbjerg, Denmark
3
Centre for Reliable Power Electronics, Department of Energy Technology, Aalborg University, 9000 Aalborg, Denmark
4
Department of Energy Technology, Aalborg University, 9000 Aalborg, Denmark
*
Author to whom correspondence should be addressed.
Energies 2018, 11(4), 889; https://doi.org/10.3390/en11040889
Submission received: 9 December 2017 / Revised: 31 December 2017 / Accepted: 4 January 2018 / Published: 11 April 2018

Abstract

:
Distribution systems can form islands when faults occur. Each island represents a subsection with variable boundaries subject to the location of fault(s) in the system. A subsection with variable boundaries is referred to as an island in this paper. For operation in autonomous mode, it is imperative to detect the island configurations and stabilize these subsections. This paper presents a novel scheme for the detection of island boundaries and stabilizing the system during autonomous operation. In the first stage, a boundary detection method is proposed to detect the configuration of the island. In the second stage, a dynamic voltage sensitivity factor (DVSF) is proposed to assess the dynamic performance of the system. In the third stage, a wide area load shedding program is adopted based on DVSF to shed the load in weak bus-bars and stabilize the system. The proposed scheme is validated and tested on a generic 18-bus system using a combination of EMTDC/PSCAD and MATLAB software’s.

1. Introduction

In recent decades, environmental concerns about greenhouse gases and global warming caused by fossil fuels have attracted many countries to adopt renewable energy sources (RES). RES-based micro grids are new structures in modern electrical distribution networks. Predefined clusters of dispersed generator (DG) units associated with their vicinity loads provide the opportunity to form a micro grid (MG), which functions as a subsystem in the distribution network. Two operation modes can be defined for micro grids: grid-connected mode and autonomous mode. In a grid-connected mode, MGs are able to exchange the energy with the upstream network. For the autonomous mode, during a grid failure or islanding, MG assures continues power supply to local loads and increases system reliability. A schematic diagram of a radial distribution network with MG and islands is shown in Figure 1.
Electrical connections between unspecified number of bus-bars and main grid can be lost due to faults in the electrical distribution system. Hence, provided that at least one DG unit remains in the separated section, an active island can be formed. Based on IEEE-Standard 1547, islanding should be detected and DG units must cease to supply within 2 s.
Due to the high penetration of RES in distribution systems, islanded operation mode for DG units are considered by many utility providers as a suitable approach to maintain continuity and reliability of supply. However, as faults can occur at any point in a distribution system, the configuration of the active subsections formed is unpredictable. As shown in Figure 1, there are several possibilities to form islands via opening breakers BK1-BK37. The identification of the island configuration is one of the important requirements for the power system analysis. Moreover, in order to stabilize the system and to conduct a voltage stability study, it is important to detect new system configuration(s) immediately after removing the faulty section. Furthermore, the new topology of the system is vital for triggering the self-healing scenarios including load and generator tripping, generation controls, intentional islanding and system reconfiguration.
Once islanding takes place, if the generation does not meet the load demand, load shedding is unavoidable to prevent voltage collapse. In order to enhance the voltage stability of the island, less stable bus-bars can be chosen for load shedding. Thus, different voltage stability indices (VSI) can be used based on the system characteristics to determine weak bus-bars in the system. VSIs indicate the stability status of the bus-bars and line sections. When islanding takes place in the system, an online voltage stability index can be utilized based on the new system structure results to determine the weakest bus-bars for load shedding. In order to detect islanding, three islanding detection methods (IDMs) [1,2,3,4,5,6,7,8,9] have been developed; Active Detection Method (ADM) [1,8,9,10,11,12,13,14,15,16,17,18,19,20], Passive Detection Method (PDM) and Remote Detection Method (RDM) [8,13,14,21,22,23,24,25,26].
The philosophy of the PDM is to measure the variables at PCC and compare with the reference values to detect the islanding. The advantages of these methods include simplicity and low cost to implement as they use conventional metering and protection devices to detect islanding. There are also several passive methods such as over/under voltage/frequency ones [1,2,3,4,5,6,7,27,28]. The over/under voltage and frequency detection methods are easy to implement but their speed is unpredictable, moreover, they don’t have a detrimental impact on power quality [3,4,5,6]. The ROCOF detection method is discussed in [8,9]. The ROCOF detection method is able to detect islanding in balanced conditions and it does not have negative impact on power quality, however, any disturbance can result in misdetection of islanding as well as it is hard to choose thresholds. The ROCOF Over Power detection method is discussed in [9]. The ROCOF over Power method can detect islanding effectively when the power imbalance is small and has a small non-detection zone. The characteristics of Phase Jump Detection (PJD) are presented in [3,9]. PJD is difficult to implement and the threshold is hard to adjust. The main drawback is that the PDMs have a large non-detection zone (NDZ), which leads to failure in islanding detection when the load and power generation are balanced [29]. The performance of ADM is based on the perturbation and observation concept. A DG parameter is chosen to be distorted by injecting a perturbation. In a stiff grid, the amplitude of the variations at the DG unit terminal is negligible since the grid parameters are dominant. However, injecting a disturbance into the terminal results in a significant variation of the DG parameters during islanding phenomena.
The Impedance Measurement detection method [8,10,11,12,13] has a low performance in the presence of multiple DG units, introduces harmonics and it is hard to adjust the thresholds. For Active Frequency Drift (AFD), NDZ is decreased as well as the error ratio and it is sensitive to the load [1,8,14,15,16]. The Frequency Jump (FJ) detection method also is unable to detect the islanding in the presence of multiple DG units [8]. The Negative Sequence Current Injection Method is not sensitive to load changes and has a better performance in the presence of multiple DG units [8,9,18,19,20]. There are several drawbacks for ADMs such as reduction in power quality via the injection of distortion into the system and the possibility of interfering distortion signals in the presence of multiple DG units.
Remote detection methods (RDMs) were developed to overcome the problems faced by existing methods. The RDMs employ a communication pattern between DG units and the main grid to alert and disconnect the DG units once unintentional islanding occurs. The Supervisory Control and Data Acquisition (SCADA) detection method provides more control signals to control DG units, as well as detection speed dependent on the system characteristics [8,14,21,22]. Power Line Carrier Signaling (PLCS) is applicable for both DG types, and uses the existing electrical network as a path for signaling. The PLCS method is suitable for large networks with high penetration of DG units since it is costly [8,23,24,25]. RDMs are applicable to the systems with multiple DG units which include both inverter-based sources and synchronous generators.
In [30,31,32,33,34,35,36], different load shedding methods have been developed for micro grids. Measurement of the system parameters such as voltages, frequency and rate of change of frequency reveals the imbalance between generation and load demand. Hence, the load shedding method would assure the stable operation. However, not all these methods are able to do the load shedding for the islands since the bus-bars for load shedding cannot be predefined.
Since these IDMs monitor voltage, current, etc. at the point of common coupling (PCC), they can detect the islanding of DG units. However, these methods are not capable of identifying the boundary of the island. The method proposed here is able to detect the boundary of the island and determine the available generation and load in each island. Moreover, the proposed method can be applied on meshed networks. The proposed method is also applicable to systems with non-consecutive bus-bar numbering.
In order to determine the system voltage stability status, various indices have been developed [37,38,39]. Voltage stability analysis can be categorized as dynamic analysis and static analysis and uses static voltage stability indices (SVSIs). Pre-islanding information or micro grid information is used to assess the voltage stability of the system using SVSIs. Hence, SVSIs do not reflect the dynamic operation of the power system during contingencies. However, dynamic analysis identifies the system parameters during transient and steady state conditions. Thus, an index is required to identify dynamic performance and system stability.
Modified graph theory is utilized to detect the boundary of each island. In the second step, in order to perform a wide area load shedding, a dynamic voltage sensitivity factor (DVSF) is proposed to specify the weak bus-bars in the system. The proposed DVSF shows the relevancy of reactive power and voltage at each bus-bar. Thus, the most sensitive bus-bars based on new configuration of the system are chosen for load shedding.
This paper is organized as follows: Section 2 explains the methodology of the proposed algorithm. Section 3 presents the boundary detection method for islands. Section 4 elaborates the calculation of dynamic sensitivity factor for the islands. In Section 5, a practical test network is utilized to validate the proposed scheme. Simulation results are investigated in Section 6 and the conclusion is presented in Section 7.

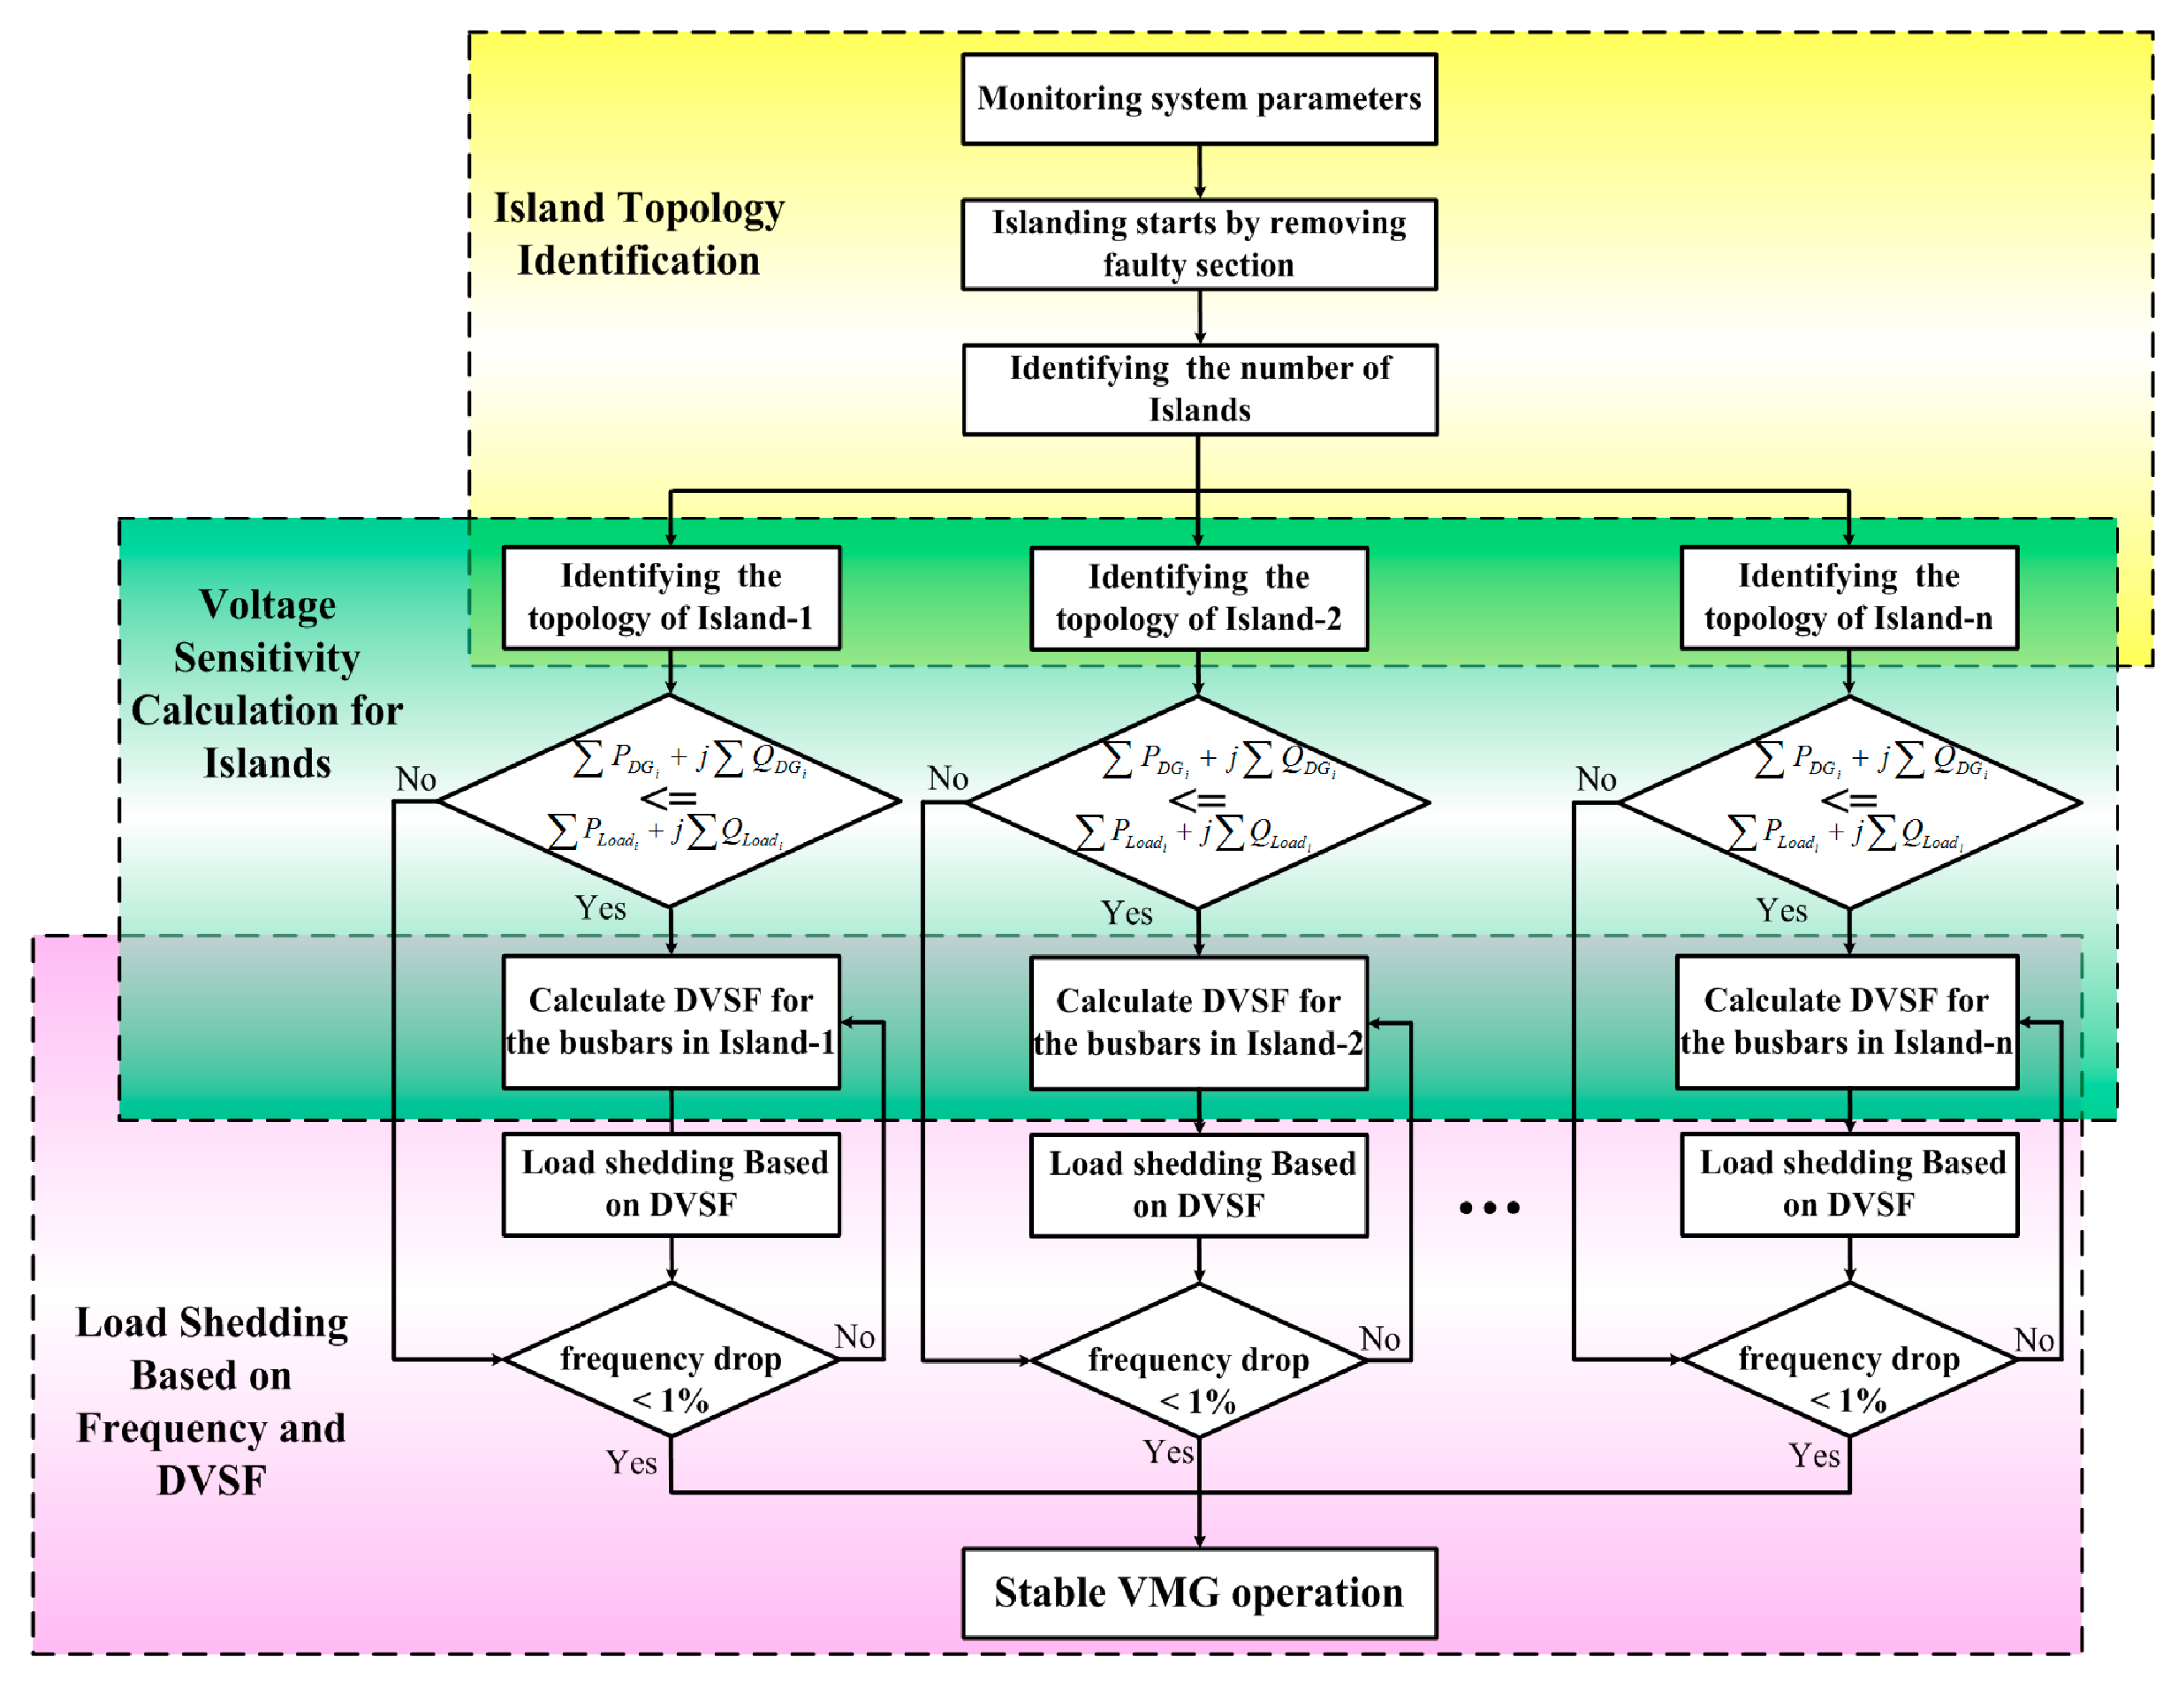
2. Proposed Scheme to Stabilize the System

The proposed scheme assumes that voltage and current measurements are available at each bus-bar. When islanding occurs in the system, the number of islands is identified using the proposed detection method. The proposed algorithm also specifies the bus-bars belonging to each island. A power system with many bus-bars can be divided into several active and reactive islands depending on the availability of generation in islanded sections. The islands topology is not predictable due to the nature of the fault. In Figure 2, an islanded network is shown. The main idea of this method is to determine the configuration of the islands and maintain system stability. When island configuration is determined, the amount of available generation and load demand are disclosed. Load shedding in the weakest bus-bar prevents voltage collapse in the system.
Weak bus-bars are chosen based on the dynamic voltage sensitivity factor. In order to conform to IEEE-1547 standard, after the first round of load shedding, if the system frequency division exceeds the ±1% of its rating, further load shedding will be done at the next weak bus-bar based on the new DVSF. This procedure is repeated until a stable operation point for all islands is gained. A flowchart of the proposed algorithm is depicted in Figure 3.

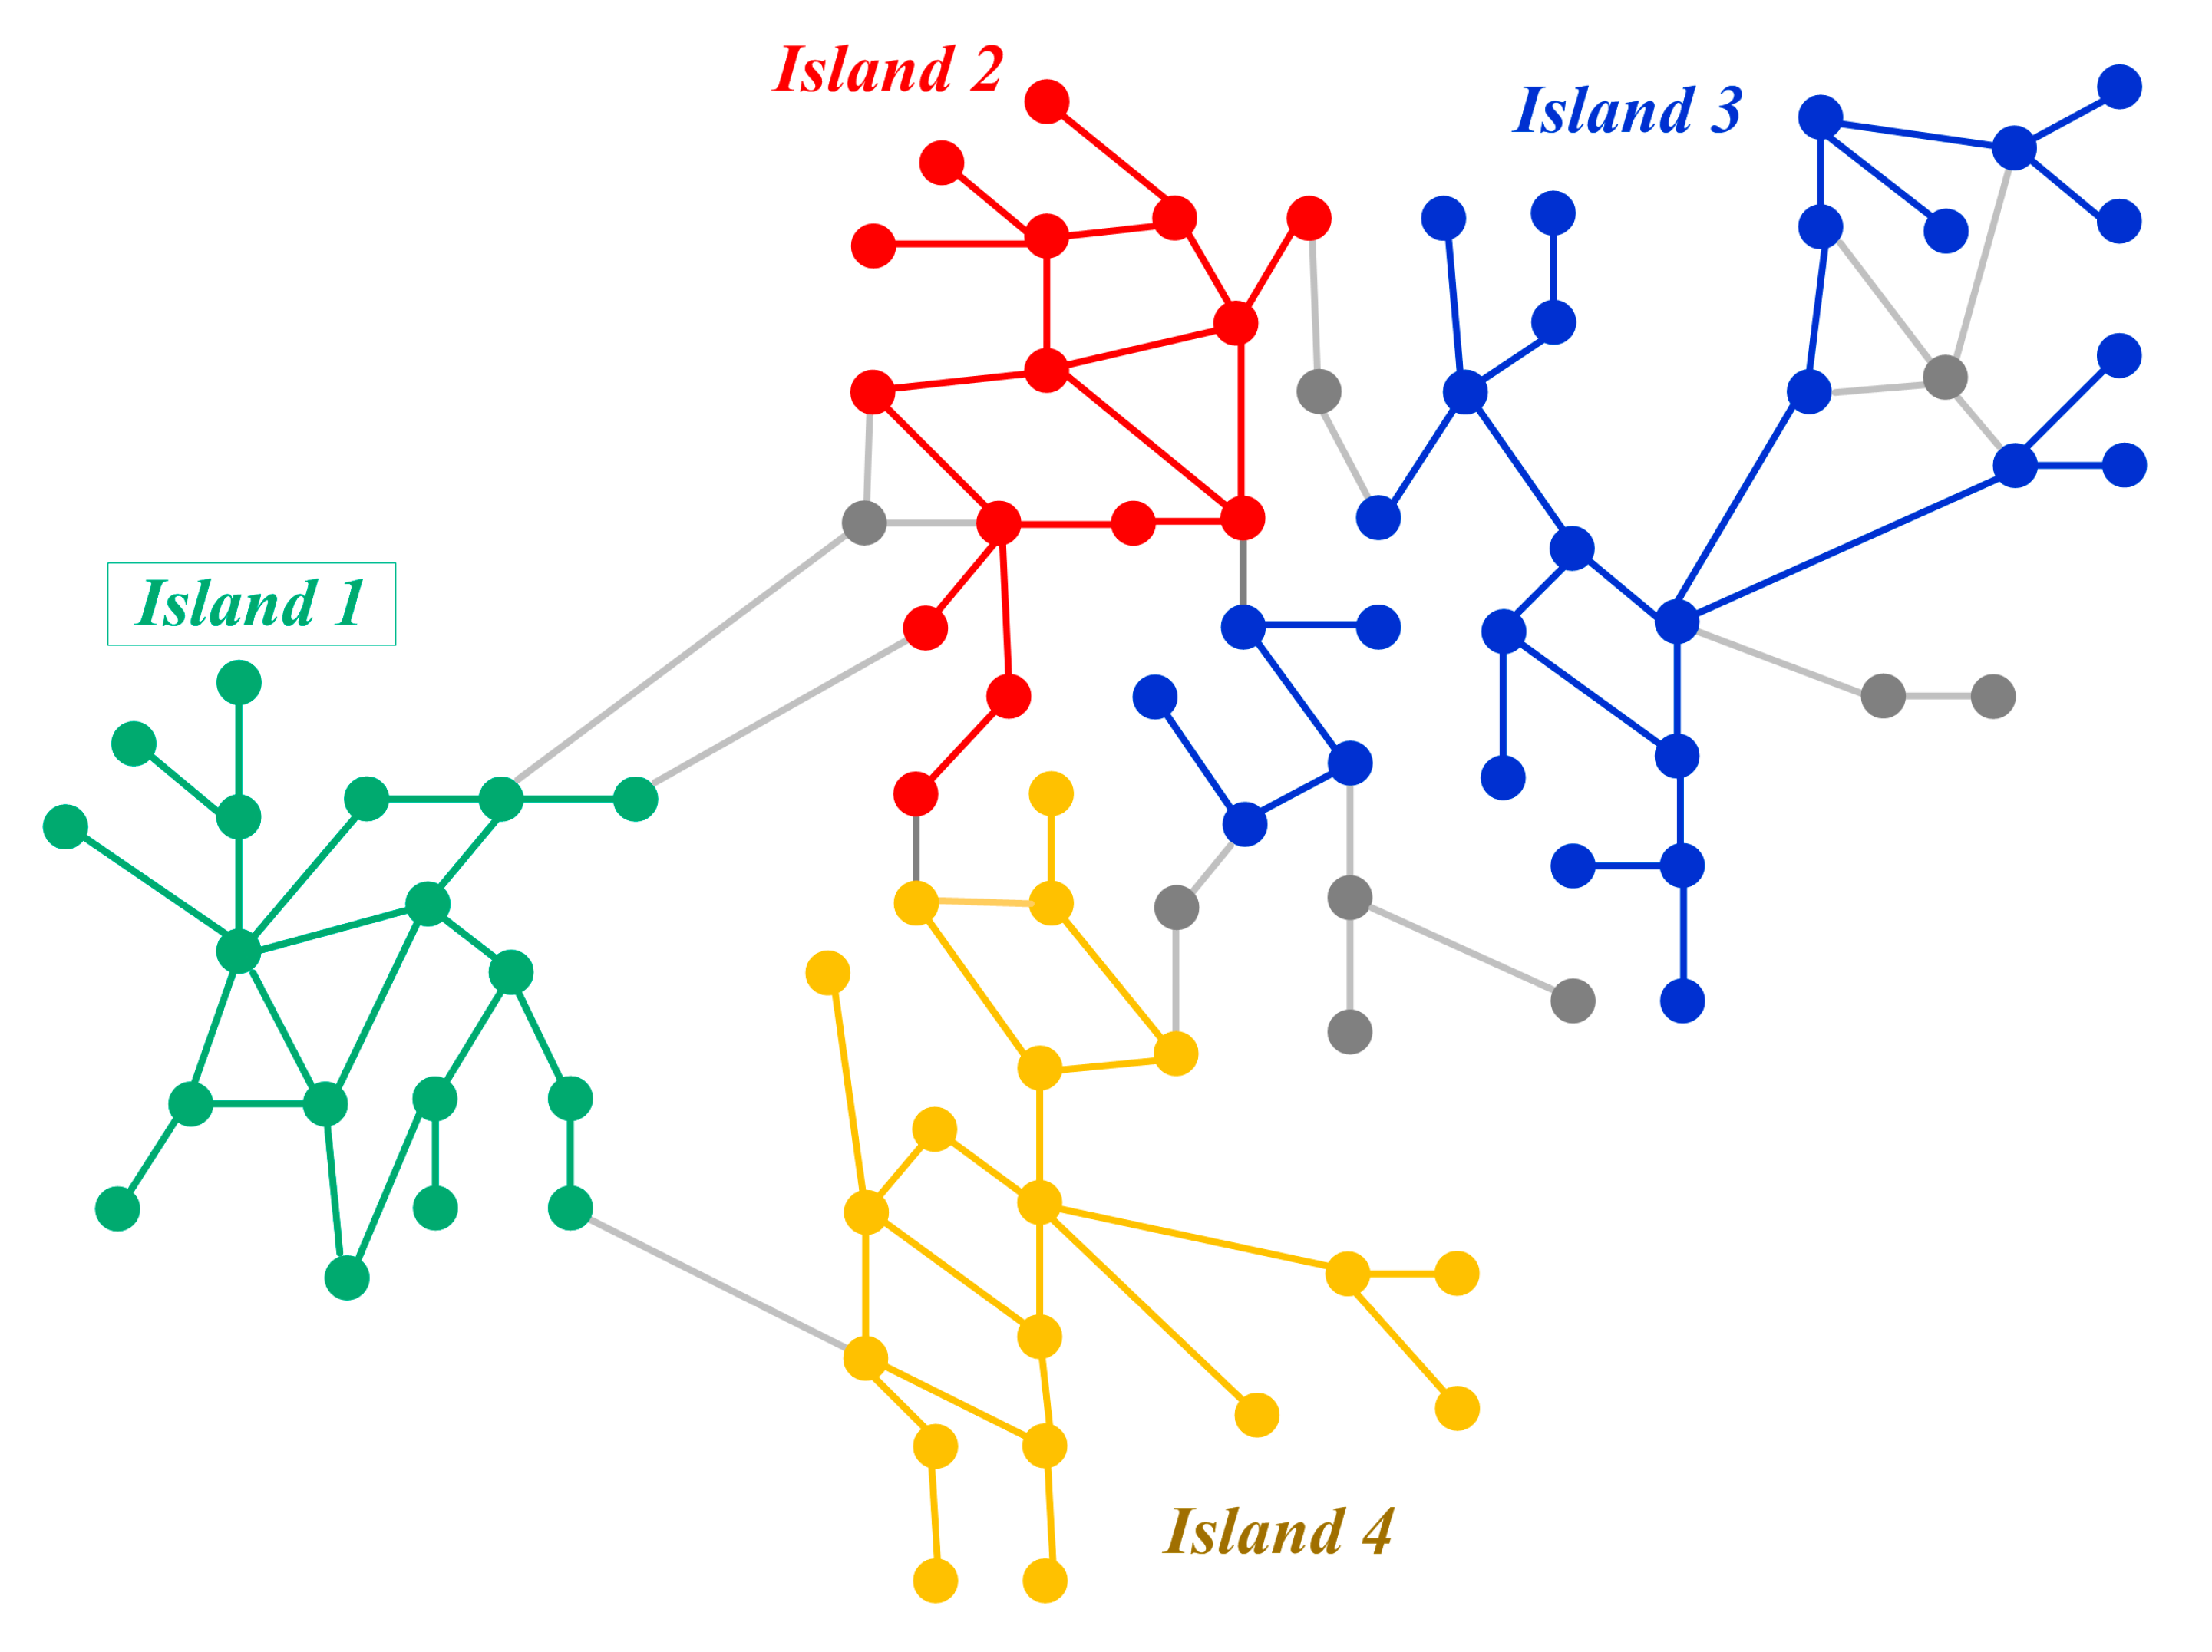
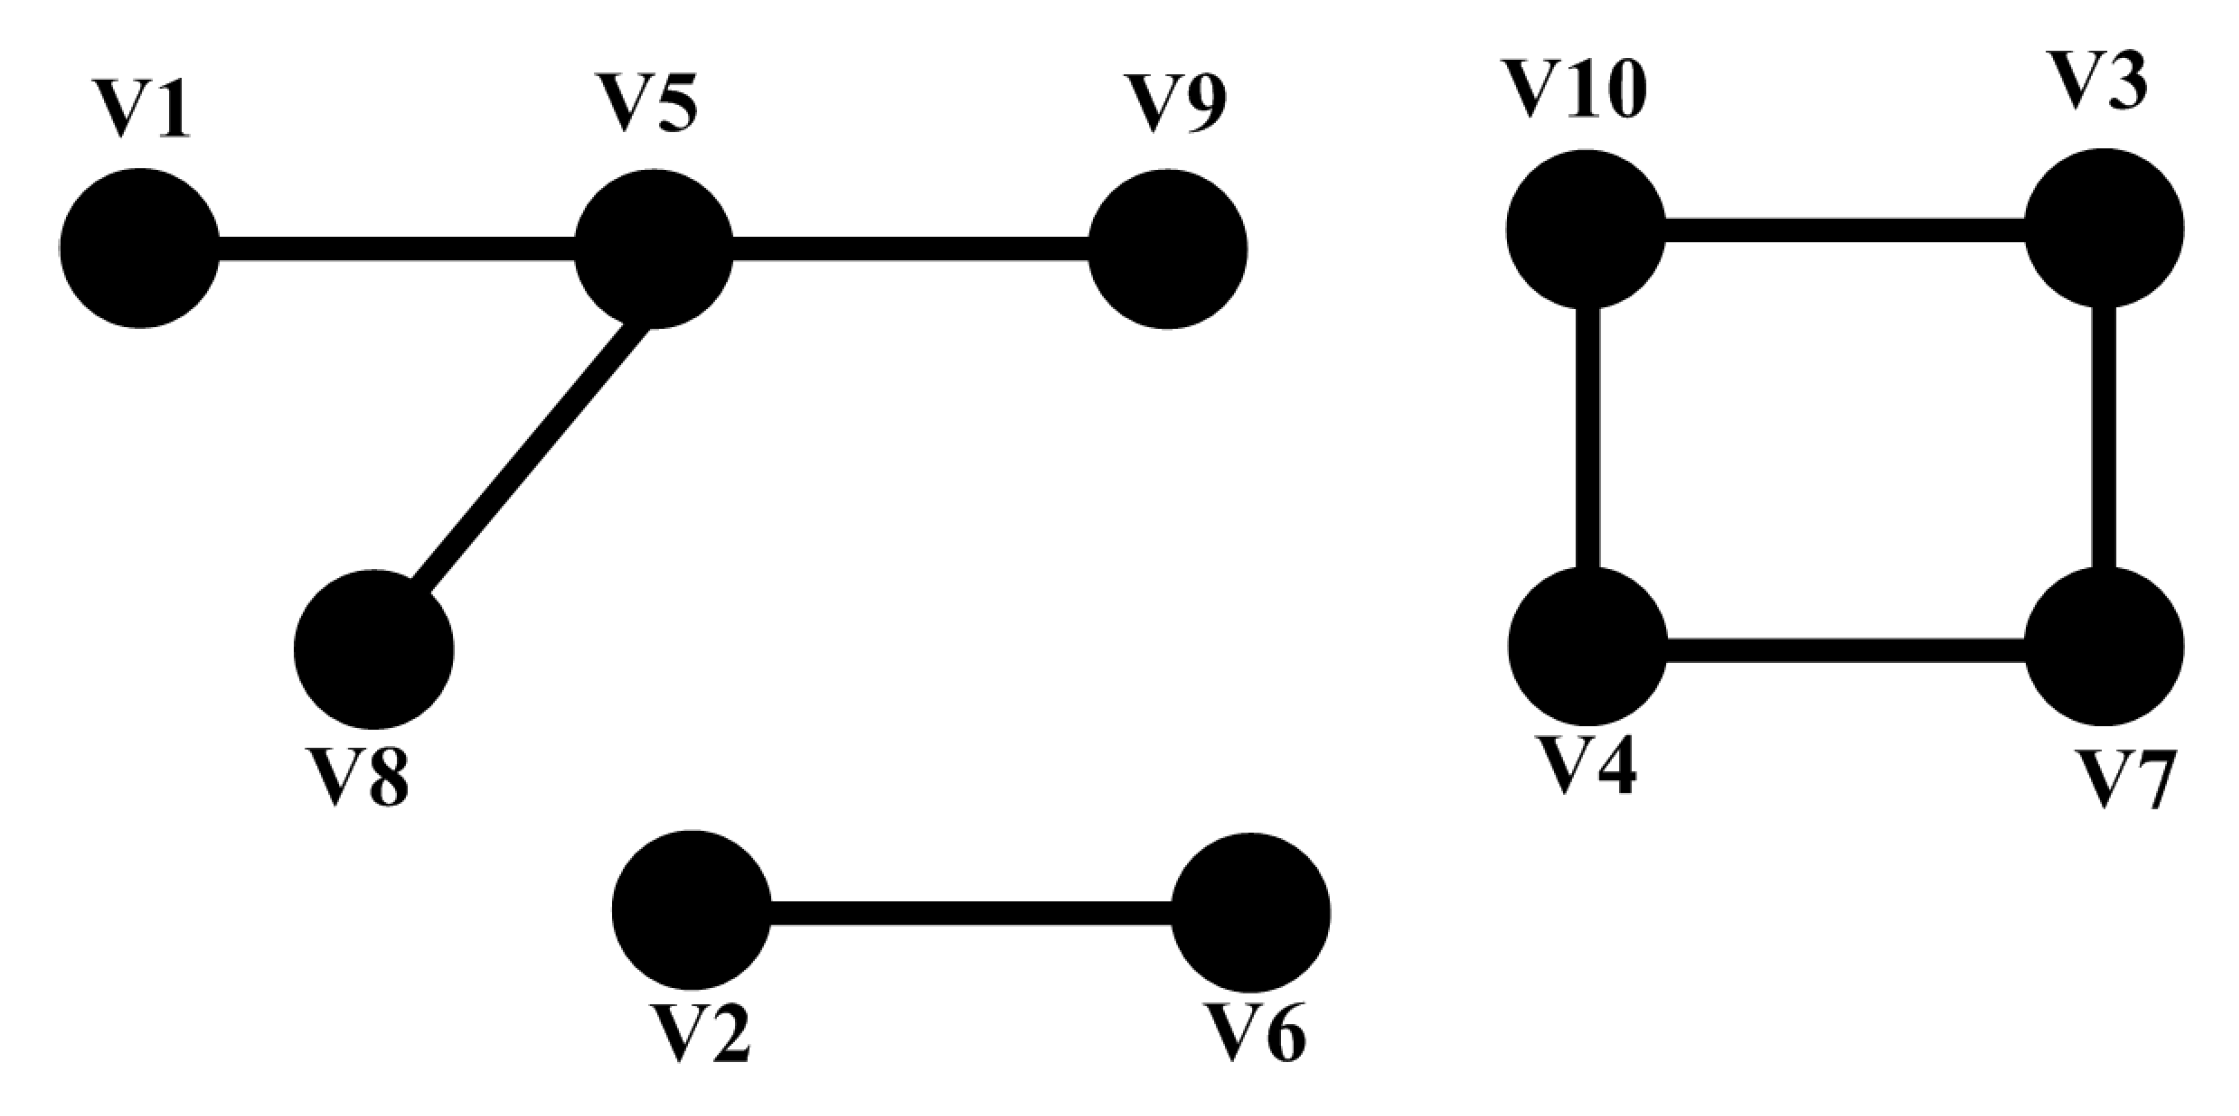
3. Boundary Detection Using Graph Model

The focus of existing detection methods is to detect the islanding at PCC. However, in this paper, a boundary detection algorithm based on modified graph theory is proposed to identify the islands topology once they are formed. A simplified graph theory is utilized for different purposes such as micro grid reconfiguration [40] and load flow calculation [41].

3.1. Node Integration Matrix

In this section, mathematical model of the proposed boundary detection method is presented. For this purpose, a graph consisting of 10 edges and 8 vertices with three subsections is considered. The graph is shown in Figure 4. As a first step, all the vertices should be numbered. Numbering of the vertices is random and each vertex should get a number. In the second step, connections between each vertex are investigated. In order to determine all connections in this graph, a node integration matrix [NIM]n,n where n represents the number of vertices is defined as follows:
{ N I M i , j = 1 , If   there   is   a   connection   between   i   and   j . N I M i , j = 0 , If   there   is   no   connection   between   i   and   j . N I M i , i = 1 .
If there is a connection between two vertices, the related elements will be unity. The value 0 indicates no connection between two vertices. Moreover, in this matrix, the diagonal elements are assumed to be 1, since the proposed search algorithm will use these particular numbers and copy them in [TMC] matrix. Equation (1) represents the [NIM] for the graph of Figure 4.
This matrix represents the existence of edges between vertices of the graph. However, the topology of the subsections still should be extracted from this matrix:
[ N I M ] = [ 1 0 0 0 1 0 0 0 0 0 0 1 0 0 0 1 0 0 0 0 0 0 1 0 0 0 1 0 0 1 0 0 0 1 0 0 1 0 0 1 1 0 0 0 1 0 0 1 1 0 0 1 0 0 0 1 0 0 0 0 0 0 1 1 0 0 1 0 0 0 0 0 0 0 1 0 0 1 0 0 0 0 0 0 1 0 0 0 1 0 0 0 1 1 0 0 0 0 0 1 ]

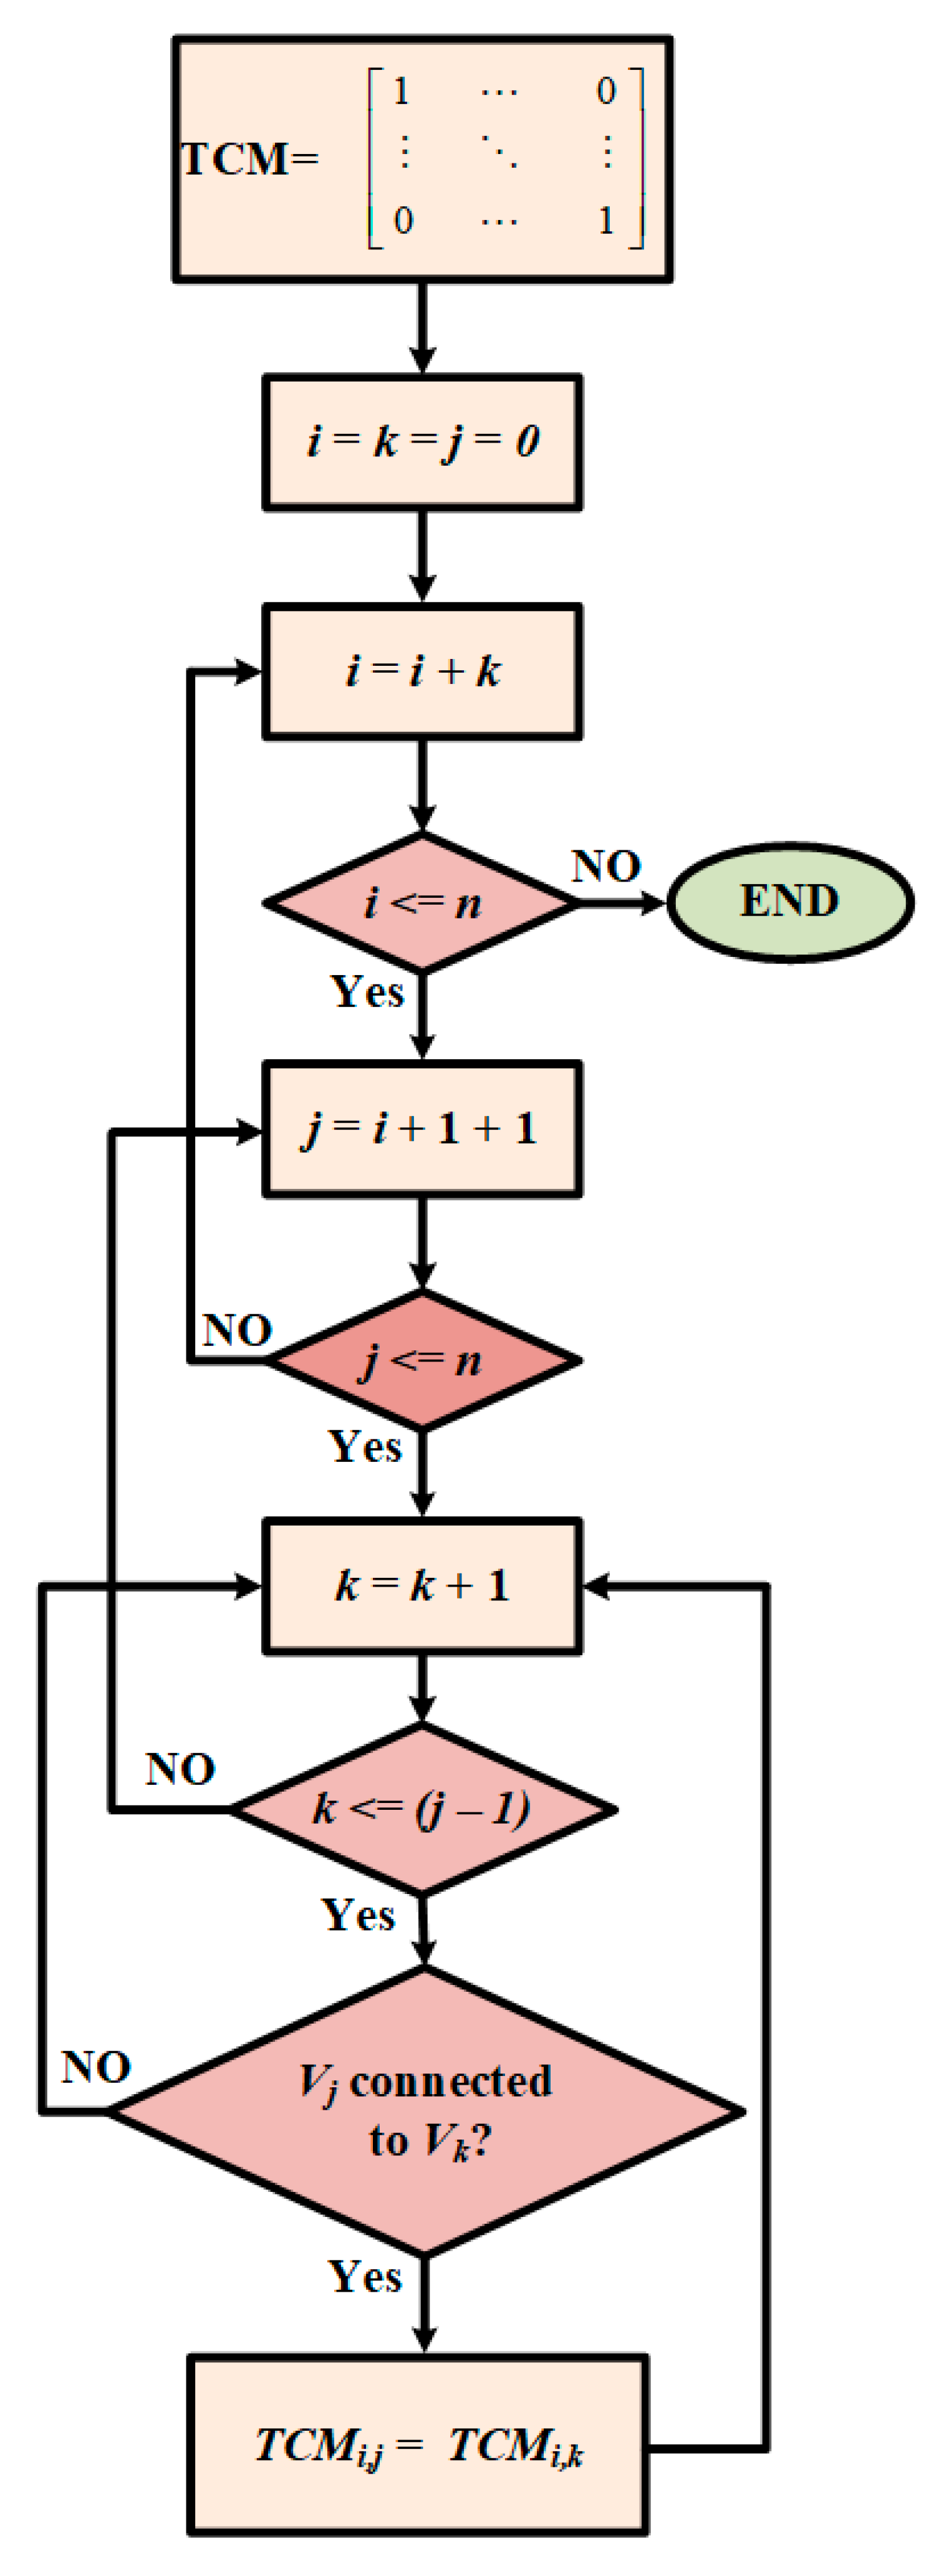
3.2. Topology Connection Matrix

Once the node integration matrix is calculated, the topology Connection Matrix [TCM]n,n is carried out. The topology connection matrix represents the subsections and the vertices in each subsection. The flowchart to calculate the [TCM] is depicted in Figure 5. Like the node integration matrix, [TCM] is a square matrix and the number of rows and columns depends on the number of vertices. The [NIM] is utilized to determine all routes in the system. The steps of determining the subsection is as follows:
(a)
As a first step, vertex V1 is chosen and the route starting from this vertex to other vertices is determined. For this purpose, existence of any edge between V2 and V1 is investigated. If any connection is found between V2 and V1, then connection between V3 and V2 will be checked and this will continue for the next vertex. Using this method, the route starts from V1 can be determined.
(b)
In the second step, since there is a possibility of more than one edge connected to V1, the connection between other unchecked vertices and V1 should be investigated. This step is repeated to find a link between all other vertices and V1.
The same steps are applied to the rest of the vertices to determine all the subsections. In Figure 5, the flowchart for calculating the [TCM] is depicted. According to this flowchart, the following are the steps to determine the island’s boundary:
(1)
For a graph with n vertices, an identity square matrix is formed.
(2)
Start to build the ith row.
(3)
If NIMj,k = 1, there is a connection between jth vertex and upstream kth vertices. Then, set the TCMi,j = TCMi,k.
(4)
Repeat the procedure from step (2) to build the next row of [TCM] for all the vertices.
The proposed algorithm in Figure 5 is used to determine the routes connecting two or more vertices. As explained above, the connectivity of each vertex with all upstream vertices is examined. Using this method, all the routes connecting the examined vertices can be detected.
Since the connection between one vertex to other vertices is checked just once by this algorithm, time will be saved. Moreover, since all the routes are determined using the above procedures, this algorithm can be applied on graphs with loops as well. Equation (2) represents the [TCM] matrix for the graph of Figure 4. When a consecutive numbering for vertices is used, The [TMC] can be calculated using Equation (2):
[ T C M ] = [ 1 0 0 0 1 0 0 1 1 0 0 1 0 0 0 1 0 0 0 0 0 0 1 1 0 0 1 0 0 1 0 0 1 1 0 0 1 0 0 1 1 0 0 0 1 0 0 1 1 0 0 1 0 0 0 1 0 0 0 0 0 0 1 1 0 0 1 0 0 1 1 0 0 0 1 0 0 1 1 0 1 0 0 0 1 0 0 1 1 0 0 0 1 1 0 0 1 0 0 1 ]

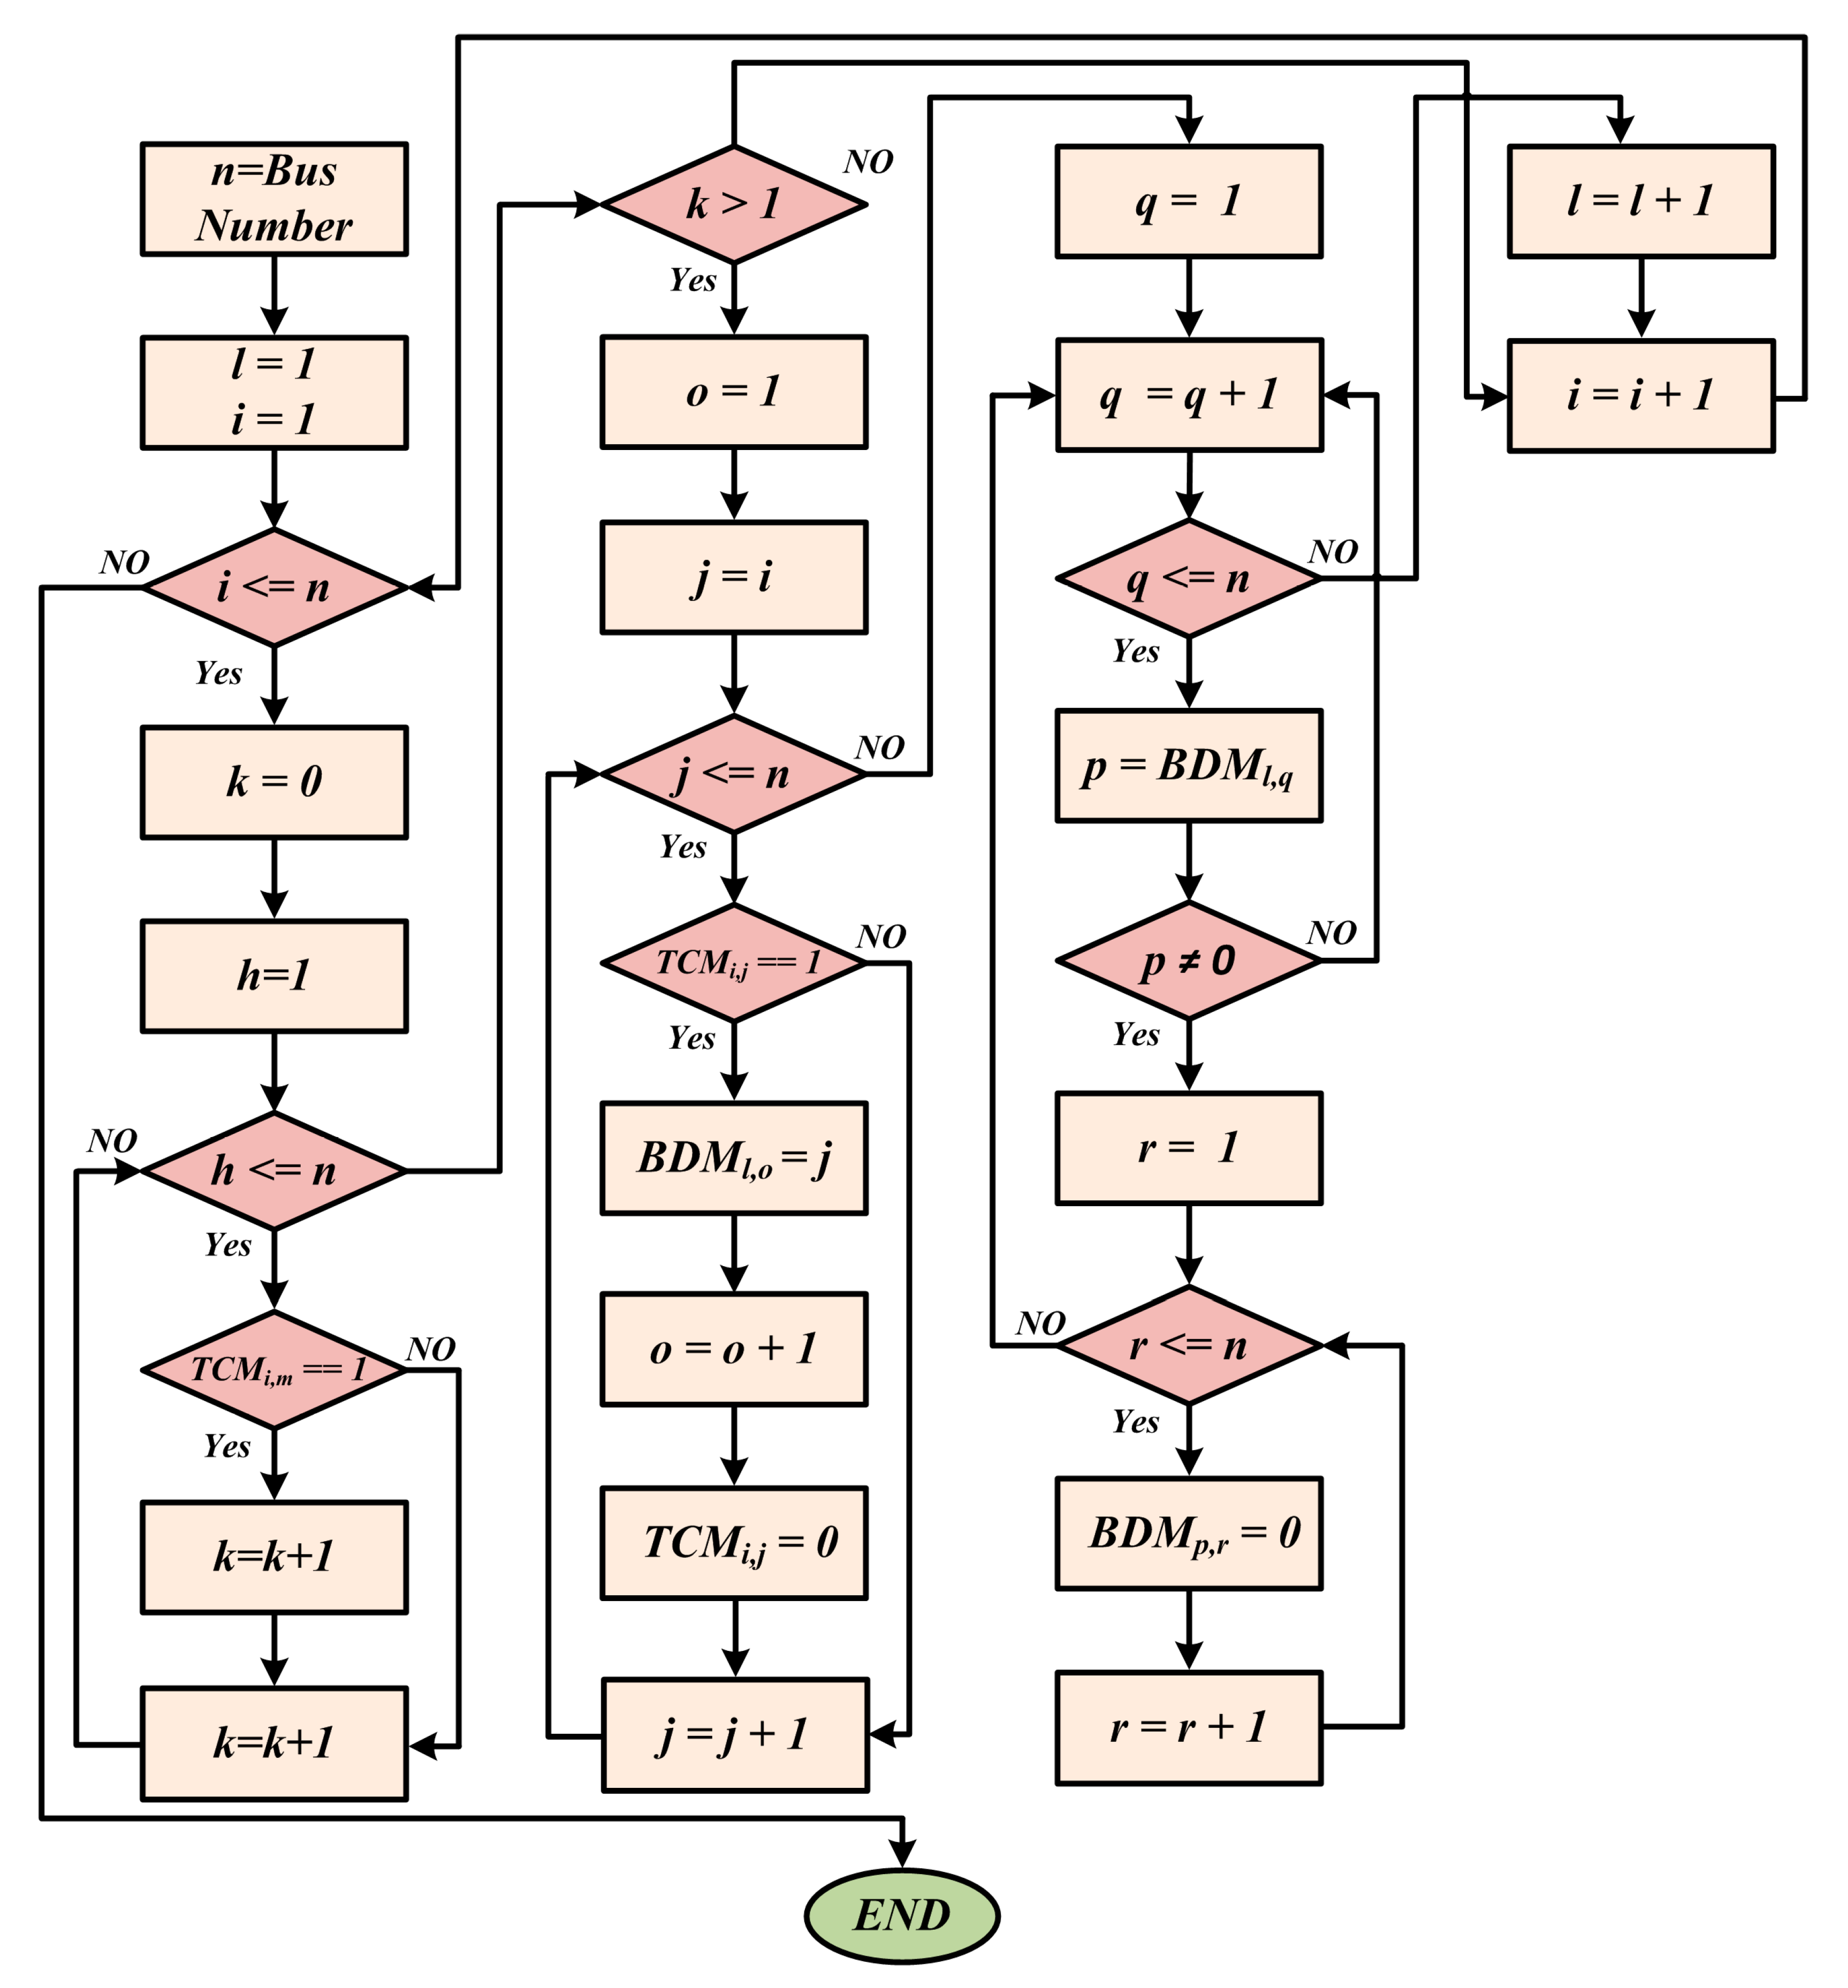
3.3. Boundary Detection Matrix

In the previous section, the topology connection matrix is formed and the subsections are marked. In this step, vertices in each subsection are extracted and Boundary Detection Matrix [ B D M ] n s , n v is formed. In this matrix, ns represents the number of subsections and nv represents the number of vertices in the largest subsection. The maximum ns are equal to n when all the vertices are separated and no edge in the graph. In contrast, the maximum value for nv is obtained for integrated graphs without any subsection. As shown in Equation (2), each row indicates one subsection. The steps for extracting the vertices and determining the boundary of each subsection are as follows:
(a)
First, in the first row of [TCM], the column numbers of those elements that are equal to 1 are taken to the [BDM].
(b)
Second, when column numbers (for example: column 1 and column 2) has been taken to [BDM], all the elements in the in the [TCM] rows with same number (row 1 and row2) have been changed to 0.
(c)
Third, the next row with non-zero elements is checked with the same procedure that explained in (a).
When the entire rows of the [TCM] are checked, the [BDM] matrix will be completed. The flowchart to identify the subsections and vertices in each section is depicted in Figure 6. The following are the steps to calculate [BDM]:
(1)
Start with mth row of [TMC] to find if there is 1 in this row.
(2)
Set the BDMi,j to m (ith is based on number of subsections).
(3)
Set entire mth row of [TMC] to zero and go to step 1.
Equation (3) shows the [BDM] matrix calculated using the procedures mentioned previously. Three different subsections including the number of vertices in each section are shown using Equation (3). One important advantage of the proposed method is the ability to detect the boundaries in meshed networks with various loops and non-consecutive bus-bar numbering.
[ B D M ] = [ 1 2 3 4 5 6 7 8 9 0 10 11 12 0 0 ]

4. Dynamic Voltage Sensitivity

In this paper, a novel dynamic voltage sensitivity factor is proposed to provide useful information about the system’s dynamic performance during islanding. Online calculation of instantaneous static voltage stability provides a pattern of points, which can be used as a dynamic index to determine the system voltage stability for each bus-bar. The DVSF reflects the influence of changes in system parameters on each bus-bar’s stability status and determines the weak bus-bar before and after islanding. A conventional load flow Jacobian matrix is used to determine the DVSF. In order to calculate the DVSF, bus-bar admittance matrix [Ybus] and the Jacobian matrix is re-calculated based on the system configuration. A three-dimensional [Ybus] is defined according to the new configuration of the system. Figure 7 demonstrates the [Ybus] for a system with ns islands. The size of the new [Ybus] is (nv, nv, ns). In this matrix, mth layer represents the calculated elements for mth island.
Similarly, a new Jacobian matrix according to the new system configuration is calculated. The dimensions of the new Jacobian matrix are (2nv × 2nv × 2ns). Equations (4)–(8) represents the mth layer of the Jacobian matrix calculated for the mth island in the system:
[ J ] ( m ) = [ J 1 m | J 2 m J 3 m | J 4 m ]
J 1 m = { P i , m δ i , m = j i | V i , m | | V j , m | | Y i , j , m | sin ( θ i , j , m δ i , m + δ j , m ) P i , m δ j , m = | V i , m | | V j , m | | Y i , j , m | sin ( θ i , j , m δ i , m + δ j , m ) j i
J 2 m = { P i , m | V i , m | = 2 | V i , m | | Y i , i , m | cos ( θ i , j , m δ i , m + δ j , m ) + j i | V j , m | | Y i , j , m | cos ( θ i , j , m δ i , m + δ j , m ) P i , m | V j , m | = | V i , m | | Y i , j , m | cos ( θ i , j , m δ i , m + δ j , m ) j i
J 3 m = { Q i , m δ i , m = j i | V i , m | | V j , m | | Y i , j , m | cos ( θ i , j , m δ i , m + δ j , m ) Q i , m δ j , m = | V i , m | | V j , m | | Y i , j , m | cos ( θ i , j , m δ i , m + δ j , m ) j i
J 4 m = { Q i , m | V i , m | = 2 | V i , m | | Y i , i , m | sin ( θ i , j , m δ i , m + δ j , m ) j i | V j , m | | Y i , j , m | cos ( θ i , j , m δ i , m + δ j , m ) Q i , m | V j , m | = | V i , m | | Y i , j , m | sin ( θ i , j , m δ i , m + δ j , m ) j i
The new Jacobian matrix for the the system with m islands is shown in Equation (9):
Energies 11 00889 i001
Accordingly, Equation (10) represents the relation between reactive power and the voltage for all the bus-bars in islands when active power exchange is assumed to be zero (ΔP = 0):
[ Δ Q ] n v , 1 , n s = [ J R ] n v , n v , n s [ Δ V ] n v , 1 , n s
Equation (11) represents the reduced matrix calculated for the mth island in the system. In this equation, [JR](m) is known as a reduced Jacobian matrix of the mth island in the system:
[ J R ] ( m ) = [ J 4 ( m ) J 3 ( m ) J 1 1 ( m ) J 2 ( m ) ]
Change in voltage with regards to the injected reactive power for the mth island can be defined by Equation (12):
[ Δ V ] ( m ) = [ J R 1 ] ( m ) [ Δ Q ] ( m )
Diagonal values of the [ J R 1 ] ( m ) , represents the voltage sensitivity for each bus-bar of the mth island in the system. DVSF is defined individually for each bus-bar. Positive and small values for DVSF indicate stable operation. On the contrary, high values for sensitivity factor are obtained when the system is near its stability margins. Negative values represent unstable operation and very small negative values represent very unstable operation. Since the relation between voltage and reactive power is nonlinear, the magnitude of the sensitivity factor in different operating conditions does not provide the degree of the stability [42].

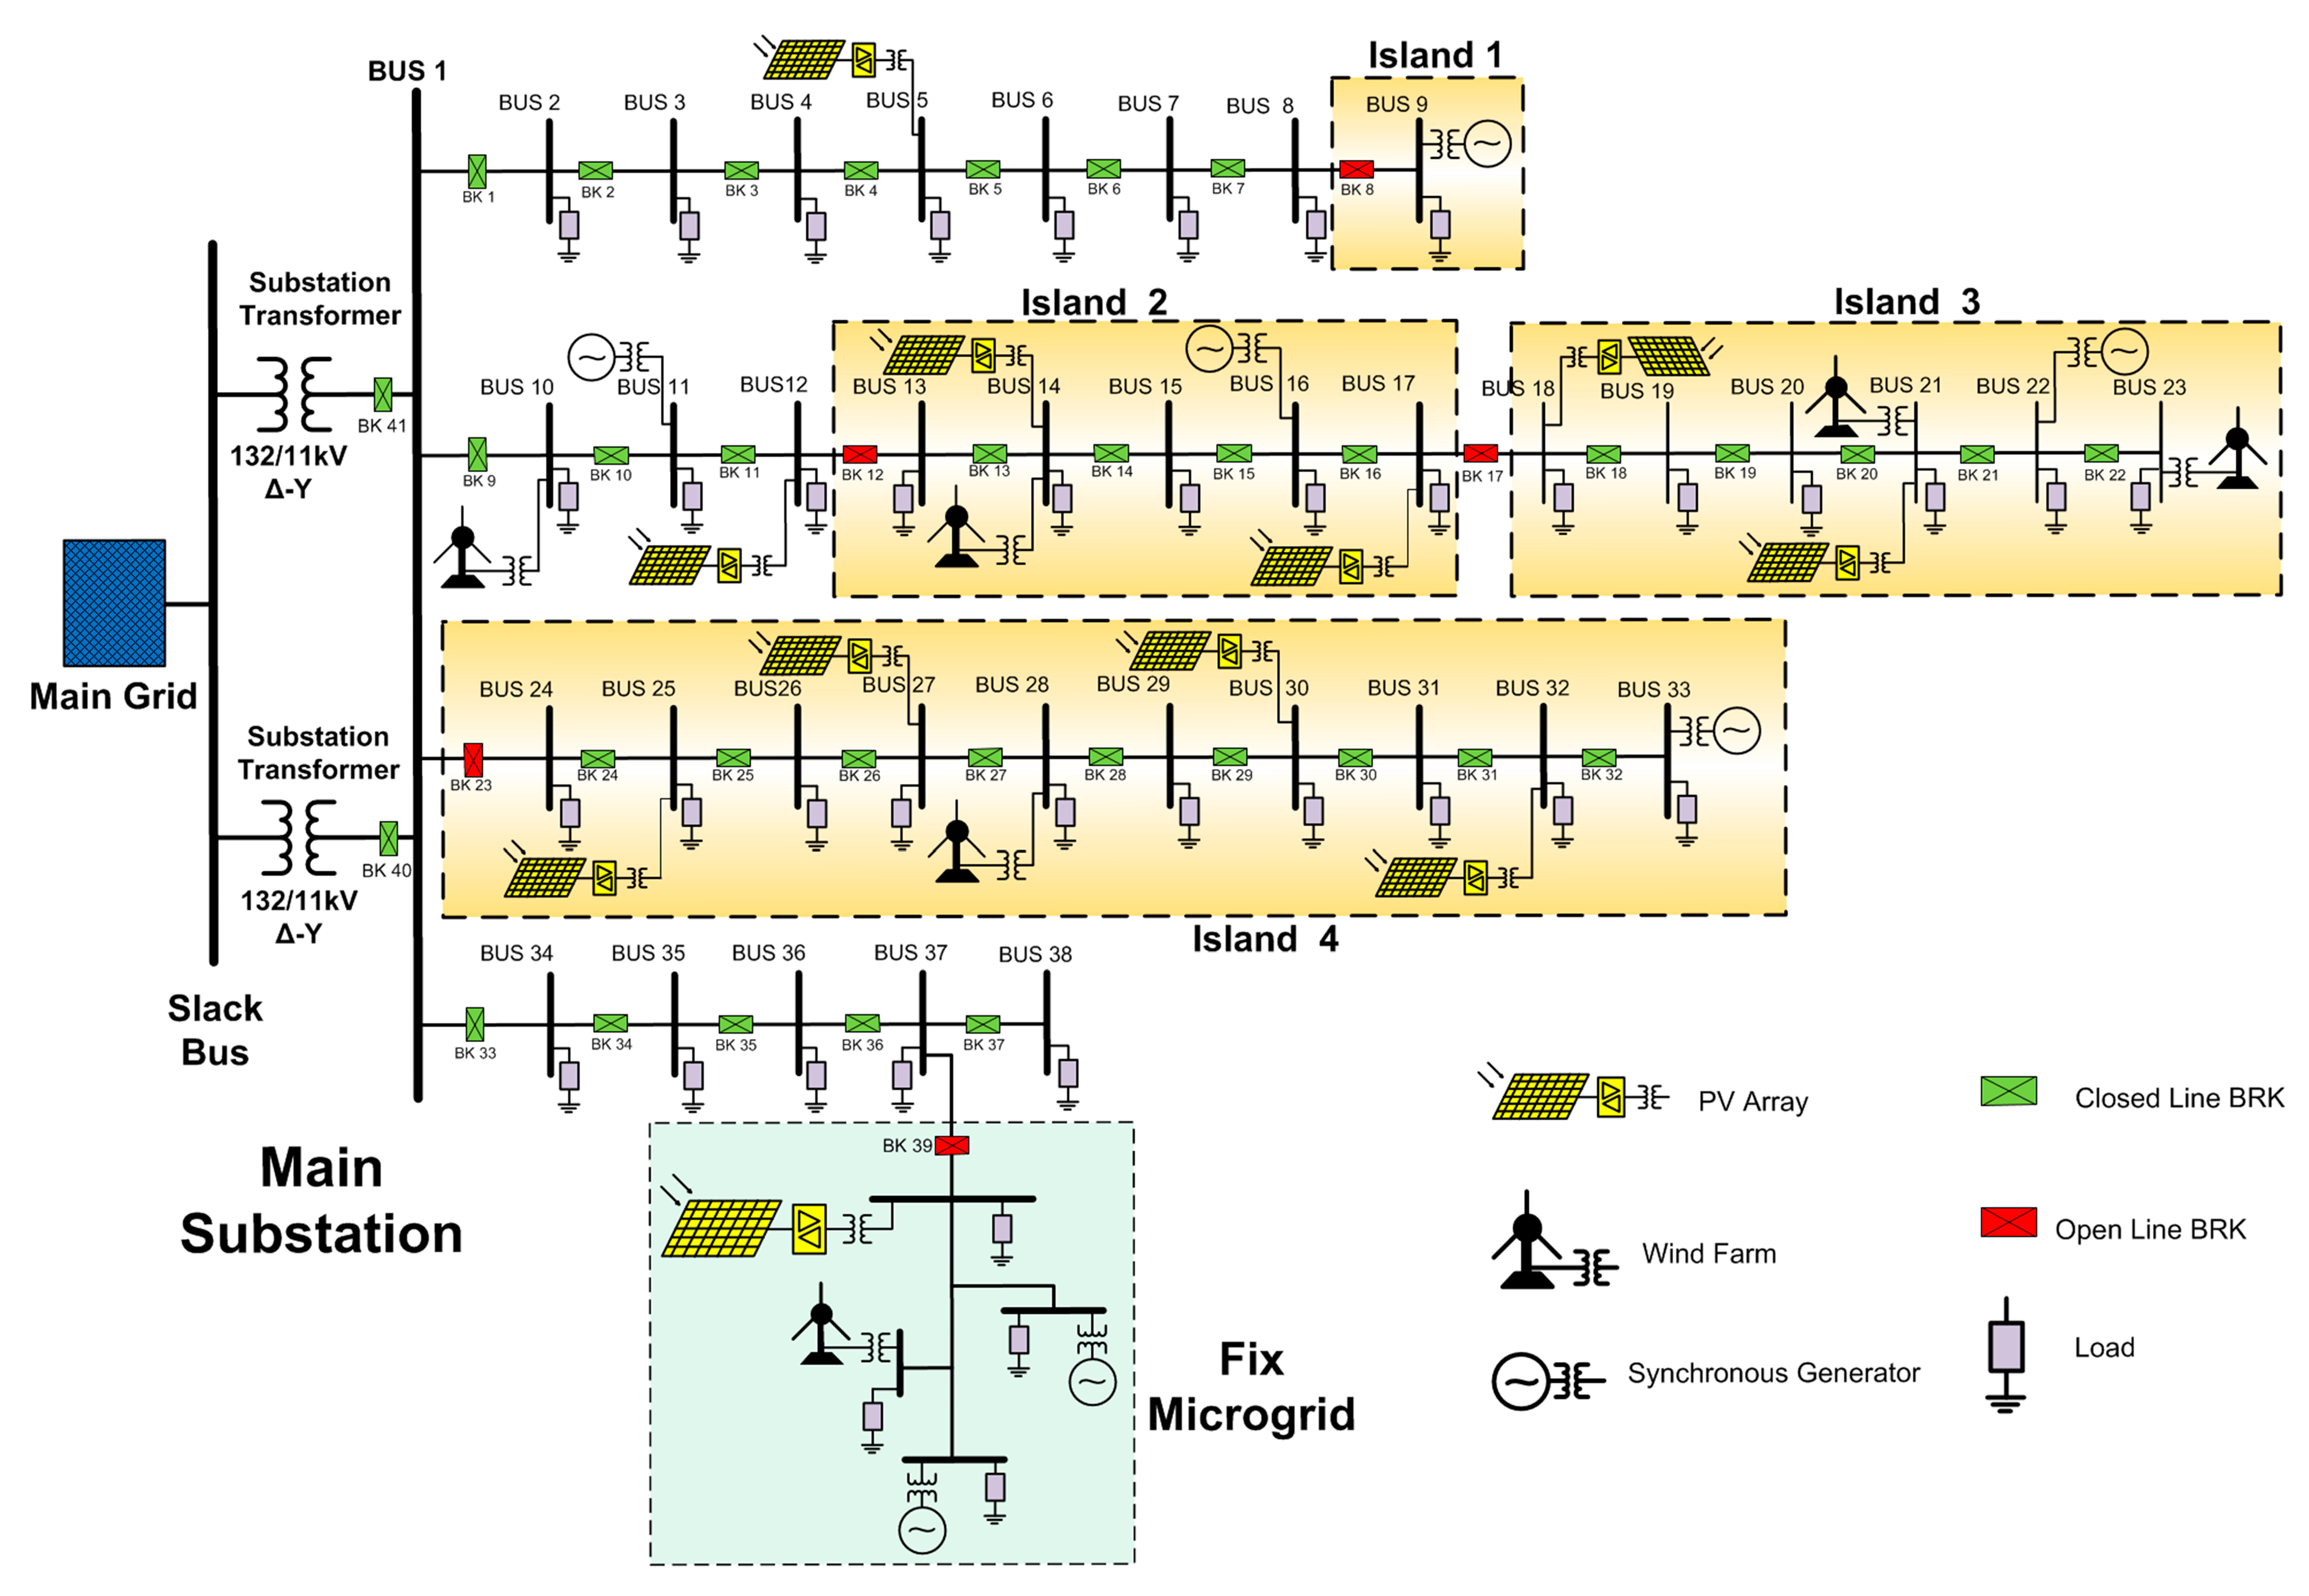
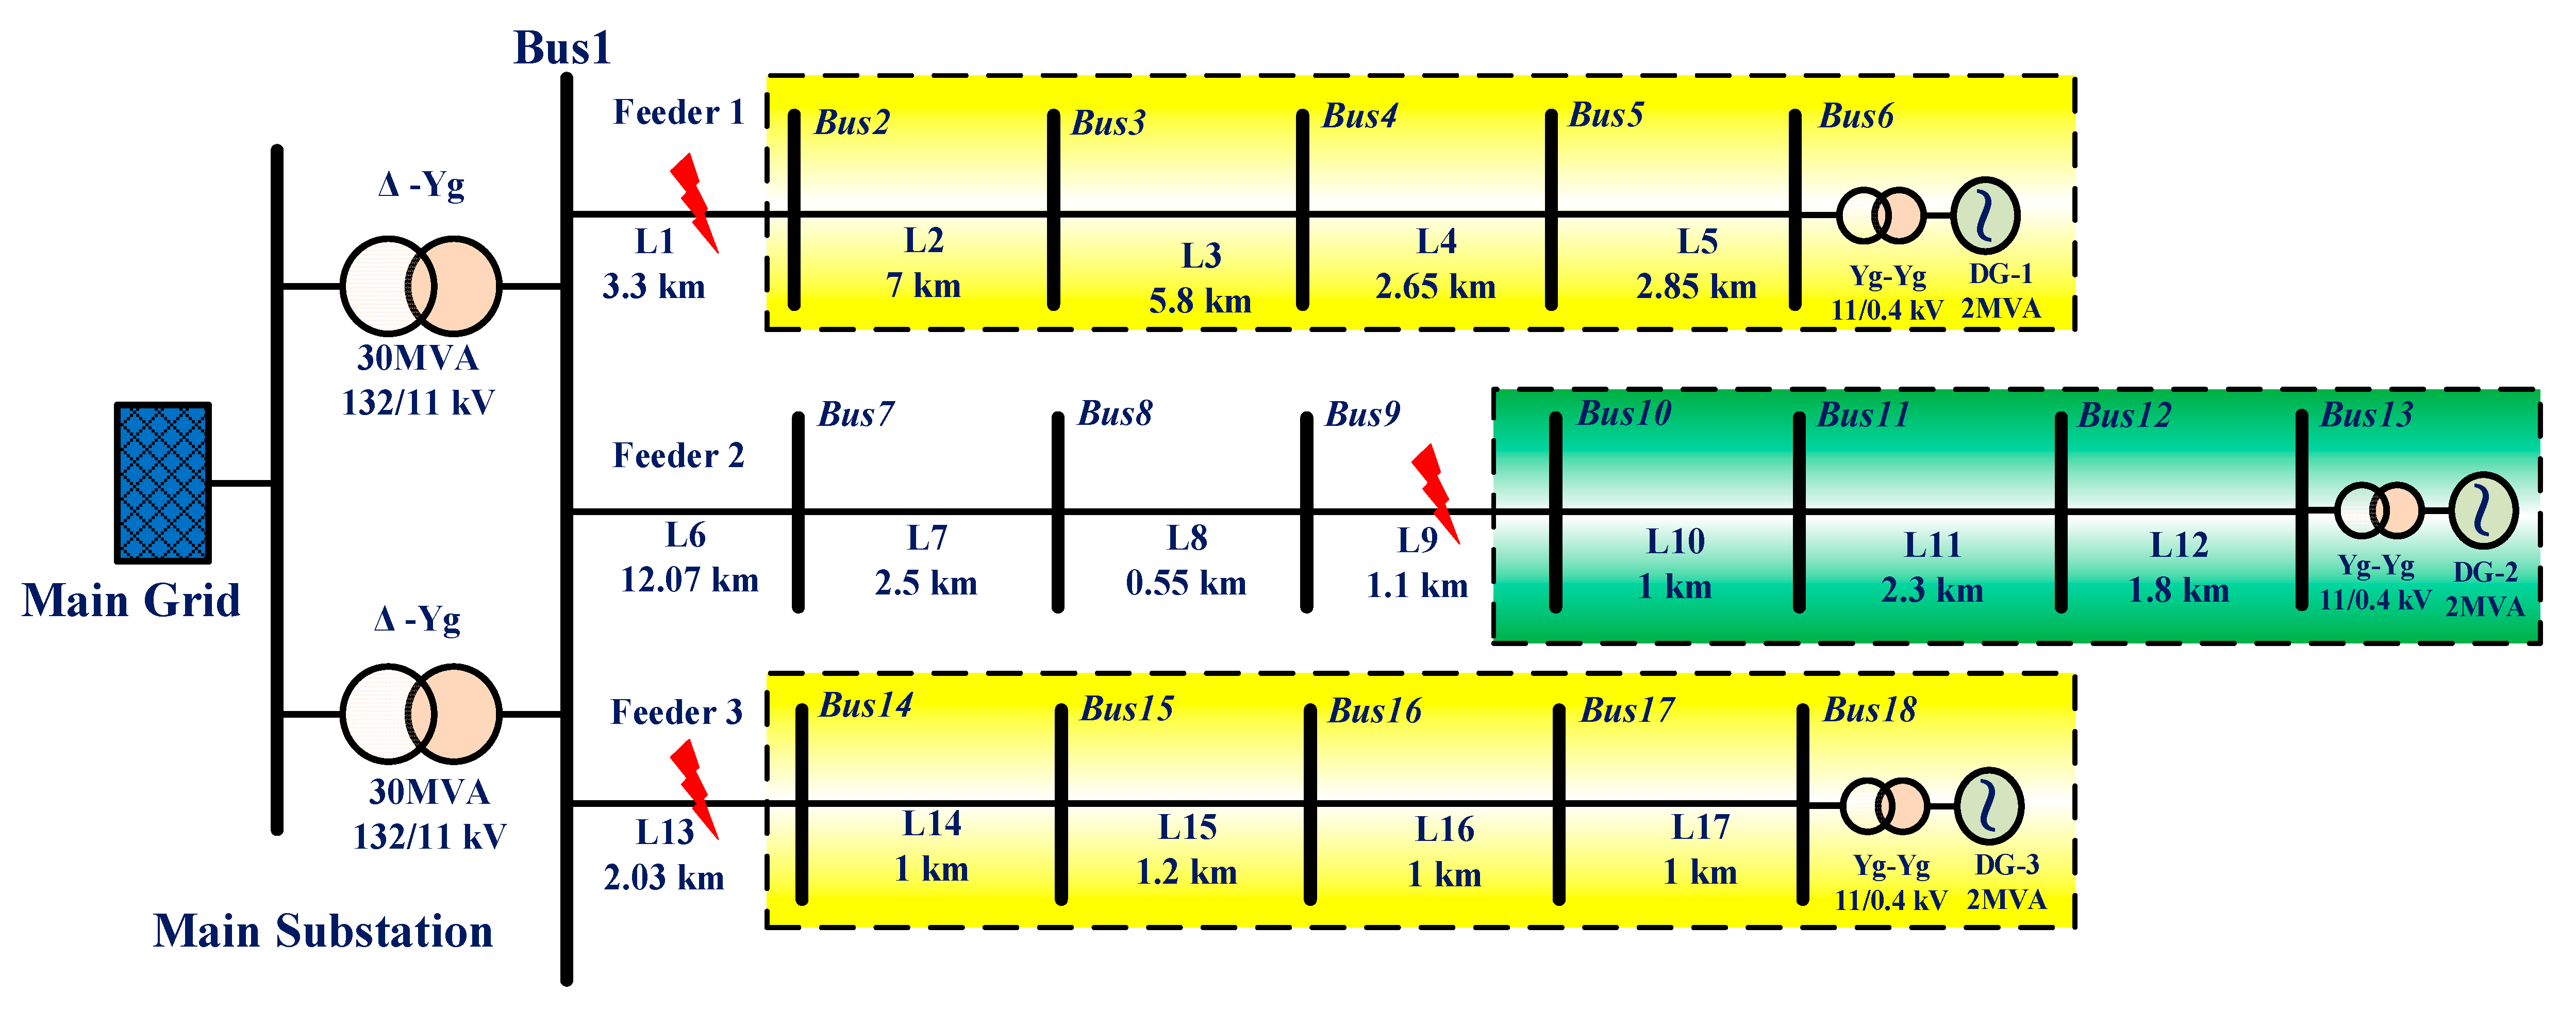
5. Generic Test Distribution System

A modified 11 kV, 50 Hz generic network from a Malaysian electrical distribution utility was modeled using EMTDC/PSCAD in order to investigate the proposed boundary detection method and dynamic voltage sensitivity factor. The single line diagram of this network is presented in Figure 8. The network has 18 bus-bars and 17 overhead lines. Both transformers in the main substation are 132/11 kV, Δ-Yg, rated at 30 MVA and impedance 10%. Fault level at 132 kV bus-bar is 14 kA and at 11 kV is 17.8 kA. Three 2 MVA synchronous generators were used as DG units as shown in Figure 8. The DG units are equipped with droop control to adjust the voltage and frequency after islanding. Each generator is connected to the distribution network via 0.4/11 kV, 3 MVA Yg-Yg transformer with 5% impedance. Simulation results are discussed in detail in the next section.

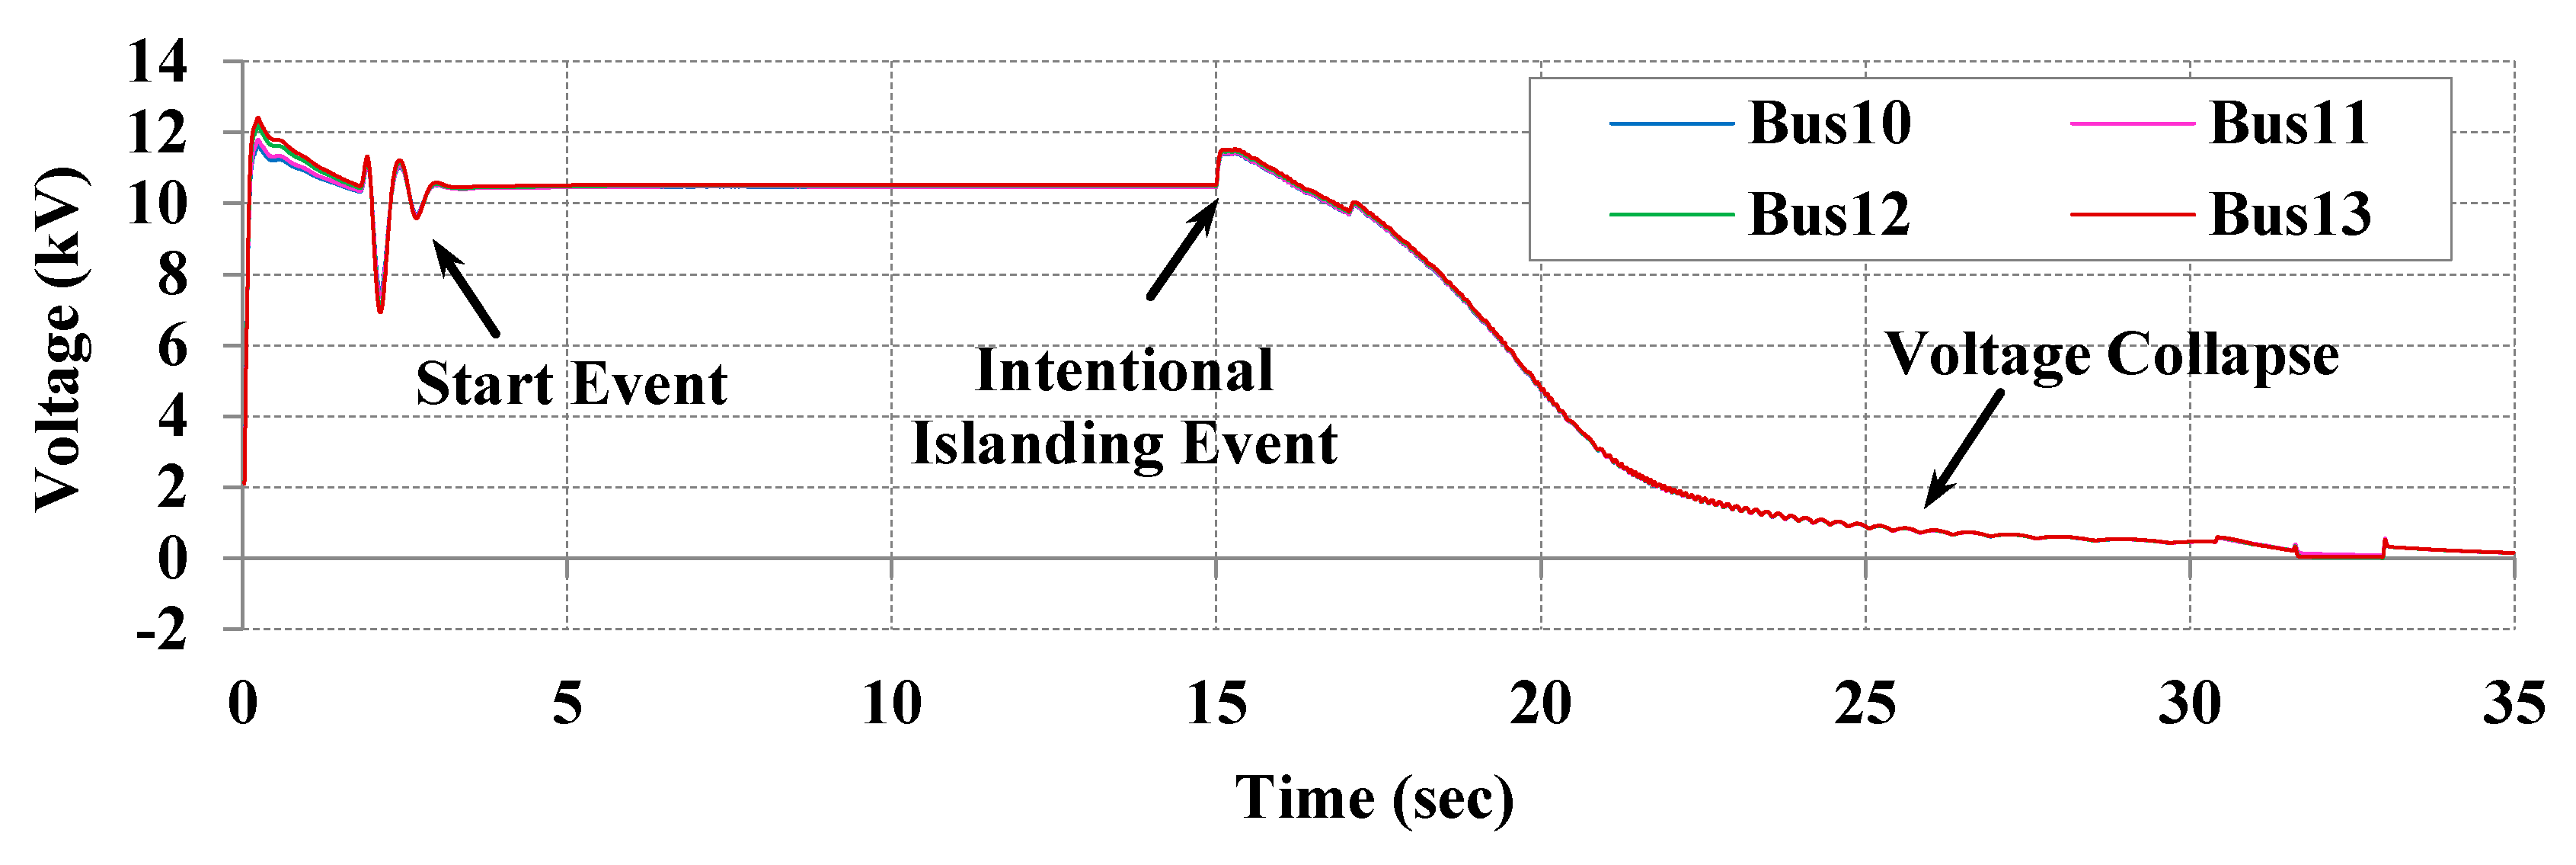
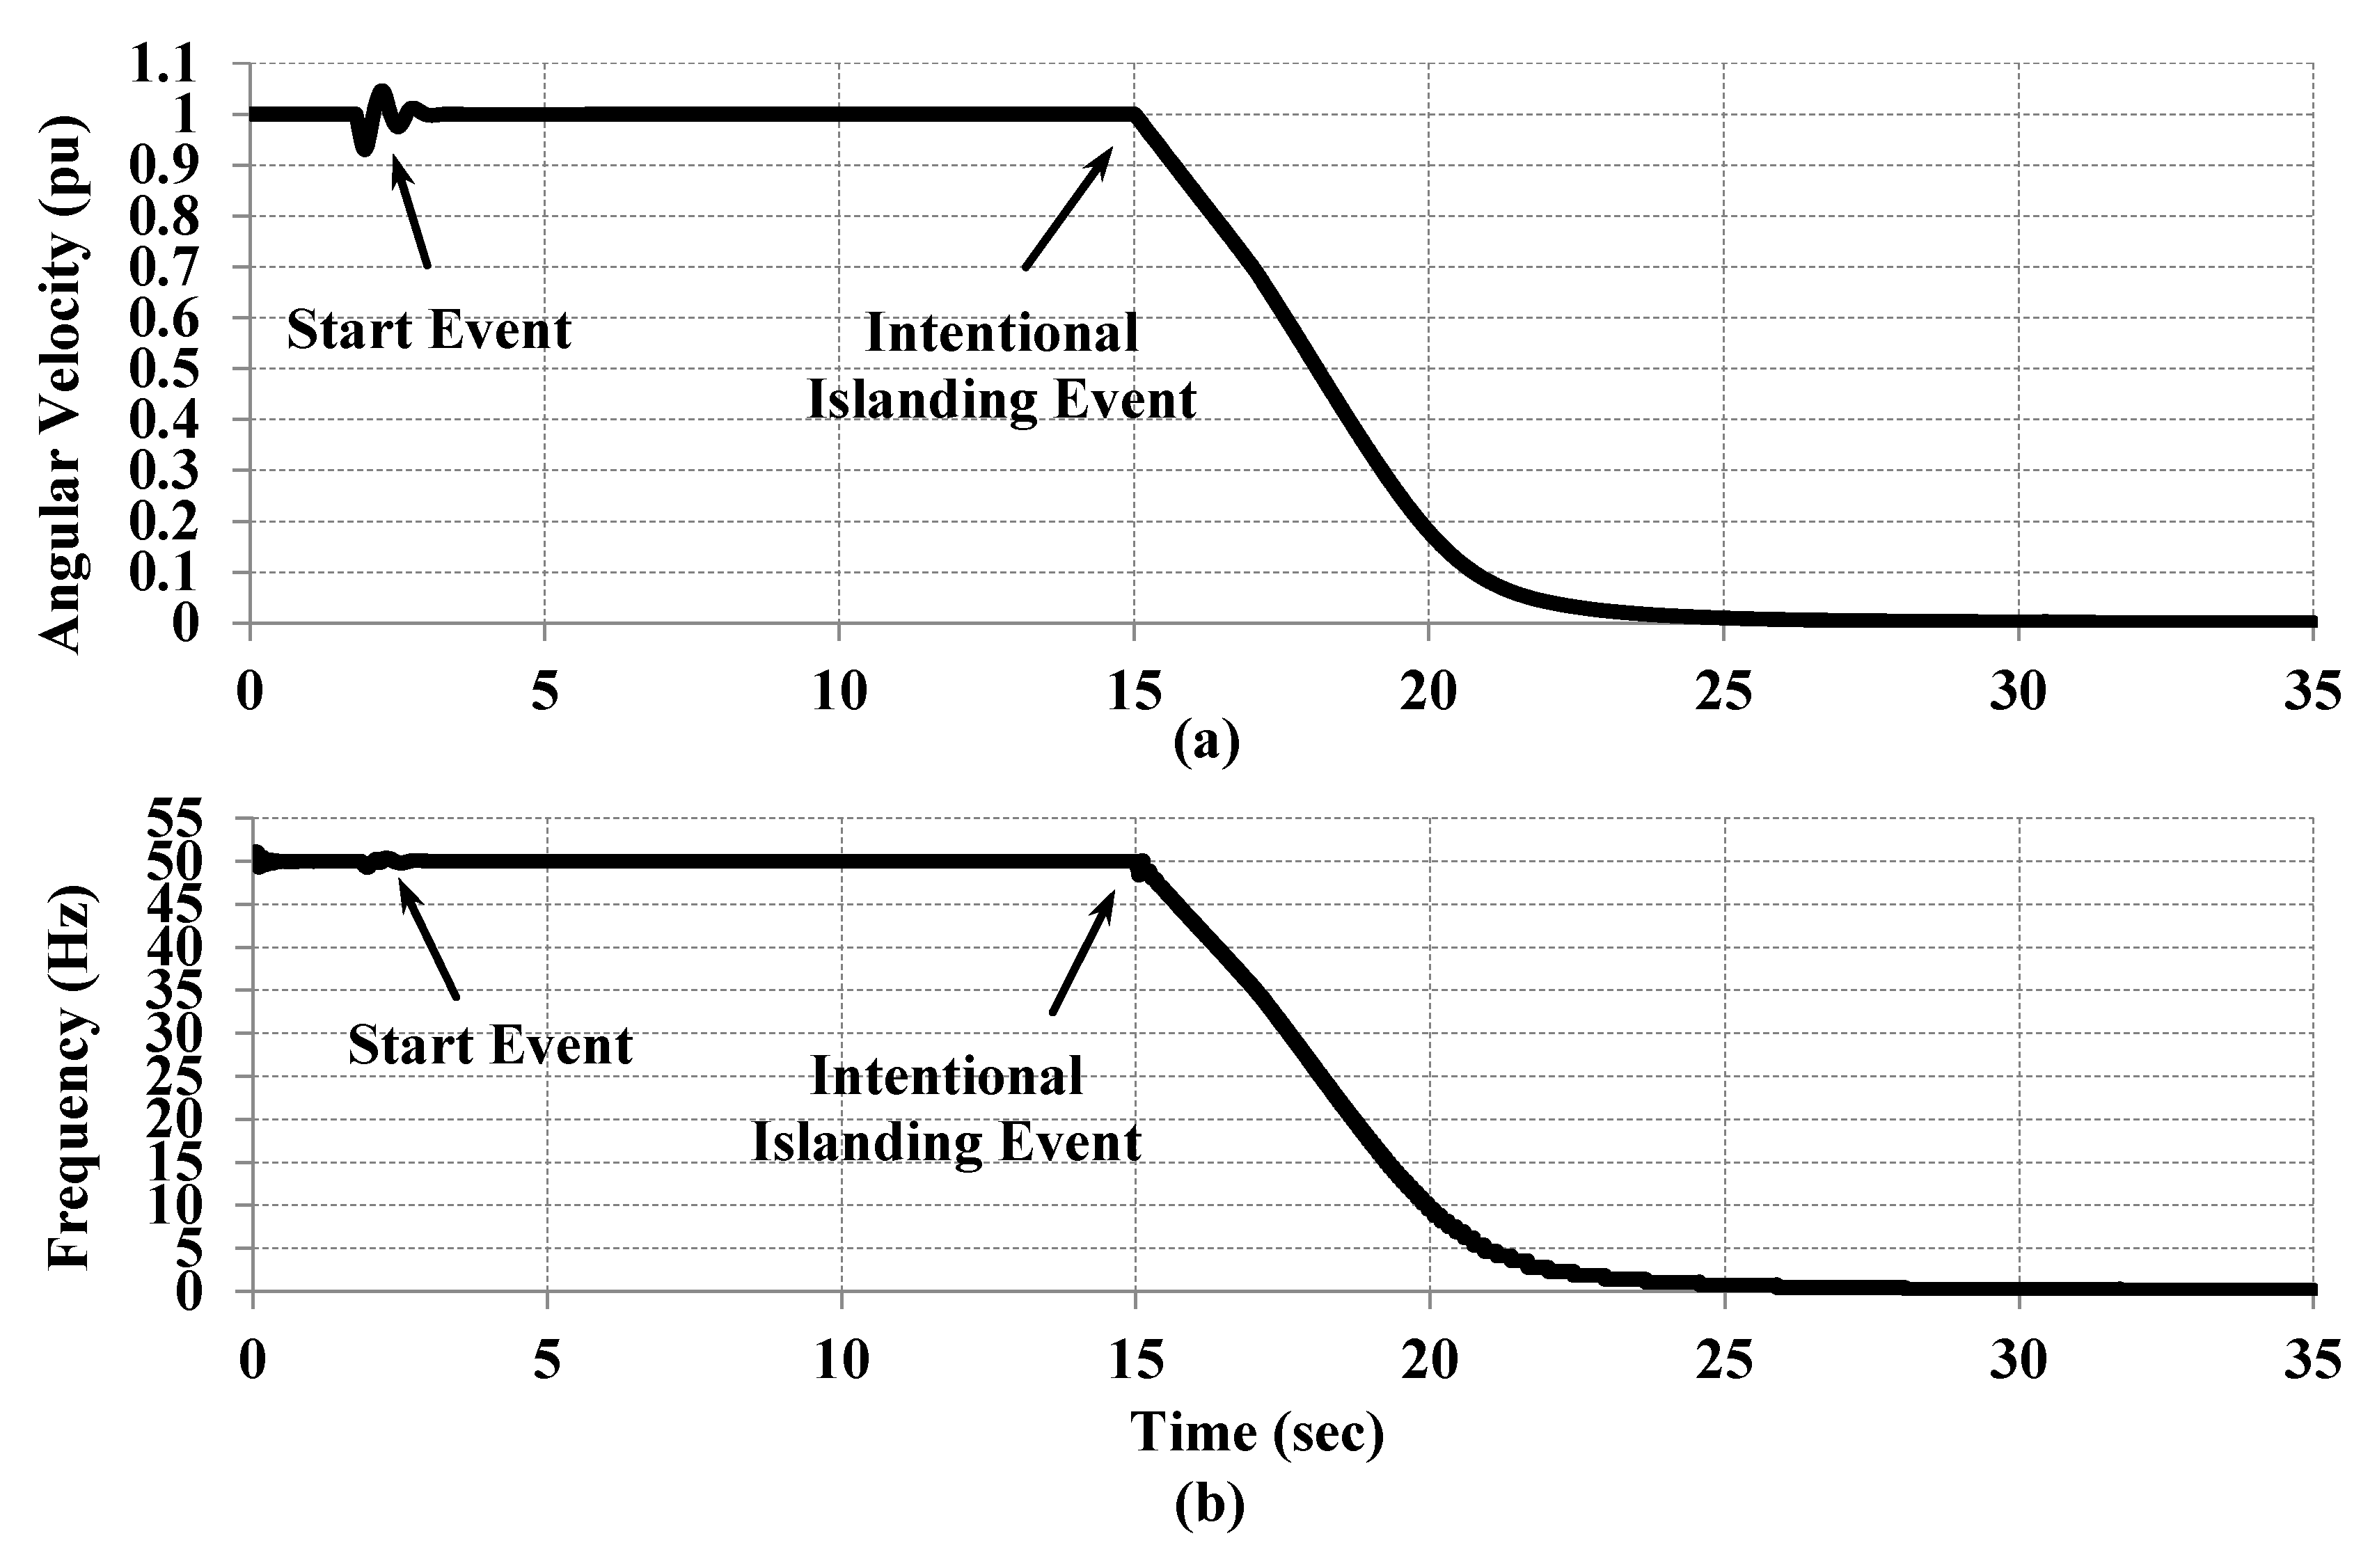
6. Results and Discussion

A case study with three islands was investigated to verify the performance of the proposed methods. In order to model the system, PSCAD/EMTDC and MATLAB were utilized. The network was modeled in PSCAD and the proposed algorithms were analyzed in MATLAB. A user defined block was used as an interface to exchange the data between the software’s and to send the wide area load shedding commands from MATLAB to PSCAD. Synchronous generator ‘start event’ was simulated via releasing the rotor at 2 s. Intentional islanding was initiated in the system after 15 s via opening the line sections L1, L9 and L13 as in Figure 8. The opening of three line sections split the network to four subsystems. In the first step, results for the island boundary detection method were investigated. In the second step, DVSFs were shown for one island. In the third step, the wide area load shedding results based on dynamic voltage sensitivity factor were presented.

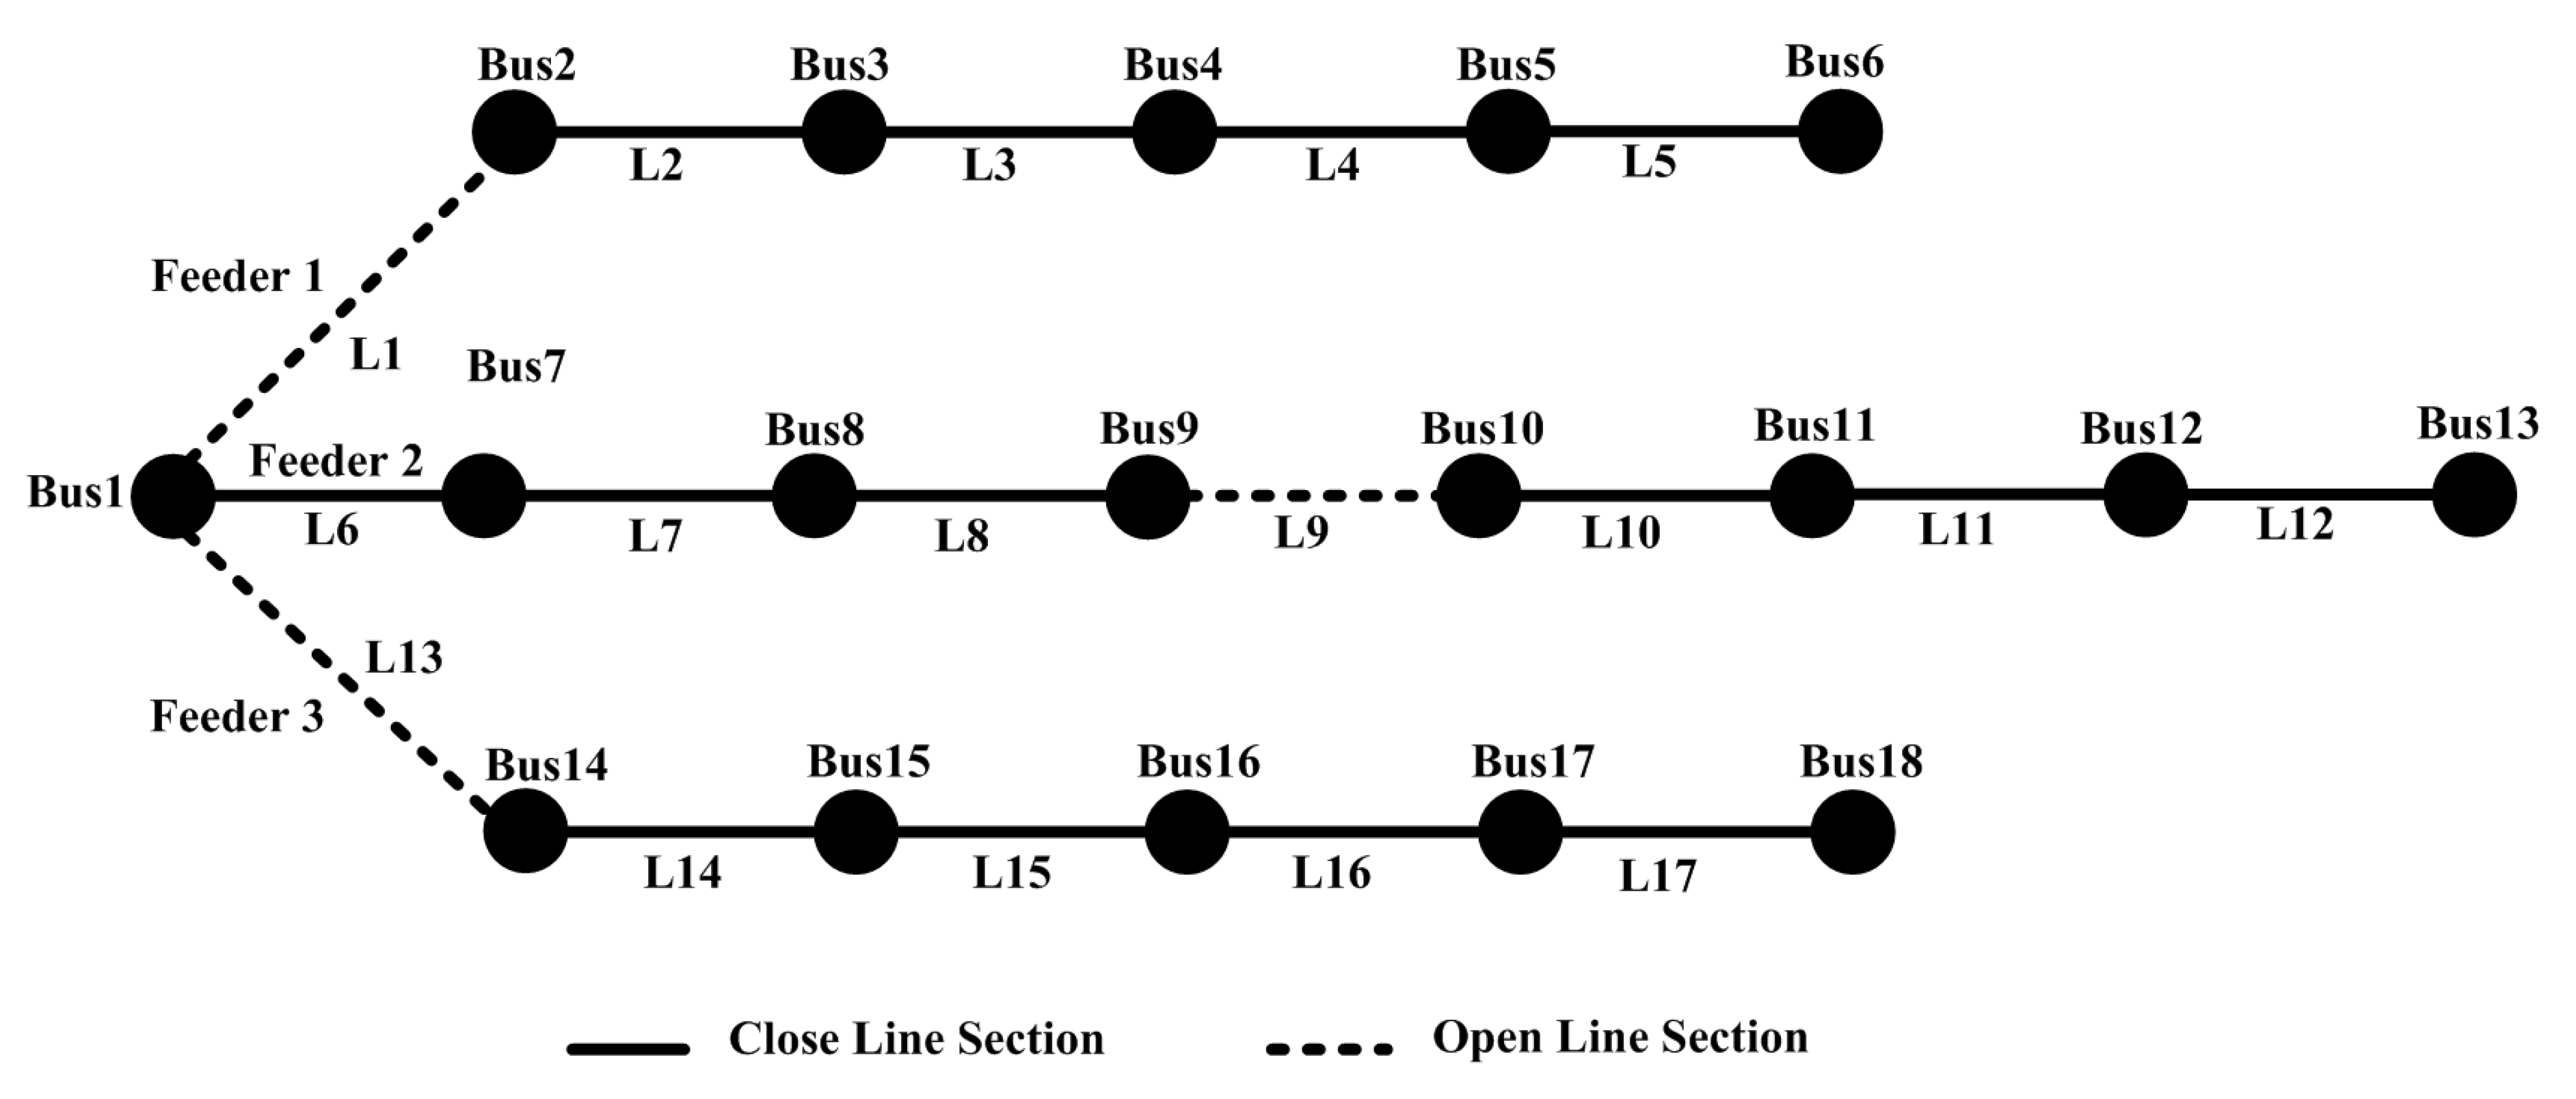
6.1. Island Boundary Detection Results

The equivalent graph for the given test system is shown in Figure 9. It was assumed that the voltage and current measurements were available in each bus-bar. After the tie line breakers opened, current would be reduced to zero in that line section. Hence, all downstream bus-bars were considered as an island, provided that a source existed. As explained in section (II), the node integration matrix [NIM]18 × 18 was calculated as follows:
[ N I M ] = [ 1 0 0 0 0 0 1 0 0 0 0 0 0 0 0 0 0 0 0 1 1 0 0 0 0 0 0 0 0 0 0 0 0 0 0 0 0 1 1 1 0 0 0 0 0 0 0 0 0 0 0 0 0 0 0 0 1 1 1 0 0 0 0 0 0 0 0 0 0 0 0 0 0 0 0 1 1 1 0 0 0 0 0 0 0 0 0 0 0 0 0 0 0 0 1 1 0 0 0 0 0 0 0 0 0 0 0 0 1 0 0 0 0 0 1 1 0 0 0 0 0 0 0 0 0 0 0 0 0 0 0 0 0 1 1 0 0 0 0 0 0 0 0 0 0 0 0 0 0 0 0 1 1 0 0 0 0 0 0 0 0 0 0 0 0 0 0 0 0 0 0 1 1 0 0 0 0 0 0 0 0 0 0 0 0 0 0 0 0 1 1 1 0 0 0 0 0 0 0 0 0 0 0 0 0 0 0 0 1 1 1 0 0 0 0 0 0 0 0 0 0 0 0 0 0 0 0 1 1 0 0 0 0 0 0 0 0 0 0 0 0 0 0 0 0 0 0 1 1 0 0 0 0 0 0 0 0 0 0 0 0 0 0 0 0 1 1 1 0 0 0 0 0 0 0 0 0 0 0 0 0 0 0 0 1 1 1 0 0 0 0 0 0 0 0 0 0 0 0 0 0 0 0 1 1 1 0 0 0 0 0 0 0 0 0 0 0 0 0 0 0 0 1 1 ]
In order to form the node integration matrix [NIM], the system topology was monitored using current measurements. The line section with none zero current was considered as a closed line. Using the procedure explained in Section 2, the calculated [TCM]18×18 is shown in Equation (14) for the test distribution network. To extract the number of bus-bars and corresponding Islands, the procedure, which is depicted in Figure 6, was applied on the calculated topology connection matrix. The calculated topology matrix [TCM] for the test network is shown in Equation (14):
[ T C M ] = [ 1 0 0 0 0 0 1 1 1 0 0 0 0 0 0 0 0 0 0 1 1 1 1 1 0 0 0 0 0 0 0 0 0 0 0 0 0 0 1 1 1 1 0 0 0 0 0 0 0 0 0 0 0 0 0 0 0 1 1 1 0 0 0 0 0 0 0 0 0 0 0 0 0 0 0 0 1 1 0 0 0 0 0 0 0 0 0 0 0 0 0 0 0 0 0 1 0 0 0 0 0 0 0 0 0 0 0 0 0 0 0 0 0 0 1 1 1 0 0 0 0 0 0 0 0 0 0 0 0 0 0 0 0 1 1 0 0 0 0 0 0 0 0 0 0 0 0 0 0 0 0 0 1 0 0 0 0 0 0 0 0 0 0 0 0 0 0 0 0 0 0 1 1 1 1 0 0 0 0 0 0 0 0 0 0 0 0 0 0 0 1 1 1 0 0 0 0 0 0 0 0 0 0 0 0 0 0 0 0 1 1 0 0 0 0 0 0 0 0 0 0 0 0 0 0 0 0 0 1 0 0 0 0 0 0 0 0 0 0 0 0 0 0 0 0 0 0 1 1 1 1 1 0 0 0 0 0 0 0 0 0 0 0 0 0 0 1 1 1 1 0 0 0 0 0 0 0 0 0 0 0 0 0 0 0 1 1 1 0 0 0 0 0 0 0 0 0 0 0 0 0 0 0 0 1 1 0 0 0 0 0 0 0 0 0 0 0 0 0 0 0 0 0 1 ]
[ B D M ] = [ 1 7 8 9 0 2 3 4 5 6 10 11 12 13 0 14 15 16 17 18 ]
The boundary detection matrix [BDM] shows that the system is divided into four subsystems. The system with bus-bar (1) is not considered as an island as it is connected to the main grid. As shown in the results, the proposed method is capable of detecting the configuration of Islands in the distribution network. Moreover, the proposed method is capable of tracking any changes in the island configuration. If the island’s configuration changed due to any reason such as faults in the system or self-healing strategies, the proposed method can detect the new configuration without applying any further modification.

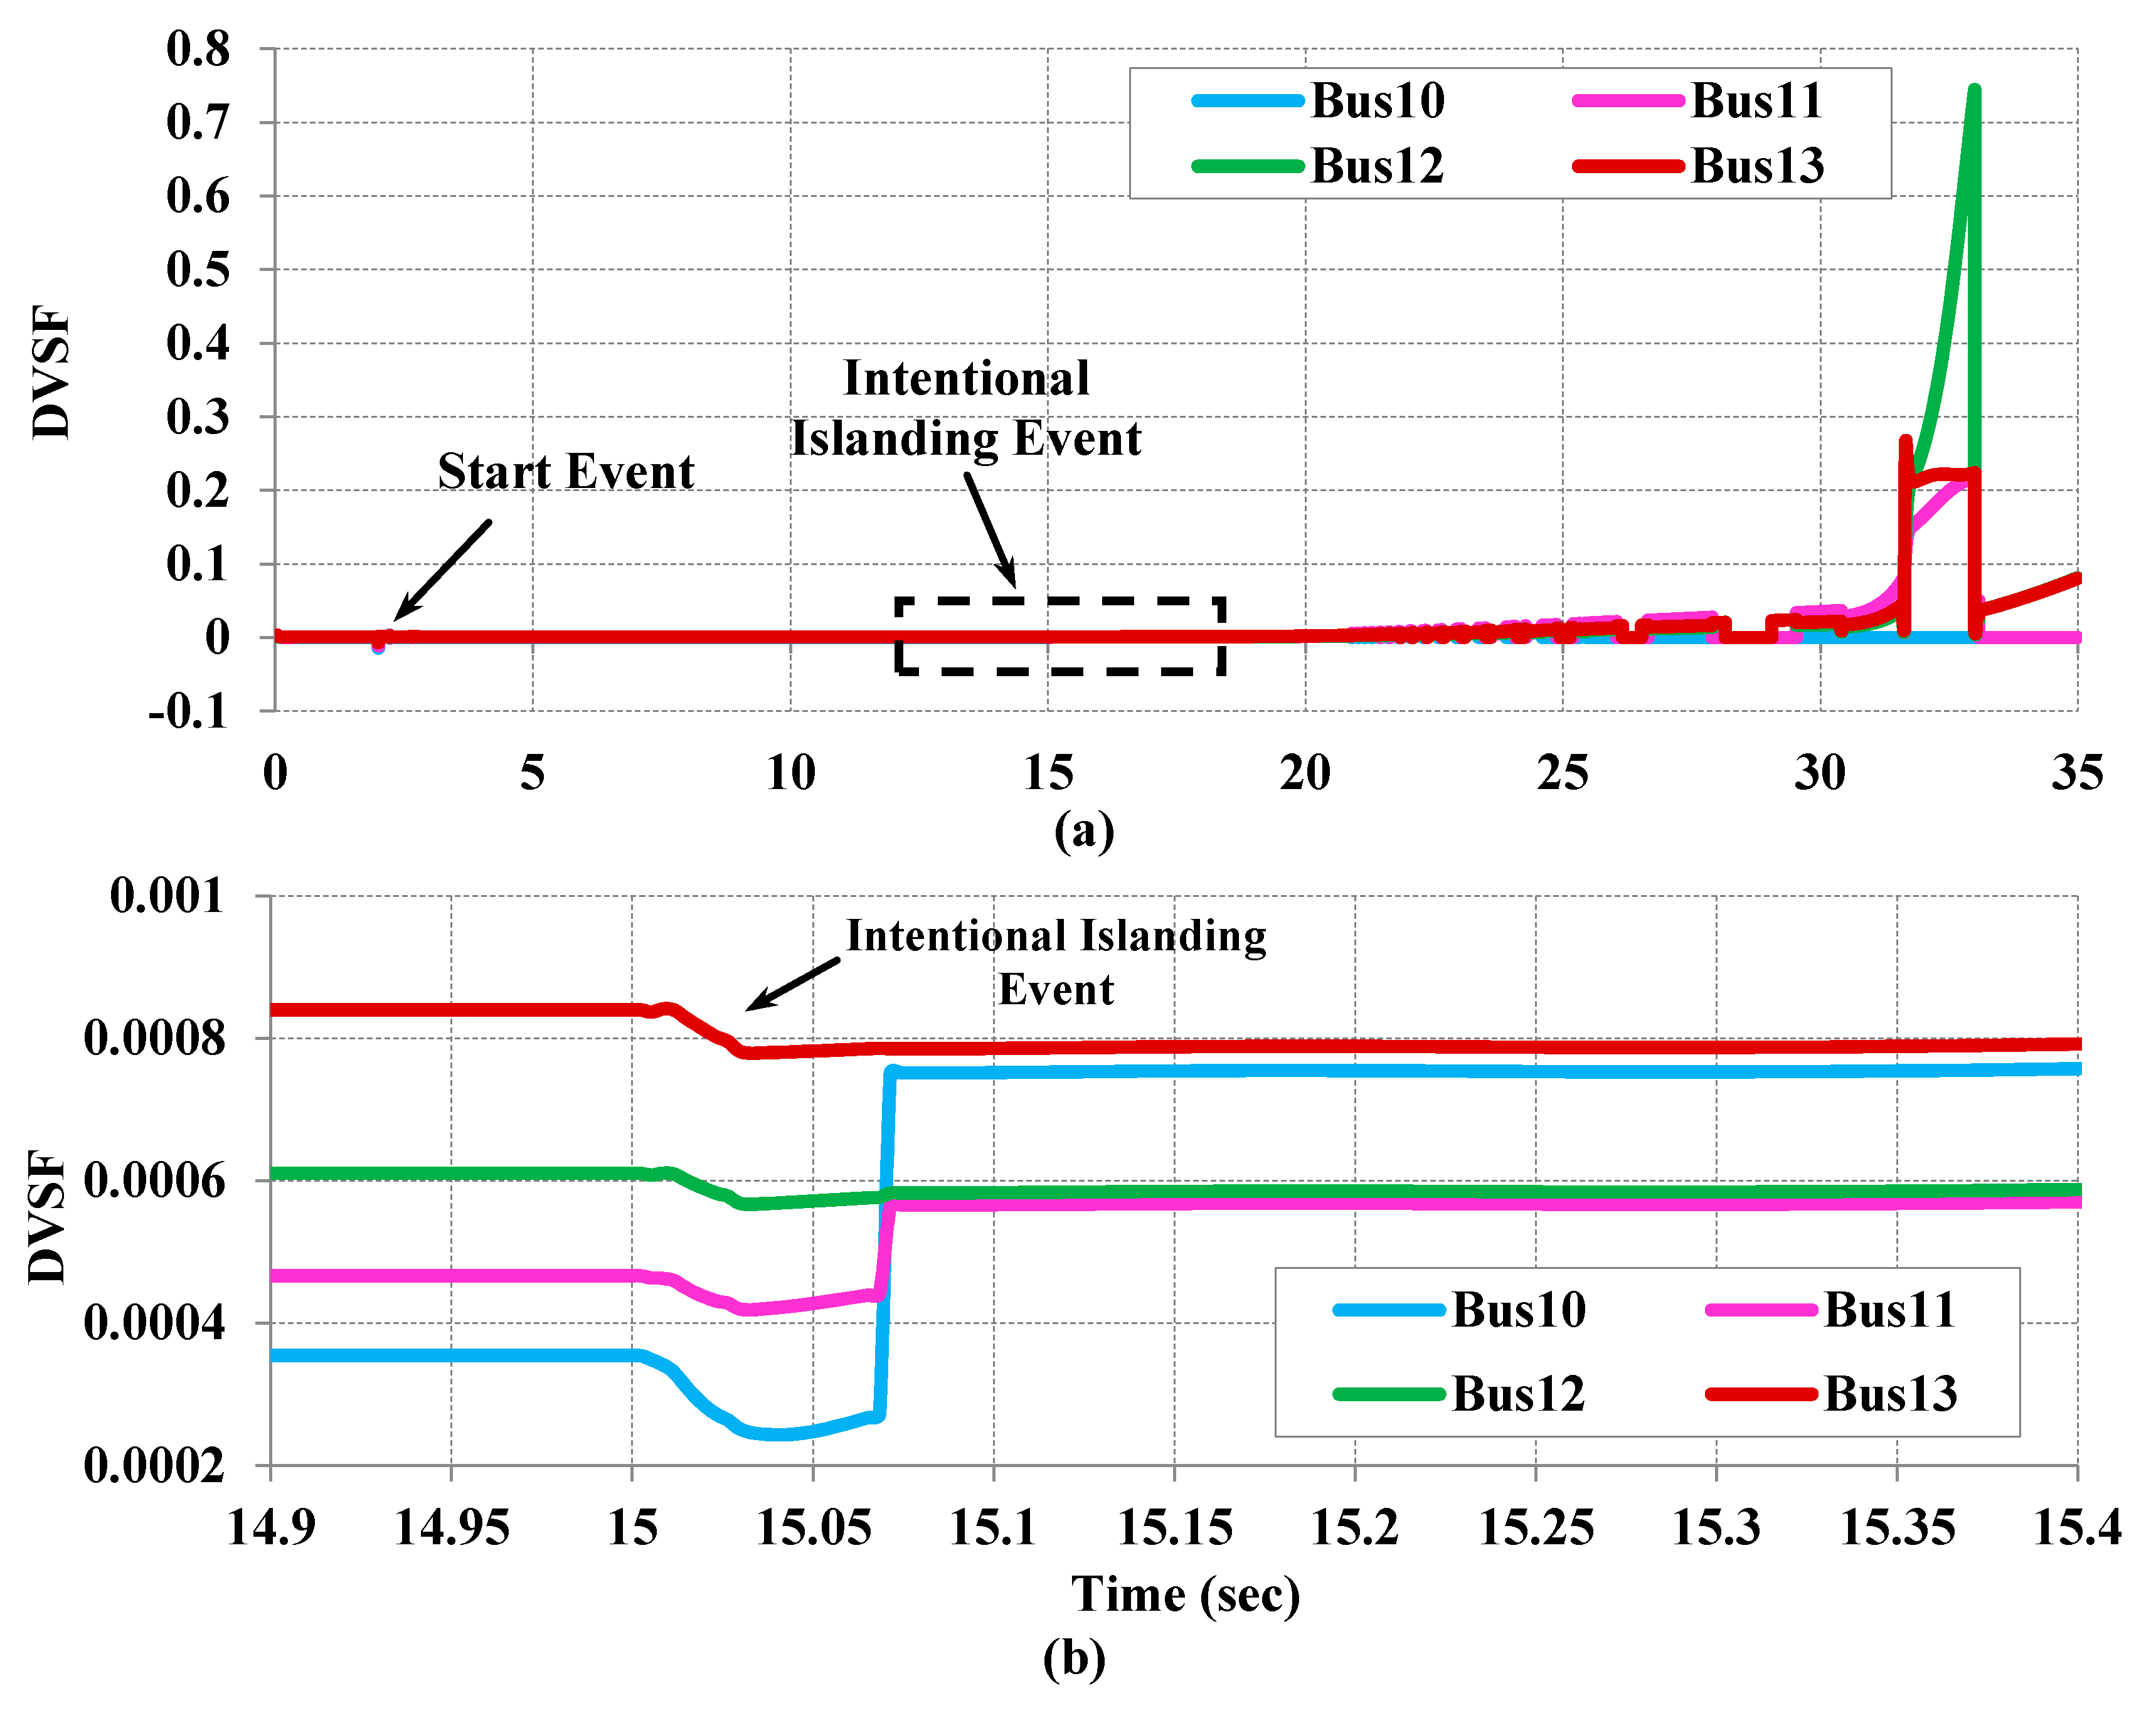
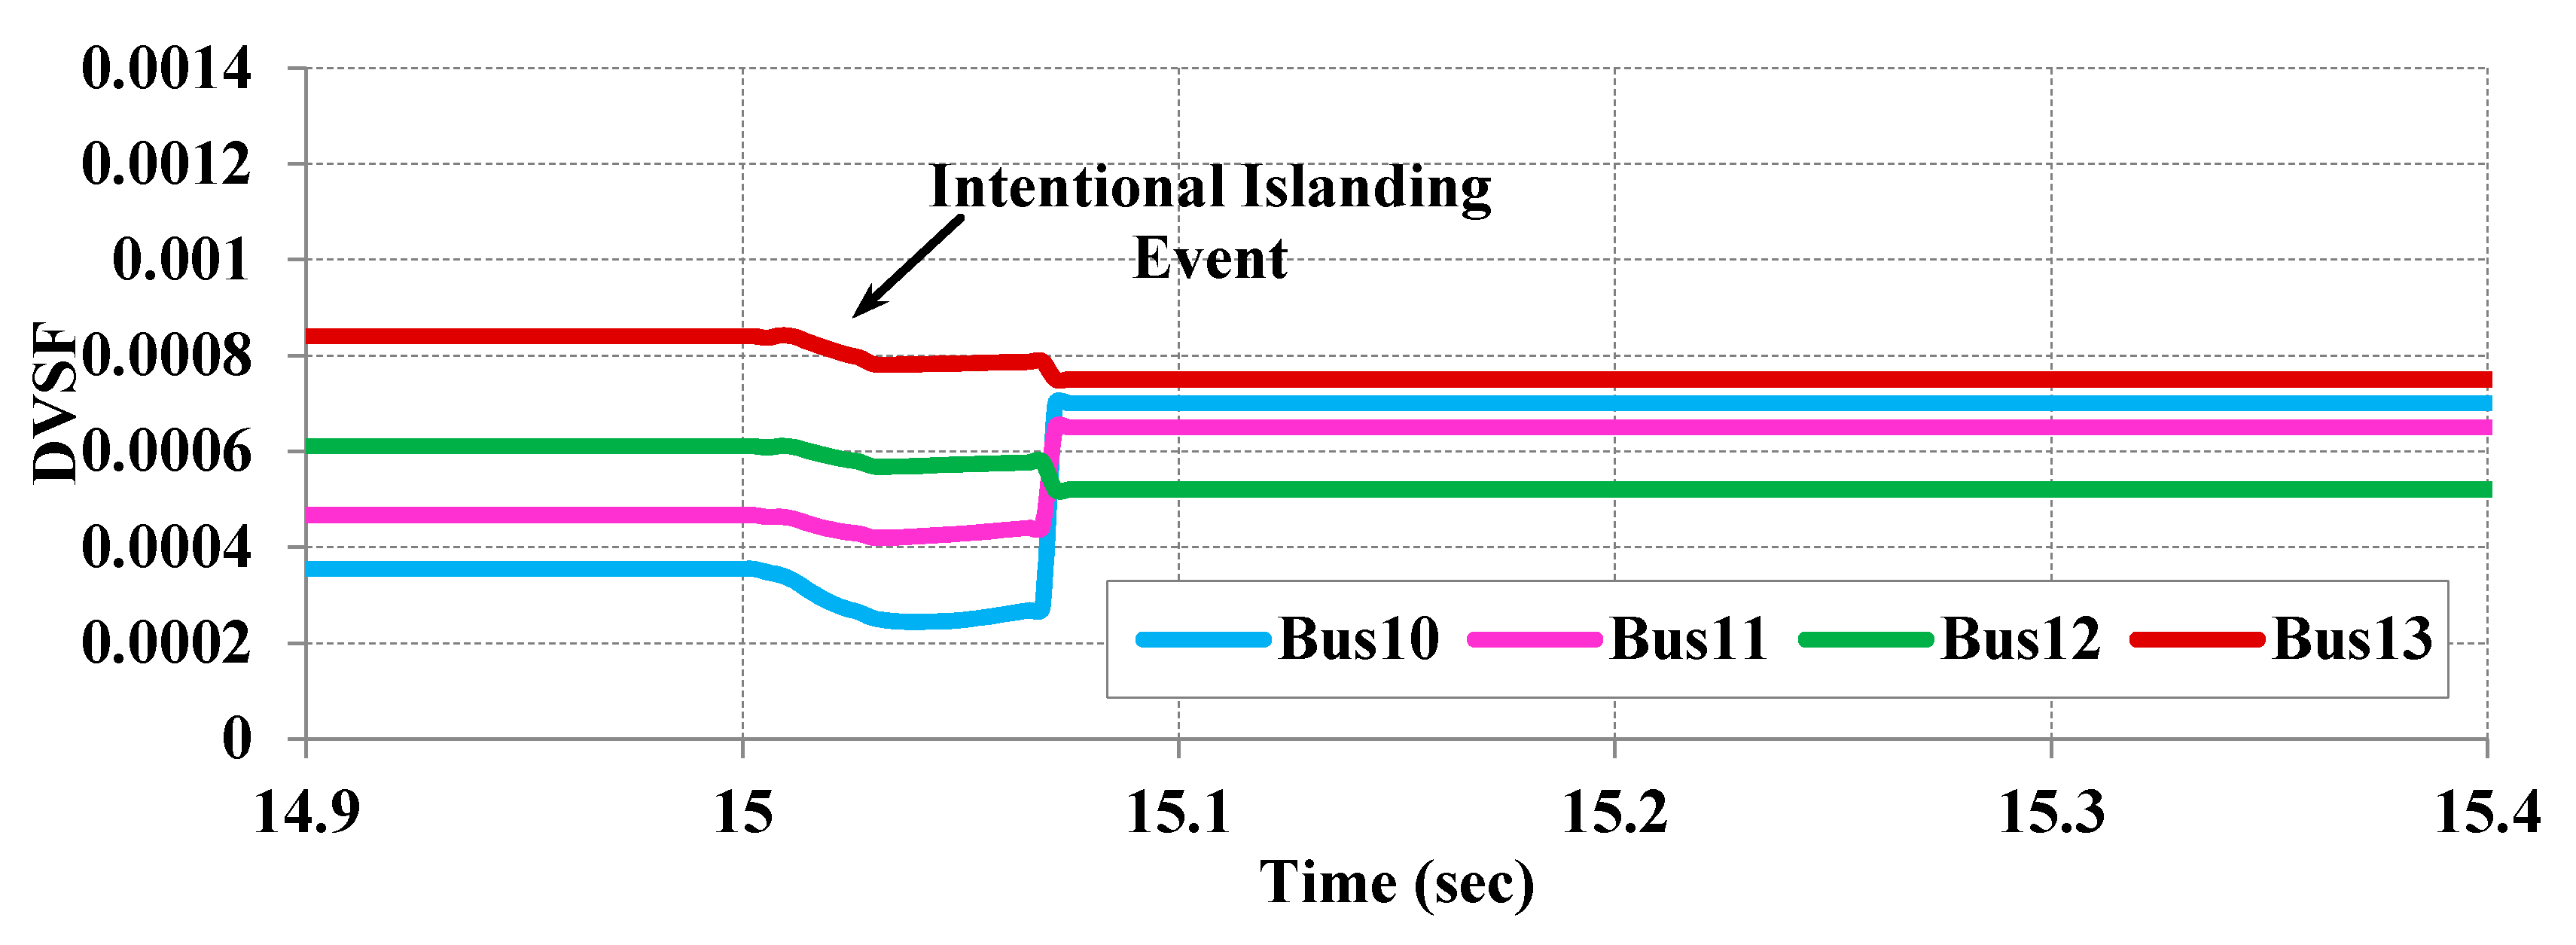
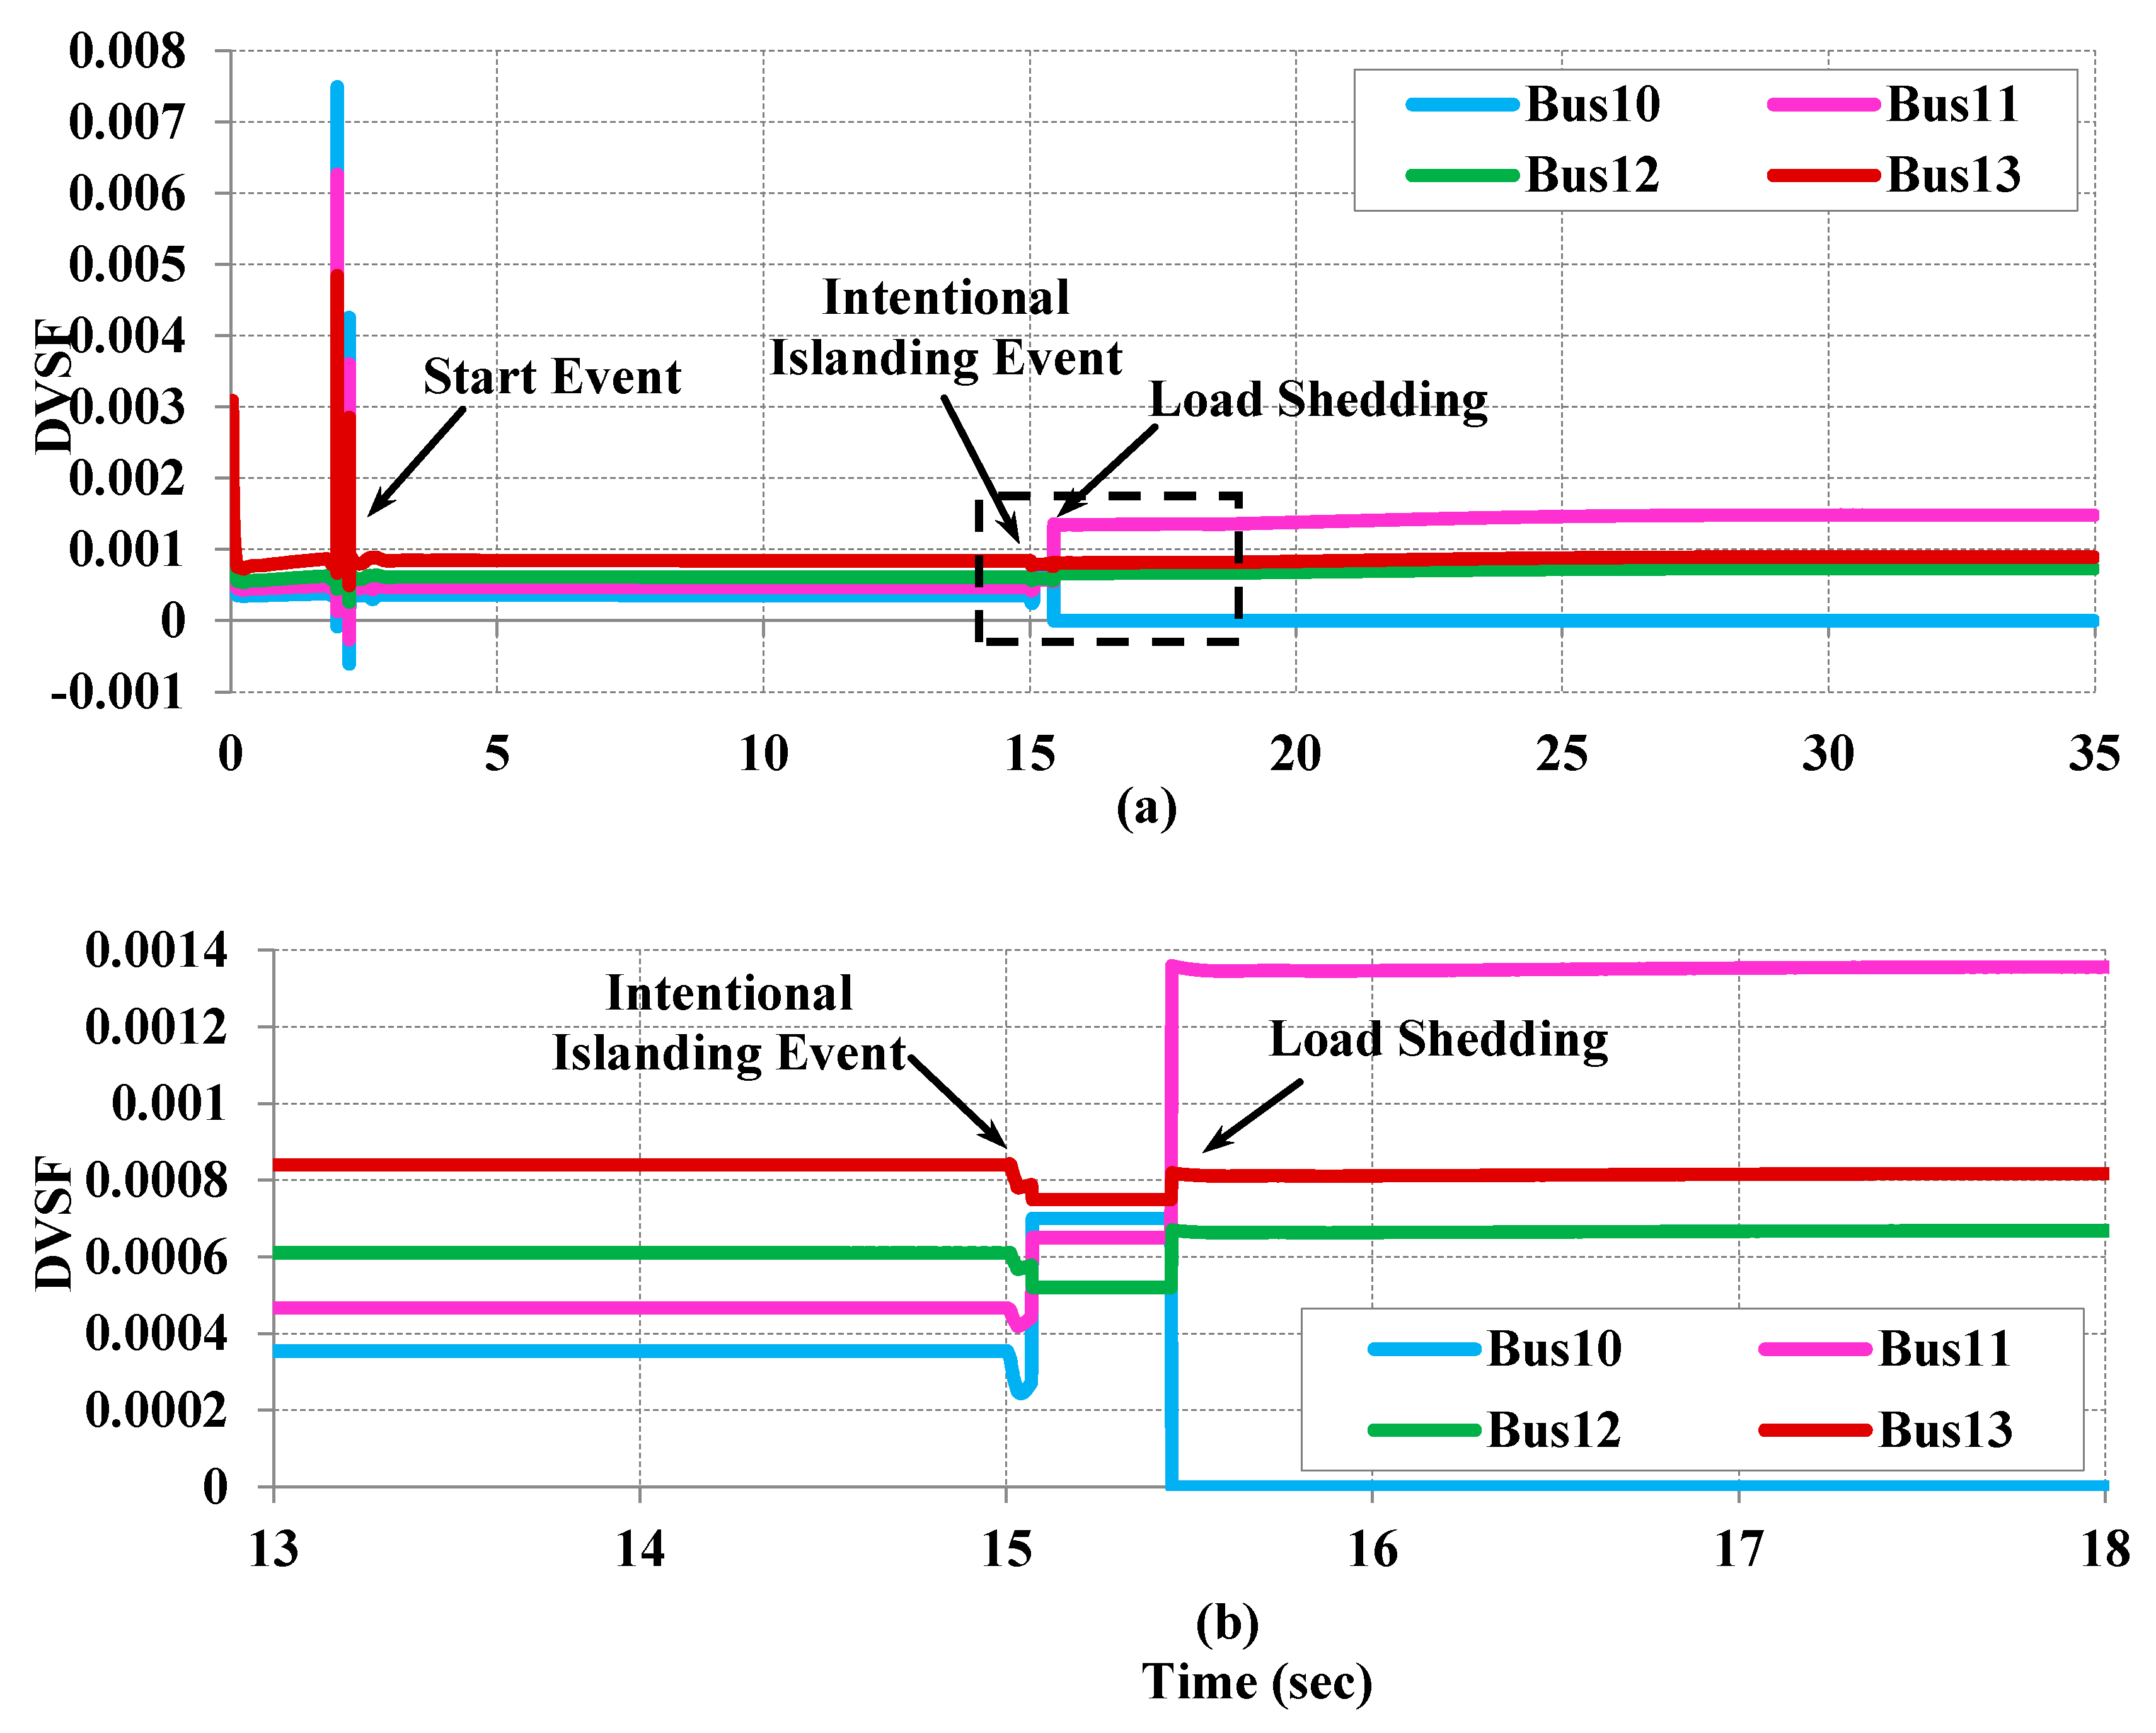
6.2. Dynamic Voltage Sensitivity Factor

When intentional islanding event is initiated via opening the line sections L1, L9 and L13, the stable operation of each island should be assured. The remaining generation and load in each island should be balanced to avoid voltage collapse. A proposed dynamic voltage sensitivity factor is used to identify weak bus-bars in each island. In Island-2, total available generation is 2 MVA while Table 1 shows the load demand in Island-2 bus-bars. In Table 1, the load consumption in each bus-bar is presented. The total active load in island-2 is equal to 3.5 MW and total reactive load is equal to 1 MVAr. Hence, 1.5 MW of additional load should be shedded to maintain the stability of Island-2.
Since the Island-2 is not stable due to lack of generation, the Island-2 was used to validate the proposed DVSF. The bus-bar voltages for Island-2 are shown in Figure 10. As shown in Figure 10, the bus-bar voltages collapsed after islanding because the generation is not enough to cover the loads in the vicinity. Similarly, generator angular velocity and system frequency as shown in Figure 10 and Figure 11a also collapses. As seen in Figure 10 and Figure 11, generator stalls due to heavy load in the system. Hence, it is vital to identify the unstable bus-bars to perform the wide area load shedding.
The full window of the calculated conventional voltage sensitivity index using pre-islanding data is shown in Figure 12a and the expanded window during the islanding is demonstrated in Figure 12b. With reference to the results, the most stable bus-bar is Bus11, since it has the lowest sensitivity index and the most sensitive bus-bar is Bus13. Hence, according to results calculated using conventional method, load-shedding program should start with Bus13 by virtue of being the weakest bus-bar and proceed to Bus10, 12 and 11. However, in the proposed scheme, once islanding occurs, the new system topology is used to calculate the DVSF. The calculated DVSF for Island-2 is illustrated in Figure 13. According to these results, once islanding takes place, the sensitivity of Bus13 is higher compared to the other bus-bars. Hence, it can be concluded that Bus13 is still the weakest bus-bar followed by Bus10, Bus11 and Bus12.

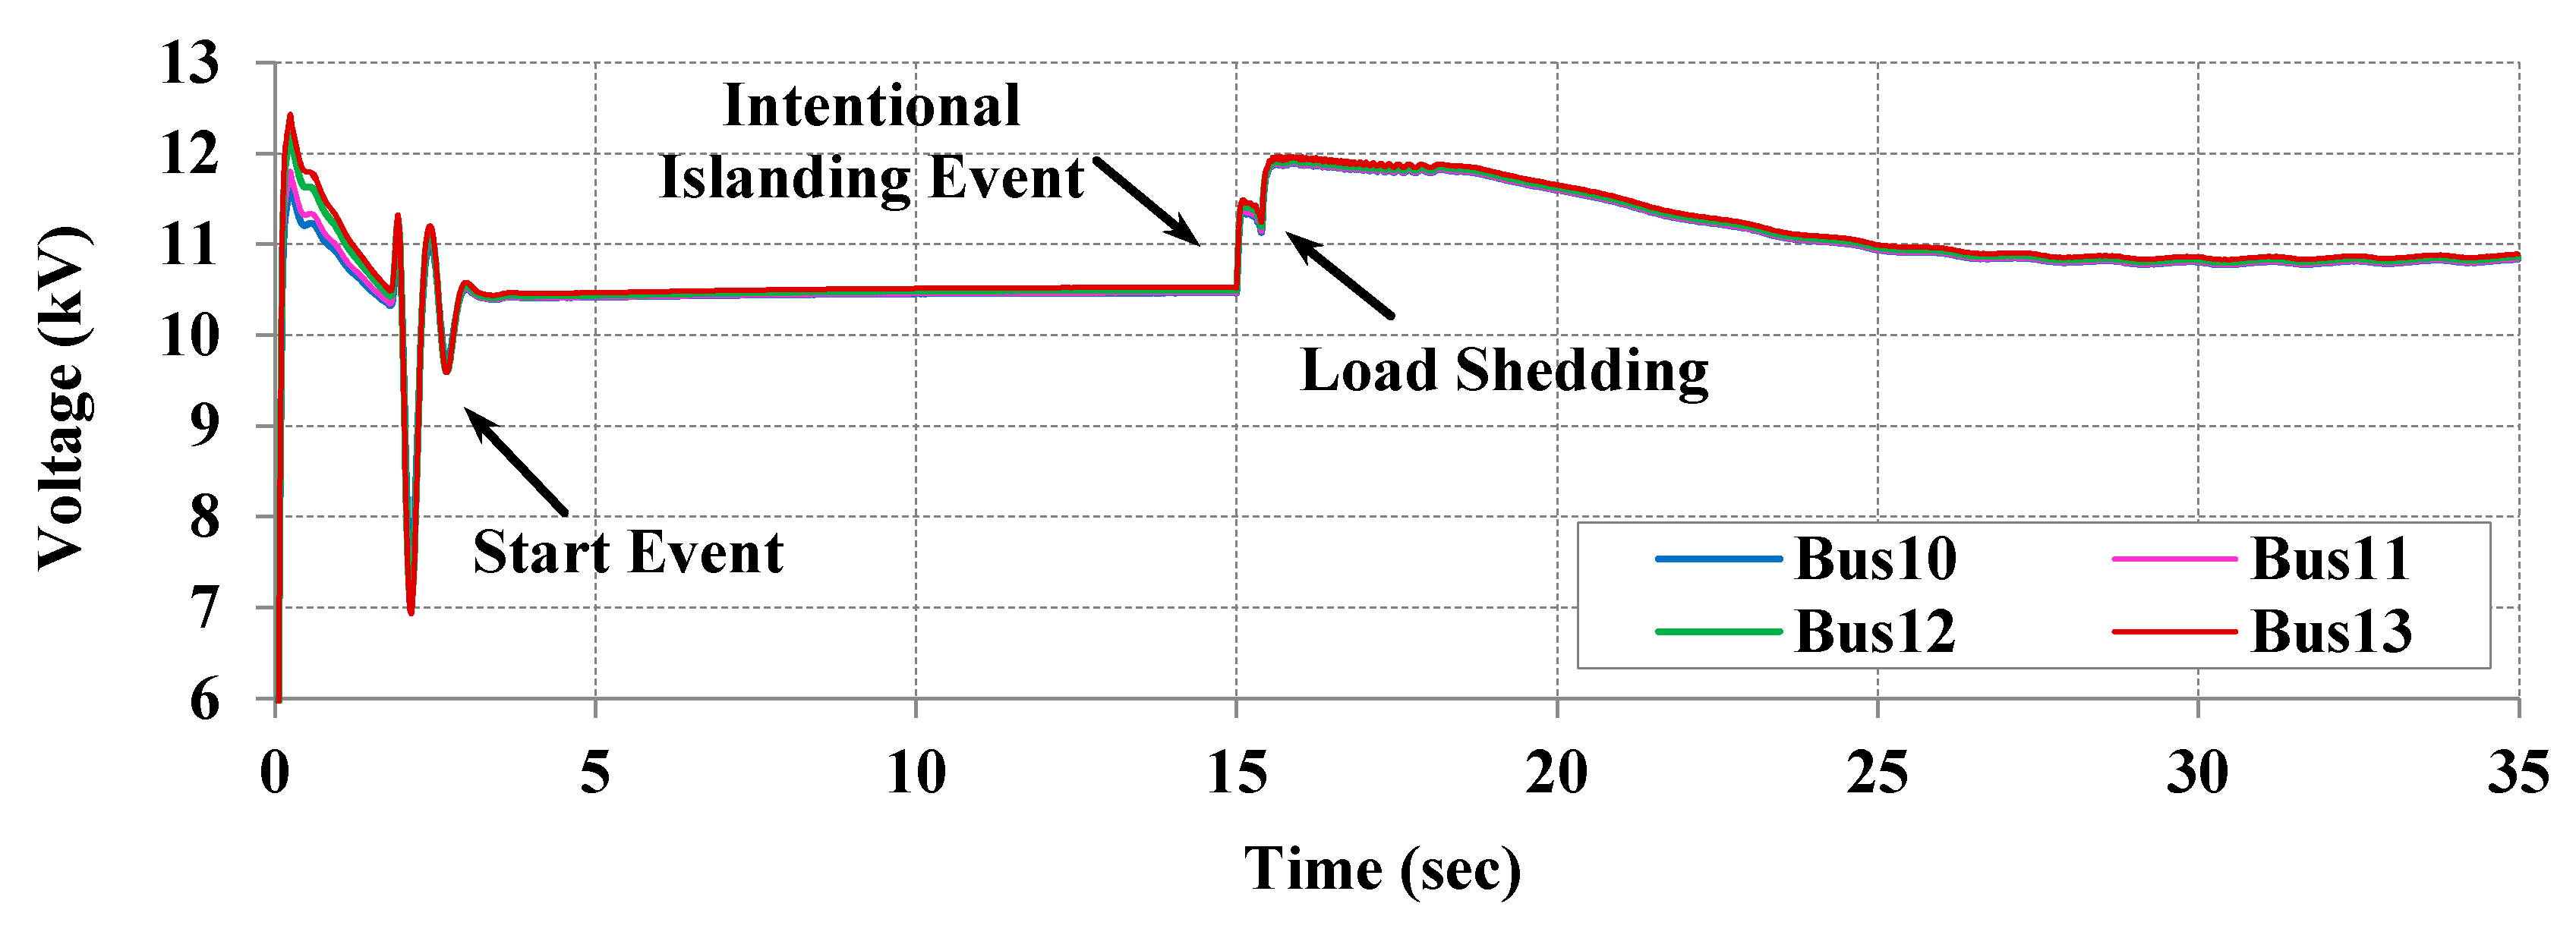
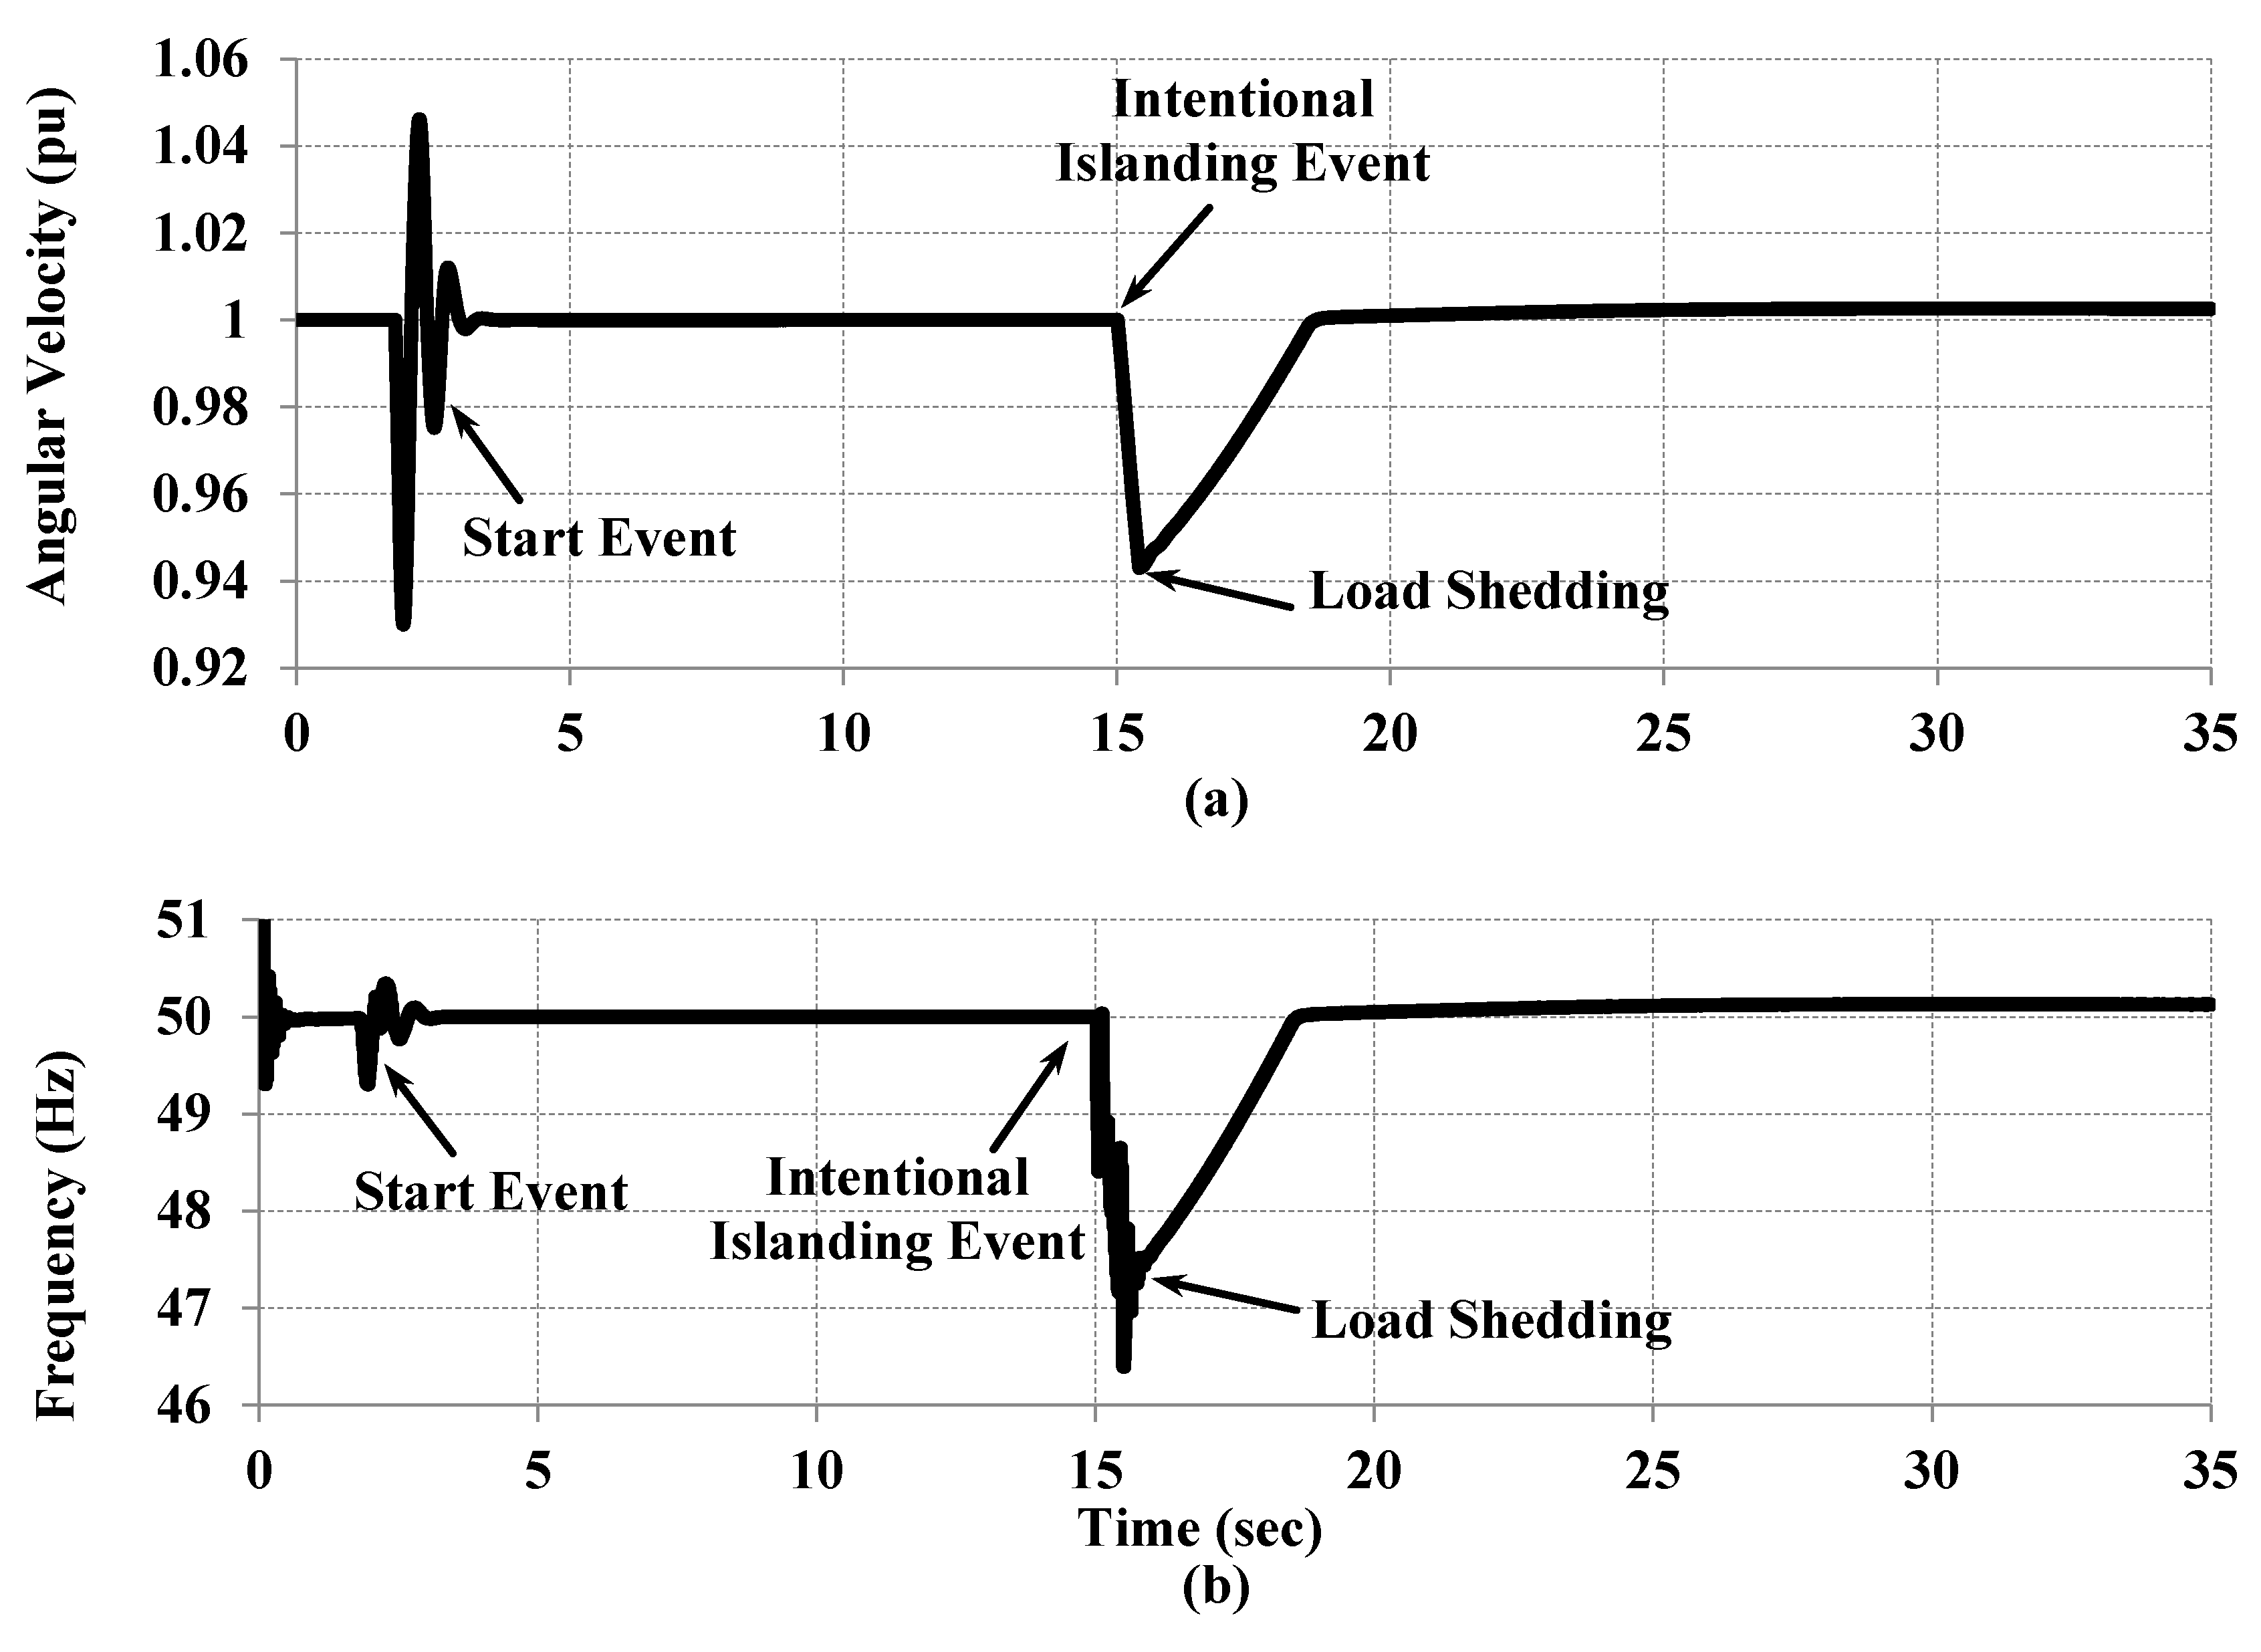
6.3. Wide Area Load Shedding

In this section, Island-2 was used to verify the robustness of the proposed wide area load shedding to improve the voltage profile of the micro grid. Once the weak bus-bars were identified, the load shedding was performed to prevent voltage collapse. The amount of load shedding is related to the system frequency. Moreover, the DG unit should be able to work ±10% of its rated value for 20–30 min [23].
In order to control the voltage of the system, the power factor of the DG unit was varied between 0.85 lagging to 0.9 leading. According to the IEEE-Standard 1547, the system should be capable of operating for 300 s when frequency deviation was less than ±5% of the rated value.
For the new topology, there is 1.82 MW of excess load in island-2. Thus, according to the previous section, Bus13 as the weakest bus-bar and Bus10 as the second weakest bus-bar were chosen to perform the load shedding. The results for the bus-bar voltages are shown in Figure 14. As seen in this figure, the bus-bar voltages decreases after islanding. However, the load shedding prevents the voltage collapse in the island and all the bus-bar voltages recover to the acceptable range.
Synchronous generator speed and frequency of the system are shown in Figure 15a,b.
Figure 15a illustrates the angular velocity of the generator during contingency. The speed of the generator recovers to 1 p.u. after load shedding. Similarly, the system frequency recovers to 50 Hz after the wide area load shedding. By comparing Figure 10 and Figure 14, it confirms that the proposed load shedding prevented voltage collapse in the system. A full window of the dynamic voltage sensitivity factor is shown in Figure 16a. An expanded window during ‘intentional islanding event’ and ‘load shedding’ is shown in Figure 16b. As seen in Figure 16, the voltage sensitivity index of the bus-bars change due to islanding and load shedding. Moreover, the DVSF for all bus-bars remained near zero, which confirms the voltage stability in the Island-2.
Measurement of the system parameters such as voltages, frequency and rate of change of frequency reveals the imbalance between generation and load demand. Since existing detection methods monitor the point of common coupling, they can detect the islanding of DG units. However, these methods are not capable of identifying the boundary of the island. The proposed method here is able to detect the boundary of the island and determine the available generation and load in each island. Moreover, the proposed method can be applied on a meshed network and for systems with non-consecutive bus-bar numbering.
It can be concluded from the results of this section, that the proposed load shedding represented a vast improvement to voltage stability by considering the dynamic performance of the system during the islanding operation for Island-2. Hence, the proposed boundary detection method and the corresponding load shedding have the ability to reconfigure the islands and improve the profile of the voltages in all bus-bars.

7. Conclusions

This paper presents a novel scheme to detect the configuration of islands in a power system. The results show that the proposed boundary detection method is capable of accurately identifying the system topology. Thus, the available generation and loads in each island can be calculated to ensure the available generation meets the load demand in the islanded subsections. Furthermore, the proposed dynamic sensitivity factor is calculated for all bus-bars in every island to determine the weak bus-bars. The obtained results prove that the DVSF reflects the system’s dynamic performance and can be used to detect the weakest bus-bar in the system. Wide area load shedding was performed on weak bus-bars and the results conform to the IEEE-1547 standard in terms of voltage and frequency in the islands. Accordingly, the proposed scheme assures stable operation of the islands using boundary detection along with wide area load shedding during autonomous mode. The proposed method can be used to reconfigure the islands to get an optimized operating condition.

Acknowledgments

The authors would like to thank the Power Quality Research Group, Universiti Tenaga Nasional, Malaysia for providing the funding resources and laboratory facilities.

Author Contributions

Aref Pouryekta, Vigna K. Ramachandaramurthy, Sanjeevikumar Padmanaban, Frede Blaabjerg and Josep M. Guerrero developed the original research work and contributed their experience in boundary detection and power systems stability.

Conflicts of Interest

The authors declare no conflict of interest.

References

  1. Yu, B.; Matsui, M.; Yu, G. A review of current anti-islanding methods for photovoltaic power system. Sol. Energy 2010, 84, 745–754. [Google Scholar] [CrossRef]
  2. Zeineldin, H.; Kirtley, J.L., Jr. A simple technique for islanding detection with negligible nondetection zone. IEEE Trans. Power Deliv. 2009, 24, 779–786. [Google Scholar] [CrossRef]
  3. Khamis, A.; Shareef, H.; Bizkevelci, E.; Khatib, T. A review of islanding detection techniques for renewable distributed generation systems. Renew. Sustain. Energy Rev. 2013, 28, 483–493. [Google Scholar] [CrossRef]
  4. Syamsuddin, S.; Rahim, N.; Selvaraj, J. Implementation of TMS320F2812 in islanding detection for Photovoltaic Grid Connected Inverter. In Proceedings of the 2009 International Conference for Technical Postgraduates (TECHPOS), Kuala Lumpur, Malaysia, 14–15 December 2009. [Google Scholar]
  5. Lidula, N.; Rajapakse, A. A pattern recognition approach for detecting power islands using transient signals—Part I: Design and implementation. IEEE Trans. Power Deliv. 2010, 25, 3070–3077. [Google Scholar] [CrossRef]
  6. Laghari, J.; Mokhlis, H.; Karimi, M.; Bakar, A.; Mohamad, H. Computational Intelligence based techniques for islanding detection of distributed generation in distribution network: A review. Energy Convers. Manag. 2014, 88, 139–152. [Google Scholar] [CrossRef]
  7. Zeineldin, H.; El-Saadany, E.F.; Salama, M. Impact of DG interface control on islanding detection and nondetection zones. IEEE Trans. Power Deliv. 2006, 21, 1515–1523. [Google Scholar] [CrossRef]
  8. Li, C.; Cao, C.; Cao, Y.; Kuang, Y.; Zeng, L.; Fang, B. A review of islanding detection methods for microgrid. Renew. Sustain. Energy Rev. 2014, 35, 211–220. [Google Scholar] [CrossRef]
  9. Raza, S.; Mokhlis, H.; Arof, H.; Laghari, J.; Wang, L. Application of signal processing techniques for islanding detection of distributed generation in distribution network: A review. Energy Convers. Manag. 2015, 96, 613–624. [Google Scholar] [CrossRef]
  10. Ropp, M.; Ginn, J.; Stevens, J.; Bower, W.; Gonzalez, S. Simulation and Experimental Study of the Impedance Detection Anti-Islanding Method in the Single-Inverter Case. In Proceedings of the Conference Record of the 2006 IEEE 4th World Conference on Photovoltaic Energy Conversion, Waikoloa, HI, USA, 7–12 May 2006; Volume 2, pp. 2379–2382. [Google Scholar]
  11. O’Kane, P.; Fox, B. Loss of mains detection for embedded generation by system impedance monitoring. In Proceedings of the Sixth International Conference on (Conf. Publ. No. 434) Developments in Power System Protection, Nottingham, UK, 25–27 March 1997; pp. 95–98. [Google Scholar]
  12. Mohamad, H.; Mokhlis, H.; Ping, H.W. A review on islanding operation and control for distribution network connected with small hydro power plant. Renew. Sustain. Energy Rev. 2011, 15, 3952–3962. [Google Scholar] [CrossRef]
  13. Ahmad, K.N.E.K.; Selvaraj, J.; Rahim, N.A. A review of the islanding detection methods in grid-connected PV inverters. Renew. Sustain. Energy Rev. 2013, 21, 756–766. [Google Scholar] [CrossRef]
  14. Balaguer-Alvarez, I.J.; Ortiz-Rivera, E.I. Survey of Distributed Generation Islanding Detection Methods. IEEE Lat. Am. Trans. 2010, 8, 565–570. [Google Scholar] [CrossRef]
  15. Hanif, M.; Basu, M.; Gaughan, K. A discussion of anti-islanding protection schemes incorporated in a inverter based DG. In Proceedings of the 10th International Conference on Environment and Electrical Engineering (EEEIC), Rome, Italy, 8–11 May 2011; pp. 1–5. [Google Scholar]
  16. Ropp, M.; Begovic, M.; Rohatgi, A. Analysis and performance assessment of the active frequency drift method of islanding prevention. IEEE Trans. Energy Convers. 1999, 14, 810–816. [Google Scholar] [CrossRef]
  17. Kim, B.; Sul, S.; Lim, C. Anti-islanding detection method using Negative Sequence Voltage. In Proceedings of the 7th IEEE International Power Electronics and Motion Control Conference (IPEMC), Harbin, China, 2–5 June 2012; Volume 1, pp. 604–608. [Google Scholar]
  18. Karimi, H.; Yazdani, A.; Iravani, R. Negative-Sequence Current Injection for Fast Islanding Detection of a Distributed Resource Unit. IEEE Trans. Power Electron. 2008, 23, 298–307. [Google Scholar] [CrossRef]
  19. Bahrani, B.; Karimi, H.; Iravani, R. Nondetection Zone Assessment of an Active Islanding Detection Method and its Experimental Evaluation. IEEE Trans. Power Deliv. 2011, 26, 517–525. [Google Scholar] [CrossRef]
  20. Tuyen, N.D.; Fujita, G. Negative-sequence Current Injection of Dispersed Generation for Islanding Detection and Unbalanced Fault Ride-through. In Proceedings of the 46th International Universities’ Power Engineering Conference (UPEC), Berlin, Germany, 5–8 September 2011; pp. 1–6. [Google Scholar]
  21. Yin, J.; Chang, L.; Diduch, C. Recent developments in islanding detection for distributed power generation. In Proceedings of the IEEE Large Engineering systems Conference on Power Engineering, LESCOPE-04, Halifax, NS, Canada, 28–30 July 2004; pp. 124–128. [Google Scholar]
  22. Gao, W. Comparison and review of islanding detection techniques for distributed energy resources. In Proceedings of the 40th North American Power Symposium, Calgary, AB, Canada, 28–30 September 2008; pp. 1–8. [Google Scholar]
  23. Xu, W.; Zhang, G.; Li, C.; Wang, W.; Wang, G.; Kliber, J. A power line signaling based technique for anti-islanding protection of distributed generators—Part I: Scheme and analysis. IEEE Trans. Power Deliv. 2007, 22, 1758–1766. [Google Scholar] [CrossRef]
  24. Wang, W.; Kliber, J.; Zhang, G.; Xu, W.; Howell, B.; Palladino, T. A power line signaling based scheme for anti-islanding protection of distributed generators—Part II: Field test results. IEEE Trans. Power Deliv. 2007, 22, 1767–1772. [Google Scholar] [CrossRef]
  25. De Mango, F.; Liserre, M.; Aquila, A.D. Overview of anti-islanding algorithms for pv systems. part ii: Activemethods. In Proceedings of the 12th IEEE International Power Electronics and Motion Control Conference, EPE-PEMC 2006, Portoroz, Slovenia, 30 August–1 September 2006; pp. 1884–1889. [Google Scholar]
  26. Velasco, D.; Trujillo, C.; Garcerá, G.; Figueres, E. Review of anti-islanding techniques in distributed generators. Renew. Sustain. Energy Rev. 2010, 14, 1608–1614. [Google Scholar] [CrossRef]
  27. Zhihong, Y.; Kolwalkar, A.; Zhang, Y.; Pengwei, D.; Walling, R. Evaluation of anti-islanding schemes based on nondetection zone concept. In Proceedings of the 34th IEEE Annual Power Electronics Specialist Conference, Acapulco, Mexico, 15–19 June 2003; Volume 4, pp. 1735–1741. [Google Scholar]
  28. Wang, F.; Mi, Z. Notice of Retraction Passive Islanding Detection Method for Grid Connected PV System. In Proceedings of the IEEE International Conference on Industrial and Information Systems, Haikou, China, 24–25 April 2009; pp. 409–412. [Google Scholar]
  29. Raipala, O.; Makinen, A.; Repo, S.; Jarventausta, P. The effect of different control modes and mixed types of DG on the non-detection zones of islanding detection. In Proceedings of the Integration of Renewables into the Distribution Grid, CIRED 2012 Workshop, Lisbon, Portuga, 29–30 May 2012; pp. 1–4. [Google Scholar]
  30. Lin, Z.; Xia, T.; Ye, Y.; Zhang, Y.; Chen, L.; Liu, Y.; Tomsovic, K.; Bilke, T.; Wen, F. Application of wide area measurement systems to islanding detection of bulk power systems. IEEE Trans. Power Syst. 2013, 28, 2006–2015. [Google Scholar] [CrossRef]
  31. Lei, D.; Zhencun, P.; Wei, C.; Jianye, P. An Integrated Automatic Control System for Distributed Generation Hierarchical Islanding. In Proceedings of the PowerCon 2006, International Conference on Power System Technology, Chongqing, China, 22–26 October 2006; pp. 1–6. [Google Scholar]
  32. Qin, L.; Peng, F.Z.; Balaguer, I.J. Islanding control of DG in microgrids. In Proceedings of the IEEE 6th International Power Electronics and Motion Control Conference, Wuhan, China, 17–20 May 2009; pp. 450–455. [Google Scholar]
  33. You, H.; Vittal, V.; Zhong, Y. Self-healing in power systems: An approach using islanding and rate of frequency decline-based load shedding. IEEE Trans. Power Syst. 2003, 18, 174–181. [Google Scholar] [CrossRef]
  34. Zadeh, S.G.; Madani, R.; Seyedi, H.; Mokari, A.; Zadeh, M.B. New approaches to load shedding problem in islanding situation in distribution networks with distributed generation. In Proceedings of the CIRED 2012 Workshop: Integration of Renewables into the Distribution Grid, Lisbon, Portugal, 29–30 May 2012. [Google Scholar] [CrossRef]
  35. Zahidi, R.A.; Abidin, I.Z.; Hashim, H.; Omar, Y.R.; Ahmad, N.; Ali, A.M. Study of static voltage stability index as an indicator for Under Voltage Load Shedding schemes. In Proceedings of the 3rd International Conference on Energy and Environment, Malacca, Malaysia, 7–8 December 2009; pp. 256–261. [Google Scholar]
  36. Gu, W.; Liu, W.; Zhu, J.; Zhao, B.; Wu, Z.; Luo, Z.; Yu, J. Adaptive Decentralized Under-Frequency Load Shedding for Islanded Smart Distribution Networks. IEEE Trans. Sustain. Energy 2014, 5, 886–895. [Google Scholar] [CrossRef]
  37. Arya, L.; Choube, S.; Shrivastava, M. Technique for voltage stability assessment using newly developed line voltage stability index. Energy Convers. Manag. 2008, 49, 267–275. [Google Scholar] [CrossRef]
  38. Wang, Y.; Li, W.; Lu, J. A new node voltage stability index based on local voltage phasors. Electr. Power Syst. Res. 2009, 79, 265–271. [Google Scholar] [CrossRef]
  39. Sinha, A.; Hazarika, D. A comparative study of voltage stability indices in a power system. Int. J. Electr. Power Energy Syst. 2000, 22, 589–596. [Google Scholar] [CrossRef]
  40. Shariatzadeh, F.; Vellaithurai, C.B.; Biswas, S.S.; Zamora, R.; Srivastava, A.K. Real-Time Implementation of Intelligent Reconfiguration Algorithm for Microgrid. IEEE Trans. Sustain. Energy 2014, 5, 598–607. [Google Scholar] [CrossRef]
  41. Alwash, S.F.; Ramachandaramurthy, V.K.; Mithulananthan, N. Fault-Location Scheme for Power Distribution System with Distributed Generation. IEEE Trans. Power Deliv. 2015, 30, 1187–1195. [Google Scholar] [CrossRef]
  42. Kundur, P.; Balu, N.J.; Lauby, M.G. Power System Stability and Control; McGraw-Hill: New York, NY, USA, 1994. [Google Scholar]
Figure 1. Single line diagram of a RES base integrated distribution network include MG and islands.
Energies 11 00889 g001
Figure 2. A Power system with four islands.
Energies 11 00889 g002
Figure 3. Flowchart of the proposed scheme to stabilize a system after islanding.
Energies 11 00889 g003
Figure 4. A graph consisting of 10 edges and 8 vertices with non-consecutive numbering.
Energies 11 00889 g004
Figure 5. Flowchart for [TCM] calculation.
Energies 11 00889 g005
Figure 6. Procedure to extract subsections and bus-bars.
Energies 11 00889 g006
Figure 7. Three-dimensional admittance matrix.
Energies 11 00889 g007
Figure 8. A single line diagram for a practical 18-bus-bar distribution network.
Energies 11 00889 g008
Figure 9. Equivalent graph for the test system with four subsections.
Energies 11 00889 g009
Figure 10. Voltage collapse in the island-2 after intentional islanding event.
Energies 11 00889 g010
Figure 11. System parameters (a) synchronous generator angular velocity, (b) island-2 frequency.
Energies 11 00889 g011
Figure 12. Dynamic Voltage Sensitivity Factor (a) full window of DVSF for bus-bars in the island-2 (b) expanded window for DVSF during ‘Intentional Islanding Event’.
Energies 11 00889 g012
Figure 13. Voltage sensitivity indices using proposed boundary detection method.
Energies 11 00889 g013
Figure 14. Voltage profile in island-2 recovers after load shedding.
Energies 11 00889 g014
Figure 15. System parameters (a) synchronous generator angular velocity, (b) island-2 frequency.
Energies 11 00889 g015
Figure 16. Dynamic voltage sensitivity factor (a) full window of DVSF for bus-bars in the island-2, (b) Expanded window for DVSF during ‘intentional islanding event’ and ‘load shedding’.
Energies 11 00889 g016
Table 1. Load demand in island-2.
Bus-barActive Power (MW)Reactive Power (MVar)
Bus101.0550.2842
bus110.59160.2615
Bus120.92670.2255
Bus130.92680.2278

