Article

An Intelligent Artificial Neural Network-Response Surface Methodology Method for Accessing the Optimum Biodiesel and Diesel Fuel Blending Conditions in a Diesel Engine from the Viewpoint of Exergy and Energy Analysis

by
Bahman Najafi
1,
Sina Faizollahzadeh Ardabili
1,
Amir Mosavi
2,3,
Shahaboddin Shamshirband
4,5,* and
Timon Rabczuk
2
1
Biosystem Engineering Department, University of Mohaghegh Ardabili, 56199-11367 Ardabil, Iran
2
Institute of Structural Mechanics, Bauhaus University Weimar, 99423 Weimar, Germany
3
Institute of Automation, Obuda University, 1431 Budapest, Hungary
4
Department for Management of Science and Technology Development, Ton Duc Thang University, Ho Chi Minh City, Vietnam
5
Faculty of Information Technology, Ton Duc Thang University, Ho Chi Minh City, Vietnam
*
Author to whom correspondence should be addressed.
Energies 2018, 11(4), 860; https://doi.org/10.3390/en11040860
Submission received: 23 February 2018 / Revised: 29 March 2018 / Accepted: 30 March 2018 / Published: 7 April 2018

Abstract

:
Biodiesel, as the main alternative fuel to diesel fuel which is produced from renewable and available resources, improves the engine emissions during combustion in diesel engines. In this study, the biodiesel is produced initially from waste cooking oil (WCO). The fuel samples are applied in a diesel engine and the engine performance has been considered from the viewpoint of exergy and energy approaches. Engine tests are performed at a constant 1500 rpm speed with various loads and fuel samples. The obtained experimental data are also applied to develop an artificial neural network (ANN) model. Response surface methodology (RSM) is employed to optimize the exergy and energy efficiencies. Based on the results of the energy analysis, optimal engine performance is obtained at 80% of full load in presence of B10 and B20 fuels. However, based on the exergy analysis results, optimal engine performance is obtained at 80% of full load in presence of B90 and B100 fuels. The optimum values of exergy and energy efficiencies are in the range of 25–30% of full load, which is the same as the calculated range obtained from mathematical modeling.

1. Introduction

Environmental concerns caused by the use of fossil fuels have led countries to produce and use alternative fuels [1,2]. Biodiesel fuel, as the main alternative of diesel fuel, is produced from renewable and available resources and improves the engine emissions during combustion in diesel engines. Numerous studies have been done on the relation of diesel engine performance and biodiesel fuel, which are evaluated according to their brake thermal efficiency or energy efficiency [3,4,5,6,7,8,9,10] and engine emissions.
The evaluation of the engine performance, based on the analysis of energy (First Law of Thermodynamics efficiency), however gives no information about the system efficiency. Unlike energy, exergy can be produced, destructed and stored [11].
Typically, the exergy destruction is in interaction with its surroundings and can be used as a way to interpret energy quality or opportunities to produce useful work. Therefore, exergy and energy analysis can explain the quality and quantity of energy [12].
Recently, several studies have been conducted on exergy and energy analysis of diesel engines using biodiesel fuel by various methods. Ziya Söğüt [13] employed seven alternative fuels to study the micro-turbojet engine from an exergetical viewpoint. Panigrahi et al. [14] used diesel and SB20 (a blend of 20 vol. % Simarouba biodiesel and 80% diesel) to do exergy and energy analysis on a 3.5 kW compression ignition engine. Aghbashlo et al. [15] employed a single cylinder DI diesel engine to study the exergy-based sustainability parameters in presence of B5 fuel emulsified with water (3, 5, and 7 w/w %) and two levels of cerium oxide nanoparticle concentrations (0 and 90 ppm). Jafarmadar and Nemati [16] calculated the exergy parameters on a biodiesel-fuelled HCCI to study the effect of hot EGR. Jafarmadar and Nemati [17] investigated the effect of diesel and biodiesel fuel blends on the exergy efficiency of an HCCI engine. Nemati et al. [18] employed a four-stroke DI diesel engine (fuelled with diesel and biodiesel fuel blends) at full load condition to investigate the exergetical parameters of the engine. Khoobbakht et al. [19] employed a DoE method to do exergy and energy analysis on a four-cylinder diesel engine in the presence of biodiesel, ethanol and diesel fuel blends. Coban et al. [20] employed a small-scale turbojet engine to do exergoeconomic analyze in the case of biofuel consumption. Aghbashlo et al. [21] studied a DI engine (fuelled with B5 and B20 and hybrid nanocatalyst (nanotubes-CeO2) as nano-additive) from view point of exergetic assessment. Shamshirband et al. [22] developed a hybrid ANN-SVM method to estimate the exergetic parameters of a DI diesel engine fuelled with diesel/biodiesel/expanded polystyrene wastes (EPSW) blends. Aghbashlo et al. [23] developed a novel hybrid ELM-WT method to predict the exergetic parameters of a DI diesel engine fuelled with diesel/biodiesel/polymer waste blends. Jafarmadar and Nemati [24] studied the effect of EGR on the exergy efficiency of diesel engine. Aghbashlo et al. [25] calculated exergo-environmental and exergo-economic parameters of a DI diesel engine fuelled by diesel/biodiesel blends. Mata et al. [26] developed BM methodology to estimate the NOx emissions of a city bus. Sayin kul and Kahraman [27] studied exergy and energy analysis of a single cylinder, water-cooled diesel engine. Fuel samples were biodiesel, diesel and bioethanol blends. Maximum exergy efficiency (29.38%) was related to D92B3E5 fuel—92% diesel, 3% biodiesel and 5% bioethanol. In another study, Sekmen et al. [28] employed the first and second Laws of thermodynamics to study exergy and energy in a four-cylinder, direct injection diesel engine which had been fuelled by blends of diesel and biodiesel. Hoseinpour et al. [29] studied the exergy and energy balance in a direct injection diesel engine which was fuelled by diesel/biodiesel/gasoline fuel blends. Based on results the maximum exergy of engine was in case of using the combination of B20 and gasoline fumigation.
Based on the reports of researchers, recently soft-computing methods were employed to predict, model and optimize the process in field of studying the biodiesel effect on engine from the viewpoint of analyzing exergy and energy. The ANN method is believed to be the most effective method in predicting and modeling goals. On the other hand, based on reports of optimization processes, RSM has been successfully applied to optimize the mentioned processes. The ANN methodology has been widely employed in classification, modeling, estimation, signal processing, etc. [30]. It is able to model the phenomenon or process without knowing the mathematical relations governing it, using experimental data. RSM considers the relationships between independent and response variables. This methodology was first introduced by Box and Wilson in 1951 and uses a series of designed experiments to obtain a best (or optimal) response by optimizing the operational factors. Therefore, it can be a powerful tool in any optimization process [30,31]. Therefore, it was decided to use a novel ANN-RSM method to predict and optimize (in parallel) the exergetic efficiency of a diesel/biodiesel fuelled diesel engine.
The purpose of the current study in addition to produce biodiesel and experimental consideration of diesel/biodiesel blends in diesel engines, is to model the process by thermodynamic and intelligent ANN approaches (to model the exergy and energy efficiencies) and to optimize the studied parameters (the exergy and energy efficiencies) by RSM. This approach, in addition to reducing the computational complexity, requires less time and cost to establish the nature of the studied system.
The first step of the study presents the experimental setup and test procedure. The second step uses thermodynamics and ANN methods to explore the studied system and the last step presents the output of ANN and thermodynamic methods to be applied in RSM to find the optimum conditions.

2. Experimental Setup and Test Procedure

2.1. Fuel Properties

WCO was used as a low cost available source to produce ethyl ester (biodiesel) fuel. Biodiesel fuel was produced through trans-esterification process using ethanol and NaOH catalyst. The thermo-physical properties of the produced biodiesel including viscosity, density, cetane number, heating value, pour point, flash point, and cloud point were determined according to ASTM standard methods.
In order to evaluate the effect of diesel/biodiesel blends on engine performance, biodiesel fuel was mixed with diesel fuel in different volumes ratios of 10, 20, 30, 40, 50, 60, 70.80 and 90% (i.e., B10, B20, B30, B40, B50, B60, B70, B80 and B90) and pure biodiesel (B100) and pure diesel was used as the reference samples. The components of the biodiesel fuel were determined using GC-MS tests according to the ASTM D6586 standard. For each fuel sample the density, viscosity, pure and cloud points were measured according to ASTM standards. The density of samples was measured according to ASTM D4052 using a DA-130N digital densitometer at 15 °C. The heating value was measured according to ASTM D240 using a Pars Paygeer PM-52 bomb-type calorimeter.
The properties of biodiesel fuel and its blends with diesel fuel have been tabulated in Table 1. The results show that in the composition of biodiesel fuel, oleic fatty acids (C18:1), linoleic (C18:2), linoleic (C24), palmitic (C16) and stearic (C16:1) have the highest proportion, equal to 47.33, 20.55, 19 and 7.1%, respectively. Based on the percentage of fatty acids components in biodiesel fuel, the final general formula was C19H36O2. The density and heating value of the biodiesel fuels was also measured as 0.885 g/cm3 and 38.43 MJ/kg, respectively.
Biodiesel has a high density, low heating value, high viscosity, and high cloud point compared to diesel fuel and increasing the biodiesel content increases the density, viscosity, cloud point and pour point of the blends and decreases the heating value.

2.2. Experimental Test Matrix

In engine tests, the independent parameters were the load applied to the engine and fuel type. Engine load at ten levels (10, 20, 30, 40, 50, 60, 70, 80, 90 and 100 percent of full load) was applied to each of eleven blended biodiesel-diesel fuel samples. The engine speed was held constant (at 1500 rpm) in all test modes because the diesel engine used was connected to an electric generator and had a constant speed type.

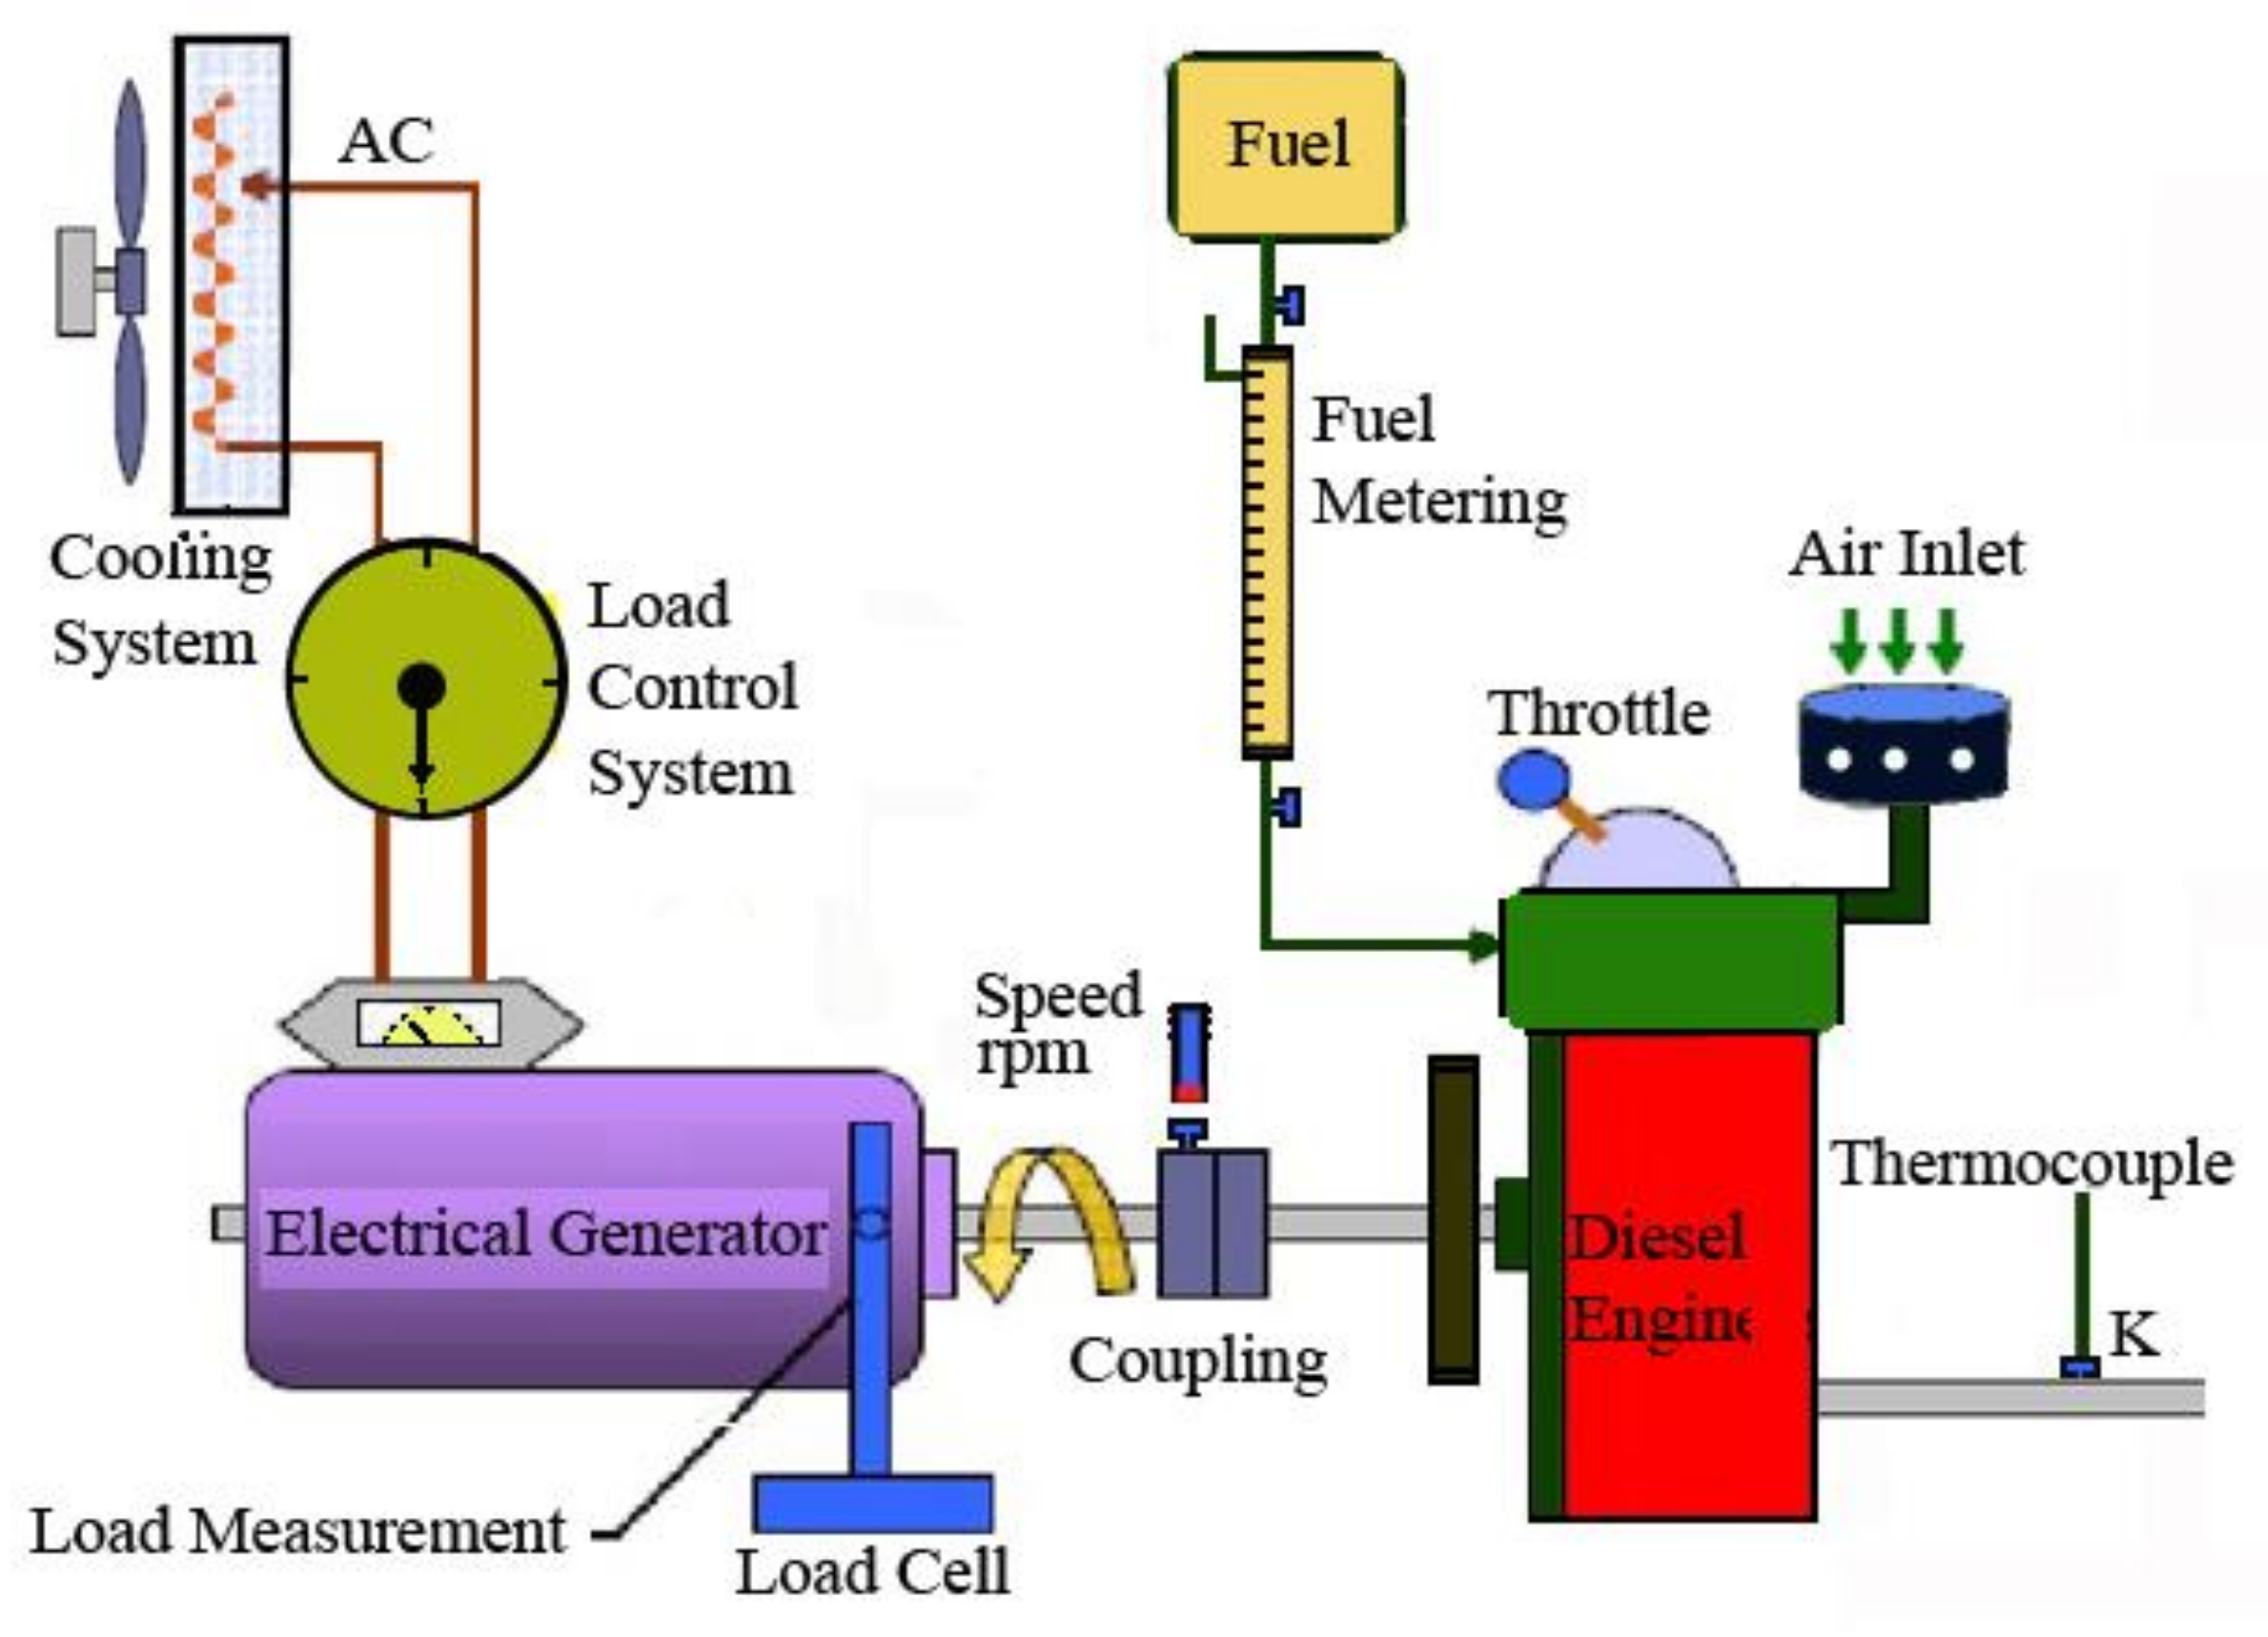
2.3. Experimental Equipment

The engine was a Margo four stroke, single cylinder, naturally aspirated, direct injection diesel engine with a maximum power of 5.52 kW. The specification of engine is presented in Table 2. The employed equipment to measure the parameters of engine performance were a generator (dynamometer), a load cell, a tachometer, a flow meter, a thermometer, a heat elements and a variable resistance.
To measure the power and torque produced by the diesel engine, the generator was used as a dynamometer in a way that the stands of the generator were initially completely free and the generator was connected to the main shaft of the generator through the engine output shaft using a coupling and it was attached to a load cell and chassis by only a beam in distance of 30 cm from the center of the generator shaft. The applied torque was measured by measuring the force (F) in N through the load cell. The engine brake power is calculated by measuring engine speed (NRPM) and the force exerted on the load cell:
W B ˙ = 2 π × 0.3 × F × N R P M 60
The electricity produced by the generator was transferred into heating elements via a variable electric resistance and accordingly changing the electrical variable resistance put the engine under load. Intake air temperature and output exhaust gases were measured using a K type thermocouple. To measure the fuel consumption, a pipette with input and output valves was placed in the engine fuel inlet (Figure 1). By measuring the consumption time of 10 cc fuel (tc), the mass of fuel consumption (in kg/s) was calculated using Equation (2):
m ˙ f u e l ( k g s ) = 10 ( cc ) × ρ ( g c m 3 ) t c ( s ) × 1000

2.4. Engine Test Method

At the beginning of the test, the engine started and worked for 10 min with diesel fuel without applying any load, and then by changing the degree of electrical resistance, thermal elements were placed in the circuit. In this case, the engine is placed under load and its speed dropped slightly and then could be set at the speed of 1500 rpm.
In this case, the value of force applied to the load cell was measured and the engine brake power value was calculated. Moreover, for the duration of the treatment, the fuel consumption was calculated. The output exhaust temperature (TEX = T4) was also measured using a thermocouple. It should be noted that when the electrical resistance degree is at its maximum value, all heating elements are in the circuit and the power produced by the engine is maximum; this is called “full engine load”. Other loads are expressed based on a percentage of the mentioned values (loads of 10%, 20%, 30%, 40%, 50%, 60%, 70%, 80%, 90% and 100% of full load). To study the reproducibility of experiments, each fuel sample was tested three times.

3. Modeling the Thermal Engine

Modeling is an approach to represent ideas about the natural of the phenomenon under investigation from the viewpoint of science [32] and is a scientific approach to present an alternative to the real phenomenon, to quantify, define, visualize, or simulate it by referring to the existing knowledge [33,34]. Modeling is an essential part of many scientific disciplines which have their own ideas about specific types of modeling. There are several types of modeling approaches, among which the most widely used are mathematical and intelligent modelling approaches [32].

3.1. Mathematical Modeling

To simplify the calculations, the used diesel engine was assumed as a thermal engine. This thermal engine works between two reservoirs: a cold thermal reservoir (the environment) with the temperature of TC and hot thermal reservoir (combustion chamber) with temperature of TH.
By measuring the fuel mass consumption m ˙ f u e l (kg/s) and heating value of fuel samples Hu (Mj/kg), the thermal power entering the engine ( Q ˙ i n ) by (kW) was calculated from the Equation (3):
Q ˙ i n = m ˙ f u e l × H u
Part of the fuel power (imported into the thermal engine) was transferred to braking power ( W ˙ B ) and the other part was transferred to the environment as a loss value ( Q ˙ o u t ). Using the first law of thermodynamics results in Equation (4):
Q ˙ i n = W ˙ B + Q ˙ o u t
Equation (4) discusses about quantity of energy and conservation of energy in the system, but does not provide any information about the system. Based on the first law of thermodynamics, energy efficiency ( η en ) is the ratio of taken power (braking power) to given power (thermal equivalent power of the fuel):
η e n = W ˙ B Q ˙ i n = W ˙ B m ˙ f u e l × H u
The maximum power that can be received from an ideal reversible system, called exergy, is defined as follows:
E x ˙ i n = W ˙ B δ E x ˙
δ E x ˙ is the exergy destruction by the system that is expressed by Equation (7) [35]:
δ E x = T C × S ˙ g e n
S ˙ g e n is the entropy produced by the system compared to the environment, and according to the second law of thermodynamics, it is expressed as Equation (8):
S ˙ g e n = Q ˙ i n T H Q ˙ o u t T C
By using the Equations (5)–(8), the maximum power is defined as Equation (9), which can be gained from an ideal reversible system:
E x ˙ i n = ( Q ˙ i n Q ˙ o u t ) T C × ( Q ˙ i n T H Q ˙ o u t T C ) E x ˙ i n = Q ˙ i n ( 1 T C T H ) = A ˙ i n ( 1 T C T H )
Here, the engine input thermal power ( Q ˙ i n ) is calculated using Equation (10) that is the chemical availability of fuel ( A ˙ i n ) and is calculated according to the number of carbons, hydrogens and oxygens in the fuel’s chemical structure (CxHyOz) [36]:
Q ˙ i n = A ˙ i n = m ˙ f u e l × H u × ( 1.0438 + 0.013 y x + 0.1083 z x )
where, according to the second law of thermodynamics, exergy efficiency ( η e x ) is the ratio of taken power (braking power) to total exergy (maximum power that can be achieved through an ideal reversible system) Equation (11):
η e x = W ˙ B E x ˙ i n η e x = W ˙ B m ˙ f u e l × H u × ( 1.0438 + 0.013 y x + 0.1083 z x ) × ( 1 T C T H )
In an ideal diesel cycle, an isentropic expansion of gas occurs between two points 3 and 4. If the gases inside the combustion chamber can be considered a perfect gas, the relation of T3 and T4 is given by Equation (12):
T 3 = T 4 ( r c β ) γ 1
γ denotes the ratio of specific heat capacity at constant pressure Cp is the specific heat capacity at constant volume Cv. This ratio for air (as the perfect gas) is 1.4. The engine compression, rc is 17.5 and β is the cutoff ratio of the engine.
This ratio equals the ratio of the initial fuel injection volume (V3) to the final injection volume (V2). Unlike the compression ratio, the cutoff ratio is not constant and is variable proportional to energy efficiency ( η e n ). Energy efficiency ( η e n ) is calculated using experimental data from Equation (4), and on the other hand, considering the standard air cycle in a diesel engine, energy efficiency can be calculated using Equation (13) [12]:
η e n = 1 1 r c γ 1 ( β γ 1 γ ( β 1 ) )
The engine braking power ( W ˙ B ), fuel mass consumption ( m ˙ f u e l ) and fuel heating value (Hu) are empirically measured for each fuel sample and considering that γ = 1.4 and rc = 17.5, the parameter β is calculated using Equation (14):
η e n = 1 1 r c γ 1 ( β γ 1 γ ( β 1 ) ) = W ˙ B m ˙ f u e l × H u
By knowing the value of β, the maximum temperature of the combustion chamber, T3 = TH was determined using Equation (12). As a result, the exergy efficiency ( η e x ) for each fuel sample can be easily calculated using Equation (11).

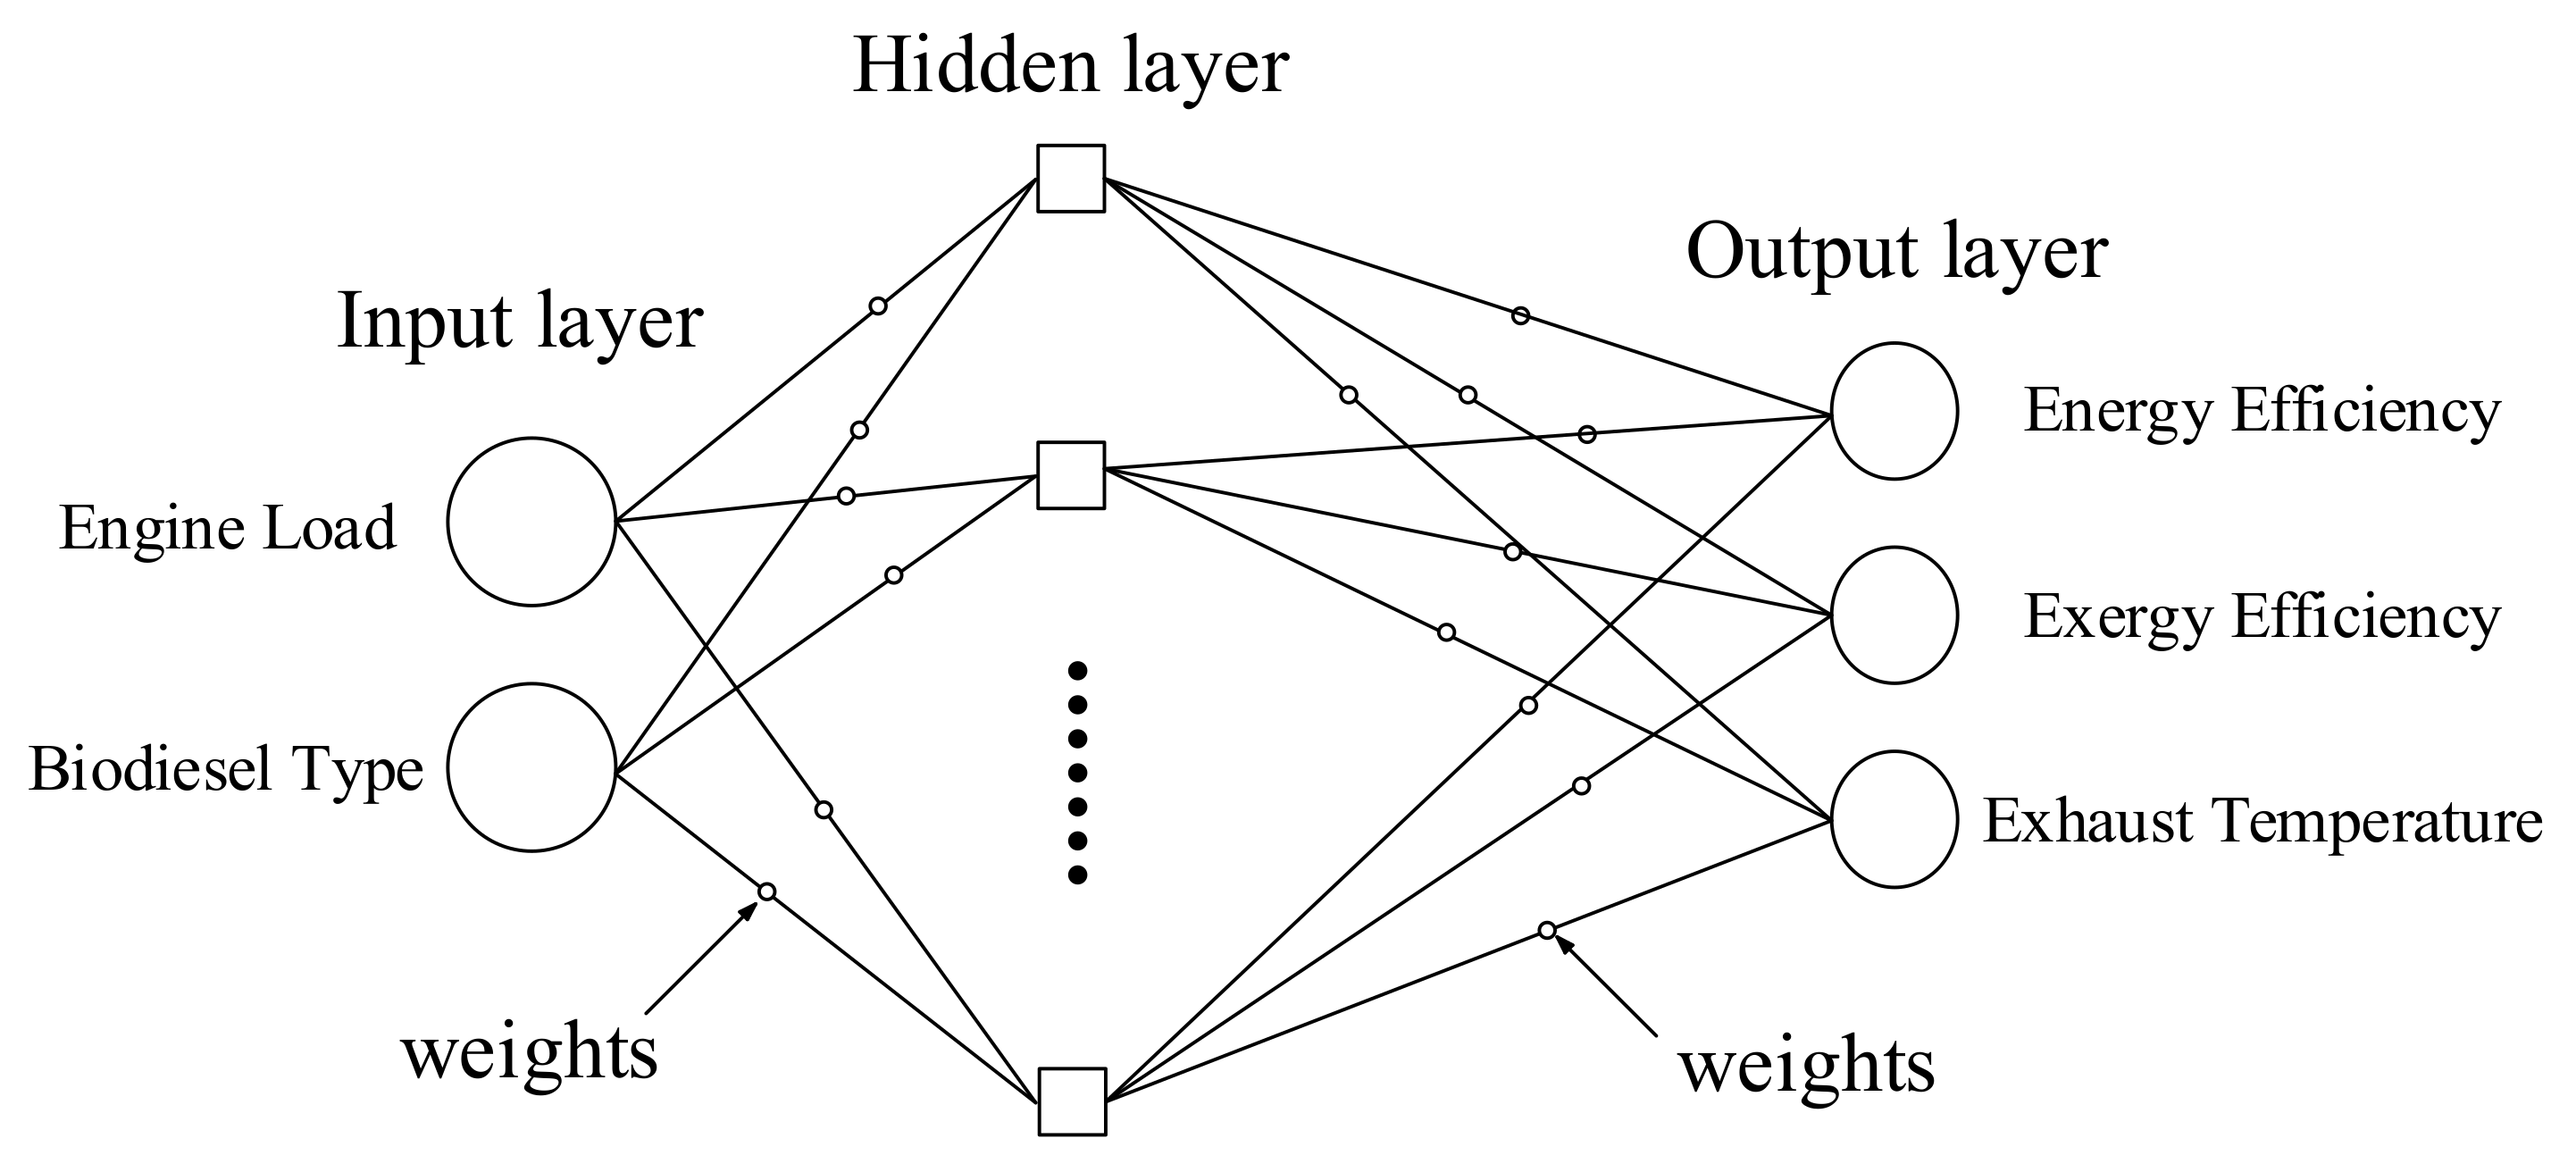
3.2. Intelligent Modeling

Intelligent systems can do complex tasks without the need to know the mathematical model of the system. In recent years, intelligent and soft computing methods were used in all fields of science [37]. ANN belongs to the intelligent methods class. ANN has different types of network. The MLP type of neural network is the most popular and most used method among other neural network methods [38]. Some applications of MLP neural networks are prediction, classification, modeling, etc. [39]. Development of an ANN has mainly two steps: training and testing.

3.3. ANN Network Training

The training process is the important way to achieve a high accuracy from a developed model. The first step was to identify the dependent and independent variables. In this study, fuel type and dynamometer load were considered as independent (input variables) variables and energy efficiency, exergy efficiency and exhaust temperature were considered as dependent variables (output variables). Therefore, by identifying the input and output variables, a MLP type of ANN was employed to develop the target model. As seen in Figure 2, the architecture of these networks generally has three layers which include input, hidden and output layers. Layers are connected by nodes, therefore each layer has its own node. The signal processing begins from first layer.
Receiving information from external nodes activates the related nodes on input layer and emits a signal to the next layer. Each connection between two nodes in two adjacent layers are related to each other by weighting coefficients, that this weights adjusts the signal strength based on the input data [40]. In training of the back propagation method, the error is determined by comparing the output and the desired output and this error is returned to the hidden and input layers of the next training processes. The network training operation ends when the error comes down below some value specified by the user [39].
The development process of our MLP network was performed using the Artificial Neural Network Toolbox in MATLAB (R2017b, MathWorks, Natick, MA, USA). In the first step, the imported processing data matrix included fuel type and dynamometer load as input variables and energy efficiency, exergy efficiency and exhaust temperature as output variables. In the second step, the imported data were randomly divided into three categories of training data (with a share of 70%), test data (with a share of 20%) and validation data (with a share of 10%) by the network. The training process was conducted with different numbers of neurons in the hidden layer and the performance parameter (MSE) of each run was accordingly calculated with respect to the target value, the network was trained with one neuron in the hidden layer. For a certain group of neurons in the hidden layer different results may be obtained in each training process. In each network training process, the weight and bias were corrected to reduce the tilt of the performance function and the output matrix of the network was obtained. Therefore, training process for each number of neurons in the hidden layer was done in three repetitions and the value of the performance function was calculated for each repetition and the average value of the performance function for three repetitions was obtained. Calculating the average value eliminates the effect of the output differences. These operations were conducted to determine the optimal number of neurons in the hidden layer and to obtain the best model. The results of the training process are tabulated in Table 3.

3.4. Evaluation of the Developed Models

The evaluation and comparing performance of MLP and ANFIS models were performed by comparing the results of the output of networks and target values using RMSE, r, MAE and MSE as follows [38,41]:
M S E = 1 N i = 1 N ( A P ) 2
R M S E = 1 N i = 1 N ( A P ) 2
R = 1 ( i = 1 N ( A P ) 2 i = 1 N ( A i ) 2 )
M A E = 1 N i = 1 N | A P |
where A is the target value and P is the predicted value [42]. The RMSE was used to calculate the difference between the predicted and target values. Decreasing the difference between output and target value decreases the RMSE value. The Pearson correlation coefficient R was used for expressing linear correlation between actual and predicted values and is used as a measure of the degree of linear dependence between two variables [37].

4. Results and Discussion
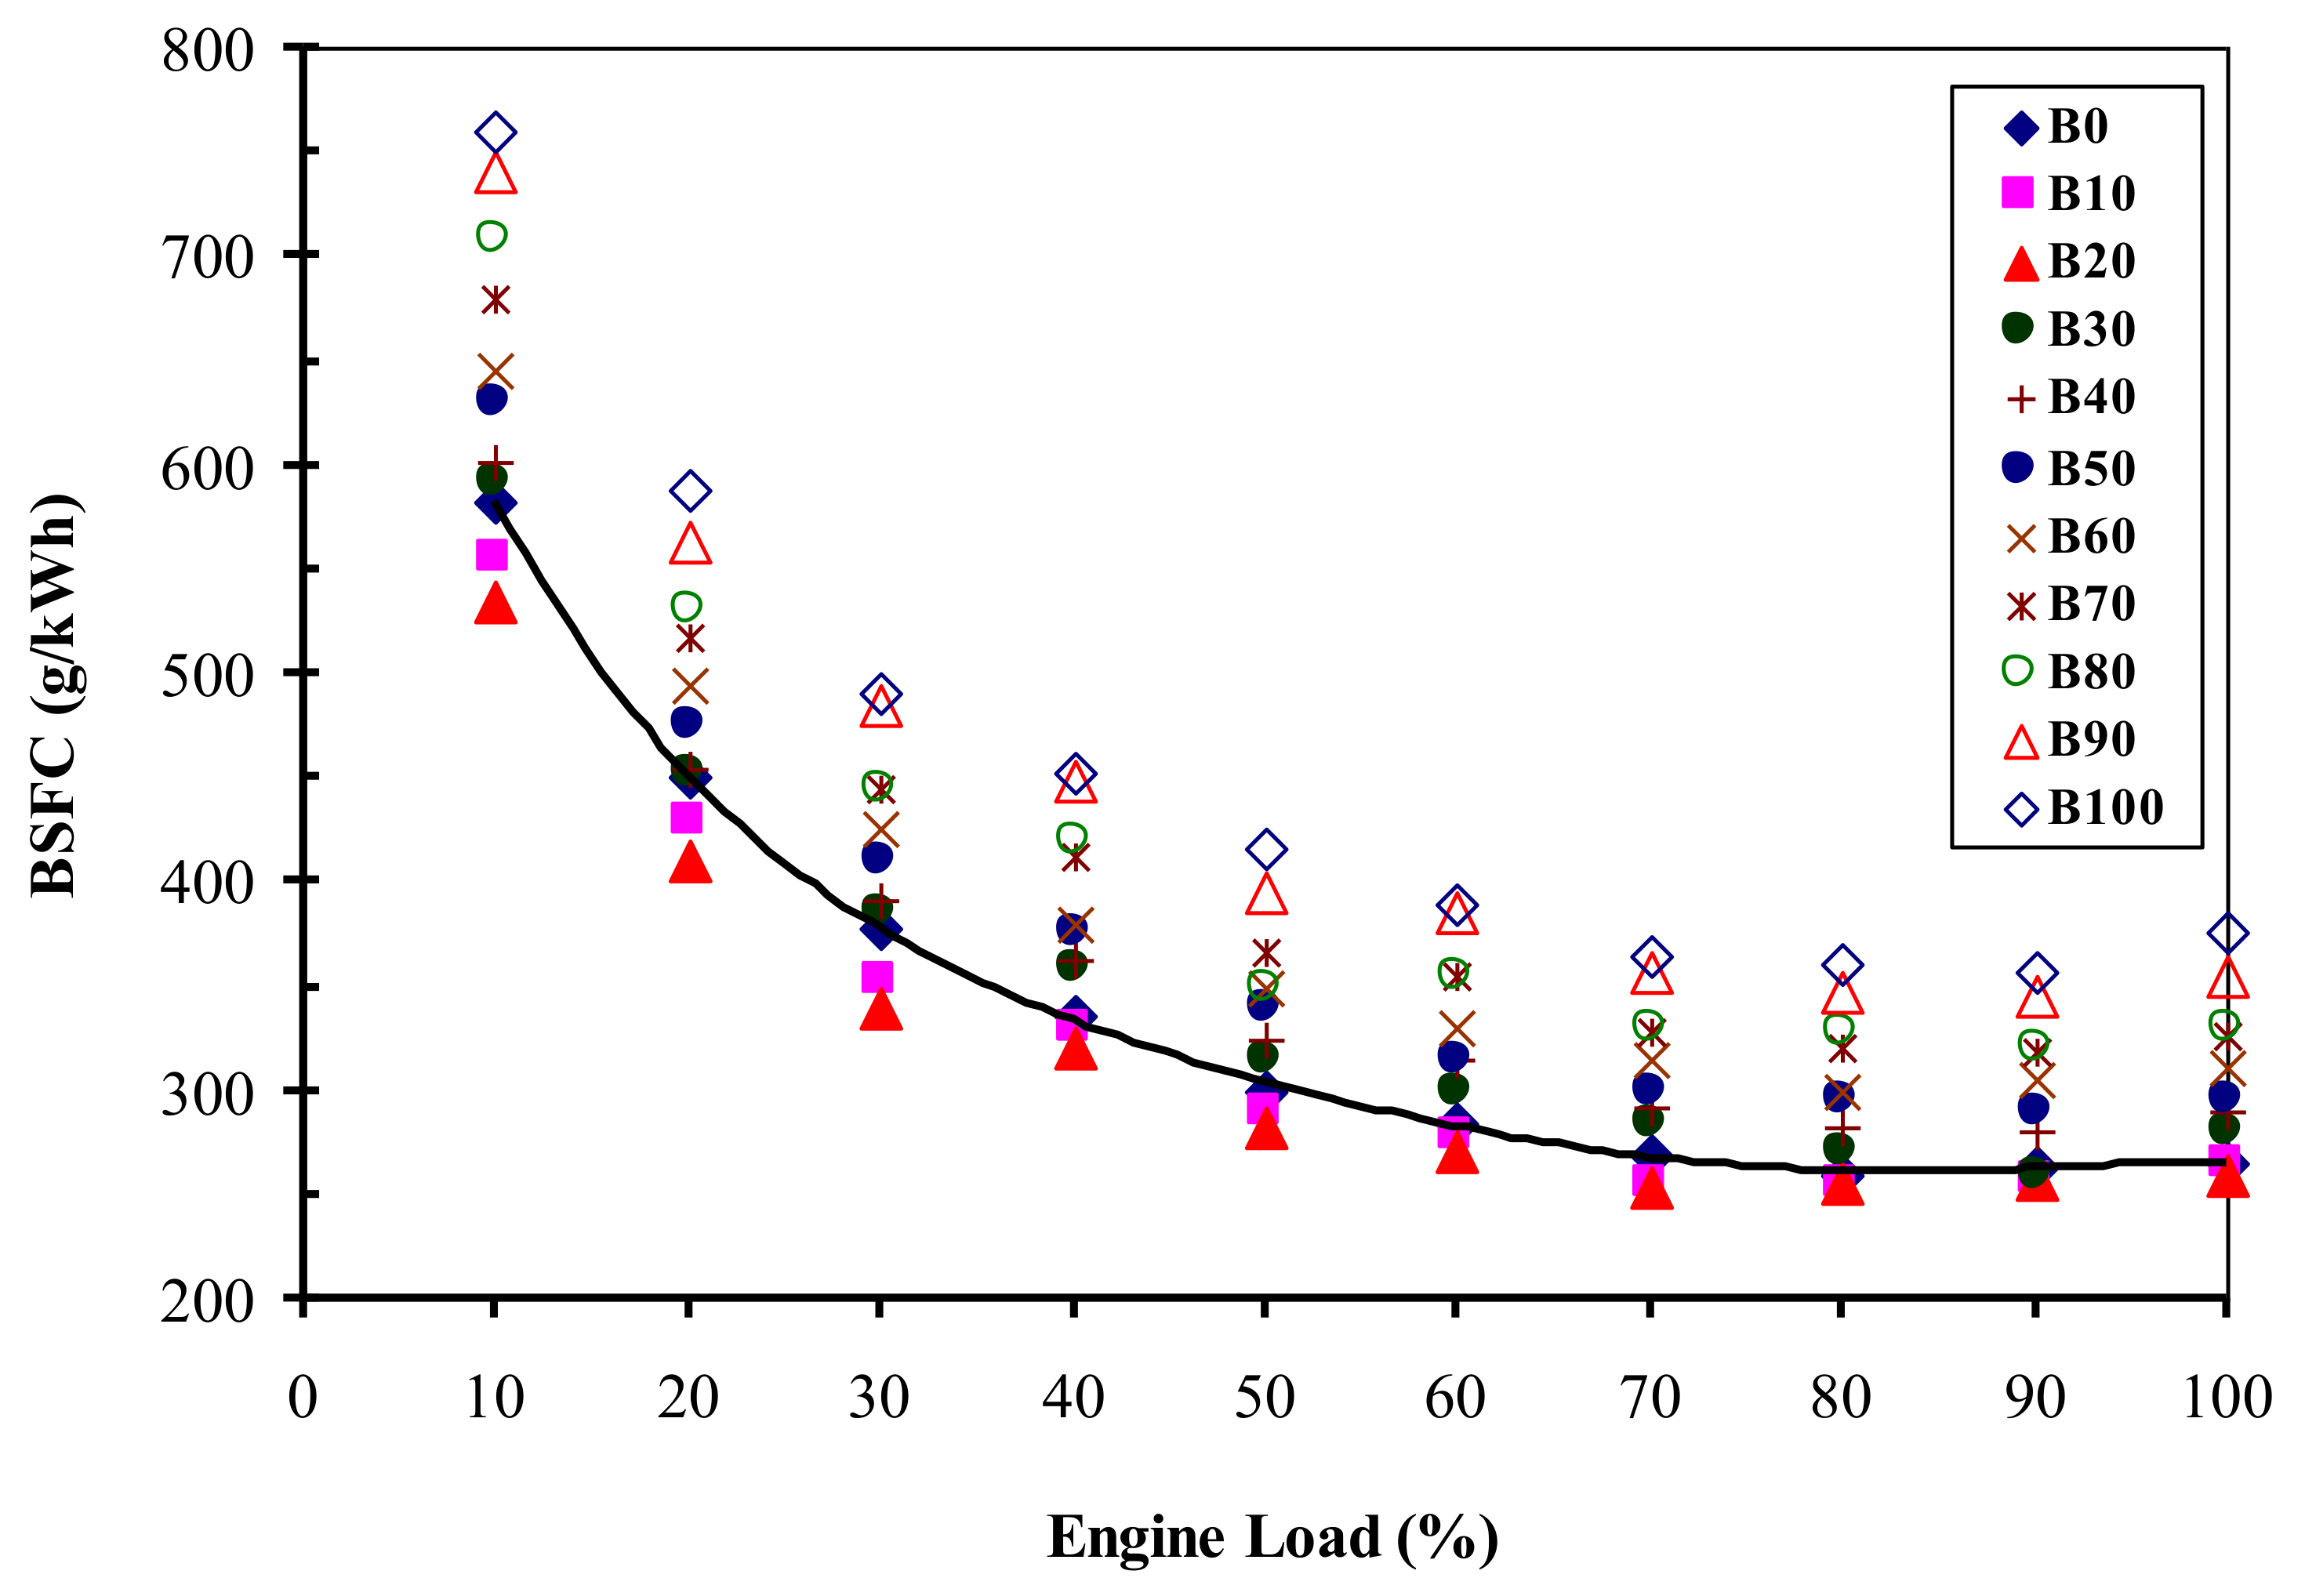
4.1. BSFC

BSFC is presented in Figure 3. The results show that increasing the engine load decreases the BSFC value in the mentioned types of fuel samples. However, when the engine load is in the range of 100% of full load, the engine BSFC is slightly increased; this can be due to the engine reaching its smoke limit. Additionally, the BSFC of fuel samples containing biodiesel was increased compared to pure diesel fuel, because the heating value of biodiesel fuel is lower than that of diesel fuel, but the fuel consumption for the B10 and B20 types is slightly less than for pure diesel fuel due to the better fuel combustion that is consistent with the literature and confirms the studies of other researchers [3,4,5,6,7,8].

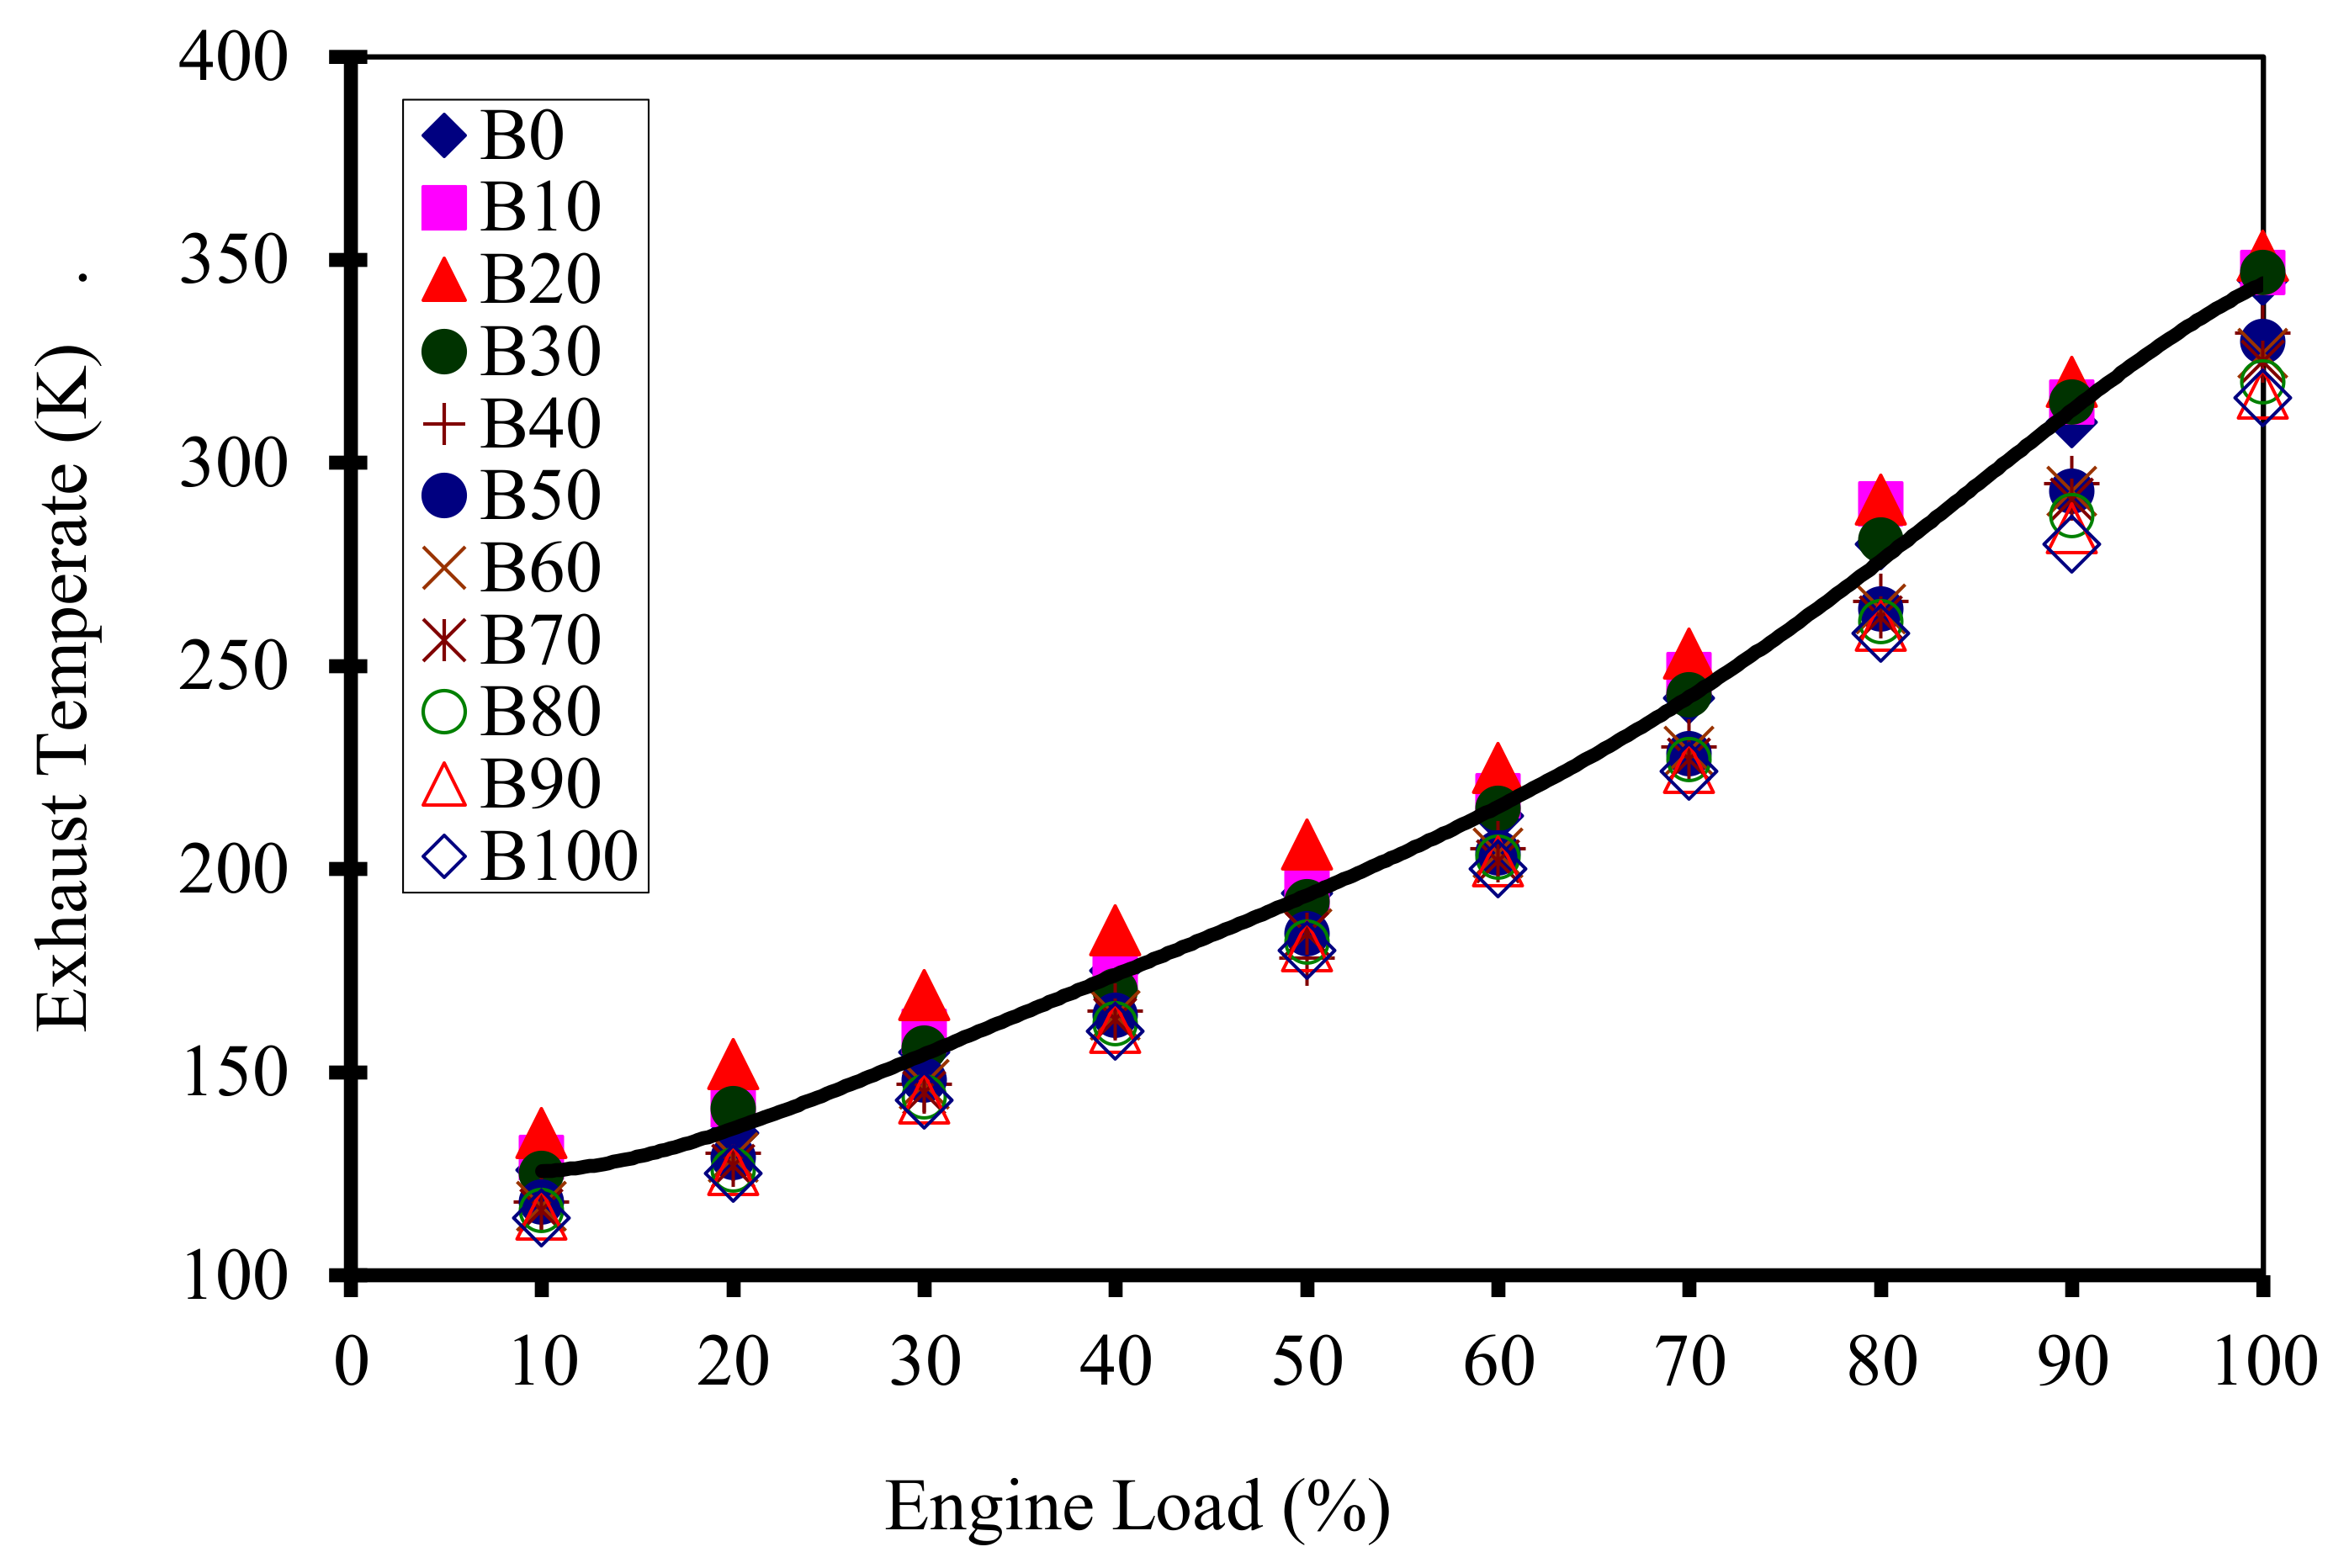
4.2. Exhaust Gas Temperature

The temperature of output exhaust gases is given in Figure 4. Comparing the temperature of the output exhaust at dynamometer constant loads and for different fuels says that increasing the proportion of biodiesel in the blended fuel up to B20 increases the exhaust temperature and then it decreases, and the results also show that increasing the load applied to the engine increases the temperature of the combustion chamber for all fuels containing biodiesel.
Unlike diesel fuel biodiesel contains oxygen. The oxygen content of fuel increases the outlet gas temperature [43]. On the other hand, the heating value of biodiesel is lower than that for the diesel fuel, so in fuel samples from diesel to B100, the oxygen content rises and the heating value of fuel decreases. Therefore, the effect of oxygen content and lower heating value of biodiesel on exhaust temperature are two contradictory factors.
Based on results, it is possible that the effect of oxygen content on exhaust temperature is higher than that of the effect of lower heating value up to B20, therefore the exhaust temperature was increased, but from B20 to B100 the effect of low heating value overcomes the effect of oxygen content and the exhaust temperature was reduced.

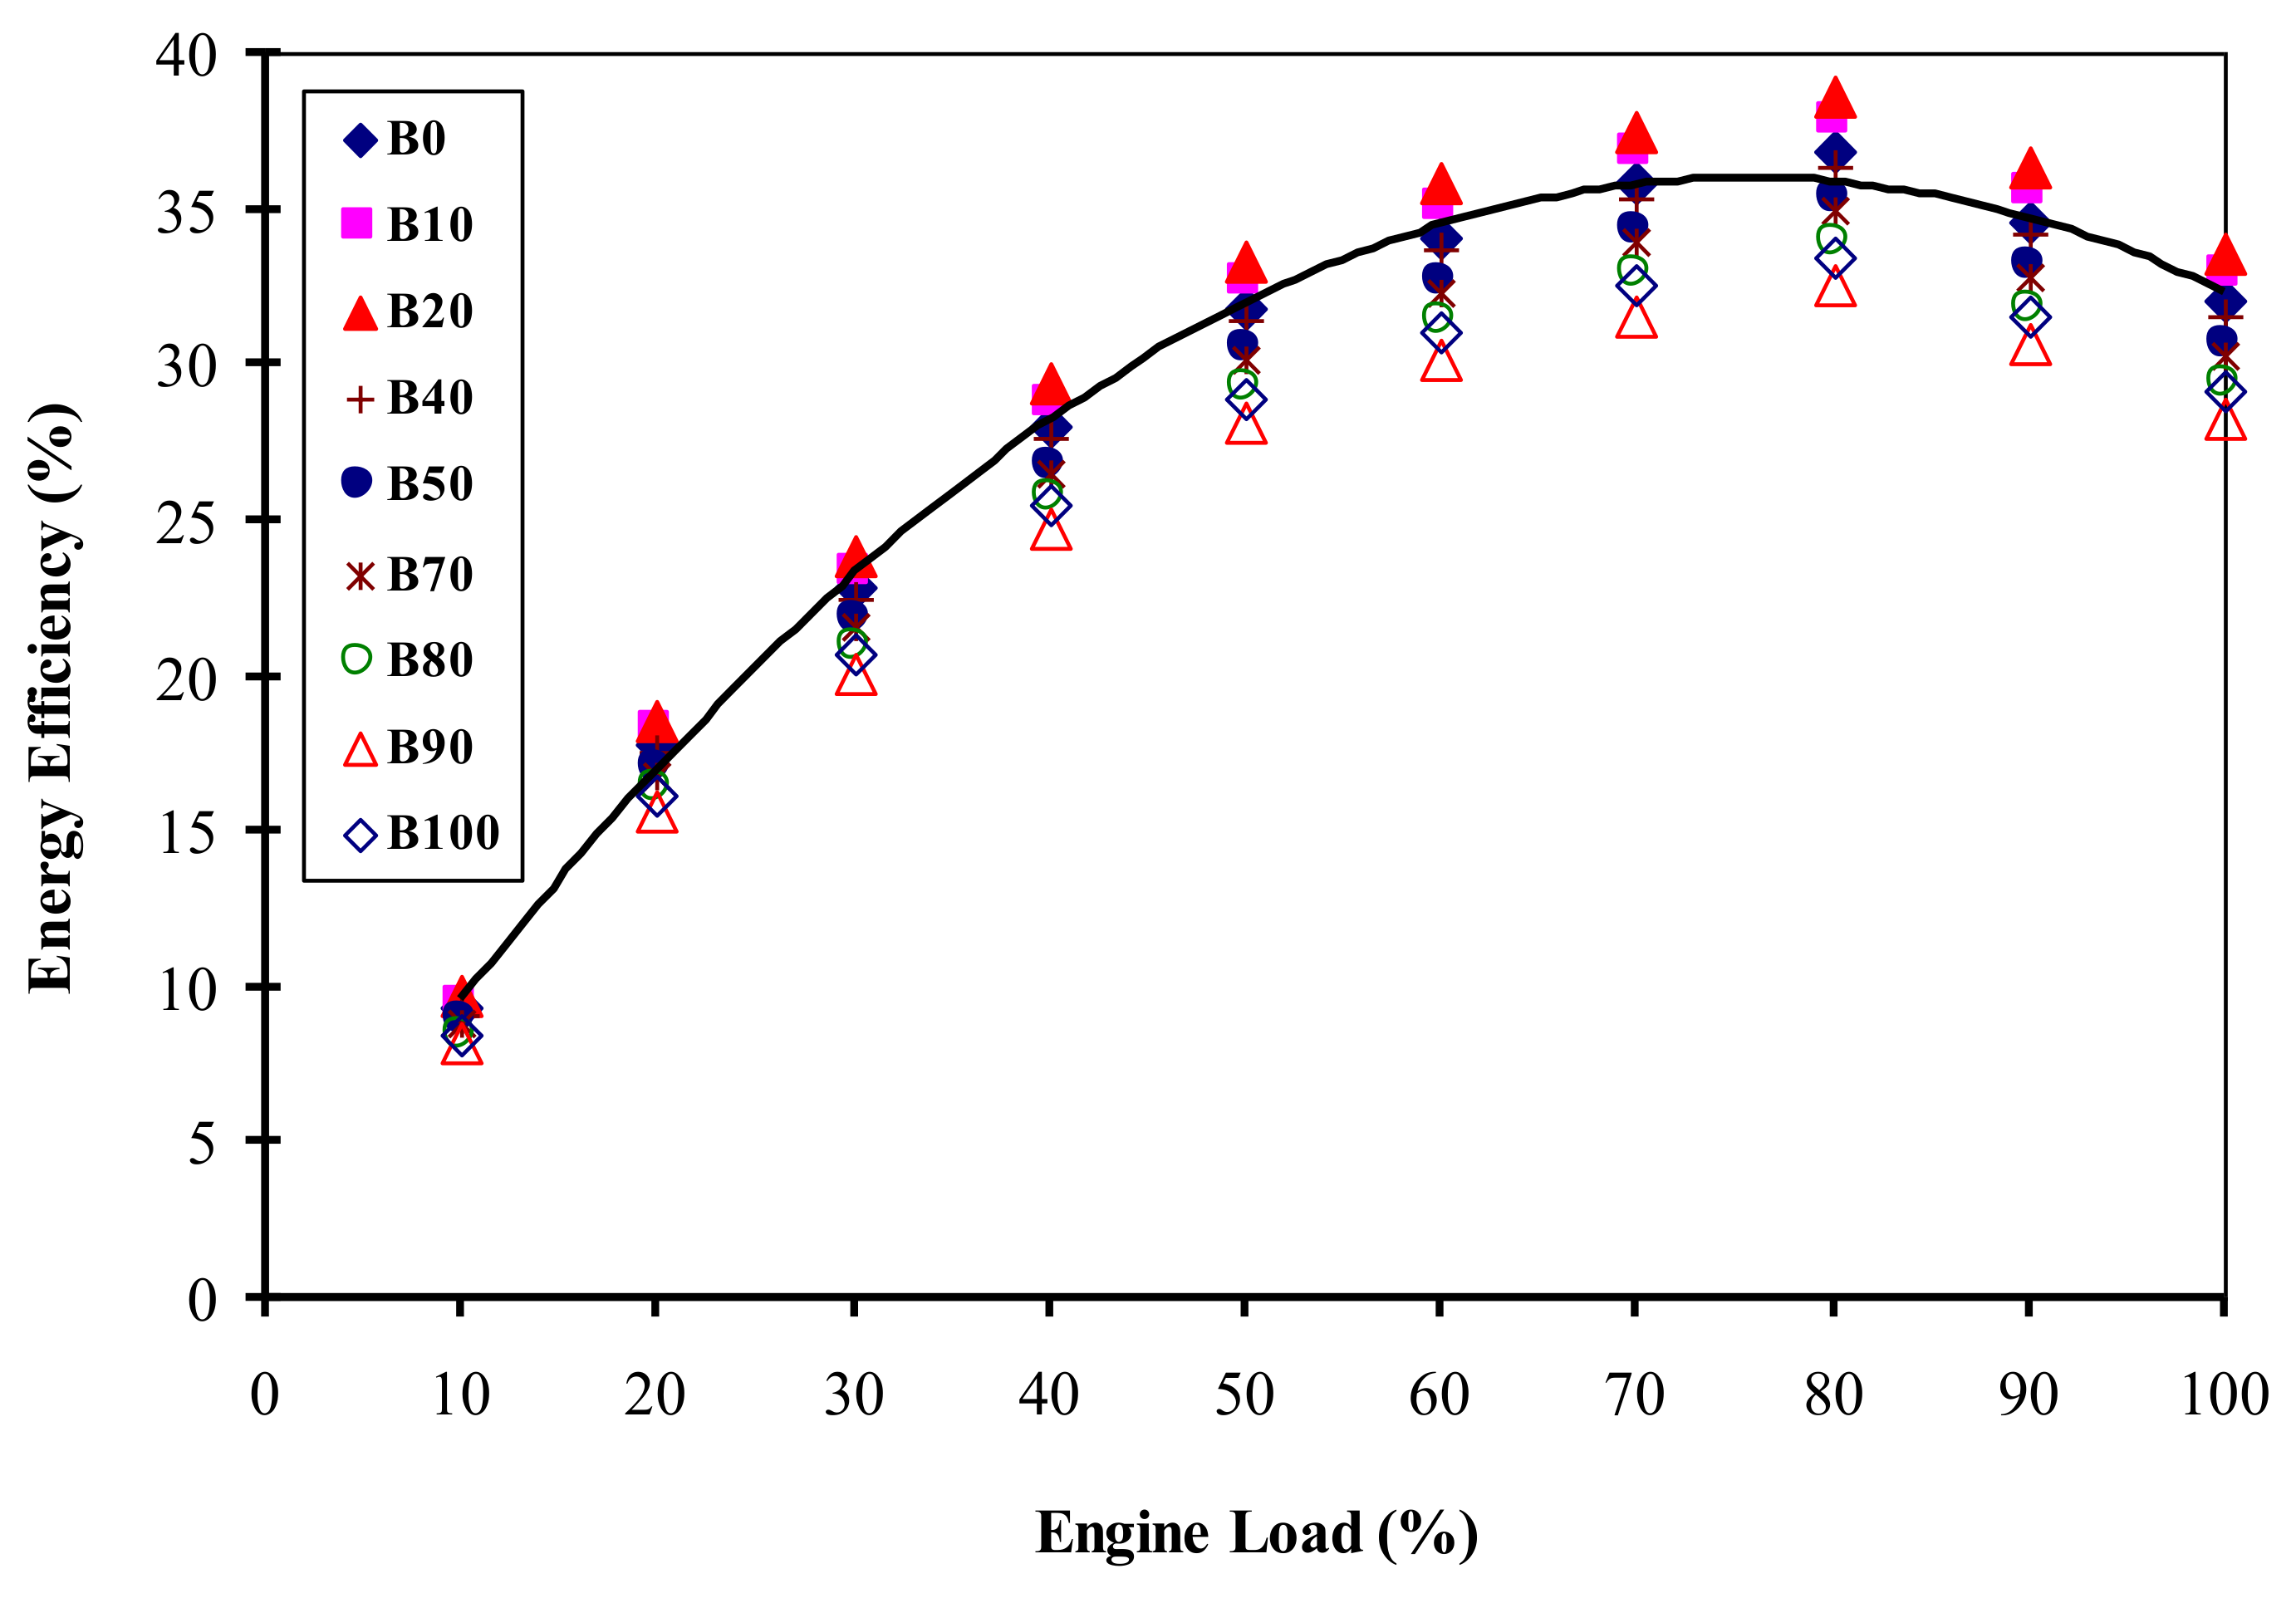
4.3. Energy Efficiency

Engine thermal brake efficiency is given in Figure 5. The results show that at different dynamometer loads, the thermal brake efficiency of B10 and B20 fuel is a little more than that of pure diesel fuel, which shows improved fuel combustion and the effective conversion of chemical energy into useful work. In the range of 80% of full load, the engine has the maximum thermal efficiency, but increasing to 100% of full load, the thermal brake efficiency decreases because the engine reaches the smoke limit. If the goal is to increase the access to energy in the fuel and converting it into useful work, the best operational condition with B10 and B20 fuels is 80% of full load.

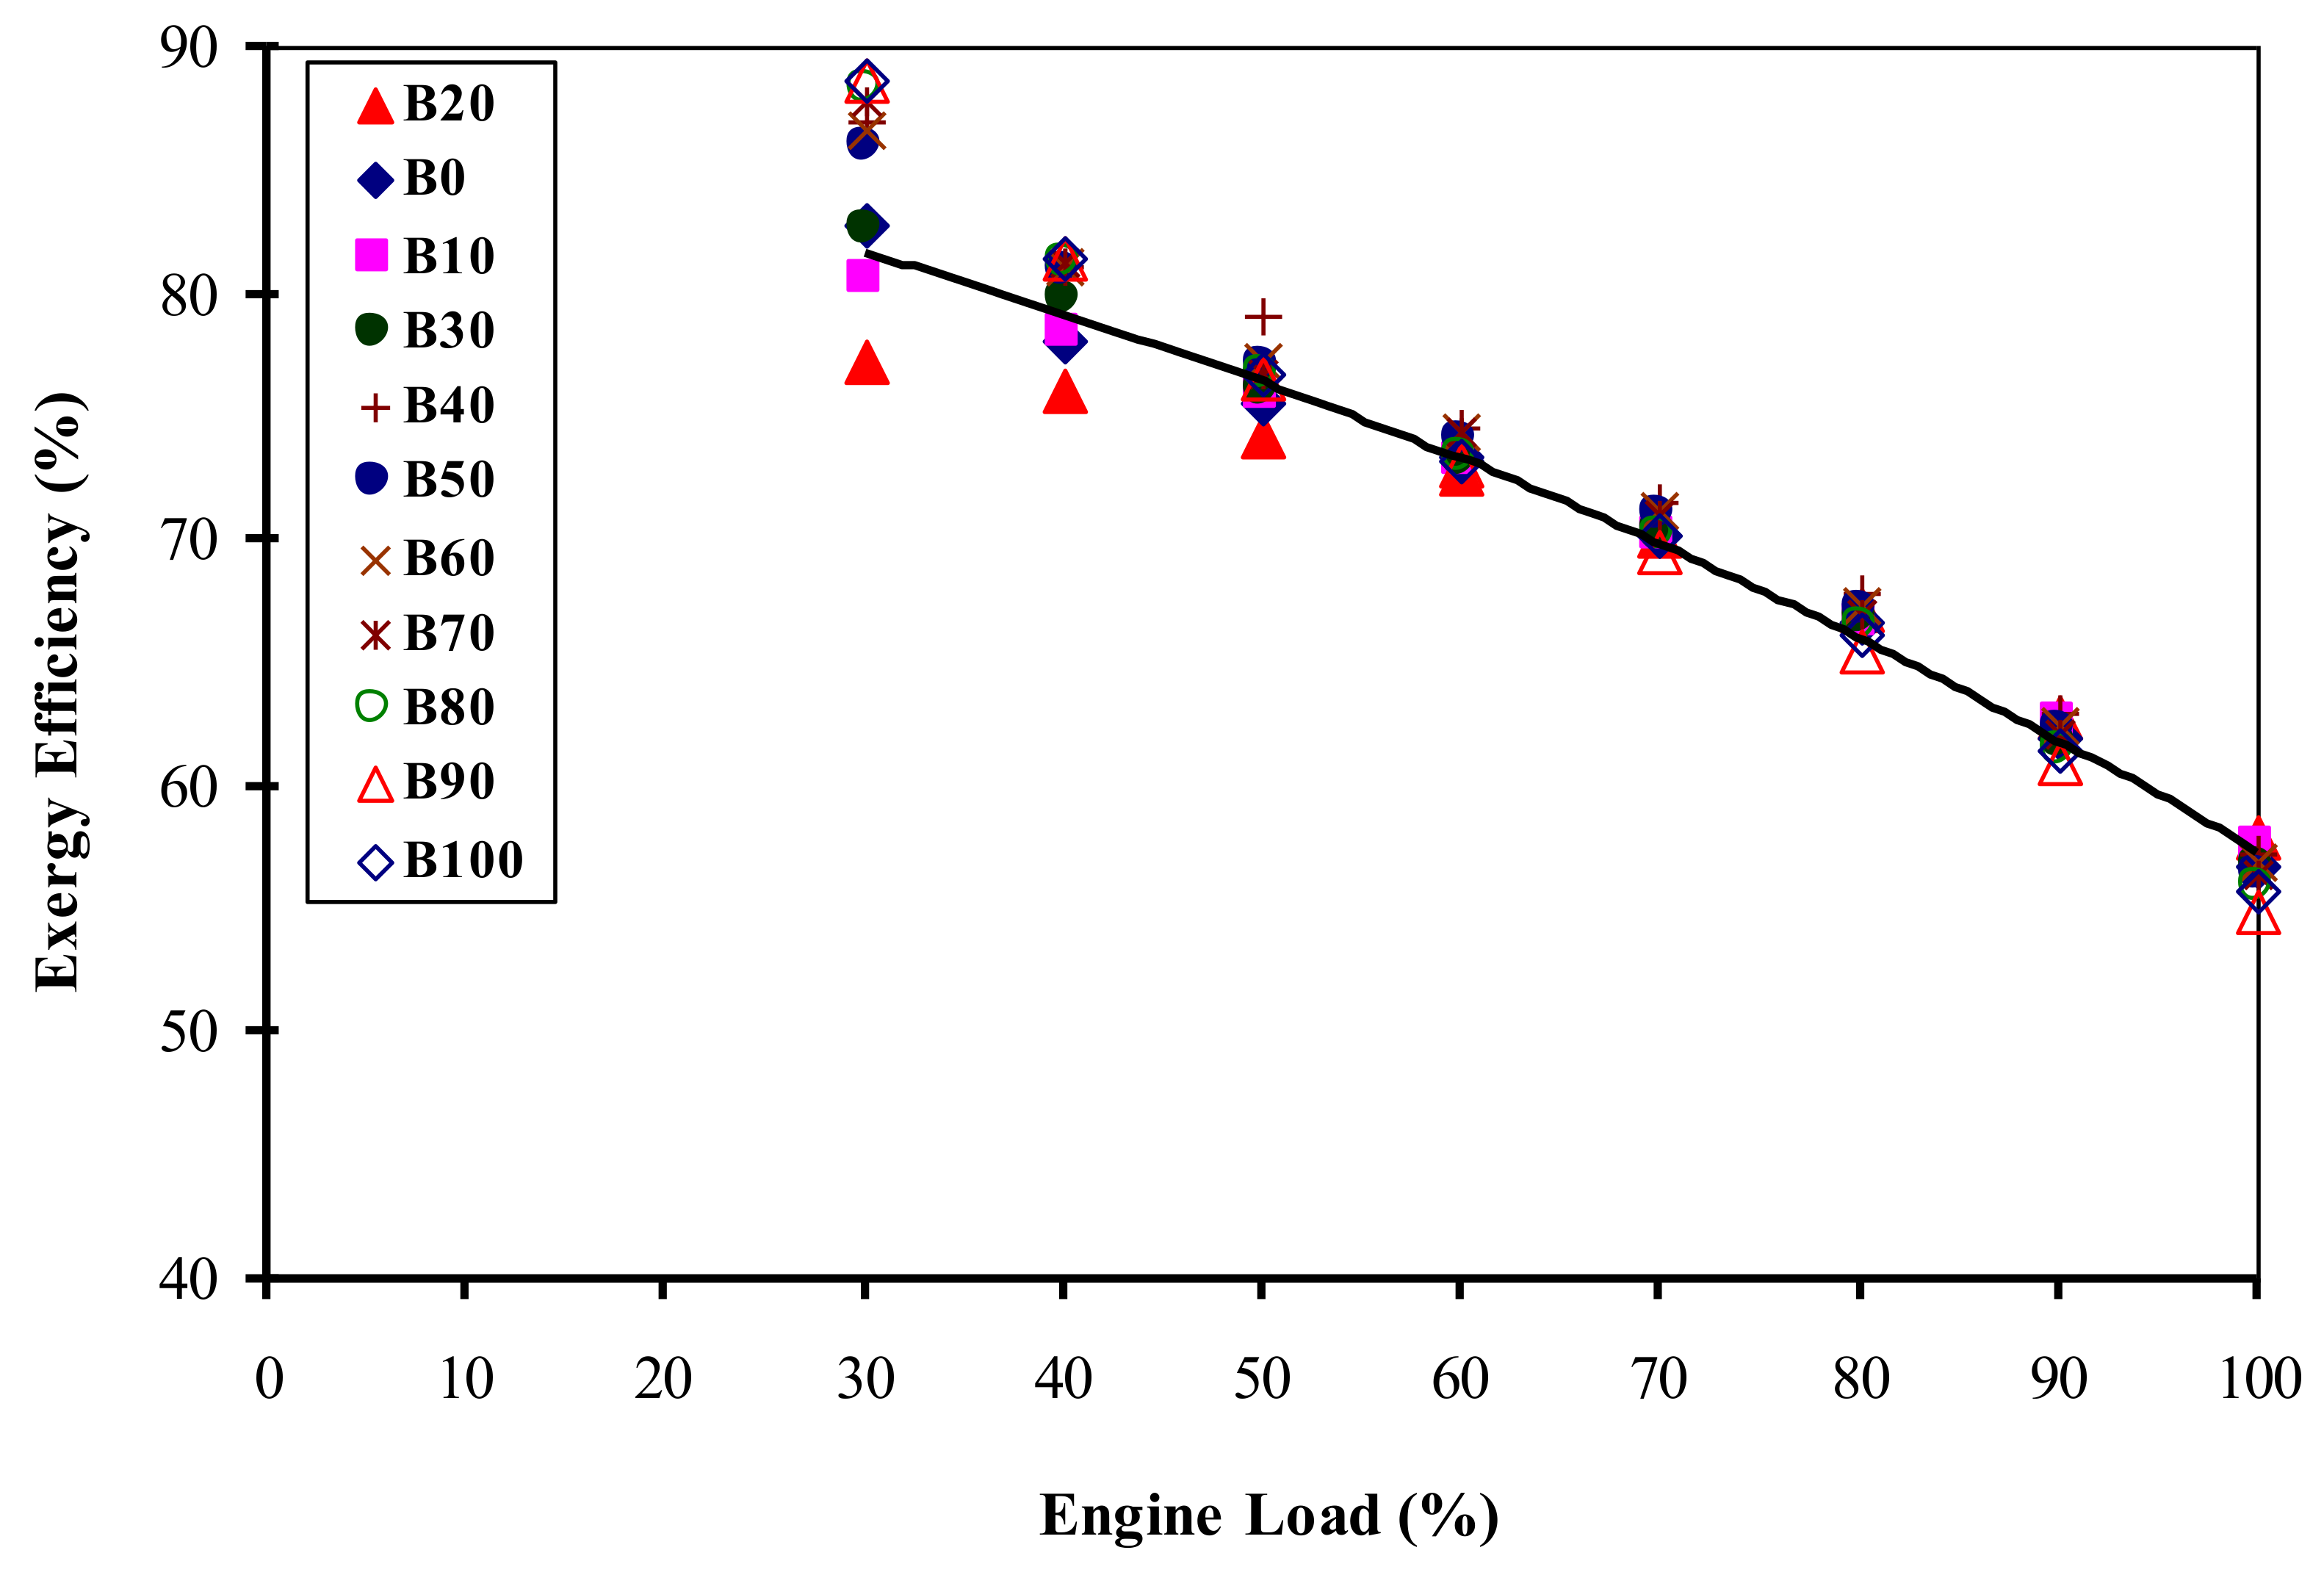
4.4. Exergy and Energy Efficiency
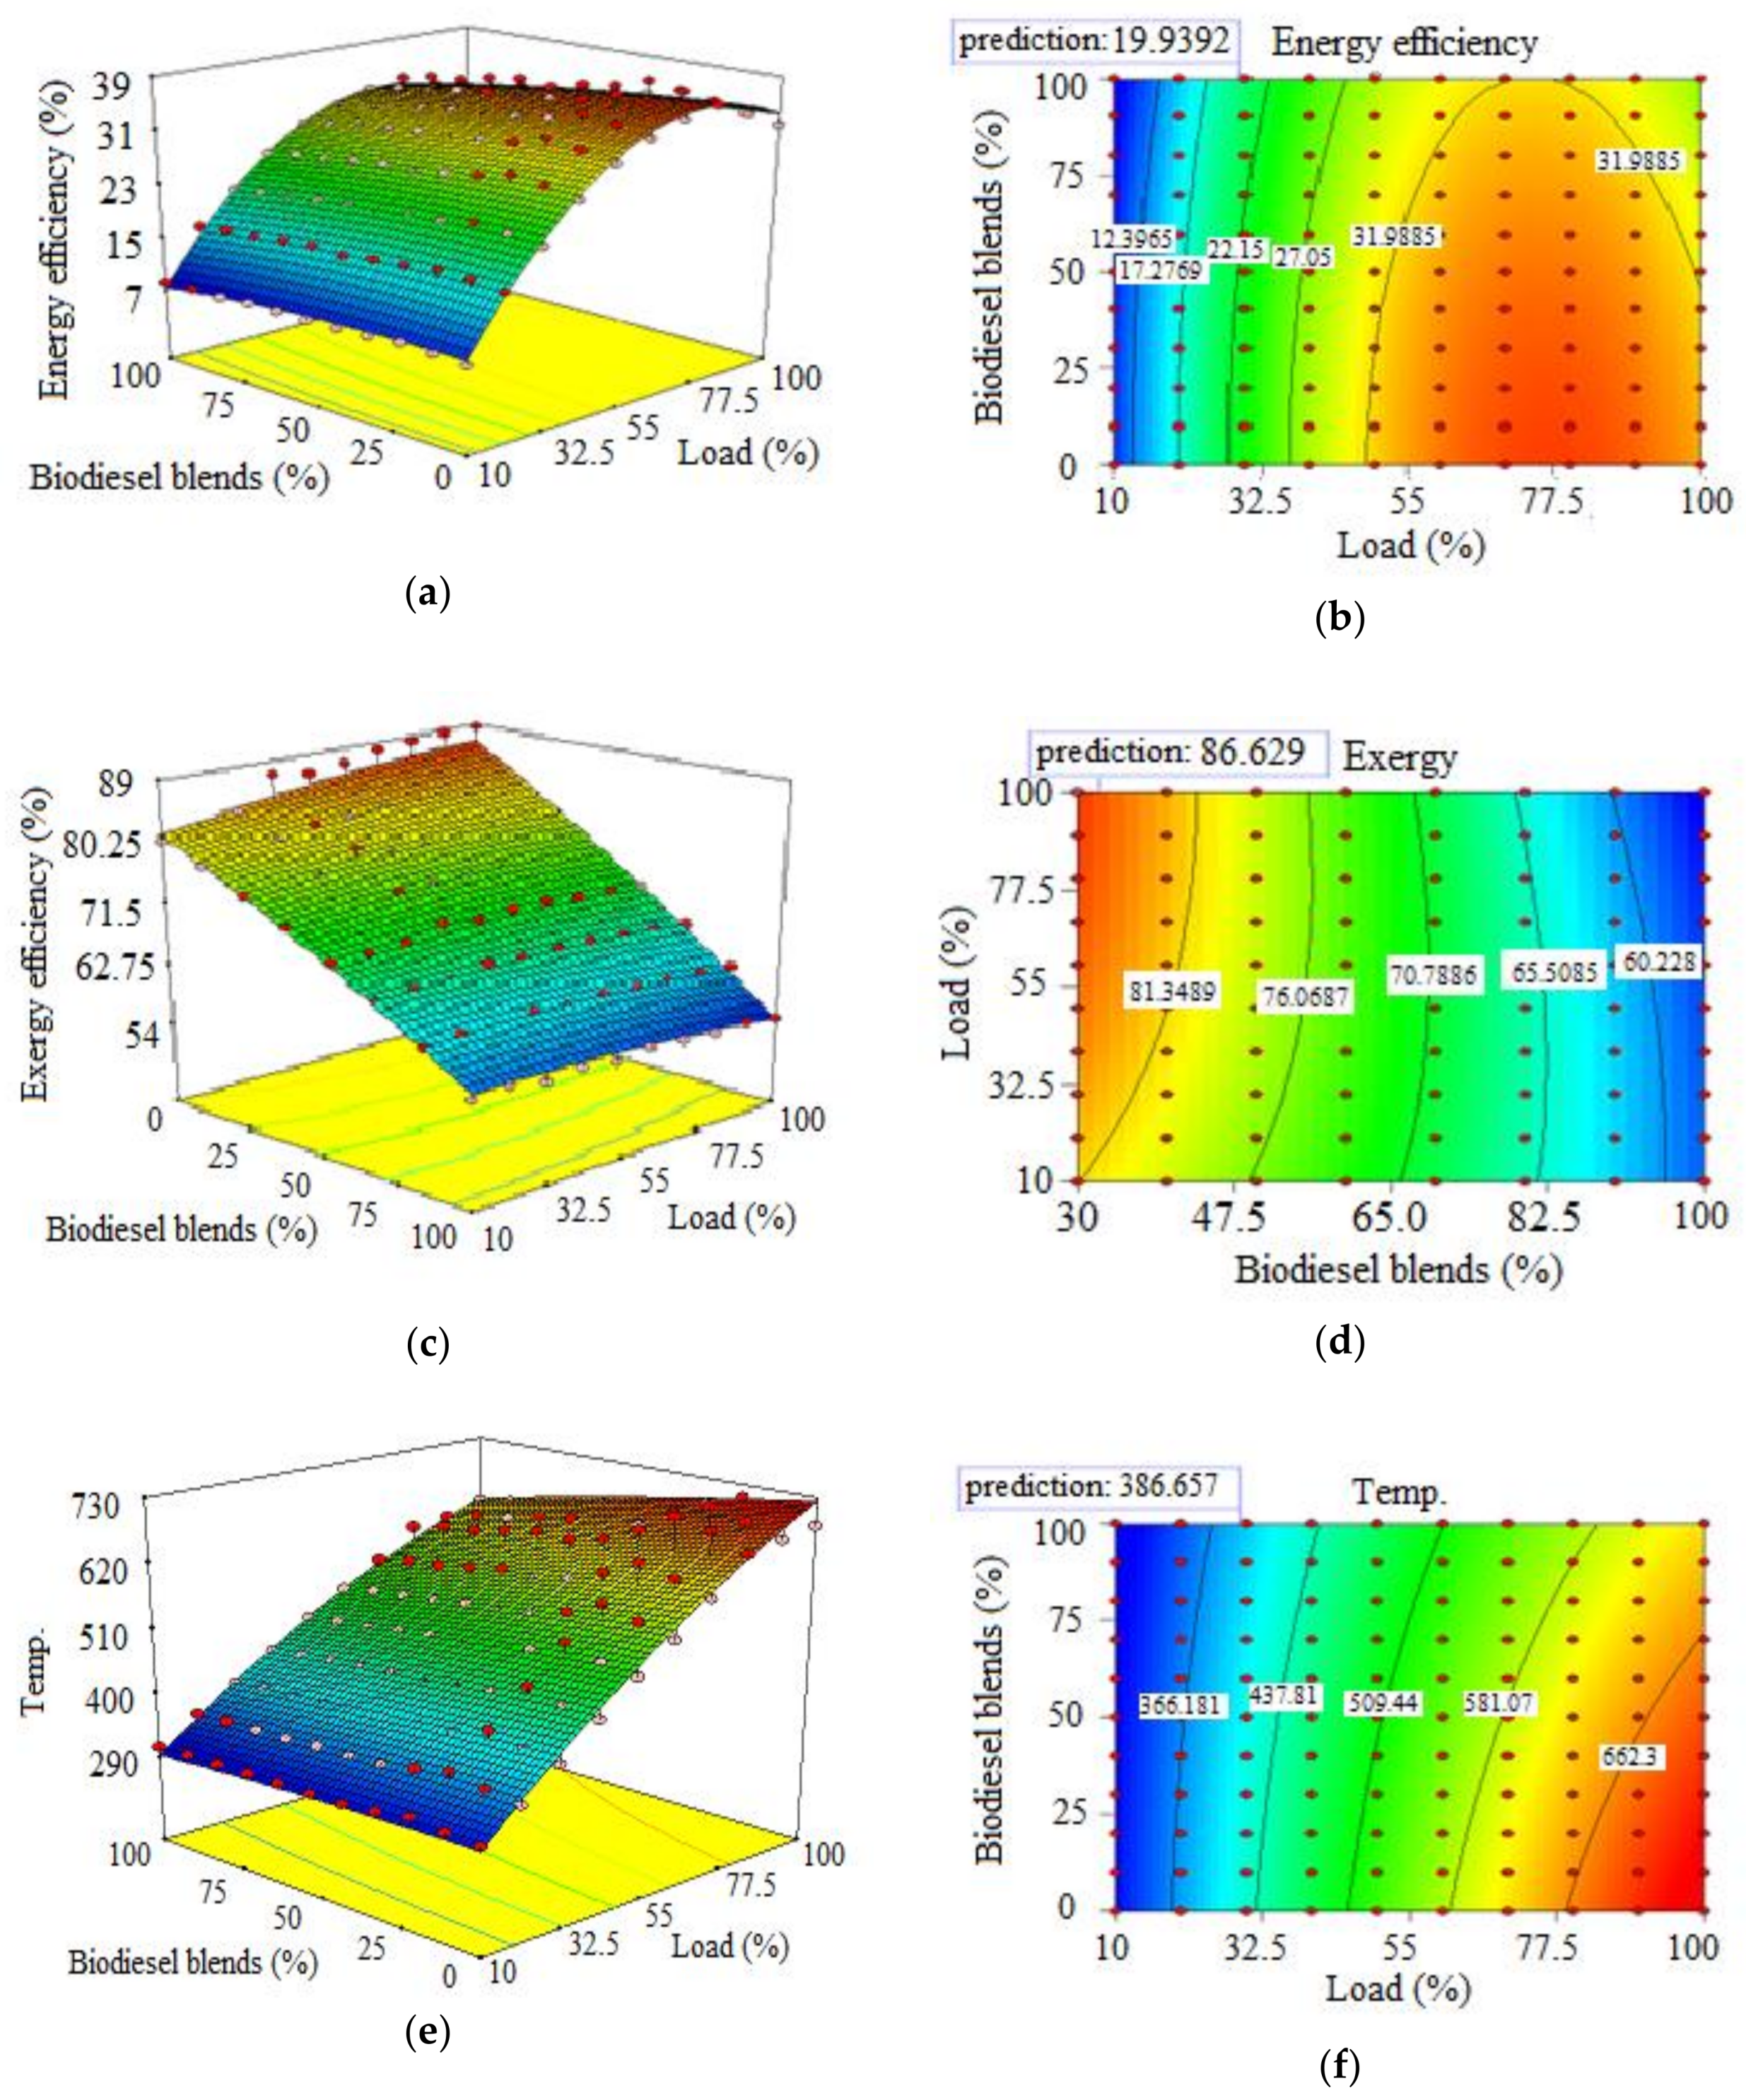
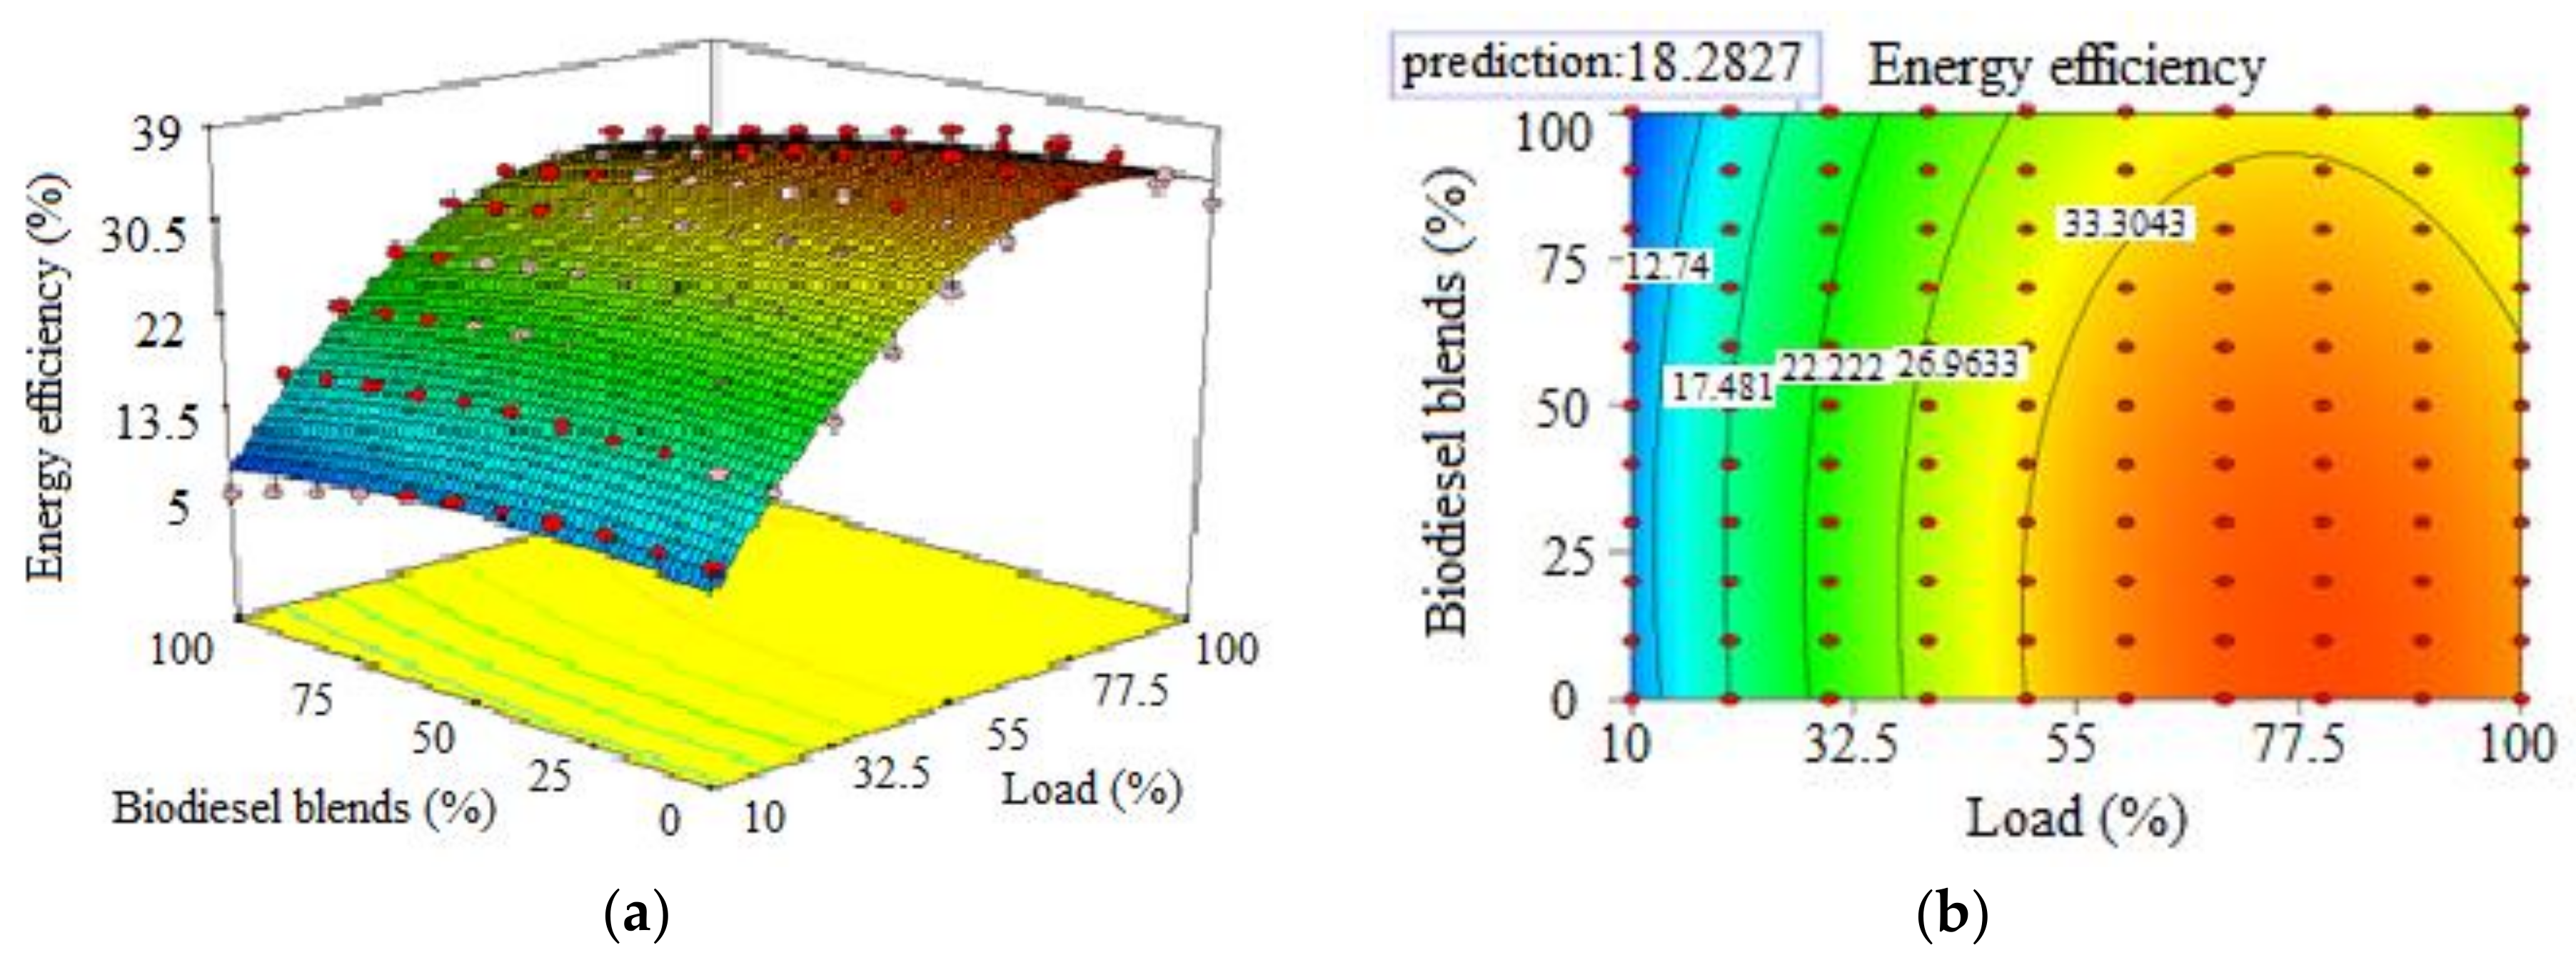
Unlike energy efficiency, exergy efficiency decreased with an increase in engine load for all samples of the blended biodiesel-diesel fuel. Energy efficiency of the engine at loads of 10% and 20% was very low. Under no-load or low-load conditions, fuel was consumed but less thermal energy was converted into mechanical work, thus the achieved value of parameter β (which is calculated using energy efficiency) was larger than the compression ratio (5/17) and exergy efficiency was calculated greater than 100%, which is an incorrect result. Therefore, exergy efficiency at 10% and 20% load was not considered in our calculations.
Exergy efficiency of the engine is given in Figure 6. The results show that the exergy efficiency at loads of 30%, 40%, 50% and 60% for the fuels of B10 and B20 was less than those of pure diesel fuel due to the higher temperature of the output exhaust of B10 and B20 fuels compared with diesel fuel. However, the exergy efficiency of other fuel samples at these loads was more than that of pure diesel fuel.
Moreover, the exergy efficiency of all fuels was almost equal at loads of 70, 80.90% and 100%, but the exergy efficiency of B10 and B20 fuels was a little more than that of pure diesel fuel, while for B90 and B100 it was slightly less. To achieve the maximum accessible work, the best operational conditions of the engine were 30% of full load and fuels of B90 and B100.
Figure 7 shows the optimal conditions of exergy and energy efficiency based on fuel type and engine load. The Design-Expert® software (Version 8.0, Stat-Ease, Minneapolis, MN, USA) was used to calculate the optimum values of exergy efficiency, energy efficiency and exhaust temperature by biodiesel and engine load. A quadratic method by manual selection was employed to maximize the energy and exergy efficiencies and to minimize the exhaust gas temperatures that are as the main limitations for optimization. Based on Figure 7, the optimum value of energy efficiency, exergy efficiency and exhaust temperature is in range of 25–30 of engine load where the value predicted for energy efficiency by the software is 19.93%. Accordingly, the predicted value of exergy efficiency in this range is 86.629% and the predicted value of exhaust temperature in the calculated range is 386.657 (°C). This means that in fuels containing more biodiesel, the applied load should be in range of 25 to 30% of engine full load.

4.5. ANN Modeling

A MLP network was employed to model the variation of energy efficiency, exergy efficiency and exhaust temperature as output variables of the network based on biodiesel type and engine load as input variables of the network. To train the target networks, data were randomly divided to training data (70% of total data), validation data (10% of total data) and test data (20% of total data) by the developed algorithm. Training was performed using different number of neurons in the hidden layer and R2 and MSE was calculated for each training as performance factors. Table 3 above indicates the results of each training process.
As seen in Table 3, the network with 16 neurons in the hidden layer provided the minimum distance of target values by MSE values of 1.2979, 3.9593 and 2.41 for energy efficiency, exergy efficiency and exhaust temperature, respectively, and highest linearity of outputs and target values by R2 values of 0.977, 0.9885 and 0.9996 for energy efficiency, exergy efficiency and exhaust temperature, respectively, therefore 16 neurons in the hidden layer was chosen as the optimum number of neurons for developing the testing process of the developed network. The testing process was performed by importing the experimental data and RMSE was calculated as 1.0288, 4.3841 and 2.8411 for energy efficiency, exergy efficiency and exhaust temperature, respectively, and accordingly the r value was measured as 0.9925, 0.9907 and 0.9997 for energy efficiency, exergy efficiency and exhaust temperature, respectively and the MAE value was calculated as 0.7861, 2.5815 and 2.1847 for Energy efficiency, exergy efficiency and exhaust temperature, respectively (Table 4).

4.6. ANN-RSM Method

Optimization was performed by RSM toolbox of the Design Expert software with a quadratic method by manual selection using the values of energy efficiency, exergy efficiency and exhaust temperature predicted by the developed model.
This method was performed to compare the optimum of the experimental data and the ANN model. Figure 8 presents the results of this stage. Based on the results the optimum value of energy efficiency, exergy efficiency and exhaust temperature is in range of 25–30 of engine load, and this range is same as the calculated range of mathematical modeling, as the value for energy efficiency predicted by the ANN modeling software is 18.2827. Accordingly, the predicted value of exergy efficiency in this range is 87.81 and the predicted value of exhaust temperature in the calculated range is 376.699 K.
By comparing the results of Figure 7 and Figure 8, it is clear that in the two methods of modeling, the optimum range is 25 to 30 percent of engine load but if we look closer, it can be seen that in this range, the mathematical modeling provides 1.6565% more energy efficiency compared to ANN modeling but on the other hand, ANN modeling provides 4.348% more exergy efficiency, which means more possibility of useful work results from the ANN model predictions compared to the mathematical modeling and it also provides a 9.958 (°C) lower value of the exhaust temperature compared to mathematical modeling.
Based on exegetical lows, in a thermal system, approaching the output temperature to dead state temperature, increases the possibility of useful work or exergy of the system. As is clear from Figure 7 and Figure 8, that after applying the ANN method, the exergy efficiency was increased (from 86.629 to 87.81). It can be concluded that employing ANN-RSM method provided more possibility of useful work compared to applying the RSM on experimental data. This is because the experimental data are discrete data and applying ANN changes discrete trends to continuous trends and this provides a precise decision to the RSM method.

5. Conclusions

The purpose of the present study was to determine the optimal conditions of engine performance based on thermal and exergy efficiencies and to develop a precise ANN to replace the complex mathematical models. The mathematical modeling results showed that in the range of 80% of full load, the engine has the maximum thermal efficiency on condition of using B10 and B20 and the optimal conditions according to exergy efficiency (reaching the most accessible work) is 30% of full load on condition of using B90 and B100 and also the optimal conditions based on both energy and exergy efficiencies, is in range of 25–30% of full load.
In the second stage of optimization the Design Expert software with a quadratic method by manual selection was employed to develop the RSM in order to reach the optimized conditions based on both exergy and energy efficiencies. Based on the results the optimum value of exergy and energy efficiencies are in range of 25–30% engine load and this range is same as the calculated mathematical modeling range. The predicted value for energy efficiency by the software for ANN modeling is 18.2827 and for exergy efficiency in this range it is 87.81. By closer looking, it can be obtained that there is a difference equal to 4.348 and 1.6565% for the values of exergy and energy efficiencies between the two developed models. Therefore, based on the mentioned results it can be concluded that employing ANN model in predicting or controlling circuit, will provide more possibility of useful work compared to that obtained by mathematical modeling.

Author Contributions

Bahman Najafi and Sina Faizollahzadeh Ardabili conceived, designed and performed the experiments and analyzed data; Sina Faizollahzadeh Ardabili and Shahaboddin Shamshirband developed the soft-computing methodology and wrote the paper; Amir Mosavi and Timon Rabczuk contributed the proofreading, analysis tools and additional informations.

Conflicts of Interest

The authors declare no conflict of interest.

Abbreviations

List of Symbols
ASTMAmerican Society for Testing and Materials
ELMExtreme learning machine
MSMass
WCOWaste cooking oil
ANNArtificial neural network
RSMResponse surface methodology
SVMSupport vector machine
HCCIHomogeneous charge compression ignition
DIDirect Injection
DoEDesign of experiments
EGRExhaust Gas Recirculation
FEngine Load, N
W ˙ B Brake Power, kW
NRPMEngine Speed (rpm)
m ˙ f u e l Mass Flow Rate (kg/s)
ρDensity (gr/cm3)
tsFuel Consumption Time (s)
T H Temperature of Combustion Chamber
T C Temperature of Environment
H u Lower Heating Value (MJ/kg)
Q ˙ i n Thermal Power (kW)
BMBi-harmonic maps
Q ˙ o u t Losses Power (kW)
MLPMulti layered perceptron
WTWavelet transform
ANFISAdaptive neuro fuzzy inference system
MSEMean square error
ANFISAdaptive neuro fuzzy inference system
MAEMean absolute error
rCorrelation coefficient
RMSERoot mean square error
BSFCBrake specific fuel consumption
R2coefficient of variations
GCGas Chromatography
η en Energy Efficiency (%)
E ˙ x i n Exergy Rate (kW)
δ E x Exergy Destruction (kW)
S ˙ g e n Entropy rate (kW/K)
A ˙ i n Chemicals Availability
x, y, zNumber of Carbon, Hydrogen and Oxygen in the fuel
γRatio of Specific Heat Capacity
CPSpecific Heat Capacity at constant pressure
CVSpecific Heat Capacity at constant volume
rcRatio of Engine compression
TExExhaust temperature
βRatio of cutoff ratio

References

  1. Khalife, E.; Kazeroni, H.; Mirsalim, M.; Shojaei, T.R.; Mohammadi, P.; Salleh, A.M.; Najafi, B.; Tabatabaei, M. Experimental investigation of low-level water in waste-oil produced biodiesel-diesel fuel blend. Energy 2017, 121, 331–340. [Google Scholar] [CrossRef]
  2. Najafi, B.; Pirouzpanah, V.; Najafi, G.; Yusaf, T.; Ghobadian, B. Experimental Investigation of Performance and Emission Parameters of a Small Diesel Engine Using CNG and Biodiesel; SAE Technical Paper; SAE International: Warrendale, PA, USA, 2007. [Google Scholar]
  3. Ali, O.M.; Mamat, R.; Abdullah, N.R.; Abdullah, A.A. Analysis of blended fuel properties and engine performance with palm biodiesel–diesel blended fuel. Renew. Energy 2016, 86, 59–67. [Google Scholar] [CrossRef]
  4. Attia, A.M.; Hassaneen, A.E. Influence of diesel fuel blended with biodiesel produced from waste cooking oil on diesel engine performance. Fuel 2016, 167, 316–328. [Google Scholar] [CrossRef]
  5. Zhang, Z.-H.; Balasubramanian, R. Investigation of particulate emission characteristics of a diesel engine fueled with higher alcohols/biodiesel blends. Appl. Energy 2016, 163, 71–80. [Google Scholar] [CrossRef]
  6. Woo, C.; Kook, S.; Hawkes, E.R.; Rogers, P.L.; Marquis, C. Dependency of engine combustion on blending ratio variations of lipase-catalysed coconut oil biodiesel and petroleum diesel. Fuel 2016, 169, 146–157. [Google Scholar] [CrossRef]
  7. Lei, T.; Wang, Z.; Chang, X.; Lin, L.; Yan, X.; Sun, Y.; Shi, X.; He, X.; Zhu, J. Performance and emission characteristics of a diesel engine running on optimized ethyl levulinate–biodiesel–diesel blends. Energy 2016, 95, 29–40. [Google Scholar] [CrossRef]
  8. Žaglinskis, J.; Lukács, K.; Bereczky, Á. Comparison of properties of a compression ignition engine operating on diesel–biodiesel blend with methanol additive. Fuel 2016, 170, 245–253. [Google Scholar] [CrossRef]
  9. Najafi, B.; Faizollahzadeh Ardabili, S. Effect of fatty acid ethyl esters in biodiesel on thermo-physical properties. Fuel Combust. 2016, 9, 121–133. [Google Scholar]
  10. Lapuerta, M.; Armas, O.; Rodriguez-Fernandez, J. Effect of biodiesel fuels on diesel engine emissions. Prog. Energy Combust. Sci. 2008, 34, 198–223. [Google Scholar] [CrossRef]
  11. Azoumah, Y.; Blin, J.; Daho, T. Exergy efficiency applied for the performance optimization of a direct injection compression ignition (CI) engine using biofuels. Renew. Energy 2009, 34, 1494–1500. [Google Scholar] [CrossRef]
  12. Moran, M.J.; Drake, M.S.; Shapiro, H.N. Fundamentals of Engineering Thermodynamics, Student Problem Set Supplement; John Wiley & Sons Inc.: Hoboken, NJ, USA, 2000. [Google Scholar]
  13. Sogut, M.Z. Exergetic irreversibility and sustainability performances for alternative fuels in the micro-turbojet engine. Int. J. Green Energy 2017, 15, 169–180. [Google Scholar] [CrossRef]
  14. Panigrahi, N.; Mohanty, M.K.; Mishra, S.R.; Mohanty, R.C. Energy and exergy analysis of a diesel engine fuelled with diesel and simarouba biodiesel blends. J. Inst. Eng. Ser. C 2018, 99, 9–17. [Google Scholar] [CrossRef]
  15. Aghbashlo, M.; Tabatabaei, M.; Khalife, E.; Najafi, B.; Mirsalim, S.M.; Gharehghani, A.; Mohammadi, P.; Dadak, A.; Shojaei, T.R. A novel emulsion fuel containing aqueous nano cerium oxide additive in diesel–biodiesel blends to improve diesel engines performance and reduce exhaust emissions: Part II—Exergetic analysis. Fuel 2017, 205, 262–271. [Google Scholar] [CrossRef]
  16. Jafarmadar, S.; Nemati, P. Multidimensional modeling of the effect of exhaust gas recirculation on exergy terms in a homogenous charge compression ignition engine fueled by diesel/biodiesel. J. Clean. Prod. 2017, 161, 720–734. [Google Scholar] [CrossRef]
  17. Jafarmadar, S.; Nemati, P. Exergy analysis of diesel/biodiesel combustion in a homogenous charge compression ignition (HCCI) engine using three-dimensional model. Renew. Energy 2016, 99, 514–523. [Google Scholar] [CrossRef]
  18. Nemati, P.; Jafarmadar, S.; Taghavifar, H. Exergy analysis of biodiesel combustion in a direct injection compression ignition (CI) engine using quasi-dimensional multi-zone model. Energy 2016, 115, 528–538. [Google Scholar] [CrossRef]
  19. Khoobbakht, G.; Akram, A.; Karimi, M.; Najafi, G. Exergy and energy analysis of combustion of blended levels of biodiesel, ethanol and diesel fuel in a di diesel engine. Appl. Therm. Eng. 2016, 99, 720–729. [Google Scholar] [CrossRef]
  20. Coban, K.; Şöhret, Y.; Colpan, C.O.; Karakoç, T.H. Exergetic and exergoeconomic assessment of a small-scale turbojet fuelled with biodiesel. Energy 2017, 140, 1358–1367. [Google Scholar] [CrossRef]
  21. Aghbashlo, M.; Tabatabaei, M.; Mohammadi, P.; Mirzajanzadeh, M.; Ardjmand, M.; Rashidi, A. Effect of an emission-reducing soluble hybrid nanocatalyst in diesel/biodiesel blends on exergetic performance of a di diesel engine. Renew. Energy 2016, 93, 353–368. [Google Scholar] [CrossRef]
  22. Shamshirband, S.; Tabatabaei, M.; Aghbashlo, M.; Yee, L.; Petković, D. Support vector machine-based exergetic modelling of a di diesel engine running on biodiesel–diesel blends containing expanded polystyrene. Appl. Therm. Eng. 2016, 94, 727–747. [Google Scholar] [CrossRef]
  23. Aghbashlo, M.; Shamshirband, S.; Tabatabaei, M.; Yee, L.; Larimi, Y.N. The use of ELM-WT (extreme learning machine with wavelet transform algorithm) to predict exergetic performance of a di diesel engine running on diesel/biodiesel blends containing polymer waste. Energy 2016, 94, 443–456. [Google Scholar] [CrossRef]
  24. Jafarmadar, S.; Nemati, P. Analysis of exhaust gas recirculation (EGR) effects on exergy terms in an engine operating with diesel oil and hydrogen. Energy 2017, 126, 746–755. [Google Scholar] [CrossRef]
  25. Aghbashlo, M.; Tabatabaei, M.; Mohammadi, P.; Khoshnevisan, B.; Rajaeifar, M.A.; Pakzad, M. Neat diesel beats waste-oriented biodiesel from the exergoeconomic and exergoenvironmental point of views. Energy Convers. Manag. 2017, 148, 1–15. [Google Scholar] [CrossRef]
  26. Mata, C.; de Oliveira Leite, W.; Moreno, R.; Agudelo, J.R.; Armas, O. Prediction of NOX emissions and fuel consumption of a city bus under real operating conditions by means of biharmonic maps. J. Energy Eng. 2016, 142, 04016018. [Google Scholar] [CrossRef]
  27. Sayin Kul, B.; Kahraman, A. Energy and exergy analyses of a diesel engine fuelled with biodiesel-diesel blends containing 5% bioethanol. Entropy 2016, 18, 387. [Google Scholar] [CrossRef]
  28. Sekmen, P.; Yılbaşı, Z. Application of energy and exergy analyses to a CI engine using biodiesel fuel. Math. Computational Appl. 2011, 16, 797–808. [Google Scholar] [CrossRef]
  29. Hoseinpour, M.; Sadrnia, H.; Tabasizadeh, M.; Ghobadian, B. Energy and exergy analyses of a diesel engine fueled with diesel, biodiesel-diesel blend and gasoline fumigation. Energy 2017, 141, 2408–2420. [Google Scholar] [CrossRef]
  30. Faizollahzadeh Ardabili, S.; Najafi, B.; Ghaebi, H.; Shamshirband, S.; Mostafaeipour, A. A novel enhanced exergy method in analyzing HVAC system using soft computing approaches: A case study on mushroom growing hall. J. Build. Eng. 2017, 13, 309–318. [Google Scholar] [CrossRef]
  31. Mostafaei, M.; Javadikia, H.; Naderloo, L. Modeling the effects of ultrasound power and reactor dimension on the biodiesel production yield: Comparison of prediction abilities between response surface methodology (RSM) and adaptive neuro-fuzzy inference system (ANFIS). Energy 2016, 115, 626–636. [Google Scholar] [CrossRef]
  32. Faizollahzadeh Ardabili, S. Simulation and comparison of control system in mushroom growing rooms environment. Master’s Thesis, Department of Mechanic of Agricultural Machinery Engineering, University of Tabriz, Tabriz, Iran, 2014. [Google Scholar]
  33. Cartwright, N. How the Laws of Physics Lie; Oxford Google Scholar; Oxford University Press: Oxford, UK, 1983. [Google Scholar]
  34. Hacking, I. Representing and Intervening: Introductory Topics in the Philosophy of Natural Science; Cambridge University Press: Cambridge, UK, 1983. [Google Scholar]
  35. Szargut, J. International progress in second law analysis. Energy 1980, 5, 709–718. [Google Scholar] [CrossRef]
  36. Rodríguez, L. Calculation of Available-Energy Quantities; ACS Publications: Washington, DC, USA, 1980. [Google Scholar]
  37. Ardabili, S.F.; Mahmoudi, A.; Gundoshmian, T.M. Modeling and simulation controlling system of HVAC using fuzzy and predictive (radial basis function, RBF) controllers. J. Build. Eng. 2016, 6, 301–308. [Google Scholar] [CrossRef]
  38. Yilmaz, I.; Kaynar, O. Multiple regression, ANN (RBF, MLP) and ANFIS models for prediction of swell potential of clayey soils. Expert Syst. Appl. 2011, 38, 5958–5966. [Google Scholar] [CrossRef]
  39. Gautam, R.; Panigrahi, S.; Franzen, D. Neural network optimisation of remotely sensed maize leaf nitrogen with a genetic algorithm and linear programming using five performance parameters. Biosyst. Eng. 2006, 95, 359–370. [Google Scholar] [CrossRef]
  40. Fathi, V.; Montazer, G.A. An improvement in RBF learning algorithm based on PSO for real time applications. Neurocomputing 2013, 111, 169–176. [Google Scholar] [CrossRef]
  41. Gundoshmian, T.M.; Ghassemzadeh, H.R.; Abdollahpour, S.; Navid, H. Application of artificial neural network in prediction of the combine harvester performance. J. Food Agric. Environ. 2010, 8, 721–724. [Google Scholar]
  42. Yilmaz, I.; Yuksek, G. Prediction of the strength and elasticity modulus of gypsum using multiple regression, ANN, and ANFIS models. Int. J. Rock Mech. Min. Sci. 2009, 46, 803–810. [Google Scholar] [CrossRef]
  43. Song, H.; Quinton, K.S.; Peng, Z.; Zhao, H.; Ladommatos, N. Effects of oxygen content of fuels on combustion and emissions of diesel engines. Energies 2016, 9, 28. [Google Scholar] [CrossRef]
Figure 1. Set-up for the engine tests.
Energies 11 00860 g001
Figure 2. The architecture of the ANN network.
Energies 11 00860 g002
Figure 3. Brake specific fuel consumption.
Energies 11 00860 g003
Figure 4. Temperatures of output exhaust gases.
Energies 11 00860 g004
Figure 5. Energy efficiency of the engine.
Energies 11 00860 g005
Figure 6. Exergy efficiency of the engine.
Energies 11 00860 g006
Figure 7. The optimum conditions for operating the engine based on energy and exergy efficiency for mathematical modeling. (a) Energy efficiency; (b) contours of Energy efficiency; (c) Exergy efficiency; (d) contours of Exergy efficiency; (e) Temperature; (f) contours of Temperature.
Energies 11 00860 g007
Figure 8. The optimum conditions for operating the engine based on energy and exergy efficiency for ANN-RSM method. (a) Energy efficiency; (b) contours of Energy efficiency; (c) Exergy efficiency; (d) contours of Exergy efficiency; (e) Temperature; (f) contours of Temperature.
Energies 11 00860 g008aEnergies 11 00860 g008b
Table 1. Biodiesel and diesel fuel blend properties.
Fuel Properties
Low Heating Value (MJ/kg)Density at 15 °C (g/cm3)Viscosity (CSt)Cloud Point (°C)Poor Point (°C)Fuel Type
42.570.8232.45−4−24Diesel
42.210.8312.78−2−19B10
41.780.8393.211.5−14B20
41.340.8443.564−12B30
40.890.8484.215−11B40
40.530.8574.726−9B50
40.110.8655.116−8B60
39.600.8685.837−6B70
39.220.8766.618.5−5B80
38.810.8827.019−3B90
38.430.8857.899−4B100
Table 2. The specification of engine.
Engine TypeSingle cylinder, air cooled vertical, totally enclosed compression ignition, four stroke cycle
CombustionDirect injection combustion system
No. of Cylinder1
Bore × Stroke (mm)87.5 × 110
Displacement Volume (cc)662
Compression Ratio17:1
Maximum Power5.52 kW
Engine SpeedConstant 1500 rpm
Table 3. The results of ANN training.
Number of NeuronsR2MSENumber of NeuronsR2MSE
12Energy Eff.0.93354.782516Energy Eff.0.9771.2979
Exergy Eff.0.954248.3648Exergy Eff.0.98853.9593
Temp0.9923112.4987Temp0.99962.41
10Energy Eff.0.97052.119318Energy Eff.0.98391.1877
Exergy Eff.0.982518.5176Exergy Eff.0.980820.1397
Temp0.995961.6531Temp0.999211.6233
14Energy Eff.0.94643.791
Exergy Eff.0.979222.7518
Temp0.996157.95
Table 4. The results of ANN testing.
ParameterRMSErMAE
Energy Efficiency1.02880.99250.7861
Exergy Efficiency4.38410.99072.5815
Exhaust Temoerature2.84110.99972.1847

