Wire Mesh Dampers for Semi-Floating Ring Bearings in Automotive Turbochargers: Measurements of Structural Stiffness and Damping Parameters


1
Department of Mechanical Engineering, Hanyang University, Ansan, Gyeonggi-do 15588, Korea
2
Department of Mechanical Design Engineering, Hanyang University, Seoul 04763, Korea
*
Author to whom correspondence should be addressed.
Energies 2018, 11(4), 812; https://doi.org/10.3390/en11040812
Submission received: 28 February 2018
/
Revised: 28 March 2018
/
Accepted: 29 March 2018
/
Published: 1 April 2018
(This article belongs to the Special Issue Recent Advances in Internal Combustion Engines Operation and Emissions)
Abstract
:The current work introduces a new semi-floating ring bearing (SFRB) system developed for improving the rotordynamic and vibration performance of automotive turbochargers (TCs) at extreme operation conditions, such as high temperature, severe external force excitation, and large rotor imbalance. The new bearing design replaces outer oil films, i.e., squeeze film dampers (SFDs), in TC SFRBs with wire mesh dampers (WMDs). This SFRB configuration integrating WMDs aims to implement reliable mechanical components, as an inexpensive and simple alternative to SFDs, with consistent and superior damping capability, as well as predictable forced performance. Since WMDs are in series with the inner oil films of SFRBs, experimentally determined force coefficients of WMDs are of great importance in the design process of TC rotor-bearing systems (RBSs). Presently, the measurements of applied static load and ensuing deflection determine the structural stiffnesses of the WMDs. The WMD damping parameters, including dissipated energy, loss factor, and dry friction coefficient, are estimated from the area of the distinctive local hysteresis loop of the load versus WMD displacement data recorded during consecutive loading-unloading cycles as a function of applied preload with a constant amplitude of motion. The changes in WMD loss factor and dry friction coefficient due to increases in preload are more significant for the WMDs with lower density. The present work shows, to date, the most comprehensive measurements of static load characteristics on the WMDs for application into small automotive TCs. More importantly, the extensive test measurements of WMD deflection versus increasing static loads will aid to anchor predictions of future computation model.
1. Introduction
Automotive turbochargers (TCs) provide pressurized air into internal combustion engines (ICEs) to increase engine output power and combustion efficiency with reduced NOx and CO2 emissions [1]. Bearing systems in automotive TCs must be simple, compact, reliable, and inexpensive while providing acceptable rotordynamic and noise, vibration, and harshness (NVH) characteristics. Figure 1 depicts a schematic view of a TC deploying semi-floating ring bearings (SFRBs). The journal bearing (i.e., the floating ring) is not stationary; it is free to float and move, but the anti-rotation pin prevents its rotation. Therefore, in SFRBs, the inner fluid film acts as a hydrodynamic (i.e., self-acting) fixed geometry plain journal bearing while the outer fluid film acts as a squeeze film damper (SFD). SFRBs are prone to show large subsynchronous rotordynamic responses over extended operating speed ranges [2]. Large cross-coupled stiffness coefficients of the inner fluid film are a typical drive of rotor-bearing system (RBS) instability [3]. See Refs. [4,5] for comprehensive review of relevant literature on rotordynamic behavior of automotive TCs supported on SFRBs (as well as fully FRBs).
SFDs in SFRBs enable acceptable limit cycle operation without failure even with persistent large amplitude subsynchronous whirl motions since SFDs introduce support flexibility and damping in the bearing structure [2,4,5]. In TCs, forced dynamic responses of the SFRBs strongly rely on viscosity of engine oil and thermal expansion of SFRB and bearing housing (BH) [6]. Note that TCs typically operate at extreme conditions, for example, exceeding 1000 °C of turbine inlet temperature while shaft rotating over 300 krpm. Moreover, the dimensional tolerance of SFDs in small automotive TCs are very critical since it dominates rotordynamic characteristics and shaft motion amplitudes [7].
SFDs have been used universally in aircraft engines, turbocompressors, and gas turbines to either reduce rotor imbalance (synchronous) response amplitudes while traversing RBS critical speeds or to improve rotordynamic stability. The forced performance of SFDs largely relies on the damper geometry and oil properties. References [8,9] present very extensive reviews of the literature on SFDs. It is important to note that SFDs are not off-the-shelf machine components and every SFD must be designed to fit the application [10]. In addition, in spite of the many prior advanced research on physical analysis and numerical modeling for SFDs, for example, [11,12,13,14], accurate and reliable prediction of SFD forced performance with experimental validation is still complicated.
Since 1970s, wire mesh dampers (WMDs) have been explored as promising soft damping elements for RBSs in high performance turbomachinery. WMDs provide a very effective mechanical energy dissipation mechanism from dry friction and material structural damping. WMDs offer distinctive advantages over SFDs, such as no oil requirement, no notable stiffness and damping variation due to supplied oil, no significant stiffness and damping variation due to temperature change, large damping at low excitation frequency, and easy manipulation of stiffness and damping by changing the wire mesh material, geometry, and mesh density. References [15,16] include comprehensive literature reviews on WMDs. Briefly, in 1978, Childs [17] presented WMDs as practical damping support components in an analysis for high pressure fuel turbopump (HPFTP) of the space shuttle main engine (SSME). Okayasu et al. [18] incorporated WMDs into a ball bearing supported rotor system to resolve subsynchronous vibration problems with the liquid hydrogen turbopump in the LE-7 rocket engines. Later, for implementation into RBSs for power turbines and cryogenic turbopumps, Vance and his students [19,20] conducted extensive experiments to investigate the effect of axial and radial preload as well as in increased temperatures and with oil entrainment. The test data shows that WMDs have material damping larger than the viscous damping provided by similar size SFDs. Ertas [21] investigated nickel-titanium (NiTi) shape memory alloy WMDs at 30% wire mesh density and demonstrates their superior damping capability to dampers made of conventional metals (steel, Inconel, and copper, for example). Recently, Chirathadam and San Andrés [22] and Feng et al. [23] used WMDs as a promising under-spring support structure in gas foil bearings which are self-acting (hydrodynamic) compliant gas bearings. For use in flexure pivot tilting pad hydrostatic gas bearings, Ertas [24] and Feng et al. [25] also used WMDs between the tilting pads and their housing to enhance energy dissipation characteristics of the gas bearings. It is important to note that in spite of many prior works, as described in the references above, there is still no commercial turbomachinery which implements WMDs for its RBS; therefore, the WMD lifetime performance is unknown yet [10].
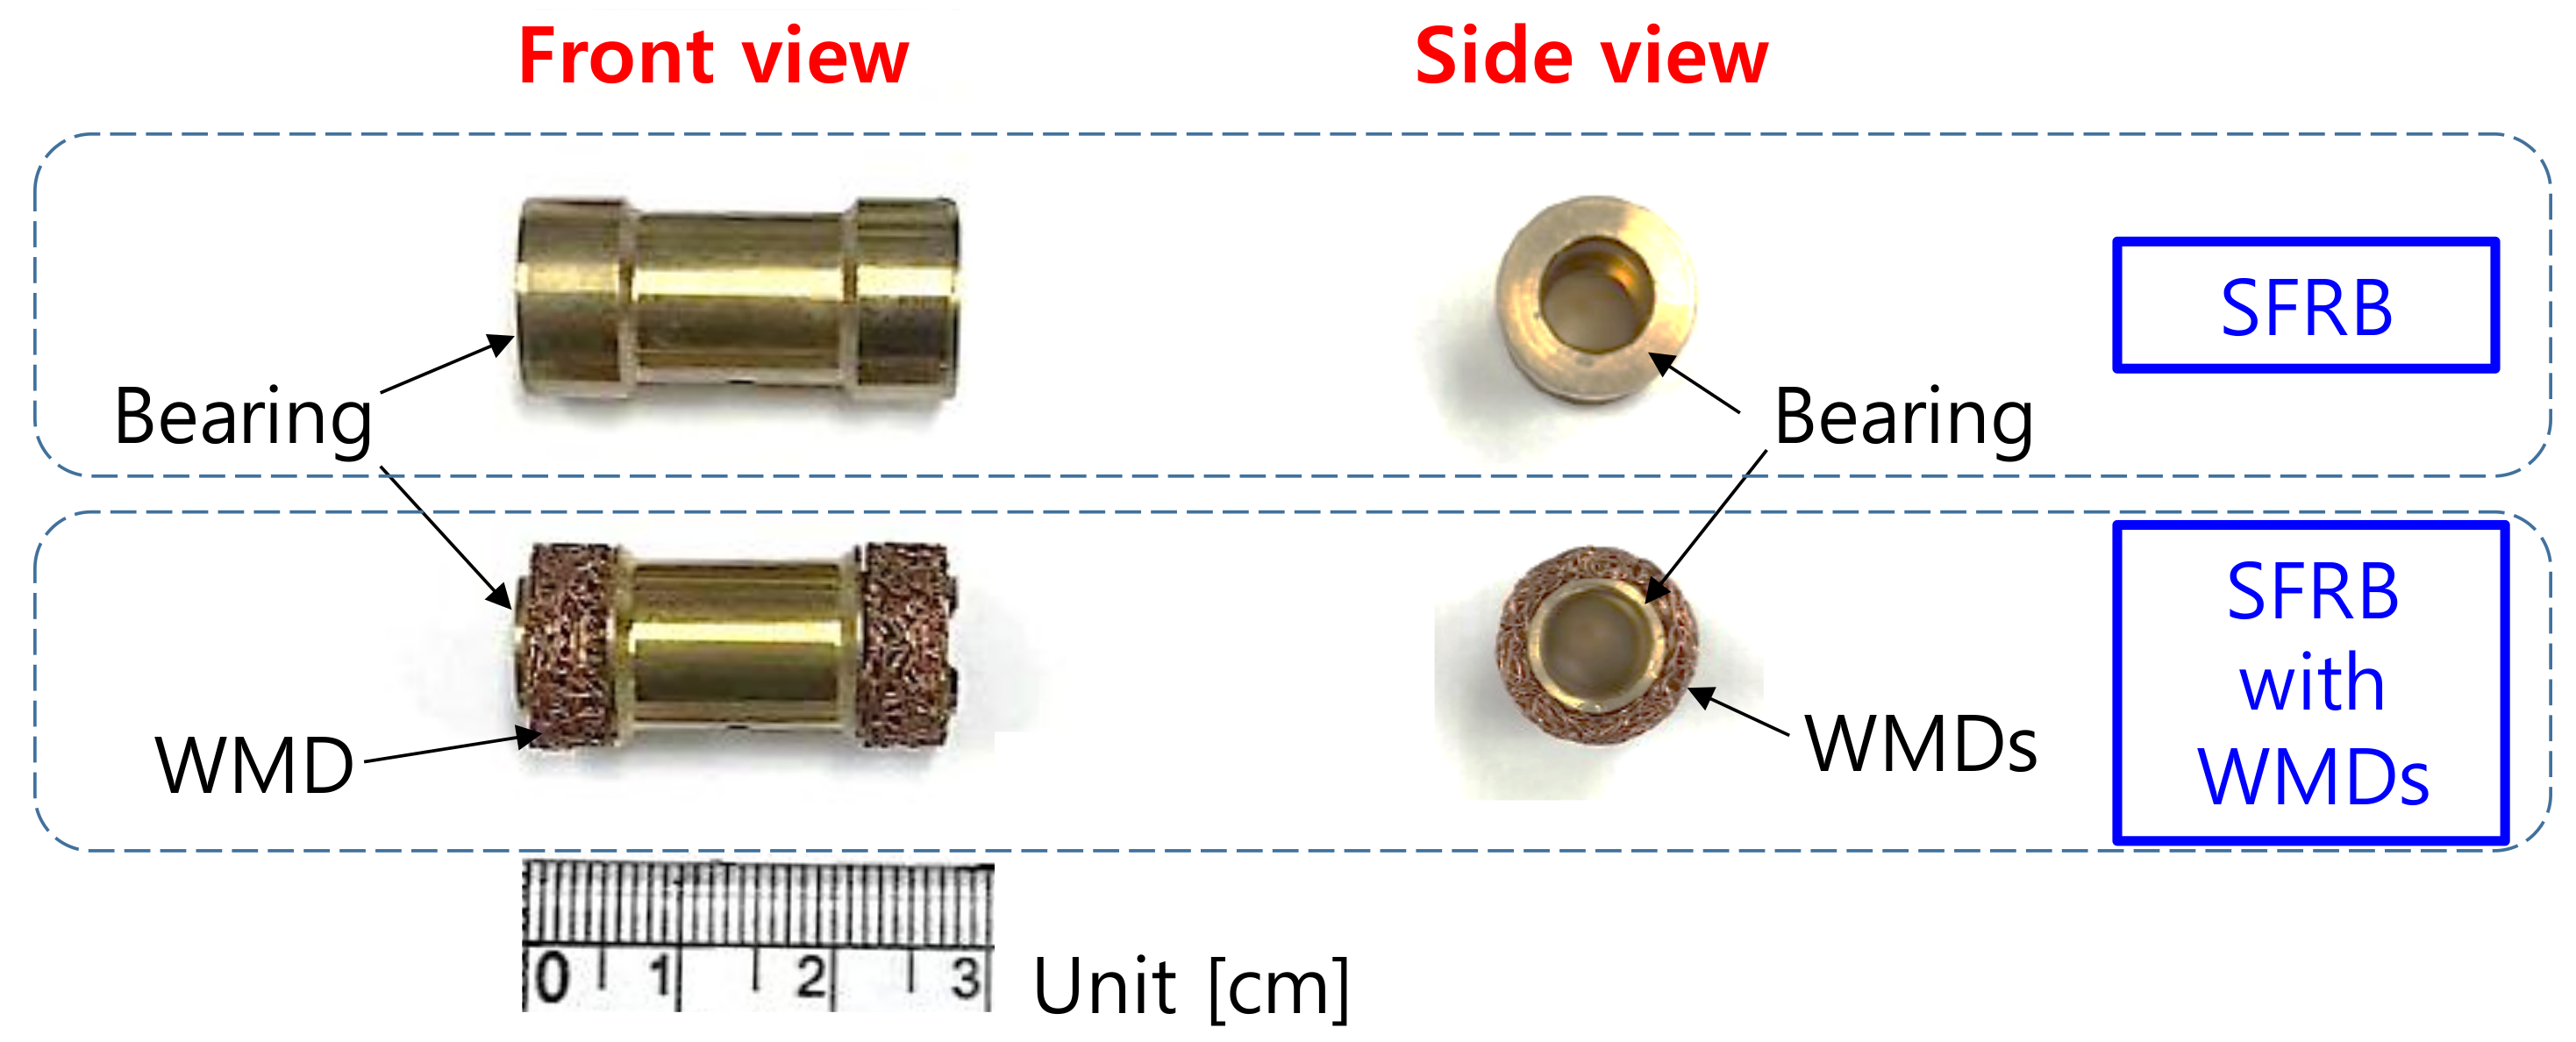
Within the framework of small automotive TC applications, in 2011, Ryu [26] introduced the concept of WMD supported SFRBs and described in details the design and principles of their operation. Figure 2 shows a single piece SFRB (top photographs) used in a commercial TC and the modified SFRB with the WMDs (bottom photographs). The WMD in Figure 2 is the actual test component used in the current work. More details on the test WMDs follow later in Section 2. For the modified SFRB, the WMD is inserted between the SFRB outer surface and TC BH inner surface as a substitute for the SFD. As shown in the bottom photographs of Figure 2, the outer surface of the SFRB has two circumferential pockets at each end for insertion of the WMDs. This configuration is able to reduce oil leakage through the outer gap (i.e., between the SFRB outer surface and TC BH inner surface), and is particularly effective when there is a large conical shaft motion. Note that, for passenger car TCs, improved damping mechanism introduced by WMDs reduces bearing transmitted force to the BH, thereby improving vehicle NVH characteristics.
Experimental identification of force coefficients with reliable testing and independent measurement database is a necessity when implementing WMDs into automotive TCs. This paper details measurements of structural force coefficients of the WMDs made of copper. A further focus of the study is the investigation of the damping parameters, such as dissipated energy, loss factor, and dry friction coefficient.
2. Experimental Facility and Procedure
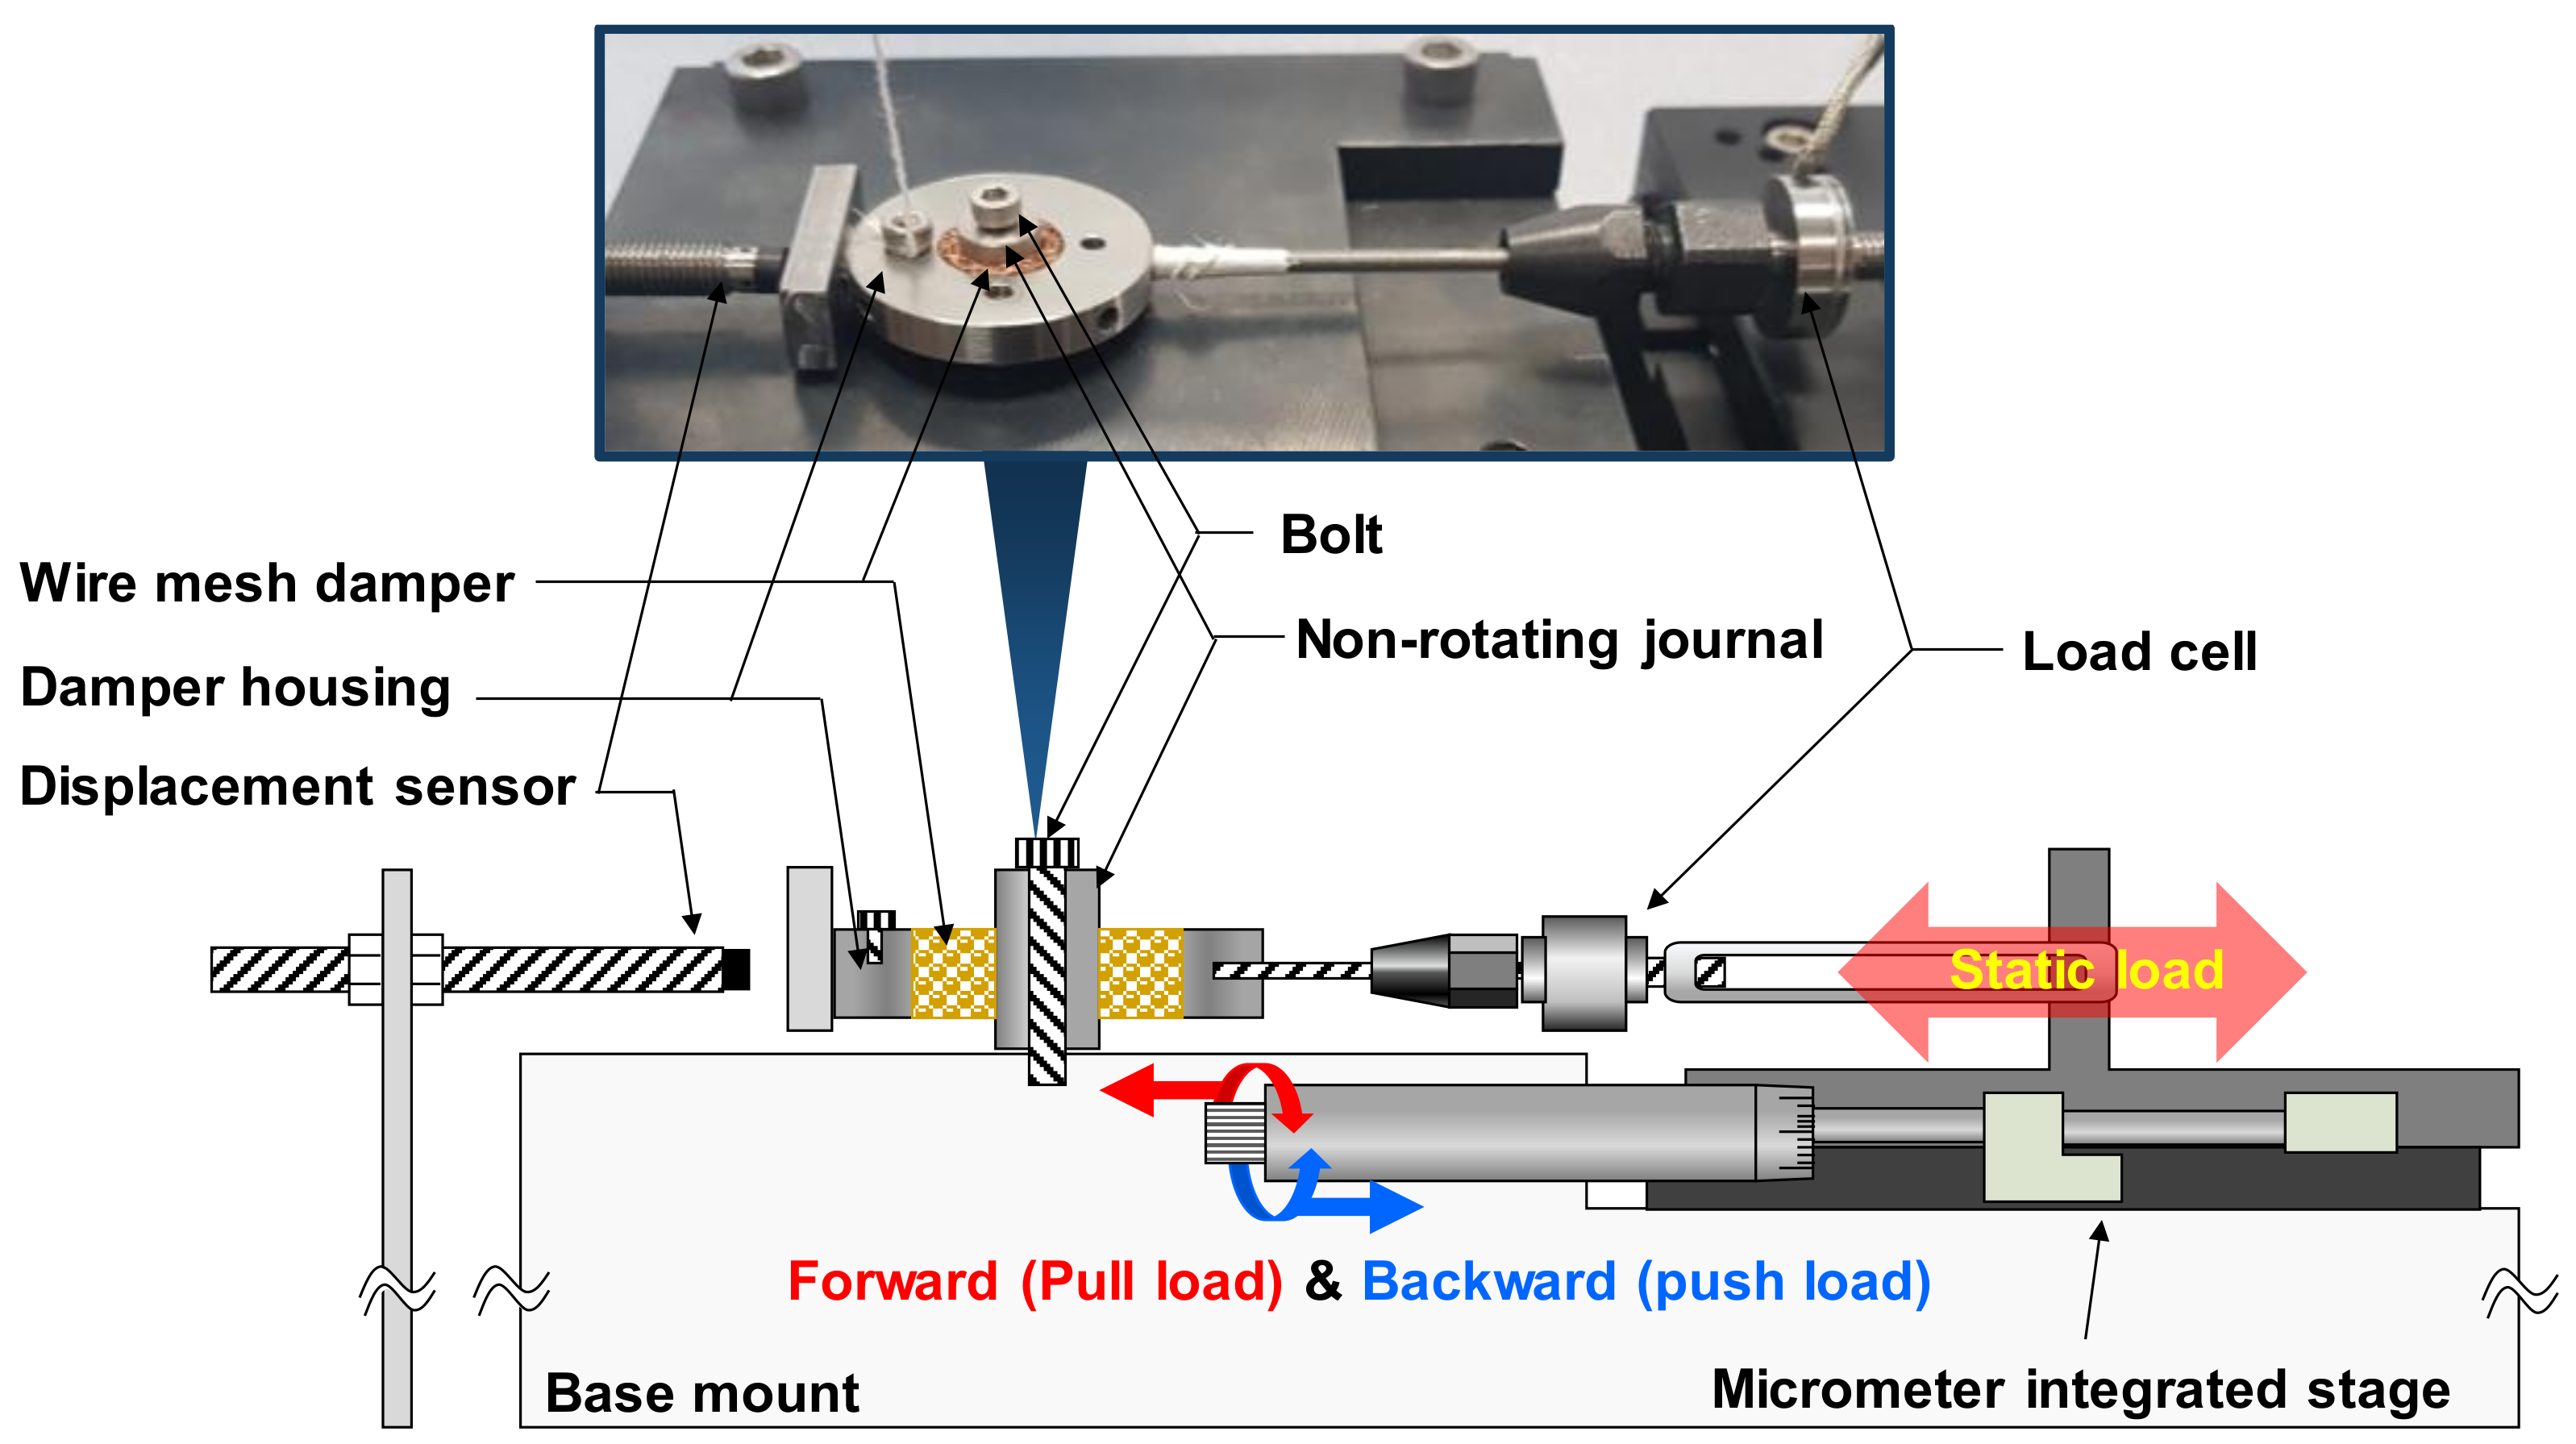
Figure 3 depicts a schematic view (not to scale) and photograph of the test setup to perform unidirectional static load tests with the copper WMD resting on the non-rotating journal. The short and rigid AISI 4140 journal with an outer diameter of 9.020 ± 0.001 mm is mounted on a test base. Within the present load ranges, there is no undesirable elastic deflection of the journal. The test WMD is inserted into the damper housing (inner diameter 13.435 ± 0.003 mm and outer diameter 33.430 ± 0.001 mm). Both the journal outer surface and damper housing inner surface are bare, i.e., no coating or special treatment is applied on their surfaces. Recall that, in an actual TC assembly, the WMDs are fit between SFRB outer surface and BH inner surface as shown in Figure 2. A calibrated strain gauge type load cell is affixed on an accurate micrometer-integrated stage to exert push and pull (compression or forward) loads into the test WMD. An eddy current displacement sensor records the displacements of the damper housing which contains the test WMD. Uncertainties for the load cell and eddy current sensor are ±0.356 N and ±0.04 V/mm, respectively. Presently, measurements are conducted at room temperature only without oil lubrication. As detailed in [19,20], WMDs do not show notable performance changes when tested at extreme temperature conditions even when soaked in lubricating oil.
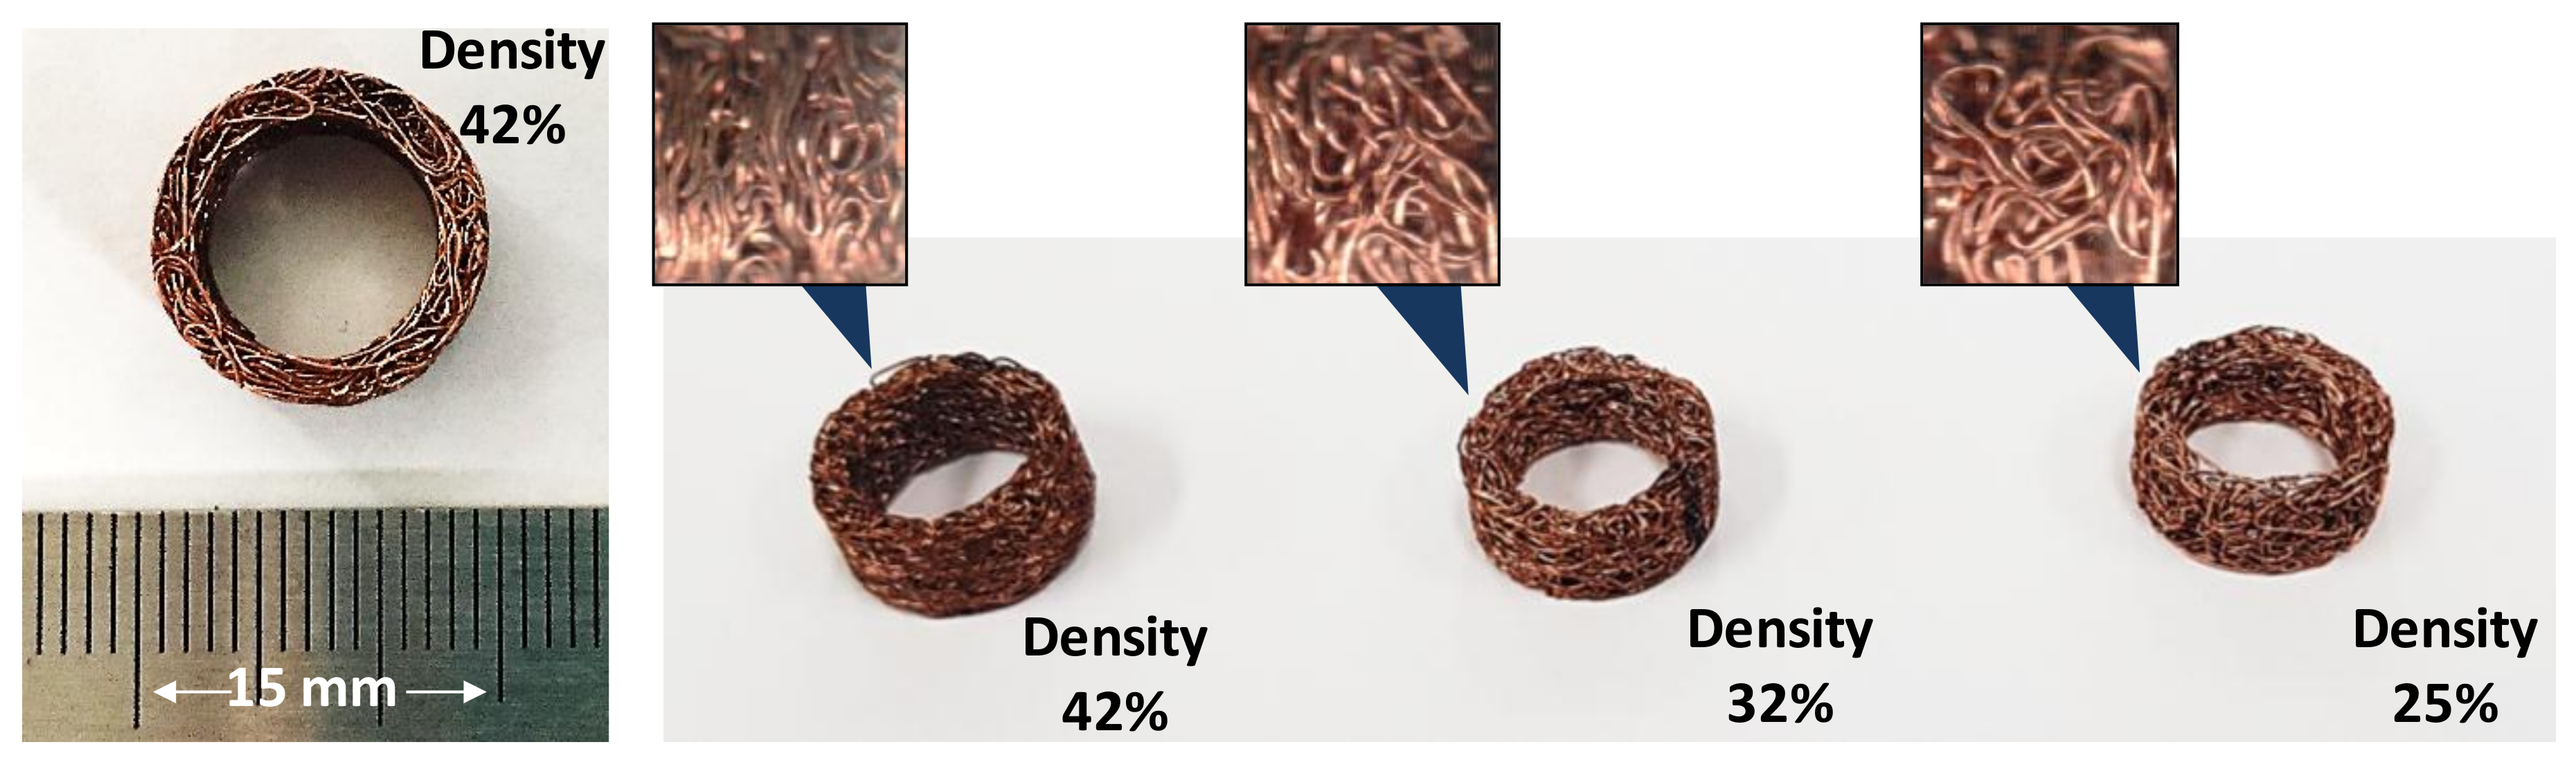
Figure 4 depicts photographs of the three test WMDs. Table 1 lists the measured dimensions of the test WMDs. The three dampers are made of thin coper wire, with a diameter of 0.195 ± 0.001 mm, compacted to densities of 42%, 32%, and 25%, respectively. Density, Young’s modulus and Poisson’s ratio of copper are 8.9 g/cm3, 121 GPa (at room temperature) and 0.33, respectively [27]. Appendix A details the manufacturing process for the test WMDs. Small differences among the inner and outer diameters of the test WMDs produce slightly different assembly fits with the journal and damper housing. Actual operation in a TC will also render various assembly fits or interferences of WMDs because of extreme thermal gradient along the BH and shaft.
3. Identification Procedure of WMD Structural Stiffness and Damping Parameters
The current test setup, detailed in Section 2, allows us to establish a simple analytical model of a one-degree-of-freedom mechanical system for the WMD with structural stiffness and equivalent damping parameters. Measurements from a series of (applied static) load versus displacement (due to WMD deflection) aid to determine the forced performance of the test WMDs. Note that the static load-deflection test offers substantial savings in cost and time to determine the energy dissipation characteristics of mechanical components with compliant structures since the identified structural parameters from the area inside the hysteresis loop of the static load versus the deflection curve show remarkable agreement with those obtained from dynamic load tests (at low excitation frequency, in particular) [28,29]. The current study presents average values of the identified parameters from three non-sequential and independent measurements of push-pull loads and WMD displacements. Appendix B lists the uncertainty of the identified parameters.
3.1. Structural Stiffness
Practically, dividing small changes in static load (ΔFStatic) by the corresponding changes in WMD displacements (Δx) determines the static structural stiffness coefficient of the test WMDs. As detailed in a later section (Section 4.1), presently, a polynomial curve fit renders an analytical relation between the static load and the WMD deflection. Therefore, the FB structural stiffness (KS) is the first spatial derivative of the curve fit, i.e., .
3.2. Damping Parameters
To identify damping parameters in a mechanical system, it is important to understand the mechanisms of energy dissipation (typically converted into internal thermal energy) in the system. The mechanical energy dissipation mechanism in a WMD is a combination of internal (material) damping and structural damping generated by dry-friction due to relative motions between rubbing surfaces in the system components. Because of the damping, the displacement (x) and applied force (FStatic) possess a corresponding mechanical hysteresis loop. That is, the area of the hysteresis loop (ΔEdis = = cyclic integral of applied force with respect to displacement) represents the net work done against the damping force. Ready evaluation of structural damping loss factor (γ, or loss coefficients) follows from the hysteresis loop, i.e., γ = {ΔEdis/(πX2)} × (1/KLcal), where KLocal is a measured average slope of the (local) force-displacement loop and X is the maximum displacement amplitude of the loop [30]. Above, ΔEdis/(πX2) represents hysteric damping constant (h), i.e., h = ΔEdis/(πX2). In addition, when damping is relatively low, the hysteresis logarithmic decrement (δ) can be defined as δ ≈ 2πζeq ≈ πγ = πh/KLocal, where ζeq is the system equivalent damping ratio. Hence, ζeq is ~50% of loss factor, that is ζeq = γ/2 for low damping, see [31,32] for more details. Note that loss factor relies on not only the amount of dissipated energy but also stiffness of the compliant structure [33].
Furthermore, for structural-type damping by considering the work done by the friction force, the energy dissipated over a complete cycle can be represented as Edis = αX2, where α = (sliding friction force) × (4/X) and X is the displacement amplitude, see [30] for complete details of the derivation of this equation. Above, the sliding friction force is f = μfN, where μf is the coefficient of sliding friction (i.e., dry friction coefficient) and N is the normal force acting on the contact surface. Since the structural damping loss factor is γ = α/(πKS) = 4f/(πKSX), where KS is a structural stiffness coefficient, the dry friction coefficient is μf = Edis/(4NX) = γ(π/4)(KSX/N) = 0.785γ(KSX/N). Note that this expression reveals that the effect of structural damping resembles internal damping. This approximation should be employed with caution since it assumes mechanical energy dissipation in WMDs is primarily due to dry friction.
4. Experimental Results and Discussion
4.1. Structural Stiffness from Full Hysteresis Loop Measurements
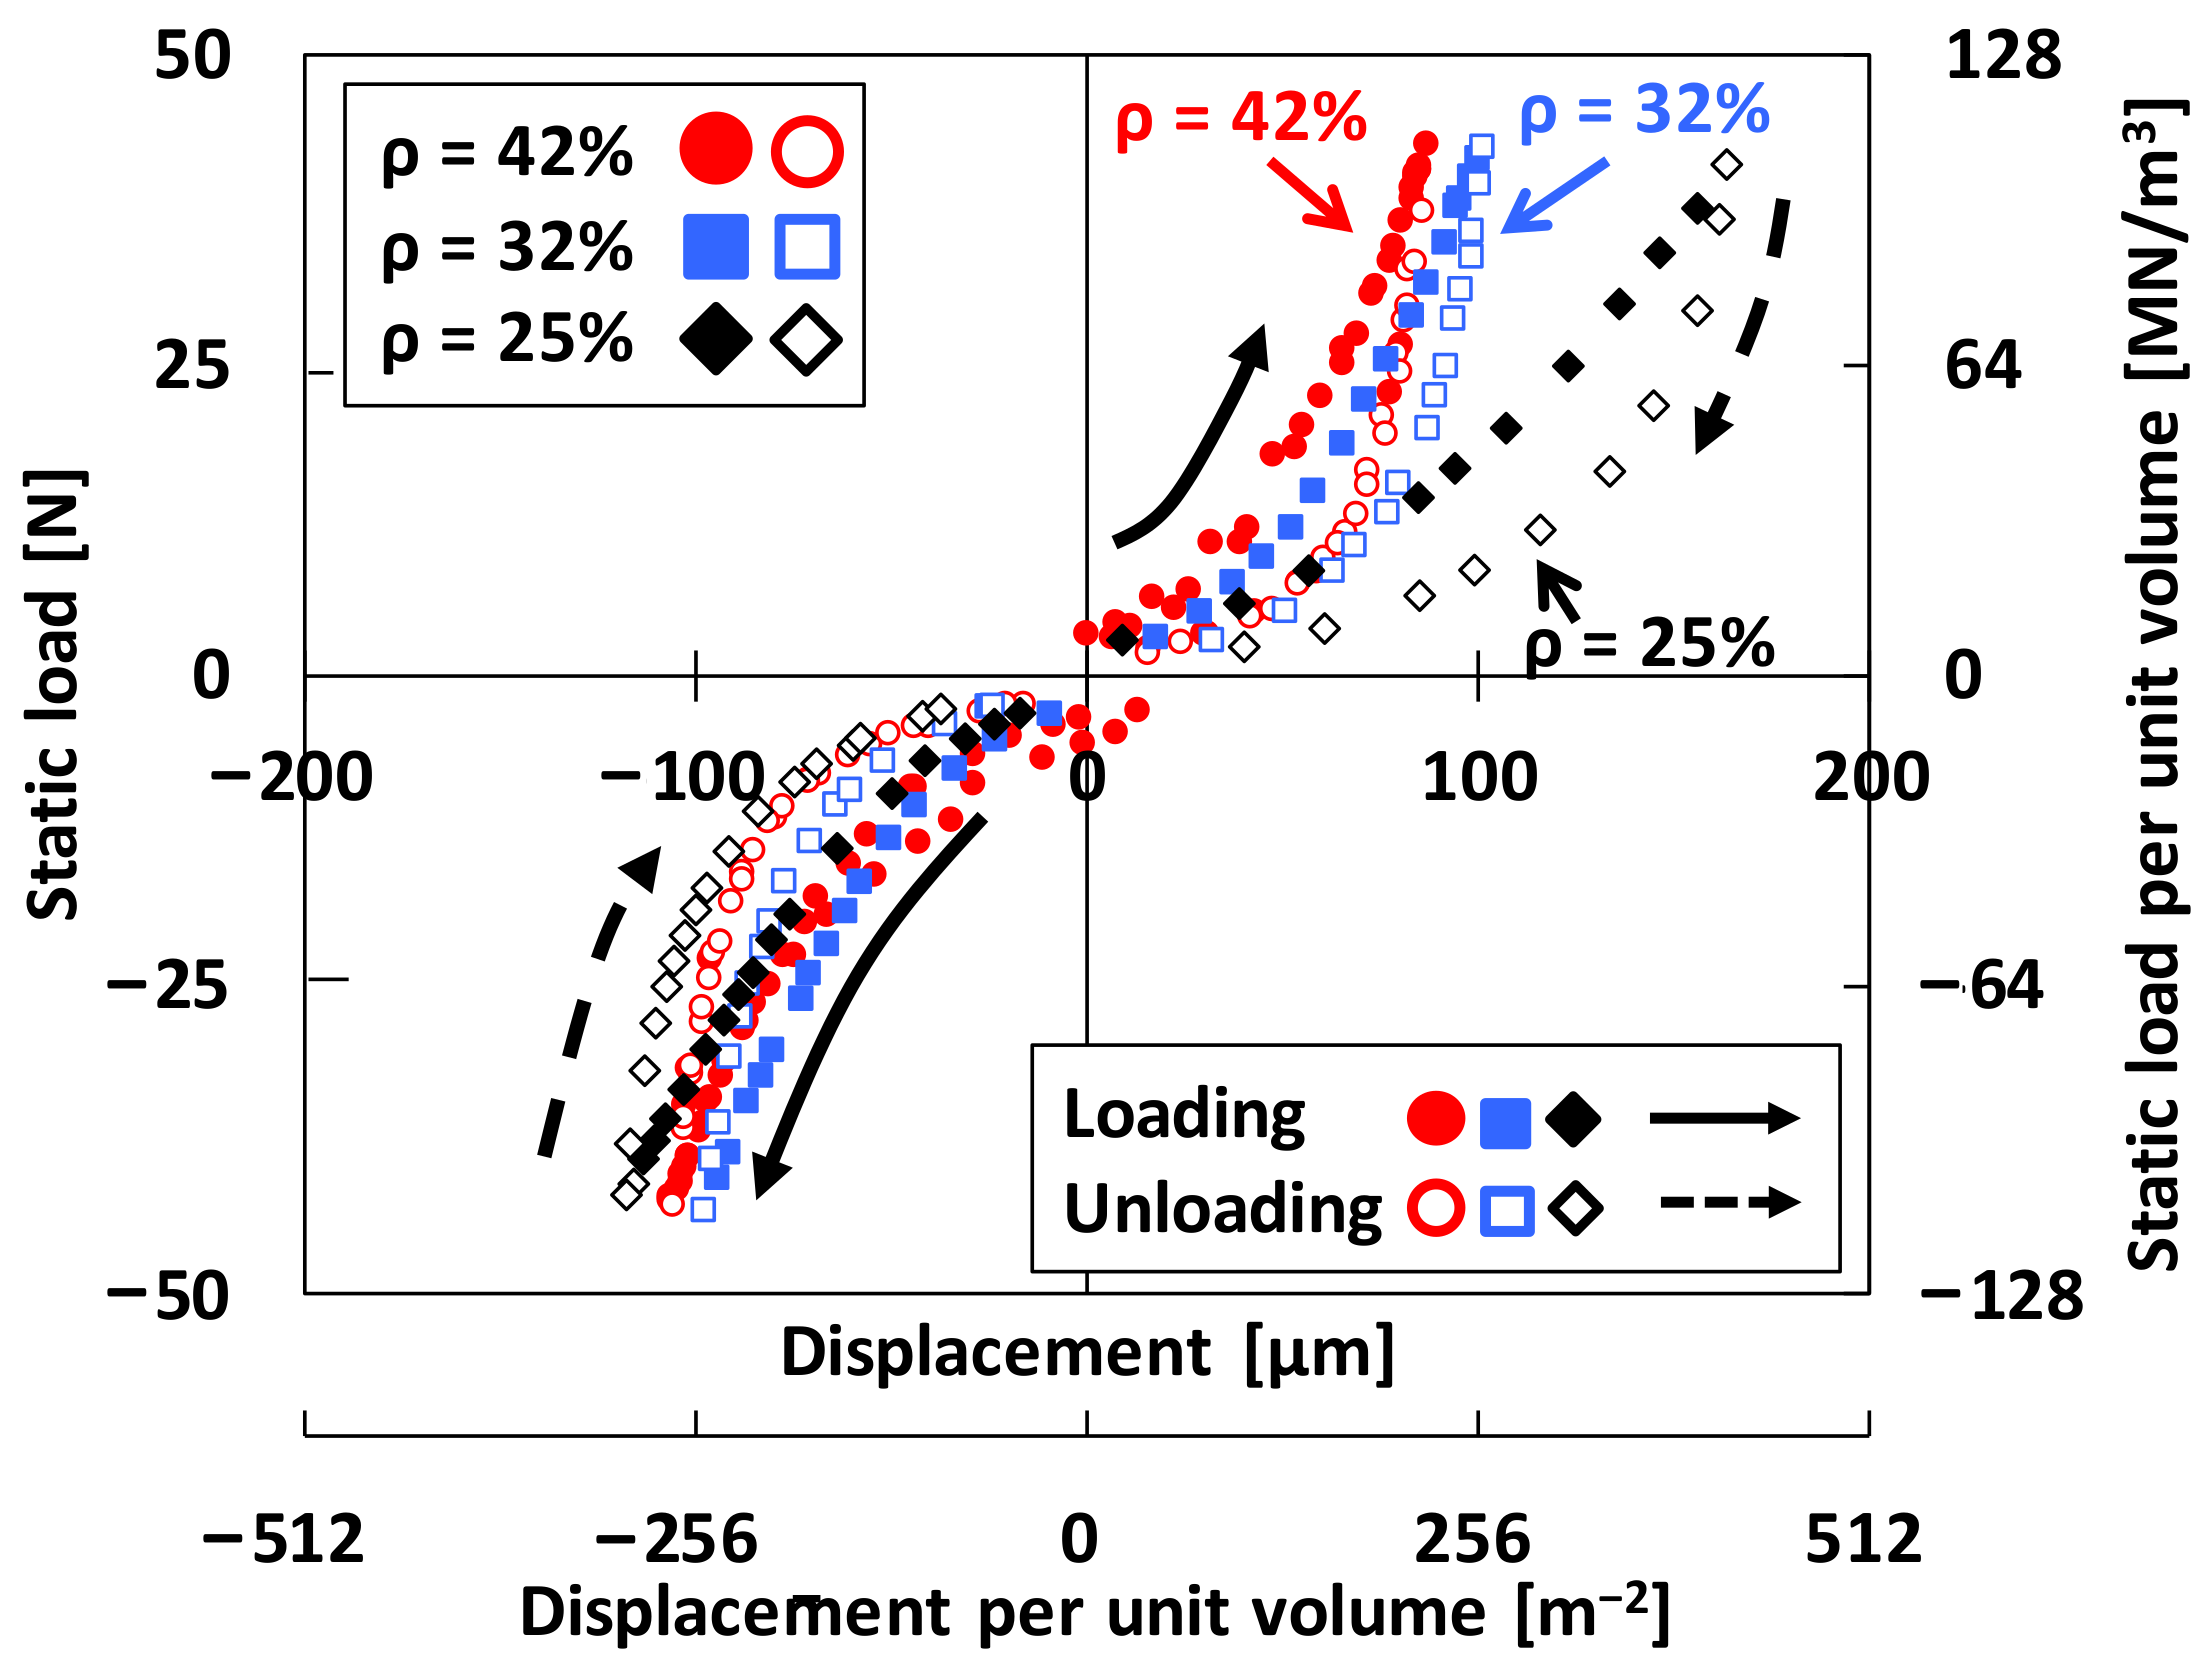
Figure 5 depicts the measured applied static load (FStatic) versus recorded WDM displacement (i.e., deflection = x), as well as versus WMD displacement per unit volume (= WMD displacement divided by volume of each test WMD). In the figure, the right vertical axis displays FStatic per unit volume of the WMD. The WMD forced deflections are nonlinear during repeated loading-unloading cycles with a noticeable hysteresis loops evidencing dissipated mechanical energy. The hysteresis loops in Figure 5 clearly shows the structural and internal damping effects of the test WMDs. Note that the increase in displacements for the WMD with ρ = 25% is more significant than the WMDs with ρ = 32% and ρ = 42% when the applied loads are same.
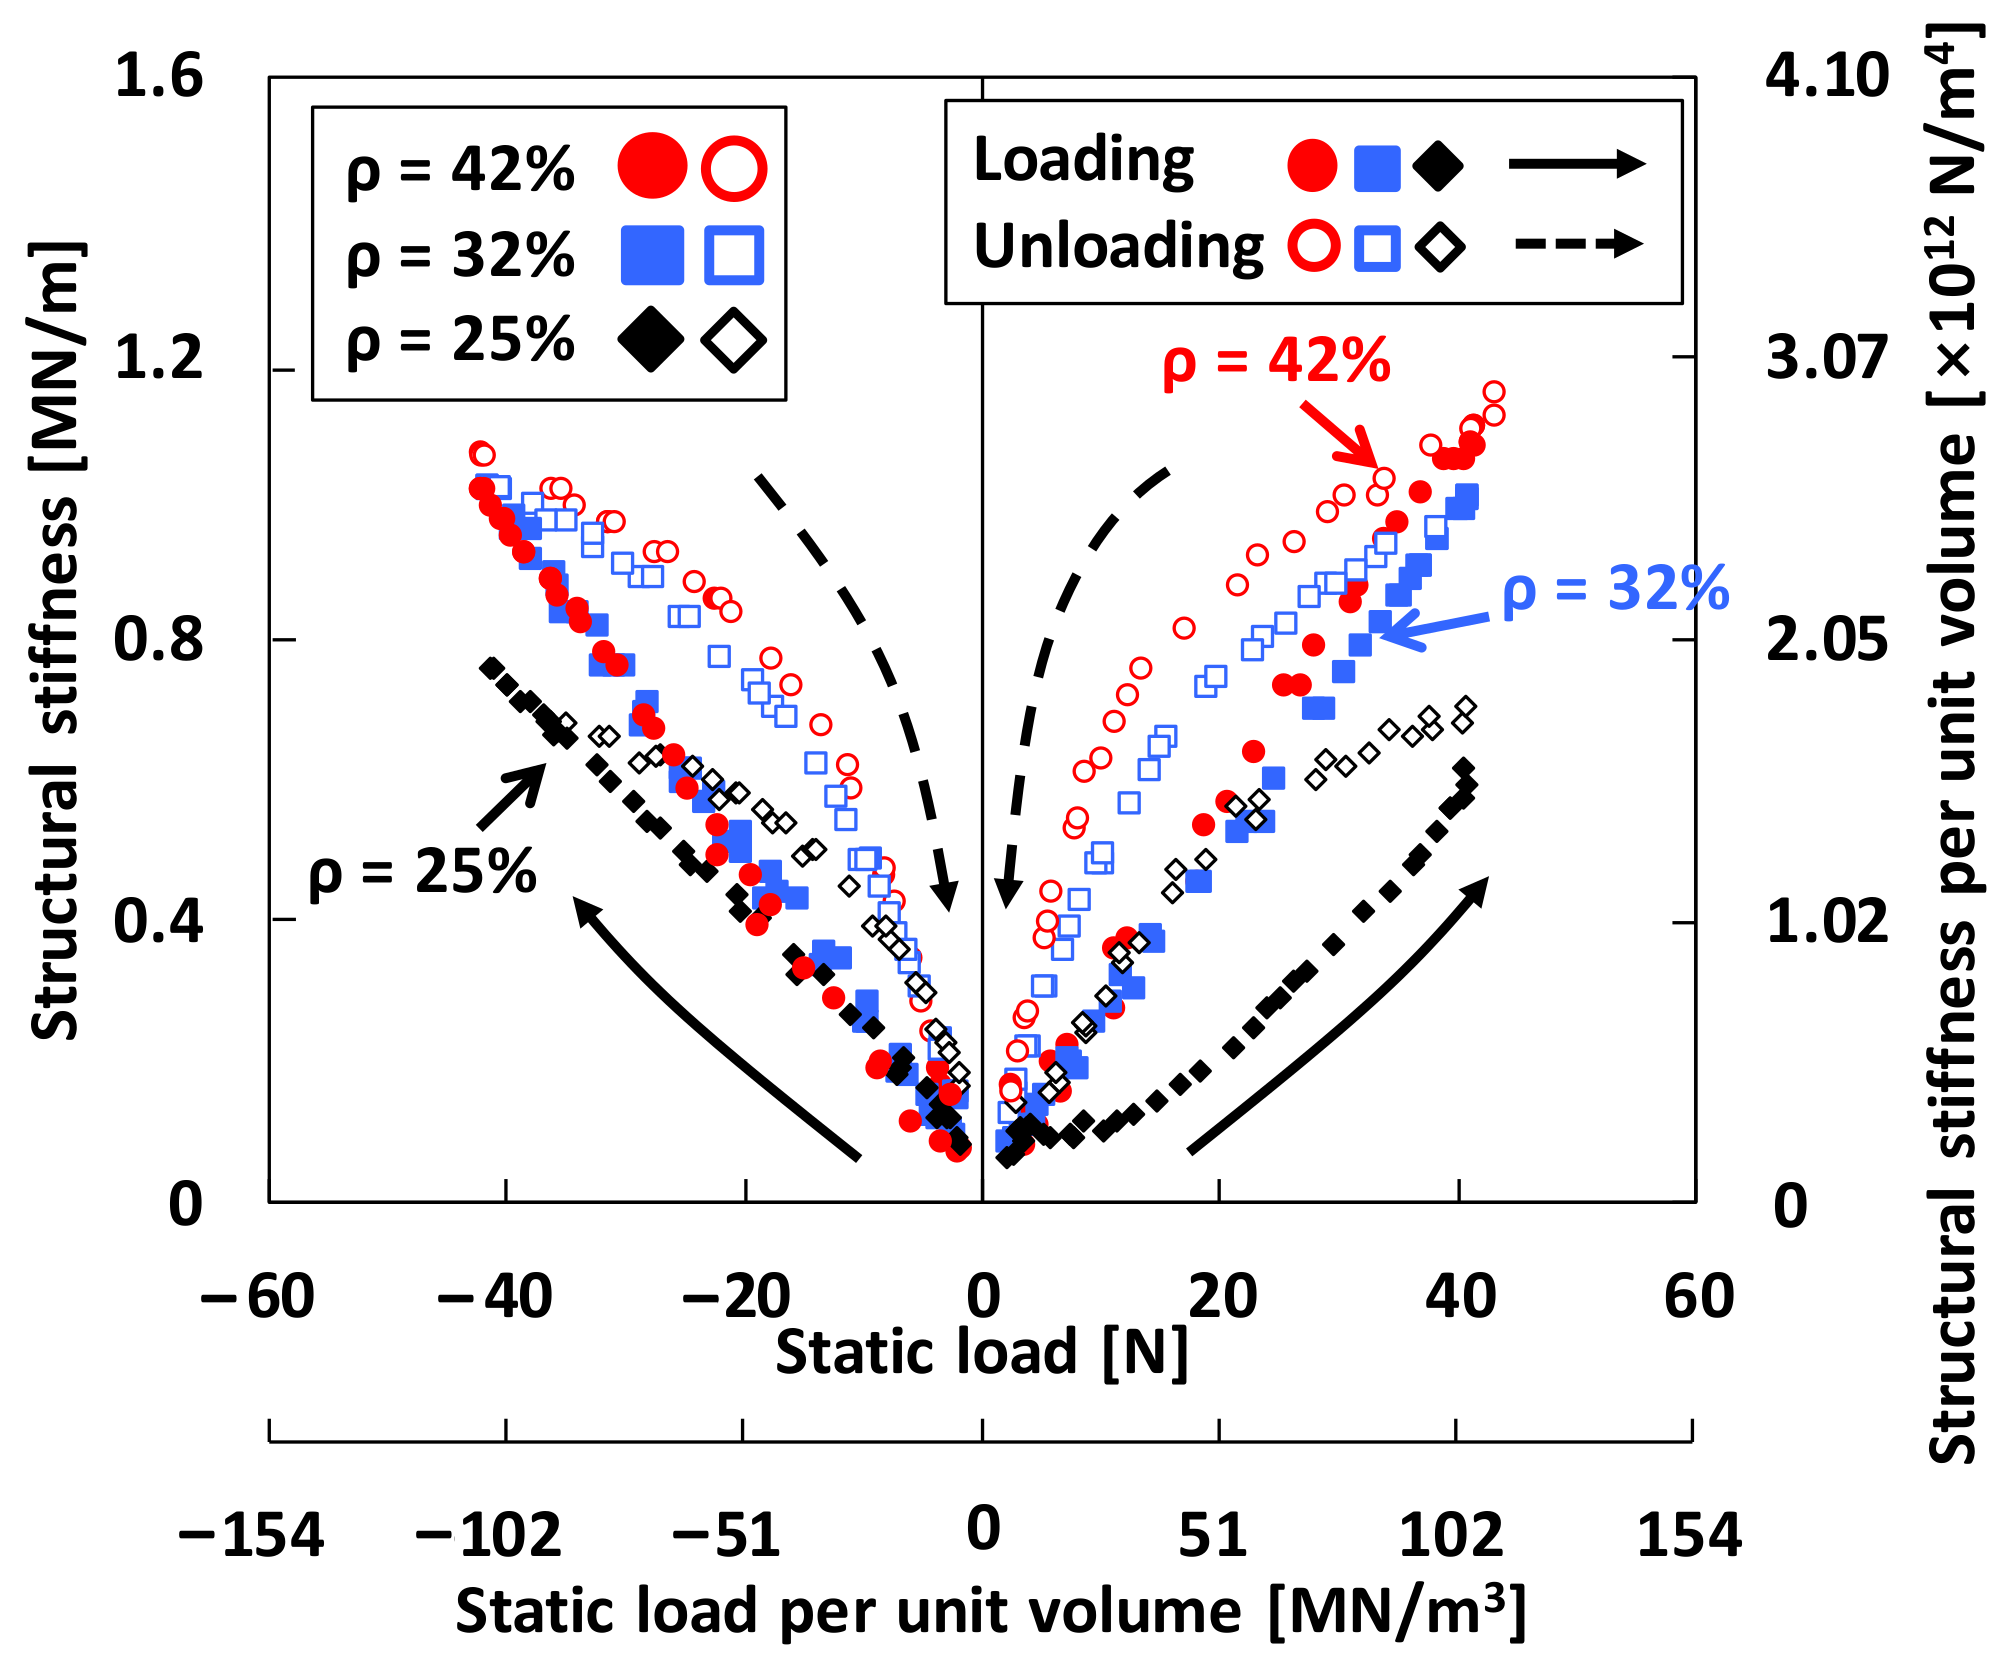
To estimate the WMD structural stiffnesses, the static load (FStatic) versus displacement (x) curves in Figure 5 are fitted through third order polynomial functions (i.e., FStatic = K0 + K1x + K2x2 + K3x3 where K1, K2, and K3 are constants obtained from the measurement data). The goodness of fit is above 99.99% for all test data. The slop of fitted third order polynomial functions (i.e., the first spatial derivative of the curve fit) present structural stiffnesses of the test WMDs from the full hysteresis loops, i.e., . Figure 6, depicting the identified WMD structural stiffnesses (KS) versus applied static load, shows a distinctive load dependency of KS. The right vertical axis and the lower horizontal axis display KS per unit volume of the WMD and FStatic per unit volume of the WMD, respectively. In the graph, the stiffnesses for the loading conditions are denoted as solid symbols (●, ■, and ◆) while the stiffnesses for the unloading conditions are denoted as empty (i.e., no fill) symbols (○, □, and ◇); the circle (● and ○), square (■ and □), and diamond (◆ and ◇) symbols denote the stiffnesses of the WMDs with 42%, 32%, and 25% densities, respectively. Under the identical load conditions, the WMD stiffnesses during the loading procedures (i.e., energy expended conditions), KFull_Loading, are always lower than those during the unloading procedures (i.e., energy recovered conditions), KFull_Unloading, i.e., KFull_Loading < KFull_Unloading when the identical loads are applied. Note that KS is almost negligible at no load condition (i.e., applied load = 0 N) since there is no installation interference between the test WMD and the damper housing.
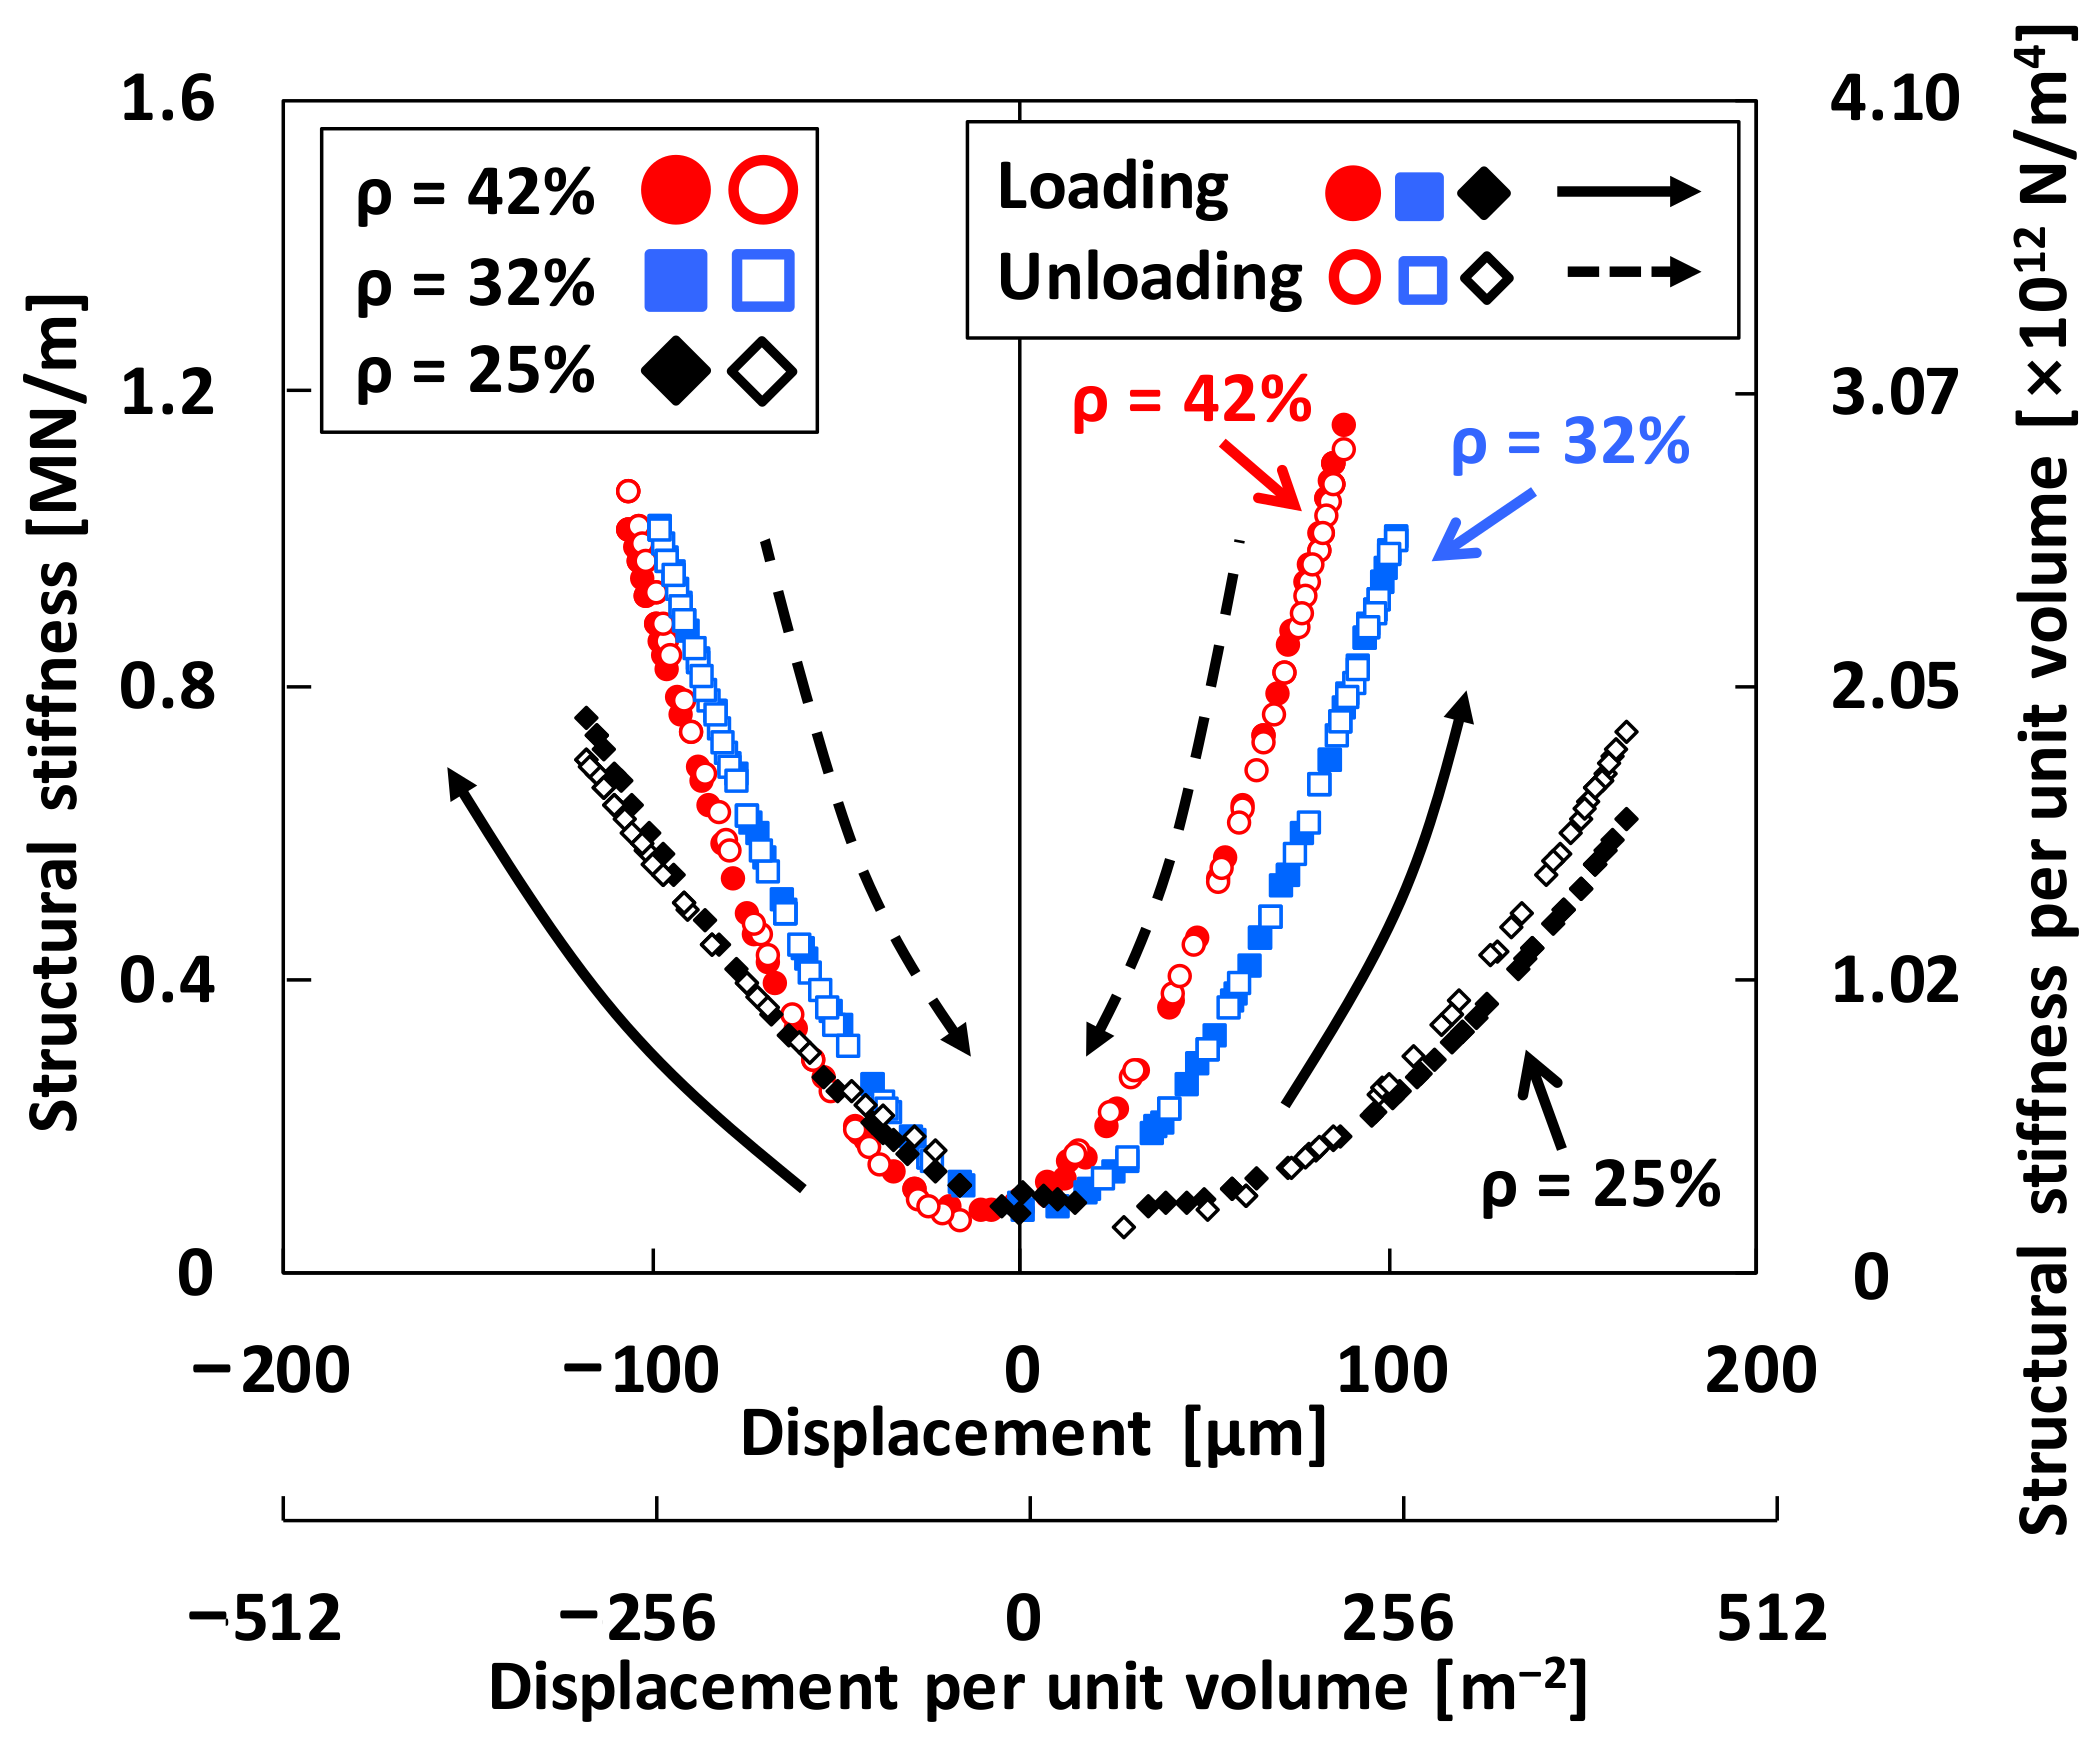
Figure 7 depicts the identified WMD structural stiffnesses (KS) and per-unit-volume structural stiffnesses versus WMD displacement (x), as well as versus WMD displacement per unit volume of the WMD. The WMD stiffness shows a hardening effect as the damper deflection increases thereby providing typical nonlinear stiffness characteristics.
The structural stiffness of the WMD with ρ = 42% increases more rapidly than others as the WMD deflection increases. Under the identical displacement conditions, KFull_Loading is nearly same with KFull_Unloading, i.e., KFull_Loading ≈ KFull_Unloading when the WMD deflections are same.
4.2. Structural Stiffness and Damping Parameters from Local Hysteresis Loop Measurements
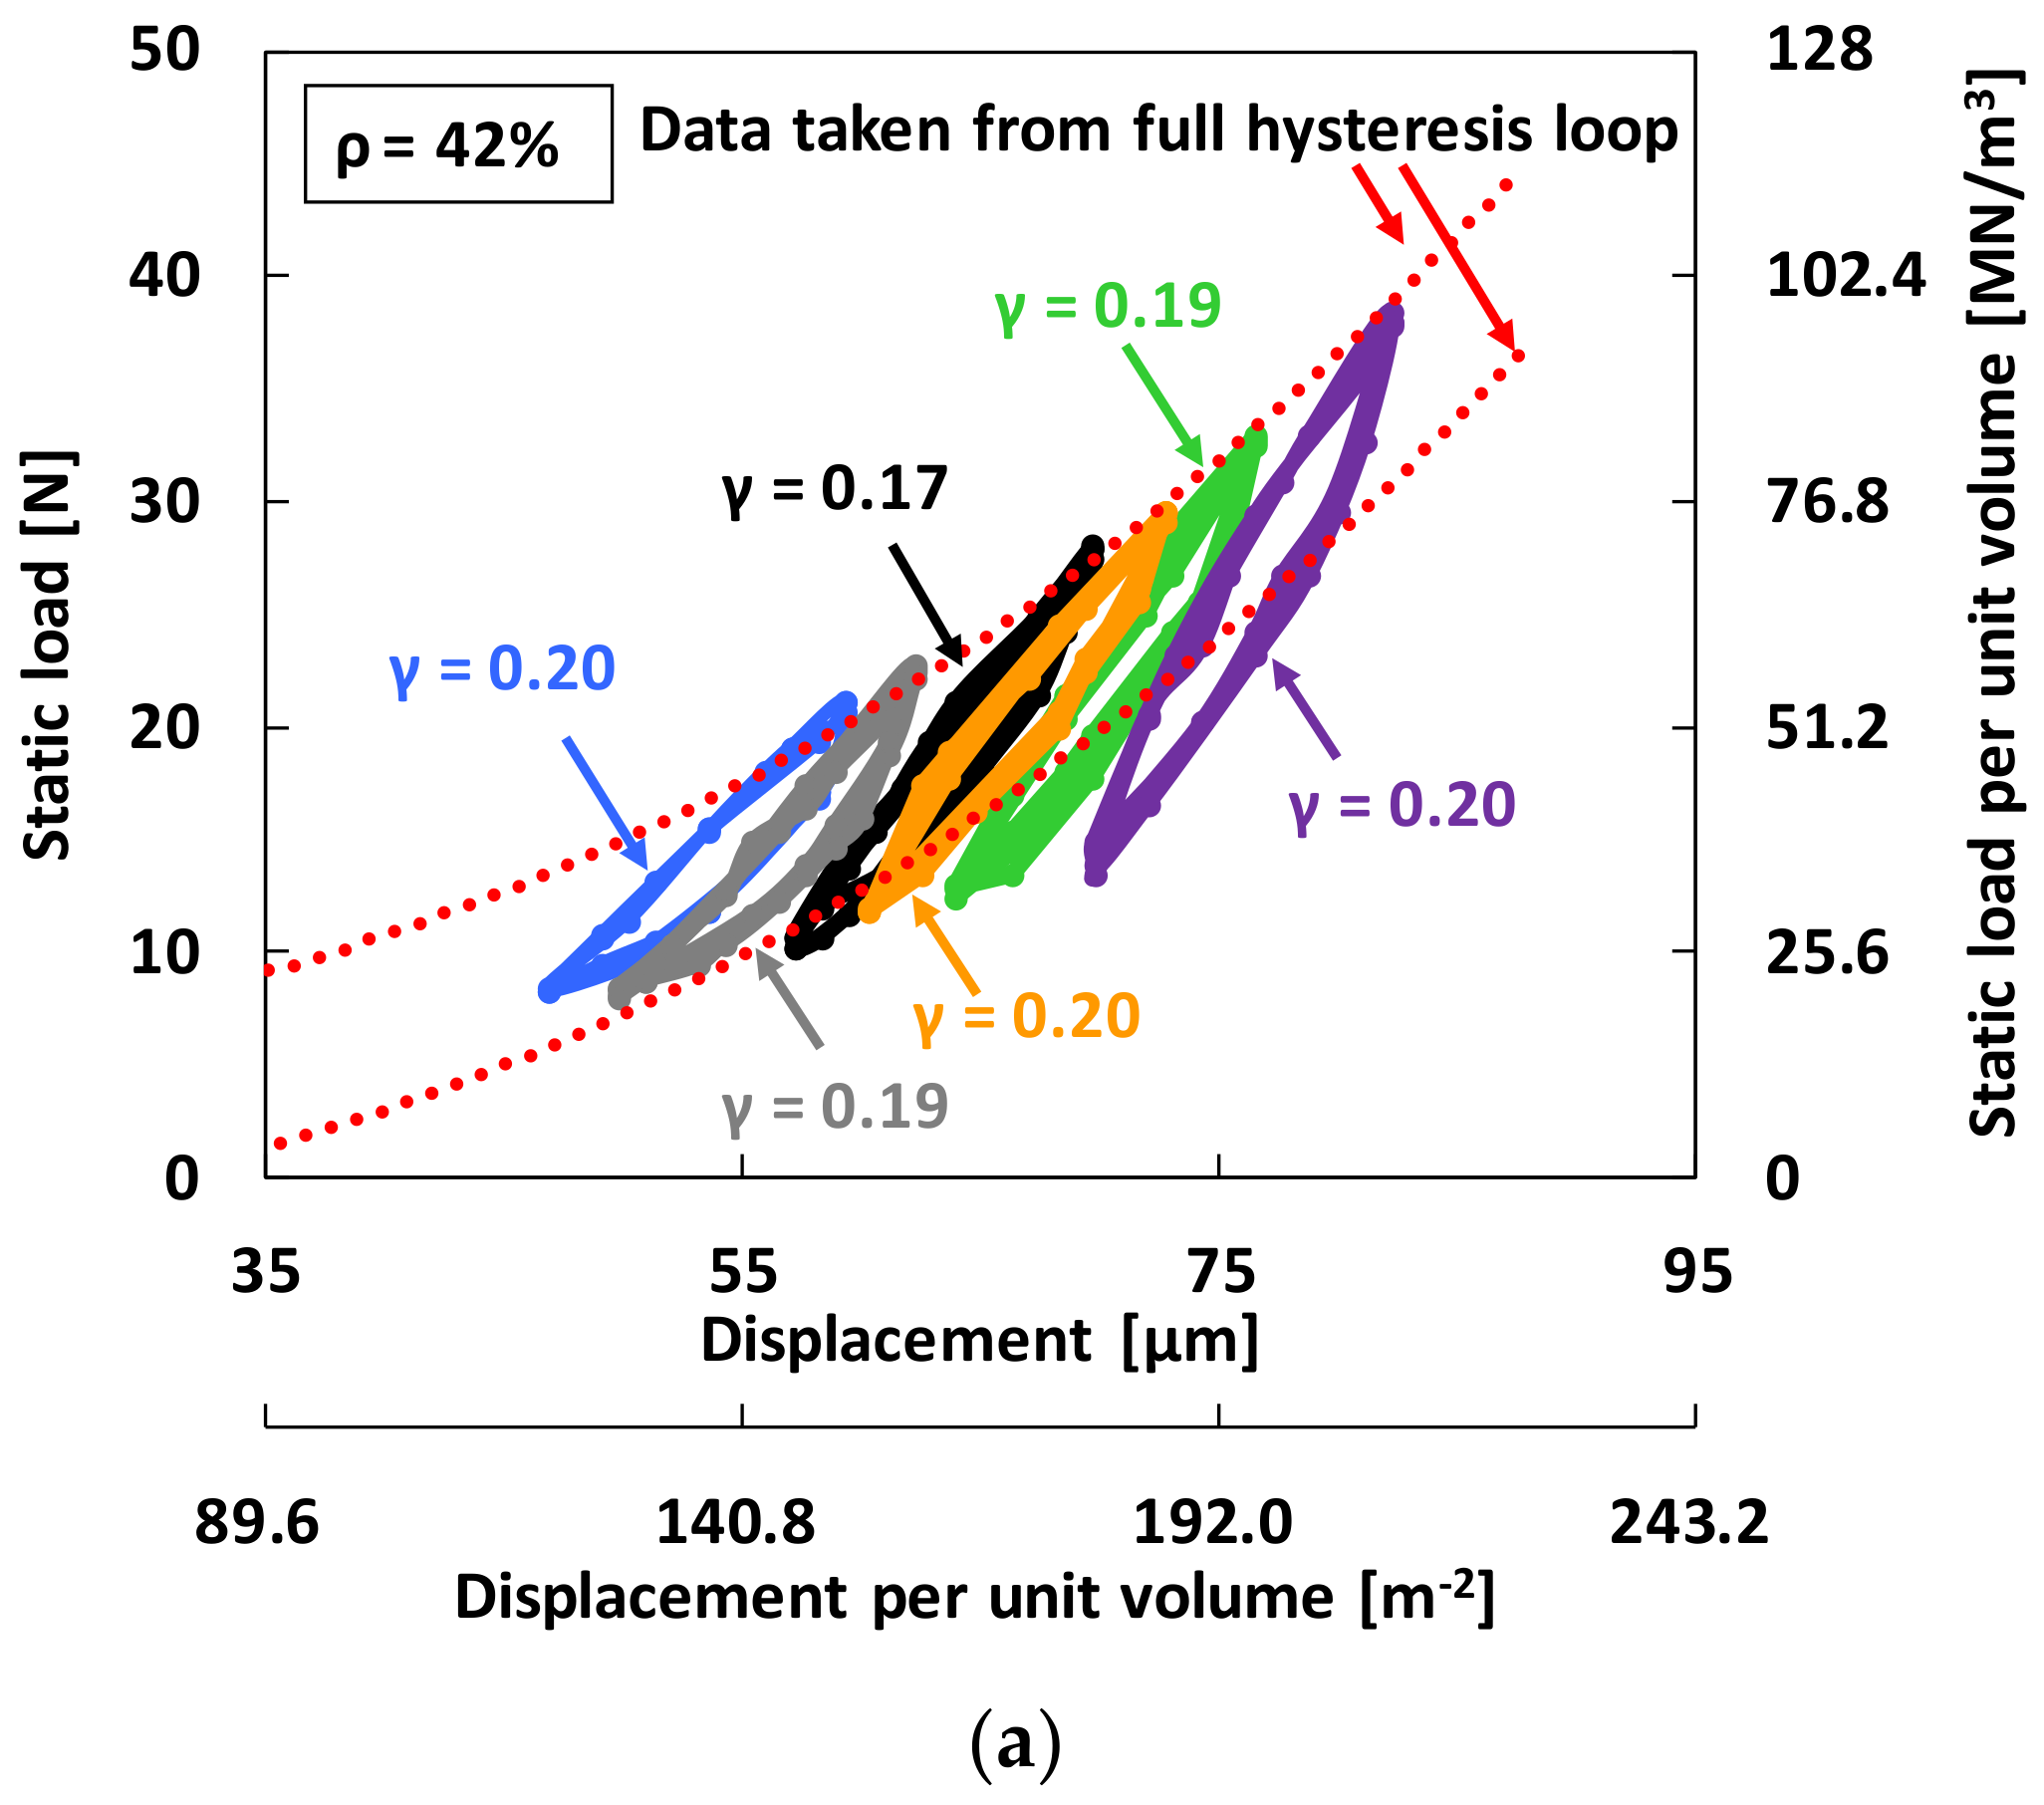
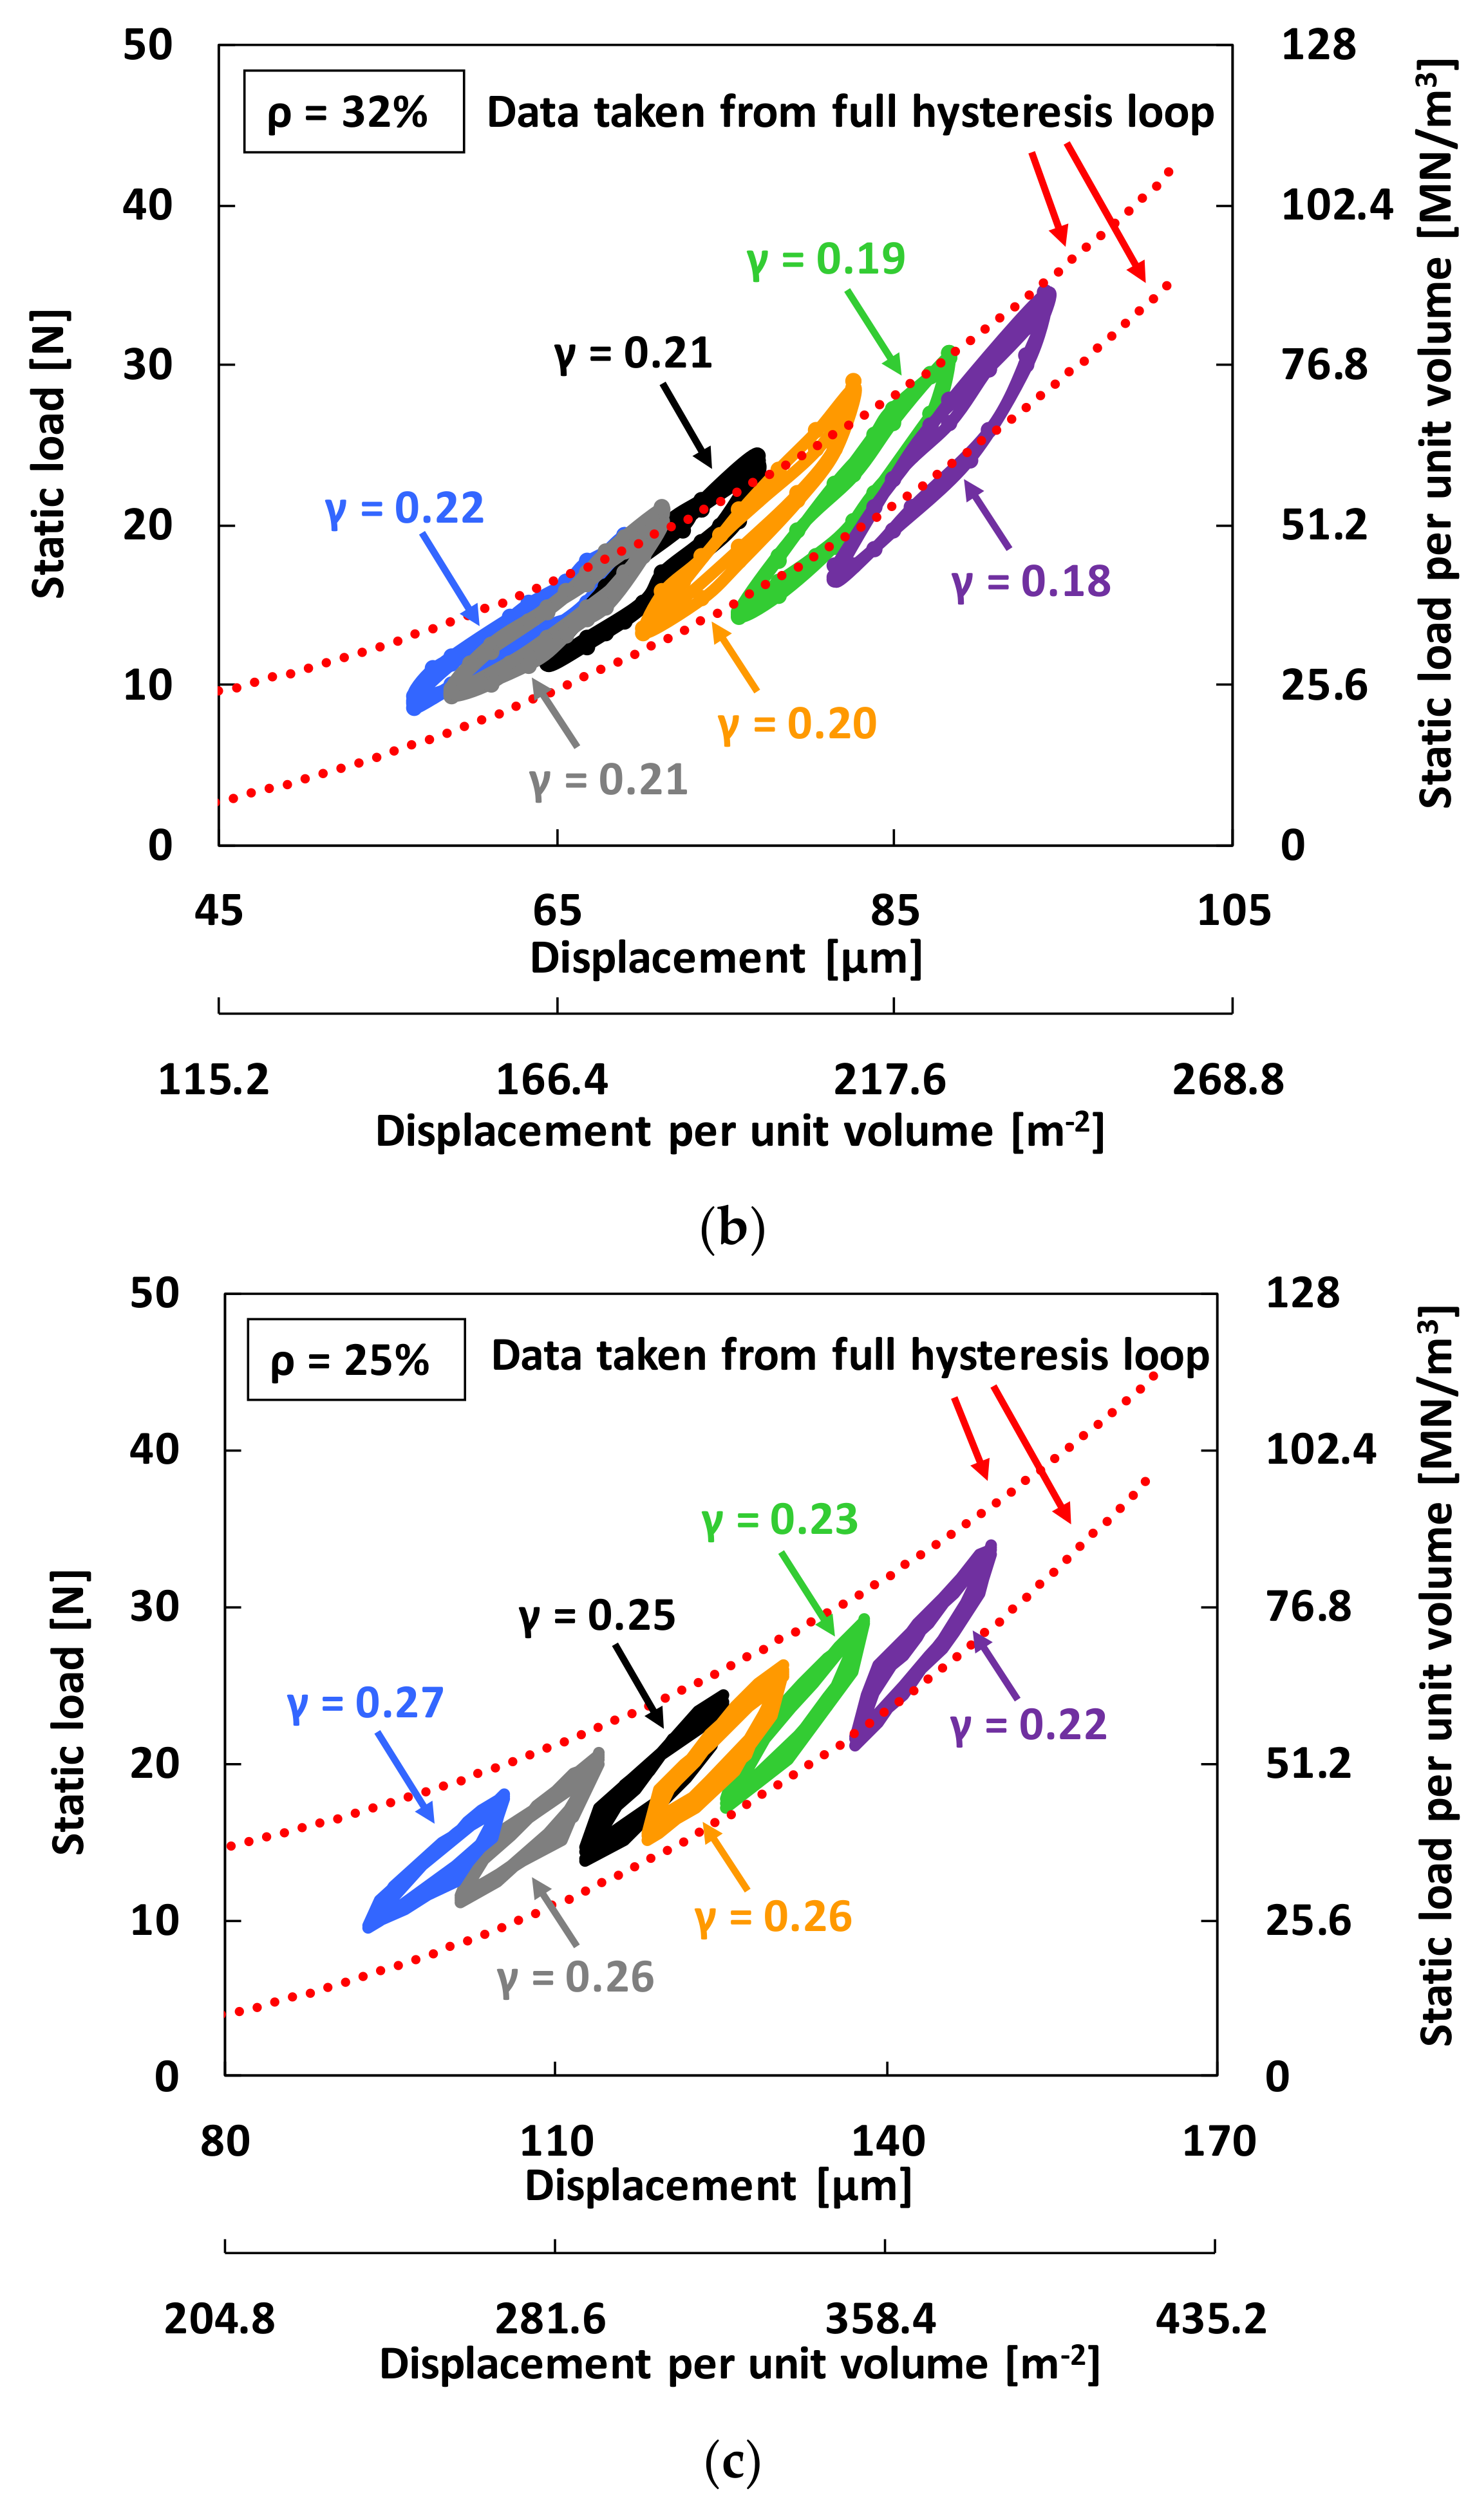
Further static load-deflection measurements are conducted with the test WMDs. Forward and backward movements of the micrometer-integrated stage produce increasing journal eccentric positions, thereby increasing preload on the damper, and further evolve into small hysteresis loops. The applied preloads increase from 13 N up to 28 N with a 1–5 N increment. In the experimental procedure, the WMD displacement amplitude is controlled to be constant at 12 ± 1 μm which is the (approximate) nominal value of the maximum allowable shaft motion amplitude at the bearing locations (i.e., physical limit of the bearing clearance). Note that the load and displacement values in the current study are within typical ranges of bearing transmitted forces and journal dynamic motion amplitudes in the TCs for passenger car applications [34]. As detailed in Section 3.2, the area of the hysteresis loops determines the energy dissipated in WMDs.
Figure 8 depicts the applied static loads (FS) versus recorded WMD displacement, as well as versus WMD displacement per unit volume. In the figure, the right vertical axis displays FS per unit volume of the WMD. The larger hysteresis loop (i.e., test data taken from the full hysteresis loop in Figure 5) encompassing a wide variation of load is shown for comparison and consistency with the series of small hysteresis loops recorded. Recall that the small hysteresis loops for increasing static preloads (or journal eccentric positions) are more representative to accurately estimate the WMD structural loss factor than the large hysteresis loop measured around the damper centered condition. For the WMD with 25% density, the local hysteresis loops are almost within the full hysteresis loop. On the other hand, for the WMD with 42% density, the measured data at the largest and smallest load conditions for each local hysteresis loop are placed near or on the full hysteresis curve data. In other word, if the WDM density is relatively small, the load versus displacement curve of the local hysteresis loop does not track the full hysteresis loop.
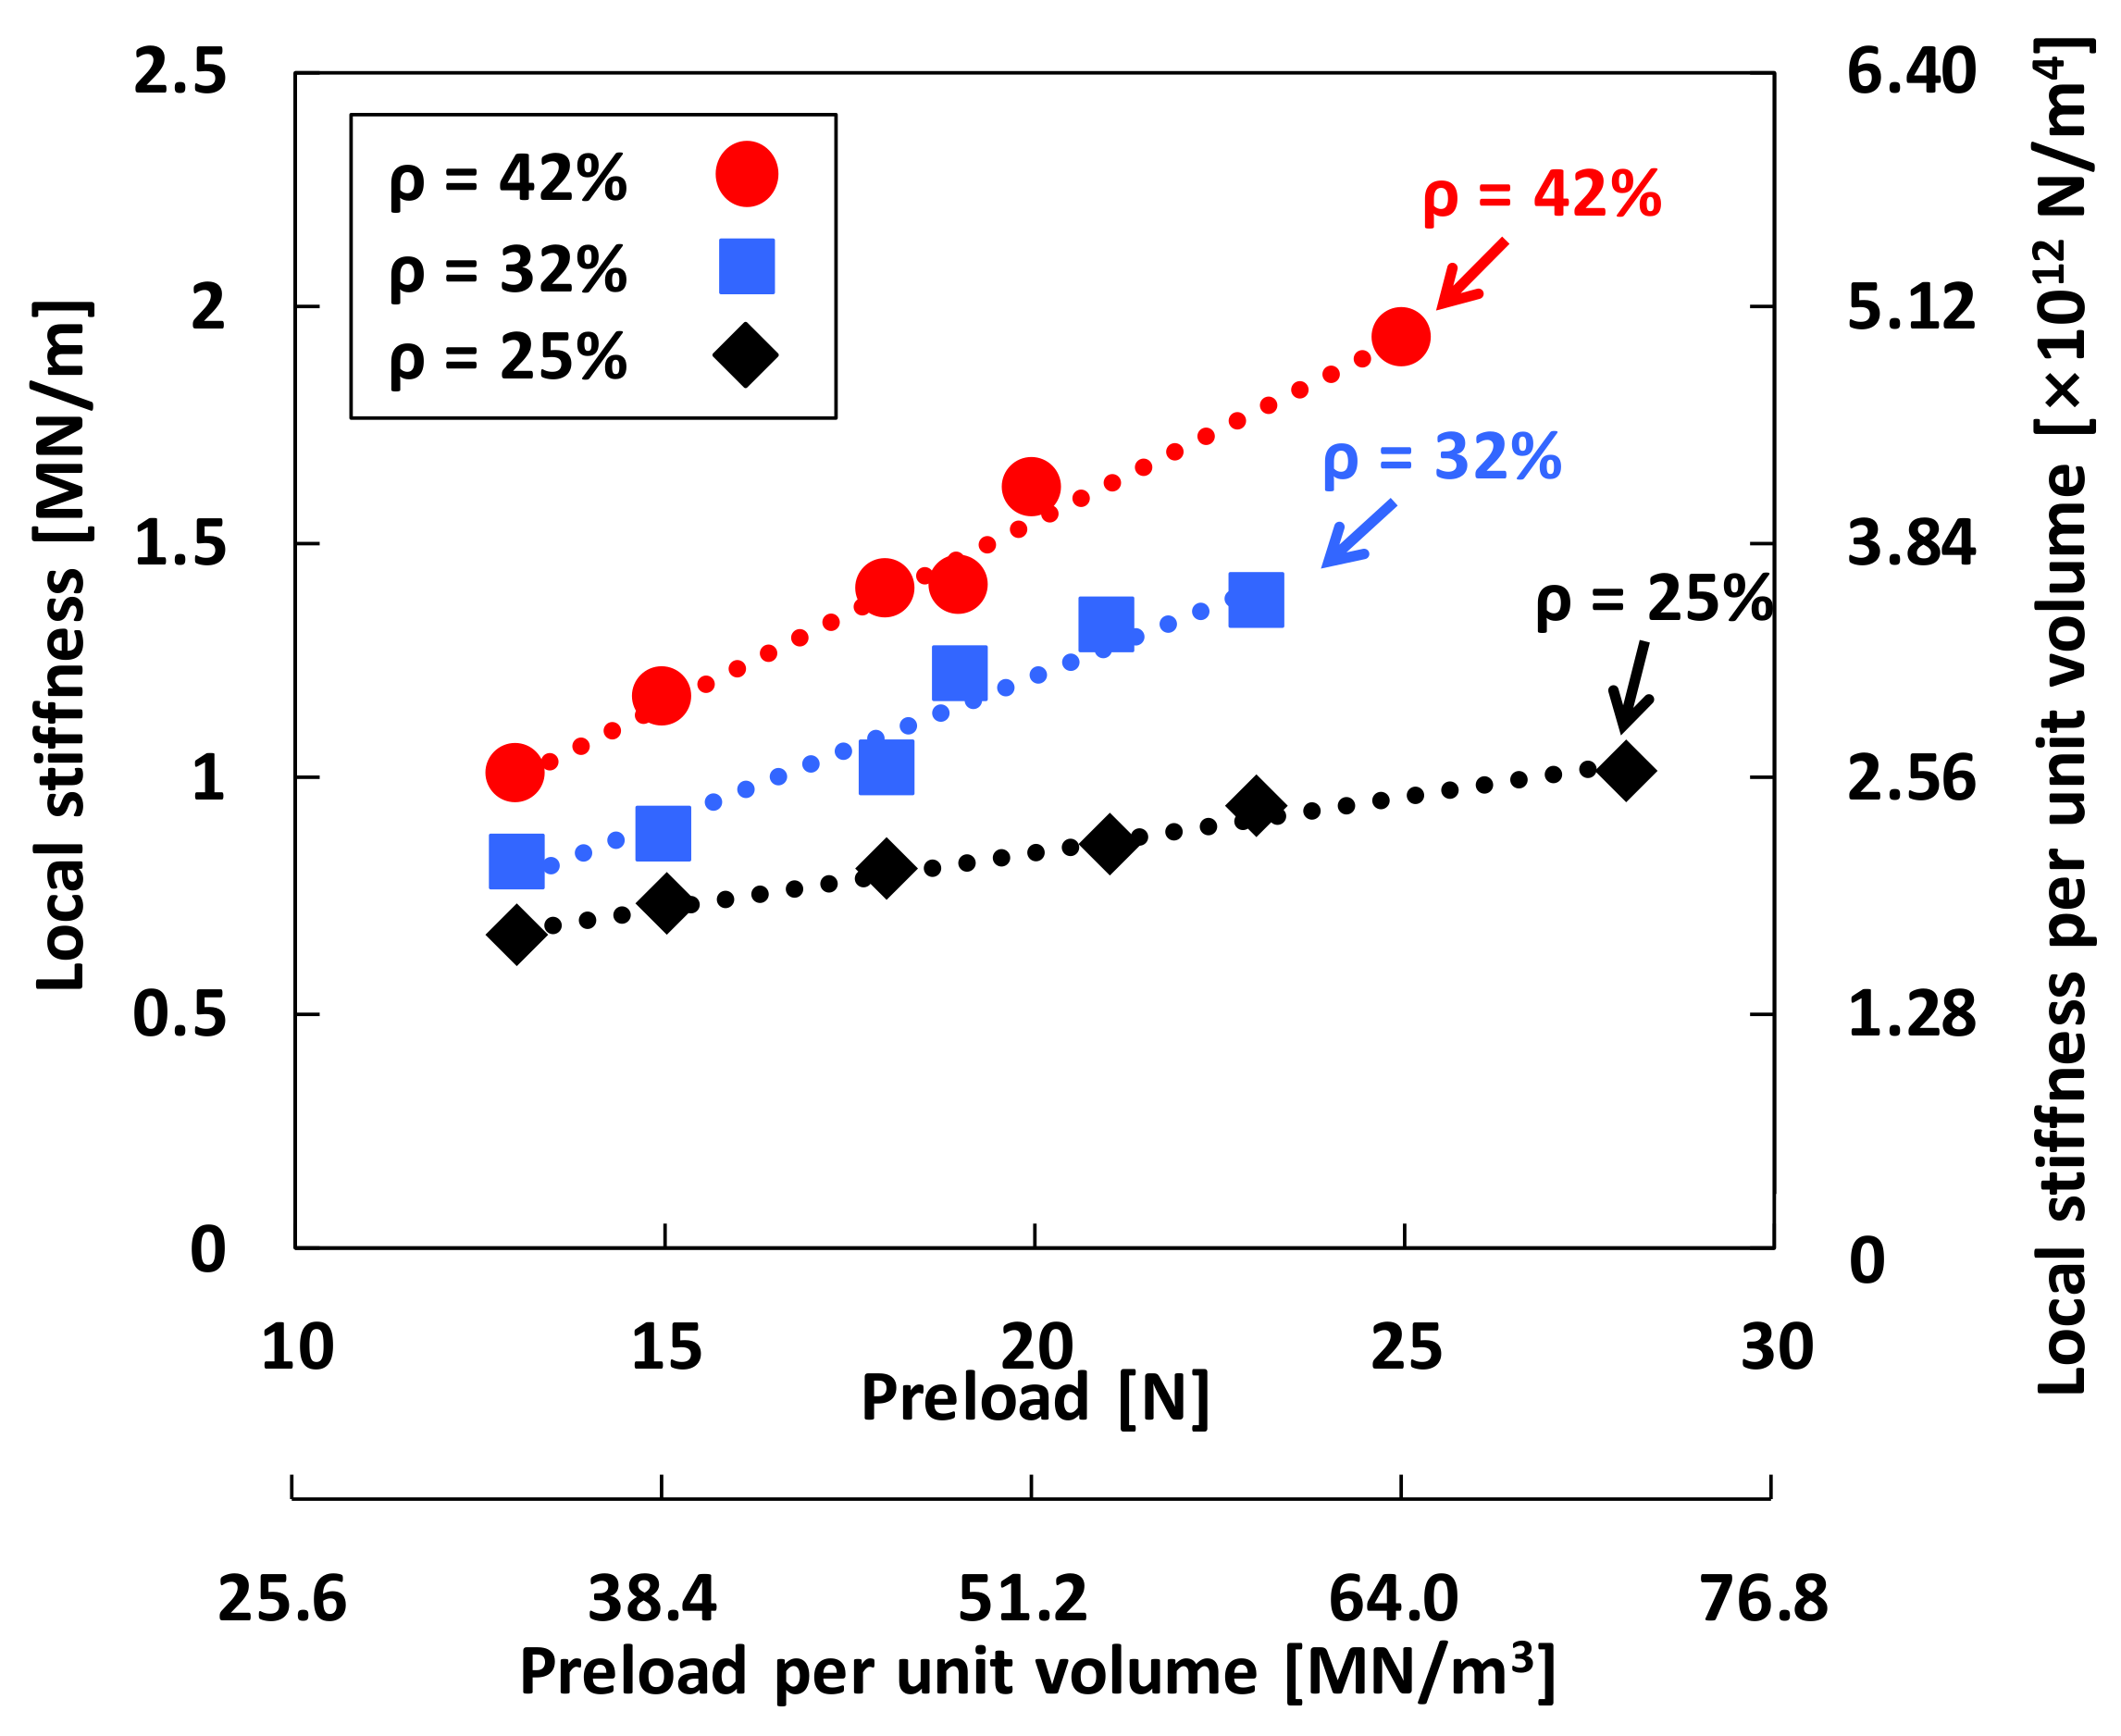
Figure 9 depicts the WMD structural stiffnesses identified from the average slope of the local hysteresis loops (KLocal) in Figure 8 versus applied preload, as well as versus preload per unit volume of the WMD. From the small hysteresis loops in Figure 8, a linear-fit also gives approximate WMD structural stiffness for the different preload conditions. Note that the average stiffness values from each local hysteresis loop in Figure 9 agree very well with the estimated stiffnesses from a linear fit, not shown here for brevity [35]. In the figure, the right vertical axis displays KLocal per unit volume. The symbols and dashed lines represent the test data and their linear-fit approximations, respectively. As expected, the identified local stiffness gradually increases with applied preload. Notice that KLocal increases ~51% and ~93% as the preload increases from 13 N to 28N and from 13 N to 25 N for the WMDs of ρ = 25% and ρ = 42%, respectively.
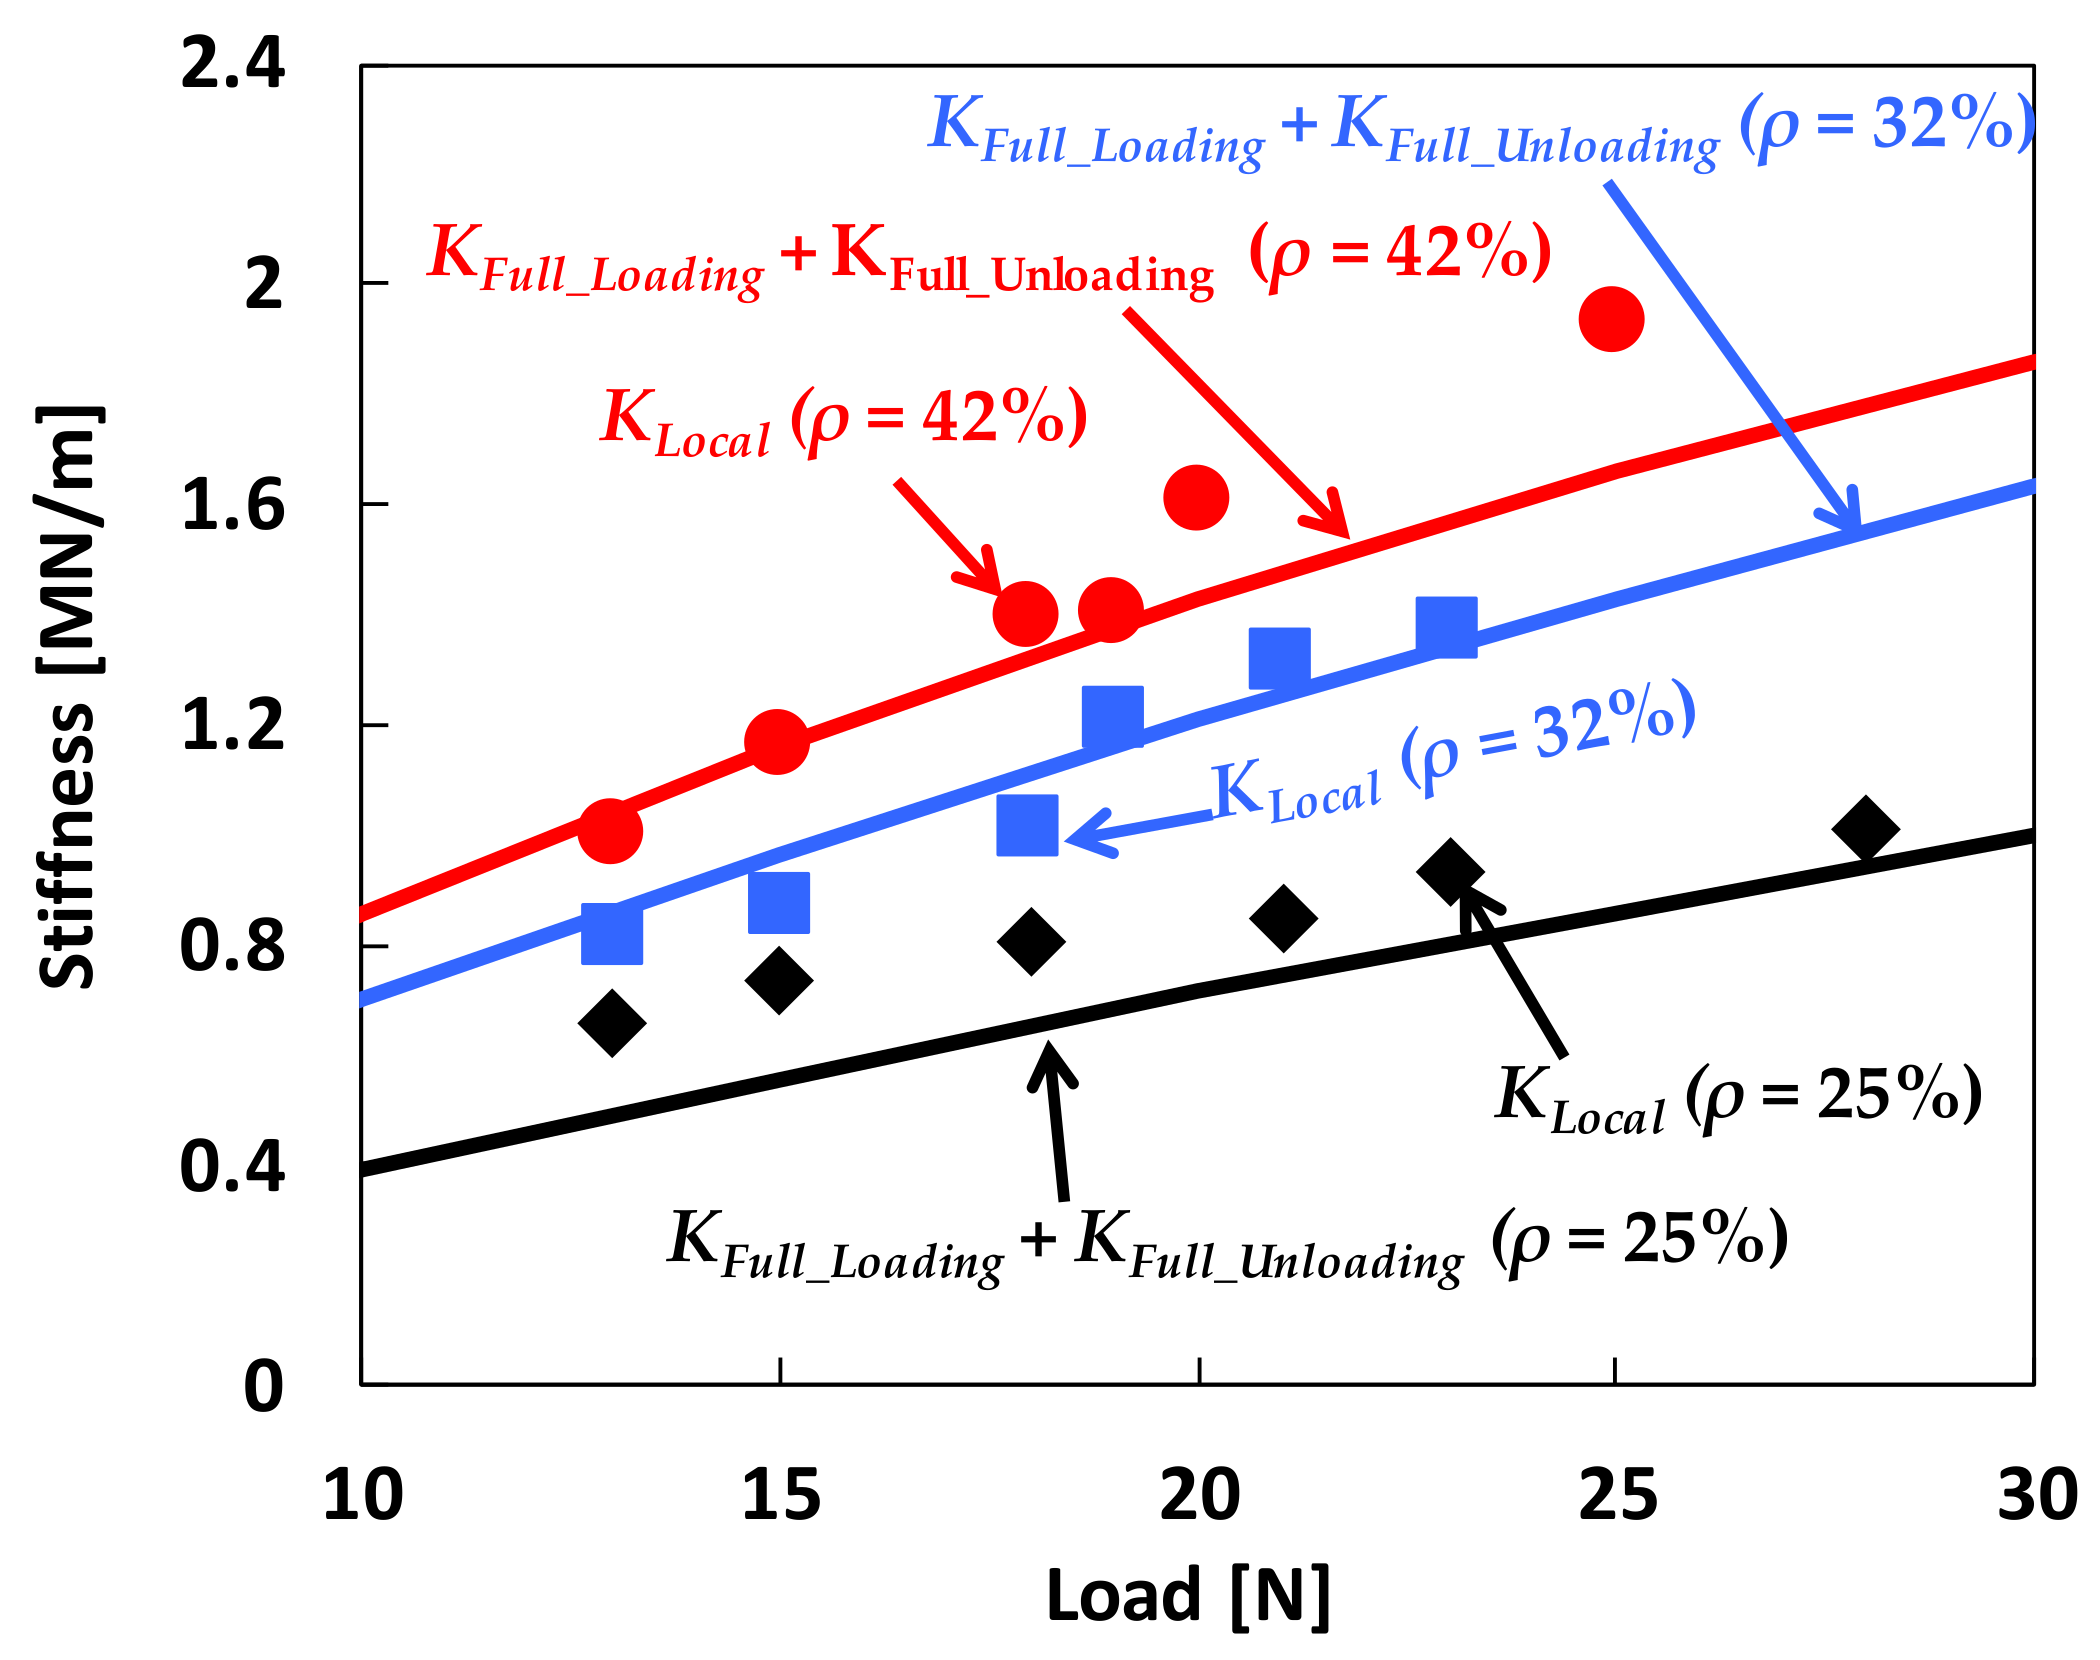
Figure 10 compares the identified stiffnesses derived from the local hysteresis loops (KLocal in Figure 9) to the summation of those obtained from the full hysteresis loops (KFull_Loading + KFull_Unloading in Figure 6). The horizontal axis of the graph for KFull_Loading + KFull_Unloading represents the applied static loads, whereas that for KLocal denotes the preloads. Symbols in the figure denote the stiffnesses from the local hysteresis loops (KLocal); continuous solid lines denote the sum of the stiffnesses under loading and unloading conditions from the full hysteresis loops (KFull_Loading + KFull_Unloading). It is very interesting that KLocal ≈ KFull_Loading + KFull_Unloading. Recall that slopes of the (small) local hysteresis loops are much higher than those of the full hysteresis loops, see Figure 8. Note that [29,36] report a similar structural behavior of corrugated compliant bump foils which shows higher local stiffnesses of the bump foils identified from small local hysteresis load-displacement curves compared to the stiffnesses determined from large full hysteresis load-displacement curves.
4.3. Damping Parameters from Local Hysteresis Loop Measurements
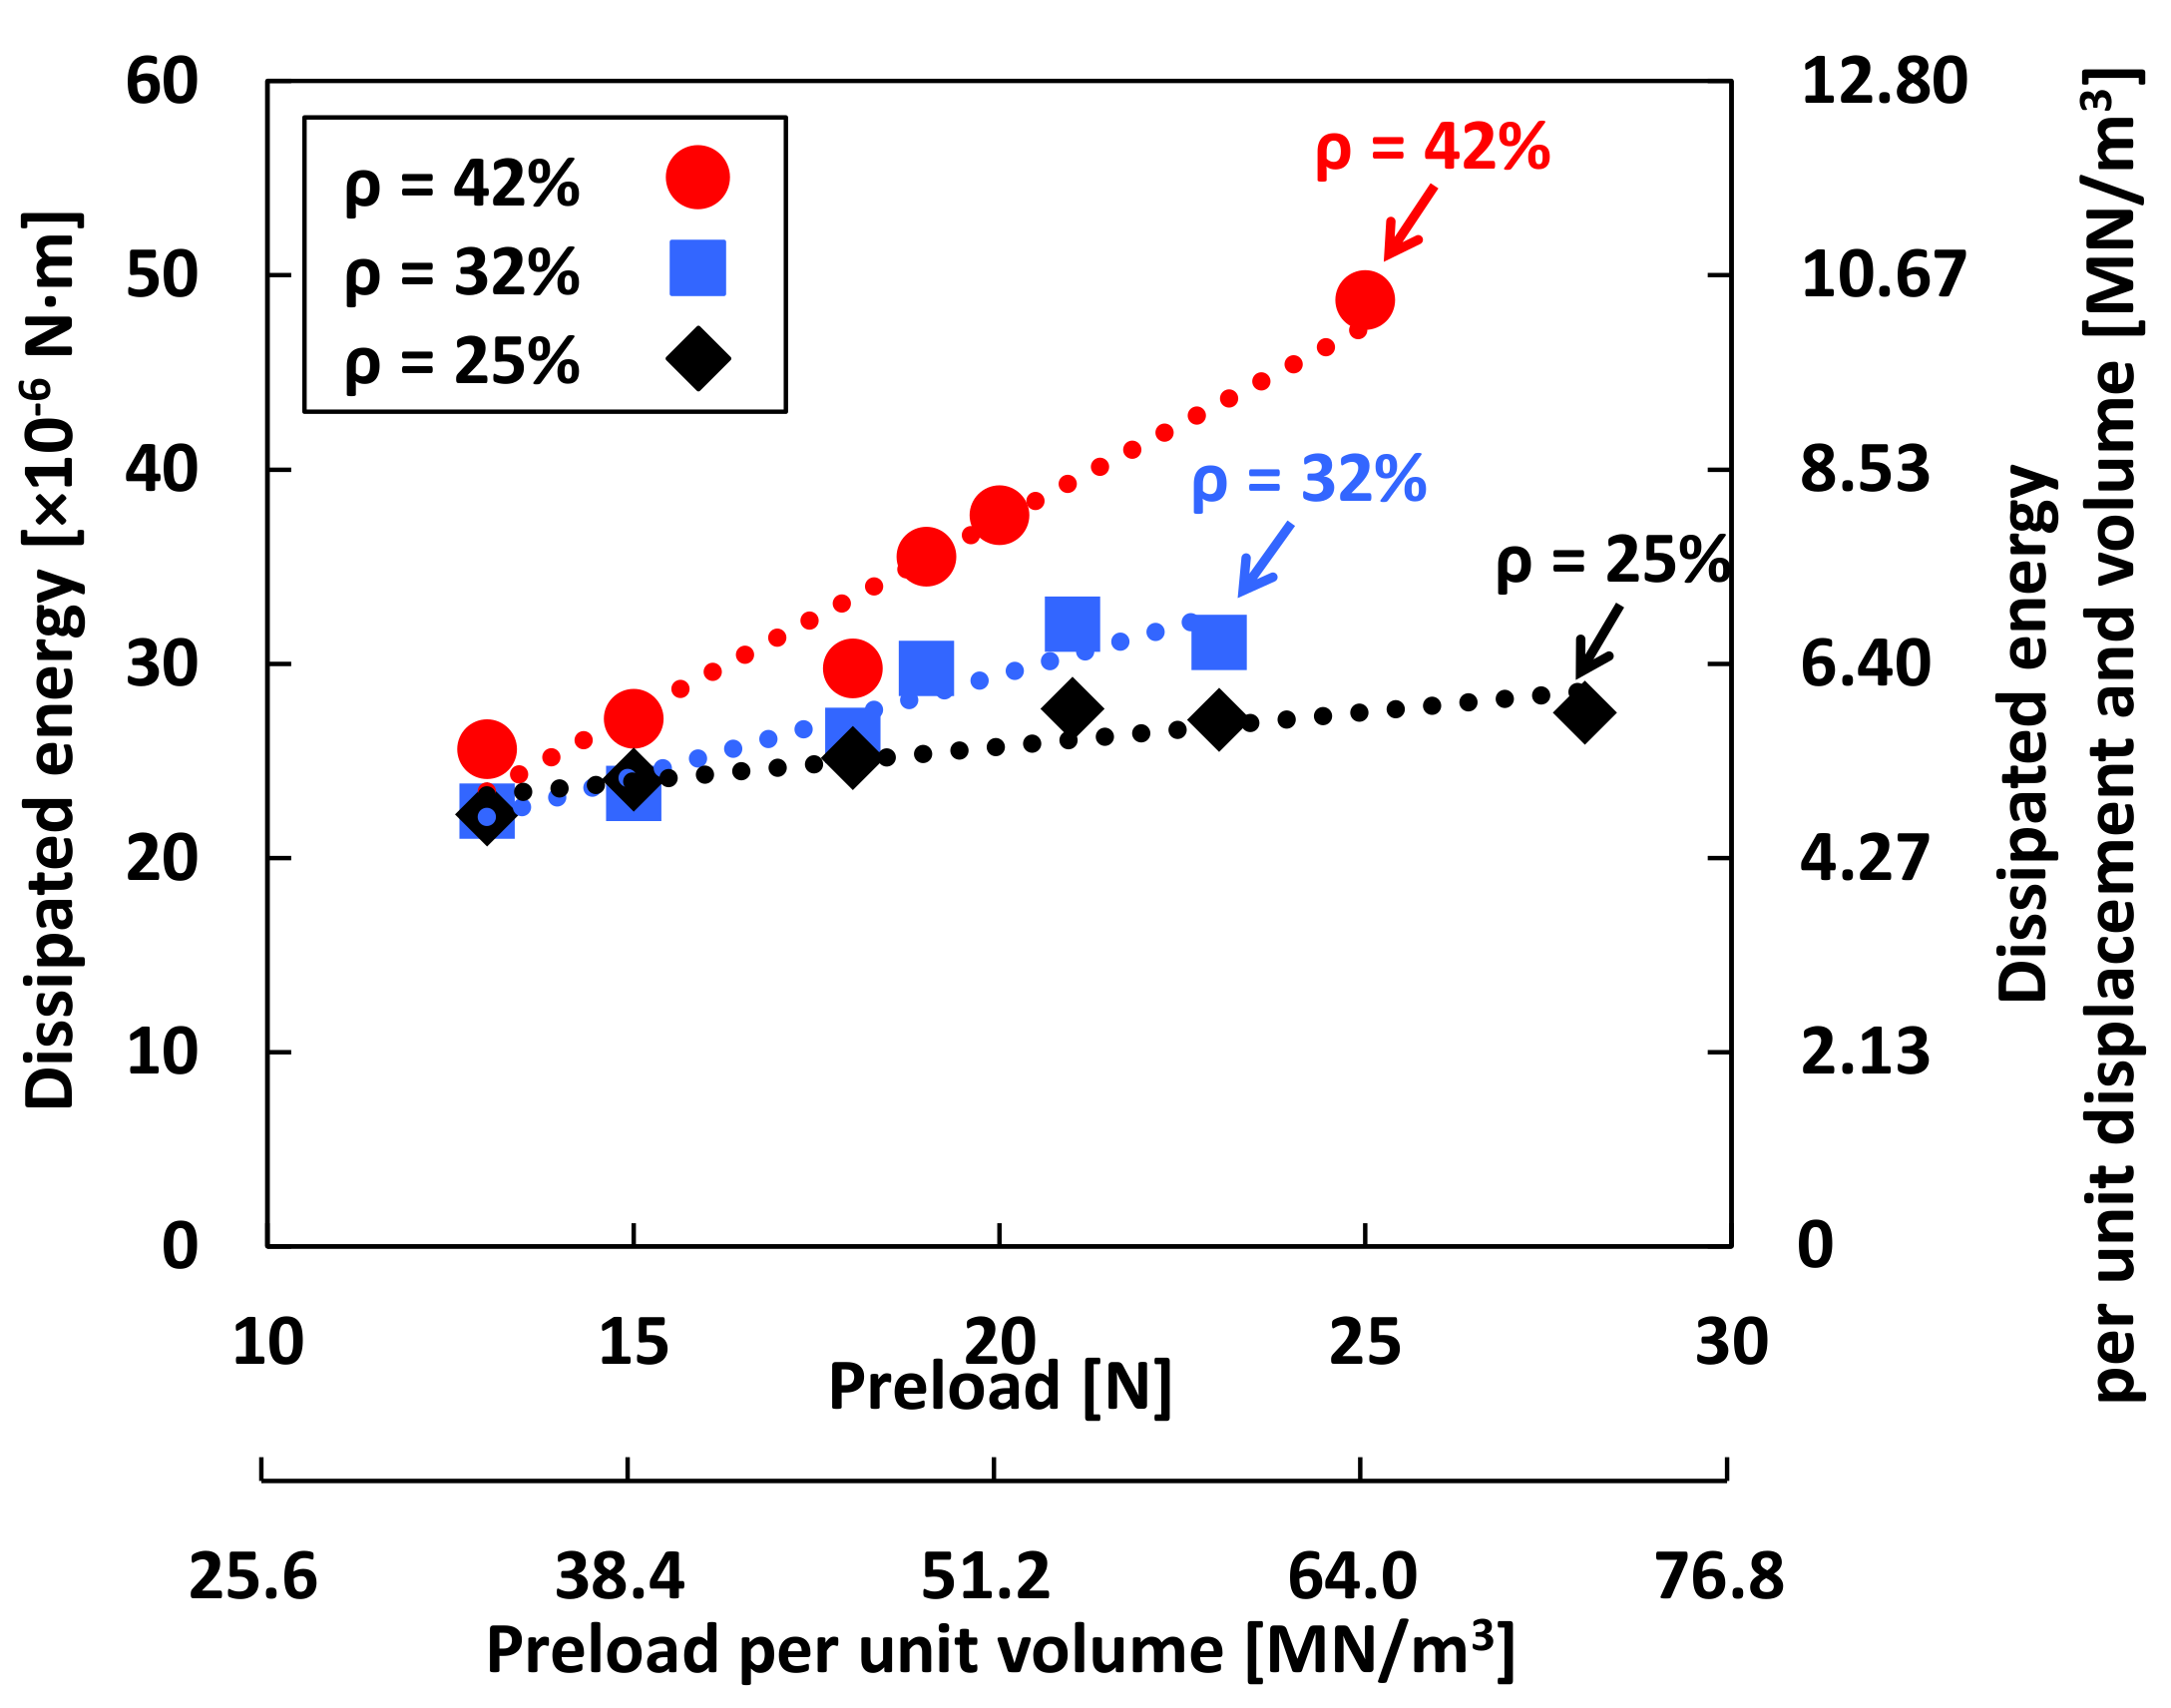
Recall that the applied static load amplitude for the small local hysteresis loop is controlled to provide a constant WMD deflection amplitude, ~12 μm, over the entire preload ranges. Figure 11 depicts the dissipated energy per cycle of motion (Edis) of the test WMDs, that is the area of the local mechanical hysteresis loop (= the damping capacity) in Figure 8, versus preload FPre, as well as versus preload FPre per unit volume of the WMD. The right vertical axis displays the per-unit-volume-displacement damping capacity that is the energy lost per unit displacement due to applied force and unit volume of the WMD per cycle due to damping. For the lowest preload condition, Edis for the WMD with ρ = 42% is slightly larger than those for the WMDs with ρ = 32% and ρ = 25%. However, as the applied preload increases, notice the significant and rapid increase in Edis for the WMD with ρ = 42% compared to others. The dissipated energy (Edis) and the applied preload (FPre) relate best through a linear polynomial. For example, the equations for the WMDs of ρ = 42%, ρ = 32%, and ρ = 25% are Edis = 1.995FPre − 2.501 (with R2 = 0.95), Edis = 1.043FPre − 8.555 (with R2 = 0.90), and Edis = 0.357FPre + 18.603 (with R2 = 0.80), respectively, where R2 (correlation coefficient) indicates the goodness of the curve fit to the identified values.
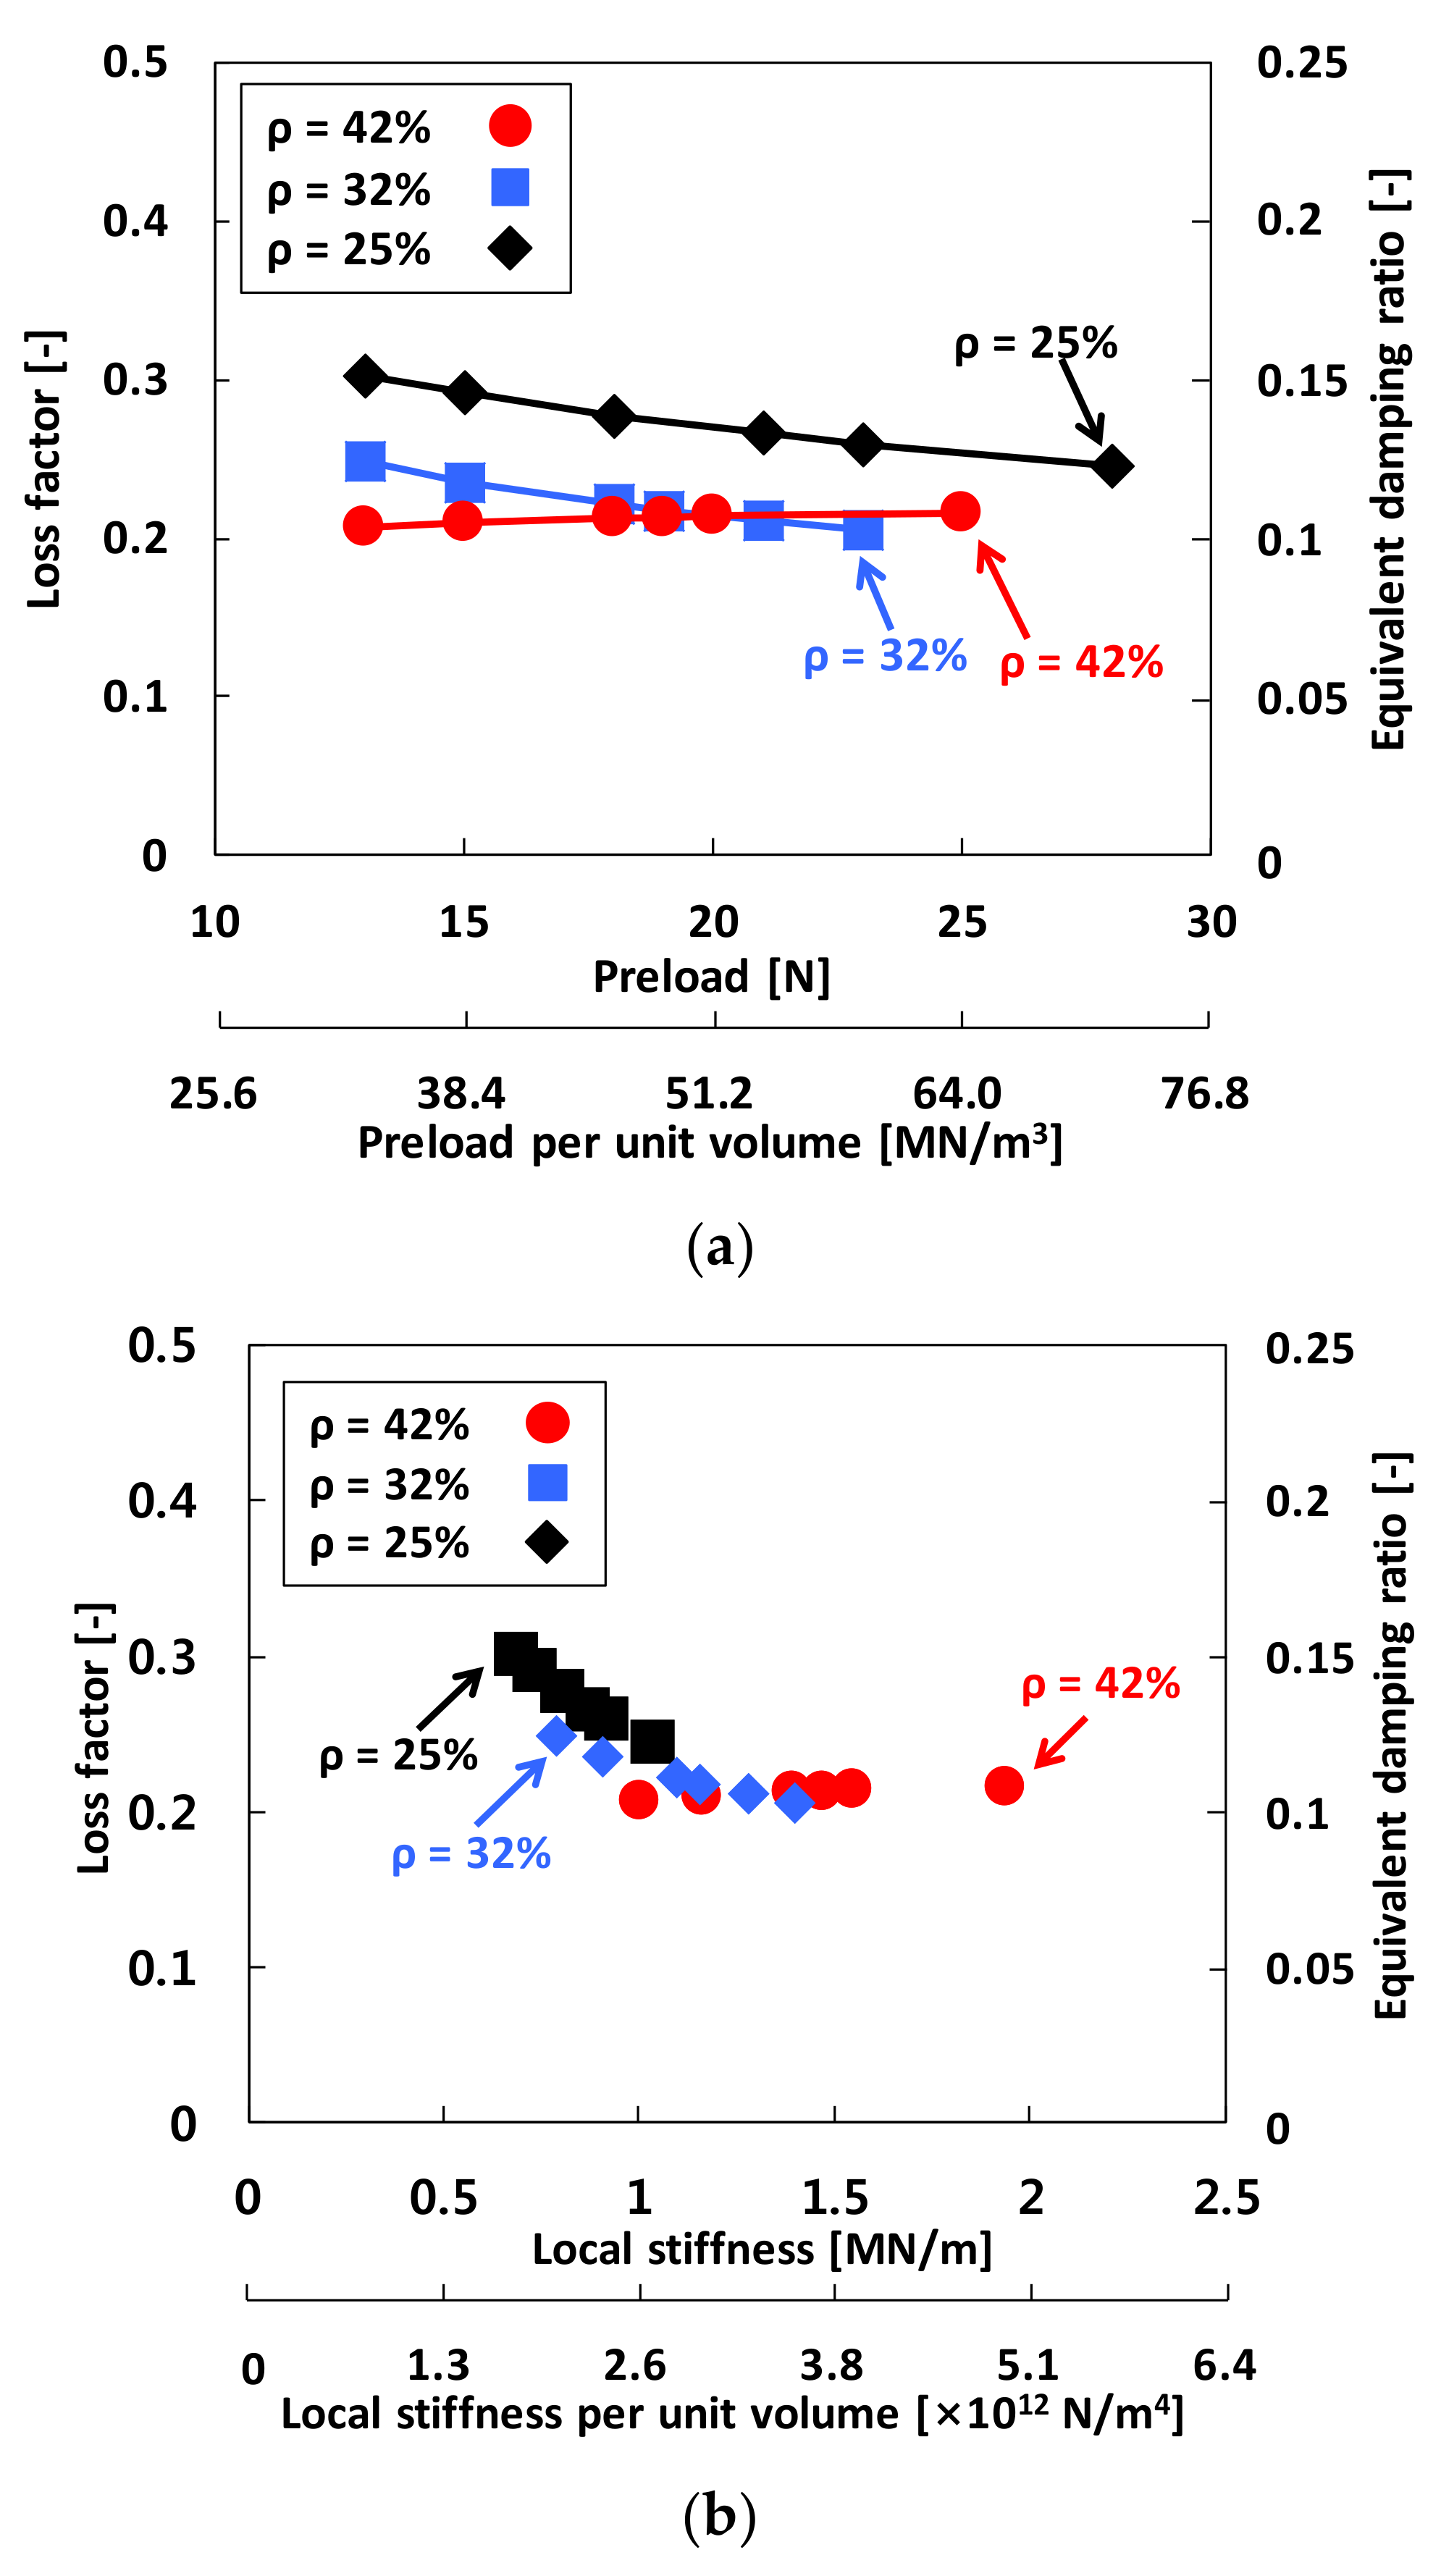
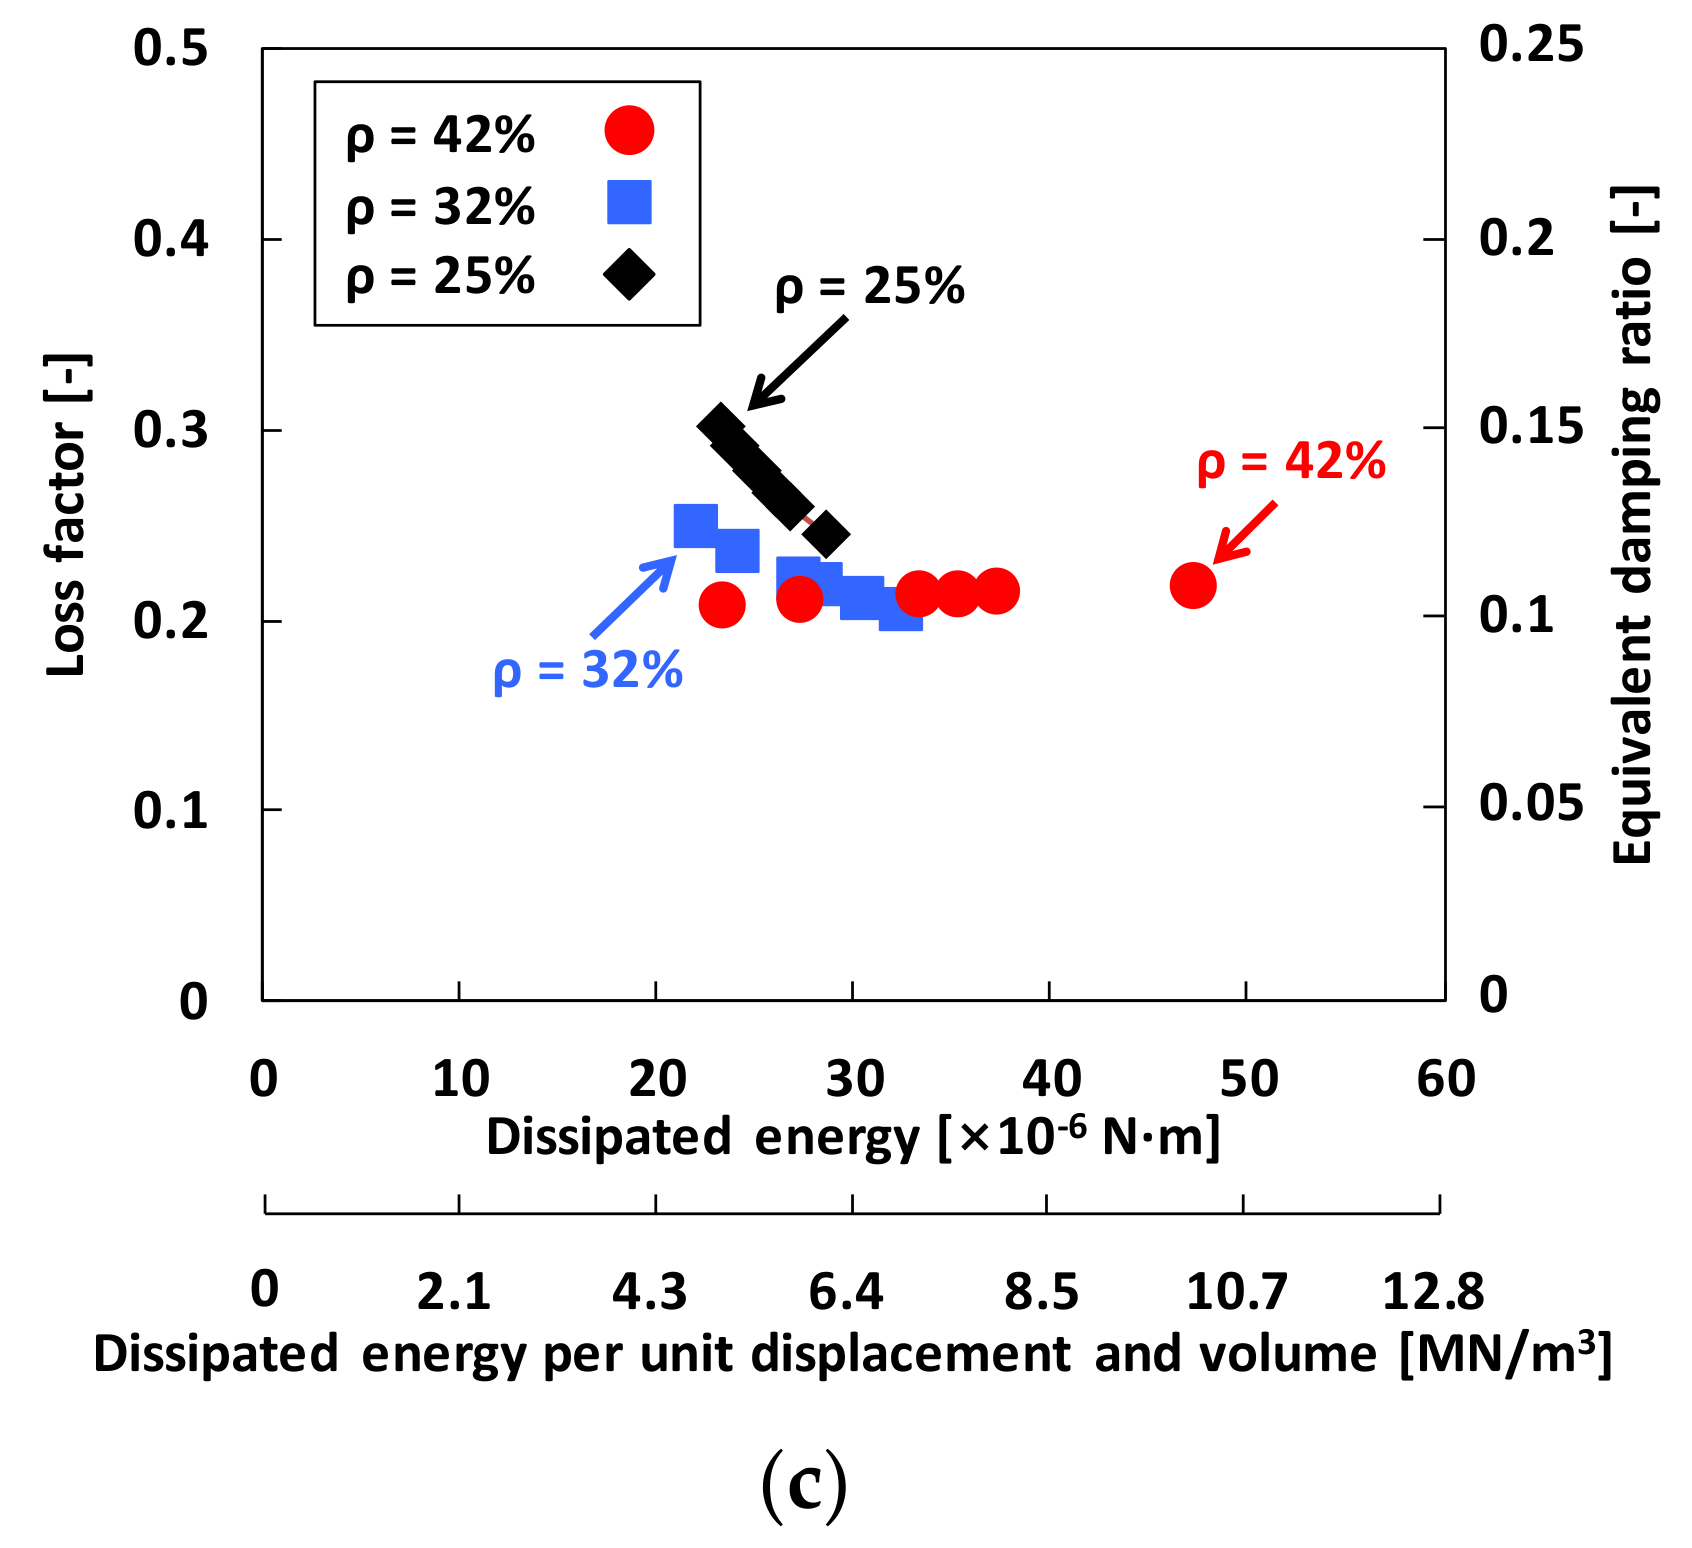
Reliable loss factors are a must to ensure the acceptable performance of WMDs. Figure 12 depicts the estimated WMD structural loss factor γ versus (a) preload FPre (upper horizontal axis) and preload FPre per unit volume of the WMD (lower horizontal axis), (b) local stiffness KLocal (upper horizontal axis) and local stiffness KLocal per unit volume of the WMD (lower horizontal axis), and (c) dissipated energy Edis (upper horizontal axis) and dissipated energy Edis per unit displacement and volume of the WMD (lower horizontal axis). In the figures, the right vertical axis displays identified equivalent damping ratio (ζeq = ~50% of loss factor, recall Section 3.2). Note that the current estimation uses the local (average) stiffness coefficients (KLocal in Figure 9) from the small local hysteresis loops as structural stiffness coefficients with the constant WMD displacement amplitude of ~12 μm. The identified loss factors range from 0.21 to 0.30. The results show the paramount effect of density of the WMDs on decreasing structural loss factor, in particular when the applied preload is relatively small. For ρ = 25% and 32%, the loss factor decreases gradually with preload. For example, γ ~ 0.30 → 0.24 for the WMD with ρ = 25% and γ ~ 0.25 → 0.21 for the WMD with ρ = 32%. On the other hand, for the WMD with ρ = 42%, the loss factors remain nearly invariant while increasing preload on the test WMD. That is, the loss factor is not sensitive to the applied preload when the WMD density is relatively large. Interestingly, from Figure 12b, the identified loss factors of three test WMDs become very similar, i.e., γ → 0.21 when KLocal > ~1.1 MN/m (or KLocal per unit volume of the WMD > ~2.8 × 10¹² N/m4) for all test WMDs. For completeness, Figure 12b,c relate the identified loss factors with the WMD local stiffness and the dissipated energy. Note that loss factors of WMDs can only be determined experimentally [32].
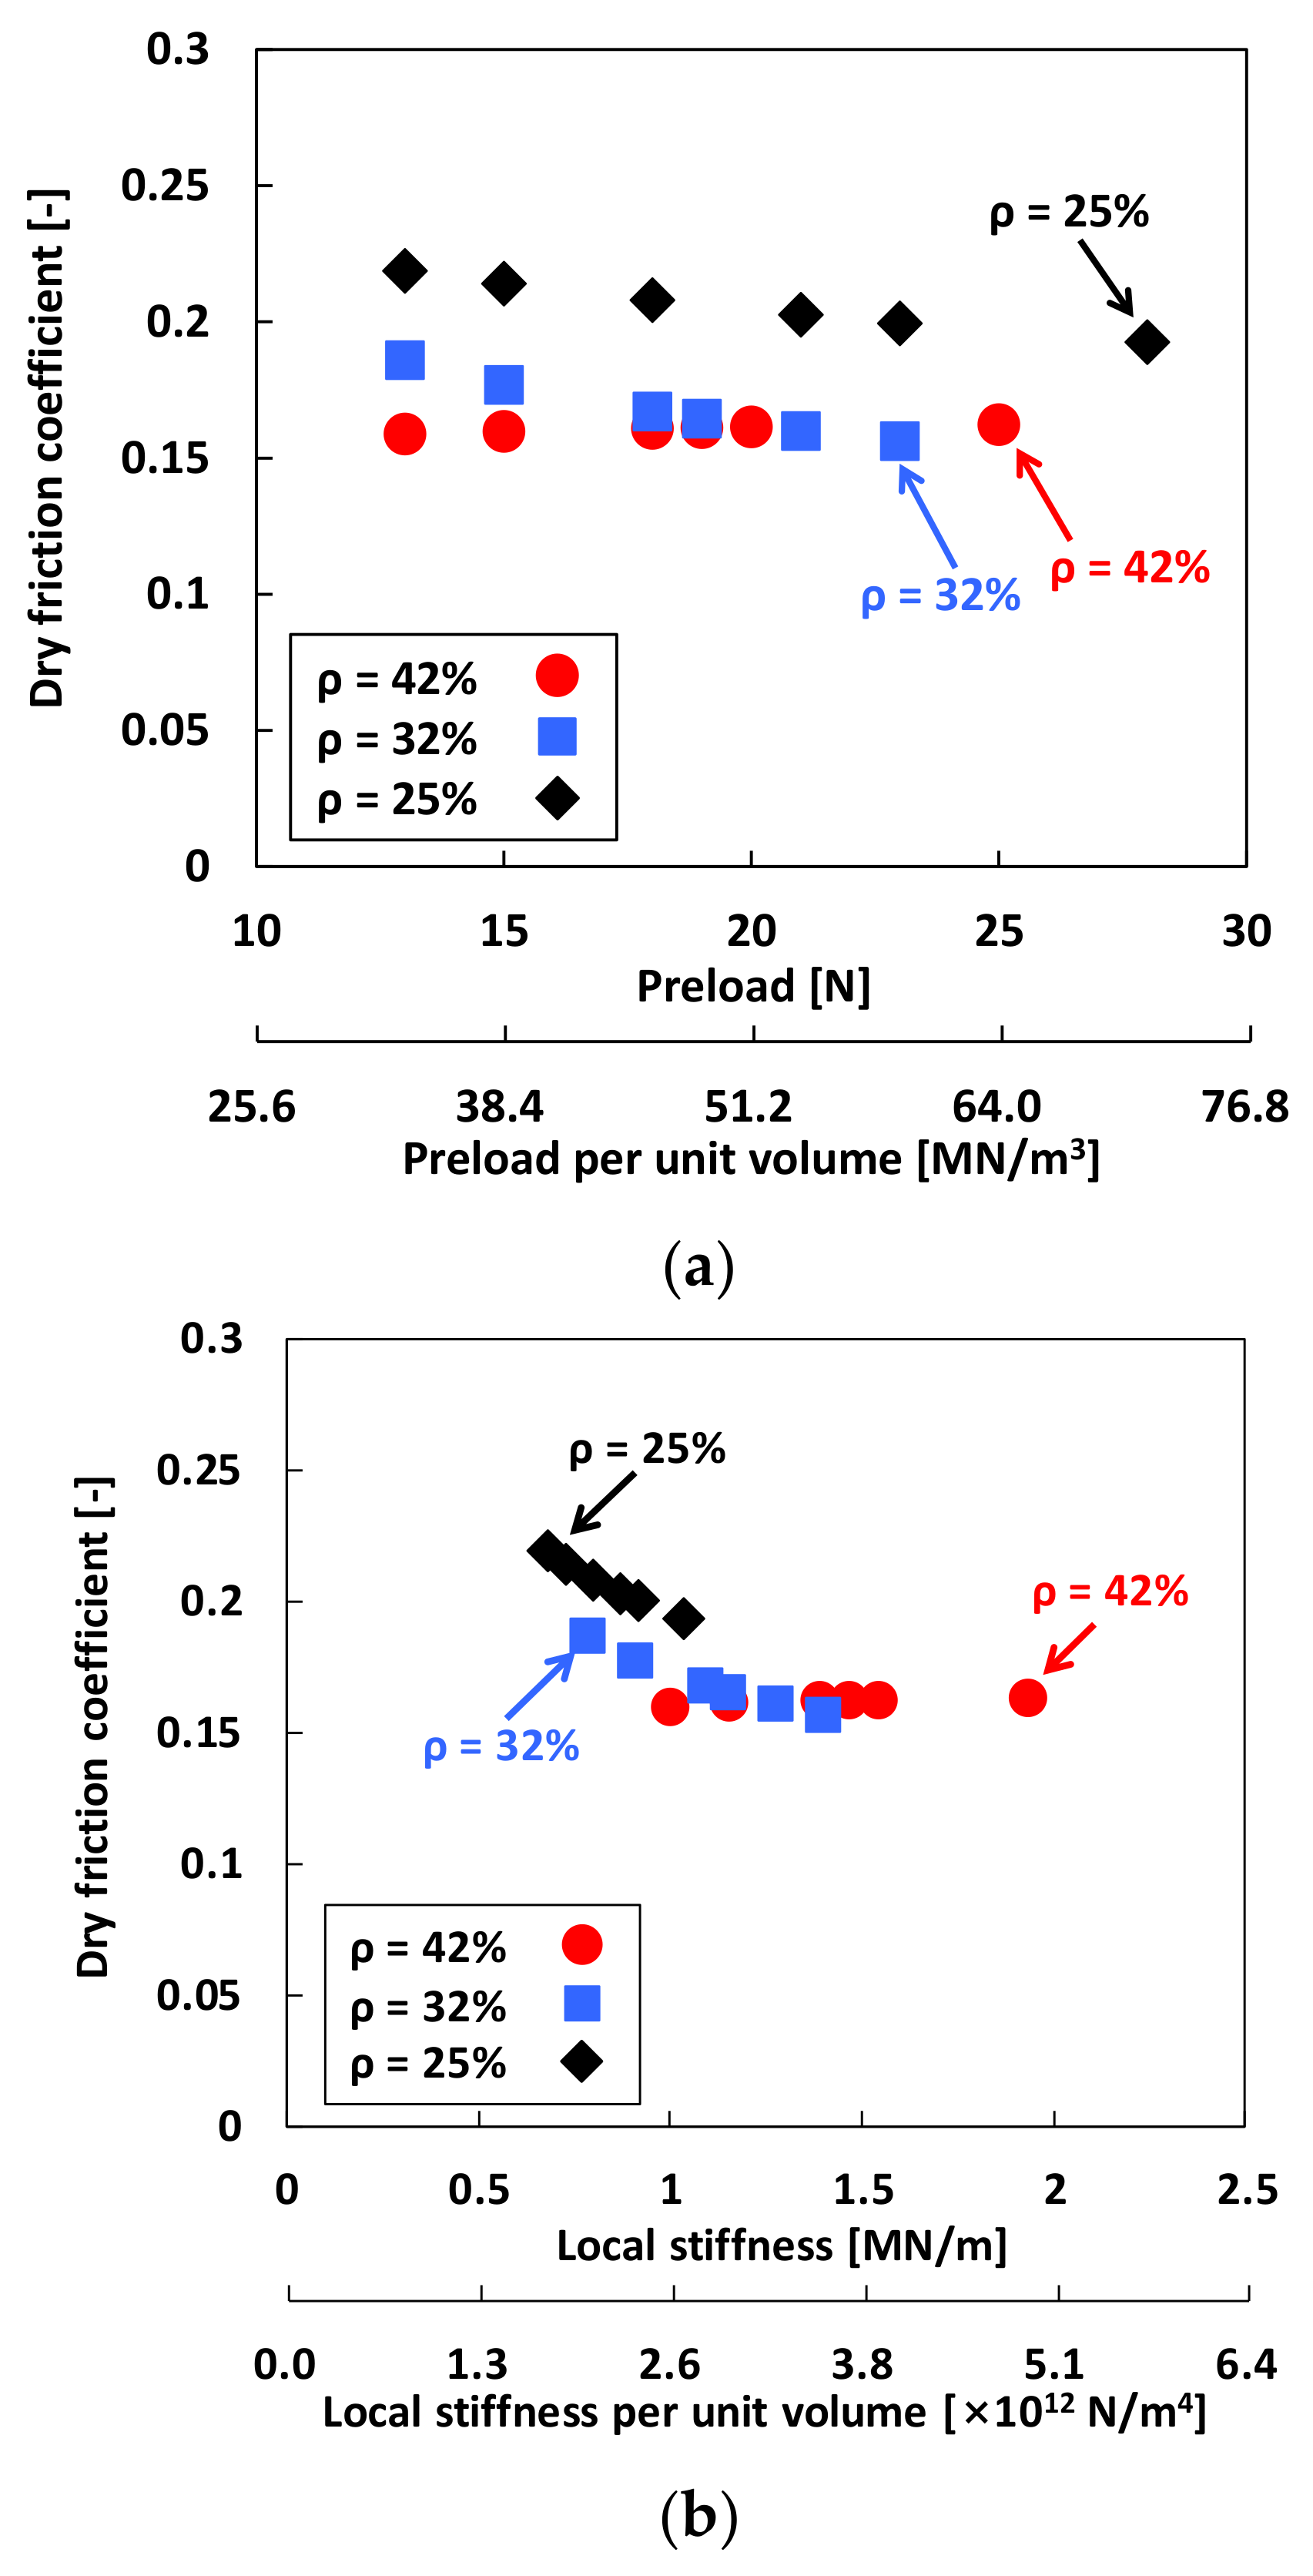
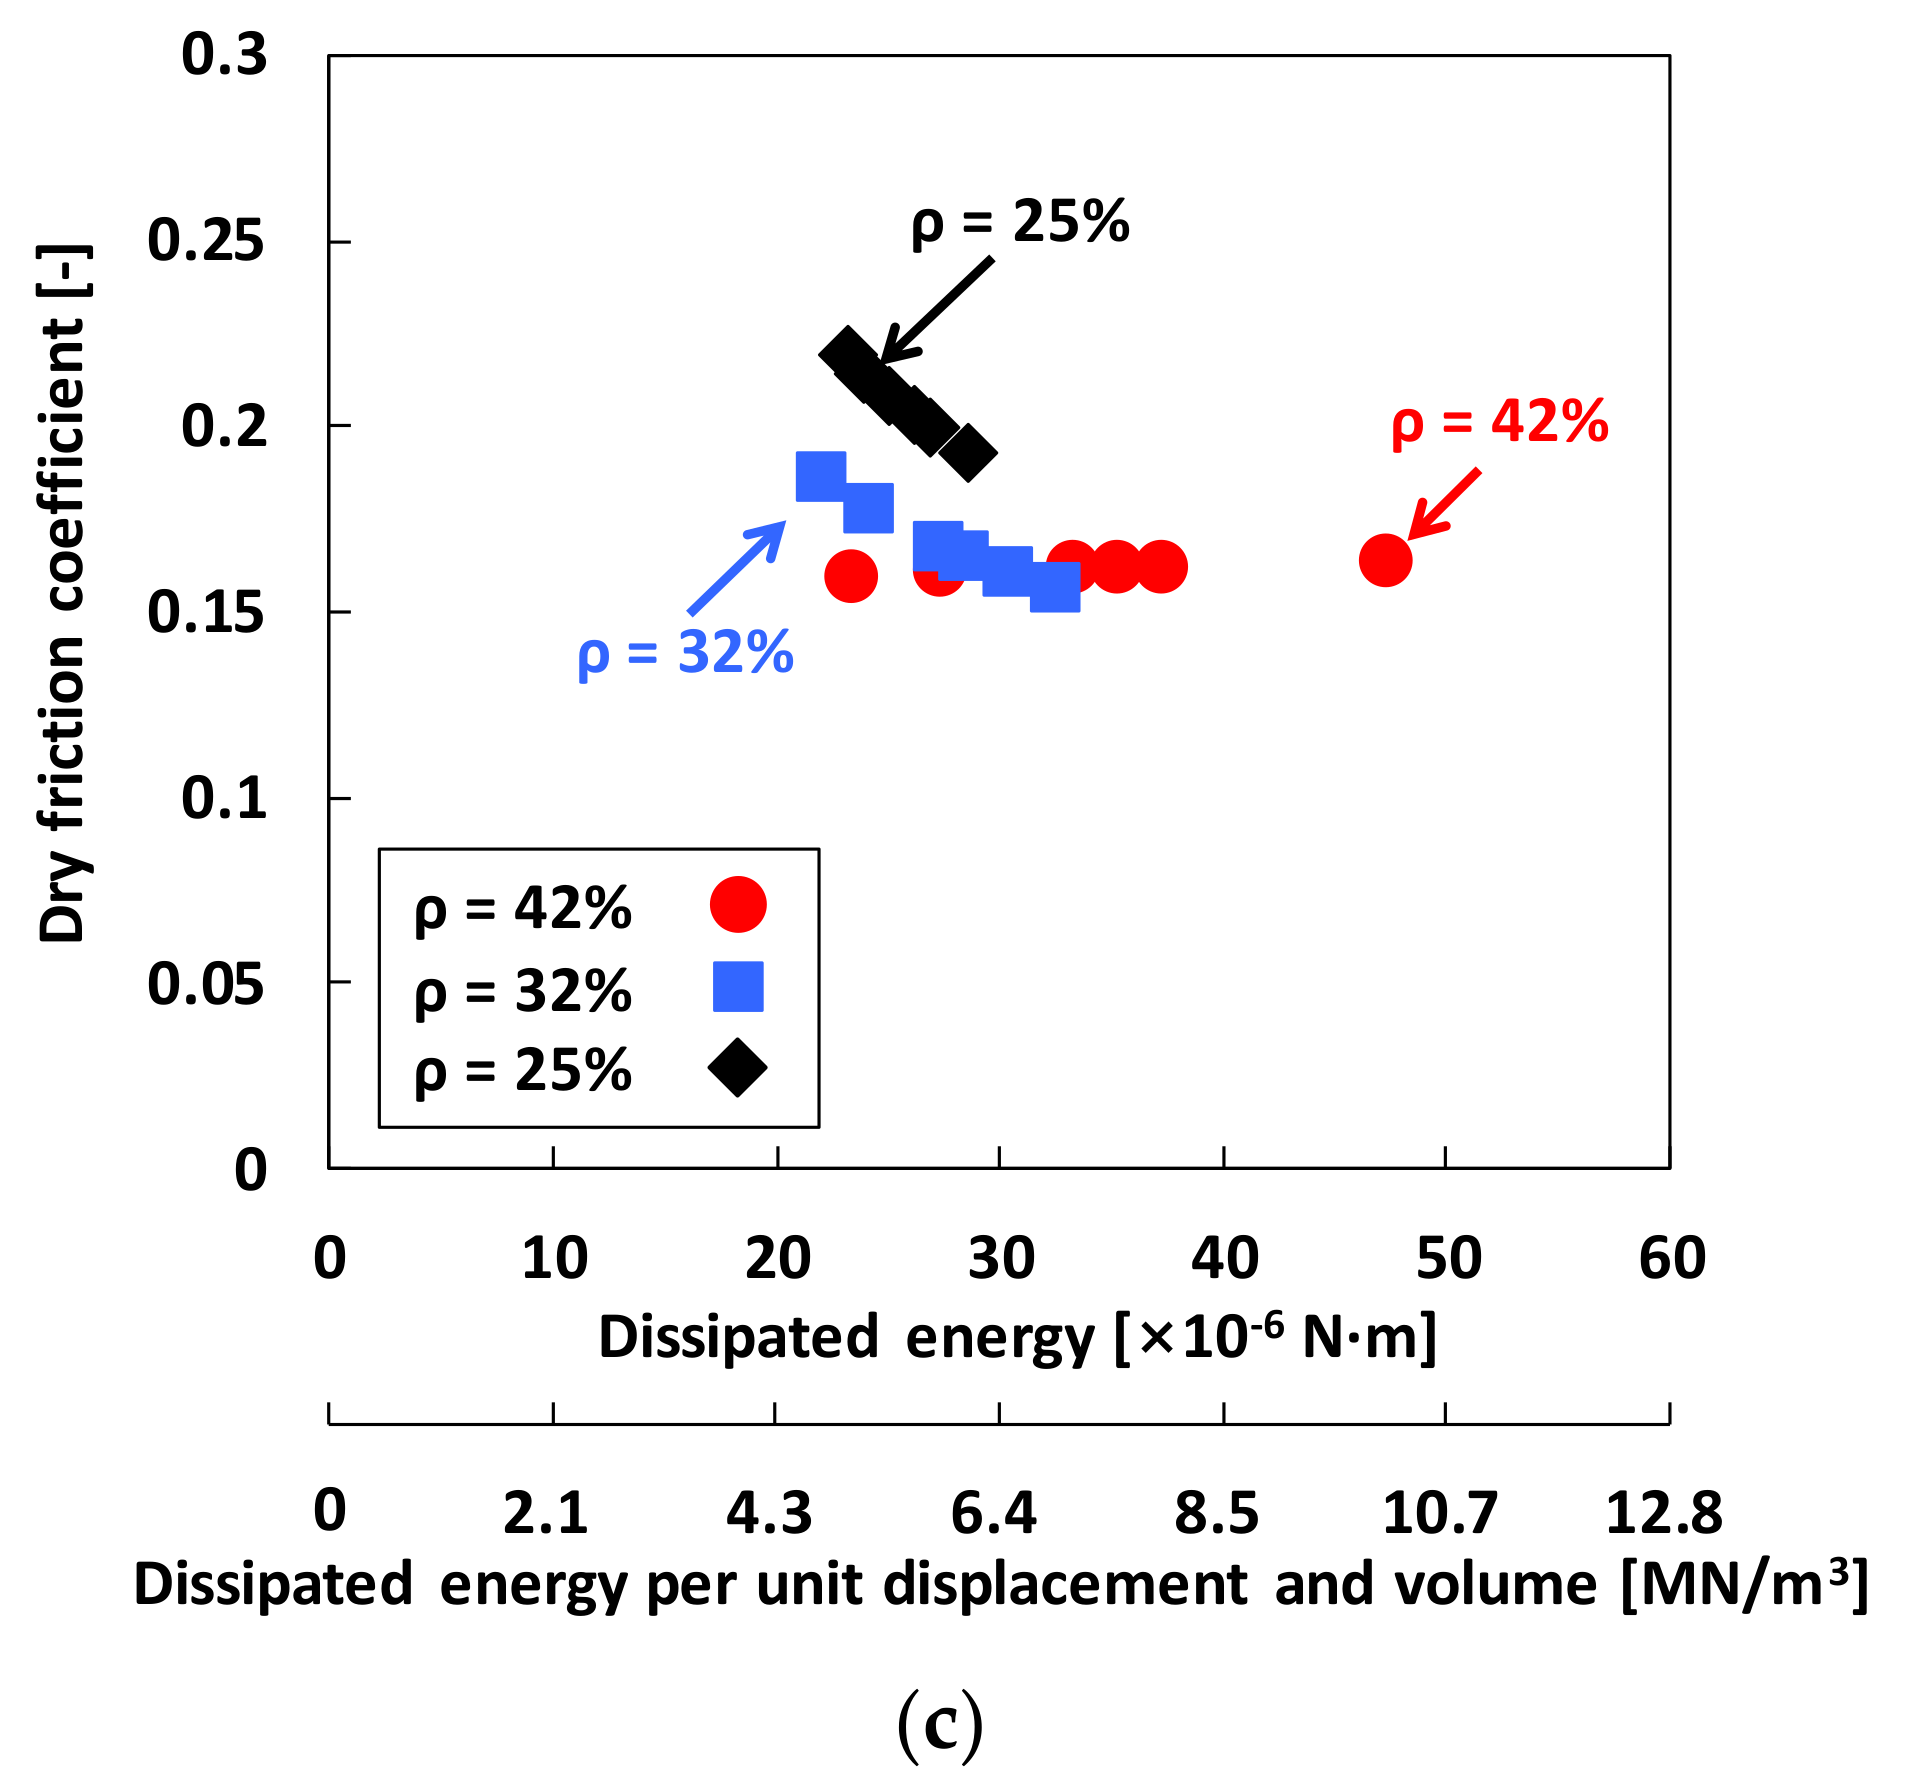
Figure 13 depicts estimated dry friction coefficients μf versus (a) preload FPre (upper horizontal axis) and preload FPre per unit volume of the WMD (lower horizontal axis); (b) local stiffness KLocal (upper horizontal axis) and local stiffness KLocal per unit volume of the WMD (lower horizontal axis); and (c) dissipated energy Edis (upper horizontal axis) and dissipated energy Edis per unit displacement and volume of the WMD (lower horizontal axis). The dry friction coefficients of three test WMDs range from 0.16 to 0.22. For the WMD with ρ = 42%, μf is nearly invariant over the entire preload ranges. On the other hand, for the WMDs with ρ = 32% and ρ = 25%, the dry friction coefficients steadily decrease from 0.19 to 0.15 and from 0.22 to 0.19, respectively, when the preload increases from 13 N to 23 N. Note that structural loss factors γ = 0.2–0.3 estimated are derived from static load tests. It is expected that, when dynamic loads with high excitation frequency are applied, loss factors are lower than the currently identified values due to a kinetic dry-friction coefficient. Figure 13b,c provide more complete knowledge relating the estimated dry friction coefficient with the WMD local stiffness and dissipated energy in the test dampers.
5. Conclusions
Experimentally identified structural stiffness and mechanical energy dissipation parameters of WMDs are mandatory to predict and understand forced performance of WMD supported automotive TCs. Presently, extensive static load tests are conducted to identify structural stiffness and damping parameters of WMDs as a function of applied preload. Measurements show a nonlinear static load-WMD deflection relationship with typical hysteresis curves, representing dissipate mechanical energy, for repeated loading and unloading tests. Structural stiffness of the test WMDs are obtained using slops of fitted polynomial functions. The identified WMD loss factor determined from the area under a hysteresis loop decreases moderately with preload; albeit, the effect of applied preload is insignificant for the WMD with larger density (i.e., ρ = 42%). That is, increasing WMD density gives a notably small variation on loss factor, as well as dry friction coefficient. The loss factor of the current test WMDs reaches up to ~0.3 at a preload of 13 N with a 12 μm displacement amplitude. The estimated dry friction coefficients are 21~27% smaller than the identified loss factor in magnitude while both following same fashion versus applied preload. In actuality, TCs operate at very high temperatures; and hence, significant thermal expansions of the bearing sleeve and BH introduce various preload conditions, in particular, for passenger vehicle applications, thus resulting in different WMD stiffness and damping coefficients. The current paper brings original contributions toward the fundamental understanding of small (~9 mm and ~13 mm inner and outer diameters, respectively) WMD performance and details the simple performance evaluation procedures and test results. The measurements will serve to benchmark a future predictive analysis for the static and dynamic forced performance of WMDs for automotive TCs.
Recently, extensive experiments of the WMD supported TC are completed in a cold air-driven rotordynamic test facility while changing oil temperatures from 44 °C to 90 °C. Future publication will include a one-to-one comparison of the rotordynamic and NVH performance of a TC integrating the new WMD bearing system against a commercial SFRB supported TC with identical rotating components (shaft, turbine wheel, and compressor wheel). Widespread usage of WMDs, made of engineered common inexpensive materials, is expected because of their simple design and fabrication (prototyping) which reduce overall cost and development time.
Acknowledgments
This work was supported by the research fund of Hanyang University (HY-2013-N).
Author Contributions
Keun Ryu conceived, designed, and performed the experiments. He also wrote the entire manuscript. Howon Yi assisted Keun Ryu to perform the experiments and analyzed test data.
Conflicts of Interest
The authors declare no conflict of interest.
Appendix A
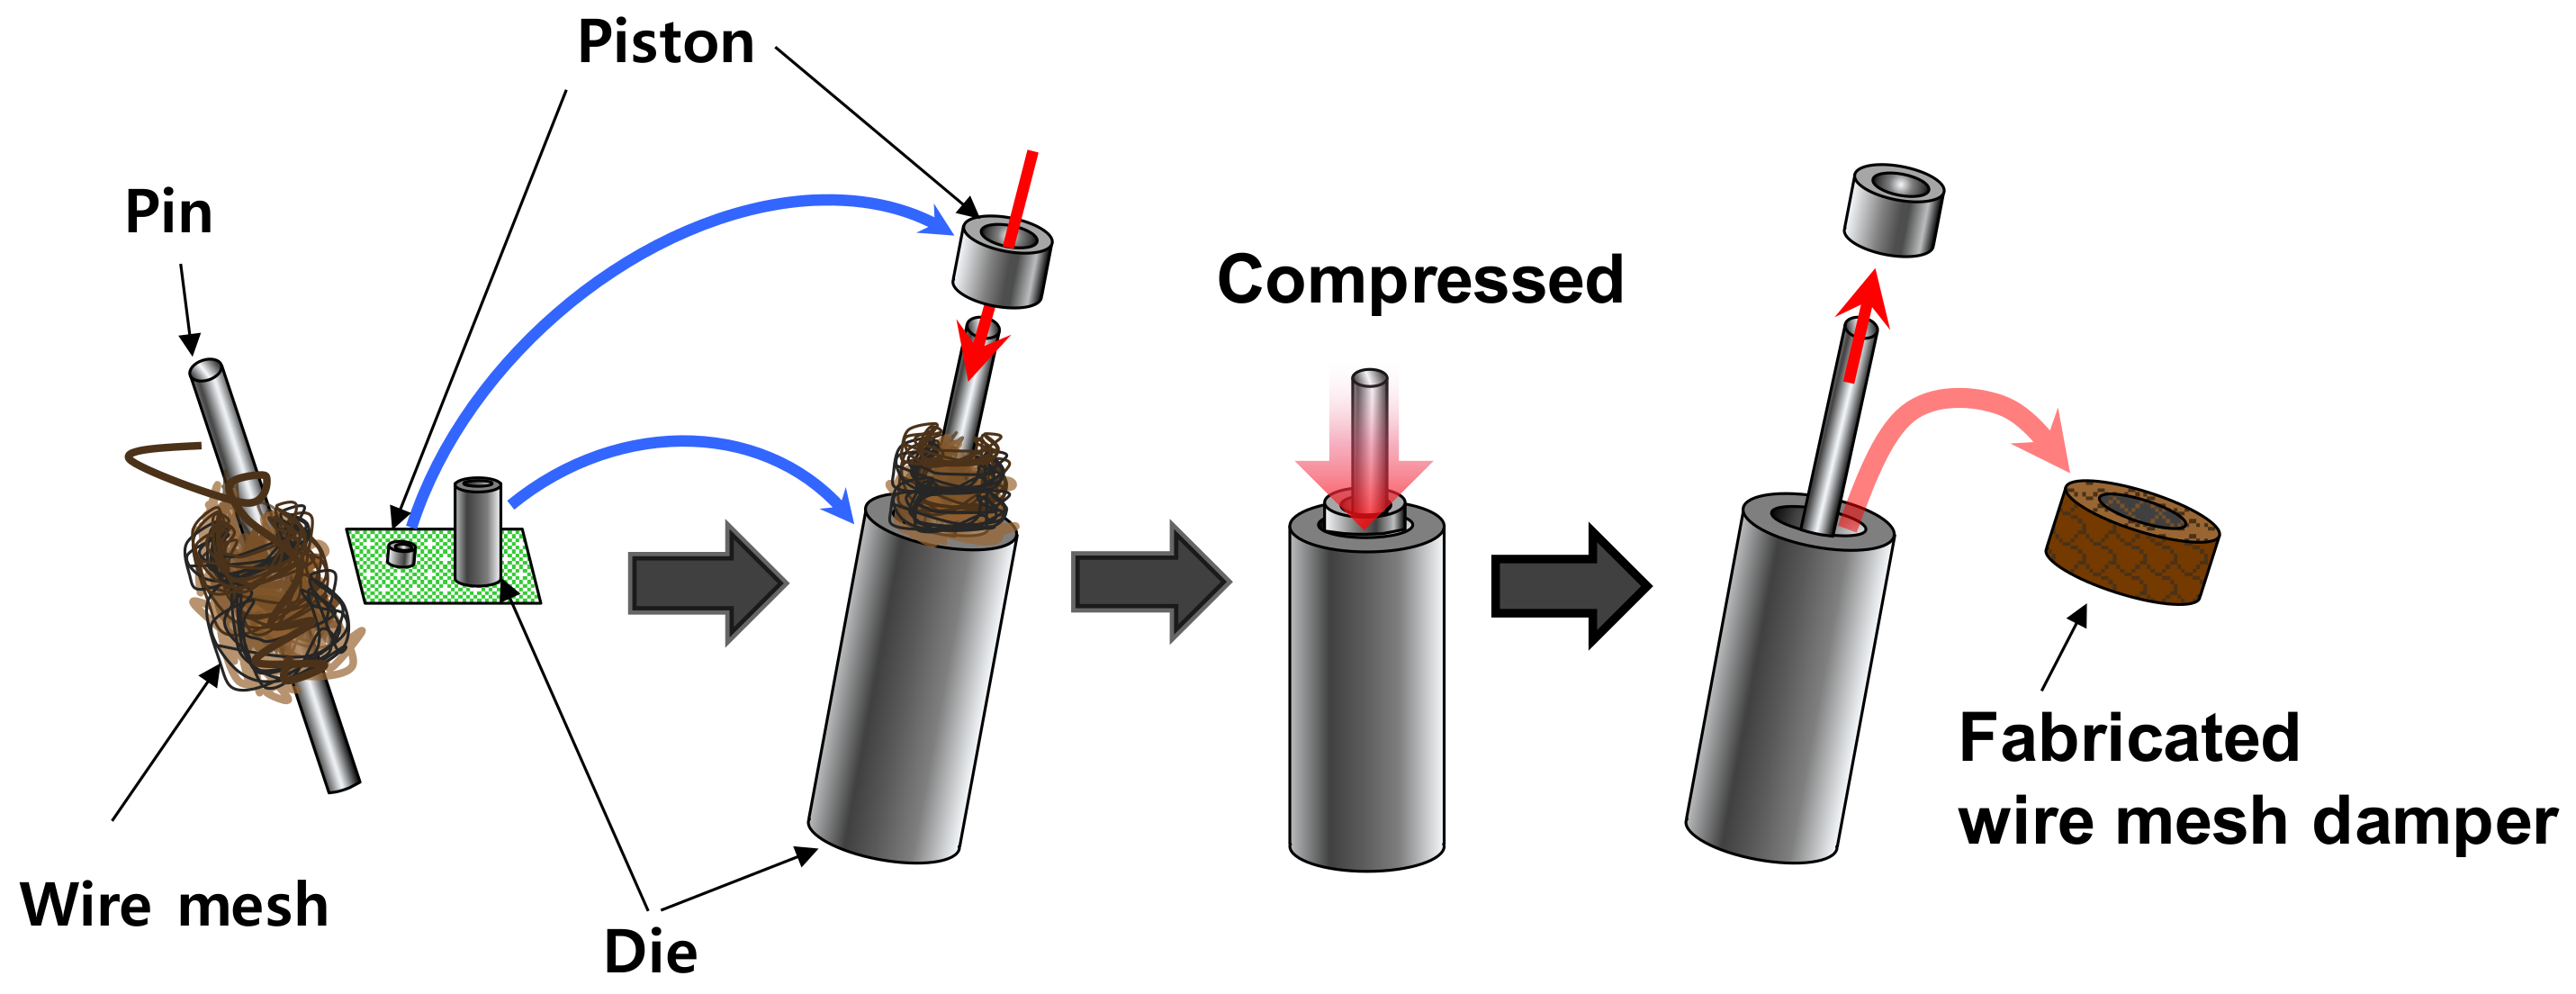
Figure A1 shows the fabrication procedure of a WMD. Knitted wire is wrapped around the pin, which produces the WMD inner diameter, and then fully inserted into the die, which produces the WMD outer diameter. The pistons are inserted into each end of the die and gradually compressed to form the height. The radial thickness of the WMD relies on the number of wraps around the pin and the crimp height of the knitted wire. Note that when the radii of curvature of the formed WMD is not accurately fabricated, the WMD is not complete contact with the journal outer surface and housing inner surface due to varying WMD thickness. The WMD density determines the desired stiffness and damping characteristics. A series of load application is required to achieve the desired radial thickness since the height of the WMD slightly increases once the applied load on the pistons is removed. The fabricated WMDs may sag or creep over time, i.e., the overall dimension may change with time. Note that WMDs are commercially available and very inexpensive.
Figure A1.
Fabrication procedure of a wire mesh damper.

Appendix B
Table A1, Table A2, Table A3 and Table A4 list the calculated combined standard uncertainty (Uc) of the identified KLocal, Edis, γ, and μf in Figure 9, Figure 11, Figure 12 and Figure 13. See [35] for full details on the fundamental equations and calculation procedures for the combined standard uncertainty.

Table A1.
Combined standard uncertainty of identified WMD local stiffness (KLocal) in Figure 9.
Table A1.
Combined standard uncertainty of identified WMD local stiffness (KLocal) in Figure 9.
| WMD Density | Preload | Identified Value | Uncertainty (Uc) | % Uncertainty |
|---|---|---|---|---|
| ρ = 42% | 13 N | 1.001 MN/m | 0.103 MN/m | 10% |
| 15 N | 1.161 MN/m | 0.137 MN/m | 12% | |
| 18 N | 1.397 MN/m | 0.046 MN/m | 3% | |
| 19 N | 1.402 MN/m | 0.053 MN/m | 4% | |
| 20 N | 1.608 MN/m | 0.092 MN/m | 6% | |
| 25 N | 1.931 MN/m | 0.121 MN/m | 6% | |
| ρ = 32% | 13 N | 0.820 MN/m | 0.083 MN/m | 10% |
| 15 N | 0.873 MN/m | 0.087 MN/m | 10% | |
| 18 N | 1.015 MN/m | 0.080 MN/m | 8% | |
| 19 N | 1.215 MN/m | 0.064 MN/m | 5% | |
| 21 N | 1.319 MN/m | 0.080 MN/m | 6% | |
| 23 N | 1.373 MN/m | 0.135 MN/m | 10% | |
| ρ = 25% | 13 N | 0.662 MN/m | 0.030 MN/m | 5% |
| 15 N | 0.734 MN/m | 0.011 MN/m | 2% | |
| 18 N | 0.807 MN/m | 0.030 MN/m | 4% | |
| 21 N | 0.854 MN/m | 0.063 MN/m | 7% | |
| 23 N | 0.937 MN/m | 0.058 MN/m | 6% | |
| 28 N | 1.015 MN/m | 0.135 MN/m | 13% |
Table A2.
Combined standard uncertainty of WMD dissipated energy (Edis) in Figure 11.
Table A2.
Combined standard uncertainty of WMD dissipated energy (Edis) in Figure 11.
| WMD Density | Preload | Identified Value | Uncertainty (Uc) | % Uncertainty |
|---|---|---|---|---|
| ρ = 42% | 13 N | 25.602 μN·m | 5.450 μN·m | 21% |
| 15 N | 27.173 μN·m | 4.340 μN·m | 16% | |
| 18 N | 29.752 μN·m | 10.707 μN·m | 36% | |
| 19 N | 35.525 μN·m | 10.734 μN·m | 30% | |
| 20 N | 37.664 μN·m | 1.656 μN·m | 4% | |
| 25 N | 48.721 μN·m | 15.307 μN·m | 31% | |
| ρ = 32% | 13 N | 22.425 μN·m | 4.908 μN·m | 22% |
| 15 N | 23.332 μN·m | 2.325 μN·m | 10% | |
| 18 N | 26.323 μN·m | 1.453 μN·m | 5% | |
| 19 N | 29.765 μN·m | 11.512 μN·m | 39% | |
| 21 N | 32.040 μN·m | 4.614 μN·m | 14% | |
| 23 N | 31.102 μN·m | 11.903 μN·m | 38% | |
| ρ = 25% | 13 N | 22.252 μN·m | 1.345 μN·m | 6% |
| 15 N | 24.149 μN·m | 4.701 μN·m | 20% | |
| 18 N | 25.149 μN·m | 6.272 μN·m | 25% | |
| 21 N | 27.691 μN·m | 1.744 μN·m | 6% | |
| 23 N | 27.109 μN·m | 6.594 μN·m | 24% | |
| 28 N | 27.493 μN·m | 4.216 μN·m | 15% |
Table A3.
Combined standard uncertainty of WMD loss factor (γ) in Figure 12.
Table A3.
Combined standard uncertainty of WMD loss factor (γ) in Figure 12.
| WMD Density | Preload | Identified Value | Uncertainty (Uc) | % Uncertainty |
|---|---|---|---|---|
| ρ = 42% | 13 N | 0.207 | 0.021 | 10% |
| 15 N | 0.210 | 0.025 | 12% | |
| 18 N | 0.212 | 0.008 | 3% | |
| 19 N | 0.213 | 0.008 | 4% | |
| 20 N | 0.214 | 0.013 | 6% | |
| 25 N | 0.216 | 0.014 | 6% | |
| ρ = 32% | 13 N | 0.249 | 0.026 | 11% |
| 15 N | 0.236 | 0.023 | 10% | |
| 18 N | 0.221 | 0.016 | 7% | |
| 19 N | 0.218 | 0.013 | 6% | |
| 21 N | 0.211 | 0.013 | 6% | |
| 23 N | 0.206 | 0.020 | 10% | |
| ρ = 25% | 13 N | 0.302 | 0.014 | 4% |
| 15 N | 0.292 | 0.005 | 2% | |
| 18 N | 0.278 | 0.011 | 4% | |
| 21 N | 0.266 | 0.019 | 7% | |
| 23 N | 0.259 | 0.017 | 6% | |
| 28 N | 0.245 | 0.032 | 13% |
Table A4.
Combined standard uncertainty of WMD dry-friction coefficients (μf) in Figure 13.
Table A4.
Combined standard uncertainty of WMD dry-friction coefficients (μf) in Figure 13.
| WMD Density | Preload | Identified Value | Uncertainty (Uc) | % Uncertainty |
|---|---|---|---|---|
| ρ = 42% | 13 N | 0.159 | 0.009 | 6% |
| 15 N | 0.160 | 0.006 | 4% | |
| 18 N | 0.161 | 0.013 | 8% | |
| 19 N | 0.161 | 0.012 | 8% | |
| 20 N | 0.161 | 0.002 | 1% | |
| 25 N | 0.162 | 0.013 | 8% | |
| ρ = 32% | 13 N | 0.186 | 0.010 | 6% |
| 15 N | 0.177 | 0.004 | 2% | |
| 18 N | 0.167 | 0.002 | 1% | |
| 19 N | 0.164 | 0.017 | 10% | |
| 21 N | 0.160 | 0.006 | 4% | |
| 23 N | 0.156 | 0.014 | 9% | |
| ρ = 25% | 13 N | 0.219 | 0.003 | 1% |
| 15 N | 0.214 | 0.011 | 5% | |
| 18 N | 0.208 | 0.013 | 6% | |
| 21 N | 0.203 | 0.003 | 2% | |
| 23 N | 0.200 | 0.012 | 6% | |
| 28 N | 0.193 | 0.007 | 4% |
References
- Ryu, K.; Ashton, Z. Bump-Type Foil Bearings and Flexure Pivot Tilting Pad Bearings for Automotive Oil-Free Turbochargers: Highlights in Rotordynamic Performance. ASME J. Eng. Gas Turbines Power 2016, 138, 042501. [Google Scholar] [CrossRef]
- San Andrés, L.; Vistamehr, A. Nonlinear Rotordynamics of Vehicle Turbochargers: Parameters Affecting Sub Harmonic Whirl Frequencies and Their Jump. In Proceedings of the 8th IFToMM International Conference on Rotordynamics, Seoul, Korea, 12–15 September 2010. [Google Scholar]
- Ehrich, F.; Childs, D. Self-Excited Vibration in High-Performance Turbomachinery. Mech. Eng. 1984, 106, 66–79. [Google Scholar]
- San Andrés, L.; Rivadeneira, J.; Chinta, M.; Gjika, K.; LaRue, G. Nonlinear Rotordynamics of Automotive Turbochargers: Predictions and Comparisons to Test Data. ASME J. Eng. Gas Turbines Power 2007, 129, 488–493. [Google Scholar] [CrossRef]
- San Andrés, L.; Rivadeneira, J.C.; Gjika, K.; Groves, C.; LaRue, G. A Virtual Tool for Prediction of Turbocharger Nonlinear Dynamic Response: Validation against Test Data. ASME J. Eng. Gas Turbines Power 2007, 129, 1035–1046. [Google Scholar] [CrossRef]
- San Andrés, L.; Barbarie, V.; Bhattacharya, A.; Gjika, K. On the Effect of Thermal Energy Transport to the Performance of (Semi) Floating Ring Bearing Systems for Automotive Turbochargers. ASME J. Eng. Gas Turbines Power 2012, 134, 102507. [Google Scholar] [CrossRef]
- Kim, K.; Ryu, K. Rotordynamic Analysis of Automotive Turbochargers Supported on Ball Bearings and Squeeze Film Dampers in Series: Effect of Squeeze Film Damper Design Parameters and Rotor Imbalances. Tribol. Lubr. 2018, 34, 8–15. [Google Scholar] [CrossRef]
- Zeidan, F.; San Andrés, L.; Vance, J. Design and Application of Squeeze Film Dampers in Rotating Machinery. In Proceedings of the 25th Turbomachinery Symposium, College Station, TX, USA, 17–19 September 1996; pp. 169–188. [Google Scholar]
- San Andrés, L.; Jeung, S.-H.; Den, S.; Savela, G. Squeeze Film Damper: An Experimental Appraisal of Their Dynamic Performance. In Proceedings of the 2016 Asia Turbomachinery & Pump Symposium, Marina Bay Sands, Singapore, 22–25 February 2016; pp. 1–23. [Google Scholar]
- Childs, D.W. Turbomachinery Rotordynamics with Case Studies; Minter Spring Publishing: Wellborn, TX, USA, 2013; pp. 281–317. ISBN 978-0-615-85272-0. [Google Scholar]
- Delgado, A.; San Andrés, L. A Model for Improved Prediction of Force Coefficients in Grooved Squeeze Film Dampers and Grooved Oil Seal Rings. ASME J. Tribol. 2010, 132, 032202. [Google Scholar] [CrossRef]
- San Andrés, L. Squeeze Film Damper: Operation, Models and Technical Issues, Modern Lubrication Theory, Notes 13, Texas A&M University, 2012. Available online: http://hdl.handle.net/1969.1/93253 (accessed on 27 February 2018).
- San Andrés, L. Force Coefficients for a Large Clearance Open Ends Squeeze Film Damper with a Central Groove: Experiments and Predictions. Tribol. Int. 2014, 71, 17–25. [Google Scholar] [CrossRef]
- Jeung, S.-H.; San Andrés, L.; Bradley, G. Forced Coefficients for a Short Length, Open-Ends Squeeze Film Damper with End Grooves: Experiments and Predictions. ASME J. Gas Turbines Power 2016, 138, 022501. [Google Scholar] [CrossRef]
- Vance, J.; Zeidan, F.; Murphy, B. Machinery Vibration and Rotordynamics; John Wiley & Sons, Inc.: Hoboken, NJ, USA, 2010; pp. 214–216. ISBN 978-0-471-46213-2. [Google Scholar]
- Chirathadam, T.A. Measurements of Drag Torque and Lift off Speed and Identification of Stiffness and Damping in A Metal Mesh Foil Bearing. Master’s Thesis, Texas A&M University, College Station, TX, USA, December 2009. [Google Scholar]
- Childs, D.W. The Space Shuttle Main Engine High-Pressure Fuel Turbopump Rotordynamic Instability Problem. AMSE J. Eng. Power 1978, 100, 48–57. [Google Scholar] [CrossRef]
- Okayasu, A.; Ohta, T.; Azuma, T.; Fujita, T.; Aoki, H. Vibration Problem in the LE-7 LH2 Turbopump. In Proceedings of the 26th Joint Propulsion Conference, Orlando, FL, USA, 16–18 July 1990. [Google Scholar]
- Zarzour, M.; Vance, J. Experimental Evaluation of a Metal Mesh Bearing Damper. ASME J. Eng. Gas Turbines Power 2000, 122, 1–4. [Google Scholar] [CrossRef]
- Ertas, B.H.; Al-Khateeb, E.M.; Vance, J.M. Rotordynamic Bearing Dampers for Cryogenic Rocket Engine Turbopumps. AIAA J. Propul. Power 2003, 119, 674–682. [Google Scholar] [CrossRef]
- Ertas, B.; Luo, H.; Hallman, D. Dynamic Characteristics of Shape Memory Alloy Metal Mesh Dampers. In Proceedings of the 50th AIAA Structures, Structural Dynamics, and Materials Conference, Palm Springs, CA, USA, 4–7 May 2009. [Google Scholar]
- San Andrés, L.; Chirathadam, T.A. A Metal Mesh Foil Bearing and a Bump-Type Foil Bearing: Comparison of Performance for Two Similar Size Gas Bearings. ASME J. Eng. Gas Turbines Power 2012, 134, 102501. [Google Scholar] [CrossRef]
- Feng, K.; Zhao, X.; Zhang, Z.; Zhang, T. Numerical and Compact Model of Metal Mesh Foil Bearings. STLE Trib. Trans. 2016, 59, 480–490. [Google Scholar] [CrossRef]
- Ertas, B. Compliant Hybrid Journal Bearings Using Integral Wire Mesh Dampers. ASME J. Eng. Gas Turbines Power 2009, 131, 1–11. [Google Scholar] [CrossRef]
- Feng, K.; Liu, W.; Zhang, Z.; Zhang, T. Theoretical Model of a Flexure Pivot Tilting Pad Gas Bearings with Metal Mesh Dampers in Parallel. Tribol. Int. 2016, 94, 26–38. [Google Scholar] [CrossRef]
- Ryu, K. Fluid Film Hydrodynamic Flexure Pivot Tilting Pad Semi-Floating Ring Journal Bearing with Compliant Dampers. U.S. Patent 9,599,149 B2, 21 March 2017. [Google Scholar]
- Juvinall, R.C.; Marshek, K.M. Machine Component Design, 5th ed.; John Wiley & Sons, Inc.: Hoboken, NJ, USA, 2012; p. 817. ISBN 978-1-118-09226-2. [Google Scholar]
- San Andrés, L.; Ryu, K.; Kim, T.H. Identification of Structural Stiffness and Energy Dissipation Parameters in a Second Generation Foil Bearing—Effect of Shaft Temperature. ASME J. Eng. Gas Turbines Power 2011, 133, 032501. [Google Scholar] [CrossRef]
- Larsen, J.S.; Varela, A.C.; Santos, I.F. Numerical and Experimental Investigation of Bump Foil Mechanical Behavior. Tribol. Int. 2014, 74, 46–56. [Google Scholar] [CrossRef] [Green Version]
- Ginsberg, J.H. Mechanical and Structural Vibrations: Theory and Application, 1st ed.; John Wiley & Sons, Inc.: New York, NY, USA, 2001; pp. 130–139. ISBN 0-471-12808-2. [Google Scholar]
- Rao, S.S. Mechanical Vibration, 5th ed.; Prentice Hall: Upper Saddle River, NJ, USA, 2011; pp. 192–198. ISBN 978-0-13-212819-3. [Google Scholar]
- De Silva, C.W. Vibration: Fundamentals and Practice, 2nd ed.; CRC Press: Boca Raton, FL, USA, 2007; pp. 385–427. ISBN 0-8493-1987-0. [Google Scholar]
- San Andrés, L.; Ryu, K. On the Nonlinear Dynamics of Rotor-Foil Bearing Systems: Effects of Shaft Acceleration, Mass Imbalance and Bearing Mechanical Energy Dissipation. In Proceedings of the ASME 2011 Turbo Expo, Vancouver, British Columbia, Canada, 6–10 June 2011. [Google Scholar]
- Park, E.Q. Effect of Bearing Design Parameters on Rotordynamic Stability and Shaft Motion Amplitudes for Automotive Turbocharges Supported on Fully Floating Ring Bearings. Master’s Thesis, Hanyang University, Seoul, Korea, February 2018. [Google Scholar]
- Bang, J. Experimental Identification of Structural Stiffness and Damping Coefficients in Bump-type Foil Bearings. Master’s Thesis, Hanyang University, Seoul, Korea, February 2017. [Google Scholar]
- Hoffmann, R.; Liebich, R. Characterization and Calculation of Nonlinear Vibrations in Gas Foil Bearing Systems—An Experimental and Numerical investigation. J. Sound Vib. 2018, 412, 389–409. [Google Scholar] [CrossRef]
Figure 1.
Schematic view (not to scale) of automotive turbocharger (TC) supported on semi-floating ring bearing (SFRB). Right inset figure depicts schematic view (not to scale) of SFRB.
Figure 1.
Schematic view (not to scale) of automotive turbocharger (TC) supported on semi-floating ring bearing (SFRB). Right inset figure depicts schematic view (not to scale) of SFRB.
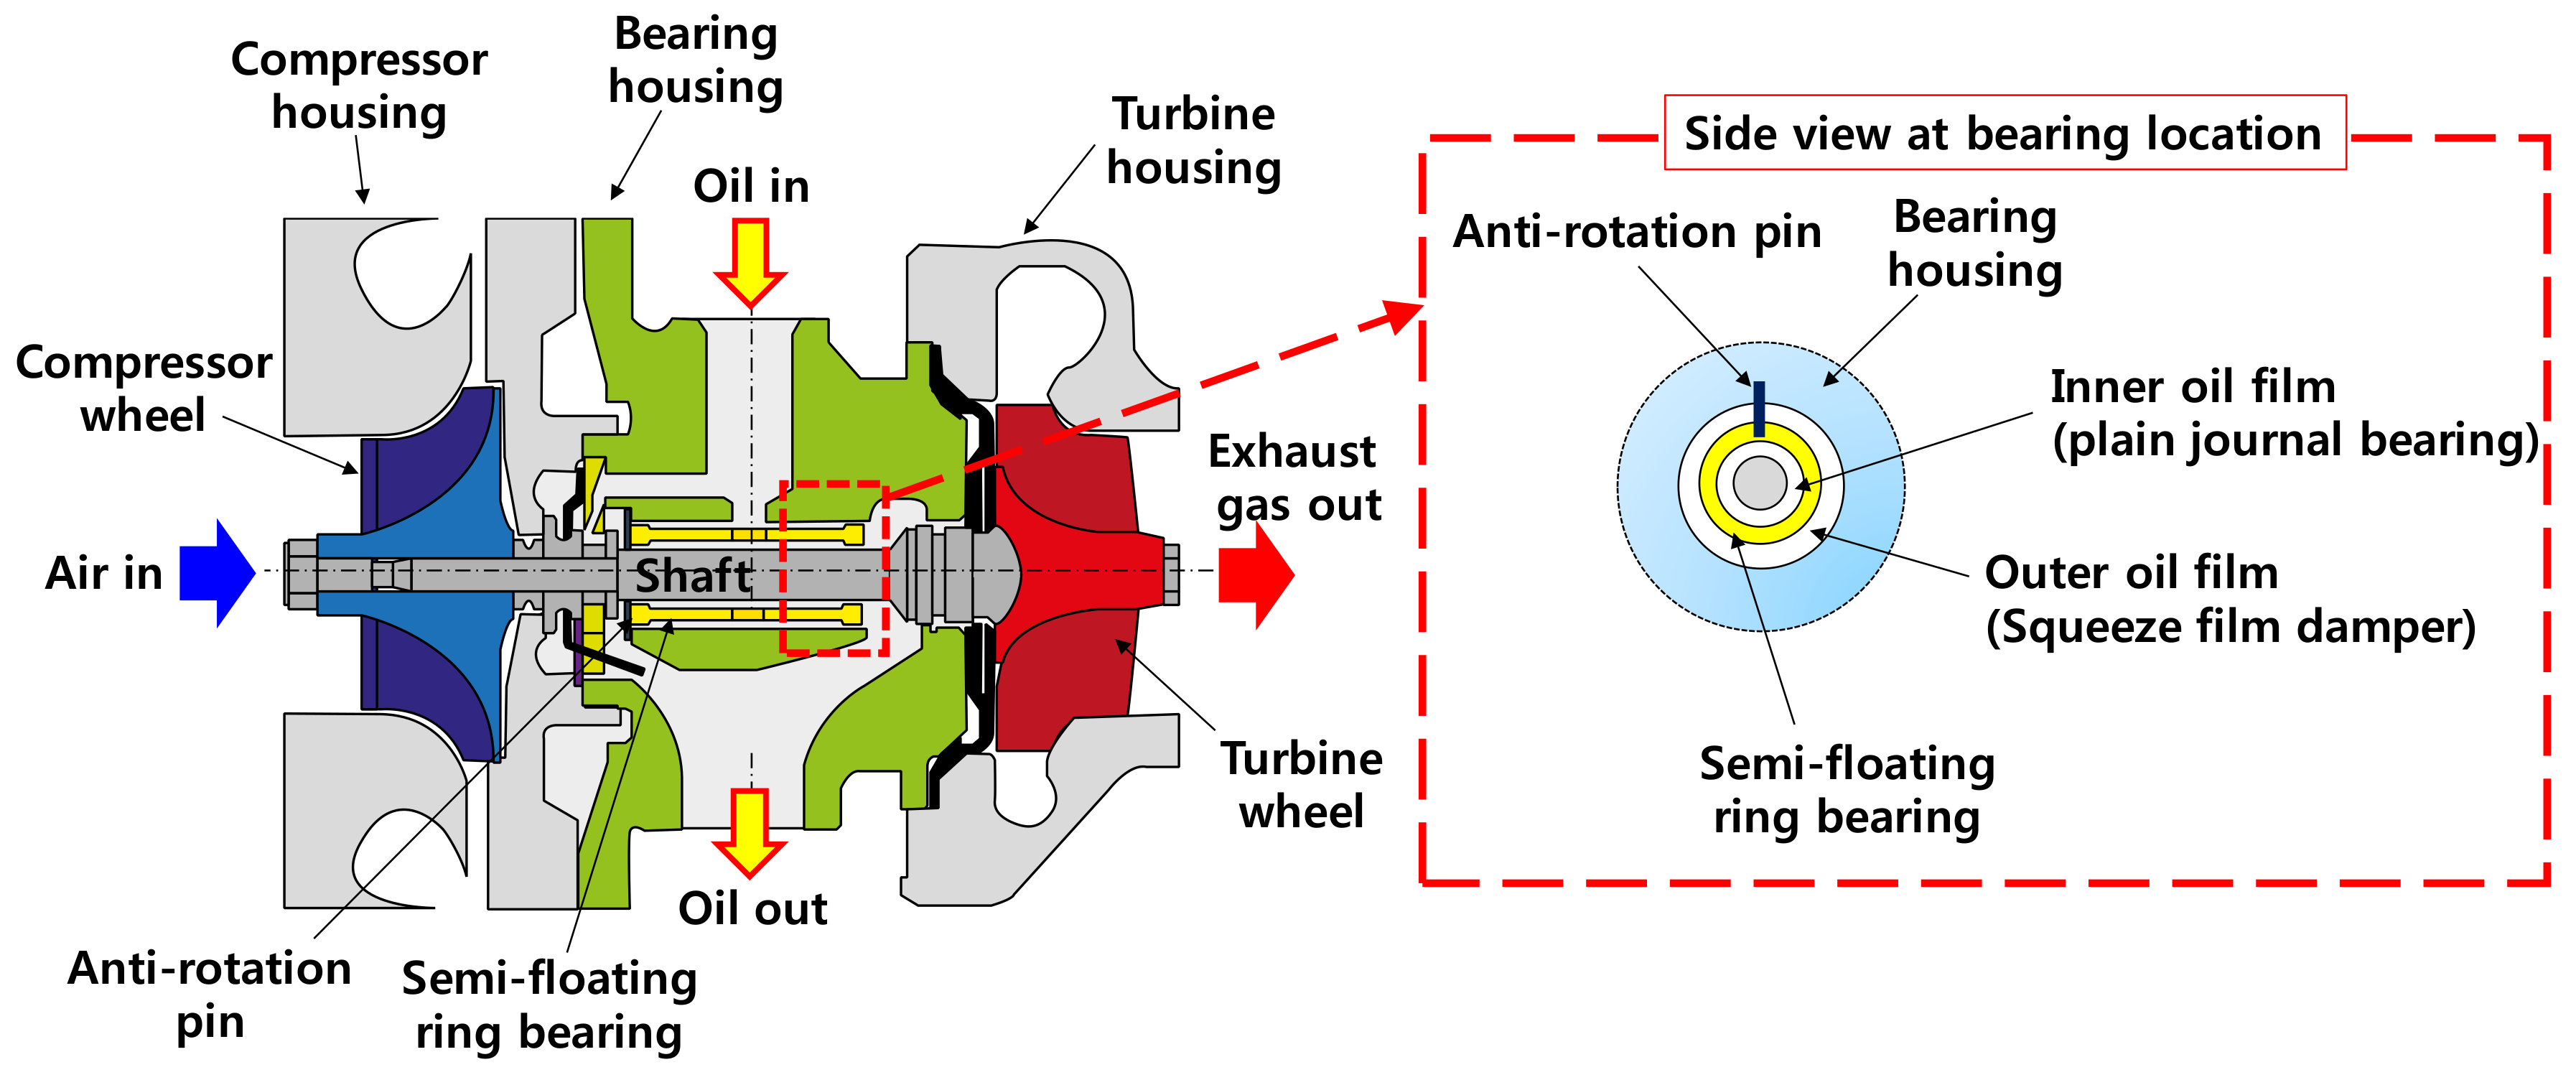
Figure 2.
Photograph of commercial SFRB (top figures) and wire mesh damper (WMD) integrated SFRB (bottom figures) for the present study. Left and right figures show front and side views, respectively.
Figure 2.
Photograph of commercial SFRB (top figures) and wire mesh damper (WMD) integrated SFRB (bottom figures) for the present study. Left and right figures show front and side views, respectively.

Figure 3.
Schematic view (not to scale) and photograph of experimental setup for WMD structural deflection test with static push-pull loads.
Figure 3.
Schematic view (not to scale) and photograph of experimental setup for WMD structural deflection test with static push-pull loads.

Figure 4.
Photographs of test copper WMDs.

Figure 5.
Full hysteresis loop measurements: Applied static load (left vertical axis) and static load per unit volume (right vertical axis) versus recorded displacement (upper horizontal axis) and displacement per unit volume (lower horizontal axis) for the test WMDs during loading and unloading cycles. The circle, square, and diamond symbols denote the structural stiffnesses of the WMDs with 42%, 32%, and 25% densities, respectively.

Figure 6.
Full hysteresis loop measurements: Structural stiffness (left vertical axis) and structural stiffness unit volume (right vertical axis) versus applied static load (upper horizontal axis) and versus applied static load per unit volume of WMD (lower horizontal axis). The circle, square, and diamond symbols denote the structural stiffnesses of the WMDs with 42%, 32%, and 25% densities, respectively.

Figure 7.
Full hysteresis loop measurements: Structural stiffness (left vertical axis) and structural stiffness per unit volume (right vertical axis) versus displacement (upper horizontal axis) and versus displacement per unit volume of WMD (lower horizontal axis). The circle, square, and diamond symbols denote the structural stiffnesses of the WMDs with 42%, 32%, and 25% densities, respectively.

Figure 8.
Local hysteresis loop measurements: Static load FS (left vertical axis) and static load FS per unit volume (right vertical axis) versus displacement (upper horizontal axis) and versus displacement per unit volume of WMD (lower horizontal axis). (a) WMD of 42% density; (b) WMD of 32% density; (c) WMD of 25% density.


Figure 9.
Local hysteresis loop measurements: Local stiffness KLocal (left vertical axis) and local stiffness KLocal per unit volume (right vertical axis) versus preload FPre (upper horizontal axis) and versus preload FPre per unit volume of WMD (lower horizontal axis). The circle, square, and diamond symbols denote the local stiffnesses of the WMDs with 42%, 32%, and 25% densities, respectively.

Figure 10.
Comparison of structural stiffnesses from measurements of full and local hysteresis loops. Continuous solid lines and symbols denote KFull_Loading + KFull_Unloading and KLocal, respectively.
Figure 10.
Comparison of structural stiffnesses from measurements of full and local hysteresis loops. Continuous solid lines and symbols denote KFull_Loading + KFull_Unloading and KLocal, respectively.

Figure 11.
Local hysteresis loop measurements: Dissipated energy Edis (left vertical axis) and dissipated energy Edis per unit displacement and volume of WMD (right vertical axis) versus preload FPre (upper horizontal axis) and versus preload FPre per unit volume of WMD (lower horizontal axis). The circle, square, and diamond symbols denote the dissipated energies of the WMDs with 42%, 32%, and 25% densities, respectively.

Figure 12.
Local hysteresis loop measurements: WMD loss factor γ (left vertical axis) and equivalent damping ratio ζeq (right vertical axis) versus (a) preload FPre (upper horizontal axis) and preload FPre per unit volume of WMD (lower horizontal axis), (b) local stiffness KLocal (upper horizontal axis) and local stiffness KLocal per unit volume of WMD (lower horizontal axis), and (c) dissipated energy Edis (upper horizontal axis) and dissipated energy Edis per unit displacement and volume of WMD (lower horizontal axis). The circle, square, and diamond symbols denote loss factors of the WMDs with 42%, 32%, and 25% densities, respectively.


Figure 13.
Local hysteresis loop measurements: Estimated dry friction coefficients μf versus (a) preload FPre (upper horizontal axis) and preload FPre per unit volume of WMD (lower horizontal axis), (b) local stiffness KLocal (upper horizontal axis) and local stiffness KLocal per unit volume of WMD (lower horizontal axis), and (c) dissipated energy Edis (upper horizontal axis) and dissipated energy Edis per unit displacement and volume of WMD (lower horizontal axis). The circle, square, and diamond symbols denote loss factors of the WMDs with 42%, 32%, and 25% densities, respectively.


Table 1.
Dimensions of test wire mesh dampers (WMDs) 1.
| Parameters | WMDρ=42% | WMDρ=32% | WMDρ=25% |
|---|---|---|---|
| Mass | 1.453 g | 1.062 g | 0.854 g |
| Outer diameter | 13.430 mm | 13.284 mm | 13.352 mm |
| Inner diameter | 9.713 mm | 9.206 mm | 9.320 mm |
| Width | 5.782 mm | 5.127 mm | 5.322 mm |
| Volume | 3.906 × 10⁻⁷ m3 | 3.693 × 10⁻⁷ m3 | 3.820 × 10⁻⁷ m3 |
1 Measurement accuracy: Mass ± 0.001 g. Diameter and length ± 0.001 mm.
© 2018 by the authors. Licensee MDPI, Basel, Switzerland. This article is an open access article distributed under the terms and conditions of the Creative Commons Attribution (CC BY) license (http://creativecommons.org/licenses/by/4.0/).
Share and Cite
MDPI and ACS Style
Ryu, K.; Yi, H. Wire Mesh Dampers for Semi-Floating Ring Bearings in Automotive Turbochargers: Measurements of Structural Stiffness and Damping Parameters. Energies 2018, 11, 812. https://doi.org/10.3390/en11040812
AMA Style
Ryu K, Yi H. Wire Mesh Dampers for Semi-Floating Ring Bearings in Automotive Turbochargers: Measurements of Structural Stiffness and Damping Parameters. Energies. 2018; 11(4):812. https://doi.org/10.3390/en11040812
Chicago/Turabian StyleRyu, Keun, and Howon Yi. 2018. "Wire Mesh Dampers for Semi-Floating Ring Bearings in Automotive Turbochargers: Measurements of Structural Stiffness and Damping Parameters" Energies 11, no. 4: 812. https://doi.org/10.3390/en11040812
Note that from the first issue of 2016, this journal uses article numbers instead of page numbers. See further details here.