Article

FPGA-Based Online PQD Detection and Classification through DWT, Mathematical Morphology and SVD

by
Misael Lopez-Ramirez
1,
Eduardo Cabal-Yepez
1,*,
Luis M. Ledesma-Carrillo
1,
Homero Miranda-Vidales
2,
Carlos Rodriguez-Donate
1 and
Rocio A. Lizarraga-Morales
1
1
Division de Ingenierias, Campus Irapuato-Salamanca, Universidad de Guanajuato/Carr. Salamanca-Valle km 3.5+1.8, Comunidad de Palo Blanco, Salamanca 36700, Guanajuato, Mexico
2
Facultad de Ingenieria, Universidad Autonoma de San Luis Potosi, Av. Manuel Nava 8, Zona Universitaria, San Luis Potosi 78290, Mexico
*
Author to whom correspondence should be addressed.
Energies 2018, 11(4), 769; https://doi.org/10.3390/en11040769
Submission received: 18 February 2018 / Revised: 14 March 2018 / Accepted: 16 March 2018 / Published: 28 March 2018
(This article belongs to the Section F: Electrical Engineering)

Abstract

:
Power quality disturbances (PQD) in electric distribution systems can be produced by the utilization of non-linear loads or environmental circumstances, causing electrical equipment malfunction and reduction of its useful life. Detecting and classifying different PQDs implies great efforts in planning and structuring the monitoring system. The main disadvantage of most works in the literature is that they treat a limited number of electrical disturbances through personal computer (PC)-based computation techniques, which makes it difficult to perform an online PQD classification. In this work, the novel contribution is a methodology for PQD recognition and classification through discrete wavelet transform, mathematical morphology, decomposition of singular values, and statistical analysis. Furthermore, the timely and reliable classification of different disturbances is necessary; hence, a field programmable gate array (FPGA)-based integrated circuit is developed to offer a portable hardware processing unit to perform fast, online PQD classification. The obtained numerical and experimental results demonstrate that the proposed method guarantees high effectiveness during online PQD detection and classification of real voltage/current signals.

1. Introduction

Non-linear loads and environmental circumstances might induce power quality disturbances (PQD) in electric distribution networks [1], which produce equipment malfunction and useful life reduction. International standards as the IEEE 1159 [2], and IEC 61000-4-30 [3] establish the requirements of quality, control, and reliability for electric distribution systems, i.e., power quality indexes (PQI). The most common electrical disturbances are voltage sag/swell, interruptions, wave faults, and harmonic distortion. For diminishing power quality (PQ) problems, it is important to determine the components provoking the problems in the distribution signal [4,5]. This demands thorough and effective PQ monitoring and classification, making it an open subject for research since the detection and classification of electrical disturbances causing PQDs are difficult tasks that require a high level of engineering [6].
Many methodologies have been proposed in the literature for PQD classification. For instance, in [7], two empirical-mode, decomposition-based techniques are used for signal denoising in PQD classification. In [8], automatic disturbance analysis and fault location are performed utilizing statistical and multilevel signal processing. In [9], different static-compensator topologies are investigated for reactive power compensation, harmonic elimination, load balancing, and neutral current compensation. In [10], an algorithm that uses wavelet transform (WT) and S-transform, along with RELIEFF feature selection for the assessment and recognition of flickers in wind turbines is presented. WT is among the most commonly used techniques for PQ analysis. For instance, Reference [11] classifies the wavelet-based methods that are applied for discrimination, classification and phase selection during fault identification of transmission systems. In [12], a technique based on an adaptive wavelet neural networks for low-order harmonic estimation is presented. In [13], wavelet decomposition that provides additional coefficients with border distortion is proposed to detect induced transients. Other approaches use different signal analysis techniques during PQD classification [5]. In [14], a review of the main contributions to PQ in ships is presented, considering the instrumentation and regulations for electrical installations. In [15], empirical-mode decomposition and Hilbert transform are used to classify PQDs. In [16], voltage flickers are classified by extracting the fundamental signal from the voltage envelope and its spectral analysis. Digital signal processing (DSP) plays an important role, since the electrical power supply signal must be analyzed to obtain useful attributes for PQD classification [17,18]. In [19], a rule-based approach using discrete wavelet transform (DWT) and fast Fourier transform is proposed for detecting PQDs. In [20], a reconfigurable system is developed that applies short-term Fourier transform and DWT to the current and voltage signals supplied to industrial equipment. In [21], electrical disturbances are identified through wavelet decomposition, hidden Markov model, and Dempster–Shafer classification. In [22], a technique based on spectral kurtosis and artificial neural networks (ANNs) is used to classify sags, swells, interruptions, oscillation transients, and impulsive transients. In this regard, ANNs are a common method used for PQD classification [5,23]. Among many different ANN structures, the multilayer perceptron trained through the back-propagation algorithm, named back-propagation network (BPN), is the most popular [24,25]. In [26], a multilayer-perceptron ANN is used for the harmonic compensation of the electric current signal. In [27], a multilayer-perceptron ANN is used to detect grid voltage disturbances and enhance the performance and stability of a rectifier. In [28], a multilayer-perceptron ANN is used to correct the power factor and regulate the zero voltage in a three-phase distribution static compensator, under nonlinear loads. On the other hand, mathematical morphology is concerned with the shape of a signal waveform in the time domain [29]. Mathematical morphology has gained applications in the study of power system faults/disturbances, where the interaction with disturbances modifies the waveform information of a signal [30]. For instance, in [31], broken rotor bars are detected using mathematical morphology and motor current signature analysis. In [32], a technique applying empirical mode decomposition and mathematical morphology for partial discharge signal denoising is proposed. The main disadvantage of the above described works is that they rely on personal computer (PC)-based techniques that make it difficult to perform a portable, online PQD classification in real-time.
The novel contribution of this work is a methodology for PQD detection and classification through DWT, singular value decomposition (SVD), and statistical analysis. Mathematical morphology is used to emphasize the characteristics of the analyzed signal to achieve an effective PQD classification using an ANN. On the other hand, the timely and reliable classification of different PQDs is necessary. In this regard, field programmable gate arrays (FPGA), which use spatial computations, offer an appropriate high-performance and low-cost solution for several applications compared to other implementation platforms, such as digital signal processors and microcontrollers [33,34]. Hence, a portable FPGA-based hardware processing unit, suitable for implementation on devices from different vendors, was developed to show the usefulness of the proposed method to perform fast, online classification of pure sine, sag, swell, outage, harmonic, harmonic with sag, harmonic with swell, high frequency transient, and low frequency transient. The numerical and experimental results validate the efficacy of the introduced approach when applied to computer models and acquired voltage/current signals from real experiments, reaching an accuracy of more than 99% in identifying and classifying the treated PQDs.

2. Mathematical Framework

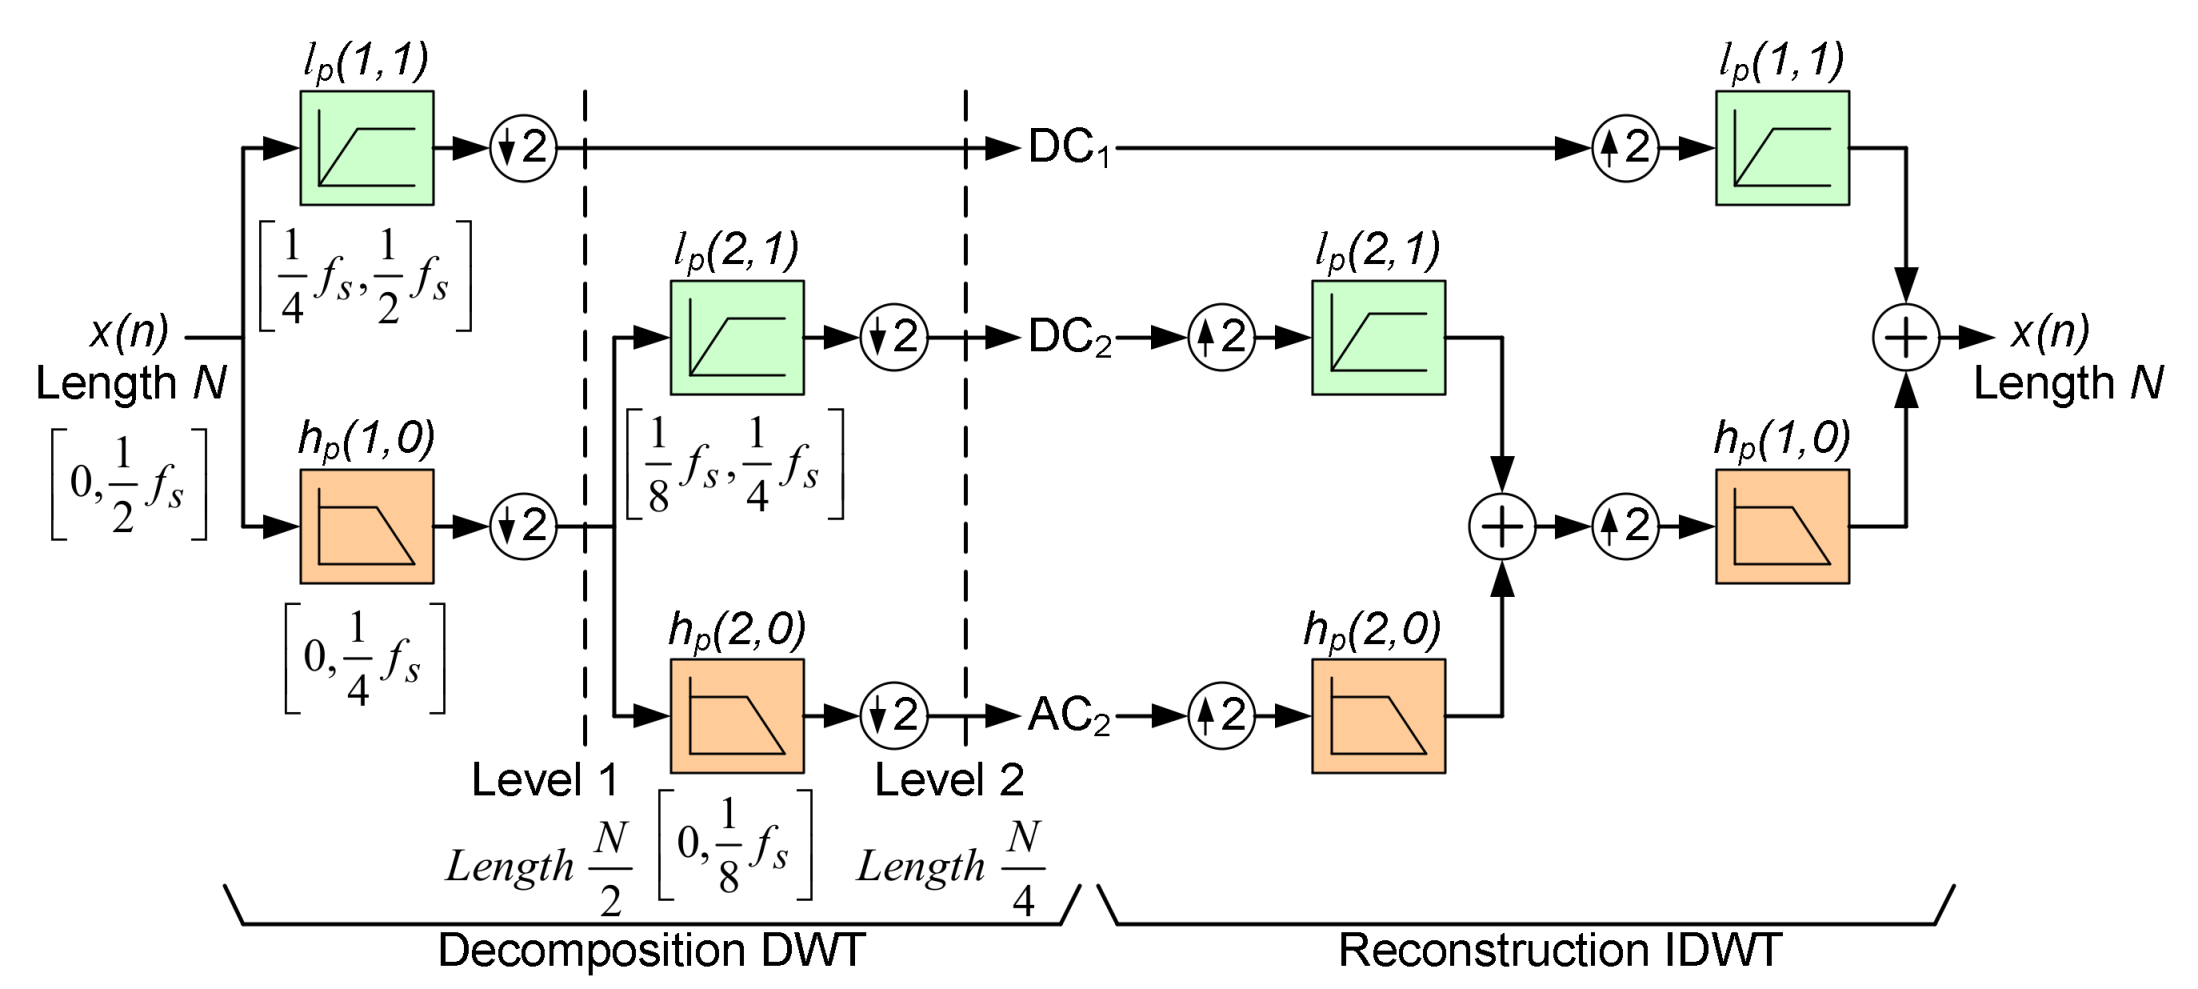
2.1. Discrete Wavelet Transform

Discrete wavelet transform (DWT) has been extensively used to analyze non-stationary signals [35,36,37]. In DWT computation, a digital signal is decomposed into a series of approximations (ACk), and details (DCk) per decomposition level k, corresponding to the analyzed signal’s low- and high- frequency bands, respectively. Hence, the ACk and the DCk series are produced by examining the signal x(n) through a low-pass filter hp(k, l) and a high-pass filter lp(k, l); and subsequently applying a down-sampling operation, where l represents the transformation-node. Once the required decomposition levels L are obtained, the reconstruction process to recreate the corresponding frequency-band signal is performed by applying an up-sampling procedure followed by the corresponding hp(k, l) and lp(k, l) filters. The DWT process described above is known as the Mallat algorithm [38], and is depicted in Figure 1, where fs is the sampling frequency, and the filter backs hp(k, l) and lp(k, l) are associated to a wavelet mother function ψ(t) [39].

2.2. Mathematical Morphology

Mathematical morphology is an approach to analyzing digital signals based on their shape. It is related to image processing; however, it can be used in a large number of different applications, since its concepts can be applied to signals of any dimensions. Dilation and erosion are elemental operations in mathematical morphology [29,40].

2.3. Dilation

Dilation expands the shape of a signal using a given structuring element. If IN denotes the collection of all points P = [x1, x2, …, xN] in an Euclidean space with N-dimensions, the binary dilation of F by G, where FIN, and GIN, is given by
( F G ) ( n , m ) = O R i , j [ A N D ( G ( i , j ) , F ( n i , m j ) ) ] .
In (1), OR and AND describe the basic binary operations, n and m represent the horizontal and vertical indexes respectively, and i and j represent their corresponding displacement.

2.4. Erosion

Erosion is a morphological transformation where a given signal is probed as to how a structuring element fits it. The binary erosion of F by G, where FIN, and GIN, is given by
( F θ G ) ( n , m ) = A N D i , j [ O R ( F ( n + i , m + j ) , G ¯ ( i , j ) ) ] .
In this work, F stands for the signal to be analyzed, e.g., “Signal with disturbances”, and G represents the structuring element, which is chosen by the user. Therefore, the operations F G and F Ɵ G represent transformed signals.

2.5. Singular Value Decomposition SVD

The singular value decomposition (SVD) of a of a matrix M with dimensions n × m is given as
M = U S V T ,
where U and V are orthogonal matrices with the dimensions n × n and m × m, respectively; S is a diagonal matrix with dimensions n × m that contains non-negative real number σ1, σ2, , σn on its diagonal, which are called singular values of M [41]. For a non-square matrix, if r = rank(M), at least r of the singular values are non-zeros and non-negatives. Current SVD algorithms use orthogonal transformations and diagonalization processes by rotation to obtain a numerical approximation of the SVD.

2.6. Jacobi Rotations

The matrix J, known as the Jacobi rotation matrix, is used to produce a diagonal matrix AD from a matrix AS, which is symmetric [42].
A D = J T A S J .
If M in (3) is not symmetric, it can still be made into a diagonal matrix by utilizing rotations to make it symmetric As, followed by further rotations to make it diagonal AD.
A S = J T M .
A D = J T A S J .

2.7. Hestenes–Jacobi Algorithm

In the Hestenes–Jacobi algorithm [43], if a non-symmetric matrix M with dimensions n × m is multiplied by a matrix U that is orthogonal, a matrix D—whose rows are orthogonal—is obtained
D = U M = S V ,
where the square norm of each row of D is contained in the diagonal matrix S. On the other hand, the orthonormal matrix V is obtained by dividing the rows in D by their corresponding square norm. Hence, (7) can be rewritten as
M = U T S V .
where the singular values (σ1, σ2, , σn) of M are the root squares of s1, s2, , sn, which are the elements in the diagonal matrix S.

2.8. Artificial Neural Networks

There are different architectures for artificial neural networks (ANNs); however, one of the most well-known architectures is multilayer perceptron (MLP), which maps data at the input wi (i = 1, 2, …, k) to a group of wanted outputs yj (j = 1, 2, …, p). The information in the MLP flows from the input layer of neurons, through the hidden layer, to the nodes at the output, as depicted in Figure 2. In general, the MLP carries out a nonlinear transformation of the information from previous layers, applying weighted summations. The MLP is typically trained using the supervised learning method of back propagation (BP). The BP algorithm maps input data to required outputs by reducing the error between the wanted and computed outputs [44].
A MLP with BP has characteristic attributes that are suitable for real-time electric-power disturbance classification:
(a)
Since the output can be computed using parallel operations, MLP can be suitable for real-time applications.
(b)
MLP can produce coherent results for distinct combinations of inputs for which the network has not been trained (surveillance applications).
(c)
Their implementation in hardware is straightforward in terms of conventional pattern recognition methods.

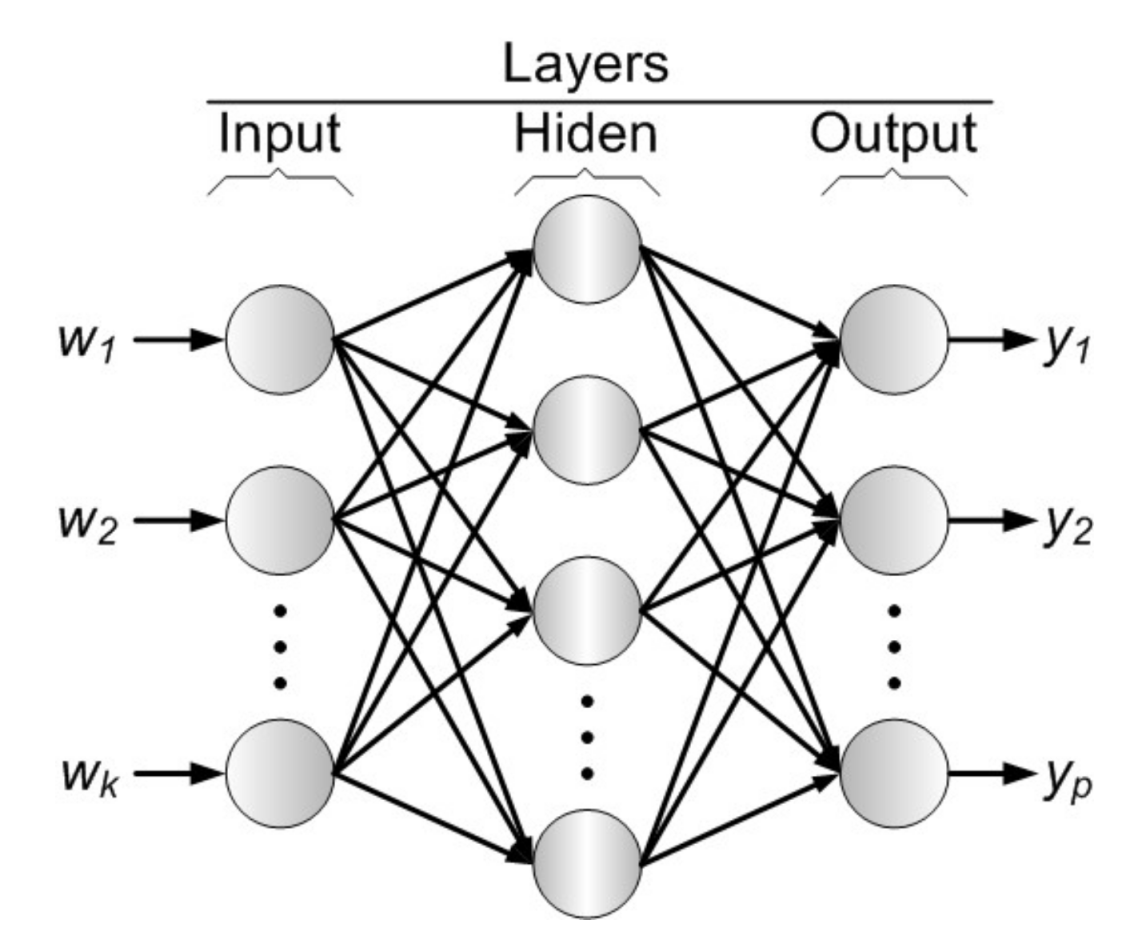
2.9. ANN Architecture

In this paper, an ANN with MLP architecture—which contains 16 input neurons, 22 neurons in the hidden layer, and 9 neurons at the output—is implemented to identify and classify PQDs in electric power systems. Each PQD is associated with an output node. The activation function log-sigmoid (LS) defined in (9), is used for the neurons in the hidden and output layers, where the weighted-input summation to the nodes is represented by η. The Levenberg–Marquardt learning method was used in the back-propagation algorithm to train the network offline, with randomly-set initial weights and biases, and a mean square error of 1 × 10⁻⁸ as the learning rate. The BP algorithm was used to train the MLP in the proposed approach because of its straightforward hardware implementation in an FPGA.
L S ( η ) = 1 1 + e η .

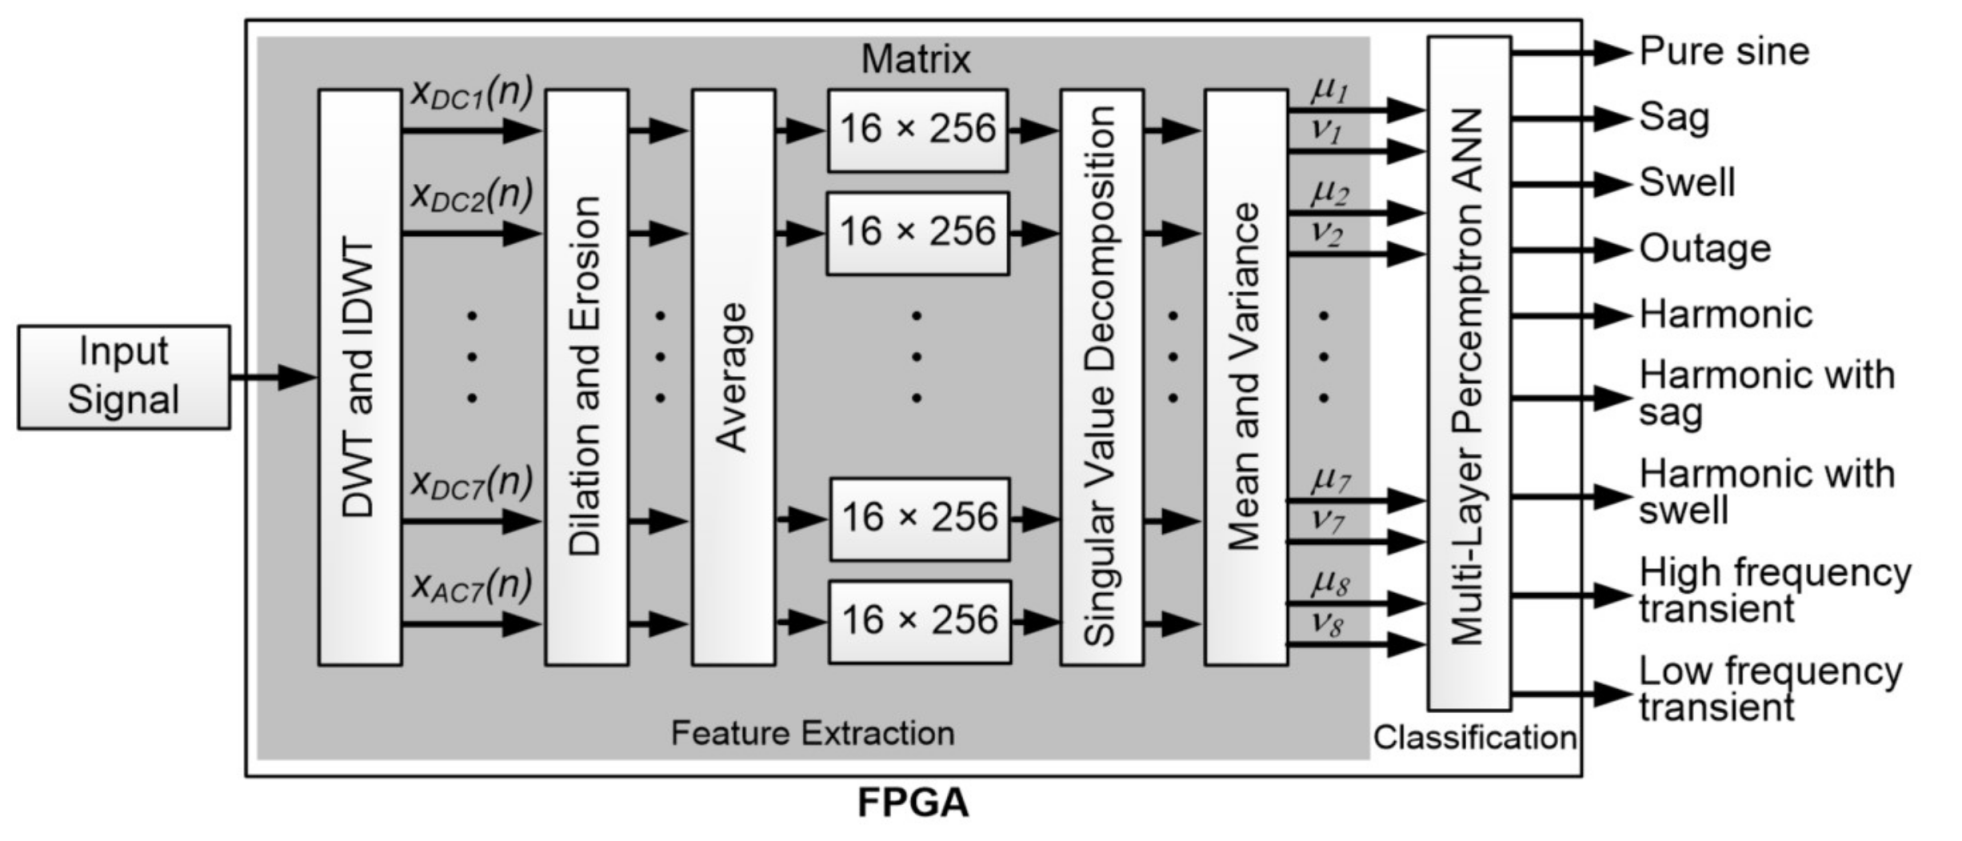
3. Proposed Methodology
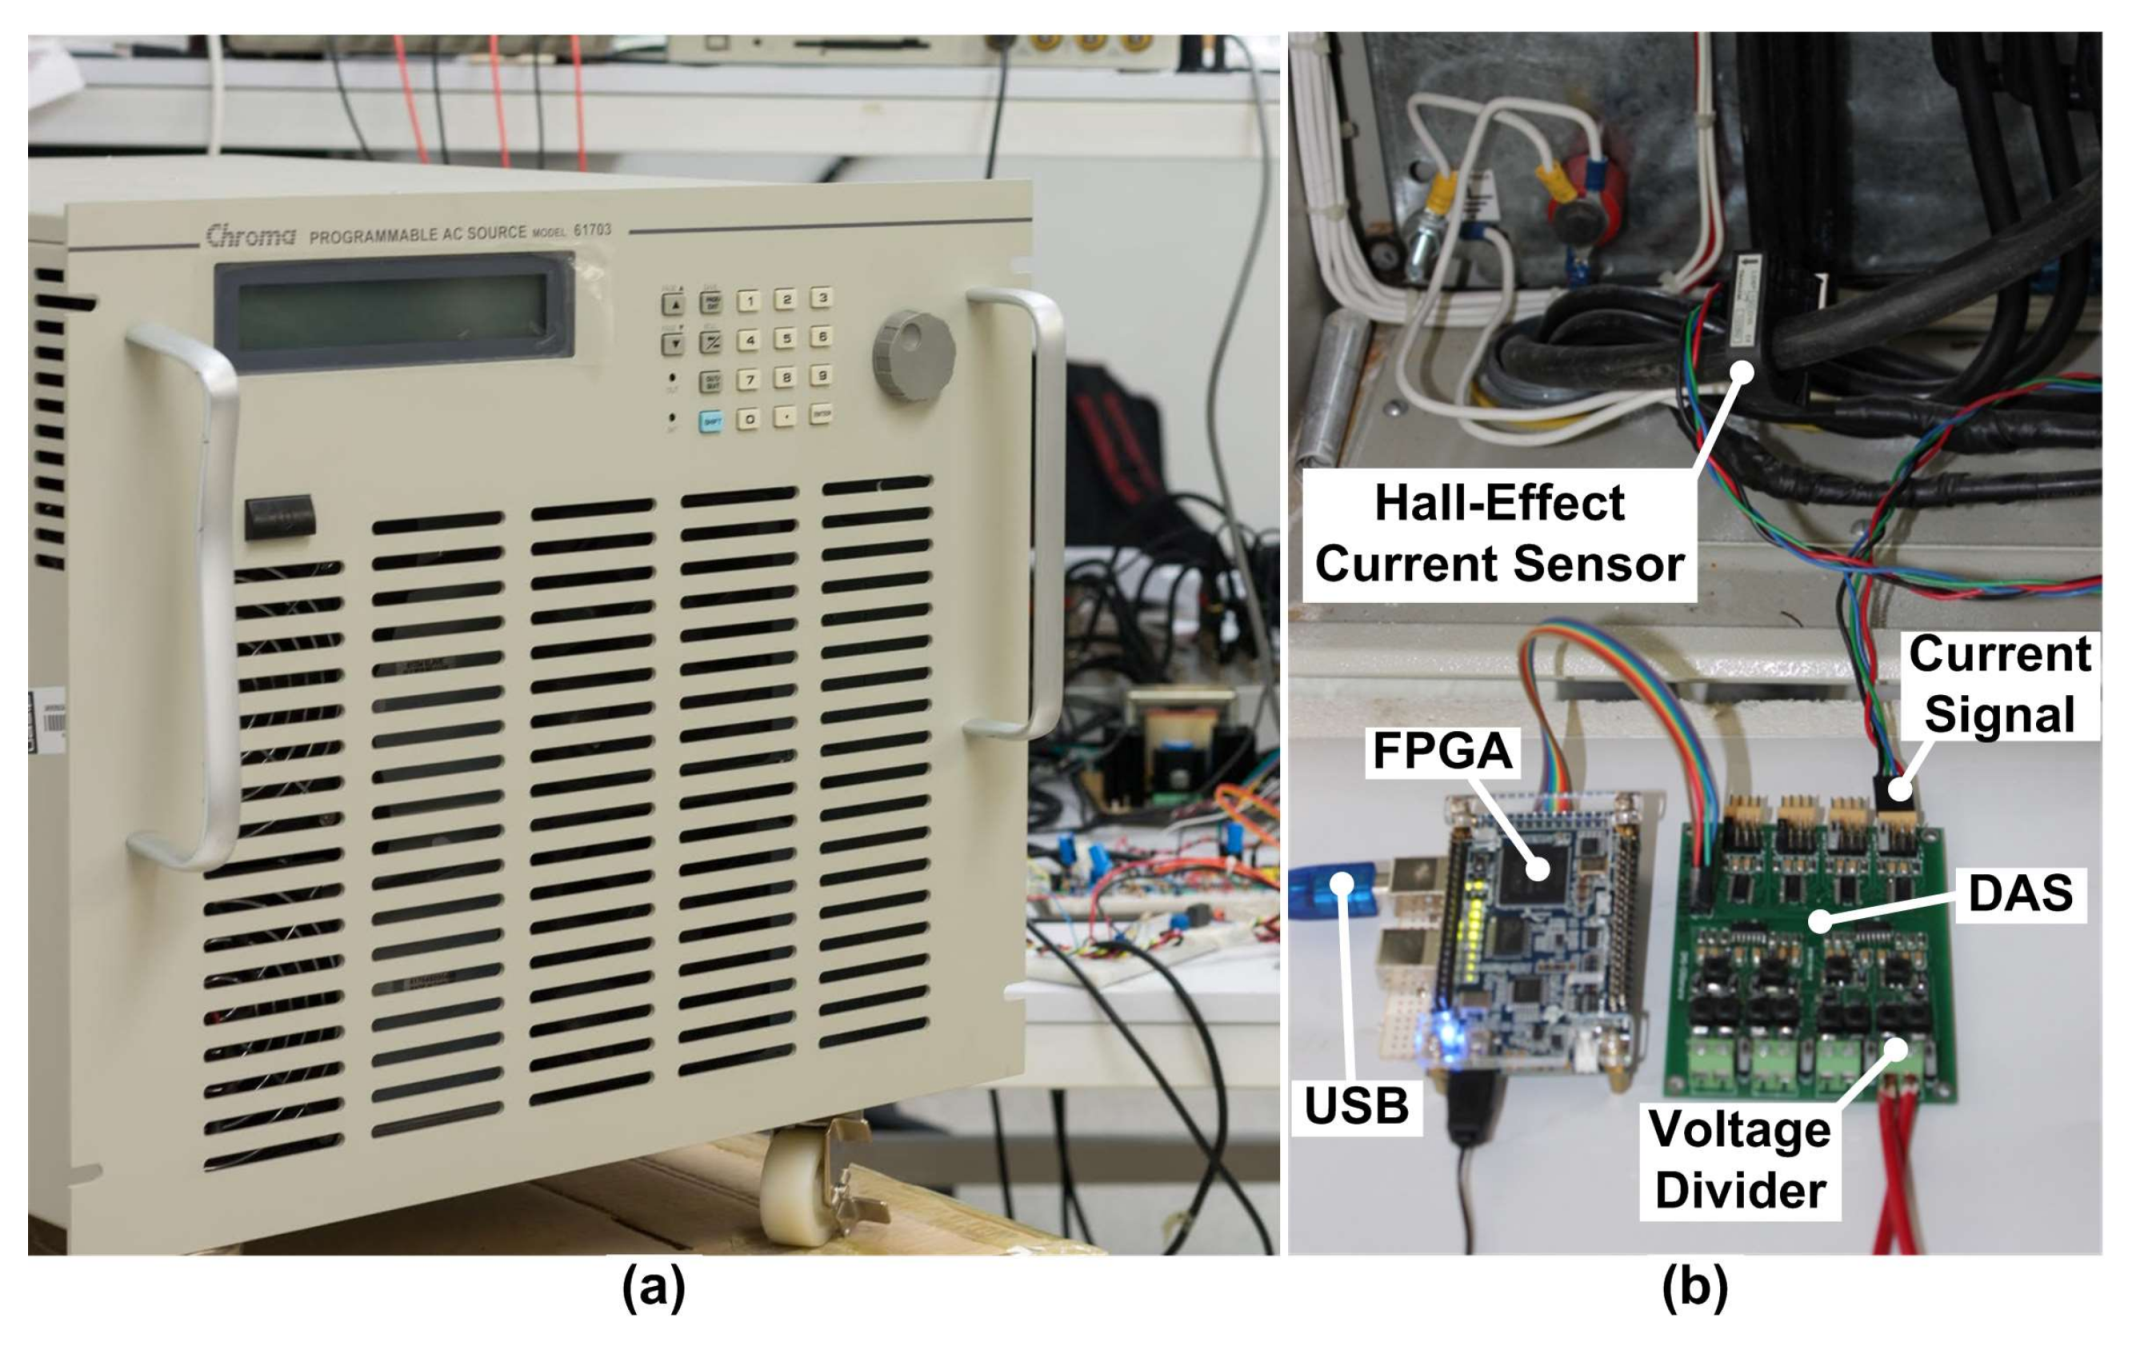
In the proposed methodology, the input voltage/current signal is decomposed and reconstructed into seven frequency levels utilizing DWT and inverse DWT (IDWT), obtaining eight frequency bands. DWT decomposition and reconstruction are used to emphasize the intrinsic characteristics of the voltage/current signal at different frequency bandwidths, which might vary according to the PQD. Mathematical morphology (dilatation and erosion) is applied to the eight frequency bands to remove the imperfections generated during pre-processing by taking into account the form and structure of the signal. Erosion refines the characteristics of the signal, whereas dilation highlights them. Therefore, the average between dilation and erosion provides a signal with balanced geometric characteristics (filtered signal). To find out intrinsic characteristics of form and reduce the information being processed, the filtered signal in each frequency band is arranged into a 16 × 256 matrix, and the corresponding singular values are computed. The obtained 16 singular values from the eight matrices are statistically analyzed by computing their mean and variance (μ1, ʋ1, μ2, ʋ2, …, μ8, ʋ8). Finally, the used MLP ANN takes these 16 statistical parameters (two for each frequency band) as inputs to identify and classify the PQD. The proposed methodology is depicted in Figure 3. The complete scheme is implemented in an FPGA device, for online detection and classification of PQD in real time, utilizing the very high speed integrated circuit hardware description language (VHDL).

4. Experiment Setup

A group of nine numerically-simulated signals, and a second group of nine signals obtained through real experimentation were used to validate the introduced methodology for detecting and classifying different PQDs.

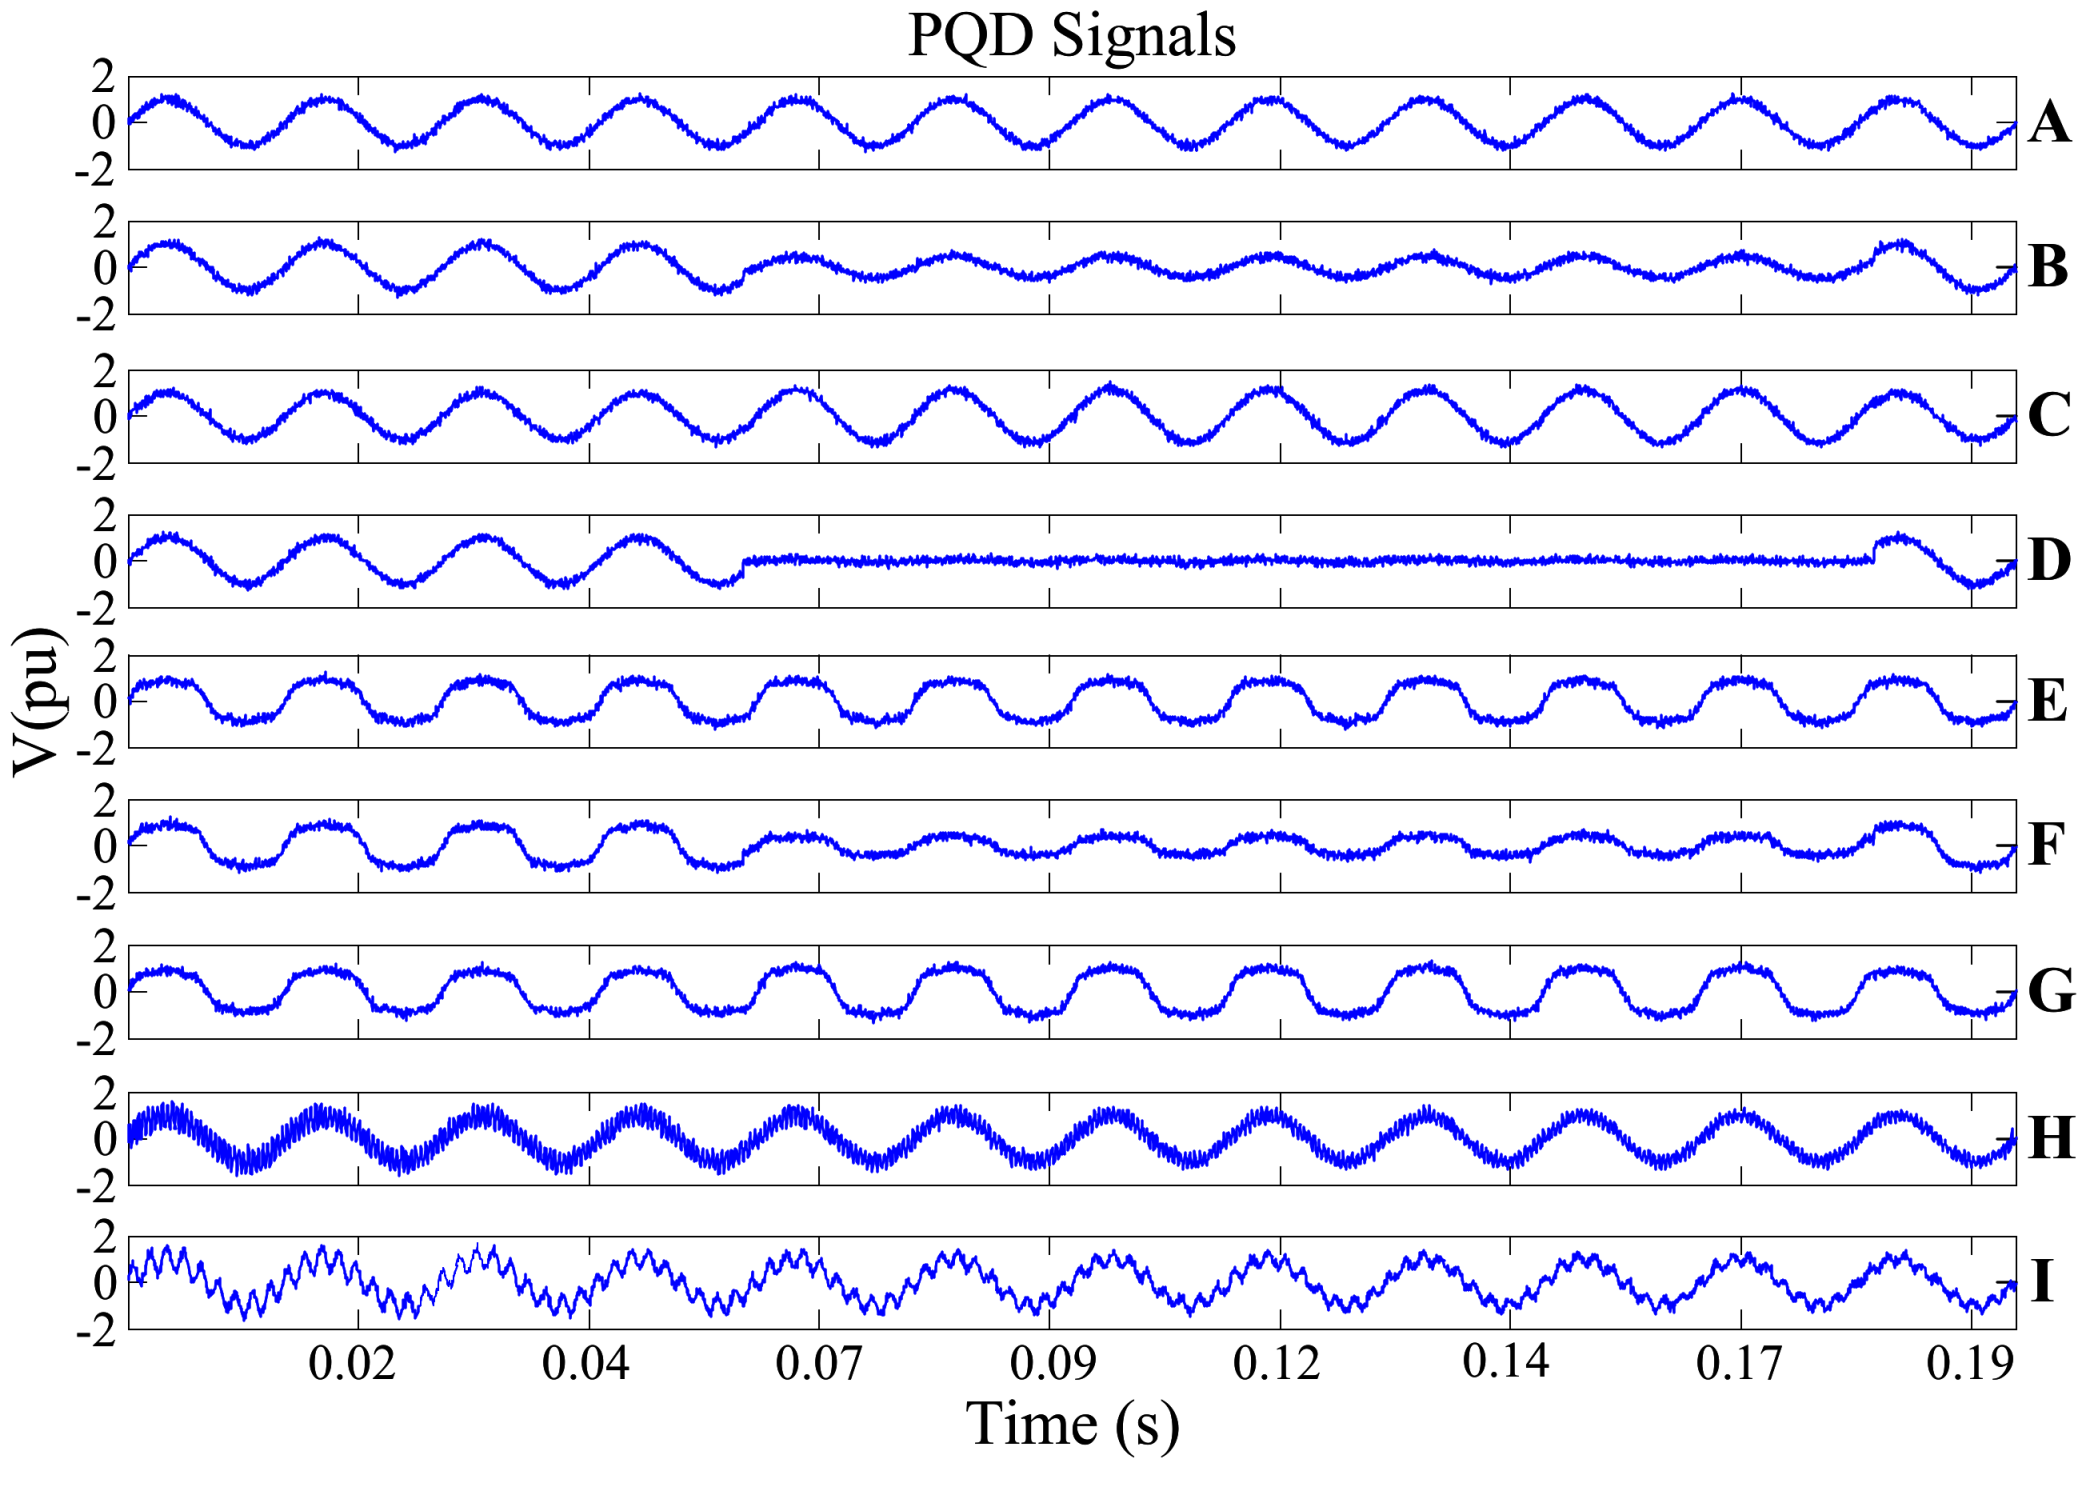
4.1. Numerical Simulation of PQDs

For the numerical validation of the proposed methodology through computer models, nine different signals that might be present in a power distribution system were generated following the mathematical descriptions in Table 1, which are defined by international standards for monitoring electric PQ [2,45]—namely, pure sine, sag, swell, outage, harmonic, harmonic with sag, harmonic with swell, high frequency transient and low frequency transient, are considered; 300 signals from each type, with different noise level—were generated to train the ANN. A total of 300 other cases were produced to test the methodology. The sampling window was 200 ms, which is the standard sampling period for PQD assessment [2,3], with a sampling frequency of 20.48 KHz. Each sampled signal contained 4096 discrete values, as shown in Figure 4.

4.2. Benchmark for Real PQD

To show the effectiveness of the introduced method for PQD identification and classification, it was necessary to construct a real experimental test bench. In this case, a programmable alternating current (AC) power supply was used as a PQD generator, the Chroma Power Source model 61703 [46]. This power source has the characteristics of producing several PQDs, such as harmonics, interharmonics, sags, swells, flickers, frequency variations and others. Disturbances can be single phase or three phase. On the other hand, to test the harmonics behavior, a three-phase diode rectifier was used to obtain a real harmonic current pattern based on a non-linear load. The power consumption of the non-linear load was 5kVA with 27.23% of total harmonic distortion (THD). The data acquisition system (DAS) consists of one analog-to-digital converter model ADC128S022—this chip has eight channels with 12 bits in a serial configuration. The system instrumentation obtained 4096 samples at a sampling rate of f0 = 20.48 kHz. The experimental setup for voltage/current signal acquisition is shown in Figure 5.
On the laboratory test bench, the real voltage or current signal was measured using a voltage divider or a hall-effect sensor, respectively, per phase leg. The sampled signal was adjusted for processing by the analog-to-digital converter in the DAS. The synchronization and control signals were provided by the FPGA. Once the acquired signal had been processed, the DAS forwarded it to a PC via an USB interface; i.e., the DAS works as link between the proposed FPGA-based monitoring system and a PC. Real signals with PQDs, captured utilizing the experimental test bench, are shown in Figure 6.

5. Results

5.1. Hardware Implementation

The FPGA-based hardware implementation figures for the proposed method for detecting and classifying PQDs in a power distribution system are summarized in Table 2. A Daubechies 1 wavelet mother function was used for DWT and IDWT computation. To demonstrate the independence of the technology to the FPGA-based hardware realization for the developed methodology, two different platforms were used: (a) The Xilinx Virtex-6 ML605 (Xilinx, Inc., San Jose, CA, USA); and (b) Altera Stratix-III DE3 EP3SE260 (Altera Corporation, San Jose, CA, USA). Table 2 shows the percentage ratio of used resources, and the maximum operational frequency reached when a 16-bit resolution was considered for implementation on each device.
The corresponding response time for each implementation is shown in Table 3; from which it can be seen that the PC-based software counterpart of the introduced method—implemented on a 3.30 GHz Intel Core i7 processor utilizing MATLAB—was outperformed by the two FPGA implementations by at least three orders of magnitude. The introduced FPGA-based hardware processing unit consumed 197,615 clock cycles to perform the PQD detection and classification, which is equivalent to around 2.99 ms in an FPGA Virtex 6 from Xilinx and 2.57 ms in an FPGA Stratix-III from Altera. At this point, it is worthwhile to note that an electric power distribution system has a slow response to transient events; hence, the proposed system response of 2.99 ms surpasses by far that required by international standards, namely one quarter of a cycle (4.1667 ms) [47].

5.2. Validation of Classification Results

The performance regarding identifying and classifying PQD through the introduced methodology was assessed using the common sensitive metrics, true positive (TP), true negative (TN), false positive (FP), and false negative (FN) rates to compute its accuracy by
A c c u r a c y   ( % ) = T P + T N T P + T N + F P + F N × 100 .
The TP, TN, FP, and FN values were computed as the incidence of the correctly and incorrectly recognized results during a signal classification, namely true (properly classified) and false (wrongly classified) outcomes [48]. Table 4 shows the accuracy of the recognition and classification of diverse PQDs performed by the ANN under the proposed methodology, with different noise levels. Figure 7 depicts the receiver operating characteristic (ROC) curve that shows the diagnostic ability of the presented scheme in distinguishing and classifying PQDs. From these plots, it can be seen that the proposed methodology ensures high certainty when identifying all treated PQDs.

5.3. Numerical Simulation Results

The detection and categorization results for diverse PQDs in voltage/current signals, utilizing the introduced approach, are shown in Table 5, when noise contamination is considered in a signal-to-noise ratio (SNR) that goes from 20 dB to 50 dB. The signals used for verifying the introduced approach were obtained through their corresponding mathematical models in Table 1, and they were different from those used for training the ANN.

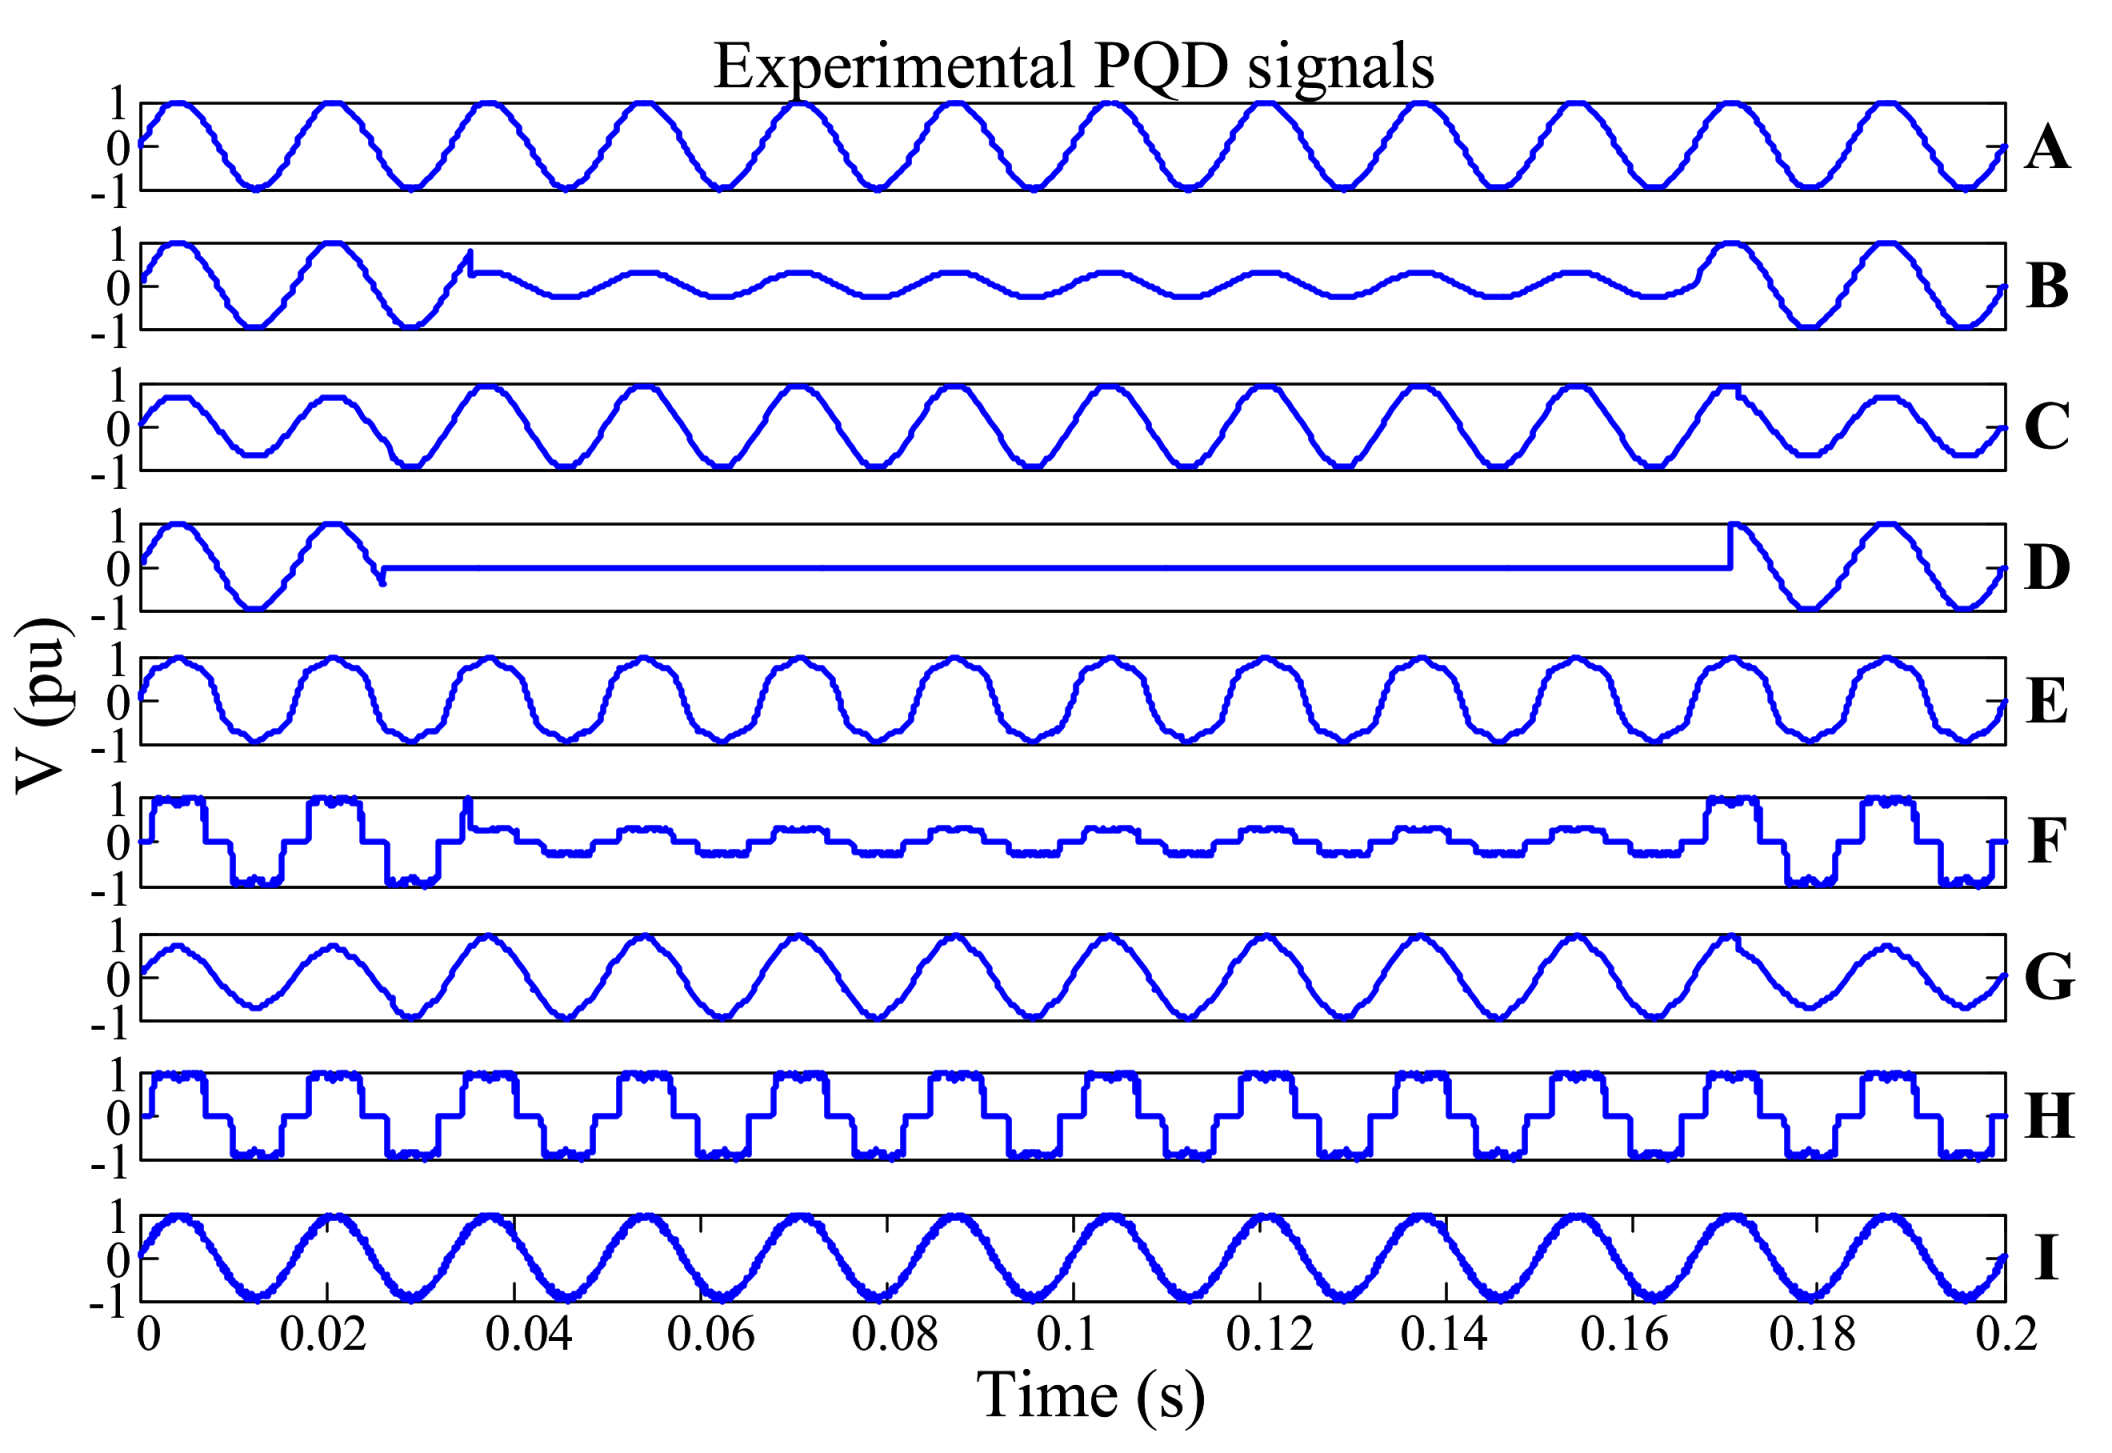
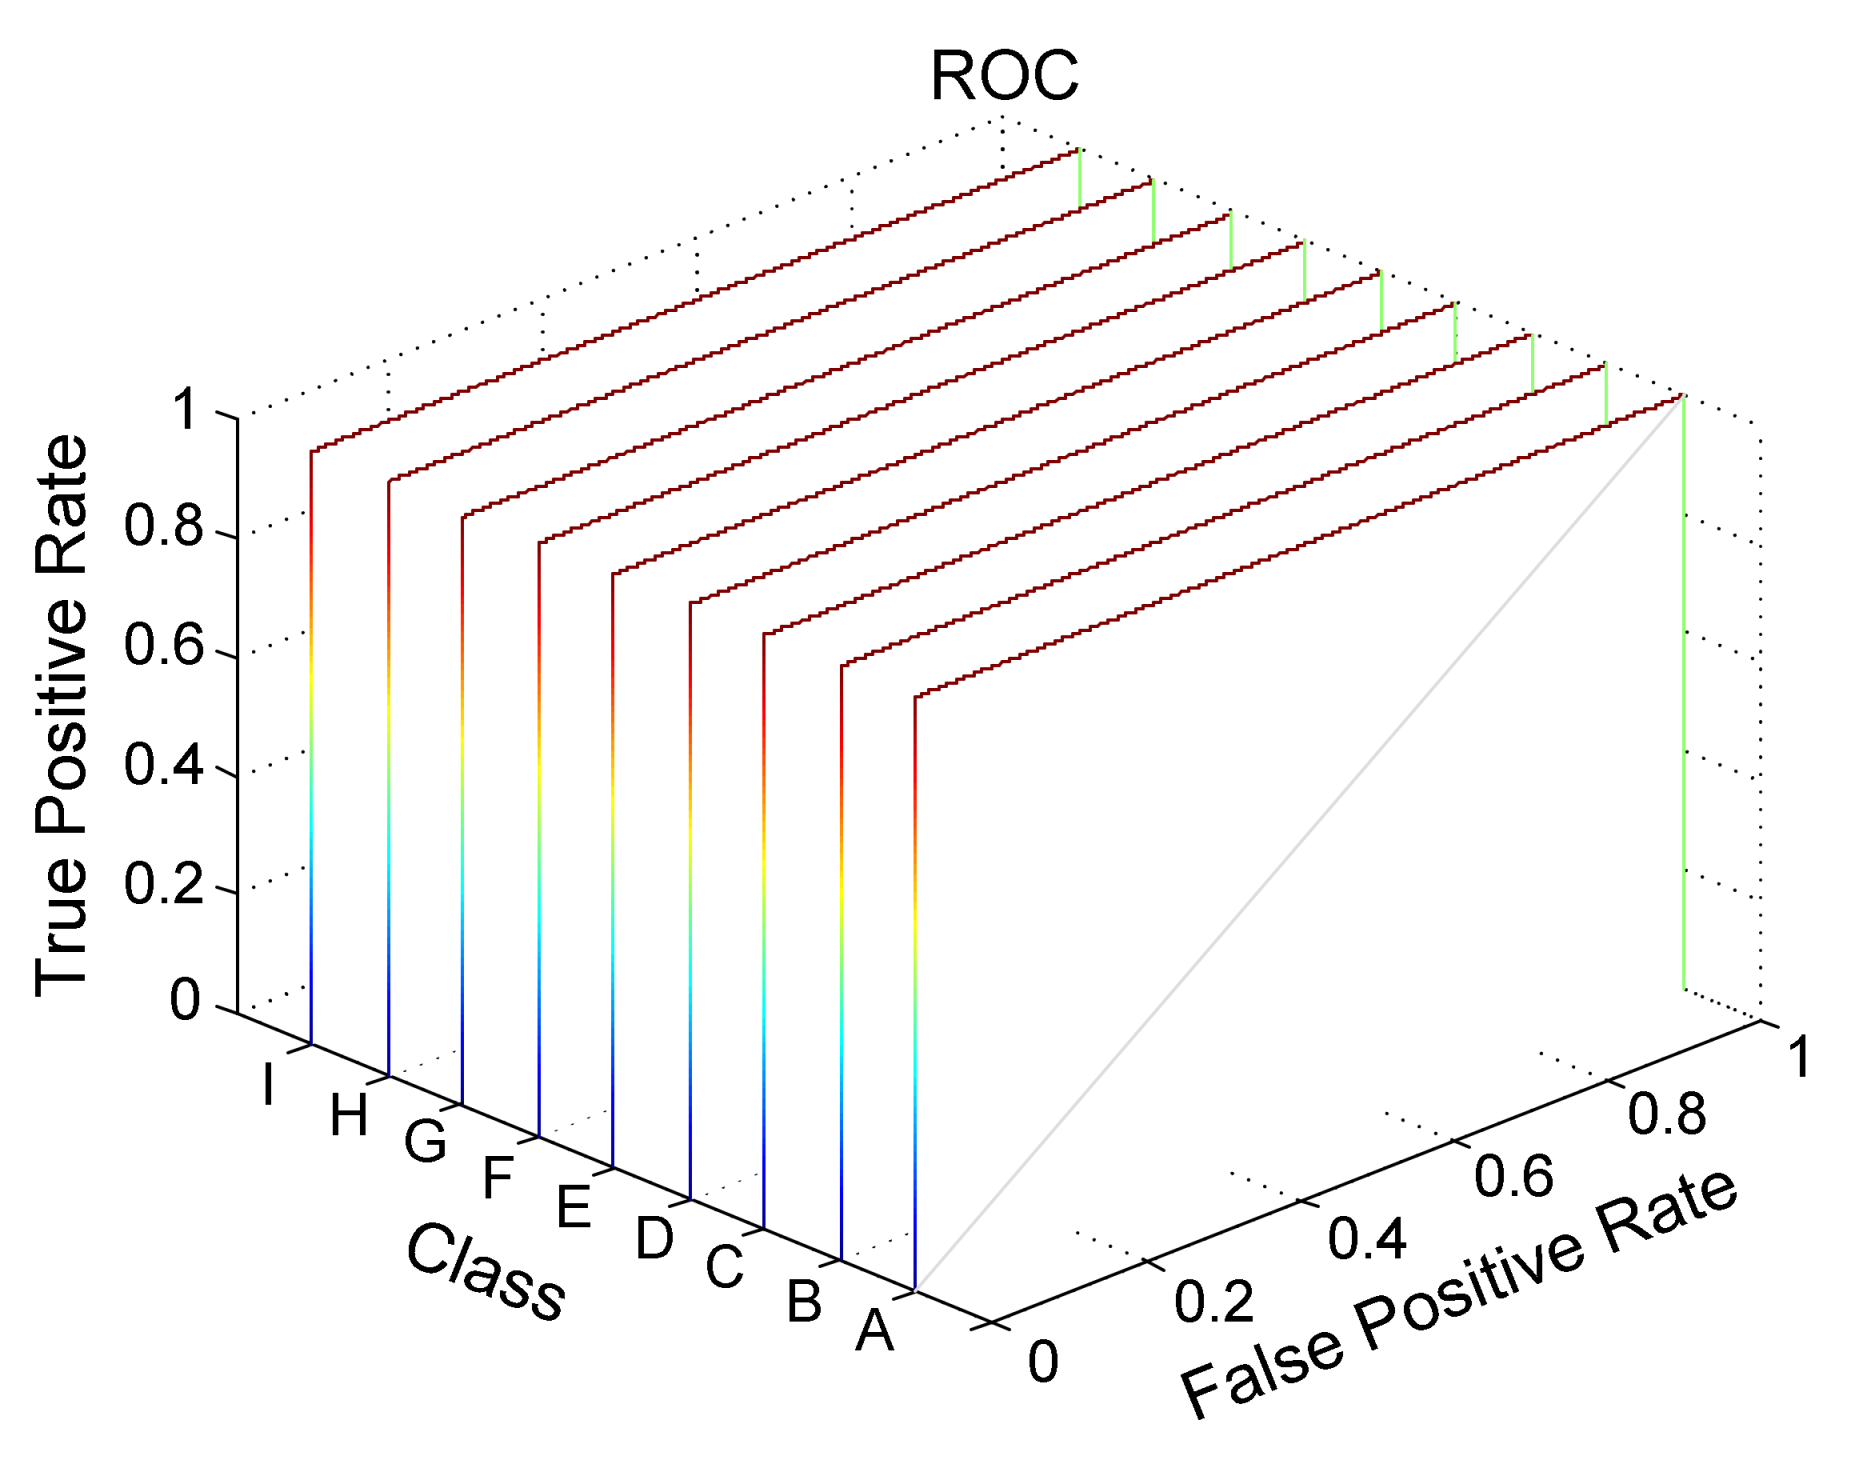
5.4. Experimental Results

The obtained results for the PQD detection and classification of real experimental voltage/current signals collected through the test bench described in Section 4 are shown in Table 6, where 50 different trials were considered for each class. The outcomes demonstrate the high efficacy of the introduced FPGA-based hardware processing unit during online PQD recognition and classification in a power distribution system.

5.5. Discussion of Results

The proposed FPGA-based method for PQD identification and categorization is compared with respect to previously-introduced techniques from the consulted bibliography outlined in Table 7. This table shows the effectiveness of each approach; it is evident that the high certainty of the introduced hardware processing unit during the online detection and classification of different PQDs. Moreover, the best reported performance for the previously-proposed techniques outlined in Table 7 was compared against the corresponding effectiveness degree of the introduced approach.
From Table 7, it is should be noted that although some previous contributions reach high effectiveness, most of them do not consider all the different PQDs detected and classified in this work, and those that do reach a similar effectiveness as that of the numerical (software-based) version of the introduced approach. From this, it can be assumed that the proposed method will reach an effectiveness as high as the highest method reported in the literature. On the other hand, considering the results of the FPGA-based hardware realization of the proposed technique for PQD detection and classification of real voltage/current signals, a 100% effectiveness can be guaranteed. Furthermore, all previously-reported methods are implemented in a software and usually applied offline, as described in Table 8, whereas the introduced approach can perform online, fast detection and classification of PQDs, thanks to its FPGA-based implementation, which takes around 3 ms to process the information. In this way, our method surpasses all previous approaches to reviewing information by at least one order of magnitude, as they require, in the best case, 10 ms to perform the signal processing.

6. Conclusions

In a power distribution system, it is very important to estimate the factors responsible for PQDs quickly and with high effectiveness. This demands classification schemes that perform rapid and efficient PQ monitoring. Most of the previously-proposed approaches described in the literature are designed to treat a limited number of PQDs, and their computation is usually performed on a PC, which makes it difficult to perform online classification. Therefore, in this work, a new method based on DWT, mathematical morphology, SVD, and statistical analysis was introduced for the fast, online detection and classification of PQD. The obtained results from numerical simulations, as well as from real voltage/current signals, demonstrate the high efficacy of the introduced method. Its realization via a FPGA-based integrated circuit ensures high certainty when detecting and classifying different PQDs in power distribution systems. The performed experiment demonstrates that the introduced approach can carry out an online, fast detection and classification of PQD in real-time, even under different noise-level contamination. In this way, our method outperforms previous PC-based approaches described in the reviewed literature by at least one order of magnitude, as they are usually applied offline, and by far surpasses the requirements established by international standards.

Acknowledgments

This work was supported in part by DAIP-U. de Gto. under Research Project Convocatoria Institucional de Investigacion Cientifica 2018 (ID CIIC 209/2018), in part by the Programa para el Desarrollo Profesional Docente, para el Tipo Superior (PRODEP) under Grant DSA/103.5/16/10374.

Author Contributions

M.L.-R. conceived the methodology, performed the experimentation and compile the mathematical definition for the treated PQD; E.C.-Y. supervised the work, defined all the tasks and wrote the paper; L.M.L.-C. provided support during experimentation and simulations; H.M.-V. provided the equipment and guided the obtaining of the real signals used for validating the proposed approach; C.R.-D. designed and implemented the data acquisition system; R.A.L.-M. verified the PC implementation for signal models and processing algorithms.

Conflicts of Interest

The authors declare no conflict of interest.

References

  1. Chattopadhyay, S.; Mitra, M.; Sengupta, S. Electric Power Quality, 1st ed.; Springer: New York, NY, USA, 2011. [Google Scholar]
  2. IEEE Std 1159–2009. IEEE Recommended Practice for Monitoring Electric Power; Revision of IEEE Std 1159-1995; IEEE: Piscataway, NJ, USA, 2009. [Google Scholar]
  3. CEI/IEC 61000-4-30 International Standard. Testing and Measurement Techniques—Power Quality Measurement, 3rd ed.; International Electrotechnical Commission: Geneva, Switzerland, 2015. [Google Scholar]
  4. Arya, S.R.; Singh, B. Neural network based conductance estimation control algorithm for shunt compensation. IEEE Trans. Ind. Inform. 2014, 10, 569–577. [Google Scholar] [CrossRef]
  5. Mahela, O.P.; Shaik, A.G.; Gupta, N. A critical review of detection and classification of power quality events. Renew. Sust. Energy Rev. 2015, 41, 495–505. [Google Scholar] [CrossRef]
  6. Monedero, I.; Leon, C.; Ropero, J.; Garcia, A.; Elena, J.M.; Montano, J.C. Classification of electrical disturbances in real time using neural networks. IEEE Trans. Power Deliv. 2007, 22, 1288–1296. [Google Scholar] [CrossRef]
  7. Shukla, S.; Mishra, S.; Singh, B. Power quality event classification under noisy conditions using EMD-based de-noising techniques. IEEE Trans. Ind. Inform. 2014, 10, 1044–1054. [Google Scholar] [CrossRef]
  8. Biscaro, A.A.P.; Pereira, R.A.F.; Kezunovic, M.; Mantovani, J.R.S. Integrated fault location and power-quality analysis in electric power distribution systems. IEEE Trans. Power Deliv. 2016, 31, 428–436. [Google Scholar] [CrossRef]
  9. Shingh, B.; Jayaprakash, P.; Kothari, D.P.; Chandra, A.; Al-Haddad, K. Comprehensive study of DSTATCOM configurations. IEEE Trans. Ind. Inform. 2014, 10, 854–870. [Google Scholar] [CrossRef]
  10. Fooladi, M.; Foroud, A.A. Recognition and assessment of different factors which affect flicker in wind turbines. IET Renew. Power Gen. 2016, 10, 250–259. [Google Scholar] [CrossRef]
  11. Adly, A.R.; El Sehiemy, R.A.; Abdelaziz, A.Y.; Ayad, N.M.A. Critical aspects on wavelet transforms based fault identification procedures in HV transmission line. IET Gener. Transm. Dis. 2016, 10, 508–517. [Google Scholar] [CrossRef]
  12. Jain, S.K.; Singh, S.N. Low-order dominant harmonic estimation using adaptive wavelet neural network. IEEE Trans. Ind. Electron. 2014, 61, 428–435. [Google Scholar] [CrossRef]
  13. Costa, F.B. Boundary wavelet coefficients for real-time detection of transients induced by faults and power-quality disturbances. IEEE Trans. Power Deliv. 2014, 29, 2674–2687. [Google Scholar] [CrossRef]
  14. Barros, J.; Diego, R.I. A review of measurement and analysis of electric power quality on shipboard power system networks. Renew. Sustain. Energy Rev. 2016, 62, 665–672. [Google Scholar] [CrossRef]
  15. Biswal, B.; Biswal, M.; Mishra, S.; Jalaja, R. Automatic classification of power quality events using balanced neural tree. IEEE Trans. Ind. Electron. 2014, 61, 521–530. [Google Scholar] [CrossRef]
  16. Chen, C.-I.; Chen, Y.-C.; Chang, Y.-R.; Lee, Y.-D. An accurate solution procedure for calculation of voltage flicker components. IEEE Trans. Ind. Electron. 2014, 61, 2370–2377. [Google Scholar] [CrossRef]
  17. Granados-Lieberman, D.; Romero-Troncoso, R.J.; Osornio-Rios, R.A.; Garcia-Perez, A.; Cabal-Yepez, E. Techniques and methodologies for power quality analysis and disturbances classification in power systems: A review. IET Gener. Transm. Distrib. 2011, 5, 519–529. [Google Scholar] [CrossRef]
  18. Khan, A.A.; Naeem, M.; Iqbal, M.; Qaisar, S.; Anpalagan, A. A compendium of optimization objectives, constraints, tools and algorithms for energy management in microgrids. Renew. Sustain. Energy Rev. 2016, 58, 1664–1683. [Google Scholar] [CrossRef]
  19. Deokar, S.A.; Waghmare, L.M. Integrated DWT-FFT approach for detection and classification of power quality disturbances. Int. J. Electr. Power 2014, 61, 594–605. [Google Scholar] [CrossRef]
  20. Cabal-Yepez, E.; Garcia-Ramirez, A.G.; Romero-Troncoso, R.J.; Garcia-Perez, A.; Osornio-Rios, R.A. Reconfigurable monitoring system for time-frequency analysis on industrial equipment through STFT and DWT. IEEE Trans. Ind. Inform. 2013, 9, 760–771. [Google Scholar] [CrossRef]
  21. Dehghani, H.; Vahidi, B.; Naghizadeh, R.A.; Hosseinian, S.H. Power quality disturbance classification using a statistical and wavelet-based hidden Markov model with Dempster-Shafer algorithm. Int. J. Electr. Power 2013, 47, 368–377. [Google Scholar] [CrossRef]
  22. Liu, Z.; Zhang, Q.; Han, Z.; Chen, G. A new classification method for transient power quality combining spectral kurtosis with neural network. Neurocomputing 2014, 125, 95–101. [Google Scholar] [CrossRef]
  23. Kow, K.W.; Wong, Y.W.; Rajkumar, R.K.; Rajkumar, R.K. A Review on performance of artificial intelligence and conventional method in mitigating pv grid-tied related power quality events. Renew. Sustain. Energy Rev. 2016, 56, 334–346. [Google Scholar] [CrossRef]
  24. Chen, C.-I.; Chen, Y.-C. Comparative study of harmonic and interharmonic estimation methods for stationary and time-varying signals. IEEE Trans. Ind. Electron. 2014, 61, 397–404. [Google Scholar] [CrossRef]
  25. Merlin, V.L.; Santos, R.C.; Grilo, A.P.; Vieira, J.C.M.; Coury, D.V.; Oleskovicz, M. A new artificial neural network based method for islanding detection of distributed generators. Int. J. Electr. Power 2016, 75, 139–151. [Google Scholar] [CrossRef]
  26. Saribulut, L.; Teke, A.; Tumay, M. Artificial neural network-based discrete-fuzzy logic controlled active power filter. IET Power Electron. 2014, 7, 1536–1546. [Google Scholar] [CrossRef]
  27. Li, S.; Fairbank, M.; Johnson, C.; Wunsch, D.C.; Alonso, E.; Proano, J.L. Artificial neural networks for control of a grid-connected rectifier/inverter under disturbance, dynamic and power converter switching conditions. IEEE Trans. Neural Netw. Learn. Syst. 2014, 25, 738–750. [Google Scholar] [CrossRef] [PubMed]
  28. Singh, B.; Arya, S.R. Back-propagation control algorithm for power quality improvement using DSTATCOM. IEEE Trans. Ind. Electron. 2014, 61, 1204–1212. [Google Scholar] [CrossRef]
  29. Hua, O.-Y.; Le-ping, B.; Zhong-lin, Y. Voltage sag detection based on dq transform and mathematical morphology filter. Procedia Eng. 2011, 23, 775–779. [Google Scholar] [CrossRef]
  30. Mohanty, S.R.; Kishor, N.; Ray, P.K.; Catalao, J.P.S. Comparative study of advanced signal processing techniques for islanding detection in a hybrid distributed generation system. IEEE Trans. Sustain. Energy 2015, 6, 122–131. [Google Scholar] [CrossRef]
  31. Rangel-Magdaleno, J.J.; Peregrina-Barreto, H.; Ramirez-Cortes, J.M.; Gomez-Gil, P.; Morales-Caporal, R. FPGA-based broken bars detection on induction motors under different load using motor current signature analysis and mathematical morphology. IEEE Trans. Instrum. Meas. 2014, 63, 1032–1040. [Google Scholar] [CrossRef]
  32. Chan, J.C.; Ma, H.; Saha, T.K.; Ekanayake, C. Self-adaptive partial discharge signal de-noising based on ensemble empirical mode decomposition and automatic morphological thresholding. IEEE Trans. Dielectr. Electr. Insul. 2014, 21, 294–303. [Google Scholar] [CrossRef]
  33. Arrais, E.; Roda, V.O.; Neto, C.M.S.; Ribeiro, R.L.A.; Costa, F.B. FPGA versus DSP for wavelet transform based voltage sags detection. In Proceedings of the IEEE International Instrumentation and Measurement Technology Conference (I2MTC), Montevideo, Uruguay, 12–15 May 2014; pp. 643–647. [Google Scholar] [CrossRef]
  34. Sepulveda, C.A.; Munoz, J.A.; Espinoza, J.R.; Figueroa, M.E.; Baier, C.R. FPGA v/s DSP performance comparison for a VSC-based STATCOM control application. IEEE Trans. Ind. Inform. 2013, 9, 1351–1360. [Google Scholar] [CrossRef]
  35. Thirumala, K.; Umarikar, A.C.; Jain, T. Estimation of single-phase and three-phase power-quality indices using empirical wavelet transform. IEEE Trans. Power Deliv. 2015, 30, 445–454. [Google Scholar] [CrossRef]
  36. Latran, M.B.; Teke, A. A novel wavelet transform based voltage sag/swell detection algorithm. Int. J. Electr. Power 2015, 71, 131–139. [Google Scholar] [CrossRef]
  37. De Yong, D.; Bhowmik, S.; Magnago, F. An effective power quality classifier using wavelet transform and support vector machines. Expert Syst. Appl. 2015, 42, 6075–6081. [Google Scholar] [CrossRef]
  38. Mallat, S. A Wavelet Tour of Signal Processing, The Sparse Way, 3rd ed.; Elsevier Inc.: Burlington, MA, USA, 2009. [Google Scholar]
  39. Kaiser, G.A. A Friendly Guide to Wavelets; Springer Science + Business Media: New York, NY, USA, 2011. [Google Scholar]
  40. Shih, F.Y. Image Processing and Mathematical Morphology: Fundamentals and Applications, 1st ed.; CRC Press, Taylor & Francis Group: Boca Raton, FL, USA, 2009. [Google Scholar]
  41. Olver, P.J.; Shakiban, C. Applied Linear Algebra, 1st ed.; Prentice Hall: Upper Saddle River, NJ, USA, 2006. [Google Scholar]
  42. Strumpen, V.; Hoffmann, H.; Agarwal, A. A Stream Algorithm for the SVD, Technical Memo MIT-LCS-TM-641, 1st ed.; Massachusetts Institute of Technology: Cambridge, MA, USA, 2003. [Google Scholar]
  43. Hestenes, M.R. Inversion of matrices by biorthogonalization and related results. J. Soc. Ind. Appl. Math. 1958, 58, 51–90. [Google Scholar] [CrossRef]
  44. Deperlioglu, O.; Kose, U. An educational tool for artificial neural networks. Comput. Electr. Eng. 2011, 37, 392–402. [Google Scholar] [CrossRef]
  45. Lopez-Ramirez, M.; Ledesma-Carrillo, L.M.; Cabal-Yepez, E.; Rodriguez-Donate, C.; Miranda-Vidales, H.; Garcia-Perez, A. EMD-based feature extraction for power quality disturbance classification using moments. Energies 2016, 9, 565. [Google Scholar] [CrossRef]
  46. Programmable AC Power Source—Model. 61700 Series; Chroma ATE Inc.: Taoyuan, Taiwan, 2000; Available online: http://www.chromausa.com/document-library/user-manuals-61700/ (accessed on 17 February 2018).
  47. Bollen, M.H. Understanding Power Quality Problems: Voltage Sags and Interruptions, 1st ed.; Wiley-IEEE Press: Piscataway, NJ, USA, 2000. [Google Scholar]
  48. Hajian, M.; Foroud, A.A. A new hybrid pattern recognition scheme for automatic discrimination of power quality disturbances. Measurement 2014, 51, 265–280. [Google Scholar] [CrossRef]
  49. Manikandan, M.S.; Samantaray, S.R.; Kamwa, I. Detection and classification of power quality disturbances using sparse signal decomposition on hybrid dictionaries. IEEE Trans. Instrum. Meas. 2015, 64, 27–38. [Google Scholar] [CrossRef]
  50. Valtierra-Rodriguez, M.; Romero-Troncoso, R.J.; Osornio-Rios, R.A.; Garcia-Perez, A. Detection and classification of single and combined power quality disturbances using neural networks. IEEE Trans. Ind. Electron. 2014, 61, 2473–2482. [Google Scholar] [CrossRef]
  51. Eristi, H.; Ucar, A.; Demir, Y. Wavelet-based feature extraction and selection for classification of power system disturbances using support vector machines. Electr. Power Syst. Res. 2010, 80, 743–752. [Google Scholar] [CrossRef]
  52. Borges, F.A.S.; Fernandes, R.A.S.; Silva, I.N.; Silva, C.B.S. Feature extraction and power quality disturbances classification using smart meters signals. IEEE Trans. Ind. Inform. 2016, 12, 824–833. [Google Scholar] [CrossRef]
  53. Khokhar, S.; Zin, A.A.M.; Memon, A.P.; Mokhtar, A.S. A new optimal feature selection algorithm for classification of power quality disturbances using discrete wavelet transform and probabilistic neural network. Measurement 2017, 95, 246–259. [Google Scholar] [CrossRef]
Figure 1. Graphical description of the wavelet-transform reconstruction and decomposition utilizing the Mallat algorithm.
Energies 11 00769 g001
Figure 2. Multilayer perceptron architecture.
Energies 11 00769 g002
Figure 3. Proposed methodology.
Energies 11 00769 g003
Figure 4. Signals with power quality disturbance (PQD) obtained through the mathematical definitions in Table 1.
Energies 11 00769 g004
Figure 5. Experiment setup for assessing the detection and classification of PQD utilizing the proposed field programmable gate array (FPGA)-based methodology. (a) Programmable alternating current (AC) power source form Chroma Systems solutions. (b) Voltage/current signal acquisition.
Energies 11 00769 g005
Figure 6. Acquired signal from the experimental setup with PQDs.
Energies 11 00769 g006
Figure 7. Receiver operating characteristic (ROC) curves that depict the trade-offs between the true positive and false positive classification of the proposed scheme for each class of power quality disturbance (PQD).
Energies 11 00769 g007
Table 1. The power quality (PQ) disturbances and its models.
DisturbancesModel            Tt2t1 ≤ 9TParametersClass
Pure Sine f ( t ) = A × s i n ( ω t ) A
Sag f ( t ) = A ( 1 α ( u ( t t 1 ) u ( t t 2 ) ) ) × s i n ( ω t ) 0.1 ≤ α ≤ 0.9B
Swell f ( t ) = A ( 1 + α ( u ( t t 1 ) u ( t t 2 ) ) ) × s i n ( ω t ) 0.1 ≤ α ≤ 0.8.C
Outage f ( t ) = A ( 1 α ( u ( t t 1 ) u ( t t 2 ) ) ) × s i n ( ω t ) 0.9 ≤ α ≤ 1D
Harmonic f ( t ) = A ( s i n ( ω t ) + α 3 s i n ( 3 ω t ) + α 5 s i n ( 5 ω t ) ) 0.1 ≤ α3 ≤ 0.2
0.05 ≤ α5 ≤ 0.1
0.1 ≤ α ≤ 0.9
E
Harmonic with sag f ( t ) = A ( 1 α ( u ( t t 1 ) u ( t t 2 ) ) ) ×    ( s i n ( ω t ) + α 3 s i n ( 3 ω t ) + α 5 s i n ( 5 ω t ) ) F
Harmonic with swell f ( t ) = A ( 1 + α ( u ( t t 1 ) u ( t t 2 ) ) ) ×    ( s i n ( ω t ) + α 3 s i n ( 3 ω t ) + α 5 s i n ( 5 ω t ) ) 0.1 ≤ α3 ≤ 0.2
0.05 ≤ α5 ≤ 0.1
0.1 ≤ α ≤ 0.8
G
High frequency transient f ( t ) = A s i n ( ω t ) + α e t λ s i n ( b ω t ) 20 ≤ b ≤ 80
0.1 ≤ λ ≤ 0.2
0.1 ≤ α ≤ 0.9
H
Low frequency transient f ( t ) = A s i n ( ω t ) + α e t λ s i n ( b ω t ) 5 ≤ b ≤ 20
0.1 ≤ λ ≤ 0.2
0.1 ≤ α ≤ 0.9
I
Table 2. Resource utilization in fiel programmable gate array (FPGA) from two different vendors.
Resource UtilizationXilinx Virtex 6Altera DE3
Programmable logic33%34%
Memory43%32%
Multipliers36%37%
Max. Oper. frequency66 MHz77 MHz
Table 3. Implementation response time for each implementation case.
Xilinx
Virtex 6
Altera
Stratix-III
Software Implementation
Intel Core i7
Feature Extraction2.34 ms2.01 ms4667.30 ms
ANN Classification0.65 ms0.56 ms12.68 ms
Total2.99 ms2.57 ms4679.98 ms
Table 4. Artificial neural network (ANN) Classification accuracy for power quality disturbance (PQD) signals with noise.
True ClassABCDEFGHIAccuracy (%)
A30000000000100
B0299000000099.7
C00300000000100
D00030000000100
E0000299000099.7
F00000300000100
G00000030000100
H00000003000100
I00000000300100
Overall Success Rate99.9
Table 5. Classification accuracy at different levels of signal to noise ratio (SNR).
True ClassSNR
20 dB30 dB40 dB50 dB
A100100100100
B99.3100100100
C100100100100
D100100100100
E99.3100100100
F100100100100
G100100100100
H100100100100
I100100100100
Overall99.8100100100
Table 6. Assessment of the introduced FPGA-based system for detecting and classifying PQDs.
ClassABCDEFGHI
FPGA100100100100100100100100100
Table 7. Comparative assessment of the proposed FPGA-based methodology and previous approaches.
% of EffectivenessProposed Method
True Class[8][19][21][22][45][49][50][51][52][53]NumericalFPGA
A---100100---10010090100---100100100
B939888100991009893939999100
C---969898971009910096100100100
D---100100981001001009998100100100
E---9893---10010090999810099100
F---9895---10083899795100100100
G---9998---9983889896100100100
H---------9610010086---94100100100
I------------100------------99100100
Overall9398969899969398969999100
Table 8. Comparison chart of the introduced methodology against previous studies of PQD identification.
MethodologyApplied TechniquesAnalysis WindowImplementationElapsed Time
Biscaro et al. [8]Wavelet transform, multiresolution analysis, signal energy, and fuzzy ANN100 msPC30 ms
Deokar & Wghmare [19]Multiresolution signal decomposition, fast Fourier transform, DWT, energy entropy, and decision treeNot providedPCNot Provided
Dehghani et al. [21]DWT, and hidden Markov modelNot providedPC1 s
Liu et al. [22]Spectral kurtosis, and ANNNot ProvidedPCNot provided
Lopez-Ramirez et al. [45]Empirical mode decomposition, and ANN200 msPC10 ms
Manikandan et al. [49]Sparse signal decomposition, and decision tree200 msPC20 ms
Valtierra-Rodriguez et al. [50]Fast Fourier transform, ANN, and decision tree200 msPC46.5 ms per analyzed cycle
Eristi et al. [51]Wavelet transform, and support vector machine266 msPCNot Provided
Borges et al. [52]Smart meter signals, decision tree, and ANN166 msPC10 ms
Khokhar et al. [53]Wavelet transform, probabilistic neural network, and artificial bee colony200 msPC76.5 ms
ProposedDWT, mathematical morphology, SVD, and ANN200 msHardware (FPGA)2.99 ms

