Effect of Wall Boundary Layer Thickness on Power Performance of a Recirculation Microbial Fuel Cell

1
Institute of Materials Science and Engineering, National Taipei University of Technology, No.1, Sec. 3, Zhongxiao E. Rd., 106 Taipei, Taiwan
2
Department of Mechanical and Electro-Mechanical Engineering, National I-Lan University, No.1, Sec. 1, Shennong Rd., 26047 I Lan, Taiwan
*
Authors to whom correspondence should be addressed.
Energies 2018, 11(4), 1003; https://doi.org/10.3390/en11041003
Submission received: 23 March 2018
/
Revised: 13 April 2018
/
Accepted: 17 April 2018
/
Published: 20 April 2018
(This article belongs to the Special Issue Biofuel and Bioenergy Technology)
Abstract
:Hydrodynamic boundary layer is a significant phenomenon occurring in a flow through a bluff body, and this includes the flow motion and mass transfer. Thus, it could affect the biofilm formation and the mass transfer of substrates in microbial fuel cells (MFCs). Therefore, understanding the role of hydrodynamic boundary layer thicknesses in MFCs is truly important. In this study, three hydrodynamic boundary layers of thickness 1.6, 4.1, and 5 cm were applied to the recirculation mode membrane-less MFC to investigate the electricity production performance. The results showed that the thin hydrodynamic boundary could enhance the voltage output of MFC due to the strong shear rate effect. Thus, a maximum voltage of 21 mV was obtained in the MFC with a hydrodynamic boundary layer thickness of 1.6 cm, and this voltage output obtained was 15 times higher than that of MFC with 5 cm hydrodynamic boundary layer thickness. Moreover, the charge transfer resistance of anode decreased with decreasing hydrodynamic boundary layer thickness. The charge transfer resistance of MFC with hydrodynamic boundary layer of thickness 1.6 cm was 39 Ω, which was 0.79 times lesser than that of MFC with 5 cm thickness. These observations would be useful for enhancing the performance of recirculation mode MFCs.
1. Introduction
In recent years, the development of renewable energy (solar energy, wind power, bio-energy, and fuel cell) and electric transportation/storage technologies (supercapacitors) has begun to flourish due to the consumption and pollution that is caused by fossil fuels [1,2,3]. Microbial fuel cells (MFCs) are renewable energy technology transducers [4], which has the potential for application in wastewater treatment plants [5,6], electrical devices [7,8], and biosensor [9,10], because it can use bacteria for generating electricity from waste water. However, the power densities of MFCs are still low due to their high internal resistances [11,12,13]. Thus, at present, there are many research works that are focused on MFCs. In MFCs, microorganisms function as a biocatalyst, which can convert organic matter into electricity by using three extracellular electron transfer (EET) pathways: (1) direct electron transfer (c-type cytochromes); (2) electron mediators; and, (3) solid conductive matrix (electrical conductive pili or nanowires) [14]. Nevertheless, the microbes using electron mediators are not suitable for commercial application as they are planktonic and could be easily washed out along with the effluent [15], and also has higher energy losses than other EET pathways [14]. Hence, it obvious that anode biofilm plays a key role in the electricity production of MFCs [16,17], as the bacteria that use direct electron transfer and solid conductive matrix pathway will be attached on the anode electrode.
Recently, there are different methods to enhance the anode biofilm formation. Li et al. demonstrated that the gravity effect being applied to the MFC not only facilitated easy attachment of microbes on the electrode, but also increased the biofilm thickness. Thus, the startup time was shorter than the control by 12%, and the maximum current density reached 8.41 ± 0.13 A/m2, which was 29% higher than without the gravitational effect [18]. He et al. indicated that if the fiber diameter of anode fiber was lesser than the bacteria size, the thickness of biofilm will be less, which may result in less current density due to the fact that the fibers will form small pores and hinder the bacterial penetration [19]. Ren et al. found that the CNT-based electrode materials: Spin-Spray Layer-by-Layer (SSLbL) CNT can guarantee a thicker biofilm than other CNT materials. Therefore, it can result in a high current density of 2.59 A/m2 [20]. Although, these studies stated that enhanced biofilm thickness lead to the enhanced electricity production of MFC, but most of the biofilm formation is dependent on natural adsorption [21]. In addition, very thick biofilms will not only block the electron transfer of MFCs [21], but also will become a diffusion barrier on the physical and chemical exchanges between the bacteria and substrate during the mass transfer processes [22].
In MFCs, the hydrodynamic effect is very significant because the major composition of anolyte is water and the physical effect of fluid motion can influence the MFC performance and behavior of biofilm microbial communities [23]. Nowadays, flow rate and recirculation rate are vital flow parameters in continuous and recirculation mode MFCs due to two reasons, first, the flow rate and recirculation rate can be easily set by peristaltic pump; second, the effect of these parameters is equally important as that of the effects of shear stress [23,24,25,26]. Increasing the flow/recirculation rate could enhance the shear rate [27,28]. Thus, resulting in a denser and thicker biofilm. Moreover, high shear rates can facilitate faster bacterial attachment on the electrode and shorten the startup time of MFC. Pham et al. indicated that the current and power output of MFC under the shear rate of about 120/s which was higher than that of low shear rate (0.3/s) by 2 to 3 times [27]. On the other hand, increasing the shear stress also can enhance the mass transfer rate between the substrate and the anode biofilm [28,29], and this will efficiently limit the mass transfer losses of MFCs [30,31]. Wang et al. reported that a high recirculation rate of 40 mL/min increased the mass transfer rate of MFC due to high shear stress. Therefore, warburg diffusion resistance of MFC was only 265.4 Ω, which is 73% less than the recirculation rate of 4 mL/min, than, the maximum current density of 50.19 mA/m2 [31]. Therefore, the shear stress effect is worthy for investigation. Furthermore, the employment of honeycomb and avoiding the membrane in MFC was also important in this study. Because many researches indicated that the use of membranes would not only limit the MFC application [32], but also decrease system performance [33] and enhance the cost [32,34]. Adding a honeycomb pattern could maintain the liquid flow inside a reactor in a homogeneous, symmetrical, and uniform manner, which can enhance the mass transfer of substrates [31].
However, when anolyte with a value of flow/recirculation rate flows through the MFC anode chamber, viscous shearing forces occur at the chamber wall and the hydrodynamic boundary layer is formed on the chamber wall. The thickness of the hydrodynamic boundary layer will increase with an increase in distance from the leading edges of the chamber wall. The flow velocity gradient will result in a strong shear stress within the hydrodynamic boundary layer [35]. Therefore, the effect of the hydrodynamic boundary layer would not only affect the biofilm structure, but it would also influence the mass transfer [36,37]. So, an in-depth understanding of the effects of hydrodynamic boundary layer thickness is necessary. But, the effects of hydrodynamic boundary layer on MFC electricity production has not been well discussed yet. Thus, in this study, three different hydrodynamic boundary layer thicknesses (1.6, 4.1, and 5 cm) were applied to recirculation mode membrane-less MFCs with a honeycomb pattern for investigating the hydrodynamic boundary layer effect on internal resistance.
2. Results and Discussion
2.1. Voltage Output of MFCs
In order to investigate the effect of hydrodynamic boundary layer on MFCs, three different hydrodynamic boundary thickness (1.6, 4.1, and 5 cm) were applied to MFCs, and the voltage output was shown in Figure 1. All three MFCs obtained the similar output voltage at the beginning of the operation. However, it could be observed that the decrease in thickness of the hydrodynamic boundary layer shortened the startup time of MFCs. The voltage of MFC-1 started to rise up by the day 3.5, but MFC-2 and MFC-3 started voltage production 1.5 days later when compared to MFC-1. At day 5, the voltage of MFC-1 increased rapidly, and reached 11 mV at day 6. Although, the voltage of MFC-2 had the similar trend with MFC-1 at day 5, but it did not increase more than MFC-1. The voltage of MFC-2 at day 6 reached 4 mV, which was just 0.36 times that of MFC-1. Nevertheless, the voltage of MFC-2 was still higher than MFC-3 and the voltage of MFC-3 was still very similar to the voltage at the beginning of the operation. The reason why less hydrodynamic boundary thickness had faster and higher voltage production was due to the shear rate effect [27]. In a pipe flow, the shear rate is high at the inlet, but it will decrease gradually to the fully developed value [38], which means that a thin hydrodynamic boundary layer could result in a higher shear rate than that of thick boundary layer. The high shear rate could enhance the bacteria attachment to the electrode [27]. In this study, the MFC-1 had the highest shear rate of 0.047/s and MFC-3 has the lowest shear rate of 0.016/s (Table 1). Therefore, the MFC-1 had the shortest startup time, than MFC-2 and MFC-3. In addition, the shear rate of three MFCs were less than 120/s. Therefore, the bacteria were not detached from the electrode [27]. After day 6, the voltage of three MFCs started to decrease. Hence, the anolyte of three MFCs were replaced by fresh medium. However, from day 6 to 10, the voltage of three MFCs failed to rise up to the same level as day 6, and the voltage of MFC-1 even started decreasing. This might be due to the fact that a high concentration of glucose may have a toxic effect on bacteria [39]. Nonetheless, the voltage of MFC-1, MFC-2, and MFC-3 started to increase after day 11.7 and the MFC-1 reached a maximum voltage of 21 mV by day 16, which was 15 times that of MFC-3.
2.2. Internal Resistance of MFCs
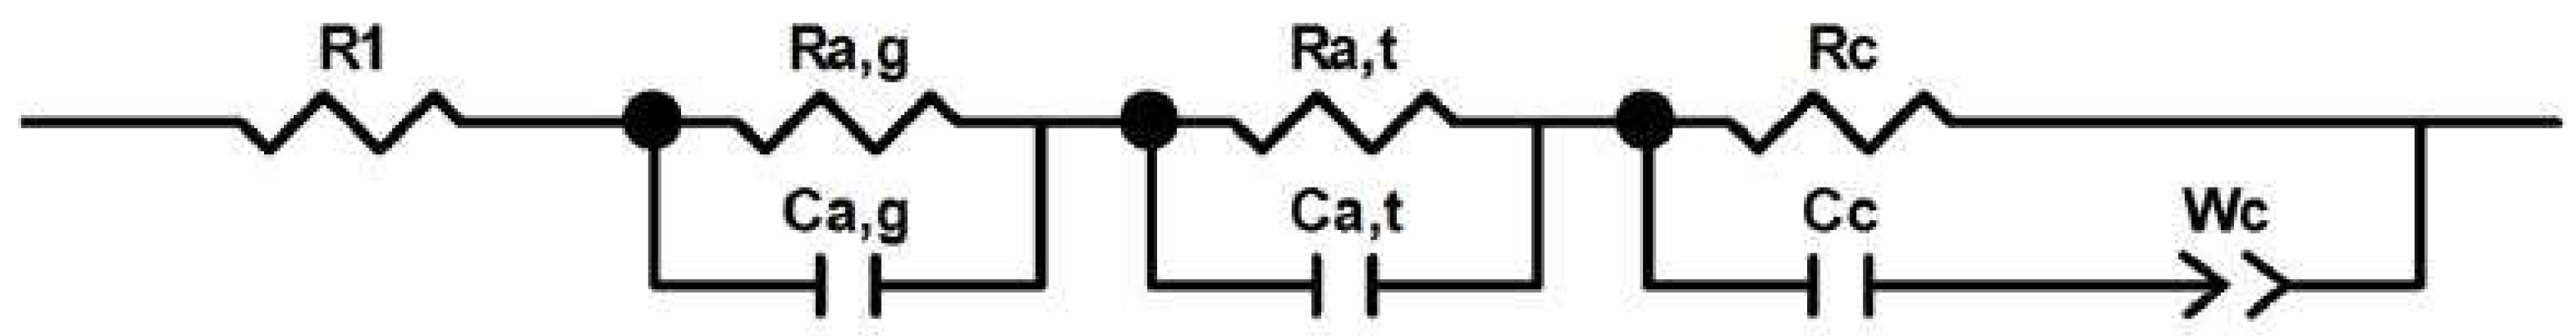
In order to investigate the hydrodynamic boundary layer thickness effect on the internal resistance of the reactor, the equivalent circuit and internal resistance of MFCs were analyzed, as shown in Figure 2 and Table 1. According to Figure 2, it could be observed that the internal resistance of the MFCs was composed of ohmic losses, charge transfer losses of anode/cathode, and concentration losses. R1 represented the ohmic losses in the MFCs [40] and the value of ohmic losses can be related to the conductivity of anolyte or the conductivity of electrode material. Ra, which represented the charge transfer losses of anode, which can indicate the activity of the biofilm [41]. Thus, two kind of charge transfer resistances (Ra,g: graphite felt sheet, Ra,t: titanium wire) occurred at anode. Capacitance Ca,g and Ca,t indicated the electrical double layer phenomenon [42] of graphite felt sheet and titanium wire, and this phenomenon occurred at the interface between the electrode and anolyte. Rc and Cc denoted the charge transfer losses and the electrical double layer of cathode. In addition, the Wc represented the concentration losses of MFCs [11], and the concentration losses could describe the diffusion of substrate, oxygen, or other reactants in MFCs.
In Table 1, the ohmic losses were 47.4, 45, and 40.5 Ω for hydrodynamic boundary layers with thicknesses of 1.6, 4, and 5 cm, respectively. These results showed that the ohmic losses were similar due to the same conductivity of the Phosphate buffered saline (PBS) [31]. On the other hand, it can be clearly seen that the value of Ra,g decreased when the hydrodynamic boundary layer thickness decreased. The charge transfer loss was 39 Ω with a hydrodynamic boundary layer thickness of 1.6 cm and increased to 49.1 Ω when the thickness was 5 cm, and these results were in accordance with the voltage output of MFCs (Figure 1). Due to the strong shear rate effect within the thin hydrodynamic boundary layer thickness [35,38], the physical properties of biofilms, such as density and strength, were influenced by fluid shear. Also, the easy attachment of bacteria on the electrode can result in a thicker and denser biofilm structure [27,28,43]. This biofilm can produce higher biomass than that of biofilm in lower shear rate environment [23]. Hence, the electron transfer rate could be enhanced and a lower charge transfer resistance could be obtained. Whereas, the effect of boundary layer thickness did not significantly influence the charge transfer losses of titanium wire and the values of Ra,t was very similar. This may be due to the smooth surface of titanium wire, which cannot facilitate easy bacterial attachment [40]. The capacitance of MFC was related to the electron or ion accumulation phenomena in the biofilm or the substrate [36]. In this study, the capacitances (Ca,g) were 0.0015, 0.0013, 0.0018 C for the hydrodynamic boundary layers of thickness 1.6, 4.1, and 5 cm, respectively. These values were very similar to each other and it can be observed that the thickness of hydrodynamic boundary layer had no effect on the values of Ca,g and these results were similar with the research of Ter Heijne et al. [36]. Moreover, the capacitances of Ca,t also reported the similar values (around 1.5 × 10⁻⁶), except for the hydrodynamic boundary layer thickness of 4.1 cm. However, this study suggests that electrochemical impedance spectroscopy (EIS) should be analyzed using three-electrode mode for the half-potential for data accuracy. Regarding the internal resistance of the cathode, the cathode of all three MFCs was installed at the top of the reactor, and, the oxygen was directed to the cathode and it did not pass through the hydrodynamic boundary layer. Thus, the thickness of the hydrodynamic boundary layer did not influence the diffusion of oxygen. Hence, the concentration losses (Wc) of three MFCs were similar.
2.3. The Mechanism of Hydrodynamic Boundary Layer Effects in Recirculation Mode MFCs
In recirculation mode MFCs, the hydrodynamics is significantly important as to the microbe, electrode biofilm, and the diffusion of reactant being affected by the flow field [44,45]. Thus, the effect of the flow field in the MFC chamber is necessary to be described. According to the results of this study and other references, the working mechanism model of the hydrodynamic boundary layer effect was illustrated in Figure 3. At first, when the anolyte flowed through the surge tank and passed through the honeycomb into the MFC chamber, the fluid particles of the anolyte in the layer, which were in contact with the chamber wall of MFC had completely stopped due to the no-slip condition. Particles of anolyte also slowed down gradually because of the friction in adjacent layers. Then, in order to compensate the decrease of mass flow rate near the MFC chamber wall, the velocity of the fluid at the midsection of the MFC chamber needed to be increased. Due to the velocity gradient (shear rate) that was developed in the MFC chamber, the velocity (hydrodynamic) boundary layer was formed on the MFC chamber wall [38]. The velocity boundary layer thickness increased along with the flow direction due to the viscosity of liquid [35,46]. Thus, the MFC-1 had the much thinner velocity boundary layer, and the MFC-3 had the thickest velocity boundary layer (see Figure 3).
However, due to the shear rate effect, the efficiency of bacteria that were attached to the electrode was enhanced [27]. The anaerobic biofilm was formed at the anode electrode because the environment was more anaerobic than cathode, and the aerobic microbes moved to the cathode due to the presence of oxygen. Thin velocity boundary layer could result in a much thicker and denser biofilm than that of the thick velocity boundary layer due to the strong shear rate effect. This could enhance the current and power output of MFC [27]. The biofilm thickness reached maximum within the transition zone between laminar and turbulent because of two reasons, first, the diffusion of substrate was limited in laminar zone, second, the bacteria was detached from the biofilm in turbulent flow [47]. In this study, the inlet Reynolds number was Re = 89.6, which meant that the inertial forces were dominant in MFC, and that the velocity of boundary layer was laminar. Thus, the mass transfer of MFCs needed to be enhanced by increasing the Reynolds number or the flow convective [45]. Although the thickness of the biofilm would become a diffusion barrier [22] the thickness of the biofilm (about 40 μm) was smaller than the hydrodynamic boundary layer [37]. Therefore, the mass transfer of recirculation mode MFC was mainly determined by the thickness of hydrodynamic boundary layer [35,36]. Inside the velocity boundary layer, the concentration boundary layer occurred due to the concentration gradient between the bulk liquid and the chamber wall. The thickness of the concentration boundary layer increased with the flow direction until it reached the velocity boundary layer [48]. Therefore, the thickest concentration boundary layer occurred in MFC-3. In the concentration boundary layer, the mass transfer of reactant relied on diffusion, which meant that a higher mass transfer could be obtained in a thin concentration boundary layer due to a high concentration gradient. In recirculation mode MFCs, due to the moving fluid, the mass transfer not only depended on diffusion, but also on bulk fluid motion. The fluid motion enhanced the mass transfer as the reactant in the fluid can move from high a concentration area to a low concentration area [48]. Hence, the strong shear rate effect in thin velocity boundary layer not only reduced the charge transfer losses, but also the concentration losses of MFCs [31,35,36]. It is worth mentioning that the boundary layer had no effect on the oxygen diffusion as the oxygen was in direct contact with the cathode in this study. Moreover, research works had indicated that the viscous sublayer was also important [49,50,51] due to the fact that it could affect the biofilm accumulation and this could be suggested as an investigation for prominent future research.
2.4. Applications
Microbial fuel cells can be used in wastewater treatment plants or microfluidic devices in the future. However, the wastewater treatment plants and microfluidic devices are the continuous/recirculation flow mode systems. Thus, the effect of hydrodynamic boundary layer can not be ignored, and it must be considered. The thin hydrodynamic boundary layer could significantly enhance the biofilm formation and substrate mass transfer, and the maintainence of a thin hydrodynamic boundary layer is a challenge in MFC performance and commercialization. There are several methods to maintain the anode/cathode electrode in a thin hydrodynamic boundary layer. Firstly, the electrode placement should be place near the flow entrance, this suggestion could be indirect proof by other research. Ye et al. showed that the biofilm were thick at the beginning of the microchannel, and thin at the end of the microchannel [52]; Second, if the anolyte flows past the porous electrode (graphite/carbon felt) a thin porous electrode of 0.1 mm porosity should be chosen as the substrate transfer and the diffusion of protons from the biofilm will be limited if the flow passes through the thick felt [53,54]; Third, using the flow control method to inhibit the hydrodynamic boundary layer developing, such as increasing the number of anolyte inlet along the MFC flow channel. This method could let the new hydrodynamic boundary layer replace the original hydrodynamic boundary layer, and keep the hydrodynamic boundary layer thickness thin [35]. The results of this research significantly have great contribution on the design of any continuous/recirculation flow mode MFC systems in the future.
3. Materials and Methods
3.1. Reactor Construction
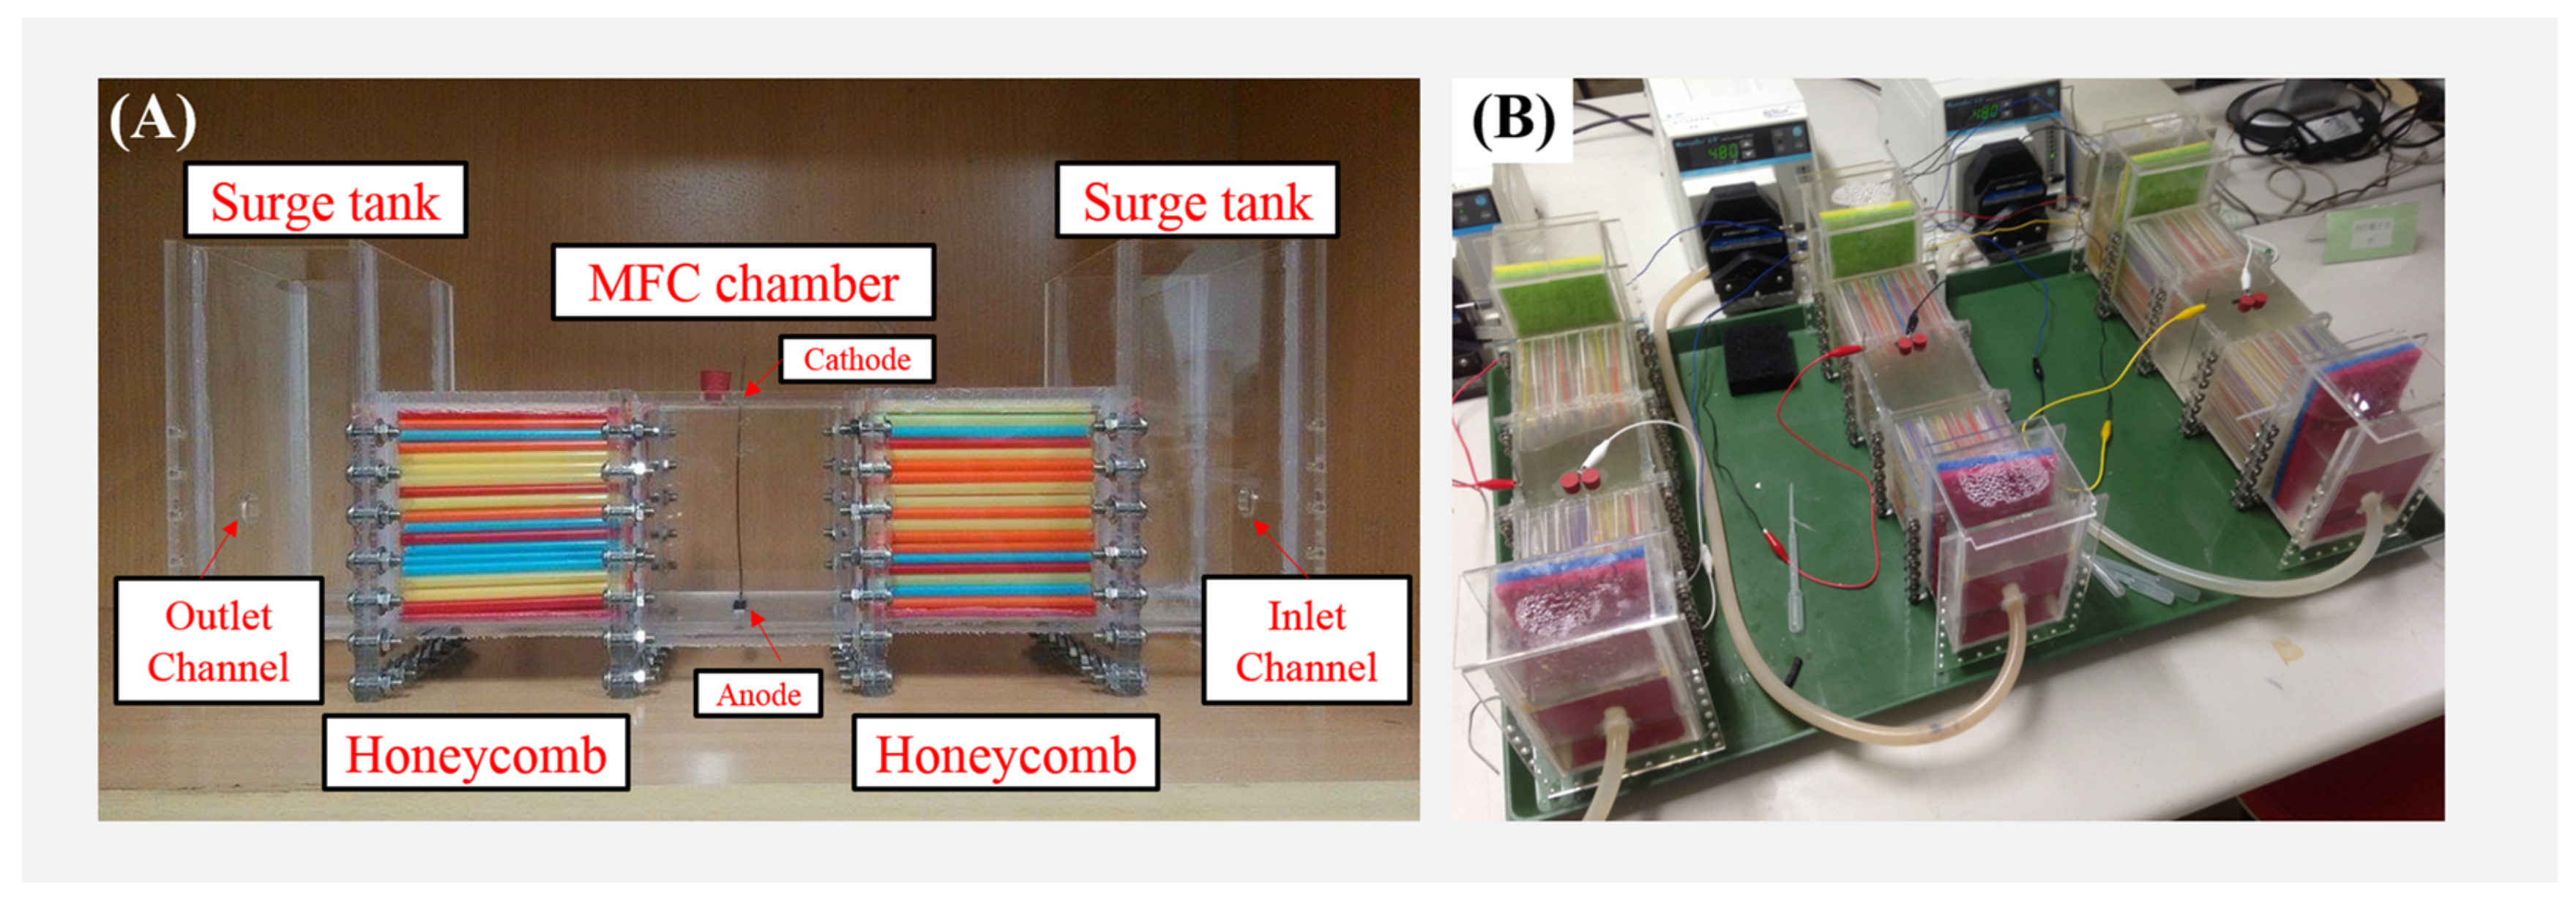
In order to investigate the effects of hydrodynamic boundary layer on the electricity production of MFC, three single chambered reactors were fabricated with Polymethylmethacrylate (PMMA) sheets (Figure 4A) [30]. The reactors were of symmetrical structure, and consisted of one MFC chamber, two honeycombs, and two surge tanks. No membranes were used, as it was a membrane-less reactor. The inner space dimension of MFC chamber was 10 cm × 10 cm × 10 cm. Honeycomb structure was made of plastic straws, and each one had an inner space dimension of 10 cm × 10 cm × 10 cm. The surge tanks had an inner space dimension of 10 cm × 17 cm × 17.5 cm. Two graphite felt sheets (each with L × W × D: 0.5 cm × 2.8 cm × 0.5 cm) were used as the anode and cathode electrode, and they were embedded at the bottom and top of the MFC chambers. The anode electrode was connected using a titanium wire to an external resistance (1000 Ω), which was further connected to the cathode electrode. In order to generate three different hydrodynamic boundary layer thicknesses in the MFC chamber, the anode and cathode electrodes were placed at the distances of 1 cm (MFC-1), 6 cm (MFC-2), and 9 cm (MFC-3), which were measured from the leading edges of the chamber wall.
3.2. Inoculation and Operational Conditions
The MFCs (MFC-1, MFC-2, MFC-3) were inoculated with 1:1 ratio of wastewater from the Department of Biotechnology and Animal Science, National Ilan University, Yilan, Taiwan [11] and 50 mM PBS [31]. 50 mM PBS contained Na2HPO4, 4.58 g/L; NaH2PHO4·H2O, 2.45 g/L; NH4Cl, 0.31 g/L; KCl, 0.13 g/L; and, 0.2 g/L glucose was used as the substrate. All of the MFCs were operated at the same flow rate of 480 mL/min from the beginning till the end of the experiment and the experimental setup was shown in Figure 4B.
3.3. Electrochemical Analysis
Three MFCs (MFC-1, MFC-2, and MFC-3) were connected with an external resistance of 1000 Ω. The voltage of MFCs was measured by an automatic data acquisition system (Jiehan 5020, Jiehan Technology Corporation, Taiwan, Republic of China) with a sample rate of 1 point/min [55]. The EIS analysis of MFCs was measured by an impedance analyzer (HIOKY 3522-50 LCR HiTESTER, Hioki E.E. Corporation, Nagano, Japan), and the scan frequency was set as 100 KHz to 0.1 Hz with an AC amplitude of 10 mV [56]. The value of equivalent circuit of MFCs was analyzed by Zware.
3.4. Reynolds Number (Re)
Reynolds number is a dimensionless quantity that can be used to investigate the different fluid flow situations in fluid mechanics. Reynolds number (Re) is a ratio of inertia force to viscous forces, and is defined as shown in Equation (1) [57]:
where represents the density of water (997 kg/m3); V indicate the inlet flow velocity (80 × 10−5 m/s, corresponding to the flow rate of 480 mL/min); DT represents the hydraulic diameter (10 cm); and, μ is viscosity of water (8.9 × 10⁻⁴ kg/ms).
3.5. Flat Plate Boundary Layer Thickness (δ) and Shear Rate
The hydrodynamic boundary layer was formed by liquid flow through a flat plate due to the viscosity of liquid particle, and the thickness of flat plate boundary layer thickness, which can be defined as Equation (2) [46]:
where x is the electrode position of 1 cm (MFC-1), 6 cm (MFC-2), and 9 cm (MFC-3). (Corresponding to the hydrodynamic boundary layer thickness of 1.6, 4.1, and 5 cm [58]), and the schematic diagram of hydrodynamic boundary layer that was applied to MFCs were showed in Figure 5.
The hydrodynamic boundary layer thicknesses were chosen based on different flow field. hydrodynamic boundary of thickness 5 cm occurred at the hydrodynamically fully developed region. In this region, the velocity profile was fully developed and remained unchanged. The hydrodynamic boundary of thickness 1.6 cm occurred near the entrance of the MFC chamber. The velocity profile on this region was similar to the inlet flow.
Shear rate can influence the mass transfer and biofilm formation, and the shear rate is defined as shown in Equation (3) [27]:
where V is the flow velocity at hydrodynamic boundary layer (0.99 times less than inlet flow velocity) (m/s), and d represents the thickness of the hydrodynamic boundary layer (m).
4. Conclusions
Hydrodynamic boundary layers of thickness 1.6, 4.1, and 5 cm were applied to the recirculation mode MFCs to investigate the electricity production in this study. It was observed that the voltage of MFCs increased with decreasing hydrodynamic boundary layer thicknesses. Due to the high shear rate of 0.047/s that occurred in the hydrodynamic boundary layer of 1.6 cm, the maximum voltage of 21 mV was observed in MFC-1, which was 15 times higher than that of MFC-3. These results were further confirmed by EIS analysis. The charge transfer losses of anode decreased with the decreasing hydrodynamic boundary layer thicknesses. The charge transfer resistance (Ra,g) of MFC-1 was only 39 Ω, which was only 0.79 times lesser than that of MFC-3. These findings were useful for the improvement in the performance of the continuous/recirculation flow mode MFCs.
Acknowledgments
The authors would like to acknowledge the generous funding support from MOST Taiwan under contract No. MOST 103-2221-E-197-022-MY3, 106-2923-E-197-001-MY3, 106-2622-E-197-007-CC3 and 106-2221-E-197-019, and thank Sangeetha Thangavel (Department of Energy and Refrigerating Air-Conditioning Engineering, National Taipei University of Technology, Taipei, Taiwan) for correcting the English grammar mistakes.
Author Contributions
Yan-Ming Chen: Operation of experiments, analysis and writing of article; Yung-Chin Yang: Guidance of material experiments; Chin-Tsan Wang: Guidance of experiments and modification of manuscript and reply of comments.
Conflicts of Interest
The authors declare no conflict of interest.
References
- Repp, S.; Harputlu, E.; Gurgen, S.; Castellano, M.; Kremer, N.; Pompe, N.; Wörner, J.; Hoffmann, A.; Thomann, R.; Emen, F.M. Synergetic effects of Fe3+ doped spinel Li4Ti5O12 nanoparticles on reduced graphene oxide for high surface electrode hybrid supercapacitors. Nanoscale 2018, 10, 1877–1884. [Google Scholar] [CrossRef] [PubMed]
- Genc, R.; Alas, M.O.; Harputlu, E.; Repp, S.; Kremer, N.; Castellano, M.; Colak, S.G.; Ocakoglu, K.; Erdem, E. High-capacitance hybrid supercapacitor based on multi-colored fluorescent carbon-dots. Sci. Rep. 2017, 7, 11222. [Google Scholar] [CrossRef] [PubMed]
- Wang, C.-T.; Chen, W.-J.; Huang, R.-Y. Influence of growth curve phase on electricity performance of microbial fuel cell by escherichia coli. Int. J. Hydrogen Energy 2010, 35, 7217–7223. [Google Scholar] [CrossRef]
- Khan, M.D.; Khan, N.; Sultana, S.; Joshi, R.; Ahmed, S.; Yu, E.; Scott, K.; Ahmad, A.; Khan, M.Z. Bioelectrochemical conversion of waste to energy using microbial fuel cell technology. Process Biochem. 2017, 57, 141–158. [Google Scholar] [CrossRef]
- Singh, H.M.; Pathak, A.K.; Chopra, K.; Tyagi, V.; Anand, S.; Kothari, R. Microbial fuel cells: A sustainable solution for bioelectricity generation and wastewater treatment. Biofuels 2018, 1–21. [Google Scholar] [CrossRef]
- Wu, Y.-C.; Wang, Z.-J.; Zheng, Y.; Xiao, Y.; Yang, Z.-H.; Zhao, F. Light intensity affects the performance of photo microbial fuel cells with Desmodesmus sp. A8 as cathodic microorganism. Appl. Energy 2014, 116, 86–90. [Google Scholar] [CrossRef]
- Wang, C.-T.; Chen, Y.-M.; Qi, Z.-Q.; Wang, Y.-T.; Yang, Y.-C. Types of simplified flow channels without flow obstacles in microbial fuel cells. Int. J. Hydrogen Energy 2014, 39, 14306–14311. [Google Scholar] [CrossRef]
- Yong, X.-Y.; Yan, Z.-Y.; Shen, H.-B.; Zhou, J.; Wu, X.-Y.; Zhang, L.-J.; Zheng, T.; Jiang, M.; Wei, P.; Jia, H.-H. An integrated aerobic-anaerobic strategy for performance enhancement of pseudomonas aeruginosa-inoculated microbial fuel cell. Bioresour. Technol. 2017, 241, 1191–1196. [Google Scholar] [CrossRef] [PubMed]
- Chouler, J.; Cruz-Izquierdo, Á.; Rengaraj, S.; Scott, J.L.; Di Lorenzo, M. A screen-printed paper microbial fuel cell biosensor for detection of toxic compounds in water. Biosens. Bioelectron. 2018, 102, 49–56. [Google Scholar] [CrossRef] [PubMed]
- Sun, J.-Z.; Kingori, G.P.; Si, R.-W.; Zhai, D.-D.; Liao, Z.-H.; Sun, D.-Z.; Zheng, T.; Yong, Y.-C. Microbial fuel cell-based biosensors for environmental monitoring: A review. Water Sci. Technol. 2015, 71, 801–809. [Google Scholar] [CrossRef] [PubMed]
- Wang, C.-T.; Lee, Y.-C.; Ou, Y.-T.; Yang, Y.-C.; Chong, W.-T.; Sangeetha, T.; Yan, W.-M. Exposing effect of comb-type cathode electrode on the performance of sediment microbial fuel cells. Appl. Energy 2017, 204, 620–625. [Google Scholar] [CrossRef]
- Liu, X.-W.; Huang, Y.-X.; Sun, X.-F.; Sheng, G.-P.; Zhao, F.; Wang, S.-G.; Yu, H.-Q. Conductive carbon nanotube hydrogel as a bioanode for enhanced microbial electrocatalysis. ACS Appl. Mater. Interfaces 2014, 6, 8158–8164. [Google Scholar] [CrossRef] [PubMed]
- Wang, Q.-Q.; Wu, X.-Y.; Yu, Y.-Y.; Sun, D.-Z.; Jia, H.-H.; Yong, Y.-C. Facile in-situ fabrication of graphene/riboflavin electrode for microbial fuel cells. Electrochim. Acta 2017, 232, 439–444. [Google Scholar] [CrossRef]
- Torres, C.I.; Marcus, A.K.; Lee, H.-S.; Parameswaran, P.; Krajmalnik-Brown, R.; Rittmann, B.E. A kinetic perspective on extracellular electron transfer by anode-respiring bacteria. FEMS Microbiol. Rev. 2009, 34, 3–17. [Google Scholar] [CrossRef] [PubMed]
- Du, Z.; Li, Q.; Tong, M.; Li, S.; Li, H. Electricity generation using membrane-less microbial fuel cell during wastewater treatment. Chin. J. Chem. Eng. 2008, 16, 772–777. [Google Scholar] [CrossRef]
- Feng, C.; Liu, Y.; Li, Q.; Che, Y.; Li, N.; Wang, X. Quaternary ammonium compound in anolyte without functionalization accelerates the startup of bioelectrochemical systems using real wastewater. Electrochim. Acta 2016, 188, 801–808. [Google Scholar] [CrossRef]
- Wang, Z.; Mahadevan, G.D.; Wu, Y.; Zhao, F. Progress of air-breathing cathode in microbial fuel cells. J. Power Sources 2017, 356, 245–255. [Google Scholar] [CrossRef]
- Li, T.; Zhou, L.; Qian, Y.; Wan, L.; Du, Q.; Li, N.; Wang, X. Gravity settling of planktonic bacteria to anodes enhances current production of microbial fuel cells. Appl. Energy 2017, 198, 261–266. [Google Scholar] [CrossRef]
- He, G.; Gu, Y.; He, S.; Schröder, U.; Chen, S.; Hou, H. Effect of fiber diameter on the behavior of biofilm and anodic performance of fiber electrodes in microbial fuel cells. Bioresour. Technol. 2011, 102, 10763–10766. [Google Scholar] [CrossRef] [PubMed]
- Ren, H.; Pyo, S.; Lee, J.-I.; Park, T.-J.; Gittleson, F.S.; Leung, F.C.; Kim, J.; Taylor, A.D.; Lee, H.-S.; Chae, J. A high power density miniaturized microbial fuel cell having carbon nanotube anodes. J. Power Sources 2015, 273, 823–830. [Google Scholar] [CrossRef]
- Wang, X.; Lin, H.; Wang, J.; Xie, B.; Huang, W. Influence of the biofilm formation process on the properties of biofilm electrode material. Mater. Lett. 2012, 78, 174–176. [Google Scholar] [CrossRef]
- Cabije, A.H.; Agapay, R.C.; Tampus, M.V. Carbon-nitrogen-phosphorus removal and biofilm growth characteristics in an integrated wastewater treatment system involving a rotating biological contactor. Asia-Pac. J. Chem. Eng. 2009, 4, 735–743. [Google Scholar] [CrossRef]
- Oliveira, V.; Simões, M.; Melo, L.; Pinto, A. Overview on the developments of microbial fuel cells. Biochem. Eng. J. 2013, 73, 53–64. [Google Scholar] [CrossRef]
- Ieropoulos, I.; Winfield, J.; Greenman, J. Effects of flow-rate, inoculum and time on the internal resistance of microbial fuel cells. Bioresour. Technol. 2010, 101, 3520–3525. [Google Scholar] [CrossRef] [PubMed]
- Zhang, F.; Jacobson, K.S.; Torres, P.; He, Z. Effects of anolyte recirculation rates and catholytes on electricity generation in a litre-scale upflow microbial fuel cell. Energy Environ. Sci. 2010, 3, 1347–1352. [Google Scholar] [CrossRef]
- Zhang, L.; Zhu, X.; Li, J.; Kashima, H.; Liao, Q.; Regan, J.M. Step-feed strategy enhances performance of unbuffered air-cathode microbial fuel cells. RSC Adv. 2017, 7, 33961–33966. [Google Scholar] [CrossRef]
- Pham, H.T.; Boon, N.; Aelterman, P.; Clauwaert, P.; De Schamphelaire, L.; Van Oostveldt, P.; Verbeken, K.; Rabaey, K.; Verstraete, W. High shear enrichment improves the performance of the anodophilic microbial consortium in a microbial fuel cell. Microb. Biotechnol. 2008, 1, 487–496. [Google Scholar] [CrossRef] [PubMed] [Green Version]
- Shen, Y.; Wang, M.; Chang, I.S.; Ng, H.Y. Effect of shear rate on the response of microbial fuel cell toxicity sensor to Cu (II). Bioresour. Technol. 2013, 136, 707–710. [Google Scholar] [CrossRef] [PubMed]
- Celmer, D.; Oleszkiewicz, J.; Cicek, N. Impact of shear force on the biofilm structure and performance of a membrane biofilm reactor for tertiary hydrogen-driven denitrification of municipal wastewater. Water Res. 2008, 42, 3057–3065. [Google Scholar] [CrossRef] [PubMed]
- Wang, C.-T.; Huang, Y.-S.; Sangeetha, T.; Chen, Y.-M.; Chong, W.-T.; Ong, H.-C.; Zhao, F.; Yan, W.-M. Novel bufferless photosynthetic microbial fuel cell (PMFCs) for enhanced electrochemical performance. Bioresour. Technol. 2018, 255, 83–87. [Google Scholar] [CrossRef] [PubMed]
- Wang, C.-T.; Huang, Y.-S.; Sangeetha, T.; Yan, W.-M. Assessment of recirculation batch mode operation in bufferless bio-cathode microbial fuel cells (MFCs). Appl. Energy 2018, 209, 120–126. [Google Scholar] [CrossRef]
- Jang, J.K.; Chang, I.S.; Kang, K.H.; Moon, H.; Cho, K.S.; Kim, B.H. Construction and operation of a novel mediator-and membrane-less microbial fuel cell. Process Biochem. 2004, 39, 1007–1012. [Google Scholar] [CrossRef]
- Logan, B.E. Microbial Fuel Cells; John Wiley & Sons: Hoboken, NJ, USA, 2008. [Google Scholar]
- Ghangrekar, M.; Shinde, V. Performance of membrane-less microbial fuel cell treating wastewater and effect of electrode distance and area on electricity production. Bioresour. Technol. 2007, 98, 2879–2885. [Google Scholar] [CrossRef] [PubMed]
- Yang, Y.; Ye, D.; Liao, Q.; Zhang, P.; Zhu, X.; Li, J.; Fu, Q. Enhanced biofilm distribution and cell performance of microfluidic microbial fuel cells with multiple anolyte inlets. Biosens. Bioelectron. 2016, 79, 406–410. [Google Scholar] [CrossRef] [PubMed]
- Ter Heijne, A.; Schaetzle, O.; Gimenez, S.; Fabregat-Santiago, F.; Bisquert, J.; Strik, D.P.; Barriere, F.; Buisman, C.J.; Hamelers, H.V. Identifying charge and mass transfer resistances of an oxygen reducing biocathode. Energy Environ. Sci. 2011, 4, 5035–5043. [Google Scholar] [CrossRef] [Green Version]
- Ter Heijne, A.; Hamelers, H.V.; Saakes, M.; Buisman, C.J. Performance of non-porous graphite and titanium-based anodes in microbial fuel cells. Electrochim. Acta 2008, 53, 5697–5703. [Google Scholar] [CrossRef]
- Yunus, A.C.; Cimbala, J.M. Fluid Mechanics Fundamentals and Applications, International ed.; McGraw Hill Publication: New York, NY, USA, 2006; pp. 325–326. [Google Scholar]
- D’souza Rohan, V.D.; Rohan, G.; Satish, B. Bioelectricity production from microbial fuel using escherichia coli (glucose and brewery waste). Int. Res. J. Biol. Sci. 2013, 2, 50–54. [Google Scholar]
- Chen, Y.-M.; Wang, C.-T.; Yang, Y.-C.; Chen, W.-J. Application of aluminum-alloy mesh composite carbon cloth for the design of anode/cathode electrodes in escherichia coli microbial fuel cell. Int. J. Hydrogen Energy 2013, 38, 11131–11137. [Google Scholar] [CrossRef]
- Liu, P.; Liang, P.; Jiang, Y.; Hao, W.; Miao, B.; Wang, D.; Huang, X. Stimulated electron transfer inside electroactive biofilm by magnetite for increased performance microbial fuel cell. Appl. Energy 2018, 216, 382–388. [Google Scholar] [CrossRef]
- Zhang, F.; Merrill, M.D.; Tokash, J.C.; Saito, T.; Cheng, S.; Hickner, M.A.; Logan, B.E. Mesh optimization for microbial fuel cell cathodes constructed around stainless steel mesh current collectors. J. Power Sources 2011, 196, 1097–1102. [Google Scholar] [CrossRef]
- Stoodley, P.; Sauer, K.; Davies, D.G.; Costerton, J.W. Biofilms as complex differentiated communities. Annu. Rev. Microbiol. 2002, 56, 187–209. [Google Scholar] [CrossRef] [PubMed]
- Wang, C.-T. Flow control in microbial fuel cells. In Technology and Application of Microbial Fuel Cells; InTech: Rijeka, Croatia, 2014. [Google Scholar]
- Costerton, J.W.; Lewandowski, Z.; Caldwell, D.E.; Korber, D.R.; Lappin-Scott, H.M. Microbial biofilms. Annu. Rev. Microbiol. 1995, 49, 711–745. [Google Scholar] [CrossRef] [PubMed]
- Schlichting, H.; Gersten, K. Boundary-Layer Theory, 7th ed.; McGraw-Hill Book Company: Columbus, OH, USA, 1989; p. 140. [Google Scholar]
- Lewandowski, Z.; Walser, G. Influence of Hydrodynamics on Biofilm Accumulation; Environmental Engineering; ASCE: Reston, VA, USA, 1991; pp. 619–624. [Google Scholar]
- Cengel, A. Heat and Mass Transfer A Practical Approach, 3rd ed.; McGraw-Hill Book Company: Columbus, OH, USA, 2006; p. 810. [Google Scholar]
- Bryers, J.D.; Characklis, W.G. Processes governing primary biofilm formation. Biotechnol. Bioeng. 1982, 24, 2451–2476. [Google Scholar] [CrossRef] [PubMed]
- Kim, T.W.; Micheli, F. Decreased solar radiation and increased temperature combine to facilitate fouling by marine non-indigenous species. Biofouling 2013, 29, 501–512. [Google Scholar] [CrossRef] [PubMed]
- De Beer, D.; Stoodley, P.; Lewandowski, Z. Liquid flow in heterogeneous biofilms. Biotechnol. Bioeng. 1994, 44, 636–641. [Google Scholar] [CrossRef] [PubMed]
- Ye, D.; Yang, Y.; Li, J.; Zhu, X.; Liao, Q.; Deng, B.; Chen, R. Performance of a microfluidic microbial fuel cell based on graphite electrodes. Int. J. Hydrogen Energy 2013, 38, 15710–15715. [Google Scholar] [CrossRef]
- Sleutels, T.H.; Lodder, R.; Hamelers, H.V.; Buisman, C.J. Improved performance of porous bio-anodes in microbial electrolysis cells by enhancing mass and charge transport. Int. J. Hydrogen Energy 2009, 34, 9655–9661. [Google Scholar] [CrossRef]
- Sleutels, T.H.; Hamelers, H.V.; Buisman, C.J. Effect of mass and charge transport speed and direction in porous anodes on microbial electrolysis cell performance. Bioresour. Technol. 2011, 102, 399–403. [Google Scholar] [CrossRef] [PubMed]
- Wang, C.-T.; Chen, Y.-M.; Hu, Z.-Y.; Chong, W.-T. Dynamic power response of microbial fuel cells under external electrical exciting. Int. J. Hydrogen Energy 2017, 42, 22208–22213. [Google Scholar] [CrossRef]
- Hutchinson, A.J.; Tokash, J.C.; Logan, B.E. Analysis of carbon fiber brush loading in anodes on startup and performance of microbial fuel cells. J. Power Sources 2011, 196, 9213–9219. [Google Scholar] [CrossRef]
- Van Dyke, M.; Van Dyke, M. An Album of Fluid Motion; Parabolic Press: Stanford, CA, USA, 1982. [Google Scholar]
- Chen, Y.-M.; Wang, C.-T.; Yang, Y.-C.; Wang, Y.-T. Effect of Boudary Layer Thickness on the Performance of Microbial Fuel Cell. In Proceedings of the EMChIE 2015, Tarragona, Spain, 10–12 June 2015. [Google Scholar]
Figure 1.
The voltage output versus time of microbial fuel cells (MFCs) with different hydrodynamic boundary layer thicknesses.
Figure 1.
The voltage output versus time of microbial fuel cells (MFCs) with different hydrodynamic boundary layer thicknesses.
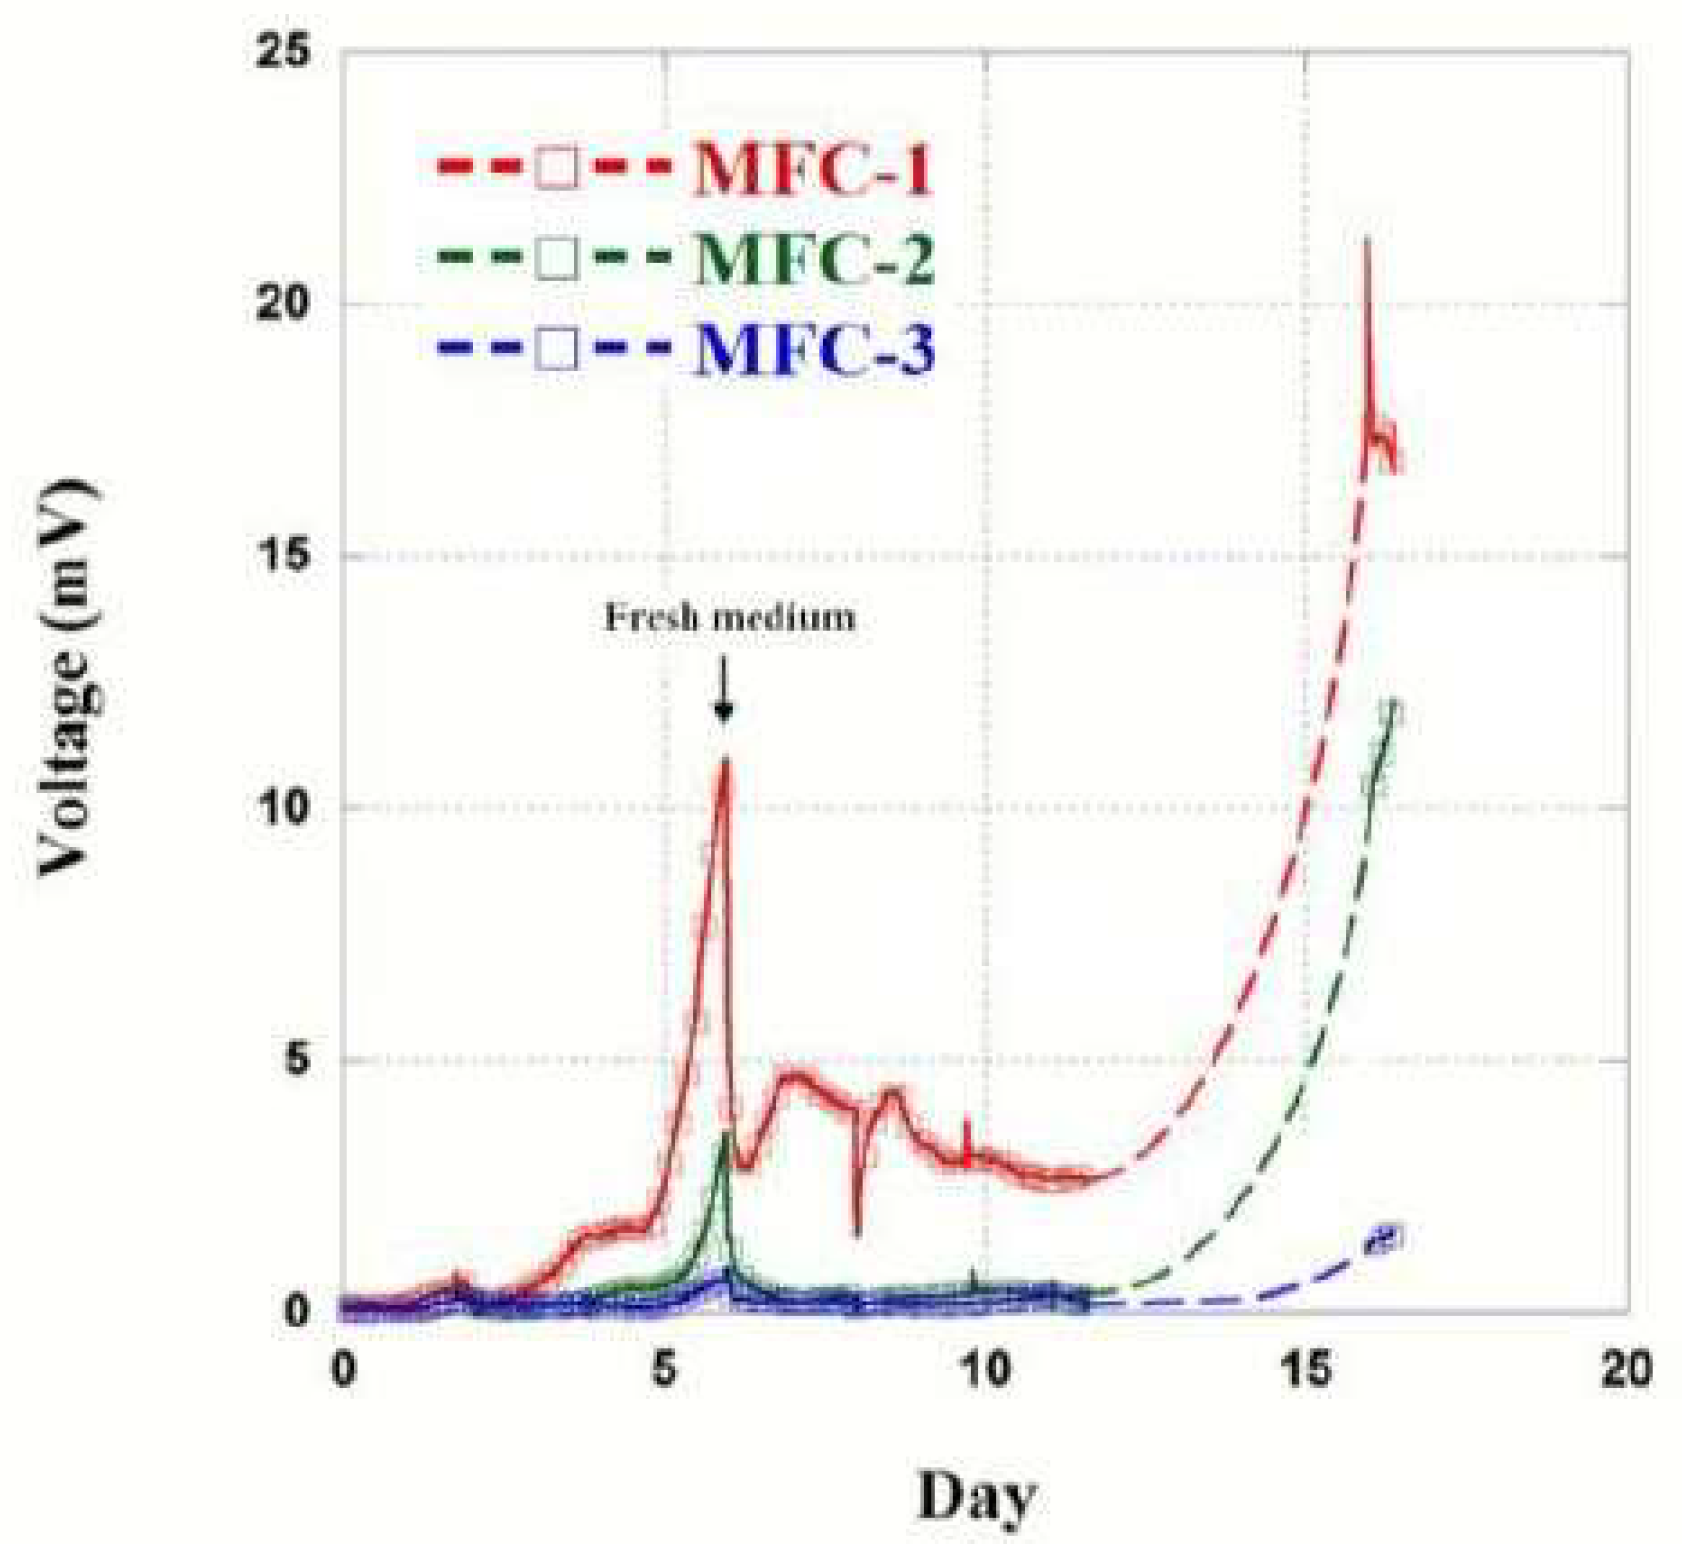
Figure 2.
The equivalent circuit of MFC.

Figure 3.
The mechanism of hydrodynamic boundary layer.
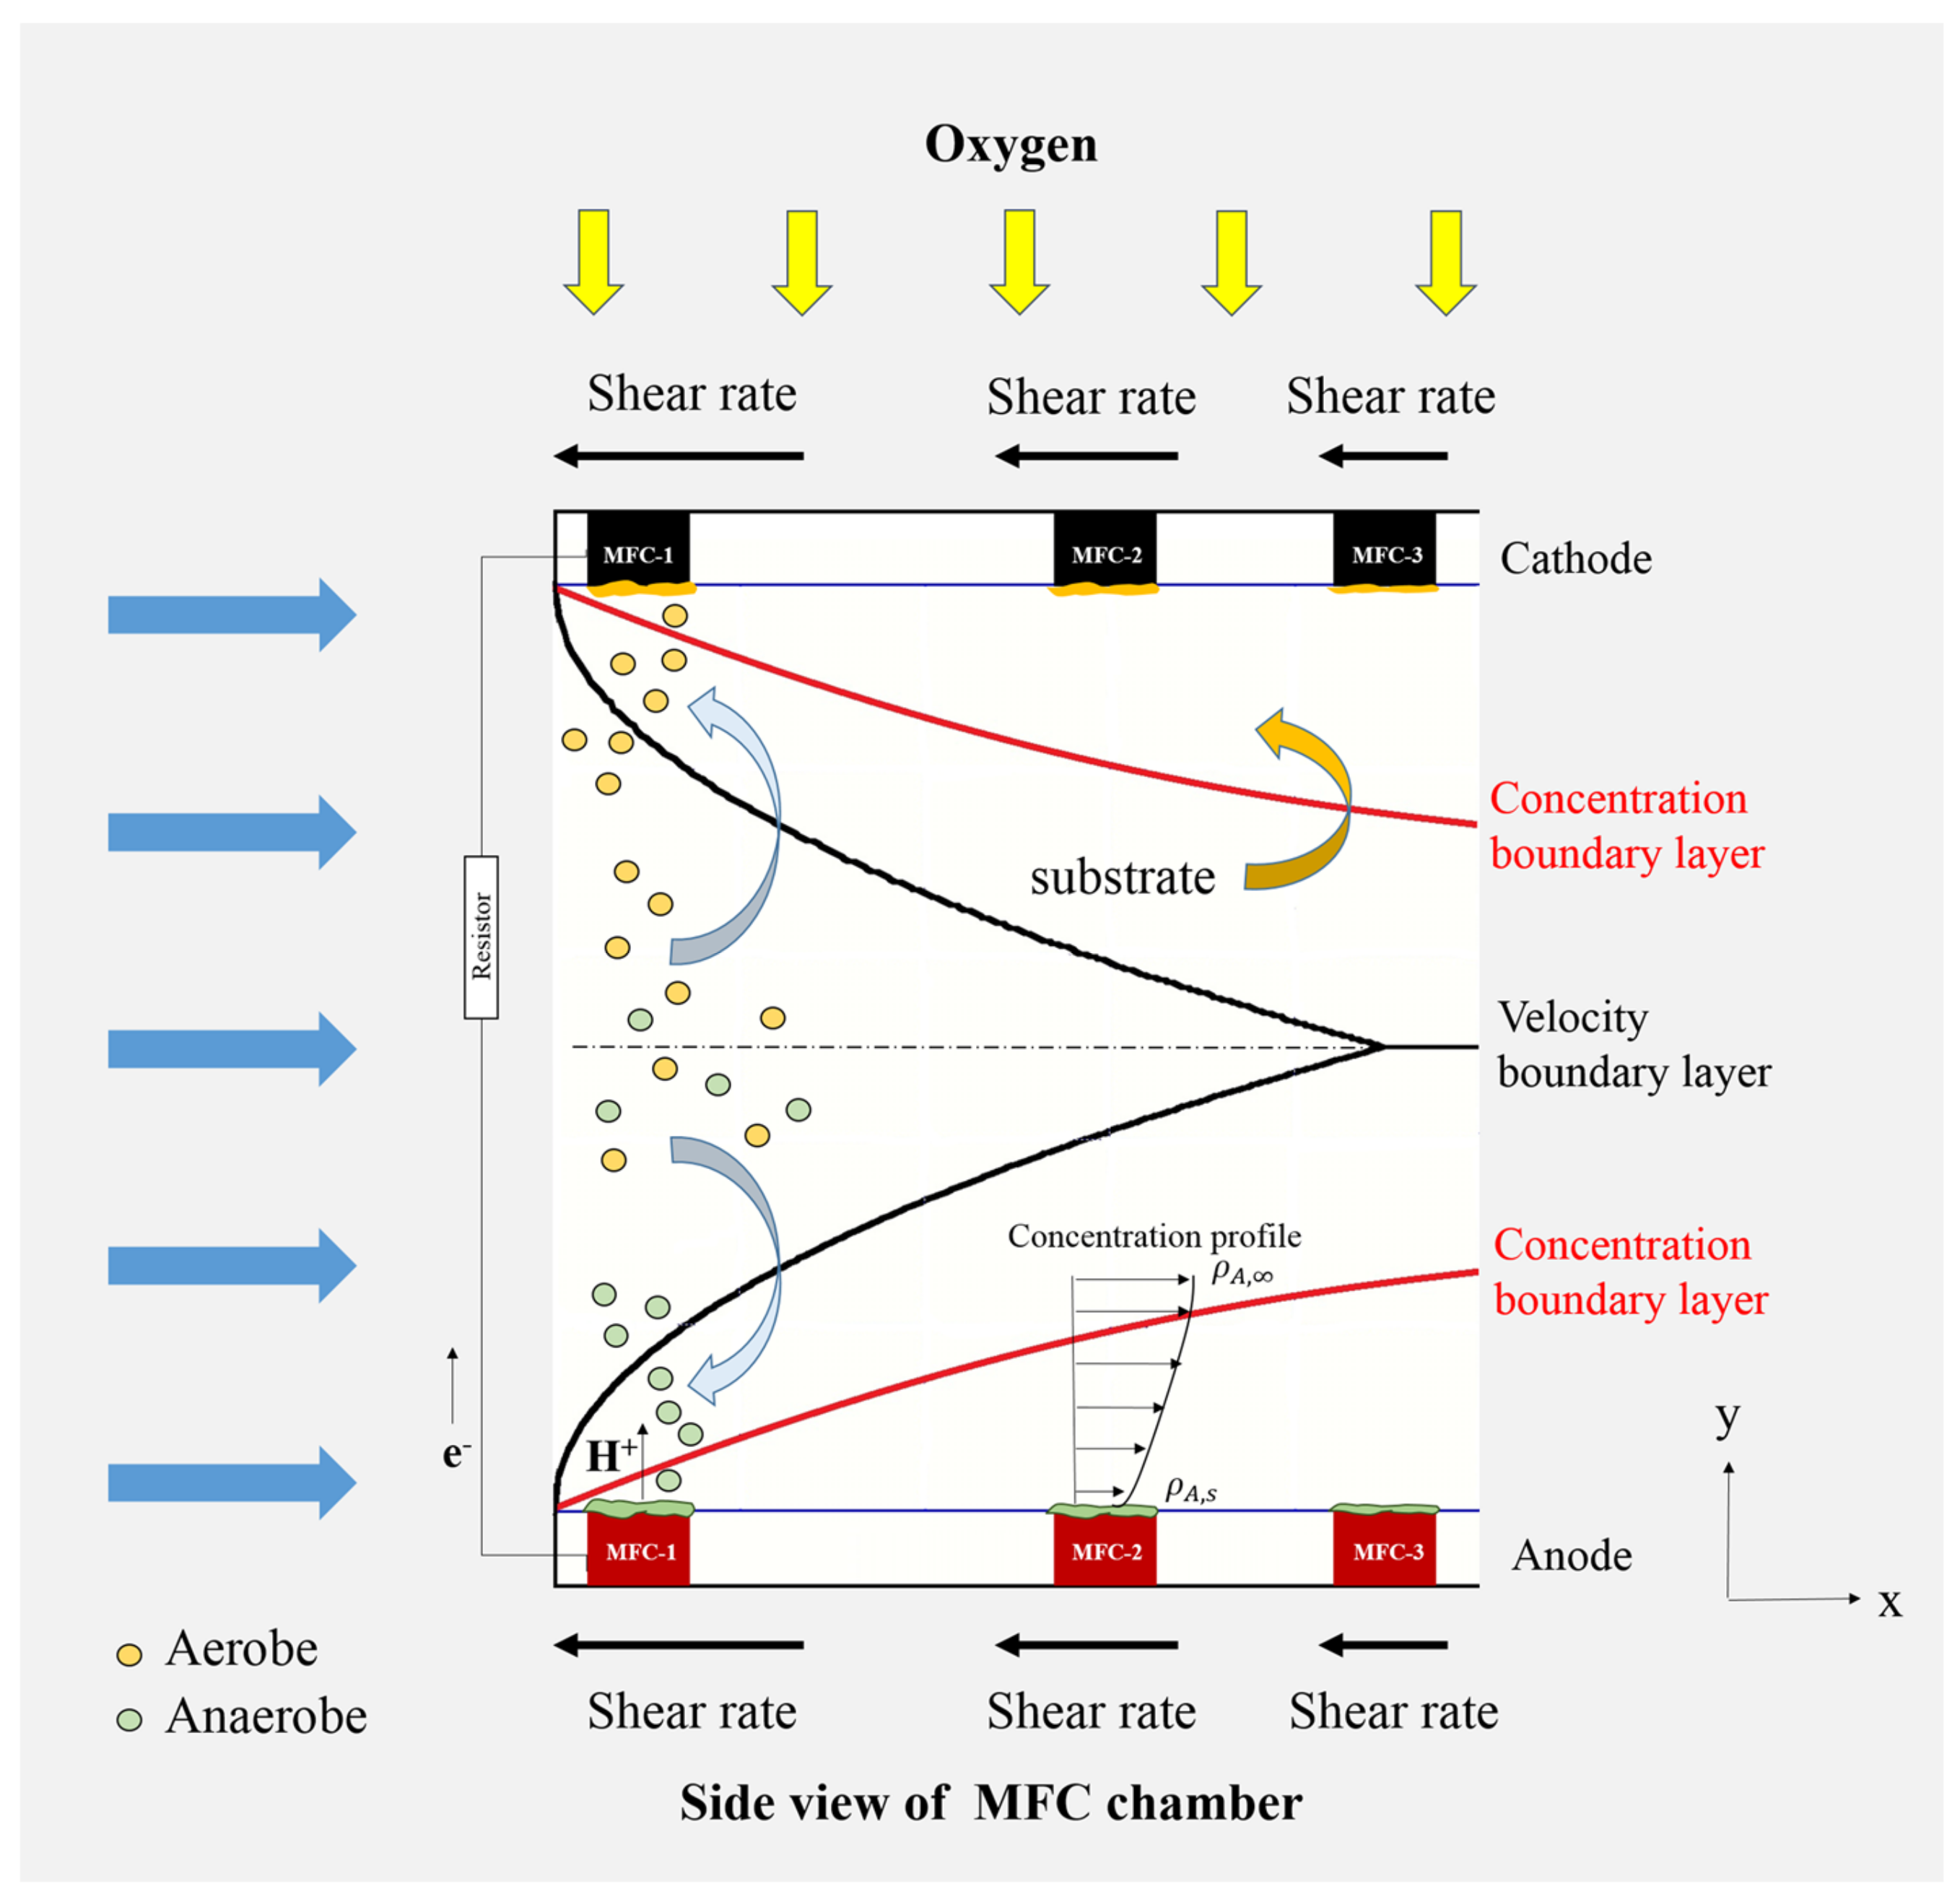
Figure 4.
The (A) clear side view and (B) experimental setup of recirculation mode MFCs.

Figure 5.
The schematic diagram of hydrodynamic boundary layer in the MFCs.


Table 1.
Internal resistance of MFCs with respect to hydrodynamic boundary layer thickness.
| Kinds | δ (cm) | G (1/S) | R1 (Ω) | Ra,g (Ω) | Ca,g (C) | Ra,t (Ω) | Ca,t (C) | Rc (Ω) | Cc (C) | Wc (C) |
|---|---|---|---|---|---|---|---|---|---|---|
| MFC-1 | 1.6 | 0.047 | 47.4 | 39 | 0.0015 | 12.6 | 1.5 × 10⁻⁶ | 15.8 | 1.6 × 10⁻⁶ | 0.00086 |
| MFC-2 | 4.1 | 0.02 | 45 | 45 | 0.0013 | 12 | 0.0025 | 3.85 × 10⁻⁶ | 0.00098 | 0.00016 |
| MFC-3 | 5 | 0.016 | 40.5 | 49.1 | 0.0018 | 11 | 1.7 × 10⁻⁶ | 13.5 | 0.0008 | 0.00085 |
© 2018 by the authors. Licensee MDPI, Basel, Switzerland. This article is an open access article distributed under the terms and conditions of the Creative Commons Attribution (CC BY) license (http://creativecommons.org/licenses/by/4.0/).
Share and Cite
MDPI and ACS Style
Chen, Y.-M.; Wang, C.-T.; Yang, Y.-C. Effect of Wall Boundary Layer Thickness on Power Performance of a Recirculation Microbial Fuel Cell. Energies 2018, 11, 1003. https://doi.org/10.3390/en11041003
AMA Style
Chen Y-M, Wang C-T, Yang Y-C. Effect of Wall Boundary Layer Thickness on Power Performance of a Recirculation Microbial Fuel Cell. Energies. 2018; 11(4):1003. https://doi.org/10.3390/en11041003
Chicago/Turabian StyleChen, Yan-Ming, Chin-Tsan Wang, and Yung-Chin Yang. 2018. "Effect of Wall Boundary Layer Thickness on Power Performance of a Recirculation Microbial Fuel Cell" Energies 11, no. 4: 1003. https://doi.org/10.3390/en11041003
Note that from the first issue of 2016, this journal uses article numbers instead of page numbers. See further details here.