The Energy Cost Analysis of Hybrid Systems and Diesel Generators in Powering Selected Base Transceiver Station Locations in Nigeria


Department of Mechanical Engineering Science, Faculty of Engineering and the Built Environment, University of Johannesburg, Auckland Park Campus, Johannesburg, Gauteng 2006, South Africa
*
Author to whom correspondence should be addressed.
Energies 2018, 11(3), 687; https://doi.org/10.3390/en11030687
Submission received: 29 November 2017
/
Revised: 31 January 2018
/
Accepted: 1 February 2018
/
Published: 19 March 2018
Abstract
:As more locations gain access to telecommunication, there is a growing demand to provide energy in a reliable, efficient and environmentally friendly manner while effectively addressing growing energy needs. Erratic power supply and rising operation costs (OPEX) in Nigeria have increased the need to harness local renewable energy sources. Thus, identifying the right generator schedule with the renewable system to reduce OPEX is a priority for operators and vendors. This study evaluates the energy costs of hybrid systems with different generator schedules in powering base transceiver stations in Nigeria using the Hybrid Optimization Model for Electric Renewable (HOMER). A load range of 4 kW to 8 kW was considered using: (i) an optimised generator schedule; (ii) forced-on generator schedule and (iii) the generator-only schedule. The results showed an optimal LCOE range between averages of USD 0.156/kWh to 0.172/kWh for the 8 kW load. The percent energy contribution by generator ranges from 52.80% to 60.90%, and by the solar PV system, 39.10% to 47.20%. Excess energy ranges from 0.03% to 14.98%. The optimised generator schedule has the highest solar PV penetration of 56.8%. The OPEX savings on fuel ranges from 41.68% to 47% for the different load schedules and carbon emission savings of 4222 kg to 31,428.36 kg. The simulation results shows that powering base stations using the optimised hybrid system schedule would be a better option for the telecom industry.
1. Introduction
As more and more locations gain access to telecommunication, there is a growing demand to provide energy in a reliable, efficient and environmentally friendly manner while efficiently addressing growing energy needs. The subscriber penetration rate in West Africa is 49%; in Nigeria, 45% [1,2]. Based on recent statistics, the subscriber identity module (SIM) penetration in Nigeria is 82% and the number of lines connections is 151.8 million [3]. Furthermore, telecom density has risen from 72.72% in May 2012 to 99.39% in August 2017 [4]. This amounts to an increase of 26.67% in the past five years.
Energy consumption is among the most expensive items for telecom operators. Base stations (BSs) are among the key energy consumption elements of cell sites [5,6]. In off-grid and bad-grid tower sites, the primary component of plant-level energy costs is the expenditure on diesel fuel for generators, which accounts for almost 80% of the total energy costs. As such, operators and vendors must critically consider and evaluate design consideration, operation and maintenance (OPEX), energy efficiency of BSs, greenhouse gas emissions, and equipment evolution capability to yield the best return on investment [2,5,7,8,9].
According to Alsharif [10], in 2014 approximately $22 billion was allocated to electric energy consumption for the global operating cost of cellular networks. About 800 mobile operators worldwide were gathered by the Global System for Mobile Communications Association (GSMA, London, UK) for a planned launch to deploy energy resources for about 118,000 new and existing base stations in developing countries in order to cut down diesel fuel consumption by 2.5 billion litres, which would invariably reduce carbon emissions by 6.3 million tons on a yearly basis [11]. Utilizing renewable energy sources such as solar, wind and biofuels as replacements would be a viable solution for the mobile telecommunication industry.
Demand for voice and data services in the Nigerian telecom industry is increasing; as a result, operators are faced with the challenge of powering their equipment reliably, efficiently, and profitably, while balancing environmental concerns. A report in the Electronic Journal of Energy & Environment discovered that erratic power supply is responsible for over 70% downtime across Nigeria, resulting in poor quality of service in the telecom industry [12].
Internationally, most developed nations do not have erratic energy supplies except in unique situations or natural disaster, which is not the case with Africa. Most parts of Africa have serious energy concerns. Though Nigeria has invested heavily in energy over the years, its power supply still seems far from meeting the demand of its yearning population, hence the need to make energy reliable, efficient, and cost effective for the telecom industry.
There are approximately 12,560 mobile sites completely off the grid in Nigeria. An estimated 11,692 sites are linked to the national grid; of those, 9% have 6 hour grid outages per day on average; 10% have 6–12 h grid outages per day; and the remaining 81% have over 12 h grid outages in a day [13]. Of the 180 million Nigerians, 100 million, which represents about 60% of the country’s population, have no access to grid electricity. On top of grid outages, a 2017 study by the Nigerian Economic Summit Group and Heinrich Böll Stiftung Nigeria [10] reports that off-grid solar photovoltaic (PV) systems cost an average of USD 20 cents/kWh, while diesel generators cost USD 30 cents/kWh. Gasoline was found to cost over USD 60 cents/kWh. The most competitive among the energy sources include large scale hydropower and natural gas, both of which average USD 0.05 to 0.07/kWh, while wind is around USD 0.09/kWh [14]. Conversion to more efficient renewable energy hybrid systems could save US$13–14 billion annually for the telecom industry while simultaneously accounting for capital expenditure (CAPEX). If adopted, these green technologies have the potential to eliminate approximately 40 million tons in carbon emissions as well as generate US$100–500 million annually in carbon savings [2]. In this study, the Hybrid Optimization Model for Electrical Renewables (HOMER) was used to simulate a solar PV hybrid system for three different loads (4, 6.4 and 8 kW) and three different generator schedules: the optimised schedule, the forced-on schedule and the generator-only schedule to simulate the energy and cost analysis of the hybrid system for 12 different sites across Nigeria. The comparison is done to determine the schedule system that would be optimal for powering base stations at the given loads range through: (1) levelised cost of energy (LCOE); (2) energy generated; (3) percentage energy contribution by solar PV system; (4) photovoltaic (PV) penetration; (5) fuel consumption; (6) percentage fuel savings and (7) carbon emissions.
The remaining parts of the paper are organized as follows: Section 2 presents work done on the related hybrid power system. Section 3 discusses the site configuration, simulation and modelling of system components using the Hybrid Optimization Model for Electric Renewable (HOMER). The results of the simulations are presented in Section 4, while Section 5 gives the conclusions and recommendations.
2. Hybrid Power System
Hybrid power systems are made to generate electrical power using different technologies and energy sources. A number of power generation systems, such as main grid, photovoltaic, wind turbines, fuel generators and batteries, can be combined in hybrid power systems for power generation. Hybrid systems can also be independent of large centralized power grids and be used in remote areas. They usually consist of a primary renewable source working in parallel with a stand-in secondary non-renewable component and storage units [15]. Hybrid power systems are a way to provide power to the many remote areas in the developing world, where the costs for large scale expansion of electrical grids as well as diesel fuel transportation are very high. However, due to the inconsistent nature of the power supply in many developing countries, hybrid renewable systems are currently being used in urban areas as well to reduce the operating expenditures (OPEX).
In this research, the simulated hybrid power system is made up of solar panels, batteries, a diesel generator and other relevant equipment, such as controllers for flexibility in switching or integrating diesel or grid through a unified controlling platform. Its maximum utilization of solar energy provides a simple, efficient, and reliable on-site power supply.
Much research has been done regarding the solar hybrid cost. Cristóbal-Monreal and Dufo-López [16] studied the optimisation of photovoltaic-diesel-battery stand-alone systems minimising system weight. They considered minimisation of the weight of the system, minimisation of the cost and minimisation of both weight and cost. They found out that a hybrid system is the optimal option. Lopez et al. [17] took it further to discuss ways of optimising PV-wind-diesel hybrid systems to minimise cost and maximise human development index and job creation. They used the multi-objective optimisation of off-grid hybrid renewable systems to minimise net present cost and maximise human development index and job creation.
Ogunjuyigbe et al. [18] used a generic algorithm on a hybrid system of solar and wind to minimize the lifecycle cost, dump energy, and CO2 emissions. They used small split diesel generators instead of a big single diesel generator. Their results achieved 28%, 46%, 82% and 94% reduction in cost of energy, life cycle cost, CO2 emissions, and dump energy, respectively, when compared to the single big diesel generator system. Ahadi et al. [19] investigated at several hybrid renewable energy system (HRES) combinations of solar, wind and energy storage free of diesel generators to supply energy for remote communities. The study showed that the wind turbine operations range must be considered. Increasing the wind turbine fraction could also lead to significantly lower costs as well as the PV solar cell number and number of batteries.
Taher et al. [20] did a techno-economic feasibility study of hybrid energy systems (PV/wind turbine/diesel system with storage batteries) for electricity generation. With a peak load of 3 kW, they had the most economical system with net present cost and levelized cost of energy of 57,320 USD and 0.26 USD/kW, respectively. The incorporation of storage units also reduced the net present cost, excess energy fraction and CO2 emission by 85%, 81% and 29%, respectively. They found out that the use of hybrid energy systems in such locations improved the standard of living and economic activities of the rural populace. Li et al. [21] developed a simple sizing algorithm for stand-alone PV/wind/battery hybrid microgrid systems to determine the number of wind turbine and PV array generating units and the storage capacity required for a stand-alone microgrid. The used the algorithm to propose the state of charge (SOC) cycle variance, from which the number of photovoltaic arrays can be calculated when the number of wind turbines is known.
PV systems and batteries serve complementary roles according to Katz et al. [22]. As the PV system efficiently reduces total grid consumption, battery storage reduces the demand charges by removing the load peaks when there is no solar radiation. Goel and Ali [23], in the study of the cost analysis of solar/wind/diesel hybrid energy systems for telecom towers, used HOMER to get the optimum net present cost (NPC), operating cost per year and the energy cost/kWh for different models. They observed that the cost of energy (COE) decreases with increasing load for the system. They had the maximum COE with only the DG system at different load levels.
According to the Saviva research group [24], most telecom operators are now moving away from total dependence on diesel fuel for powering base stations, especially in remote and rural locations. Some of these telecom firms have acquired integrated renewable energy systems; though higher capital expenditure (CAPEX) is required, lower OPEX is expected in the long run. Alsharif, in comparing the analysis of solar-powered base stations using the architecture, energy production, and optimal system cost with conventional energy sources, obtained an OPEX savings range of 32% to 66%. He concluded that the solar-powered base stations would be a feasible long-term solution for the telecommunication industry [5]. In a similar study in the optimisation of energy in the telecommunication industry for base stations using hybrid system, an OPEX savings of 43% to 47% was achieved considering the solar radiation in Malaysia [25].
In many developing countries, the emissions from fuel burned by telecom operators for their base stations are an enormous source of greenhouse gas (GHG) emissions into the atmosphere. According to Alsharif [26], the mobile sector accounts for 51% of the total carbon footprint of the information and communication technology sector. With the integration of hybrid systems, the size of the footprint would be reduced significantly. Moradi et al. [27] in the Modeling of a Hybrid microgrid, concluded that high renewable energy penetration have substantial effect on the grid operation with respect to emission.
Different energy sources can be incorporated into a single energy platform to provide flexible configuration, smooth evolution and easy expansion in the hybrid system [12,28,29,30,31]. With the hybrid solution, the following can be achieved:
- (1)
- A 40~90% reduction in fuel consumption by the diesel generator (DG) with the solar hybrid system. 90% can be reduced as well on the operation and maintenance cost (OPEX). The OPEX on sites powered by DG alone is higher than that in hybrid powered sites. Carbon footprint savings of 30~75% are also achieved as a result of the reduction in the burning of fossil fuel [29,30,31,32,33,34,35].
- (2)
- (3)
- (4)
- Increased life cycle of DG and replacement time as a result of lower run hours [38]. Lower generator run hours increases the life cycle of a generator.
- (5)
- Equipment temperature maintenance at an acceptable range that would not cause damage due to heating.
A complete hybrid system can be packaged in an ‘energy container’ to offer quick installation in remote locations. The cycling battery must have a temperature-resistant, low-maintenance design, accept fast charging, and be able to deliver a large number of charge-discharge cycles; the rectifier must offer the highest possible energy efficiency. Furthermore, the controller must be equipped with dedicated software enabling the operating profile of the battery and generator, which allows for component optimization and thus delivering the lowest possible operating cost. The addition of renewable energy sources will permit an increase in cycling time and consequently extend the life of the battery and generator while also reducing environmental impact.
Colocation (colo) is the provision of space and facilities which includes towers, generators and other equipment for telecommunications operators and internet service providers in the same location. This has reduced the CAPEX and OPEX for most operators significantly.
Some of the challenges faced by telecom operators in powering their base transceiver station include: high mean time to repair (MTTR), increasing fuel cost and consumption, high operation cost, high cooling load, fuel theft and environmental pollution (oil spillage, carbon emission and noise).
3. Site Configuration
Site configuration determines the energy requirement for sites. This should be established during the site design process. The sites, which can be either outdoors or indoors, also determine the load requirements. Table 1 and Table 2 are for real site configurations used by telecom operators in the design of base transceiver stations’ load requirements. The configurations 222/444, 222/666 and 444/666 indicate the number of TRXs (transceiver) in each sector for the BTS (base transceiver station). Microwave is a communications system that uses a beam of radio waves in the microwave frequency range to transmit audio, video and other information between locations, from a few feet or meters to several miles or kilometers apart. Table 1 and Table 2 show the outdoor and indoor configurations.
For the research work, three sets of configurations were considered:
- (1)
- 222/444 + 3G + 4G + Microwave + Lighting 4 kW
- (2)
- 444/666 + 3G + 4G + Microwave + Lighting 6.4 kW
- (3)
- 444/666 + 3G + 4G + Microwave + DC air conditioner + Lighting 8 kW.
In the simulation, three schedules were considered for the generator: the optimised, the forced-on and generator only. In the optimised schedule, the HOMER system decides what energy source comes into play at every point. In the forced-on schedule, the generator operates between 10:00 p.m. and 7:00 a.m., while there is no solar radiation. The generator only schedule is without a renewable energy source.
3.1. Simulation and Modelling of System Components
Hybrid Optimization Model for Electric Renewable (HOMER) is a simulation model software. It simulates a feasible system for all likely combinations of the equipment to be considered. It is a tool for comparing and evaluating micro-grid technology for a wide range of applications; depending on how the problem is posed, HOMER can simulate hundreds of systems. In this study, the HOMER Pro 3.9.2 software was used to simulate hybrid energy system for off-grid with different schedules and compared with a system that run with diesel generator only system. In doing the simulations system designs, several parameters have to be taken into consideration for proper decisions. Such includes what components to include and the size of the component to make the system feasible and at optimum cost. HOMER simulates the system over 8760 h, making energy balance for the values. HOMER in its simulation compares the electric and thermal demand to the energy that the hybrid system can supply. It calculates the flows of energy in and out of each component of the hybrid system and determines whether a configuration is feasible or not.
The key components of the hybrid system comprise of solar PV, diesel generator, batteries and the converter. HOMER incorporates the entire cost of the system to calculate the economic viability of the systems. It involves information about the cost (capital, operation, maintenance and replacement), number and size of the units to be used, hours of operation and lifetime, as well as specific component properties. It uses the total net present cost (NPC) to signify the life-cycle cost of the system while factoring in yearly real interest rate. HOMER takes a linear depreciation component, meaning that the salvage value is directly proportional to its remaining life. The HOMER software performs sensitivity analyses to justify the sensitivity of the system design to key factors, like the component resource costs or availability.
HOMER uses the following equation to calculate the total net present cost (NPC) [10,26,39,40]:
where Cann,tot is the total annualized cost, i is the annual real interest rate (the discount rate), Rproj is the project lifetime, and CRF is the capital recovery factor, given by the equation:
where i is the annual real interest rate and N is the number of years.
To calculate the salvage value of each component at the end of the project lifetime, HOMER uses the following equation [5,39]:
where S is the salvage value, Crep the replacement cost of the component, Rrem the remaining life of the component, and Rcomp the lifetime of the component. For each of the components, HOMER integrates the capital, maintenance, replacement, fuel costs, along with the salvage value and any other costs or revenues, to calculate the project component’s annualized cost.
3.1.1. Solar Resource
Solar resources are simulated from the NASA surface meteorology and solar energy database by entering the GPS coordinates in the website [41]. It is advisable that the average radiation should have a constant trend and annual radiation above 4 kWh/m2/day to have a reliable source of power coming from the photovoltaic panels [39]. The radiation values were determined for the 12 sites considered for the six geo-political regions of Nigeria.
3.1.2. Clearness Index
In the HOMER Pro, the average radiation for each month is entered. HOMER calculates the clearness index based on the radiation value, the month of the year and latitude. HOMER also calculates the average radiation from the global horizontal radiation (GHI). The index is a number indicating the fraction of the solar radiation striking the top of the atmosphere that makes it through the atmosphere to the Earth’s surface. The value ranges between 0 and 1.
The following equation defines the monthly average clearness index:
- .
HOMER uses the equation below to calculate the intensity of solar radiation at the top of the Earth’s atmosphere:
where , n is the day of the year [a number between 1 and 365].
Optimization process of the HOMER system: The optimization process of the HOMER system assumes the generator runs continuously, which is not always the case. Most hybrid systems, when optimising, switch between different energy sources, giving priority to the renewable energy system. The generator is usually the last in the priority list [39,42,43].
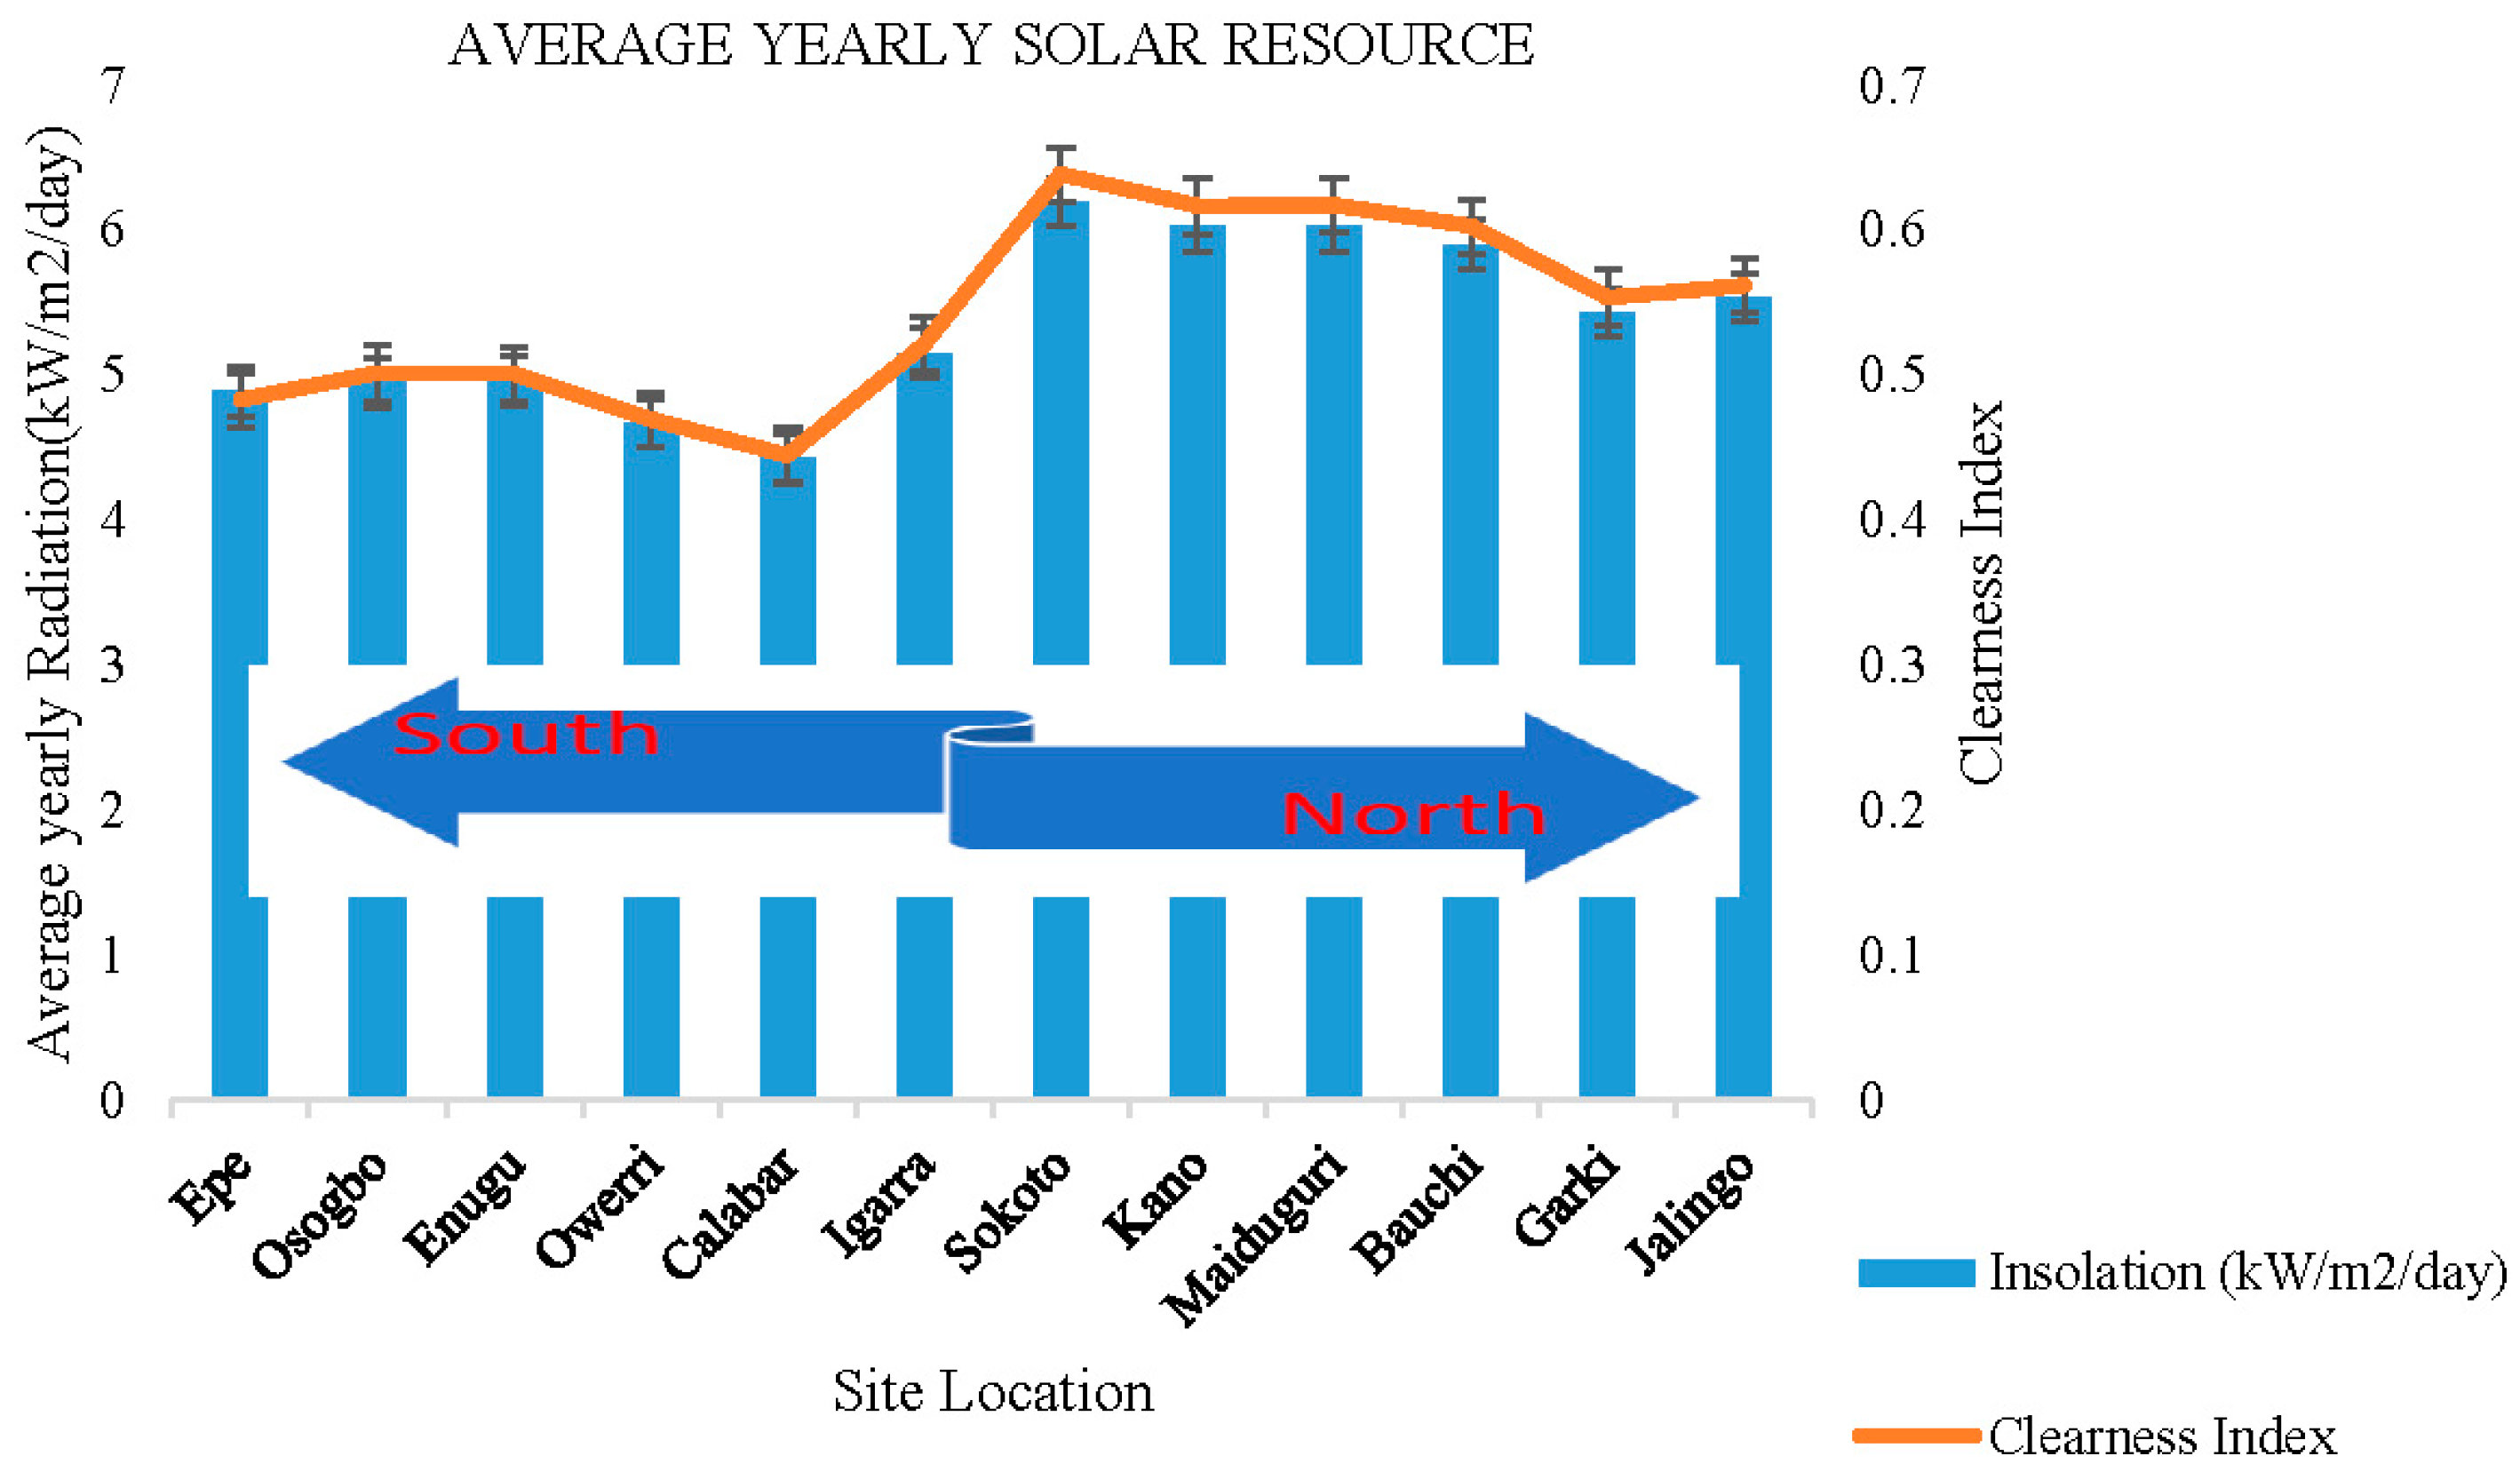
The annual average insolation level in kWh/m2/day, and the clearness index is shown in Figure 1 for all 12 sites. The northern region of Nigeria has higher average insolation as compared to the southern part. Sokoto has the highest solar radiation while Calabar has the lowest solar radiation among the sites.
3.2. Modelling of System Components
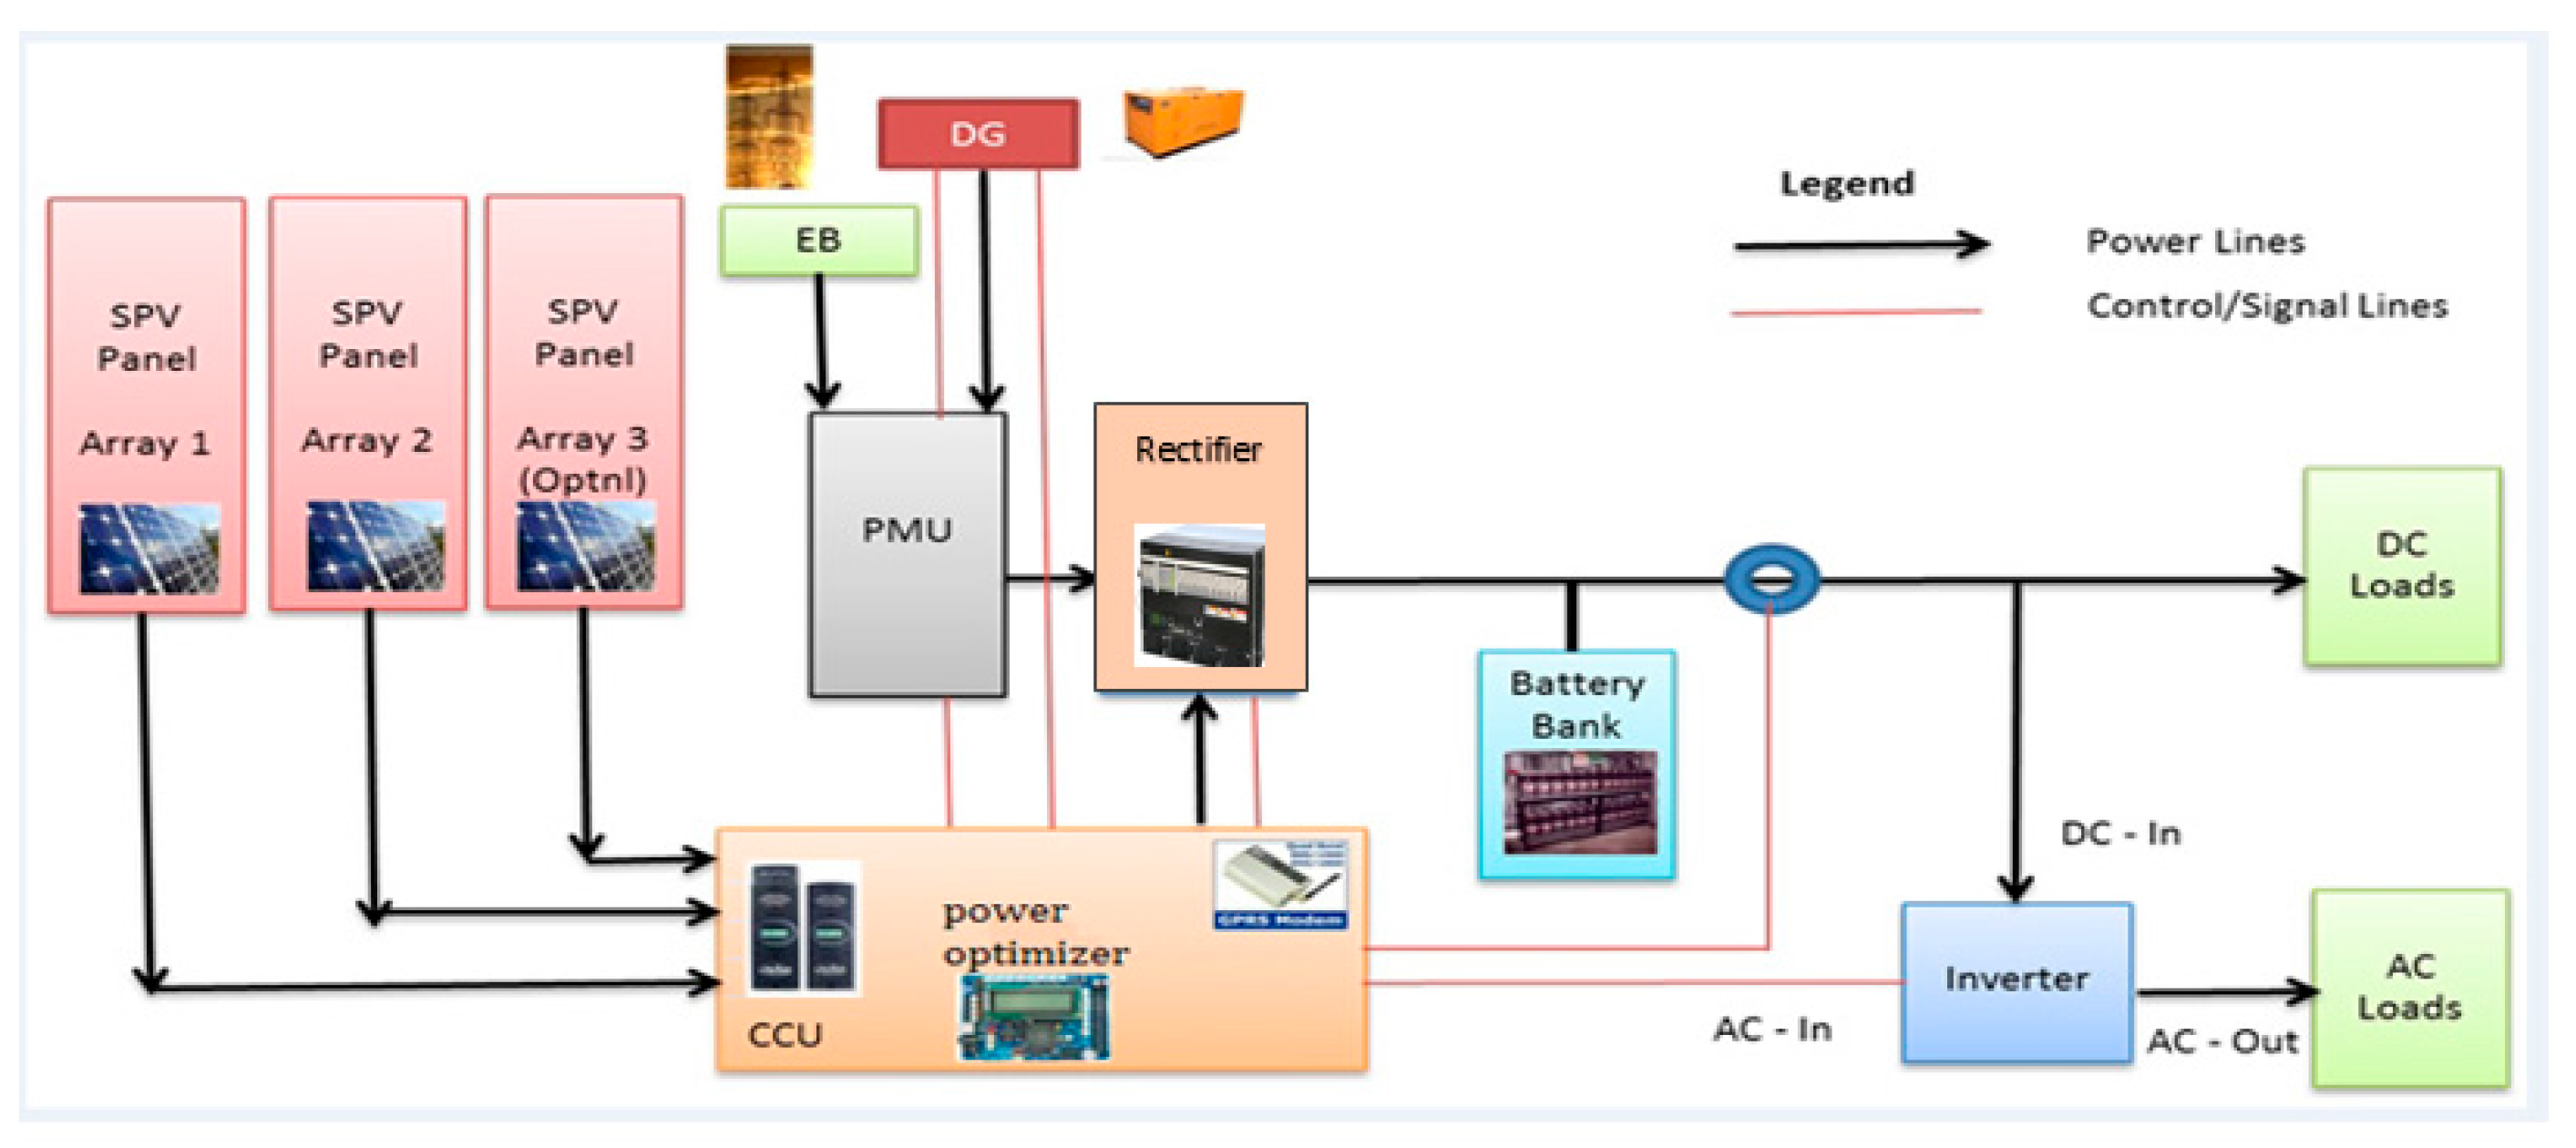
The architecture of a solar-powered base transceiver station is shown in Figure 2. The station combines a photovoltaic (PV) array, battery, the generator and converter. The load directly feeds the required energy to the DC load of the base station. The alternating current (AC) load (cooling and lighting) is fed via a DC/AC inverter. Excess energy is stored in the battery bank and used during night or when the PV cannot supply energy to the required load.
The schematic diagram of the simulated hybrid system is illustrated in Figure 3. The system consists of a PV array containing the load, solar modules, converter, batteries for storage and the diesel generator. The DC power produced from PV arrays and the fuel cell is fed to the DC Bus. The AC power generated from the diesel generator is directly fed to the AC Bus and then converted into DC power and fed to the DC Bus. Excess power goes to the battery bank and is utilized by the fuel cell in case of lack of generated power from PV source.
The costs of renewable energy in the power sector can be represented by per unit of electricity generated and per unit of the installed capacity called “overnight costs”. This study adopts the former in this analysis by using HOMER. The LCOE is defined as the ratio of lifetime costs to lifetime electricity generation, both discounted back to a common year using a discount rate that captures the cost of finance. It can also be seen as the average price at which electricity generated must be sold for a project to reach ‘‘break-even’’ cost. This LCOE also represents cost of unit of electricity produced and in this case is given in US dollars per kilowatt-hour ($/kWh) [44].
In the hybrid system, the control unit monitors the power monitoring unit of the system and delivers power based on the scenarios below:
Scenario 1 (Optimised schedule): The PV provides the required energy to the equipment at the base stations and stores the excess energy in the battery to be used at night or when there is insufficient radiation to provide the required energy. The battery supplies the required energy when there is insufficient solar radiation till it get to its DoD, only then can the generator start working.
Scenario 2 (Forced-on schedule): In the forced on schedule the PV provides the required energy to the equipment during the day time and the generator is forced to start from 10:00 p.m. and 7:00 a.m. in the morning. In between the times when there is no sufficient solar radiation to provide the required energy, the battery supplies the required energy. Excess energy is stored in the battery when there is sufficient solar radiation and also when the generator is running.
Scenario 3 (Generator only schedule): In this scenario the site is made to run on diesel generator only, which is used to make the comparison with the scenarios 1 and 2.
Levelised Cost of Energy (LCOE)
The LCOE takes into account the expected power plant costs, including but not limited to: capital costs, the debt servicing and return on equity invested (weighted average cost of capital), operation and maintenance costs (OPEX), costs of fuel and costs associated with CO2 and other emissions, and decommissioning costs:
Investment in the Nigerian PV industry shares the same risks as other power generation investments, including high capital costs, currency fluctuation risks and foreign exchange market. In addition, another PV-specific risk includes the poor wheeling capacity of the grid in high potential locations. The PV system has an advantage of not being vulnerable to fuel price volatility or resource depletion.
Some assumptions and indicators used in the study to calculate the LCOE and NPC are:
- (1)
- The PV system life is taken as 25 years.
- (2)
- The discount rate is taken as 6%.
- (3)
- Inflation rate is at 2%.
- (4)
- Costs of PV is at $1.3/W.
- (5)
- The costs of maintenance for the generator used as paid by operators is shown below:
- 10–15 KVA @ $0.224/h
- 16.5 KVA @ $0.251/h
- 18–20 KVA @ $0.267/h
- 20–26 KVA @ $0.291/h
- (1)
- Diesel cost of $0.52/L is based on current market price.
- (2)
- The battery used is a 500 AH 2 V deep cycle battery.
For any site, the power requirement is a major component of the design process that needs to be fully studied before installation.
In calculating the power requirement for a site, the equation below is used:
where P is the capacity of the total DC load power, Pn is the power of the different energy consumption equipment like the BTS, microwave, cooling system, lighting and other equipment on site. Tn is the run time of the corresponding energy equipment. Not all equipment runs 24 h on a site.
The battery capacity determines the backup time for the solar system. To determine the battery capacity, the equation below is used:
where C = battery capacity (Ah); D = backup days (s); DoD = depth of discharge (=80%); Kb = coefficient of battery capacity (=1.14); P = capacity of the total DC power load; t = working time per day of load (=24) and Vb = voltage of the battery (=48).
The backup days (D) provides the length of time the batteries can sustain the system when the primary sources of power (PV and DG) are not available. In determining this, several parameters are taken into consideration, which include energy usage of the system, depth of discharge (DoD) limit, temperature, autonomy days, and the battery capacity. In this research, a total of two strings of batteries are connected in parallel for the site. One string comprises 24 blocks of 2 V each batteries connected in series. The battery capacity and the DoD is used to determine the backup days from the equation.
The DoD is defined using the following equation:
where (minimum state of charge) is the lower limit or remaining capacity of battery. This is required to help prevent the battery from discharge and overcharge, improve the battery life and protect it [5,45].
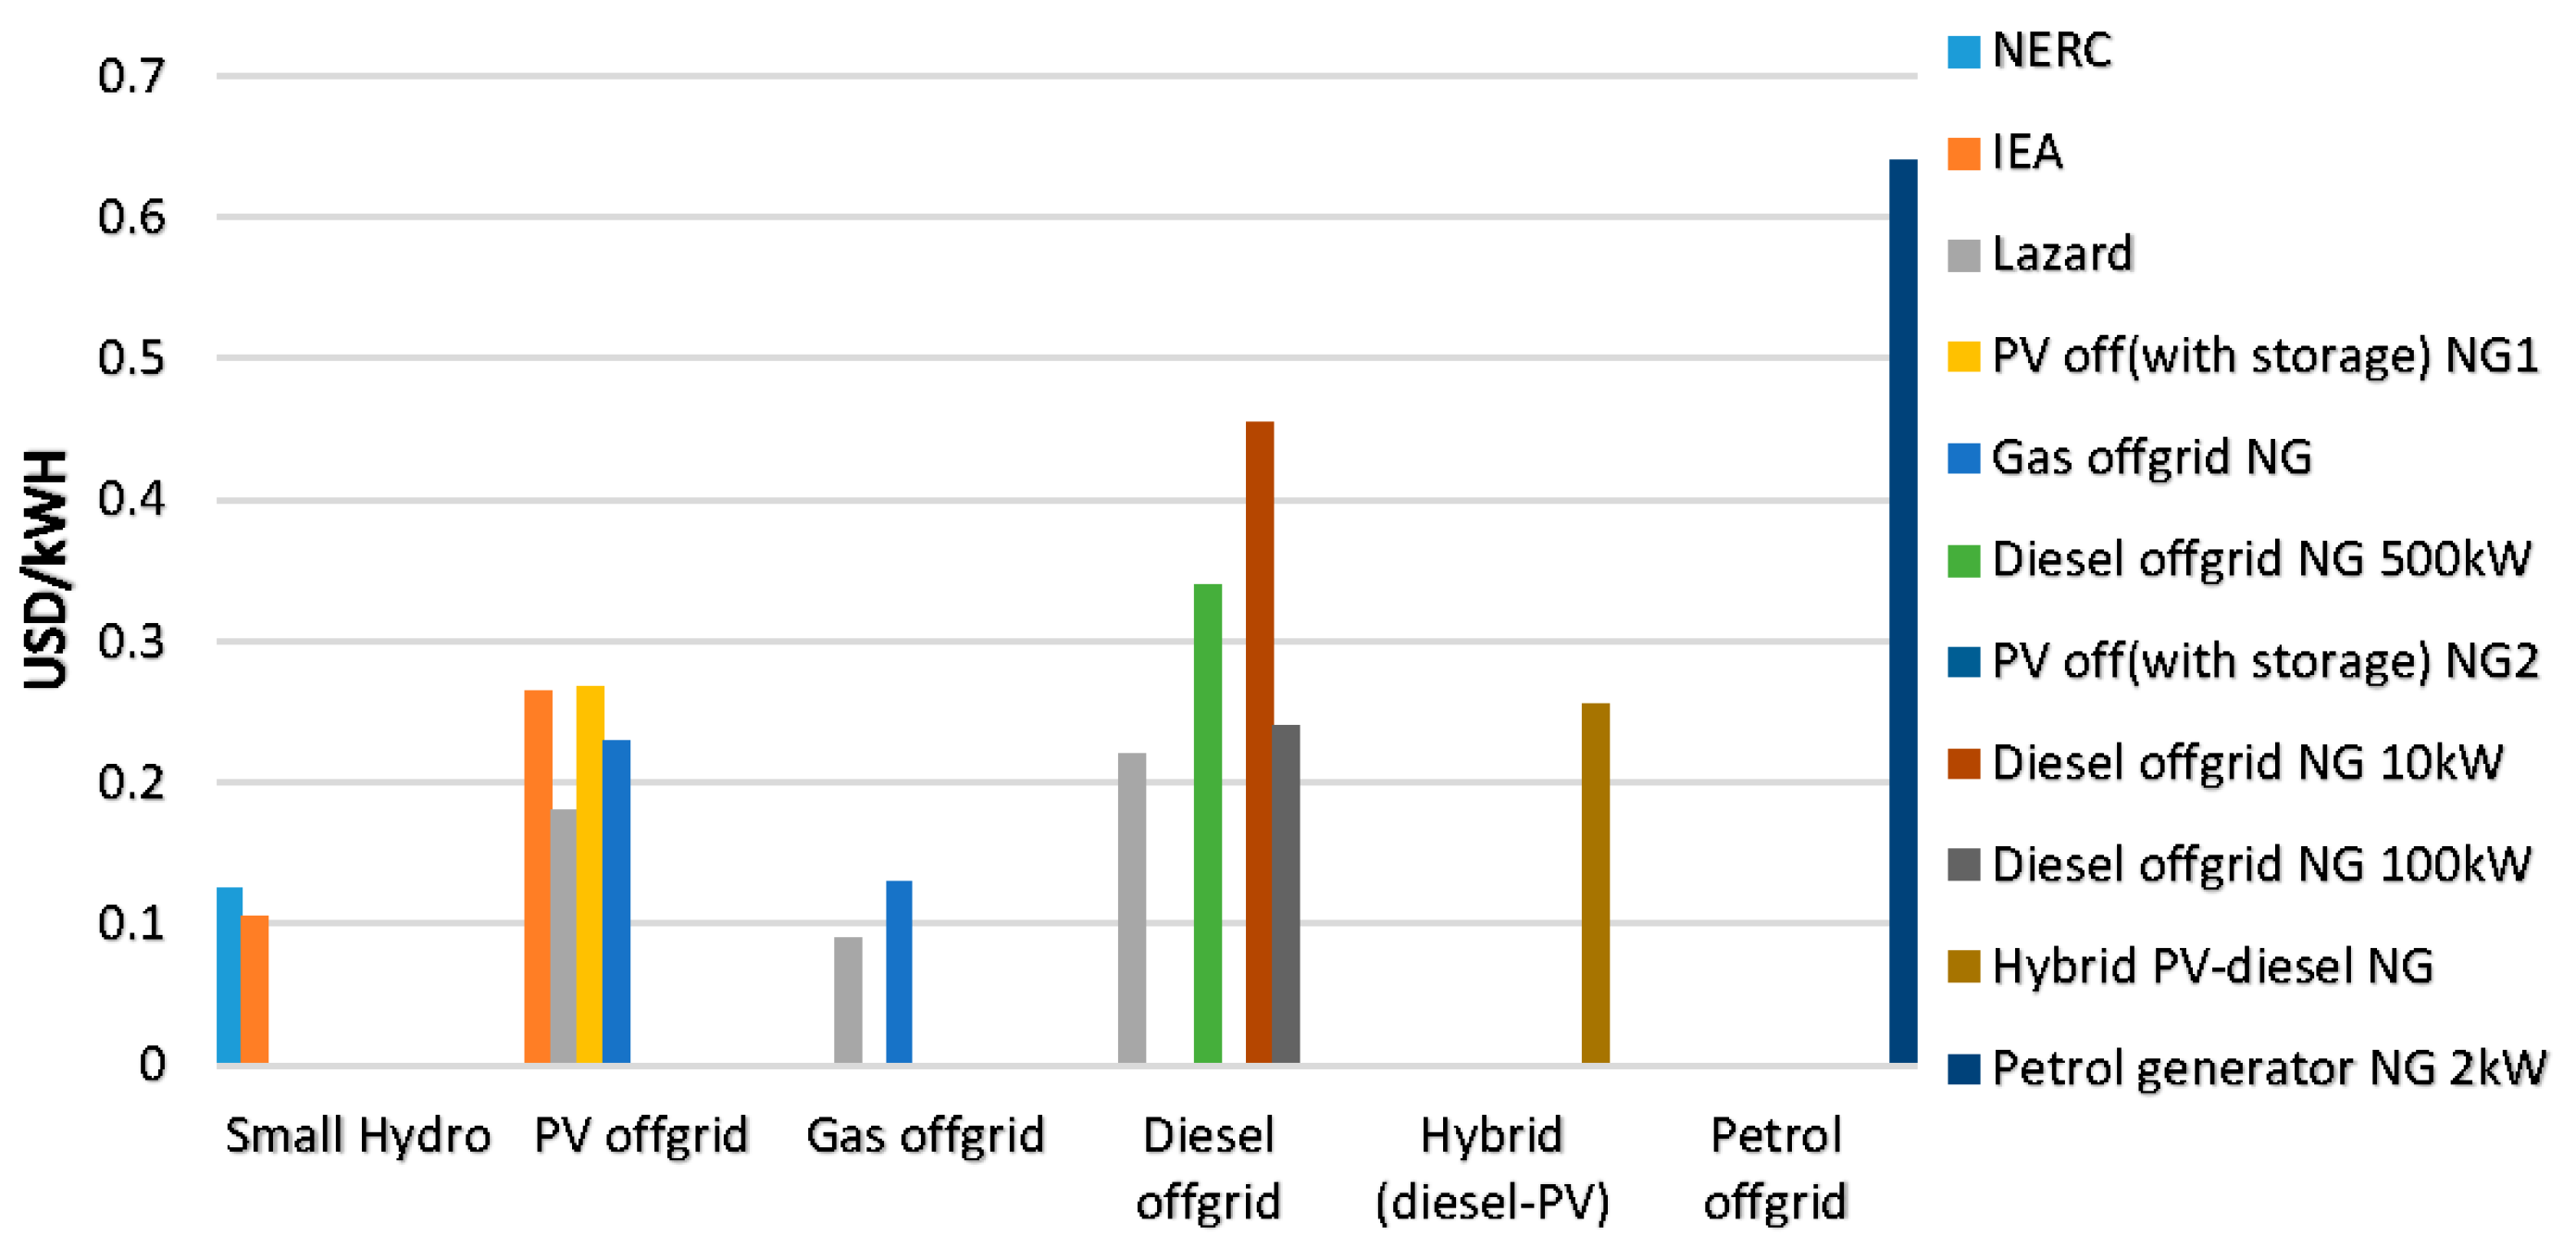
According to the report by the Nigerian Economic Summit Group and Heinrich Böll Stiftung Nigeria [10], the cost of off-grid electricity generation, based on LCOE, is shown in Figure 4. Though small hydro has the smallest LCOE, it is followed by PV—hence the need to harness different renewable sources of energy in all possible ways to mitigate the energy crisis in the Nigerian telecom industry.
Figure 4 shows the costs of off-grid electricity generation based on the LCOE Cost comparison of different energy sources in Nigeria. Note that the Hybrid PV system has an LCOE of about $0.26/kWh. Although a power plant’s electrical production capacity is far higher than that of the system being considered, the graph still presents a comparison of energy costs across different categories.
Table 3 shows the average levelized cost of energy (LCOE) analysis of off-grid PV systems. The values are from the reports from international organizations such as the International Energy Agency (IEA), world energy outlook (WEO) report focusing on renewable energy and Lazard’s annual study comparing the cost of generating energy from conventional and alternative technologies. Other sources include the Renewable Energy and Energy Efficiency Partnership (REEEP) annual reports on clean energy markets and other reports [14,44,46]. It can be seen from the Table 3 that the average LCOE varies from 0.182 to 0.310 $/kWh. The reports gives different values, based on the values used in their calculations. Higher LCOE implies higher energy costs for the populace. The Weighted average cost of capital (WACC) is the overall cost of capital for all funding sources in a company. The exchange rate is based on 315 naira to a dollar.
4. Results and Discussion
In doing the system comparisons, we have used several indices to compare the schedules used: (1) levelised cost of energy (LCOE); (2) energy generated; (3) percentage energy contribution by solar PV system; (4) photovoltaic (PV) penetration; (5) fuel consumption; (6) percentage fuel savings and (7) carbon emissions. The results are presented below.
Table 4 illustrates the levelised cost of energy (LCOE) for the different load range for the 12 locations in Nigeria. From the table, the solar hybrid PV systems are cost competitive in Nigeria for the 4 kW load on a lifetime basis. The LCOE for the 4 kW load ranges between an average of USD 0.199/kWh to 0.221/kWh (including storage costs) as opposed to diesel generators USD 0.30/kWh and gasoline generators over USD 0.60/kWh as compared to the data in Table 3. However, they have significant capital costs and, without affordable financing; diesel generators are more accessible to the operators for their business. If the OPEX and costs of components like the battery could be reduced, there would be a lower LCOE. The price of batteries, a major component of the PV system costs, is rapidly decreasing, majorly driven by the global take-off of electric vehicles. This will facilitate lower LCOEs for the PV system.
For the 6.4 kW load on a lifetime basis, the LCOE which ranges between averages of USD 0.157/kWh to 0.208/kWh (including storage costs) is lower than the 4 kW load. This value is still very competitive as opposed to diesel generators USD 0.30/kWh and gasoline over USD 0.60/kWh (Table 3). However, they have significant capital costs and, without affordable financing, diesel generators are more accessible to the operators for their business.
The solar hybrid PV systems are also the most cost competitive in Nigeria for the 8 kW load on a lifetime basis. The LCOE which ranges between averages of USD 0.156/kWh to 0.172/kWh (including storage costs) for this load (8 kW) is the lowest of the 3 loads scenario considered. As the load increases, the PV size and generator size also increases but it gives lower LCOE. There is little change in the LCOE for the optimised and forced-on generator schedules, the LCOEs are both within the same range. Increased load gives better energy economics. However, they will have significantly higher initial capital costs compared to 4 kW and 6.4 kW systems and require affordable financing. Diesel generators require lower initial capital cost and therefore are more accessible to the operators for their business. If the OPEX and costs of components like the battery could be reduced, LCOE would be reduced. It is worth noting that from the report of [2], the cost of generation of electricity at off-grid sites, which also includes cost of fuel theft, can rise up to US$2.21 per kWh, which is about 10 to 20 times the price of electricity from the grid in most African countries [2].
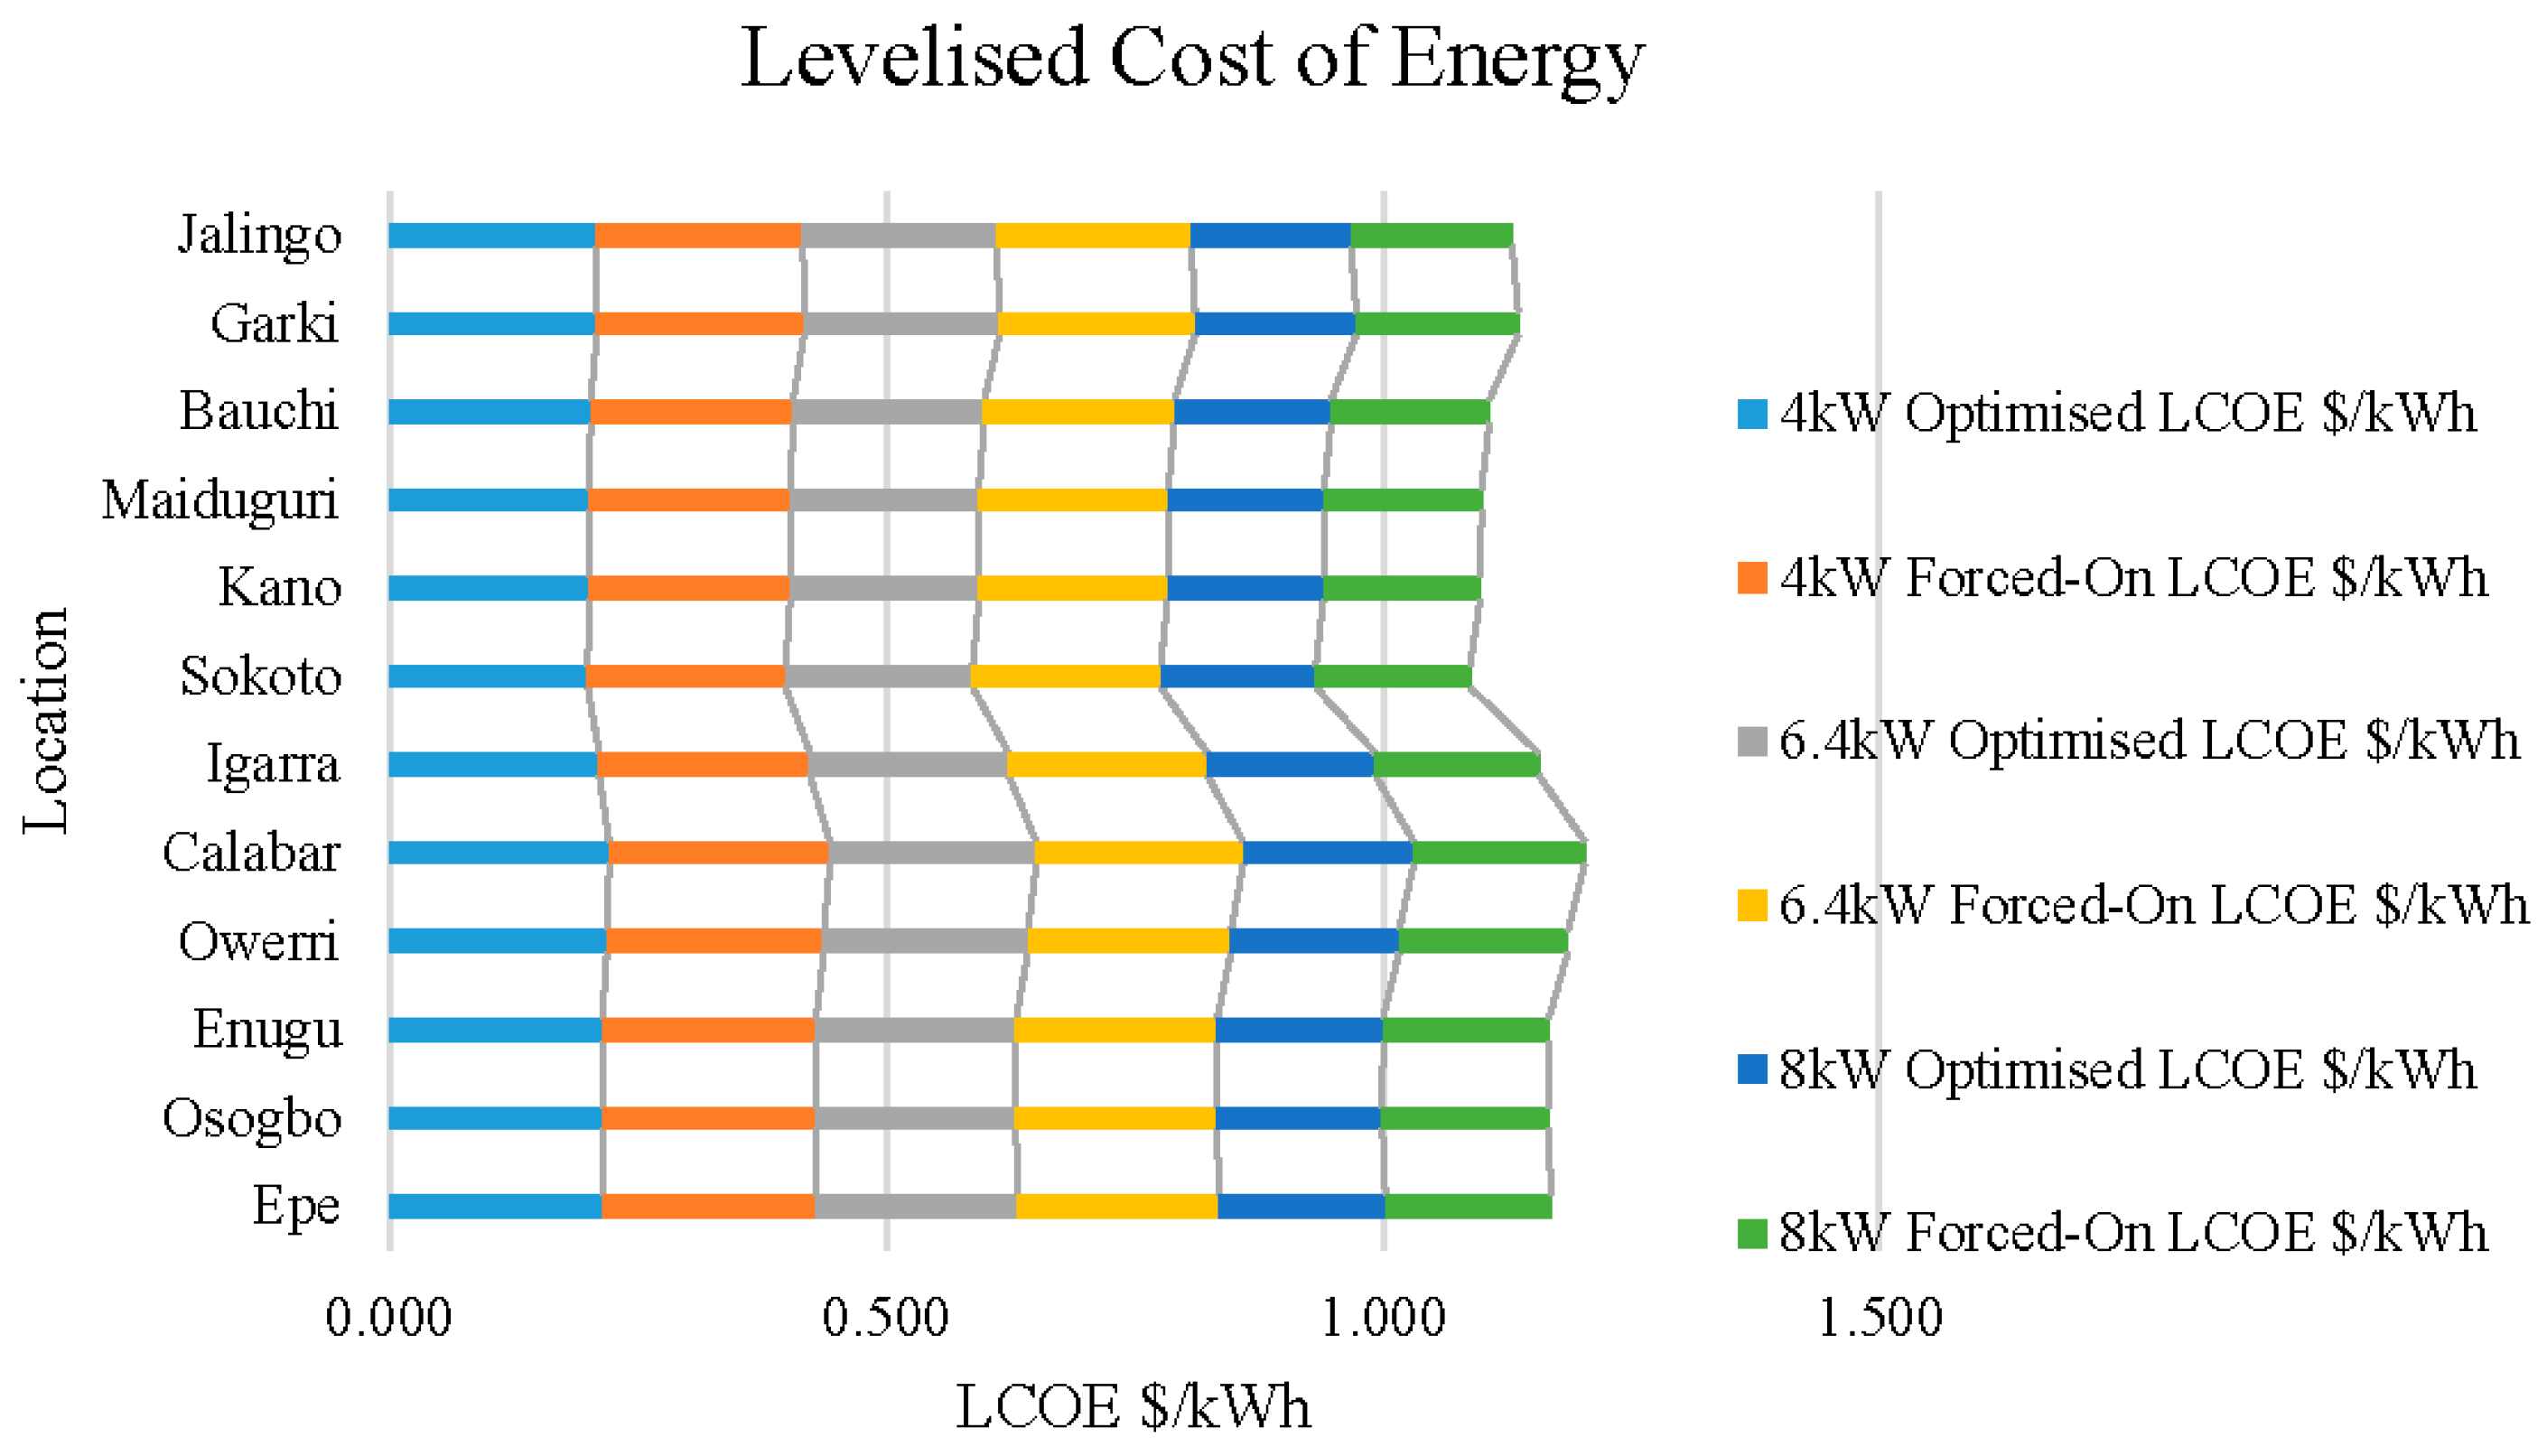
Figure 5 shows the comparisons between the load’s total LCOE for each location. The bar gives the overall systems with the highest and lowest LCOE when the different values are combined together. The sum of Sokoto’s LCOE is 1.088 kWh and the average LCOE is $0.181/kWh for the optimised and forced-on schedules. The solar radiation for Sokoto is the highest in comparison to all the sites locations in Nigeria from the study (see Figure 1). Calabar has the highest average LCOE of $0.201/kWh for the optimised and forced-on schedules, and has the lowest solar radiation, which is the reason for Calabar having the highest LCOE.
Table 5 shows the total energy generated for each site and the energy difference between the optimized and the forced-on schedule for the sites. As can be seen from the table, a total of 27,095 kWh to 28,471 kWh range is the annual energy contribution of the PV array and the diesel generator for the 4 kW optimised load system. The average energy of the optimised system and forced-on system is 27,265.8 kWh and 27,419 kWh respectively. The optimised 6 kW load annual energy generated by the PV array and diesel generator is 58,422 kWh to 58,631 kWh range. For the 8 kW optimised load system, the total energy generated is 78,707 kWh to 81,711 kWh range.
The difference in energy generated between the optimised system and the forced-on system shows that a higher energy is generated from the forced-on system. This implies that the optimised system performs better than the forced-on system because it requires less energy compared to the forced-on system. The OPEX on the forced-on system is higher so also is the carbon emission. It is worth noting that a deviation from the energy difference is shown in the Table 5 with negative values. The values indicates that the forced-on system have better performance than the optimised system in such instances. Though the optimised system performs well on average, there are areas where the forced-on system installation would be the best options for operators’ base transceiver stations based on the values in the Table 5. The ratio of the average energy difference and the corresponding loads of 4, 6.4 and 8 kW are 38.29, 46.34 and 38.32 per year, respectively. The 6.4 kW has a higher energy difference.
Figure 6 shows the energy generated by the optimised system and the forced-on system. In the forced-on system, the generator was simulated to run for 9 h: 10:00 p.m. to 7:00 a.m., the period when there is little or no solar radiation. From the design results, the PV and battery supply is between 7:00 h and 22:00 h while the radiation peak is between 12:00 h and 14:00 h. The figure compares the energy generated by the systems when they are on forced-on and optimised systems. From Figure 6, the average energy generated by the forced-on system are more than the optimised system for all the scenarios considered. The energy generated by the forced-on system is higher because of the higher generator run time. The fuel combustion produces higher energy than the PV system.
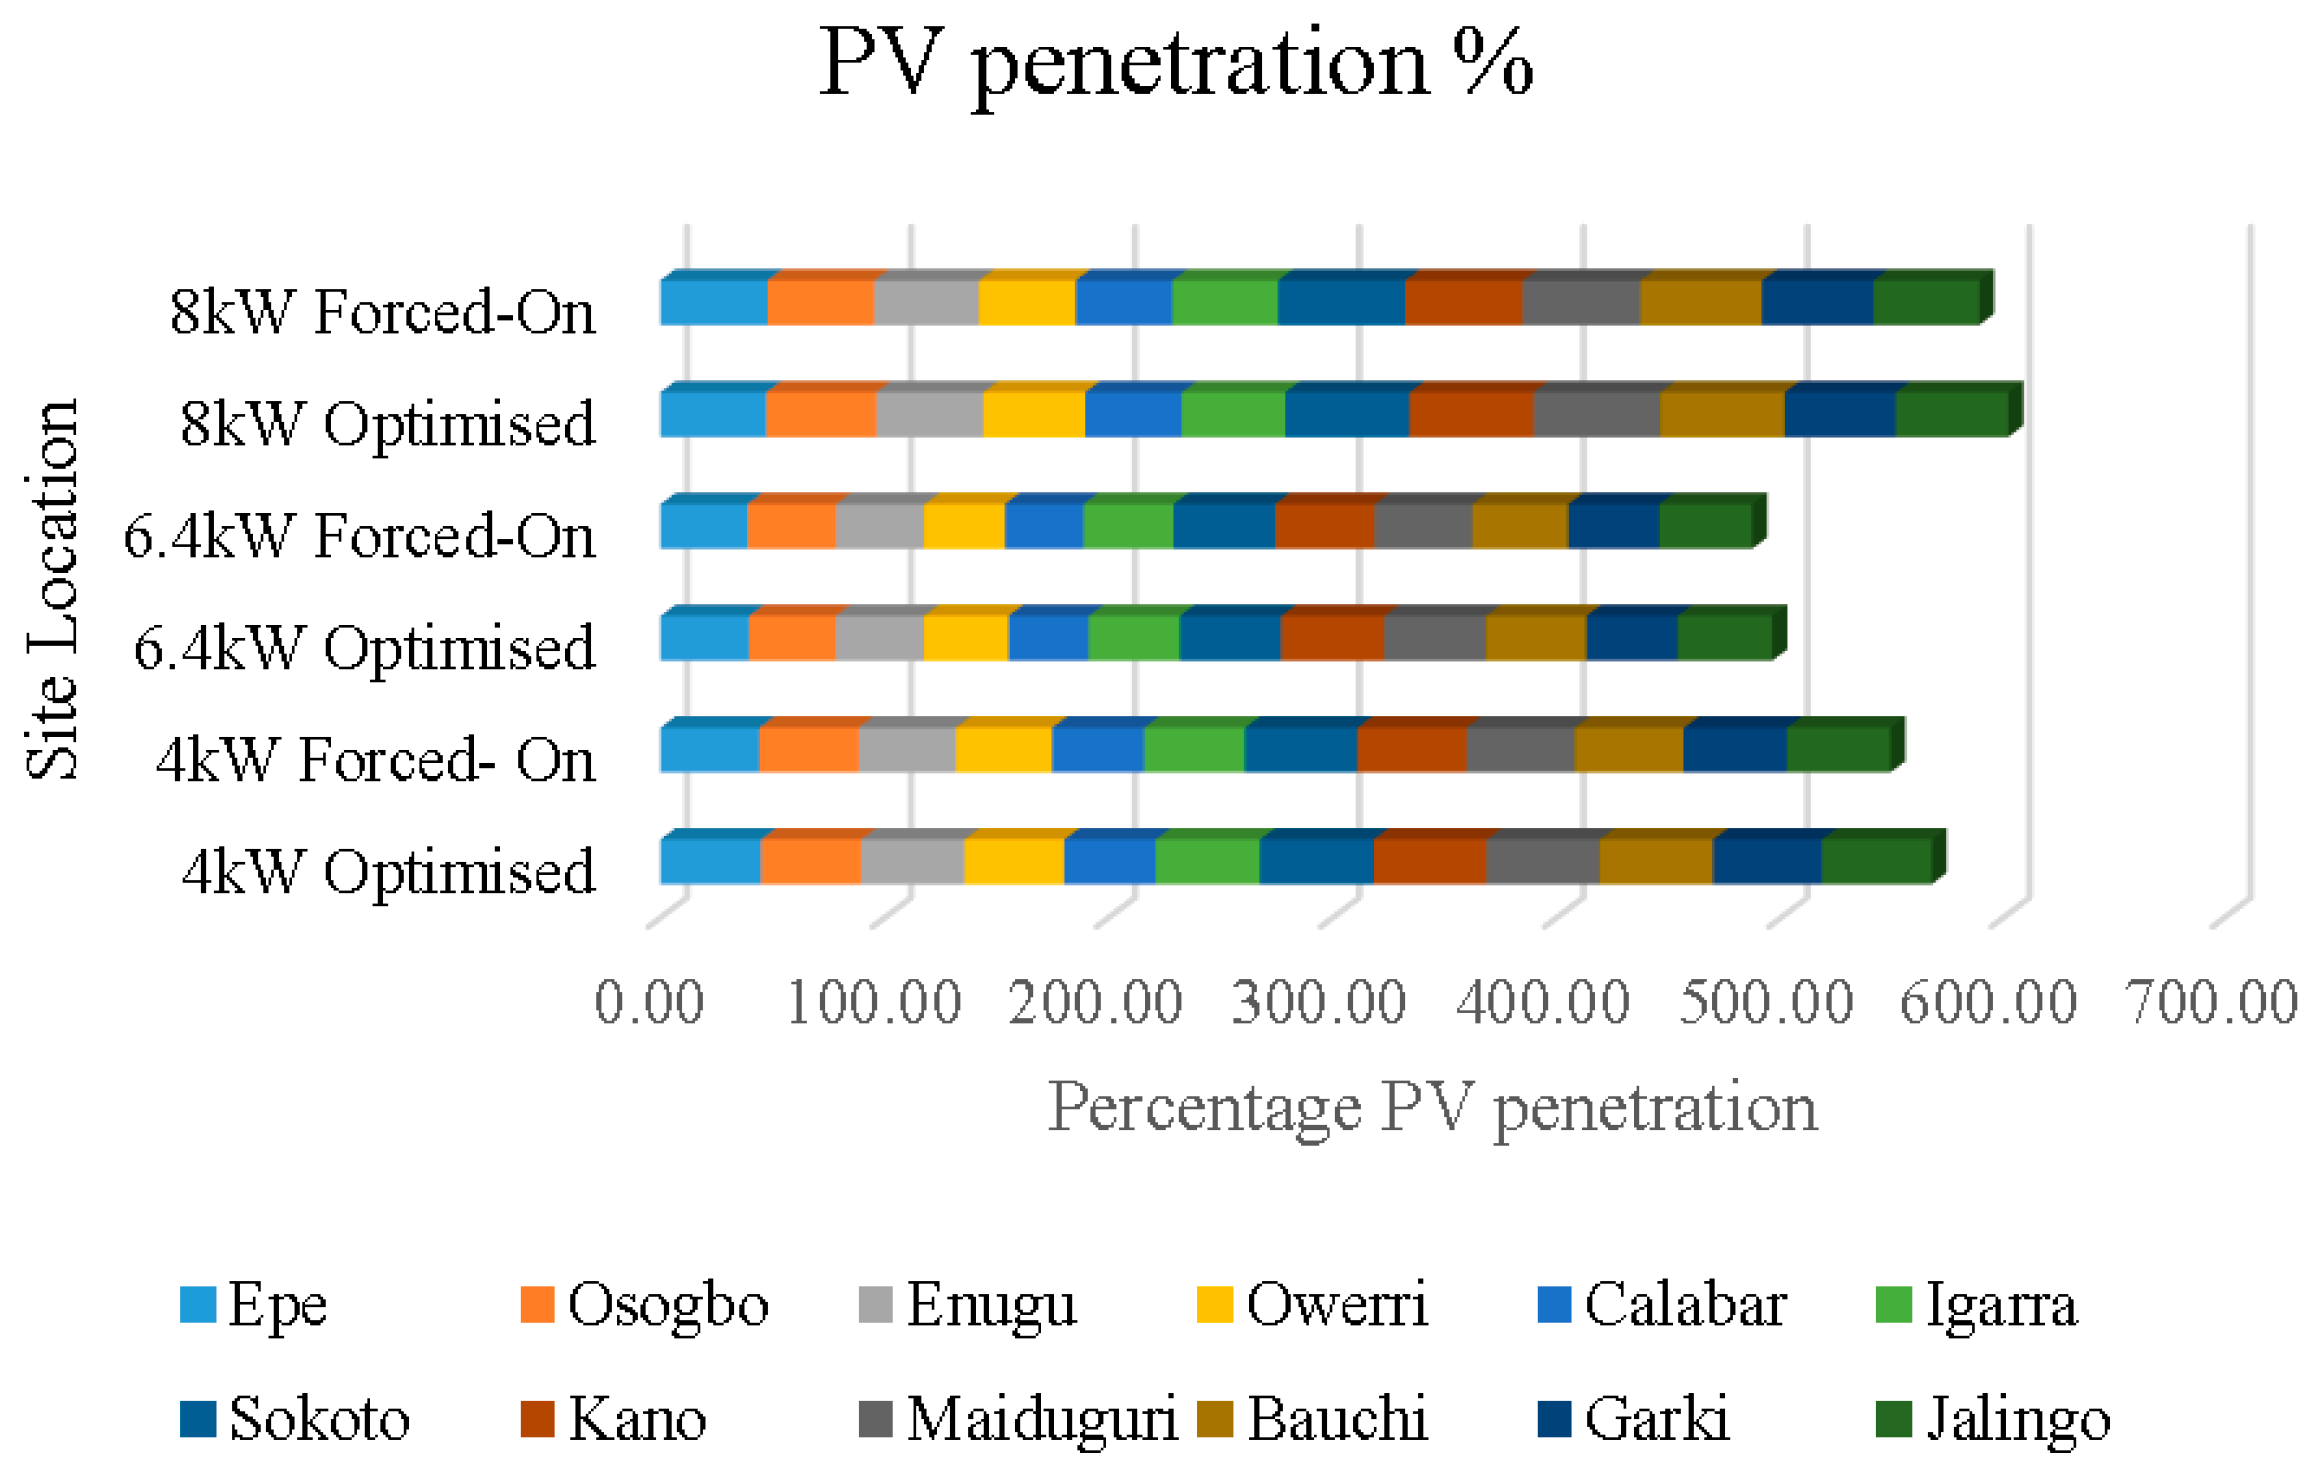
Table 6 summarizes the percentage energy contribution by the solar PV system and thus the generator. As can be deduced from Table 6, 52.80% to 68.10% of the energy was supplied by the diesel generators and the remaining 31.90% to 47.20% was supplied by the solar PV system. Excess energy for the system is different for the different loads and the percentage in comparison to the total load energy demand ranges from 0.03% to 14.98%. The 8 kW optimised schedule has the highest solar PV penetration range for all loads; 43.2% to 56.8%. From the penetration percentage results, it is evident that this has direct effect on the fuel consumption, hence fuel conservation and reduced carbon emission. Furthermore, the number of running hours of the generators decreased with an increase in solar energy penetration into the power system. The percentage of running time of the generators of the largest unit and load decreased compared to that of smaller units. Thus the larger generator units will require less maintenance hence longer life.
Solar photovoltaic (PV) penetration is defined as the ratio of total peak PV power to peak load apparent power. Figure 7 gives the aggregate percentage of the PV penetration. The 6.4 kW forced-on system has the lowest solar PV penetration on average 40.61% for all the loads schedule. The implication is a higher DG “ON and OFF’’ time for the 6.4 kW load because the energy required for the load has to be supplied to meet the load demands. This effect does not only affect the DG life cycle it also affects the OPEX. The 8 kW optimised system has the highest PV penetration of 50.20% for all the loads as seen in Table 7. This effect means reduced carbon emission and also the frequency of DG cyclic time. Care should also be taken because of the PV penetration. High penetrations of PV impacts circuit voltage in a number of ways. Voltage rise and voltage variations triggered by variations in solar PV generation are among the difficult impacts of high penetrations of PV. Real and reactive power from the PV system can impact the steady-state circuit voltage, and rise and fall of PV output can result in voltage fluctuations on the circuit. This, in turn, can impact power quality and voltage control device operation. Instances of high voltage can occur on the distribution circuit during low-load conditions. Voltages should stay within the permissible range; otherwise, they can reduce the lifetime of electrical equipment and cause DG (including PV inverters) to trip off-line.
Table 8 depicts the total fuel consumptions of each site per annum while Table 9 shows the difference of the fuel consumption between the forced-on and the optimized schedules at each site per year. It can be seen from the tables that in most instances, the optimized system consumes less fuel than the forced-on system which is expected because the optimsed system has lower generator run time. Exceptions to the above are: the optimised 4 kW load at Calabar, the system fuel consumption is 75 L per year higher than the forced-on system. This is because the system capacity could not provide the required energy. At Osogbo, the 6.4 kW load optimised system fuel consumption is 72 L per year higher than the forced-on system. At Kano both systems require the same fuel consumption at 6.4 kW load. At Igarra at 8 kW load, the optimised system requires 63 L of fuel more per year for the same load as can be seen from Table 8 and Table 9. For the optimised systems with higher fuel consumption than the forced-on systems; the battery capacity and PV system capacity should be increased to have optimum system performance. The number of running hours of the generators is decreased for the optimised system, which means less maintenance is required and hence longer life. Meanwhile, there is an increase for the forced-on system and hence higher OPEX.
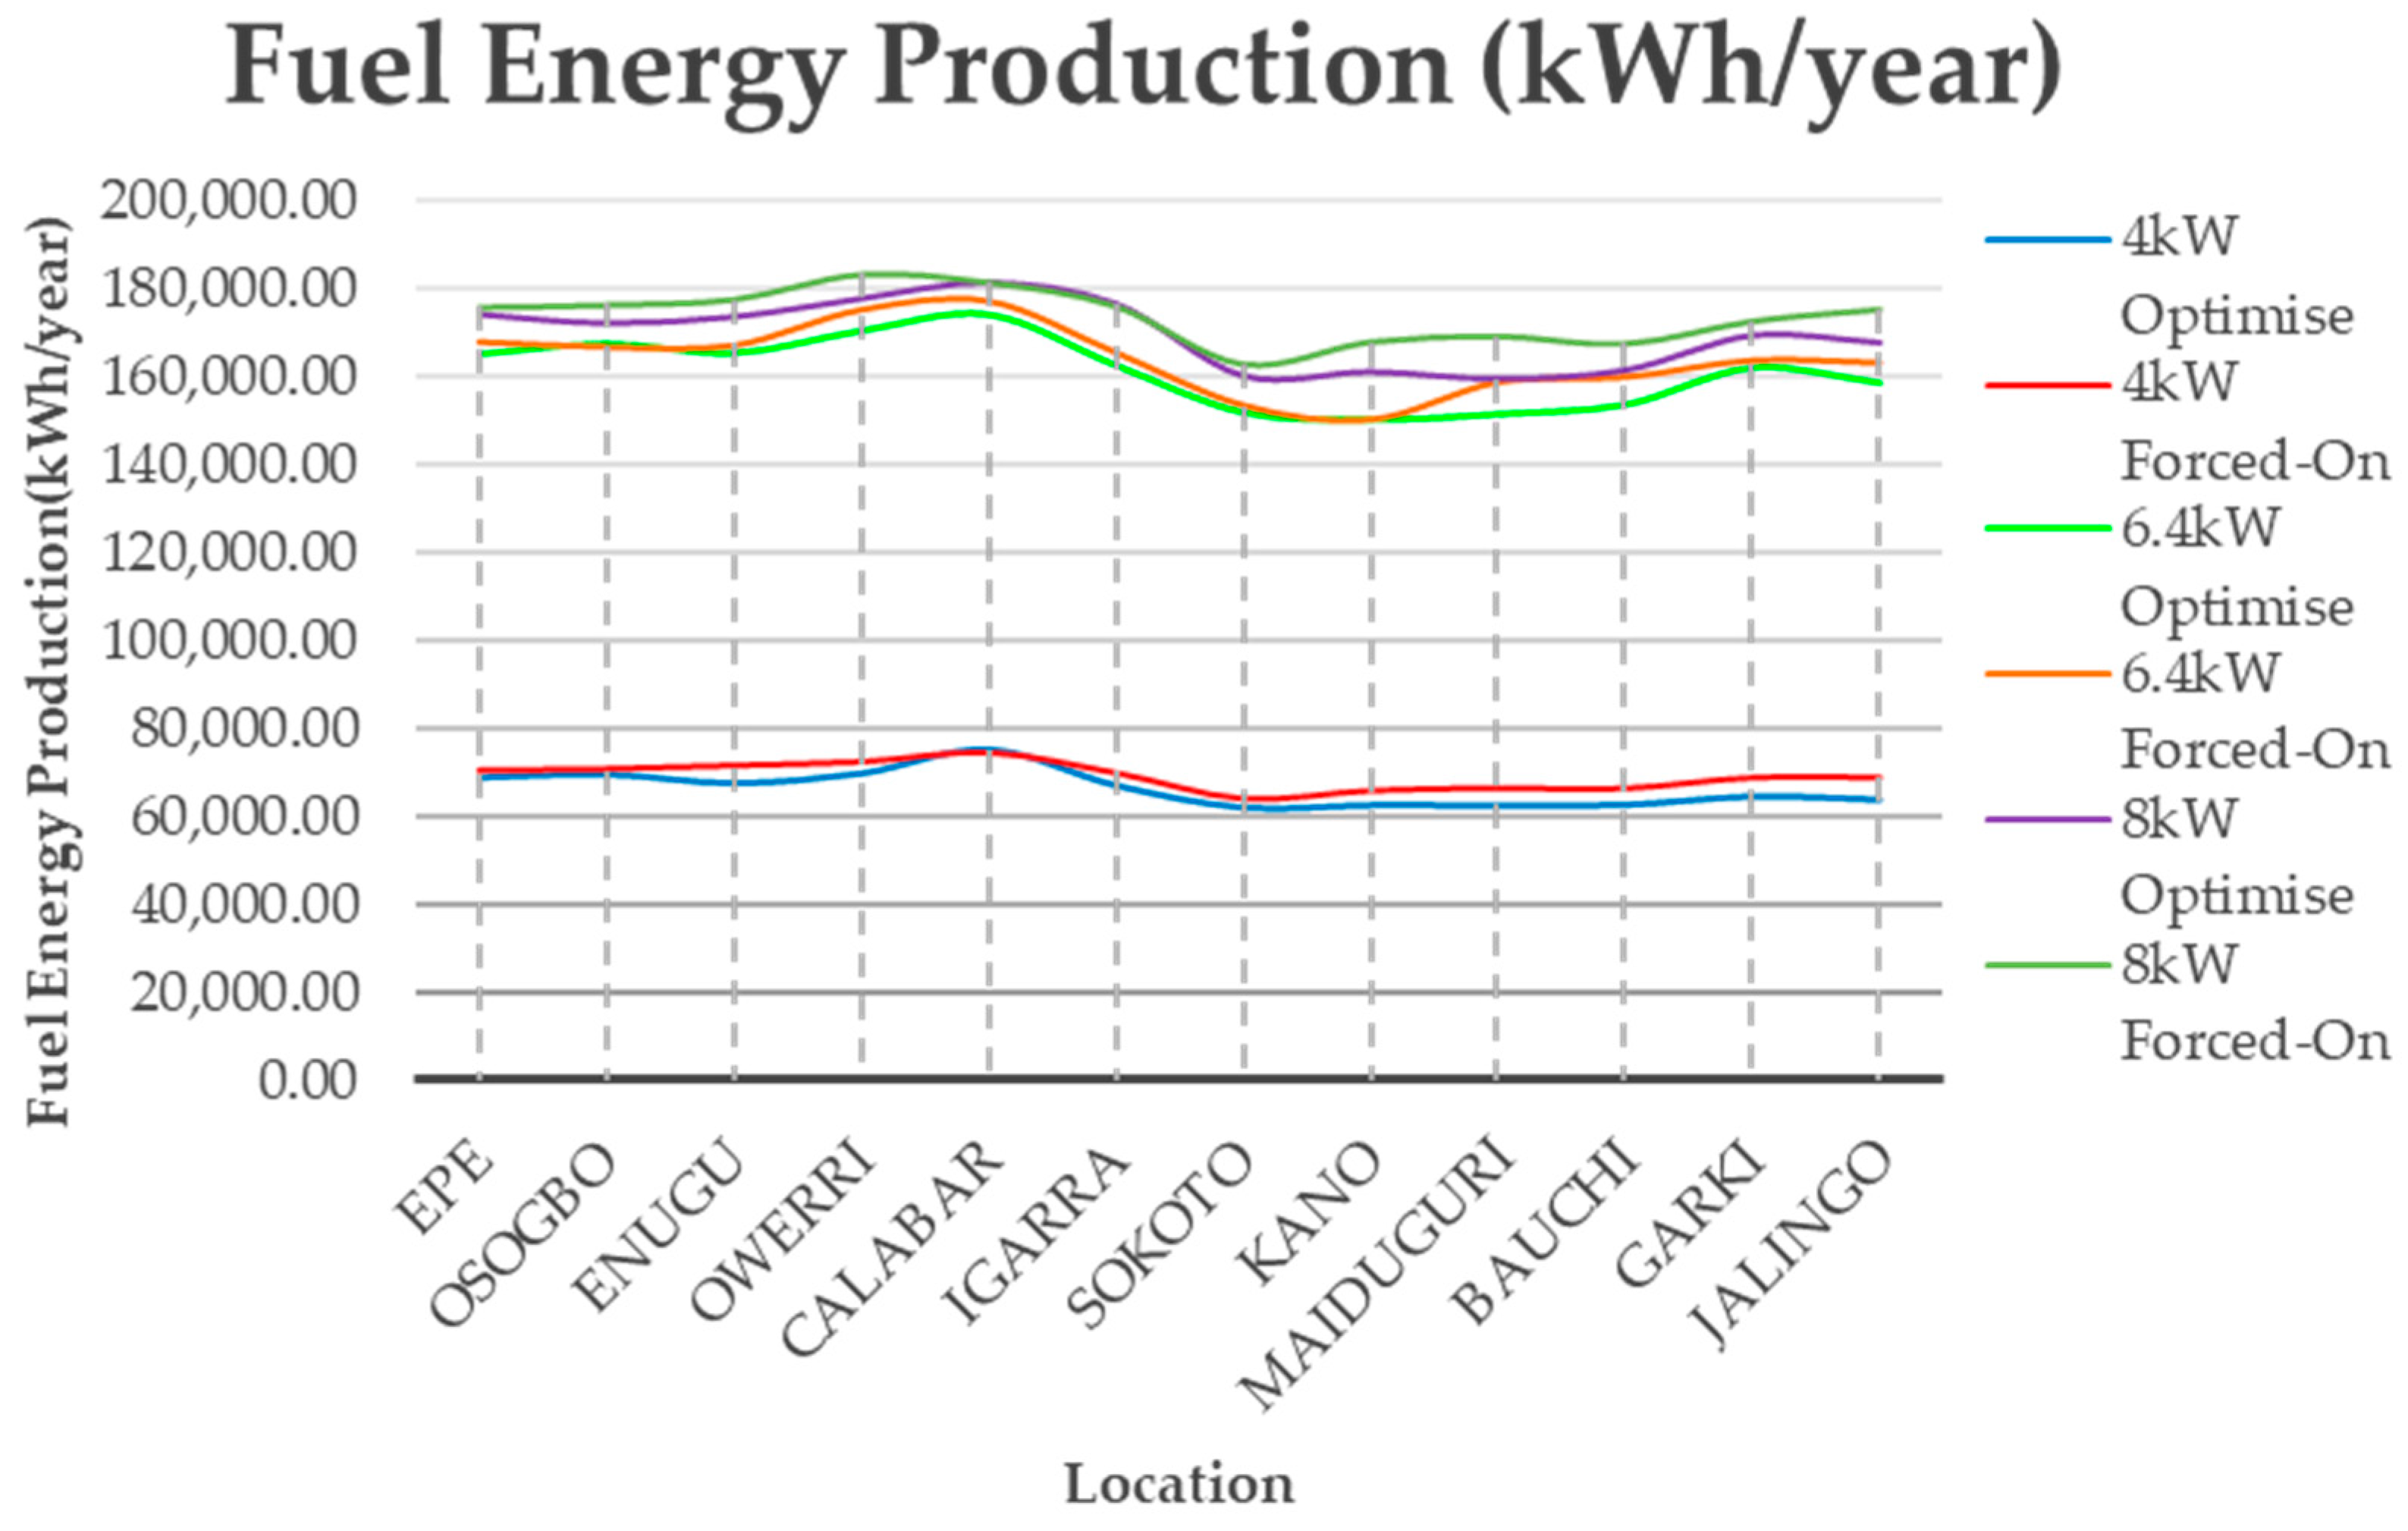
Figure 8 shows the fuel energy production for all the sites. The 4 kW loads have distinct lower fuel energy production because the fuel consumption is lower. The 8 kW forced-on system has the highest energy production because it consumes more diesel than other schedules. The range of the fuel energy production for the 8 kW load is 159,737 kWh/year to 183,433 kWh/year. The average value for the same load schedule is 174,010.3 kWh/year. Owerri has the highest energy production of 183,433 kWh/year while Maiduguri has the lowest, 159,737 kWh/year for the 8 kW load. The energy production is proportional to the generator capacity and fuel consumption. That is why there is a large energy production difference between the different energy scenarios. The 6.4 kW and 8 kW loads are close as seen from the graph in Figure 8. This is because the energy production from the fuel consumption of both loads schedule are close. The average fuel energy production for both load schedules are 162,819.79 kWh/year and 171,924.08 kWh/year respectively. The average difference in the fuel energy production is 9104.29 kWh/year for the 6.4 kW and 8 kW load schedules.
Table 10 shows the fuel consumption and LCOEs simulated result for sites on generators only. The configurations are without any renewable sources; they run essentially on diesel generators. These values are used to compute the percentage savings on fuel for all the locations in the simulated values. Because these sites run basically on diesel fuel, the energy cost, as well as the OPEX, is higher. The carbon emissions and environmental concerns for these sites are also higher. The OPEX for these sites are among the major reasons why operators and vendors have devised ways of mitigating these effects through the use of hybrid systems. The LCOEs are 0.340 $/kWh, 0.234 $/kWh, 0.195 $/kWh for the 4 kW, 6.4 kW and 8 kW loads respectively.
Table 11 shows the percentage savings on fuel consumption. It can be seen from Table 11 that the fuel consumption savings range from 24.76% to 42.24%. With the hybrid system, not only are there higher savings on fuel, but there are also implied savings on maintenance and lower carbon emissions. Table 12 shows the average savings on fuel as well as equivalent costs. The percentage savings on fuel is the difference between the fuel consumption when running on generator only and the fuel consumption when it is a hybrid system, divided by the fuel consumption when running on generator only and then multiplied by 100:
Table 12 is the summary of the average savings. The 8 kW optimised system has the highest average percentage savings of 38.269% and cost savings of $5992.047. The optimised system has averagely better percentage savings than the forced-on system. Table 12 also depicts the costs that could be saved by operators on average for each of the load schedules. With the optimised systems higher costs is saved on fuel, the OPEX and carbon emissions. The energy economics comparisons favours the optimised systems for all the different load schedules.
From the date the percentage energy savings is dependent on the location, solar insolation, the sequence control of the generator and load setting. A variation in any of these variables would affect the energy produced hence the OPEX and carbon emissions.
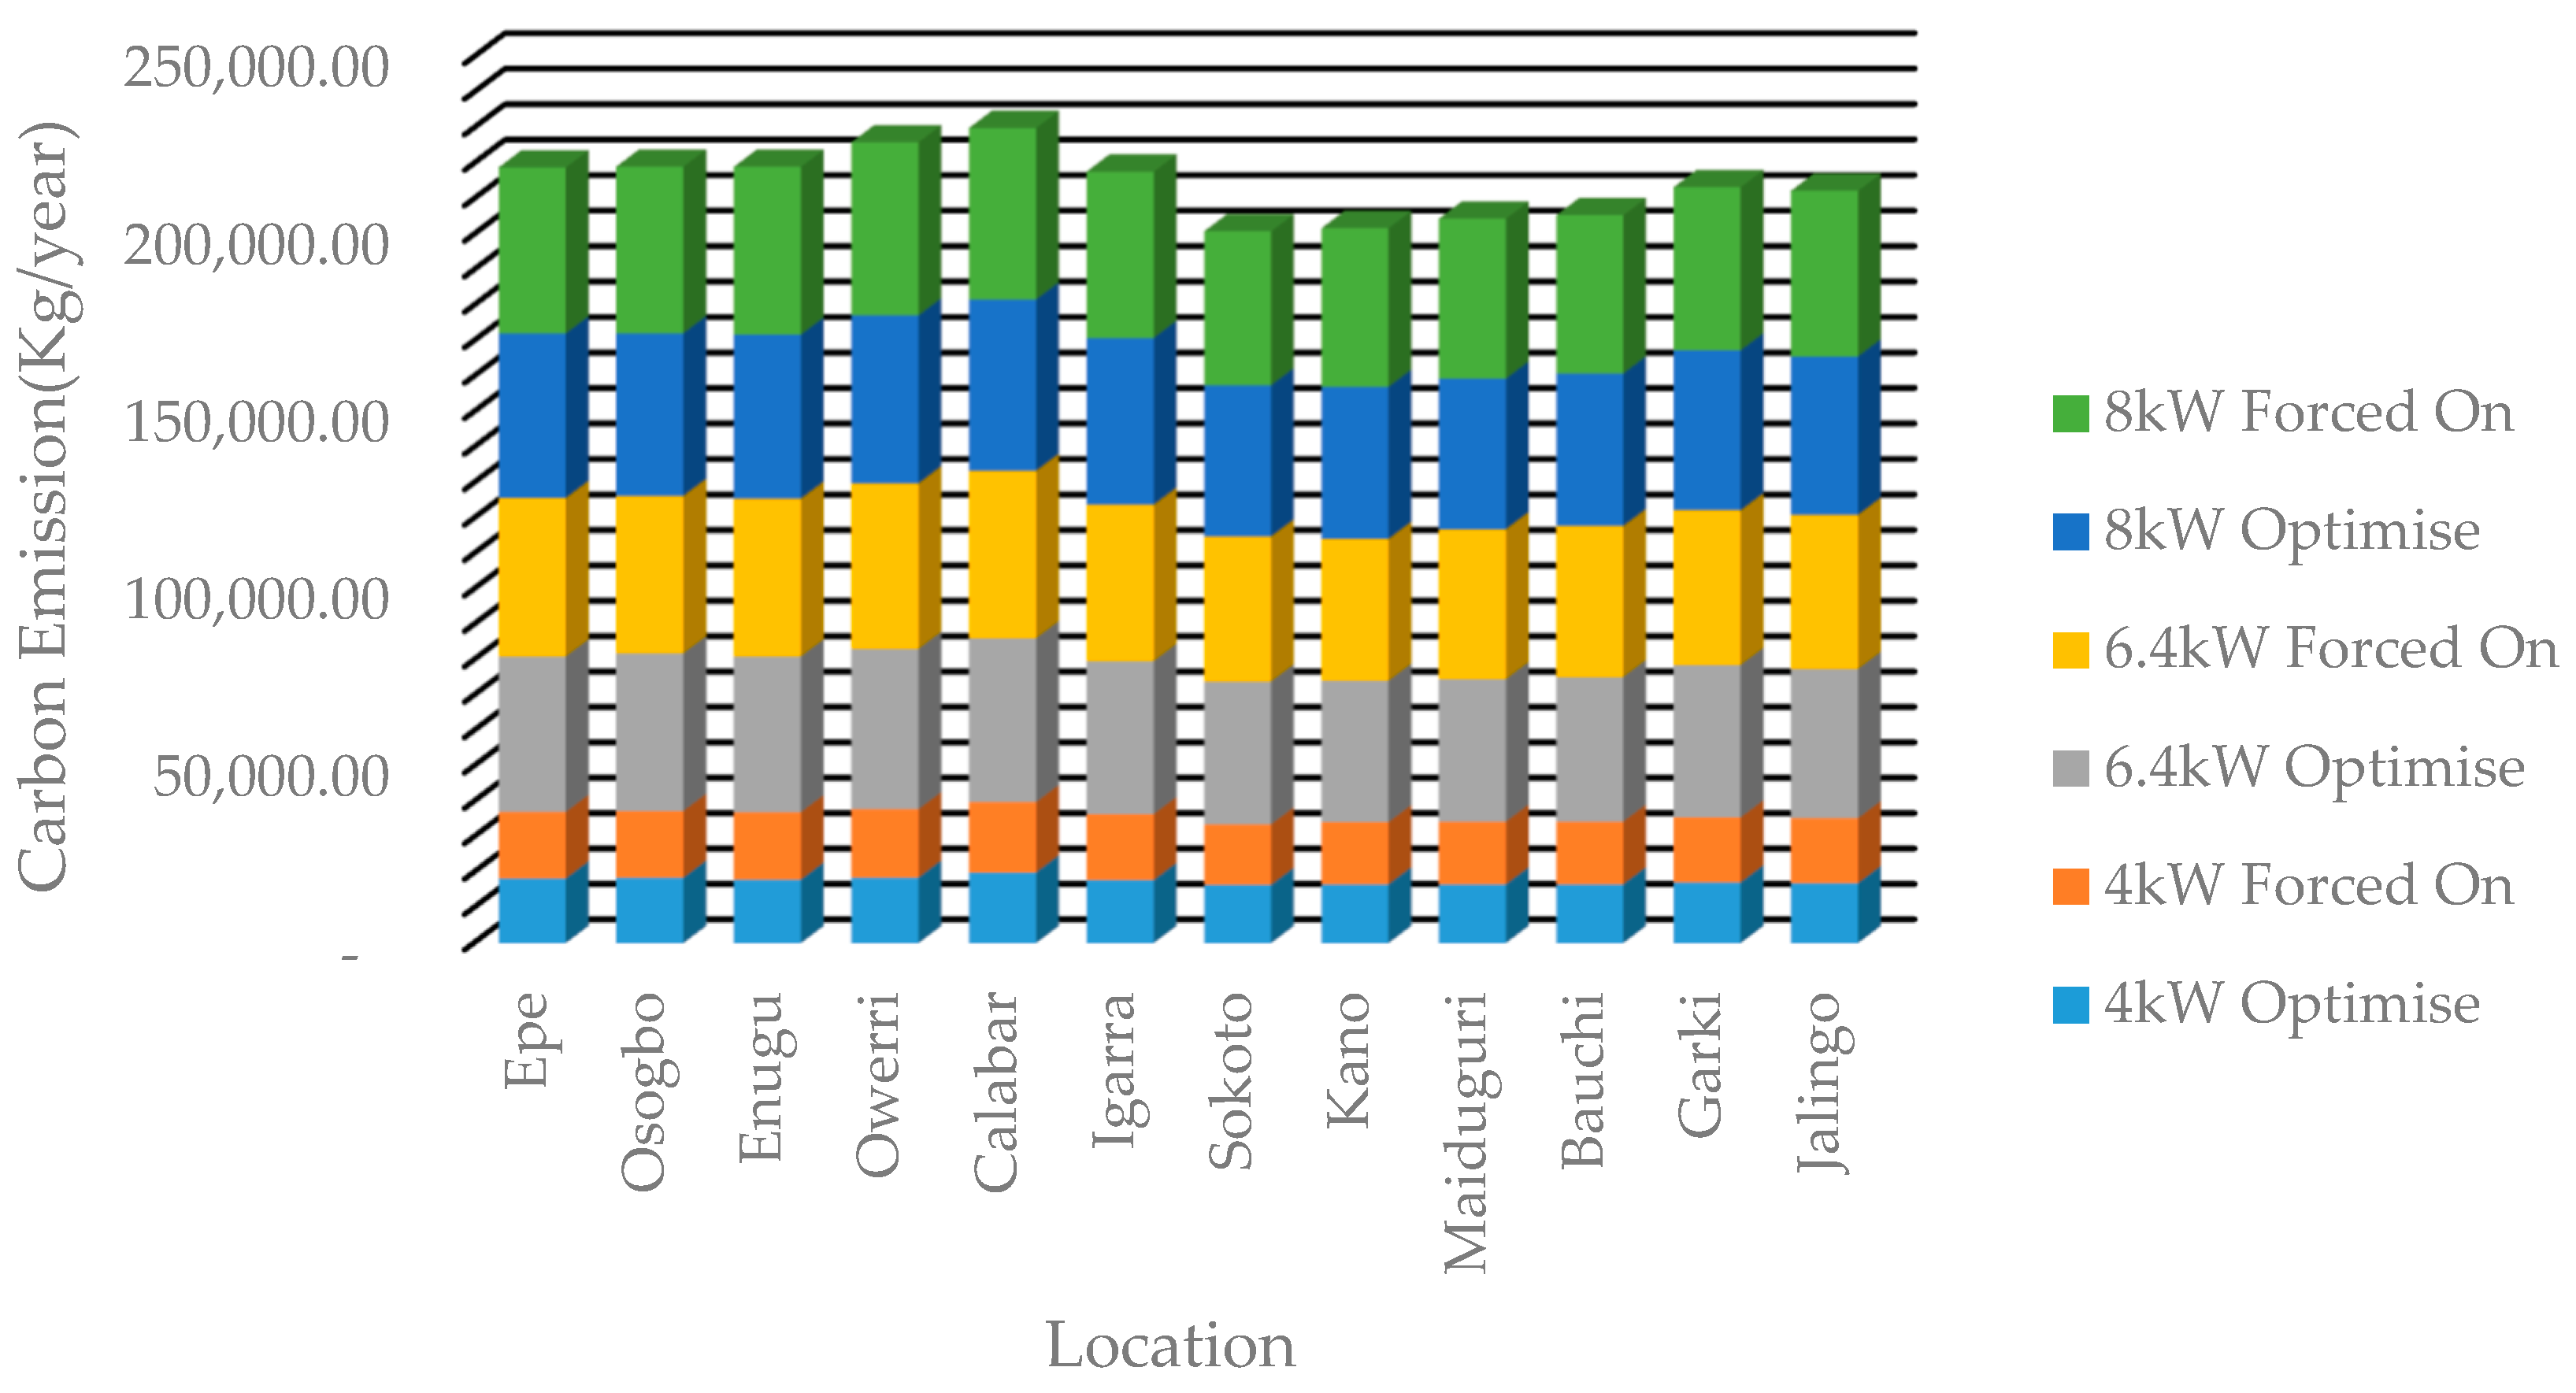
Figure 9 shows the stacked carbon emissions for each of the site location. Calabar, with the highest generator run time, has the highest carbon emission in total for the simulated values. Sokoto, which has the lowest generator run time, also has the lowest carbon emission. To have a good reduction in carbon emission while meeting load demands, the PV capacity has to be increased; this, however, has economic implications. The total amount of annual CO2 emissions that can be eliminated is between 11,314.96 kg to 14,370.14 kg, 22,611.2 kg to 29,959.72 kg and 25,460 kg to 31,428.36 kg for the 4 kW, 6.4 kW and 8 kW loads respectively (annual diesel consumption of saved multiplied by 2.68 kg CO2/L).
5. Conclusions and Recommendations
This study examined the use of different solar hybrid system schedules in comparison to diesel generator schedules in powering some base transceiver stations in different locations in Nigeria. With a load range of 4 kW to 8 kW, the schedules examined are: (i) optimised generator schedule; (ii) forced-on generator schedule and (iii) the generator-only schedule.
The results showed that the solar PV hybrid system OPEX fuel savings range of 41.68% to 47% for the loads considered. The percentage of energy contribution by generator is in the range of 52.80% to 60.90% and 39.10% to 47.20% for the solar PV system. The solar PV penetration range is 40.90% to 56.80%. The penetration percentage result is proportional to the fuel consumption, hence there is fuel conservation and reduced carbon emissions. The running hours of the generators decreased with an increase in solar energy so is the percentage of running time of the generators of the largest unit and load compared to that of smaller units. Solar Hybrid PV systems are most cost competitive in Nigeria for the higher load on a lifetime basis among the load scenario with LCOE range between averages of USD 0.156/kWh to 0.172/kWh. Though the LCOE for both the optimised system and the forced-on are within the same range, the forced-on has higher fuel consumption. For better energy economics and environmental concerns, the optimised hybrid system proves a better system than both the forced-on and the generator only site. Nevertheless there are a few instances where the forced-on system is better for certain locations. It is recommended that policies should be put in place by the government to make operators and vendor incorporate renewable energy in their energy solutions, especially for areas with low loads that can be effectively and efficiently sustained by renewable energy sources. With that, there would be diversification and good energy mix in the telecommunication sector. Furthermore, operators and vendors should also study the type of hybrid system that will be best for a particular location before deploying the system to site.
Acknowledgments
We thank University of Johannesburg for the GES scholarship and financial support from NRF Grant No. 110774 (South Africa-China Bilateral Collaborative Research Program). Both authors would also like to acknowledge the proofreading from Annie Jen.
Author Contributions
Peter Ozaveshe Oviroh did the data collection and result analysis. Tien-Chien Jen, the supervisor of Peter Ozaveshe Oviroh, guided the research and revised the paper several times before final submission.
Conflicts of Interest
The authors declare there is no conflict of interest.
References
- Groupe Speciale Mobile Association (GSMA). The Mobile Economy West Africa 2017; Groupe Speciale Mobile Association: London, UK, 2017. [Google Scholar]
- Groupe Speciale Mobile Association (GSMA). The Global Telecom Tower Esco Market Overview of the Global Market for Energy to Telecom Towers in Off-Grid and Bad-Grid Areas; Groupe Speciale Mobile Association: London, UK, 2014. [Google Scholar]
- SMA Intelligence Data. Available online: https://www.gsmaintelligence.com/markets/2481/dashboard/# (accessed on 20 September 2017).
- Nigerian Communications Commission (NCC). Subscriber/Teledensity Data. Available online: http://www.ncc.gov.ng/stakeholder/statistics-reports/industry-overview#view-graphs-tables (accessed on 21 September 2017).
- Alsharif, M.H. Comparative Analysis of Solar-Powered Base Stations for Green Mobile Networks. Energies 2017, 10, 1208. [Google Scholar] [CrossRef]
- Ahmed, F.; Naeem, M.; Ejaz, W.; Iqbal, M.; Anpalagan, A.; Kim, H. Renewable Energy Assisted Traffic Aware Cellular Base Station Energy Cooperation. Energies 2018, 11, 99. [Google Scholar] [CrossRef]
- Mancuso, S.A.V. Reducing costs and pollution in cellular networks. IEEE Commun. Mag. 2011, 49. [Google Scholar] [CrossRef]
- Wu, J.; Zhang, Y.; Zukerman, M.; Yung, E.K.N. Energy-Efficient Base-Stations Sleep-Mode Techniques in Green Cellular Networks: A Survey. IEEE Commun. Surv. Tutor. 2015, 17, 803–826. [Google Scholar] [CrossRef]
- Feng, D.; Jiang, C.; Lim, G.; Cimini, L.J.; Feng, G.; Li, G.Y. A survey of energy-efficient wireless communications. IEEE Commun. Surv. Tutor. 2013, 15, 167–178. [Google Scholar] [CrossRef]
- Alsharif, M.H. Techno-Economic Evaluation of a Stand-Alone Power System Based on Solar Power/Batteries for Global System for Mobile Communications Base Stations. Energies 2017, 10, 392. [Google Scholar] [CrossRef]
- Taverner, D. Green Power for Mobile Community Power. Available online: http://www.gsma.com/mobilefordevelopment/wp-content/uploads/2012/05/Community-Power-Using-Mobile-to-Extend-the-Grid-January-2010.pdf (accessed on 24 April 2017).
- Anayochukwu, A.V.; Nnene, E.A. Simulation and optimization of hybrid diesel power generation system for GSM base station site in Nigeria. Electron. J. Energy Environ. 2013, 1, 37–56. [Google Scholar] [CrossRef]
- Olatomiwa, L.J.; Mekhilef, S.; Huda, A.S.N. Optimal Sizing of Hybrid Energy System for a Remote Telecom Tower: A Case Study in Nigeria. In Proceedings of the 2014 IEEE Conference on Energy Conversion (CENCON), Johor Bahru, Malaysia, 13–14 October 2014. [Google Scholar]
- Roche, M.Y. True Cost of Electrcity-Comparison of Costs of Electricity Generation in Nigeria; Nigerian Economic Summit Group: Lagos, Nigeria; Heinrich Böll Stiftung Nigeria: Abuja, Nigeria, 2017. [Google Scholar]
- Khan, M.J.; Iqbal, M.T. Pre-feasibility study of stand-alone hybrid energy systems for applications in Newfoundland. Renew. Energy 2004, 30, 835–854. [Google Scholar] [CrossRef]
- Cristóbal-Monreal, I.R.; Dufo-López, R. Optimisation of photovoltaic–diesel–battery stand-alone systems minimising system weight. Energy Convers. Manag. 2016, 119, 279–288. [Google Scholar] [CrossRef]
- Dufo-López, R.; Cristóbal-Monreal, I.R.; Yusta, J.M. Optimisation of PV-wind-diesel-battery stand-alone systems to minimise cost and maximise human development index and job creation. Renew. Energy 2016, 94, 280–293. [Google Scholar] [CrossRef]
- Ogunjuyigbe, A.S.O.; Ayodele, T.R.; Akinola, O.A. Optimal allocation and sizing of PV/Wind/Split-diesel/Battery hybrid energy system for minimizing life cycle cost, carbon emission and dump energy of remote residential building. Appl. Energy 2016, 171, 153–171. [Google Scholar] [CrossRef]
- Ahadi, A.; Kang, S.-K.; Lee, J.-H. A novel approach for optimal combinations of wind, PV, and energy storage system in diesel-free isolated communities. Appl. Energy 2016, 170, 101–115. [Google Scholar] [CrossRef]
- Maatallah, T.; Ghodhbane, N.; Nasrallah, S.B. Assessment viability for hybrid energy system (PV/wind/diesel) with storage in the northernmost city in Africa, Bizerte, Tunisia. Renew. Sustain. Energy Rev. 2016, 59, 1639–1652. [Google Scholar] [CrossRef]
- Li, J.; Wei, W.; Xiang, J. A Simple Sizing Algorithm for Stand-Alone PV/Wind/Battery Hybrid Microgrids. Energies 2012, 5, 5307. [Google Scholar] [CrossRef]
- Katz, D.; Haaren, R.V.; Fthenakis, V. Applications and economics of combined PV and battery systems for commercial & industrial peak shifting. In Proceedings of the 2015 IEEE 42nd Photovoltaic Specialist Conference (PVSC), New Orleans, LA, USA, 14–19 June 2015; pp. 1–6. [Google Scholar]
- Goel, S.; Ali, S.M. Cost Analysis of Solar/Wind/Diesel Hybrid Energy Systems for Telecom Tower by Using HOMER. Int. J. Renew. Energy Res. 2014, 4, 305–311. [Google Scholar]
- Saviva Research. Saviva Research Review Hybrid Energy Systems for Telecom Towers; Saviva Research: New York, NY, USA, 2013. [Google Scholar]
- Alsharif, M.H.; Nordin, R.; Ismail, M. Energy optimisation of hybrid off-grid system for remote telecommunication base station deployment in Malaysia. EURASIP J. Wirel. Commun. Netw. 2015. [Google Scholar] [CrossRef]
- Alsharif, M.H. A Solar Energy Solution for Sustainable Third Generation Mobile Networks. Energies 2017, 10, 429. [Google Scholar] [CrossRef]
- Moradi, H.; Esfahanian, M.; Abtahi, A.; Zilouchian, A. Modeling a Hybrid Microgrid Using Probabilistic Reconfiguration under System Uncertainties. Energies 2017, 10, 1430. [Google Scholar] [CrossRef]
- Erdinc, O.; Uzunoglu, M. Optimum design of hybrid renewable energy systems: Overview of different approaches. Renew. Sustain. Energy Rev. 2012, 16, 1412–1425. [Google Scholar] [CrossRef]
- Huawei. Huawei Diesel Hybrid Power Solution; Huawei: Shenzhen, China, 2017. [Google Scholar]
- Flexenclosure. Hybrid Power for Telecom Sites. Available online: http://www.flexenclosure.com/?wpfb_dl=305/ (accessed on 21 June 2017).
- Oviroh, P.O.; Jen, T.-C.; Idusuyi, N.; Gbadeyan, O. Comparative Energy Cost Analysis of Hybrid System and Diesel Generator in Powering Selected Base Transceiver Stations in Nigeria. In Proceedings of the ASME 2017 International Mechanical Engineering Congress and Exposition, Tampa, FL, USA, 3–9 November 2017. [Google Scholar]
- Khan, M.J.; Yadav, A.K.; Mathew, L. Techno economic feasibility analysis of different combinations of PV-Wind-Diesel-Battery hybrid system for telecommunication applications in different cities of Punjab, India. Renew. Sustain. Energy Rev. 2017, 76, 577–607. [Google Scholar] [CrossRef]
- Huawei, D.G. Battery Hybrid System. Available online: http://www.huawei.com/za/products/energy-infrastructure/hybrid_system/ (accessed on 22 June 2017).
- Adaramola, M.S.; Paul, S.S.; Oyewola, O.M. Assessment of decentralized hybrid PV solar-diesel power system for applications in Northern part of Nigeria. Energy Sustain. Dev. 2014, 19, 72–82. [Google Scholar] [CrossRef]
- Ajlan, A.; Tan, C.W.; Abdilahi, A.M. Assessment of environmental and economic perspectives for renewable-based hybrid power system in Yemen. Renew. Sustain. Energy Rev. 2017, 75, 559–570. [Google Scholar] [CrossRef]
- Gross, I. Mitigating ICTRelated Carbon Emissions: Using Renewable Energy to Power Base Stations in Africa’s Mobile Telecommunications Sector; Centre for Development Informatics (CDI) University of Manchester: Manchester, UK, 2012. [Google Scholar]
- Shaahid, S.M.; El-Amin, I. Techno-economic evaluation of off-grid hybrid photovoltaic–diesel–battery power systems for rural electrification in Saudi Arabia—A way forward for sustainable development. Renew. Sustain. Energy Rev. 2009, 13, 625–633. [Google Scholar] [CrossRef]
- Ani, V.A. Design of a Reliable Hybrid (PV/Diesel) Power System with Energy Storage in Batteries for Remote Residential Home. J. Energy 2016, 2016, 6278138. [Google Scholar] [CrossRef]
- HOMER Energy. HOMER® Pro Version 3.7-User Manual; HOMER Energy: Boulder, CO, USA, 2016. [Google Scholar]
- Alsharif, M.; Kim, J. Hybrid Off-Grid SPV/WTG Power System for Remote Cellular Base Stations towards Green and Sustainable Cellular Networks in South Korea. Energies 2017, 10, 9. [Google Scholar] [CrossRef]
- National Aeronautics and Space Administration (NASA). NASA Prediction of Worldwide Energy Resource (POWER). Available online: https://power.larc.nasa.gov/cgi-bin/cgiwrap/solar/timeseries.cgi (accessed on 3 September 2017).
- Kalogirou, S.A. Solar Energy Engineering: Processes and Systems; Academic Press: New York, NY, USA, 2013. [Google Scholar]
- Duffie, J.A.; Beckman, W.A. Solar Engineering of Thermal Processes; John Wiley & Sons: New York, NY, USA, 1980. [Google Scholar]
- International Energy Agency (IEA). World Energy Outlook 2016; International Energy Agency (IEA): Paris, France, 2016.
- Chang, W.-Y. The State of Charge Estimating Methods for Battery: A Review. ISRN Appl. Math. 2013, 2013, 953792. [Google Scholar] [CrossRef]
- LAZARD. Lazard’s Levelized Cost of Energy Analysis 10.0; LAZARD: New York, NY, USA, 2016. [Google Scholar]
Figure 1.
Yearly solar resource.

Figure 2.
Schematic diagram of a solar hybrid system.

Figure 3.
Schematic diagram of the simulated system.

Figure 4.
The cost of off-grid electricity generation, based on lcoe: Adapted [14].
Figure 4.
The cost of off-grid electricity generation, based on lcoe: Adapted [14].

Figure 5.
Levelised cost of energy ($/kWh).

Figure 6.
Energy generated comparison of optimised and forced-on (kWh/year).

Figure 7.
PV penetration (%).

Figure 8.
Fuel energy production (kWh/year).

Figure 9.
Total carbon emission for the location (kg/year).


Table 1.
Outdoor configuration for base stations.
| Configuration | Power (kW) | Current (A) | Voltage (Vdc) |
|---|---|---|---|
| 222/444 + Microwave + Lighting | 3.2 | 67 | 48 |
| 222/444 + 3G + 4G + Microwave + Lighting | 4.0 | 83 | 48 |
| 222/666 + 3G + 4G + Microwave + Lighting | 5.4 | 112.5 | 48 |
| 444/666 + 3G + 4G + Microwave + Lighting | 6.4 | 133 | 48 |
Table 2.
Indoor configuration for base stations.
| Configuration | Power (kW) | Current (A) | Voltage (Vdc) |
|---|---|---|---|
| 222/444 + Microwave + DC air conditioner + Lighting | 4.8 | 100 | 48 |
| 222/444 + 3G + 4G + Microwave + DC air conditioner + Lighting | 6 | 125 | 48 |
| 222/666 + 3G + 4G + Microwave + DC air conditioner + Lighting | 7 | 146 | 48 |
| 444/666 + 3G + 4G + Microwave + DC air conditioner + Lighting | 8 | 167 | 48 |
Table 3.
PV off-grid rooftop (Residential, C&I)—few kW to few MW storage included source [14,44,46].
| Parameters | Unit | IEA WEO 2016 [28] | Lazard 2016 [30] | NG PV off Gird IPP [10] | REEEP/NESP 2016 [14] | Hybrid PV-Diesel [14] |
|---|---|---|---|---|---|---|
| Currency and year | - | 2015 USD | not stated | 2016 USD | NAIRA (=315 USD) | not stated |
| Installed Capacity | MW | not stated | 1.000 | 0.010 | 0.022 | not stated |
| Capital Cost | $/kW | 2840 | 2400 | 3260 | 2882 | 2000 |
| Technical Lifetime | year | 20 | 20 | 20 | 20 | 30 |
| Capacity Factor | % | 17% | 20% | 23% | 16% | 20% |
| Fixed O&M | $/kWh/year | 28 | 18 | 50 | 0 | 50 |
| LCOE (11% WACC) | $/kWh | 0.258 | 0.182 | 0.223 | 0.260 | 0.256 |
| World Bank 2013 LCOE | $/kWh | 0.310 | ||||
Table 4.
Lcoe ($/kWh) for the different loads.
| Location | Latitude (N) | Longitude (E) | 4 kW Optimised LCOE $/kWh | 4 kW Forced-on LCOE $/kWh | 6.4 kW Optimised LCOE $/kWh | 6.4 kW Forced-on LCOE $/kWh | 8 kW Optimised LCOE $/kWh | 8 kW Forced-on LCOE $/kWh |
|---|---|---|---|---|---|---|---|---|
| Epe | 6.58694 | 3.98361 | 0.215 | 0.215 | 0.203 | 0.202 | 0.167 | 0.167 |
| Osogbo | 7.8073 | 4.54111 | 0.214 | 0.214 | 0.202 | 0.202 | 0.167 | 0.167 |
| Enugu | 6.4575 | 7.53472 | 0.214 | 0.215 | 0.202 | 0.202 | 0.167 | 0.167 |
| Owerri | 5.49781 | 7.05194 | 0.218 | 0.219 | 0.205 | 0.205 | 0.169 | 0.170 |
| Calabar | 4.96722 | 8.32583 | 0.221 | 0.222 | 0.208 | 0.208 | 0.172 | 0.172 |
| Igarra | 7.0864 | 6.2775 | 0.211 | 0.212 | 0.200 | 0.200 | 0.169 | 0.165 |
| Sokoto | 13.07093 | 5.21083 | 0.199 | 0.199 | 0.189 | 0.189 | 0.156 | 0.156 |
| Kano | 11.94192 | 8.57389 | 0.201 | 0.202 | 0.190 | 0.190 | 0.157 | 0.158 |
| Maiduguri | 11.80057 | 13.20056 | 0.200 | 0.203 | 0.190 | 0.191 | 0.157 | 0.158 |
| Bauchi | 10.46797 | 9.83222 | 0.202 | 0.204 | 0.192 | 0.192 | 0.158 | 0.159 |
| Garki | 9.02636 | 7.48361 | 0.208 | 0.209 | 0.197 | 0.197 | 0.162 | 0.163 |
| Jalingo | 8.91306 | 11.31167 | 0.207 | 0.209 | 0.195 | 0.196 | 0.161 | 0.162 |
| Average | - | - | 0.209 | 0.210 | 0.198 | 0.198 | 0.164 | 0.164 |
Table 5.
Total energy generated for each site (kWh/year) and the energy difference for the sites.
| - | Total Energy Generated for Each Site (kWh/year) | Energy Difference (kWh/year) | |||||||
|---|---|---|---|---|---|---|---|---|---|
| Location | 4 kw Optimsed (kWh) | 4 kw Forced-on (kWh) | 6.4 kW Optimised (kWh) | 6.4 kW Forced-on (kWh) | 8 kW Optimised (kWh) | 8 kW Forced-on (kWh) | 4 kW Load | 6.4 kW Load | 8 kW Load |
| Epe | 27,191 | 27,371 | 58,518 | 58,681 | 79,625 | 80,364 | 180 | 163 | 739 |
| Osogbo | 27,206 | 27,357 | 58,441 | 58,708 | 80,164 | 80,216 | 151 | 267 | 52 |
| Enugu | 27,185 | 27,391 | 58,452 | 58,807 | 79,719 | 80,100 | 206 | 355 | 381 |
| Owerri | 27,217 | 27,410 | 58,478 | 58,634 | 79,212 | 78,926 | 193 | 156 | −286 |
| Calabar | 28,471 | 27,456 | 58,464 | 58,683 | 78,707 | 78,707 | −1015 | 219 | 0 |
| Igarra | 27,172 | 27,389 | 58,472 | 58,808 | 79,419 | 79,939 | 217 | 336 | 520 |
| Sokoto | 27,095 | 27,396 | 58,499 | 58,964 | 81,427 | 82,799 | 301 | 465 | 1372 |
| Kano | 27,116 | 27,403 | 58,631 | 58,631 | 81,476 | 81,300 | 287 | 0 | −176 |
| Maiduguri | 27,125 | 27,511 | 58,618 | 59,085 | 82,093 | 81,711 | 386 | 467 | −382 |
| Bauchi | 27,121 | 27,458 | 58,579 | 58,870 | 81,544 | 82,282 | 337 | 291 | 738 |
| Garki | 27,148 | 27,411 | 58,422 | 58,783 | 80,024 | 80,875 | 263 | 361 | 851 |
| Jalingo | 27,143 | 27,475 | 58,488 | 58,967 | 80,268 | 80,138 | 332 | 479 | −130 |
| Average | 27,265.833 | 27,419.000 | 58,505.167 | 58,801.750 | 80,306.500 | 80,613.083 | 153.167 | 296.583 | 306.583 |
Table 6.
Percentage energy contribution by solar PV system.
| Location | 4 kW Optimised % | 4 kW Forced-on % | 6.4 kW Optimised % | 6.4 kW Forced-on % | 8 kW Optimised % | 8 kW Forced-on % |
|---|---|---|---|---|---|---|
| Epe | 45.100 | 40.900 | 36.300 | 35.500 | 40.400 | 40.400 |
| Osogbo | 41.200 | 40.600 | 35.300 | 35.900 | 41.400 | 40.200 |
| Enugu | 42.800 | 40.000 | 36.000 | 35.800 | 40.600 | 39.700 |
| Owerri | 41.000 | 39.400 | 34.200 | 32.600 | 38.300 | 36.800 |
| Calabar | 36.200 | 37.700 | 32.700 | 31.900 | 37.200 | 37.200 |
| Igarra | 43.200 | 41.400 | 37.100 | 36.400 | 39.400 | 40.100 |
| Sokoto | 47.200 | 46.200 | 41.200 | 41.100 | 46.200 | 46.600 |
| Kano | 46.800 | 44.700 | 41.900 | 41.900 | 45.900 | 43.700 |
| Maiduguri | 46.900 | 44.400 | 41.400 | 39.300 | 46.900 | 43.600 |
| Bauchi | 46.800 | 44.400 | 40.600 | 38.600 | 45.800 | 44.500 |
| Garki | 45.200 | 42.300 | 37.300 | 37.100 | 42.300 | 41.800 |
| Jalingo | 45.800 | 42.400 | 38.600 | 37.500 | 42.900 | 40.400 |
Table 7.
Percentage penetration.
| Location | 4 kW Optimised | 4 kW Forced-on | 6.4 kW Optimised | 6.4 kW Forced-on | 8 kW Optimised | 8 kW Forced-on |
|---|---|---|---|---|---|---|
| Epe | 45.10 | 44.40 | 39.80 | 39.00 | 47.40 | 48.00 |
| Osogbo | 44.60 | 44.10 | 38.60 | 39.50 | 49.00 | 47.50 |
| Enugu | 46.20 | 43.50 | 39.50 | 39.50 | 47.80 | 46.90 |
| Owerri | 44.30 | 42.90 | 37.50 | 35.80 | 45.40 | 42.90 |
| Calabar | 40.90 | 41.10 | 35.90 | 35.10 | 43.20 | 43.20 |
| Igarra | 46.60 | 45.00 | 40.70 | 40.20 | 46.20 | 47.30 |
| Sokoto | 50.80 | 50.20 | 45.20 | 45.40 | 55.50 | 56.70 |
| Kano | 50.40 | 48.60 | 46.00 | 44.50 | 55.20 | 52.40 |
| Maiduguri | 50.50 | 48.50 | 45.50 | 43.50 | 56.80 | 52.60 |
| Bauchi | 50.40 | 48.40 | 44.50 | 42.60 | 55.20 | 54.10 |
| Garki | 48.70 | 46.10 | 40.80 | 40.80 | 49.90 | 49.90 |
| Jalingo | 49.30 | 46.30 | 42.30 | 41.40 | 50.80 | 47.80 |
| Average | 47.32 | 45.76 | 41.36 | 40.61 | 50.20 | 49.11 |
Table 8.
Simulated fuel consumption for the sites L/year.
| Location | 4 kW Optimised | 4 kW Forced-on | 6.4 kW Optimised | 6.4 kW Forced-on | 8 kW Optimised | 8 kW Forced-on |
|---|---|---|---|---|---|---|
| Epe | 7006 | 7175 | 16,810 | 17,086 | 17,724 | 17,881 |
| Osogbo | 7082 | 7210 | 17,045 | 16,973 | 17,520 | 17,937 |
| Enugu | 6879 | 7288 | 16,831 | 17,007 | 17,668 | 18,066 |
| Owerri | 7105 | 7373 | 17,345 | 17,832 | 18,093 | 18,642 |
| Calabar | 7661 | 7586 | 17,722 | 18,031 | 18,460 | 18,460 |
| Igarra | 6829 | 7117 | 16,552 | 16,844 | 17,972 | 17,909 |
| Sokoto | 6316 | 6521 | 15,457 | 15,624 | 16,306 | 16,568 |
| Kano | 6366 | 6708 | 15,289 | 15,289 | 16,396 | 17,085 |
| Maiduguri | 6359 | 6767 | 15,416 | 16,155 | 16,233 | 17,217 |
| Bauchi | 6376 | 6759 | 15,639 | 16,273 | 16,437 | 17,042 |
| Garki | 6574 | 7009 | 16,493 | 16,663 | 17,237 | 17,566 |
| Jalingo | 6496 | 7005 | 16,142 | 16,604 | 17,073 | 17,836 |
| Average | 6754.083 | 7043.167 | 16,395.083 | 16,698.417 | 17,259.917 | 17,684.083 |
Table 9.
Fuel consumption difference for the sites.
| Location | 4 kW Fuel Consumption Difference L/year | 6.4 kW Fuel Consumption Difference L/year | 8 kW Fuel Consumption Difference L/year |
|---|---|---|---|
| Epe | 169.000 | 276.000 | 157.000 |
| Osogbo | 128.000 | −72.000 | 417.000 |
| Enugu | 409.000 | 176.000 | 398.000 |
| Owerri | 268.000 | 487.000 | 549.000 |
| Calabar | -75.000 | 309.000 | 0.000 |
| Igarra | 288.000 | 292.000 | −63.000 |
| Sokoto | 205.000 | 167.000 | 262.000 |
| Kano | 342.000 | 0.000 | 689.000 |
| Maiduguri | 408.000 | 739.000 | 984.000 |
| Bauchi | 383.000 | 634.000 | 605.000 |
| Garki | 435.000 | 170.000 | 329.000 |
| Jalingo | 509.000 | 462.000 | 763.000 |
| Average | 289.083 | 303.333 | 424.167 |
Table 10.
Fuel consumption for generator only.
| Load (kW) | Fuel Consumption for Generator Only (L) | LCOE (kWh/year) |
|---|---|---|
| 4 | 11,883 | 0.340 |
| 6.4 | 26,468 | 0.234 |
| 8 | 27,960 | 0.195 |
Table 11.
Simulated percentage savings on fuel L/year.
| Location | 4 kW Optimised | 4 kW Forced-on | 6.4 kW Optimised | 6.4 kW Forced-on | 8 kW Optimised | 8 kW Forced-on |
|---|---|---|---|---|---|---|
| Epe | 28.60% | 27.61% | 36.49% | 35.45% | 36.61% | 36.05% |
| Osogbo | 28.15% | 27.40% | 35.60% | 35.87% | 37.34% | 35.85% |
| Enugu | 29.34% | 26.94% | 36.41% | 35.75% | 36.81% | 35.39% |
| Owerri | 28.02% | 26.45% | 34.47% | 32.63% | 35.29% | 33.33% |
| Calabar | 24.76% | 25.20% | 33.04% | 31.88% | 33.98% | 33.98% |
| Igarra | 29.64% | 27.95% | 37.46% | 36.36% | 35.72% | 35.95% |
| Sokoto | 32.64% | 31.44% | 41.60% | 40.97% | 41.68% | 40.74% |
| Kano | 32.35% | 30.34% | 42.24% | 42.24% | 41.36% | 38.89% |
| Maiduguri | 32.39% | 30.00% | 41.76% | 38.96% | 41.94% | 38.42% |
| Bauchi | 32.29% | 30.05% | 40.91% | 38.52% | 41.21% | 39.05% |
| Garki | 31.13% | 28.58% | 37.69% | 37.04% | 38.35% | 37.17% |
| Jalingo | 31.59% | 28.60% | 39.01% | 37.27% | 38.94% | 36.21% |
Table 12.
Summary of average savings.
| Load | Average Fuel Savings (L/year) | Average Percentage Savings | Costs Savings ($) on Fuel |
|---|---|---|---|
| 4 kW Optimised | 5128.917 | 30.075% | 2872.193 |
| 4 kW Forced-on | 4839.833 | 28.379% | 2710.307 |
| 6.4 kW Optimised | 10,072.917 | 38.057% | 5640.833 |
| 6.4 kW Forced-on | 9769.583 | 36.911% | 5470.967 |
| 8 kW Optimised | 10,700.083 | 38.269% | 5992.047 |
| 8 kW Forced-on | 10,275.917 | 36.752% | 5754.513 |
© 2018 by the authors. Licensee MDPI, Basel, Switzerland. This article is an open access article distributed under the terms and conditions of the Creative Commons Attribution (CC BY) license (http://creativecommons.org/licenses/by/4.0/).
Share and Cite
MDPI and ACS Style
Oviroh, P.O.; Jen, T.-C. The Energy Cost Analysis of Hybrid Systems and Diesel Generators in Powering Selected Base Transceiver Station Locations in Nigeria. Energies 2018, 11, 687. https://doi.org/10.3390/en11030687
AMA Style
Oviroh PO, Jen T-C. The Energy Cost Analysis of Hybrid Systems and Diesel Generators in Powering Selected Base Transceiver Station Locations in Nigeria. Energies. 2018; 11(3):687. https://doi.org/10.3390/en11030687
Chicago/Turabian StyleOviroh, Peter Ozaveshe, and Tien-Chien Jen. 2018. "The Energy Cost Analysis of Hybrid Systems and Diesel Generators in Powering Selected Base Transceiver Station Locations in Nigeria" Energies 11, no. 3: 687. https://doi.org/10.3390/en11030687
Note that from the first issue of 2016, this journal uses article numbers instead of page numbers. See further details here.