Solar Cell Capacitance Determination Based on an RLC Resonant Circuit
by
 , and
, and
Petru Adrian Cotfas
1,*, 
Daniel Tudor Cotfas
1 ,
,
Paul Nicolae Borza
1,
Dezso Sera
2 and
Remus Teodorescu
2 1
Department of Electronics and Computers, Transilvania University of Brasov, Eroilor 29, 500036 Brasov, Romania
2
Department of Energy Technology, Aalborg University, Pontoppidanstraede 101, DK-9220 Aalborg, Denmark
*
Author to whom correspondence should be addressed.
Energies 2018, 11(3), 672; https://doi.org/10.3390/en11030672
Submission received: 14 February 2018
/
Revised: 11 March 2018
/
Accepted: 13 March 2018
/
Published: 16 March 2018
(This article belongs to the Special Issue PV System Design and Performance)
Abstract
:The capacitance is one of the key dynamic parameters of solar cells, which can provide essential information regarding the quality and health state of the cell. However, the measurement of this parameter is not a trivial task, as it typically requires high accuracy instruments using, e.g., electrical impedance spectroscopy (IS). This paper introduces a simple and effective method to determine the electric capacitance of the solar cells. An RLC (Resistor Inductance Capacitor) circuit is formed by using an inductor as a load for the solar cell. The capacitance of the solar cell is found by measuring the frequency of the damped oscillation that occurs at the moment of connecting the inductor to the solar cell. The study is performed through simulation based on National Instruments (NI) Multisim application as SPICE simulation software and through experimental capacitance measurements of a monocrystalline silicon commercial solar cell and a photovoltaic panel using the proposed method. The results were validated using impedance spectroscopy. The differences between the capacitance values obtained by the two methods are of 1% for the solar cells and of 9.6% for the PV panel. The irradiance level effect upon the solar cell capacitance was studied obtaining an increase in the capacitance in function of the irradiance. By connecting different inductors to the solar cell, the frequency effect upon the solar cell capacitance was studied noticing a very small decrease in the capacitance with the frequency. Additionally, the temperature effect over the solar cell capacitance was studied achieving an increase in capacitance with temperature.
1. Introduction
Solar cells represent one of the most important renewable energy sources. There are many studies on increasing the efficiency of the photovoltaic (PV) systems used as renewable energy sources as a solution for the reduction of pollution [1,2,3,4,5]. Due to the nonlinear current-voltage (I-V) characteristic of PV modules, the accurate determination of their electrical parameters is not easy. Extensive studies on the determination of the PV modules’ and solar cells’ electrical parameters were performed in the last decades. Studies were focused on calculating both the DC and AC [6,7,8,9,10,11,12,13,14,15,16] electrical parameters.
The most widely used method to study the dynamic behavior of the PV modules is the impedance spectroscopy—IS [17,18]. Based on this method, the AC parameters of the solar cell, like capacitance, and dynamic and series resistance can be determined.
The IS method implies the application of a small AC signal (voltage or current) to the device under test (DUT), and the measurement of the resulting AC current or voltage. The DUT impedance can be calculated from the known AC voltage and the current. By varying the AC signal frequency, the DUT impedance spectrum can be found. Based on the DUT equivalent circuit, its components can be determined by using the fitting method (like the series and parallel resistance and the capacitance in the case of solar cells). The IS method has the advantage of offering the information about three important dynamic parameters and can be implemented with dedicated instruments or LCR meters. The disadvantage of this method is the need for an external signal injection into the DUT which can increase the price of the used instruments, especially if the tests are conducted under light conditions. These conditions involve DC power electronics in the instruments in order to bias the PV.
Other methods are based on the time response of the PV modules. These methods are based on the transient effect of the Resistor Capacitor (RC) circuit (discharging effect of the PV capacitance [19,20] or time constant of the PV circuit [21]). The reported time response-based methods require external signal injection into the DUT and are used only in dark conditions.
The dynamic parameters can be used as tools to characterize and diagnose the quality and the degradation status of the PV modules. One of the key dynamic parameters is the electrical capacitance of the PV modules. Oprea et al. [22] found that the PV panel capacitance and parallel resistance are affected by the PV panel degradation state when the potential-induced degradation was studied. Bhat et al. [23] found that the silicon cell capacitance decreases when the solar cell is irradiated with 8 MeV electrons because the carrier concentration decreases when increasing dose. Kim et al. [24] found that the capacitance of the PV panels increases when hot spots appear. Osawa et al. [25] studied the influence of the cracks and interconnected ribbon disconnection defects over the dynamic parameters of the PV modules. Their results showed that the parallel resistance decreases with the cracks number, while the parallel capacitance increases with the cracks number. Increasing the number of the interconnected ribbon disconnections increases the series resistance, slightly decreases the parallel resistance, and does not affect the capacitance of the PV modules.
The solar cell capacitance is a combination of two capacitances: transition capacitance (also known as junction capacitance) and diffusion capacitance connected in parallel. The solar cell capacitance varies function of the cell voltage, level of irradiance, frequency, and temperature [26,27,28,29,30,31,32,33]. The capacitance variation of the silicon solar cell function of the bias voltage presents two regions: in the first region, stretching from reverse to forward bias until the knee voltage, the capacitance presents a small increasing slope (region associated with the transition capacitance), while in the second region, beginning above the knee voltage, the capacitance presents an exponential increase (in the region associated with the diffusion capacitance). The increasing of the irradiance level leads to an increase of the solar cell capacitance [18,30,33]. Increasing the solar cell temperature also increases its capacitance [18,31,32,33]. Based on the dependence of the solar cell capacitance on the temperature, Anantha Krishna et al. [31] proposed a method for measuring the solar cell blanket in spacecraft.
This paper describes a simple method which allows determining the capacitance of the solar cells. The method is based on the behavior of the RLC (Resistor Inductance Capacitor) circuits. An inductance is used as a variable load for solar cells. The method can be applied under light conditions starting from 1 W/m2. The influences of the irradiance level, frequency, and temperature on the solar cell capacitance are described, as well.
2. Materials and Methods
2.1. Photovoltaic Cell Modeling
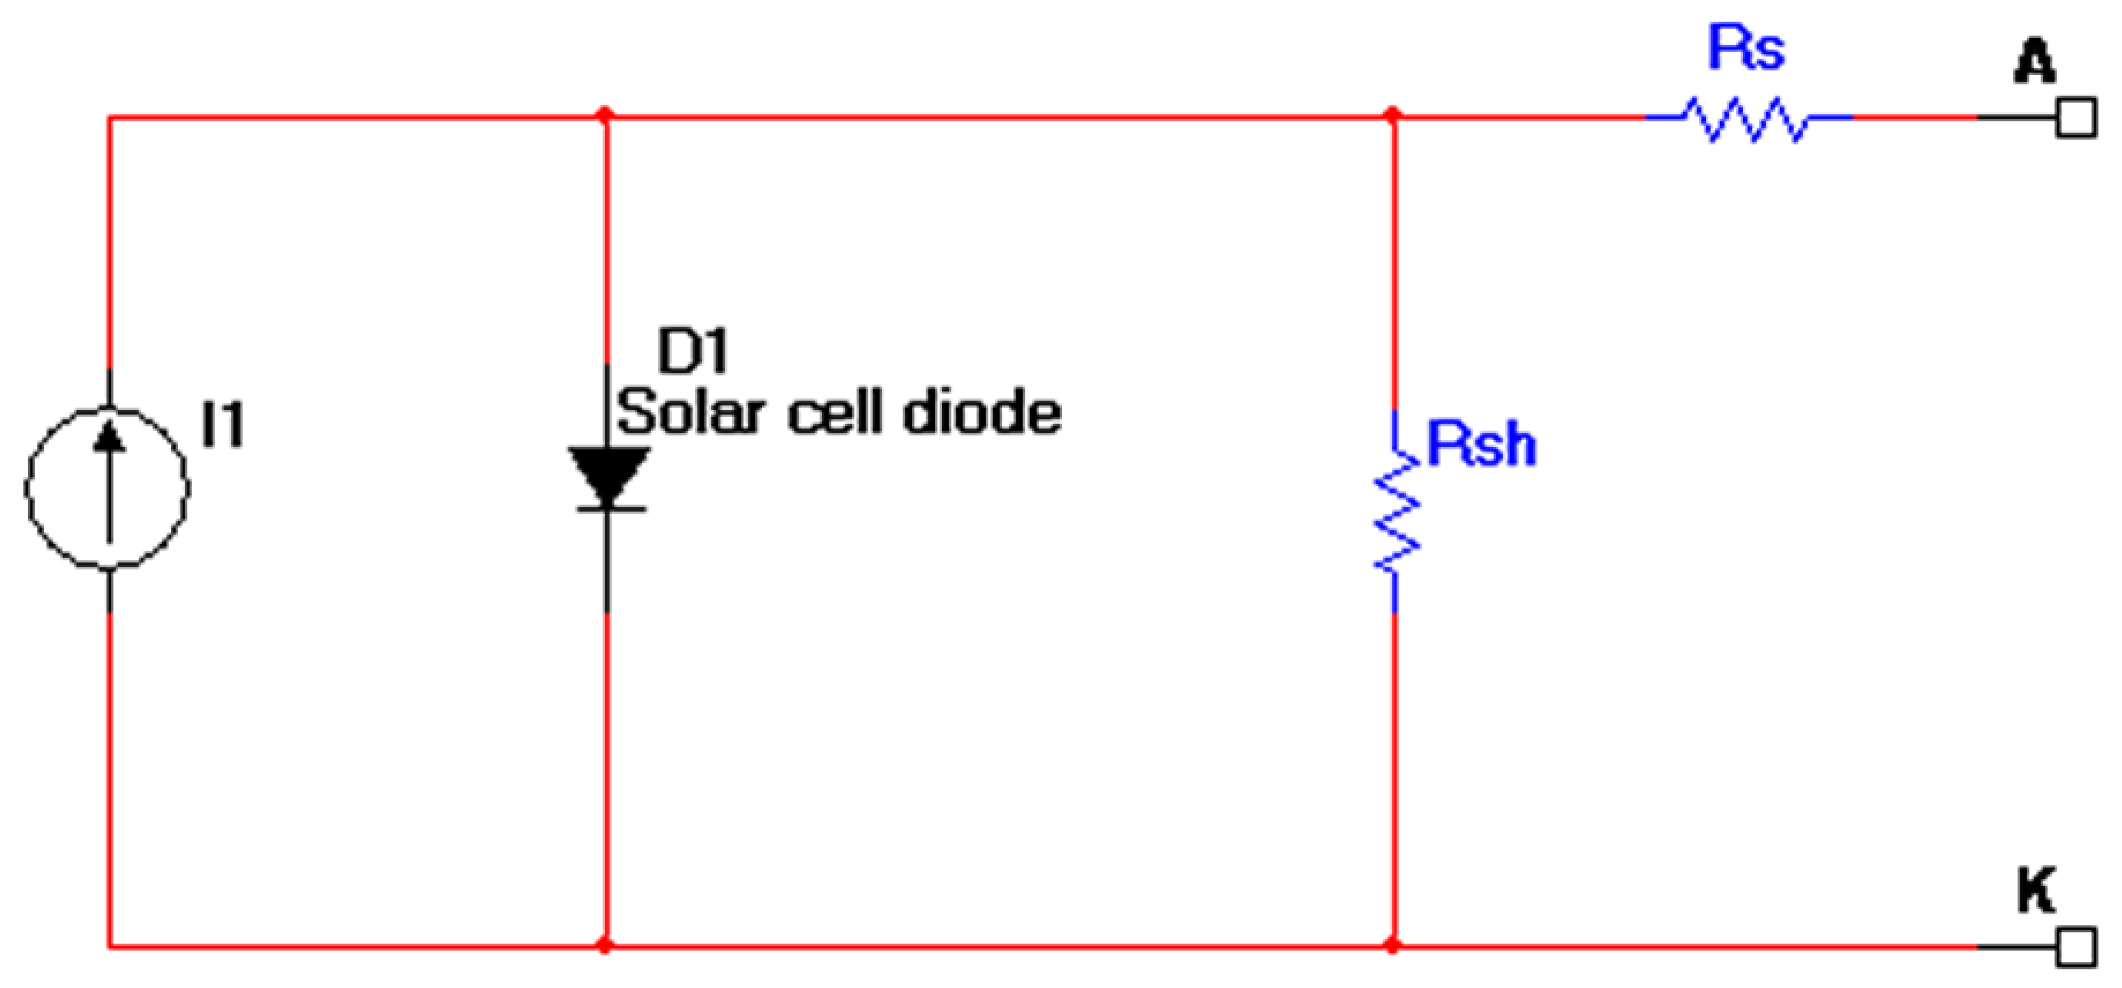
Solar cells characterization can be performed in DC and AC regimes. In the DC case, the solar cell can be described using the equivalent electrical circuit shown in Figure 1. This is based on the one-diode model.
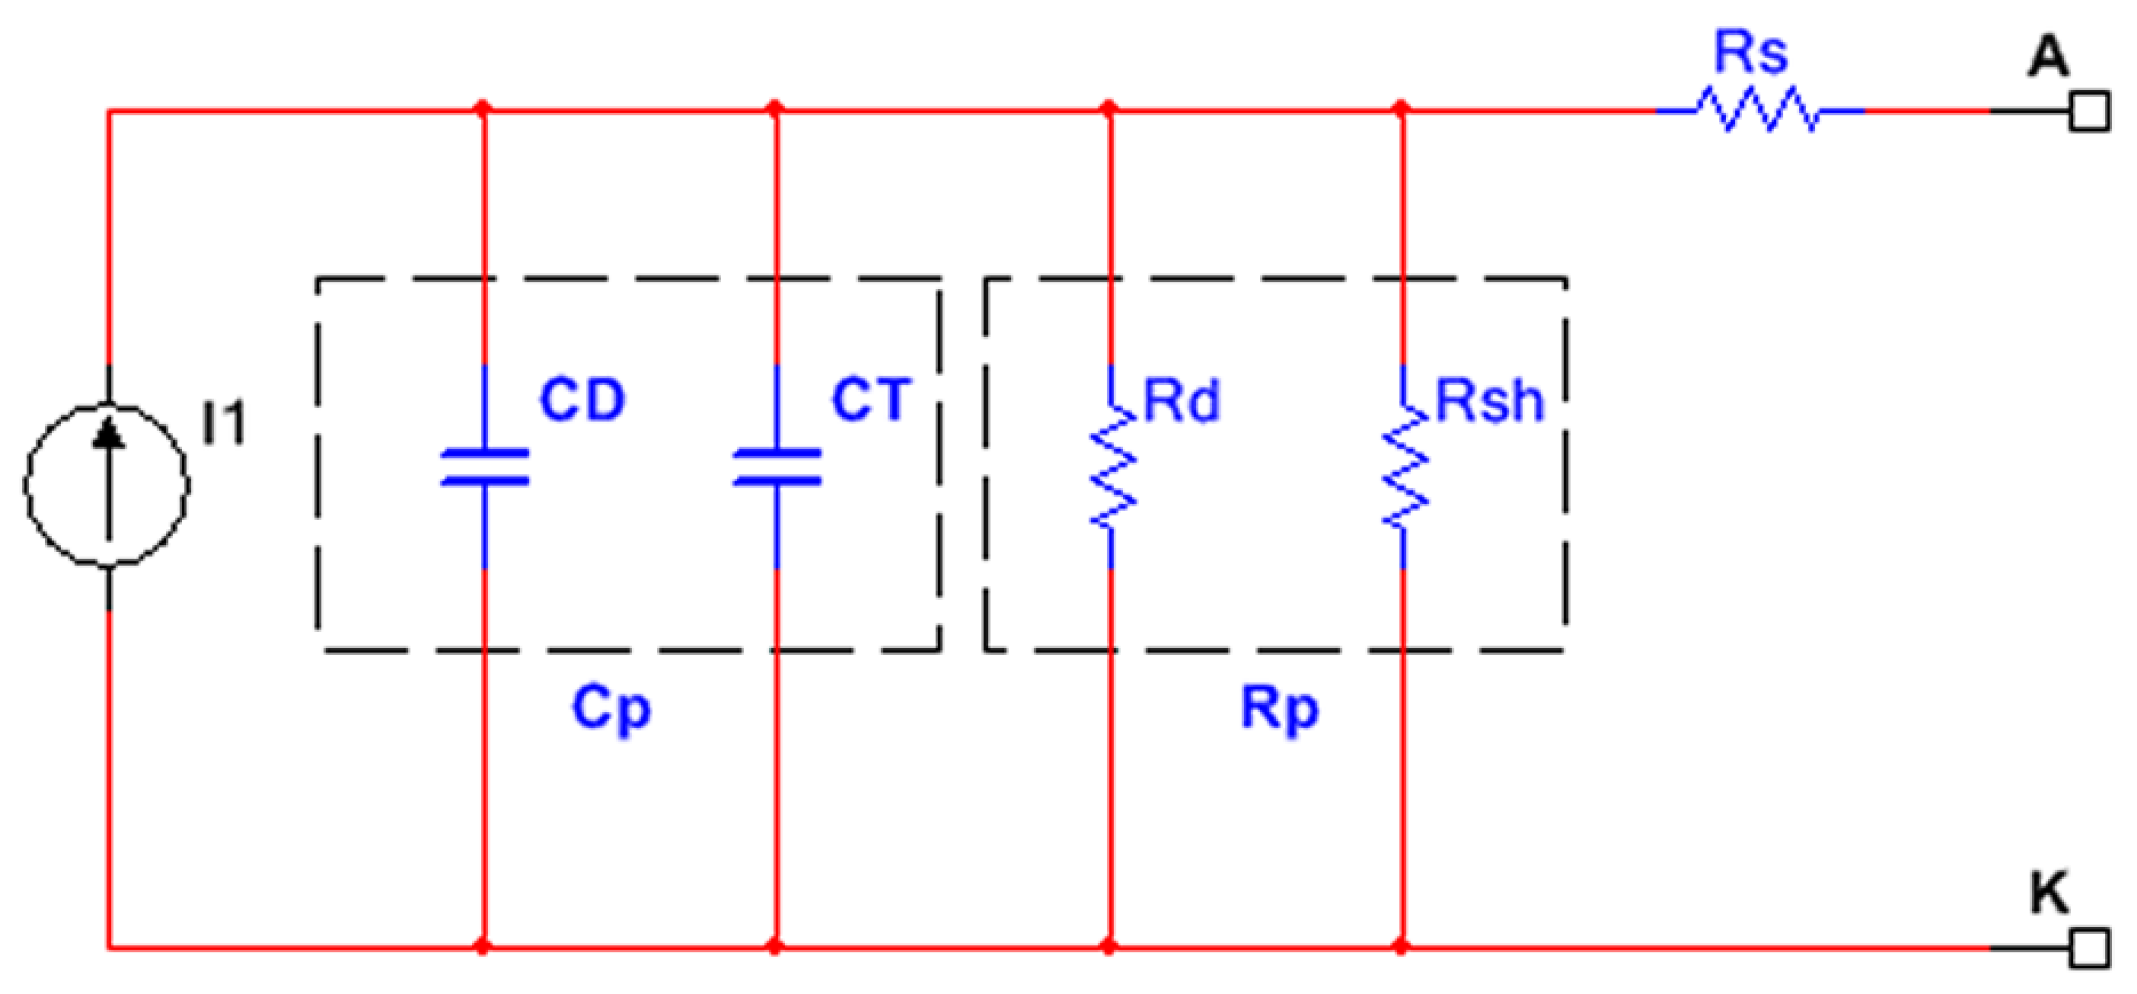
For the AC case, the equivalent circuit of the solar cell is shown in Figure 2, where:
- I1 = photogenerated current
- Rs = series resistance
- Rsh = shunt resistance
- Rd(V) = dynamic resistance of the diode
- CD(V, ω) = diffusion capacitance
- CT(V) = transition capacitance
- ω = signal frequency
The CT capacitance describes the separation of charges in the depletion region and the CD capacitance describes the gradient in the charge density inside the solar cell [18,26].
The equivalent electrical circuit of the solar cell can be simplified like in Figure 2; the dashed line part, Cp = CD||CT, is the equivalent parallel capacitance, and Rp = Rsh||Rd is the equivalent parallel resistance.
2.2. Proposed Method for Determining the Solar Cell Capacitance
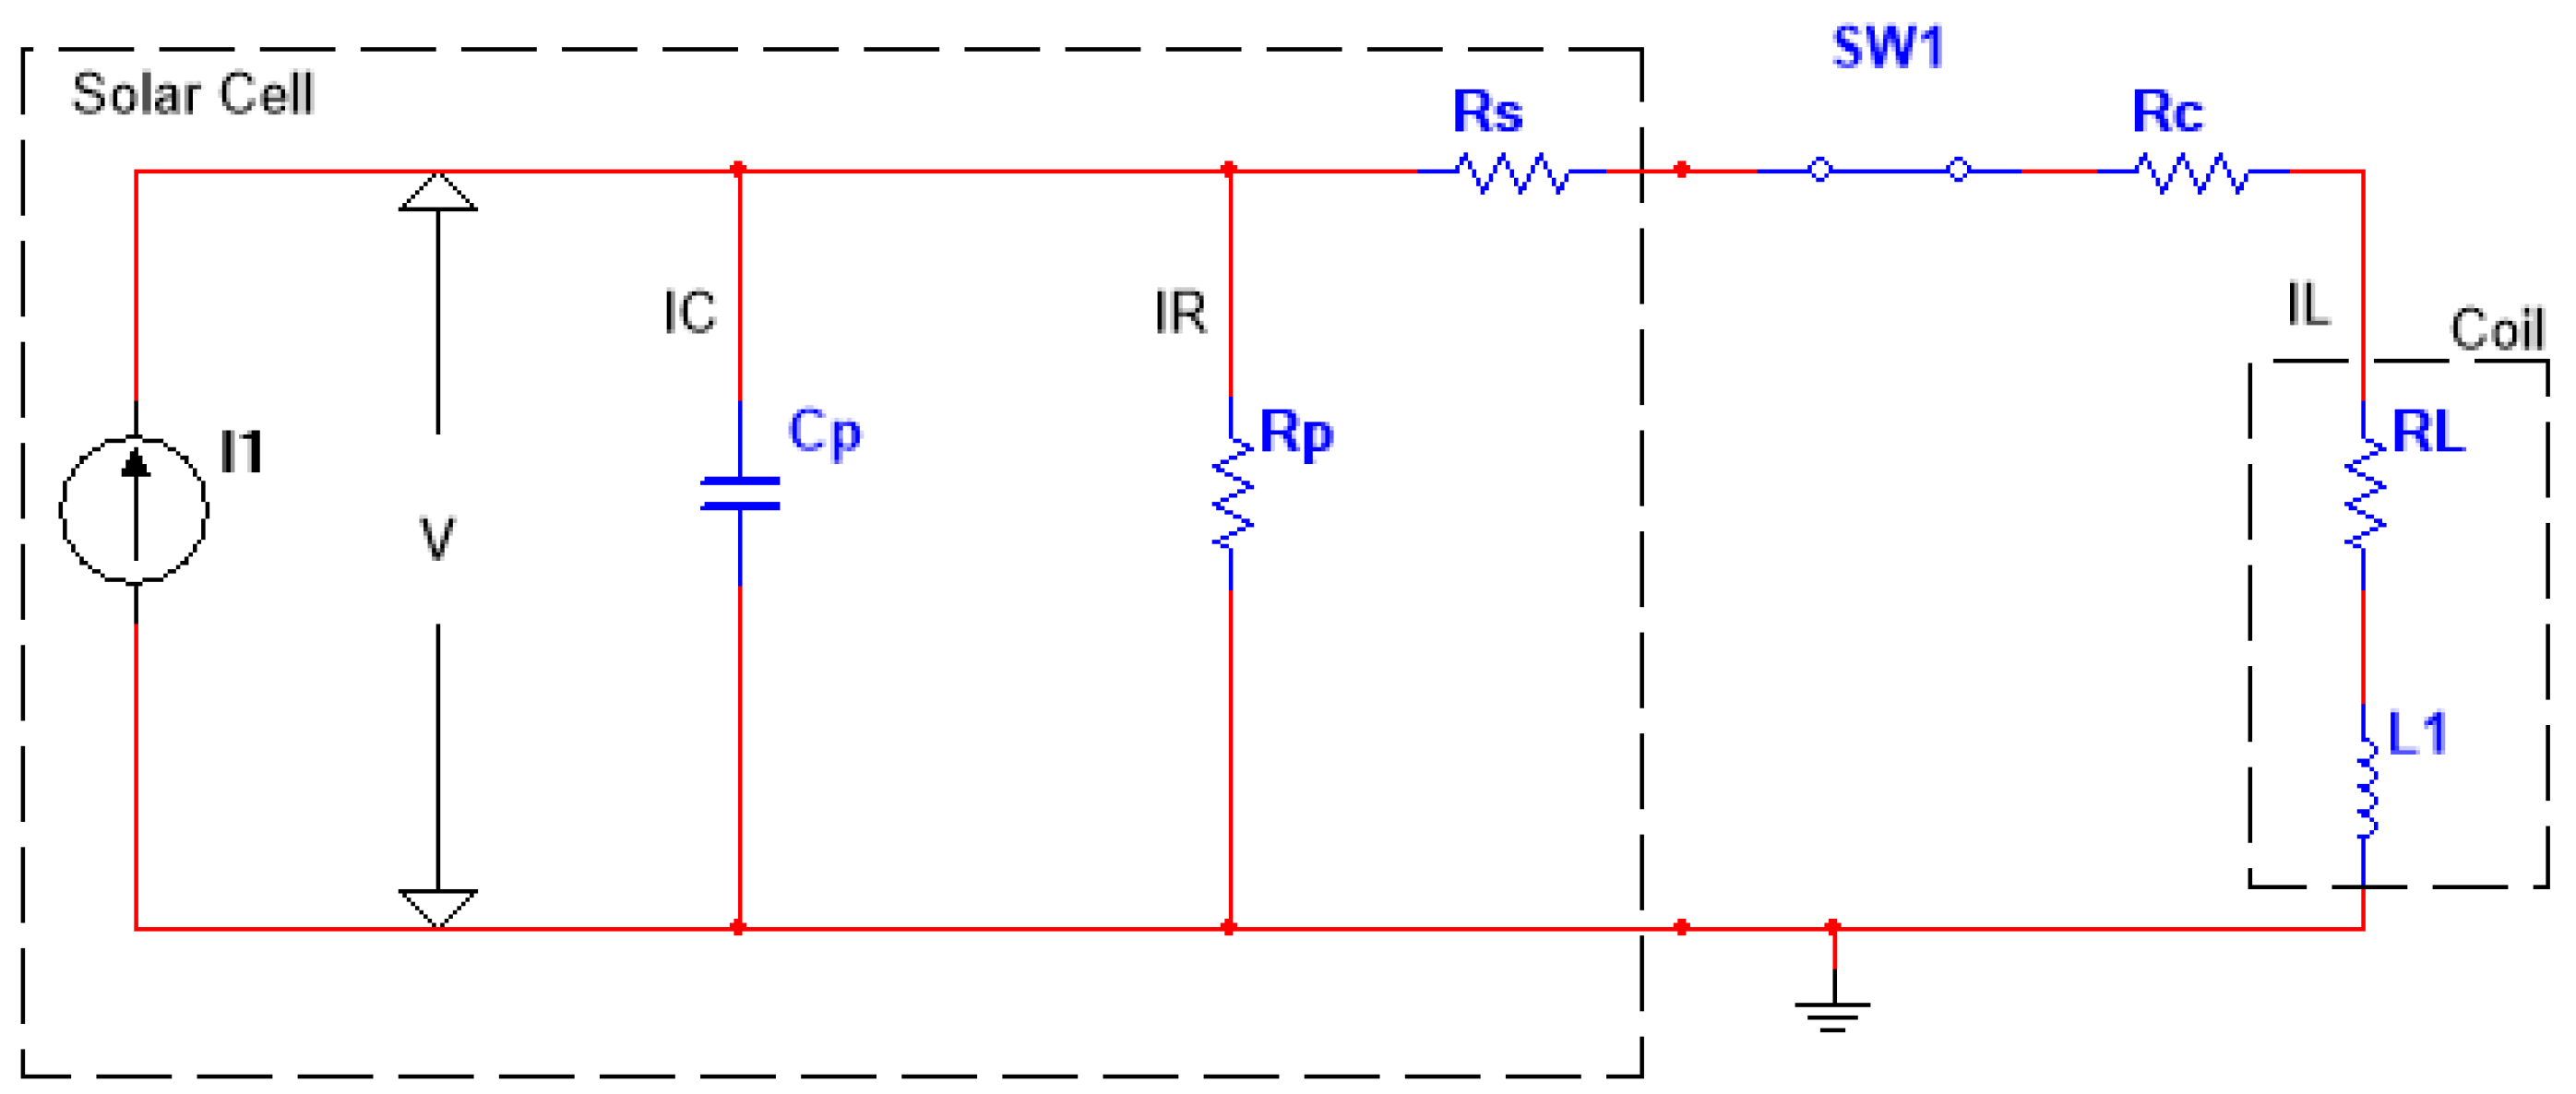
The proposed method is based on the RLC circuit behavior. The method supposes having the solar cell under a constant level of irradiance and in the open circuit point. Using a switch, a coil with known inductance L1 and series resistance RL is connected to the solar cell. At the time instance when the switch is closed, a transient process of the coil charging begins. The operating point of the system is moving from the open circuit point towards the short circuit current point. When the coil is completely charged (when IL ≅ I1) an oscillation between the solar cell capacitance Cp and external inductor L1 appears, and the coil discharge begins through the circuit resistance and charges the solar cell capacitance. The charging-discharging process is repeated as an underdamped oscillation until a steady state is obtained.
Therefore, when the inductance L1 with series resistance RL is connected to the solar cell’s terminals using the SW1 switch, the circuit shown in Figure 3 is obtained. The Rc is the resistance of the connection circuit between the solar cell and the coil.
The circuit from Figure 3 is an RLC circuit that can be described based on following equation:
or:
where:
is called the resonant frequency, A0 is the initial amplitude of the oscillation, φ is the initial phase, β is the damping coefficient which is dependent on the capacitance, parallel and series resistances of the solar cell, the coil inductance, and the circuit resistance, represents the resonant frequency of the ideal oscillator, and is the time-dependent oscillation amplitude. If β < ω0 then the voltage across the cell is an underdamped oscillation and the proposed method can be used. If β ≥ ω0, then the voltage across the cell presents an overdamped evolution and the method could not be applied.
The logarithmic decrement of the underdamped oscillation is given by the logarithm value of the ratio between two consecutive oscillator amplitudes:
where is the period.
The Cp capacitance of the solar cell can be calculated at frequency, by knowing the coil inductance value, and by determining the frequency and the logarithmic decrement of the resulted oscillation from the measurements:
If the coil is changed, a new oscillating circuit is obtained, which has a new resonant frequency.
2.3. Simulation and Experimental Setup
The research for this paper is made in two stages. The first stage is based on the simulation of circuits using the National Instruments (NI) Multisim software package as SPICE simulation software.
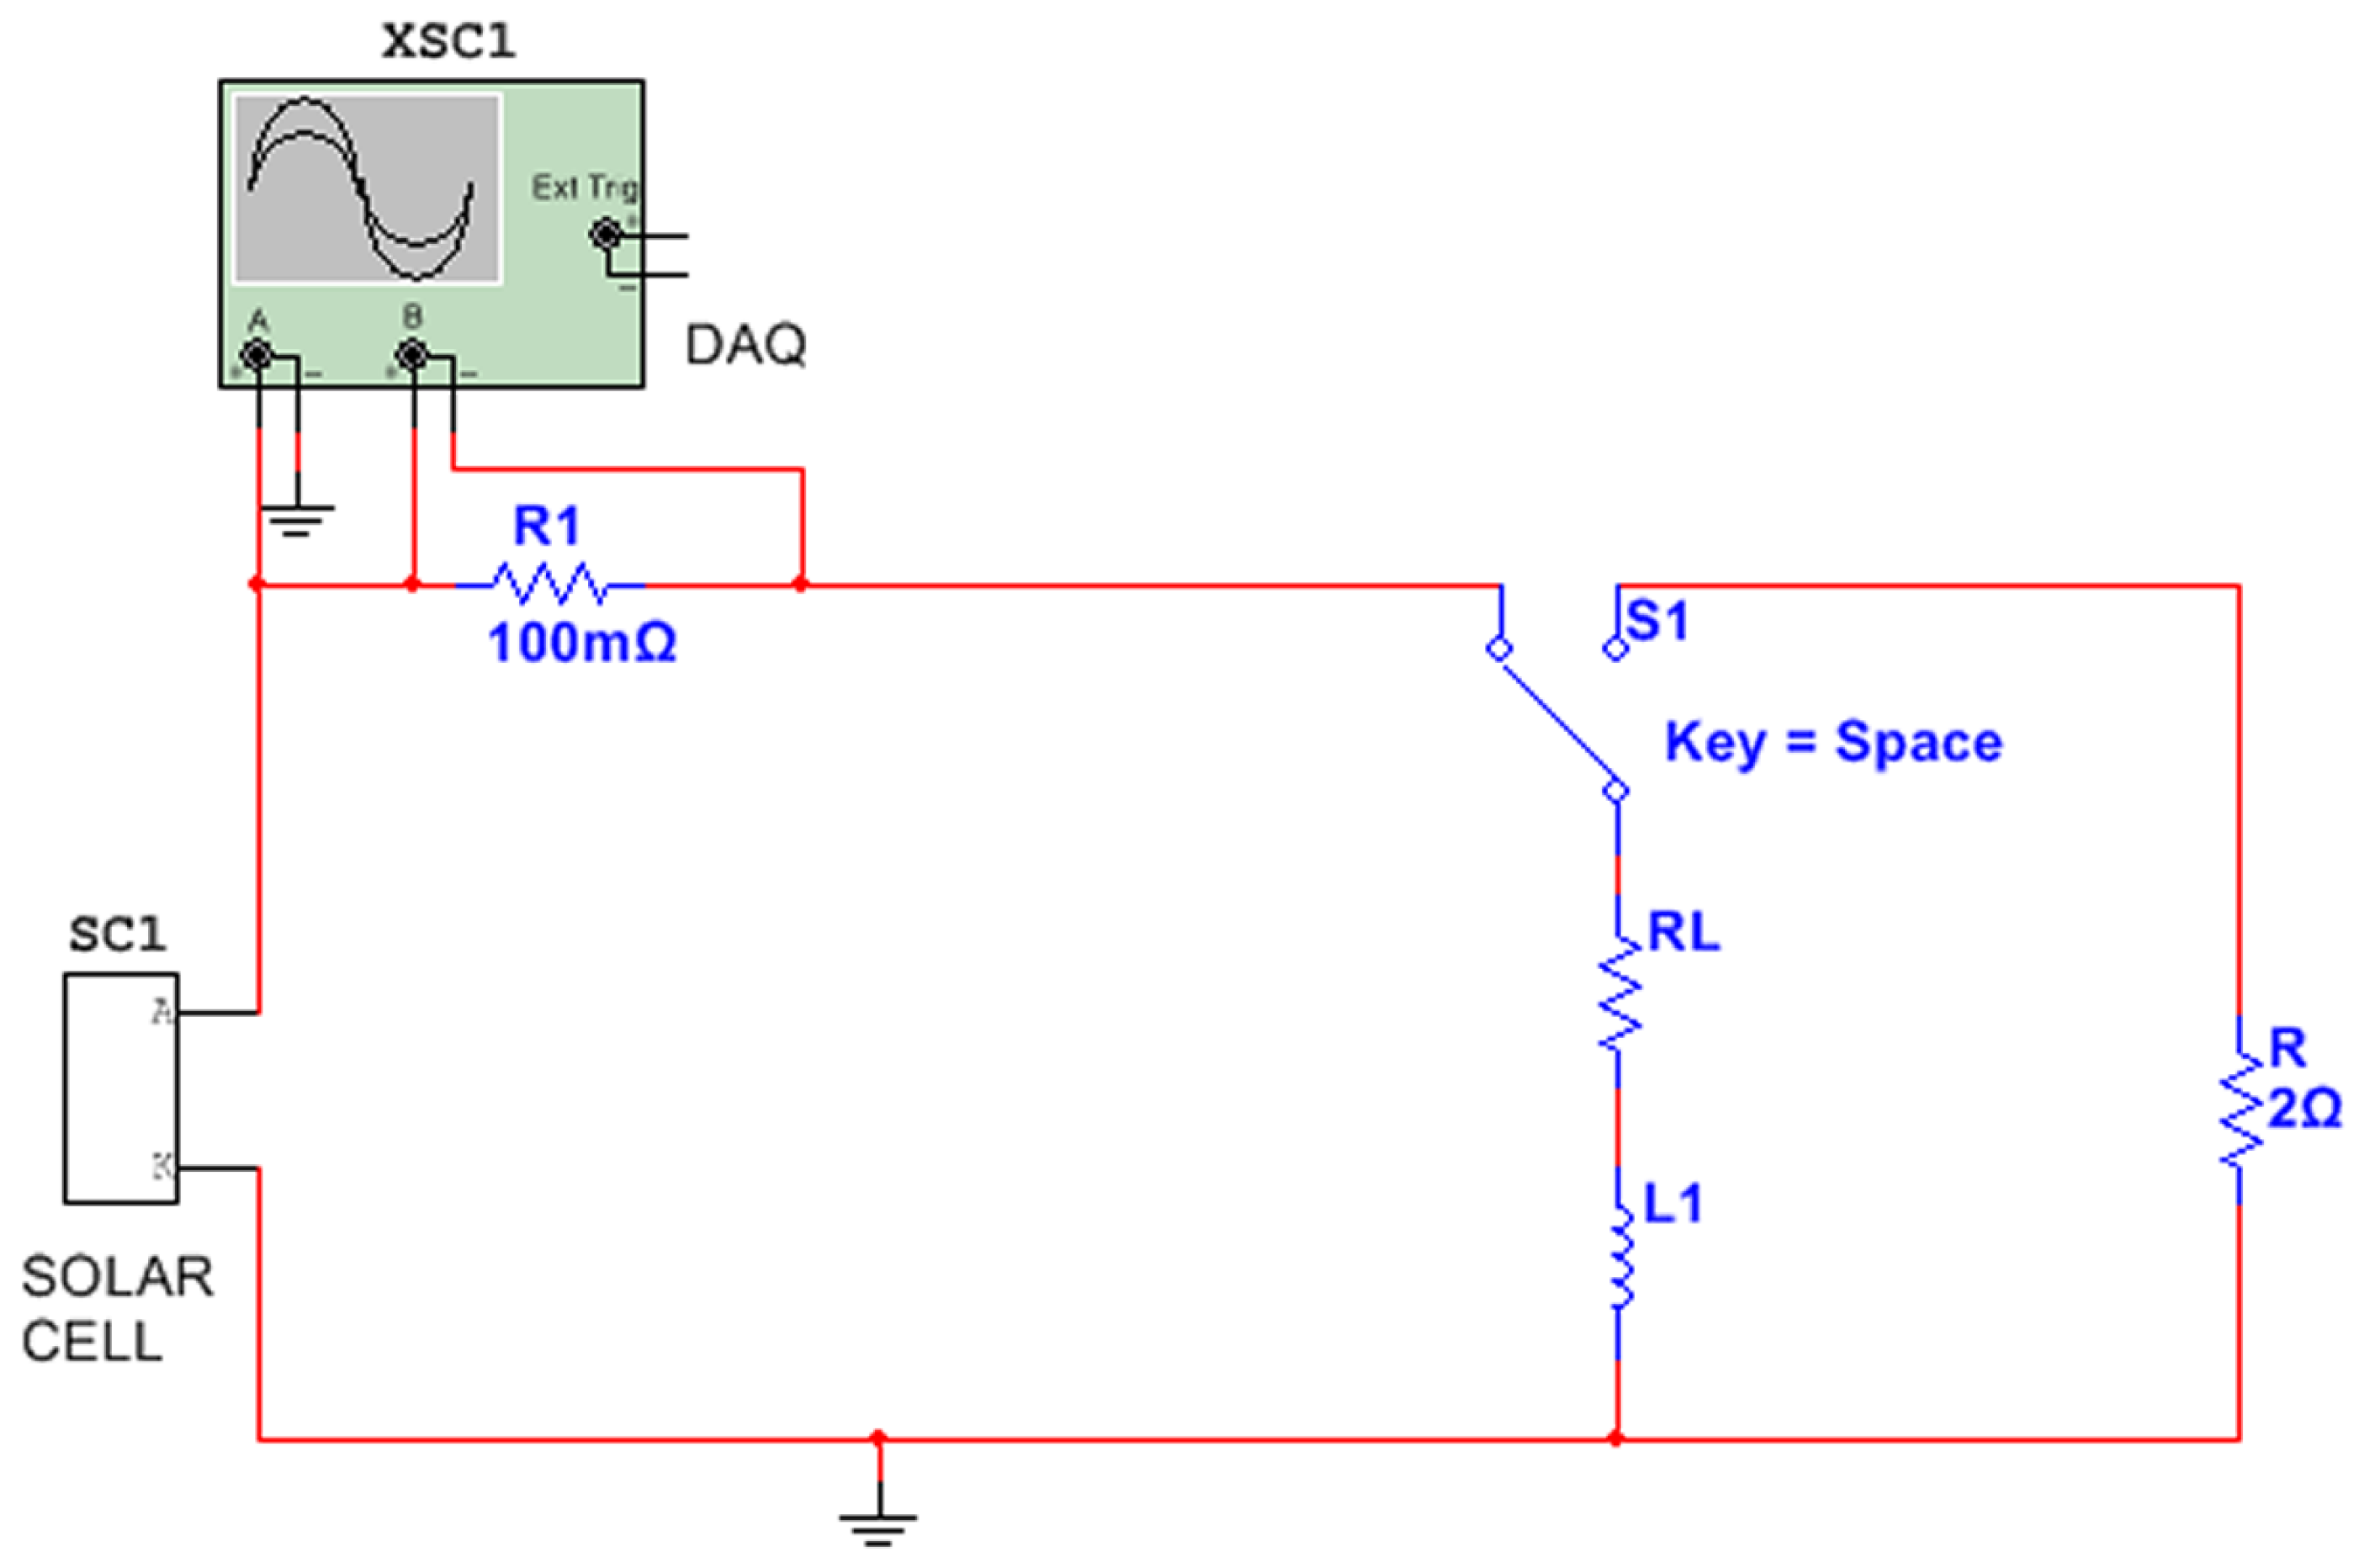
The circuit used for the simulation is shown in Figure 4. The SC1 solar cell is connected through the R1 resistance to a coil with L1 inductance and RL internal resistance known. The solar cell voltage and the current through the circuit are measured with the XSC1 oscilloscope. The R1 resistance with known value is used for current measurement. The R resistance and the S1 single pole double throw (SPDT) switch are used for coil discharge.
The SC1 equivalent electrical circuit used is shown in Figure 1, where the D1 diode is used in order to observe the dynamic behavior of the solar cell.
In order to obtain the solar cell capacitance at different frequencies, several coils with different inductance values are used. The data obtained from the simulation are exported and processed in a software application developed using NI LabVIEW (2014, National Instruments, Austin, TX, USA). The developed application allows selecting the desired part of the underdamped oscillation signal and then, by using the Fourier analysis, the resonant frequency is determined. The application allows calculating the logarithmic decrement based on two consecutive amplitudes of the oscillation. Using Equation (7), the parallel capacitance of the solar cell is calculated.
In the second stage, a commercial encapsulated Si monocrystalline solar cell with an active area of 7.9 cm2, several coils with values between 21 µH and 566 µH, a 12-bit DAQ system (type NI PCI-MIO-16E-1), and a self-built signal conditioning (SBSC) circuit with adjustable amplification are used. The measurement chain is based on the circuit from Figure 4, in which the XSC1 oscilloscope was replaced with the DAQ + SBSC system. The measurement and data processing applications were also developed in NI LabVIEW. Consequently, the results of simulation could be compared to the experimental measurements. Additionally, in this stage the IS method [17,18,26] was used to validate the results obtained through the proposed method. The impedance measurements were carried out using a Zahner IM6 system and the associated software Thales (Z2.25, ZAHNER-elektrik, Kronach, Germany). The main characteristics of the Zahner IM6 system are: the frequency range of 10 μHz to 3 MHz, the AC amplitude 1 mV to 1 V, the DC amplitudes of ±14 V and ±2 A, the measurement accuracy ±250 μV and ±0.05% at 2 μA to 100 mA and ±0.5% at <2 μA or >100 mA. The measurements were taken at different levels of irradiance (1, 183, 263, 354, and 642 W/m2), over a frequency range of 1 Hz–100 kHz with 20 points per decade. The excitation signal was a sinusoidal voltage with 25 mV peak and the DC forward bias voltages were the averages values of the data obtained from RLC method (see Section 3.2). The irradiance on the solar cell is obtained using a halogen bulb. The distance between the halogen bulb and the solar cell was modified in order to vary the level of irradiance. The measurements were obtained at the constant temperature of 25 °C. For the Nyquist plot fitting obtained through the IS method, the simplified circuit from Figure 2 was used.
The proposed method was further tested on a Solvis SV36 multi-crystalline Si PV panel. The measurements were done in the Photovoltaic Systems Laboratory of the Department of Energy Technology, Aalborg University.
The inductor connected to the PV panel (see Figure 3) has the following parameters: L1 = 1 mH, RL = 128 mΩ. The current measurements are done using a Tektronix DPO4054B digital oscilloscope (Tektronix, Inc., Beaverton, OR, USA) with a TC0030 current probe.
The impedance spectroscopy measurements for the PV panel were performed with a HP 4284A Precision LCR Meter. This LCR meter is capable of a frequency range of 20 Hz–1 MHz and a current or voltage excitation signal range (peak value) of 50 μA–20 mA and 5 mV–2 V, respectively. The HP 4284A has a measurement accuracy of ±0.05% of full-scale value. The HP 4284A uses the self-balancing bridge method principle to determine the impedances.
The IS measurements are carried out in dark conditions, over a frequency range of 20 Hz–50 kHz (with 1 kHz resolution). The excitation signal is a sinusoidal voltage with 1 V peak. In order to avoid opening the bypass diodes—hence distorting the results—a DC forward bias of 1 V is applied.
3. Results and Discussion
3.1. Simulation Results
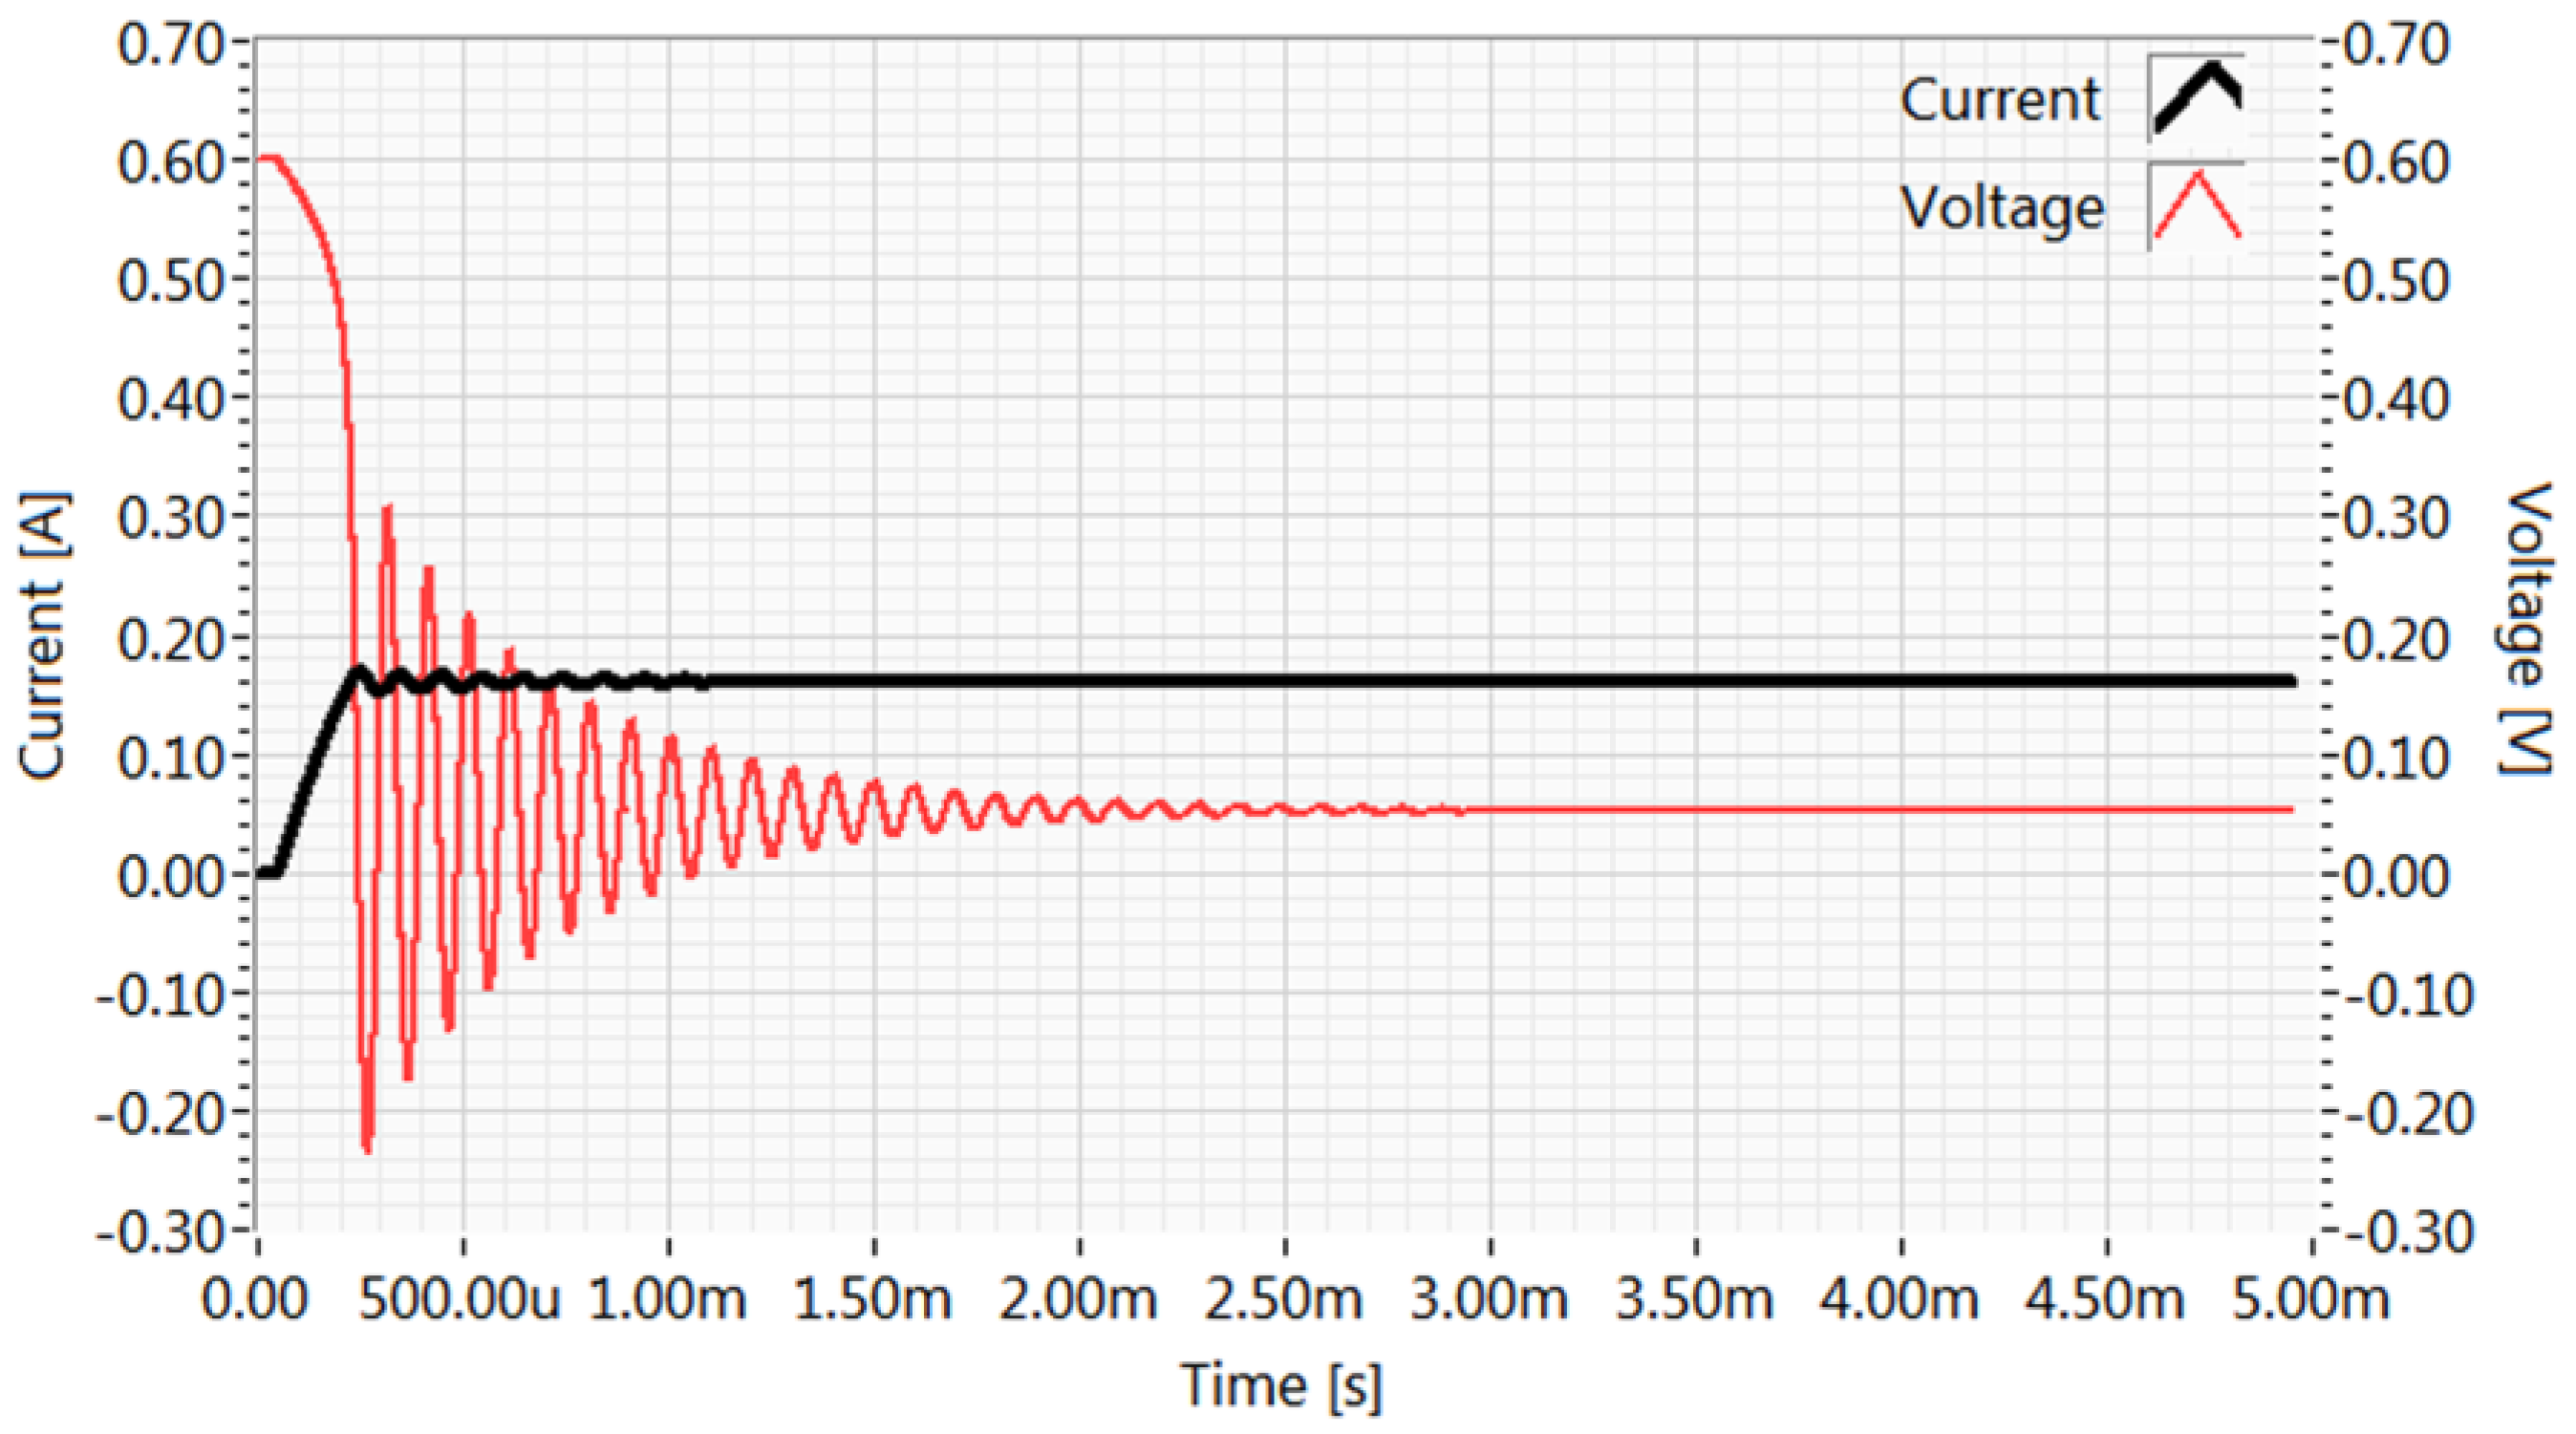
By connecting the L1 inductance to the circuit of the cell by making the S1 switch commutation (Figure 4), the voltage and current waveforms are obtained, as shown in Figure 5. The obtained signals are underdamped oscillating signals. The oscillation is around the values of V ≈ 0 and I ≈ I1 for voltage and for current, respectively. The value of the balance point for the voltage (Vpol) is dependent on the short circuit current of the solar cell Isc (which is approximately equal to I1) and the series resistance of the circuit (Rc and RL):
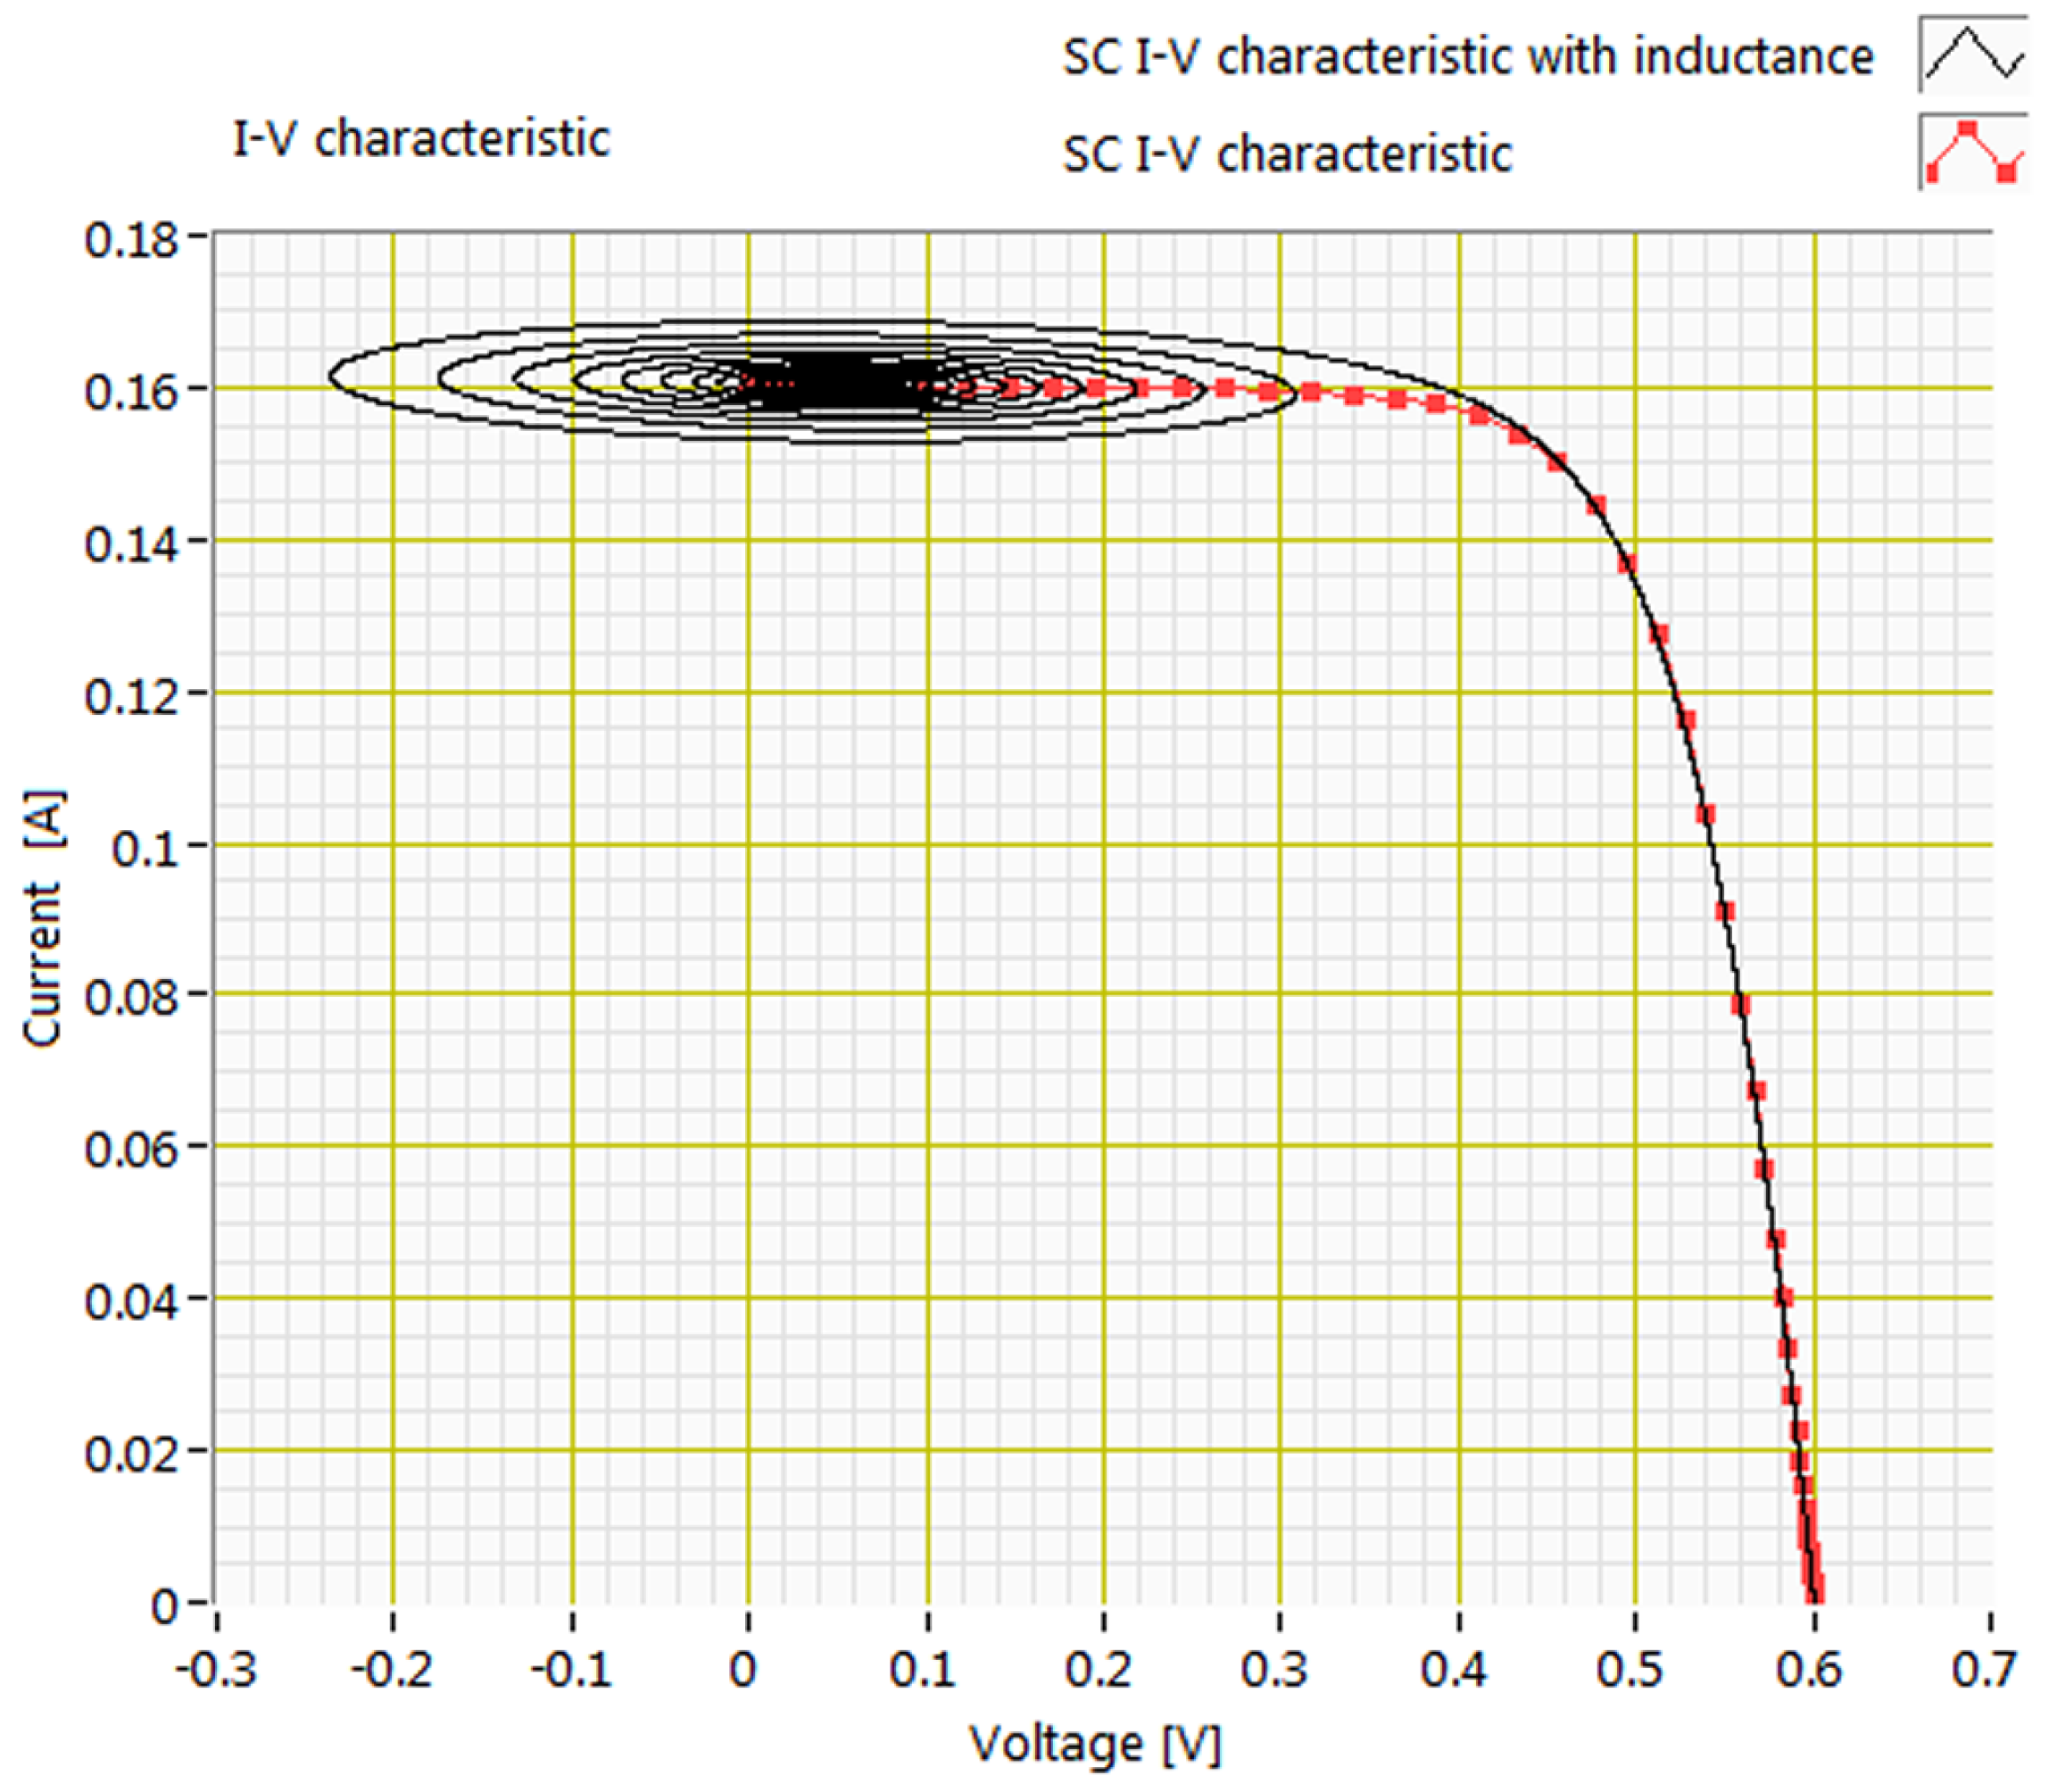
The representation of current depending on the voltage (the I-V characteristic) is shown in Figure 6. The red thin curve with square points represents the DC I-V characteristic of the solar cell, while the black thin curve represents the I-V characteristic of the solar cell obtained with the inductance.
When the L1 coil is connected to the solar cell, it acts as a very large impedance so the I-V characteristic is obtained starting from the VOC point and then continuing to the ISC point where its impedance drops significantly (equal to its internal resistance). From Figure 6 one can observe that L1 acts as a variable load for the solar cell starting from large impedance and varying towards small impedance. The underdamped oscillation of the formed RLC circuit is obtained around the value Vpol. By determining the frequency of the voltage signal, the logarithmic decrement of the oscillation and by using Equation (7), the capacitance of the solar cell can be determined. The values of the components used in the circuit of the solar cell SC1 were: Rsh = 777 Ω, Cp = 433 nF and Rs = 143 mΩ, while R1 = 100 mΩ. Table 1 presents the values resulted after processing the data obtained from simulations. In these simulations the photogenerated current I1 was set at different values.
Table 2 shows the results obtained after using different inductances. One can notice that the resonant frequency changes (according to Equation (3)), thus resulting in the possibility of studying the variation of Cp with frequency (the domain being 10 kHz–52 kHz for the chosen coils and for chosen solar cell (SC)).
The effect that the errors in the inductance and resonant frequency determination have over the solar cell capacitance calculation is studied through simulation. Therefore, if the inductance determination has an error of 10%, the error in the capacitance calculation is 9.1%. In the case of a 10% error in the resonant frequency determination, it introduces a 17.4% error in the capacitance calculation.
3.2. Experimental Results
For the solar cell study the measurements were taken at five levels of irradiance. On each level, four different coils were used. The inductances of the used coils are: 21, 100, 271, and 566 μH.
Table 3 shows the results obtained through the analysis of the measurements made on the monocrystalline silicon solar cell.
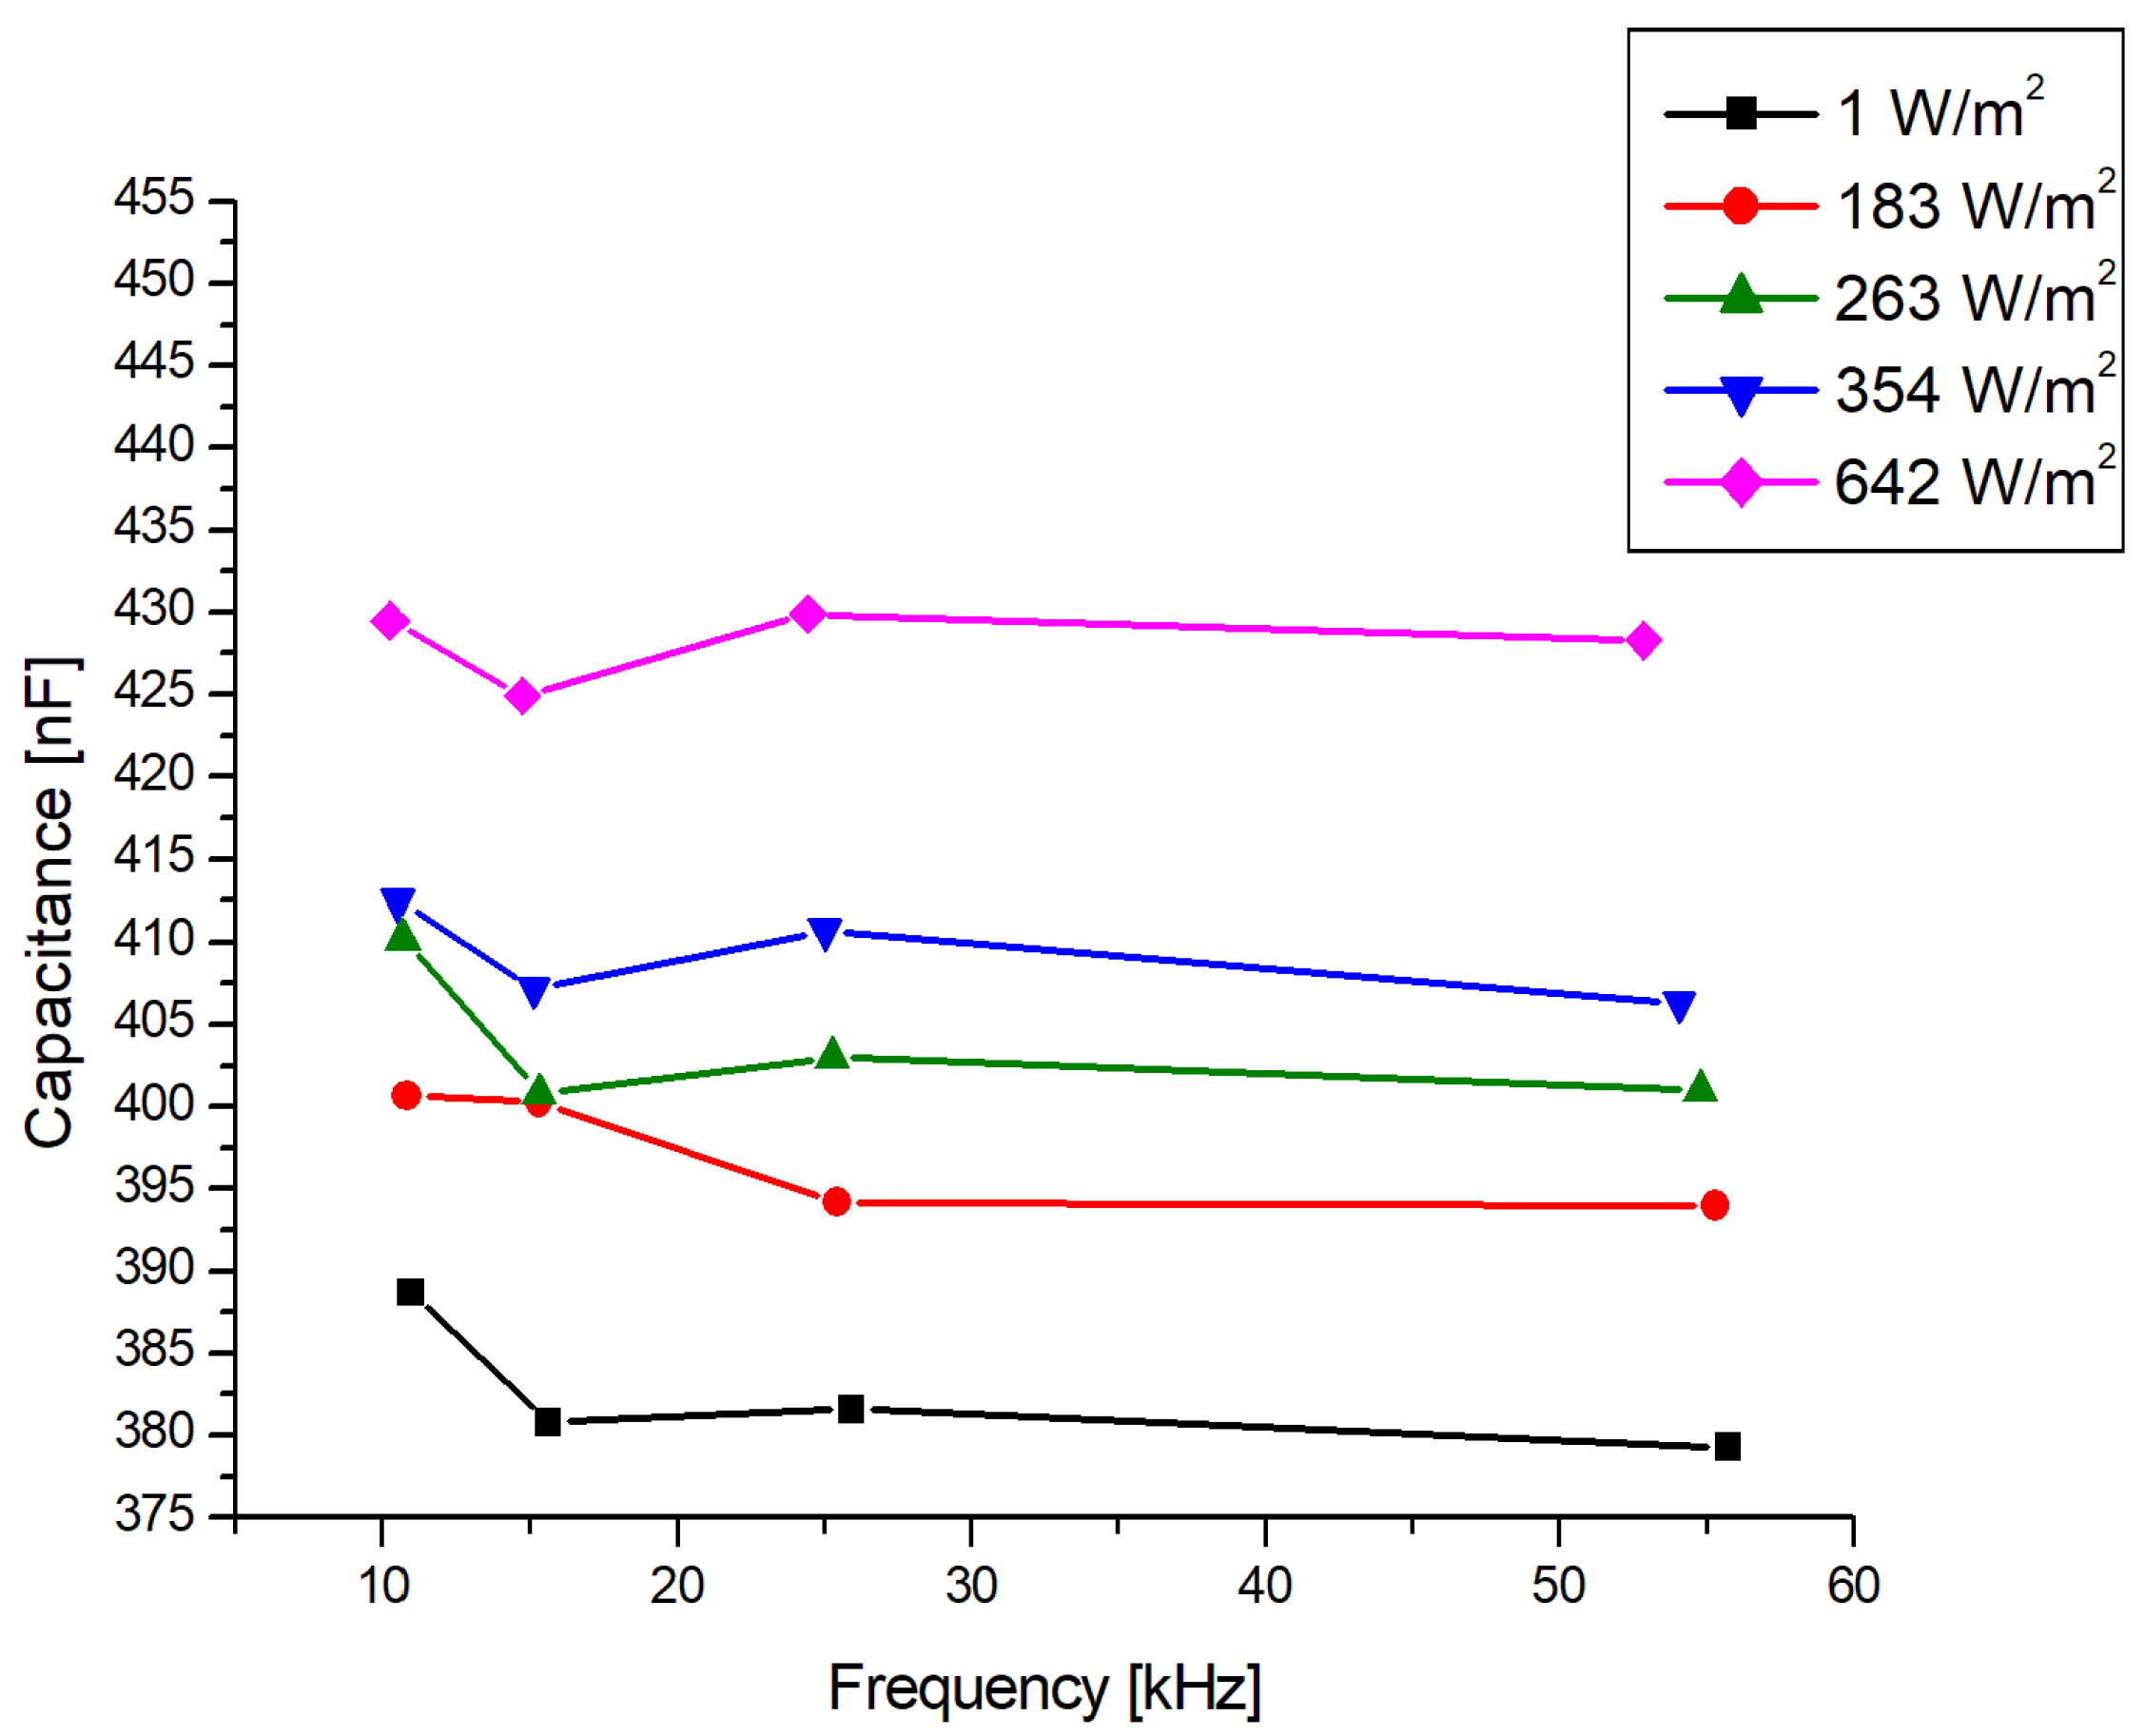
The data from Table 3 regarding the solar cell capacitance are plotted as shown in Figure 7. From the curves, one can observe that the capacitance of the solar cell increases with the level of the irradiance, and decreases very slowly with the frequency in the used range, as it was also obtained in [27,28,29,30,33].
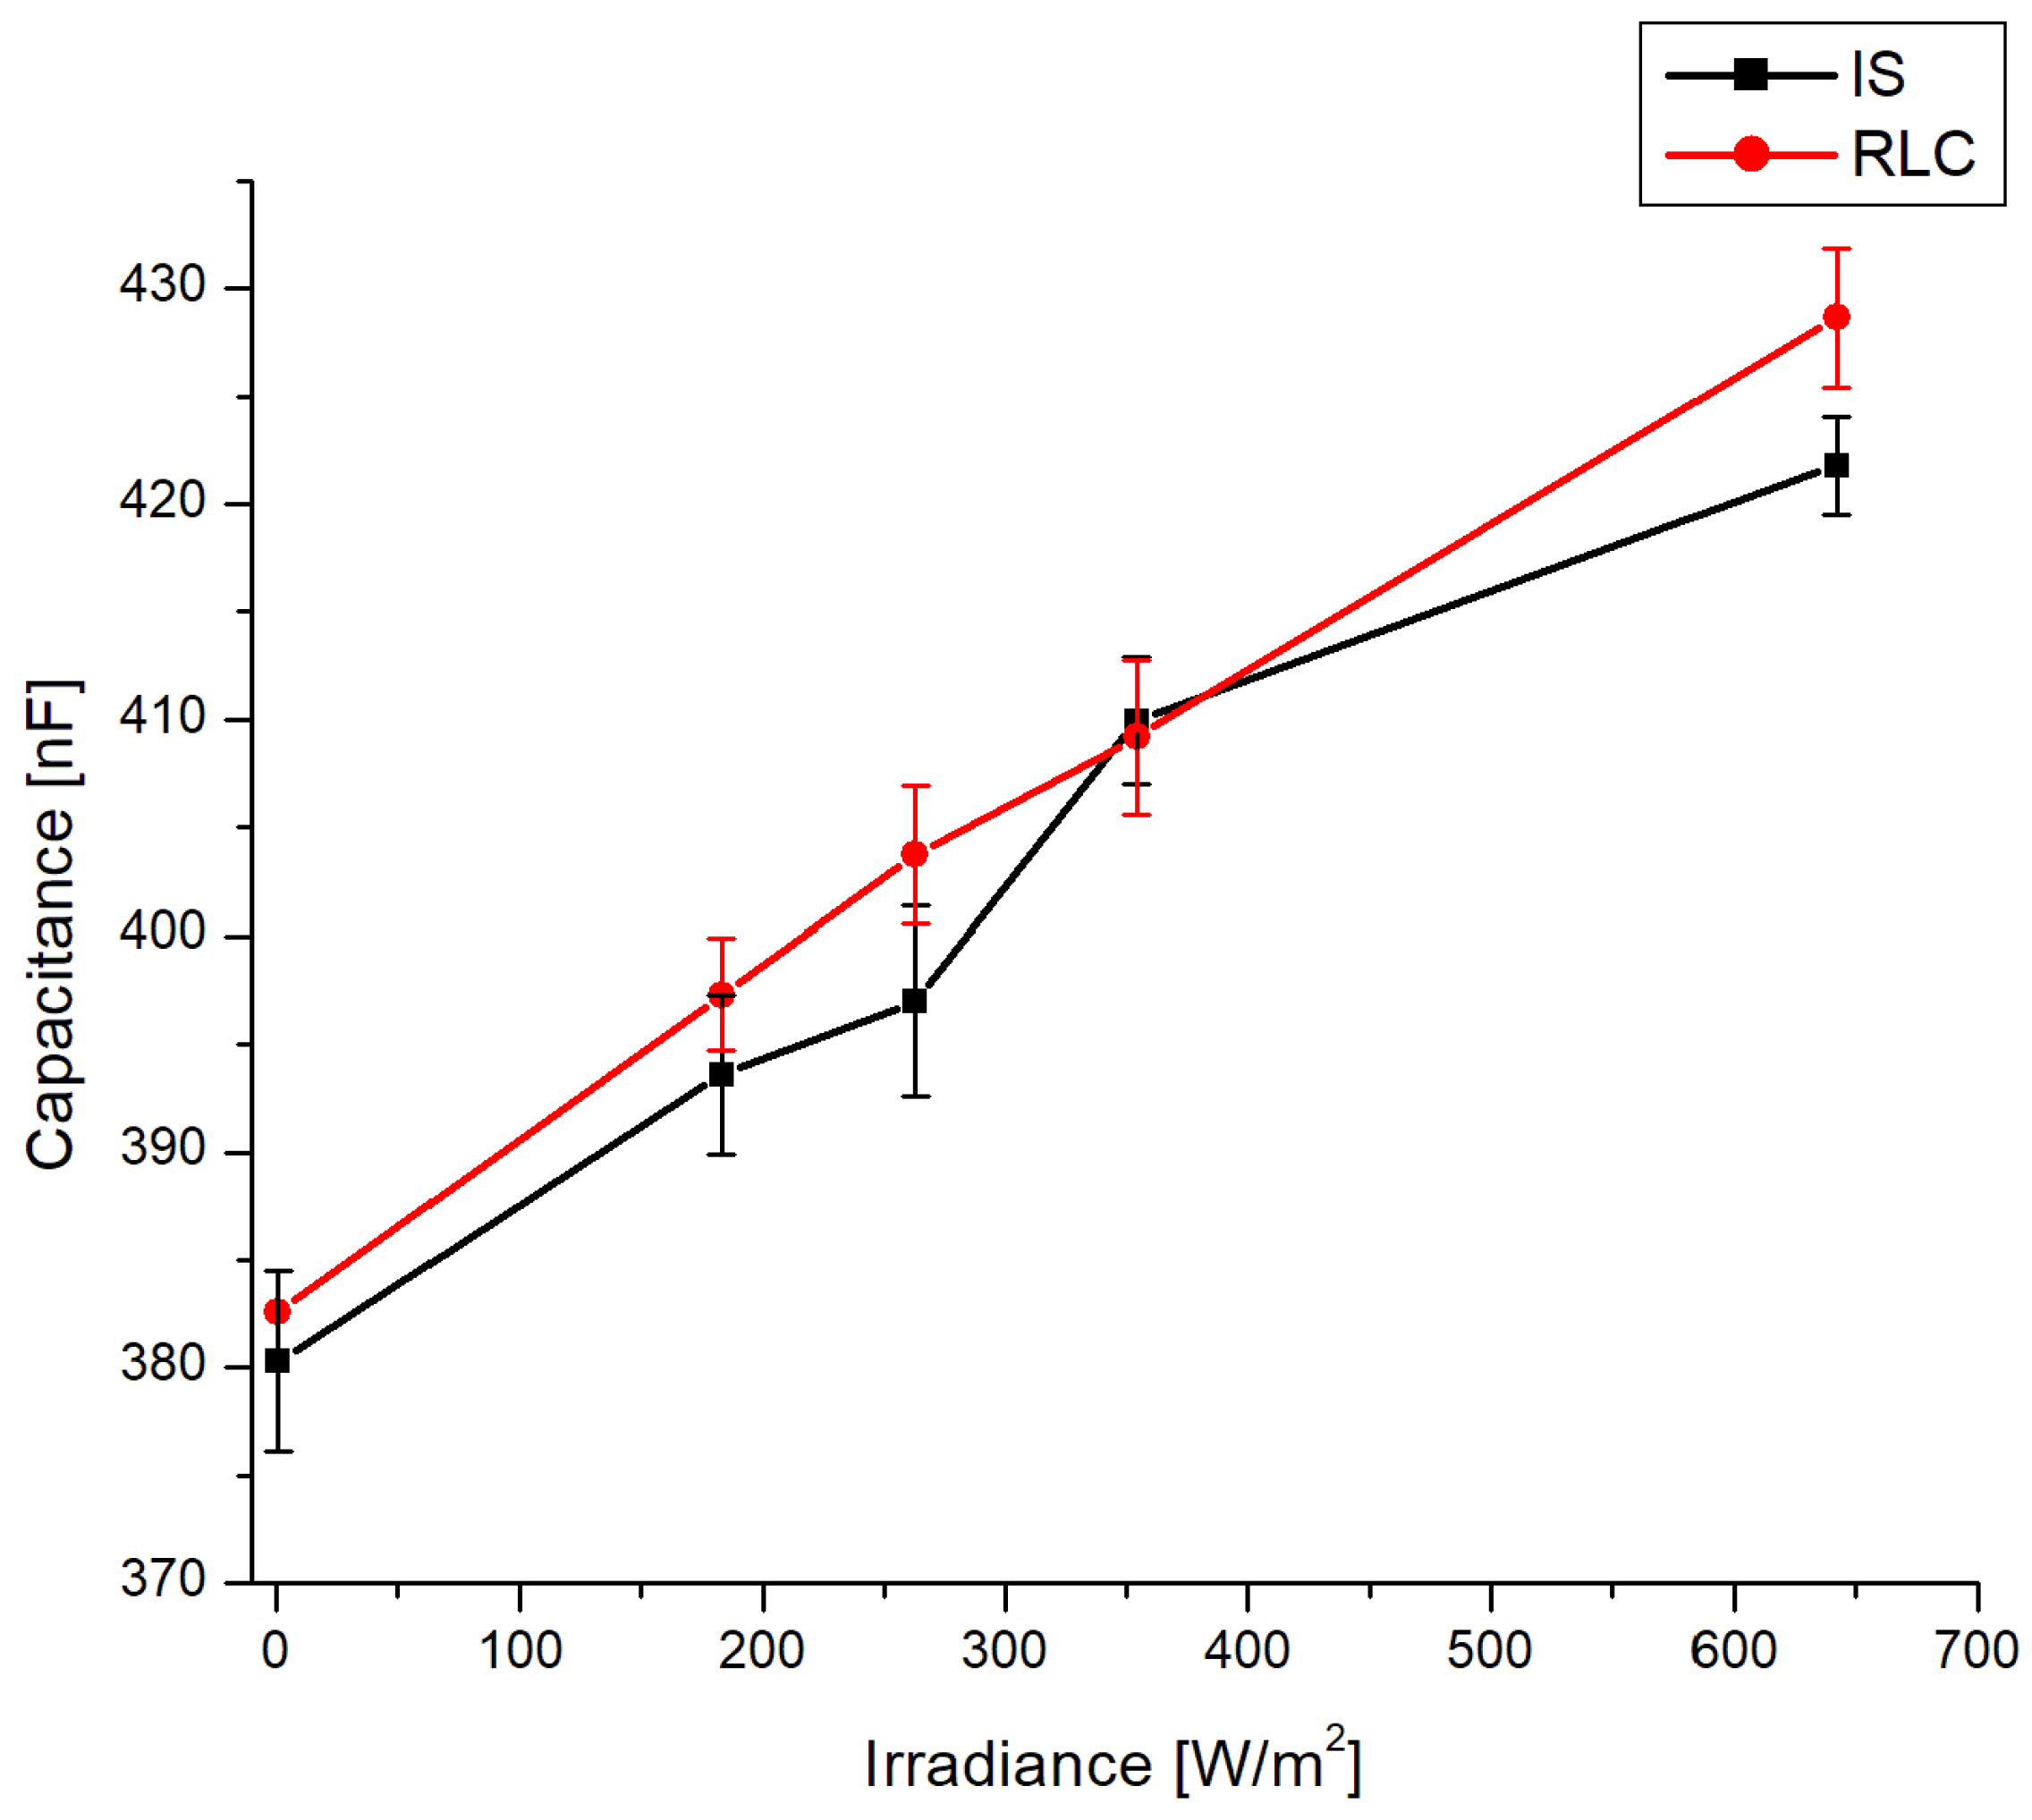
The comparison between the results obtained, based on the impedance spectroscopy method for solar cell characterization and the results obtained using the proposed method, is shown in Figure 8. For this graph, the average solar cell capacitances over all resonant frequencies for every irradiance level were used; the vertical bars denote the standard deviation for the results obtained through both methods. The differences between the capacitances obtained through the two methods are small. The average value of the errors of the capacitances obtained through the IS and RLC methods is 1.01%. These differences are due to the parasitic capacitance of the external circuit including the coil capacitance, which is connected in parallel with the solar cell capacitance, increasing the determined capacitance, and also due to the measurement error of the coil inductance value and the frequency of the signal.
The proposed method is also verified by determining the photovoltaic panel capacitance and the results obtained again show very good agreement with the reference IS measurement. The PV panel measurements were conducted at a 10 W/m2 irradiance level using a coil with the inductance of 1 mH. The capacitance obtained through the RLC method was 246.4 nF at 10.14 kHz and Vpol = 15 mV, while the capacitance obtained through the IS method was 272.5 nF. The results obtained from the two methods are close, with an error of 9.6%. This error can be explained by the differences in the test condition (the level of illumination and the DC forward bias voltage).
The PV panel capacitance has a small value (in comparison with the individual solar cell DUT—see Table 3). This can be explained by the series connection of all solar cells in the panel that implies the series connection of their capacitances. Therefore, even though the area of cells within the Solvis SV36 panel is much higher (~243.4 cm2) compared to the individual cell (7.9 cm2), the resulting overall capacitance of the panel is smaller than that of the cell.
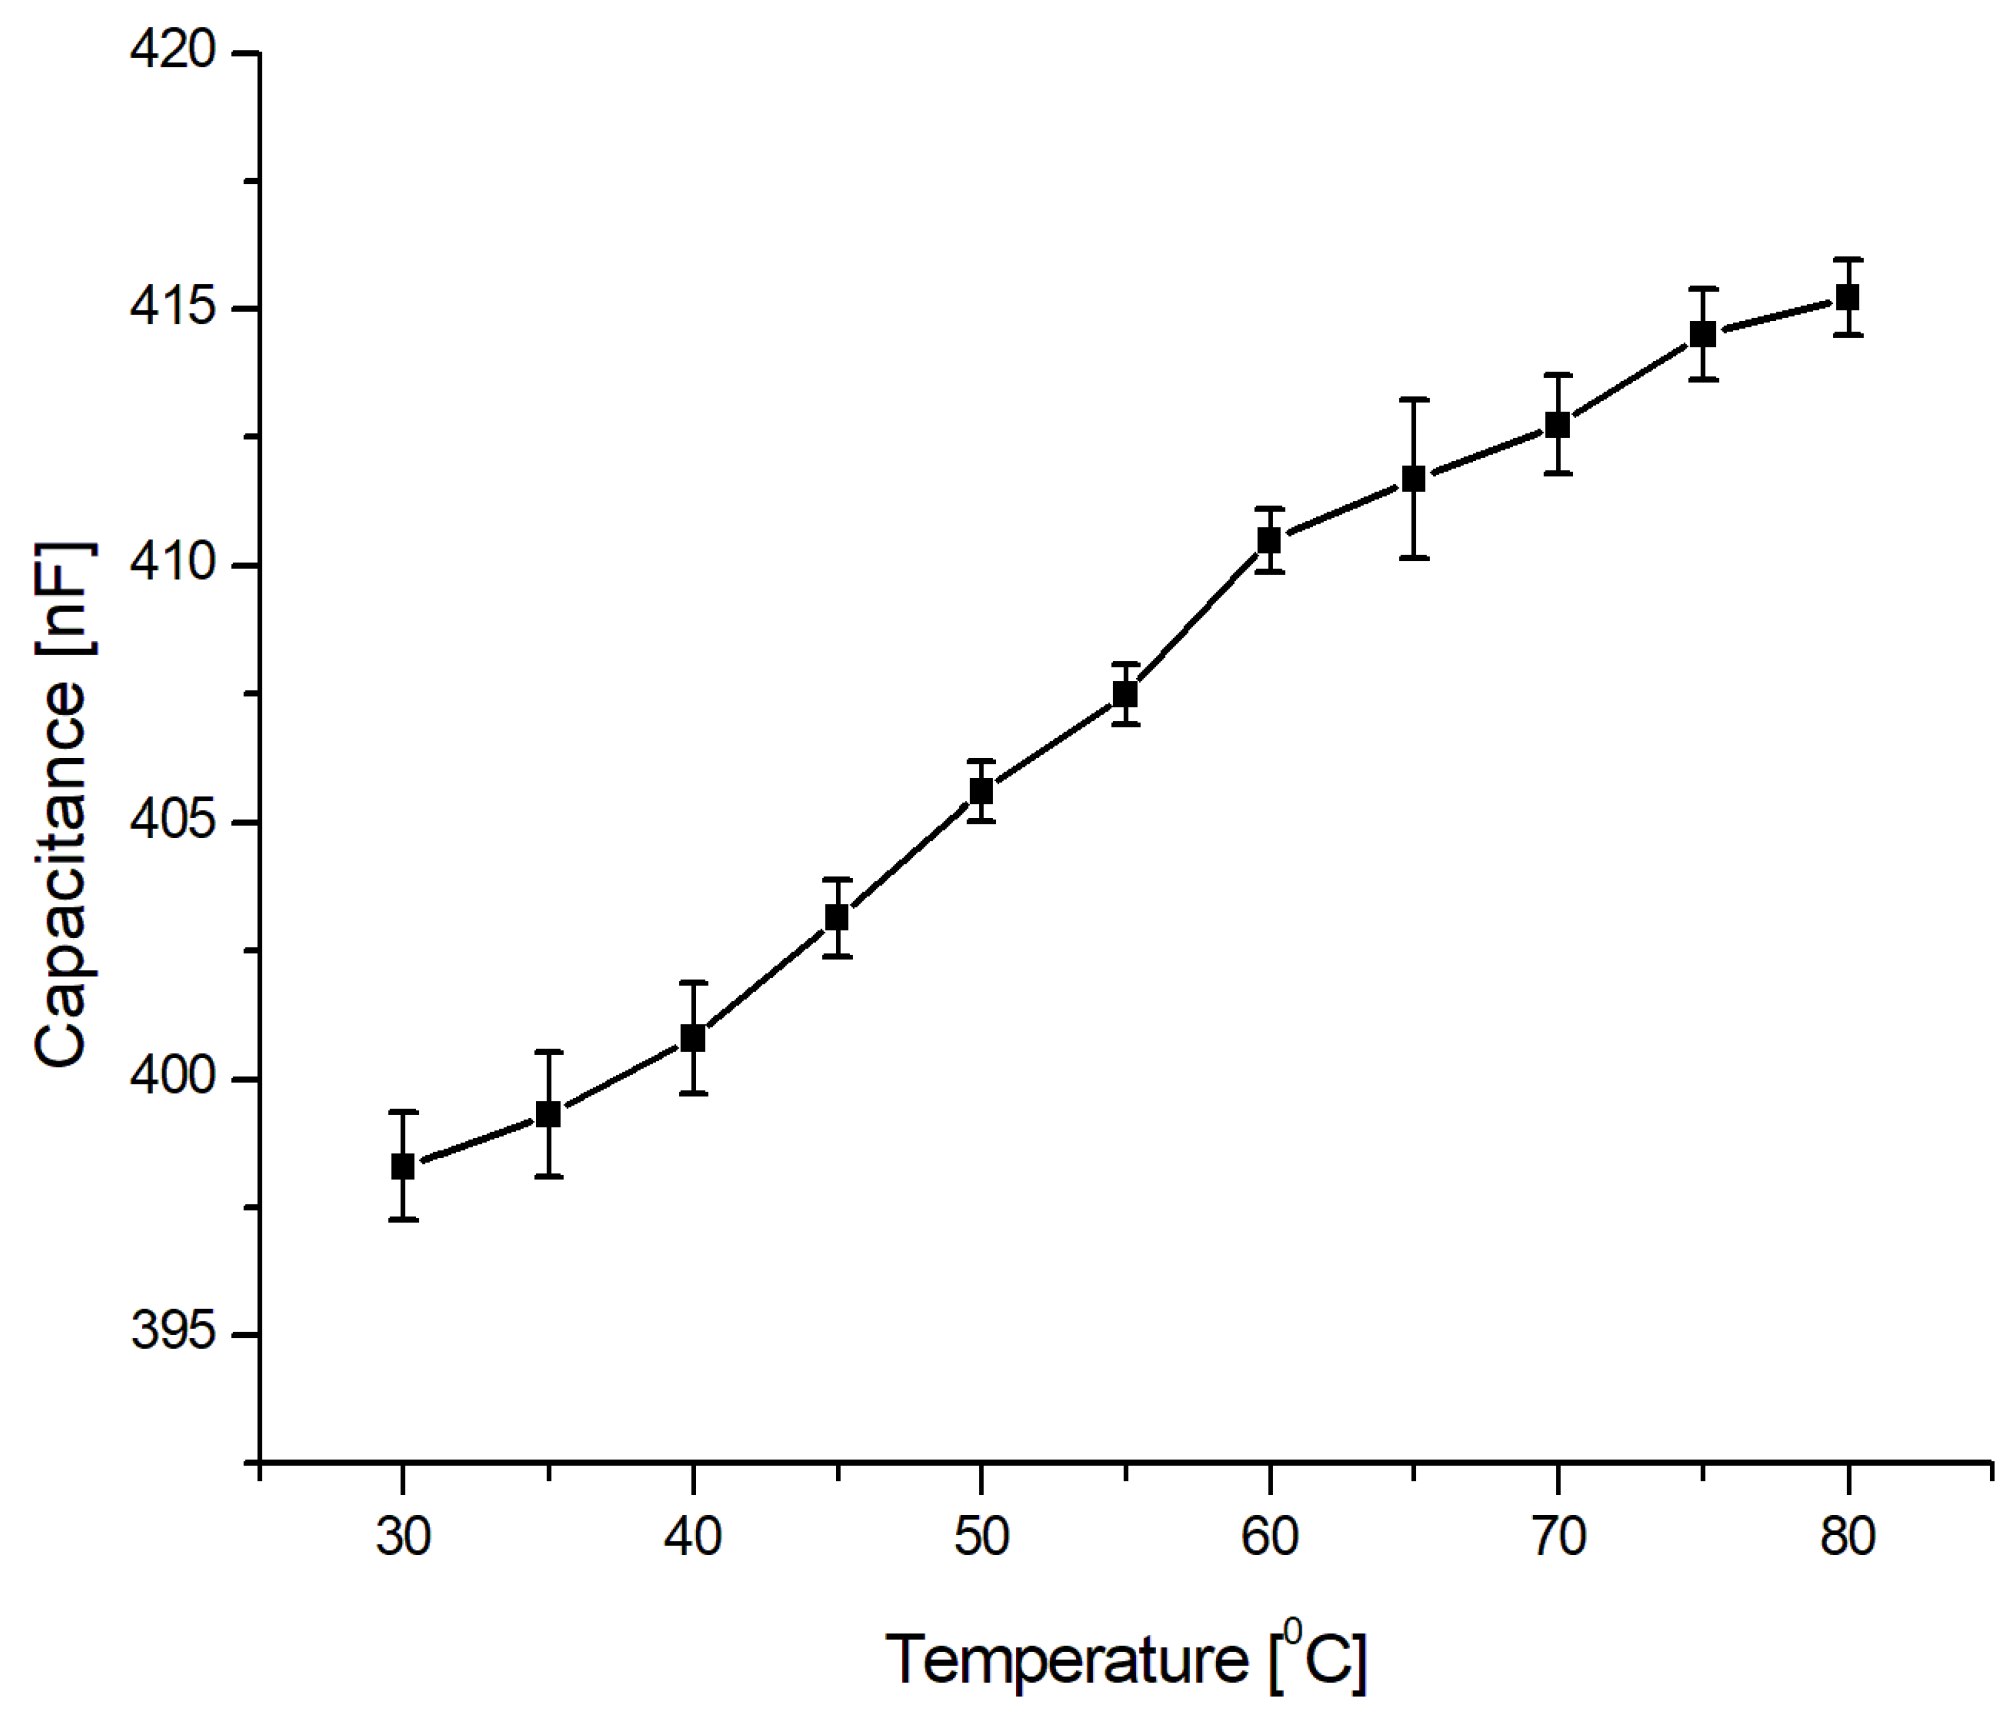
The effect of temperature on the solar cell capacitance was studied at a 183 W/m2 irradiance level using two coils with inductances of 271 μH, and of 21 μH, respectively. Due to the small forward bias voltage (see Table 3) the predominant capacitance is the transition capacitance. The transition capacitance is given by the following equation:
where B is a constant [32], Vd is cell voltage, V0 is the built-in voltage and n is equal to 1/2 for abrupt junction and 1/3 for graded junction. The dependence of CT on temperature can be expressed as a fourth-degree polynomial:
where Ki, i = 1 … 4, are constants [31].
For the experiment, the temperature was varied in the range of 30–80 °C, in steps of 5 °C, using a PID (Proportional–Integral–Derivative) thermostat. For each step, the temperature was maintained constant for 10 min before measuring. The average solar cell capacitances obtained with the two coils and their standard deviation in function of the temperature are shown in Figure 9. From the graph, one can observe that the capacitance of the studied solar cell increases with the temperature. Similar results are reported in [18,30,31].
4. Conclusions
The electric capacitance represents a key dynamic parameter of PV modules and should be studied due to the fact that it can offer information about the health status and quality of the PV modules. In this paper, we proposed a new method, called the RLC method, which allows the determination of the solar cells and PV panels’ capacitance. The RLC method is relatively easy to implement and does not require any external signal injection into the DUT, which can significantly decrease the cost of the method. The capacitance values obtained by using this method are in accordance with the results obtained based on the impedance spectroscopy methods. The average error between the two methods is approximately 1% for the capacitance determination of the solar cells and 9.6% for the photovoltaic panels. Using different inductors, the solar cells and PV panels’ capacitance could be determined at different frequencies, with only a minor reduction (1.1%) of the estimated capacitance value in the used frequency range (10–56 kHz). Experimental results show that the solar cell capacitance increases from 382 nF to 428 nF as the irradiance increases from 1 W/m2 to 642 W/m2. Additionally, the results show that the capacitance for the studied solar cell increases with the temperature.
The RLC method can be applied under light conditions, starting from irradiance levels below 10 W/m2.
One drawback of the method is that the damping coefficient β should always be smaller than the resonant frequency ω0, in order to obtain underdamped oscillation. Additionally, it is necessary to use coils with different inductance values to get the capacitance over different frequencies.
The accuracy of the solar cell capacitance calculation is strongly affected by the accuracy of the inductance and the resonant frequency determination.
Author Contributions
All the authors contributed to the publishing of this paper. Petru Adrian Cotfas contributed to the development of the RLC method, made the simulations and measurements and wrote the paper. Daniel Tudor Cotfas contributed to the development of the RLC method theory and to the writing of the paper and performed the data analysis. Paul Nicolae Borza conducted the IS measurements for the solar cells. Dezso Sera made the IS measurements and data analysis for the PV panel. Remus Teodorescu supervised the research and edited the paper.
Conflicts of Interest
The authors declare no conflict of interest.
References
- MacGill, I.; Watt, M. Economics of Solar PV Systems with Storage, in Main Grid and Mini-Grid Settings. In Solar Energy Storage; Sørensen, B., Ed.; Academic Press: London, UK, 2015; Chapter 10; pp. 225–244. ISBN 978-0-12-409540-3. [Google Scholar]
- Gude, V.G.; Nirmalakhandan, N.; Deng, S. Desalination using solar energy: Towards sustainability. Energy 2011, 36, 78–85. [Google Scholar] [CrossRef]
- Das, N.; Wongsodihardjo, H.; Islam, S. Photovoltaic cell modeling for maximum power point tracking using MATLAB/Simulink to improve the conversion efficiency. In Proceedings of the IEEE Power and Energy Society General Meeting (PES 2013), Vancouver, BC, Canada, 21–25 July 2013. [Google Scholar]
- Das, N.; Wongsodihardjo, H.; Islam, S. Modeling of multi-junction photovoltaic cell using MATLAB/Simulink to improve the conversion efficiency. Renew. Energy 2015, 74, 917–924. [Google Scholar] [CrossRef]
- Al-Nimr, M.; Al-Ammari, W. A novel hybrid PV-distillation system. Sol. Energy 2016, 135, 874–883. [Google Scholar] [CrossRef]
- Cotfas, D.T.; Cotfas, P.A.; Kaplanis, S. Methods to determine the dc parameters of solar cells: A critical review. Renew. Sustain. Energy Rev. 2013, 28, 588–596. [Google Scholar] [CrossRef]
- Cotfas, D.T.; Cotfas, P.A.; Kaplanis, S. Methods and techniques to determine the dynamic parameters of solar cells: Review. Renew. Sustain. Energy Rev. 2016, 61, 213–221. [Google Scholar] [CrossRef]
- Yadav, P.; Pandey, K.; Bhatt, V.; Kumar, M.; Kim, J. Critical aspects of impedance spectroscopy in silicon solar cell characterization: A review. Renew. Sustain. Energy Rev. 2017, 76, 1562–1578. [Google Scholar] [CrossRef]
- Chan, D.S.H.; Phillips, J.R.; Phang, J.C.H. A comparative study of extraction methods for solar cell model parameters. Solid-State Electron. 1986, 29, 329–337. [Google Scholar] [CrossRef]
- Raj, S.; Kumar, S.A.; Panchal, A.K. Solar cell parameters estimation from illuminated I-V characteristic using linear slope equations and Newton-Raphson technique. J. Renew. Sustain. Energy 2013, 5, 255–265. [Google Scholar] [CrossRef]
- Cubas, J.; Pindado, S.; Manuel, C. Explicit Expressions for Solar Panel Equivalent Circuit Parameters Based on Analytical Formulation and the Lambert W-Function. Energies 2014, 7, 4098–4115. [Google Scholar] [CrossRef]
- Mughal, M.A.; Ma, Q.; Xiao, C. Photovoltaic Cell Parameter Estimation Using Hybrid Particle Swarm Optimization and Simulated Annealing. Energies 2017, 10, 1213. [Google Scholar] [CrossRef]
- Ye, M.; Wang, X.; Xu, Y. Parameter extraction of solar cells using particle swarm optimization. J. Appl. Phys. 2009, 105, 094502. [Google Scholar] [CrossRef]
- Zagrouba, M.; Sellami, A.; Bouaïcha, M.; Ksouri, M. Identification of PV solar cells and modules parameters using the genetic algorithms: Application to maximum power extraction. Sol. Energy 2010, 84, 860–866. [Google Scholar] [CrossRef]
- Hasanien, H.M. Shuffled frog leaping algorithm for photovoltaic model identification. IEEE Trans. Sustain. Energy 2015, 6, 509–515. [Google Scholar] [CrossRef]
- Yu, K.; Chen, X.; Wang, X.; Wang, Z. Parameters identification of photovoltaic models using self-adaptive teaching-learning-based optimization. Energy Convers. Manag. 2017, 145, 233–246. [Google Scholar] [CrossRef]
- Kumar, R.A.; Suresh, M.S.; Nagaraju, J. Measurement and comparison of AC parameters of silicon (BSR and BSFR) and gallium arsenide (GaAs/Ge) solar cells used in space applications. Sol. Energy Mater. Sol. Cells 2000, 60, 155–165. [Google Scholar] [CrossRef]
- Kumar, R.A.; Suresh, M.S.; Nagaraju, J. Silicon (BSFR) solar cell AC parameters at different temperatures. Sol. Energy Mater. Sol. Cells 2005, 85, 397–406. [Google Scholar] [CrossRef]
- Kumar, R.A.; Suresh, M.S.; Nagaraju, J. Time domain technique to measure solar cell capacitance. Rev. Sci. Instrum. 2003, 74, 3516–3519. [Google Scholar] [CrossRef]
- Deshmukh, M.P.; Kumar, R.A.; Nagarajua, J. Measurement of solar cell ac parameters using the time domain technique. Rev. Sci. Instrum. 2004, 75, 2732–2735. [Google Scholar] [CrossRef]
- Chenvidhya, D.; Limsakul, C.; Thongpron, J.; Kirtikara, K.; Jivacate, C. Determination of solar cell dynamic parameters from time domain responses. In Proceedings of the Technical Digest of the 14th International Photovoltaic Science and Engineering Conference (PVSEC14), Bangkok, Thailand, 26–30 January 2004. [Google Scholar]
- Oprea, M.I.; Spataru, S.V.; Sera, D.; Poulsen, P.B.; Thorsteinsson, S.; Basu, R.; Andersen, A.R.; Frederiksen, K.H.B. Detection of potential induced degradation in c-Si PV panels using electrical impedance spectroscopy. In Proceedings of the IEEE 43rd Photovoltaic Specialists Conference (PVSC), Portland, OR, USA, 5–10 June 2016; pp. 1575–1579. [Google Scholar]
- Bhat, P.S.; Rao, A.; Sanjeev, G.; Usha, G.; Priya, G.K.; Sankaran, M.; Puthanveettil, S.E. Capacitance and conductance studies on silicon solar cells subjected to 8 MeV electron irradiations. Radiat. Phys. Chem. 2015, 111, 28–35. [Google Scholar] [CrossRef]
- Kim, K.A.; Seo, G.S.; Cho, B.H.; Krein, P.T. Photovoltaic Hot-Spot Detection for Solar Panel Substrings Using AC Parameter Characterization. IEEE Trans. Power Electron. 2016, 31, 1121–1130. [Google Scholar] [CrossRef]
- Osawa, S.; Nakano, T.; Matsumoto, S.; Katayama, N.; Saka, Y.; Sato, H. Fault diagnosis of photovoltaic modules using AC impedance spectroscopy. In Proceedings of the IEEE International Conference on Renewable Energy Research and Applications (ICRERA), Birmingham, UK, 20–23 November 2016; pp. 210–215. [Google Scholar]
- Kumar, S.; Sareen, V.; Batra, N.; Singh, P.K. Study of C–V characteristics in thin n+-p-p+ silicon solar cell sand induced junction n-p-p+ cell structures. Sol. Energy Mater. Sol. Cells 2010, 94, 1469–1472. [Google Scholar] [CrossRef]
- Kumar, S.; Singh, P.K.; Chilana, G.S. Study of silicon solar cell at different intensities of illumination and wavelengths using impedance spectroscopy. Sol. Energy Mater. Sol. Cells 2009, 93, 1881–1884. [Google Scholar] [CrossRef]
- Burgelman, M.; Nollet, P. Admittance spectroscopy of thin film solar cells. Solid State Ion. 2005, 176, 2171–2175. [Google Scholar] [CrossRef]
- Bayhan, H.; Kavasoǧlu, A.S. Admittance and Impedance Spectroscopy on Cu(In,Ga)Se2 Solar Cells. Turk. J. Phys. 2003, 27, 529–535. [Google Scholar]
- Kumar, R.A.; Suresh, M.S.; Nagaraju, J. GaAs/Ge solar cell AC parameters under illumination. Sol. Energy 2004, 76, 417–421. [Google Scholar] [CrossRef]
- Anantha Krishna, H.; Misra, N.K.; Suresh, M.S. Use of solar cells for measuring temperature of solar cell blanket in spacecrafts. Sol. Energy Mater. Sol. Cells 2012, 102, 184–188. [Google Scholar] [CrossRef]
- Mandal, H.; Nagaraju, J. GaAs/Ge and silicon solar cell capacitance measurement using triangular wave method. Sol. Energy Mater. Sol. Cells 2007, 91, 696–700. [Google Scholar] [CrossRef]
- Panigrahi, J.; Singh, R.; Batra, N.; Gope, J.; Sharma, M.; Pathi, P.; Srivastava, S.K.; Rauthan, C.M.S.; Singh, P.K. Impedance spectroscopy of crystalline silicon solar cell: Observation of negative capacitance. Sol. Energy 2016, 136, 412–420. [Google Scholar] [CrossRef]
Figure 1.
The DC equivalent electrical circuit of a solar cell.

Figure 2.
The AC equivalent electrical circuit of a solar cell.

Figure 3.
The electrical circuit obtained connecting an inductance coil to a solar cell.

Figure 4.
The electrical circuit used to study the AC solar cell parameters.

Figure 5.
The voltage and current waveforms obtained in simulation (Cp = 0.433 μF, Rsh = 777 Ω, L1 = 566 μH, Rs = 143 mΩ, R1 = 100 mΩ).
Figure 5.
The voltage and current waveforms obtained in simulation (Cp = 0.433 μF, Rsh = 777 Ω, L1 = 566 μH, Rs = 143 mΩ, R1 = 100 mΩ).

Figure 6.
The simulated I-V characteristic obtained with the L1 as variable load.

Figure 7.
The dependence of the SC capacitance function of the frequency.

Figure 8.
SC capacitance obtained through IS and RLC methods.

Figure 9.
The variation of the solar cell capacitance depending on temperature.


Table 1.
Results obtained from simulation using a inductance L1 = 21 μH and RL = 223 mΩ.
| I1 [mA] | Cp [nF] | Vpol [mV] |
|---|---|---|
| 46 | 432.3 | 14.7 |
| 66 | 432.5 | 21.2 |
| 89 | 432.4 | 28.6 |
| 161 | 432.2 | 51.8 |
Table 2.
Results obtained from simulation using different inductances.
| Inductance [μH] | Frequency [kHz] | Cp [nF] | Vpol [mV] |
|---|---|---|---|
| 21 | 52.69 | 432.2 | 51.9 |
| 100 | 24.22 | 432.9 | 51.9 |
| 271 | 14.67 | 432.7 | 51.9 |
| 566 | 10.15 | 432.6 | 51.9 |
Table 3.
The results obtained from measurements.
| Level [W/m2] | Inductance [μH] | Frequency [kHz] | Cp [nF] | Vpol [mV] | Isc [mA] |
|---|---|---|---|---|---|
| 1.0 | 21 | 55.71 | 379.3 | ~0 | ~0 |
| 100 | 25.93 | 381.6 | ~0 | ~0 | |
| 271 | 15.63 | 380.8 | ~0 | ~0 | |
| 566 | 10.99 | 388.7 | ~0 | ~0 | |
| 183 | 21 | 55.28 | 394.0 | 14.8 | 46.0 |
| 100 | 25.45 | 394.2 | 14.5 | 46.0 | |
| 271 | 15.31 | 400.3 | 15.9 | 46.0 | |
| 566 | 10.83 | 400.7 | 16.7 | 46.0 | |
| 263 | 21 | 54.78 | 401.0 | 21.4 | 66.0 |
| 100 | 25.28 | 403.0 | 21.3 | 66.0 | |
| 271 | 15.32 | 400.8 | 22.5 | 66.0 | |
| 566 | 10.70 | 410.2 | 23.6 | 66.0 | |
| 354 | 21 | 54.07 | 406.3 | 29.1 | 89.0 |
| 100 | 25.03 | 410.7 | 28.6 | 89.0 | |
| 271 | 15.13 | 407.2 | 30.5 | 89.0 | |
| 566 | 10.55 | 412.5 | 33.2 | 89.0 | |
| 642 | 21 | 52.82 | 428.3 | 54.0 | 161.0 |
| 100 | 24.45 | 429.9 | 51.9 | 161.0 | |
| 271 | 14.75 | 424.9 | 56.1 | 161.0 | |
| 566 | 10.27 | 429.5 | 60.3 | 161.0 |
© 2018 by the authors. Licensee MDPI, Basel, Switzerland. This article is an open access article distributed under the terms and conditions of the Creative Commons Attribution (CC BY) license (http://creativecommons.org/licenses/by/4.0/).
Share and Cite
MDPI and ACS Style
Cotfas, P.A.; Cotfas, D.T.; Borza, P.N.; Sera, D.; Teodorescu, R. Solar Cell Capacitance Determination Based on an RLC Resonant Circuit. Energies 2018, 11, 672. https://doi.org/10.3390/en11030672
AMA Style
Cotfas PA, Cotfas DT, Borza PN, Sera D, Teodorescu R. Solar Cell Capacitance Determination Based on an RLC Resonant Circuit. Energies. 2018; 11(3):672. https://doi.org/10.3390/en11030672
Chicago/Turabian StyleCotfas, Petru Adrian, Daniel Tudor Cotfas, Paul Nicolae Borza, Dezso Sera, and Remus Teodorescu. 2018. "Solar Cell Capacitance Determination Based on an RLC Resonant Circuit" Energies 11, no. 3: 672. https://doi.org/10.3390/en11030672
Note that from the first issue of 2016, this journal uses article numbers instead of page numbers. See further details here.