1. Introduction
Fermentation is an anaerobic respiration process carried out by many types of bacteria and fungi. Fermentation, by definition, is a disproportionation reaction. Ethanol fermentation is carried out by yeasts, including
Saccharomyces cerevisiae [
1,
2,
3,
4,
5]. Yeasts are able to ferment hexoses and some oligosaccharides, e.g., sucrose, maltose, or inulin, at specific conditions. A decreased pH value or the presence of inhibiting fermentation products, i.e., ethanol, influences the growthabilities of
Saccharomyces cerevisiae. At ethanol concentrations up to 120 g/L,
Saccharomyces are capable of performing fermentationand they areable to grow at ethanol concentrations up to 200 g/L [
6,
7,
8].
The current global demand for biofuels is largely covered by the production of first-generation bioethanol from sucrose or starch contained in such raw materials as sugar cane, wheat, or corn. An interesting alternative is the production of the second-generation bioethanol as a result of fermentation processes from lignocellulosic waste. Lignocellulose, the most abundant renewable carbohydrate-rich biomass, is accumulated in large quantities from agricultural, forestry, or municipal activities and do not compete with food crops. It is also less expensive than conventional agricultural feedstocks. However, according to the complexity of the chemical structure, lignocellulosic biomass is resistant to biodegradation. Cellulose, hemicellulose, and lignin, main components of lignocellulosic complex, are strongly intermeshed and bonded trough covalent and non-covalent bonds. Lignin is the major barrier to make the carbohydrate components (cellulose and hemicellulose) suitable for bioconversion [
9,
10]. Therefore, the pre-treatment step has a large impact on subsequent enzymatic hydrolysis and fermentation steps [
11]. It should improve the formation of sugars, be effective in the removal of lignin, and produce no, or limited amounts of, products that inhibit the action of the hydrolitic enzymes or the growth of fermentative microorganisms. Pre-treatment methods can be classsified as biological, physical, chemical, and physico-chemical processes. A combination of different pre-treatment methods have also been considered [
12].
The main goal of alkaline treatment, one of the most common chemical pre-treatment methods, is to remove lignin from the biomass [
13]. The action of alkaline reagents leads tothe degradation of side chains of esters and glycosides and then to the structural modification of lignin, cellulose swelling, cellulose decrystallization, and hemicellulose solvation. Ca(OH)
2 also removes acetyl groups from hemicellulose, reducing steric hindrance and increasing the availability of the enzyme to the surface of hemicellulose and cellulose. These methods are more effective for cellulose digestibility and for lignin solubilization, exhibiting minor cellulose and hemicellulose dissolution than acid or hydrothermal processes [
9]. The advantage of alkaline methods is their low cost, especially when using Ca(OH)
2. The limitation is that alkali are converted into un-salted or introduced as biomass salts after the pre-treatment and, therefore, thewater consumption for salt removal from biomass is high. The lignin removal step is nessesary to avoid the formation of inhibitors (salts, furfural, phenolic acid, aldehydes). Abudi et al. [
14] investigated the effects of alkaline and peroxide pre-treatment of rice straw (RS). The results indicate that NaOH and H
2O
2 pre-treatmentsaffected the lignocellulose composition differentlyand are particularly effective in terms of solubilization of RS hemicellulose more than of cellulose and lignin. NaOH pre-treatment led to approximately 11%, 32%, and 22% reductions in hemicellulose, cellulose, and lignin content, respectively. In the case of H
2O
2 pre-treatment, the corresponding reductions were 16%, 41%, and 7%, respectively.
After the pre-treatment of lignocellulosic biomass, the hydrolysates are further processed by biochemical methods.During the enzymatic hydrolysis, crystalline cellulose and hemicellulose not decomposed during pretreatment, and are degraded to reducing sugars, fermentable by microorganisms. The conversion of cellulose and hemicellulose is catalysed by cellulases and hemicellulases, respectively.Cellulases are usually a mixture of several enzymes. The three predominant ones are: endo-1,4-β-glucanase, which hydrolyzes the inner β-1,4-glycosidic bonds; exo-1,4-β-glucanase, which removes mono- and dimers from the free chain-ends; and β-glucosidase (cellobiase), which hydrolyzes glucose dimers [
15,
16,
17]. Cellulose hydrolysis starts with adsorption of cellulase enzymes onto the surface of cellulose. Afterwards, cellulose isbiodegraded to the fermentable sugars and cellulase is desorbed from the biomass surface.Cellulose microfibers are surrounded by hemicellulose polysaccharides. Therefore, auxiliary enzymes that attack hemicellulose are used. In the first step, endo-1,4-β-xylanase depolimerizes xylan into xylooligosaccharides.Further, xylanases, such as β-glucuronidase, α-arabinofuranosidase, and acetyl xylan esterase, cleave side chains and side groups of heteroxylan, while galactomannanase and glucomannanase hydrolyze glucomannan [
18]. The optimal balanced combination of enzymes is needed to effectively modify the complex structure of lignocellulosic materials. In addition to the quality of the hydrolyzing enzymes, the digestibility of cellulose and hemicellulose is affected by pH, temperature, process time and porosity, degree of crystallization, and cellulose content [
19].
Saccharification of lignocellulosic biomass with an acid catalyst is also possible. The main objective of acid treatment is the solubilization of hemicellulose and making cellulose accessible to enzymes. Acid hydrolysis is an alternative for enzymatic hydrolysis, as acid hydrolyzes biomass to fermentable sugars. However, intensive washing is required to remove the acid before fermentation is performed. The advantage of using acids is their low price and availability. Additionally, the use of organic acids (formic, acetic, maleic) makes the process environmentally friendly [
20]. The disadvantage is the need to neutralize the used acid by alkali, which generates a stream of reagents, or by vacuum distillation, in order to reuse the acid. Another disadvantage of using acid hydrolysisis is the possibility of the formation of fermentation inhibitors, especially when high acid concentrations, high temperatures, and long reaction times are applied [
21,
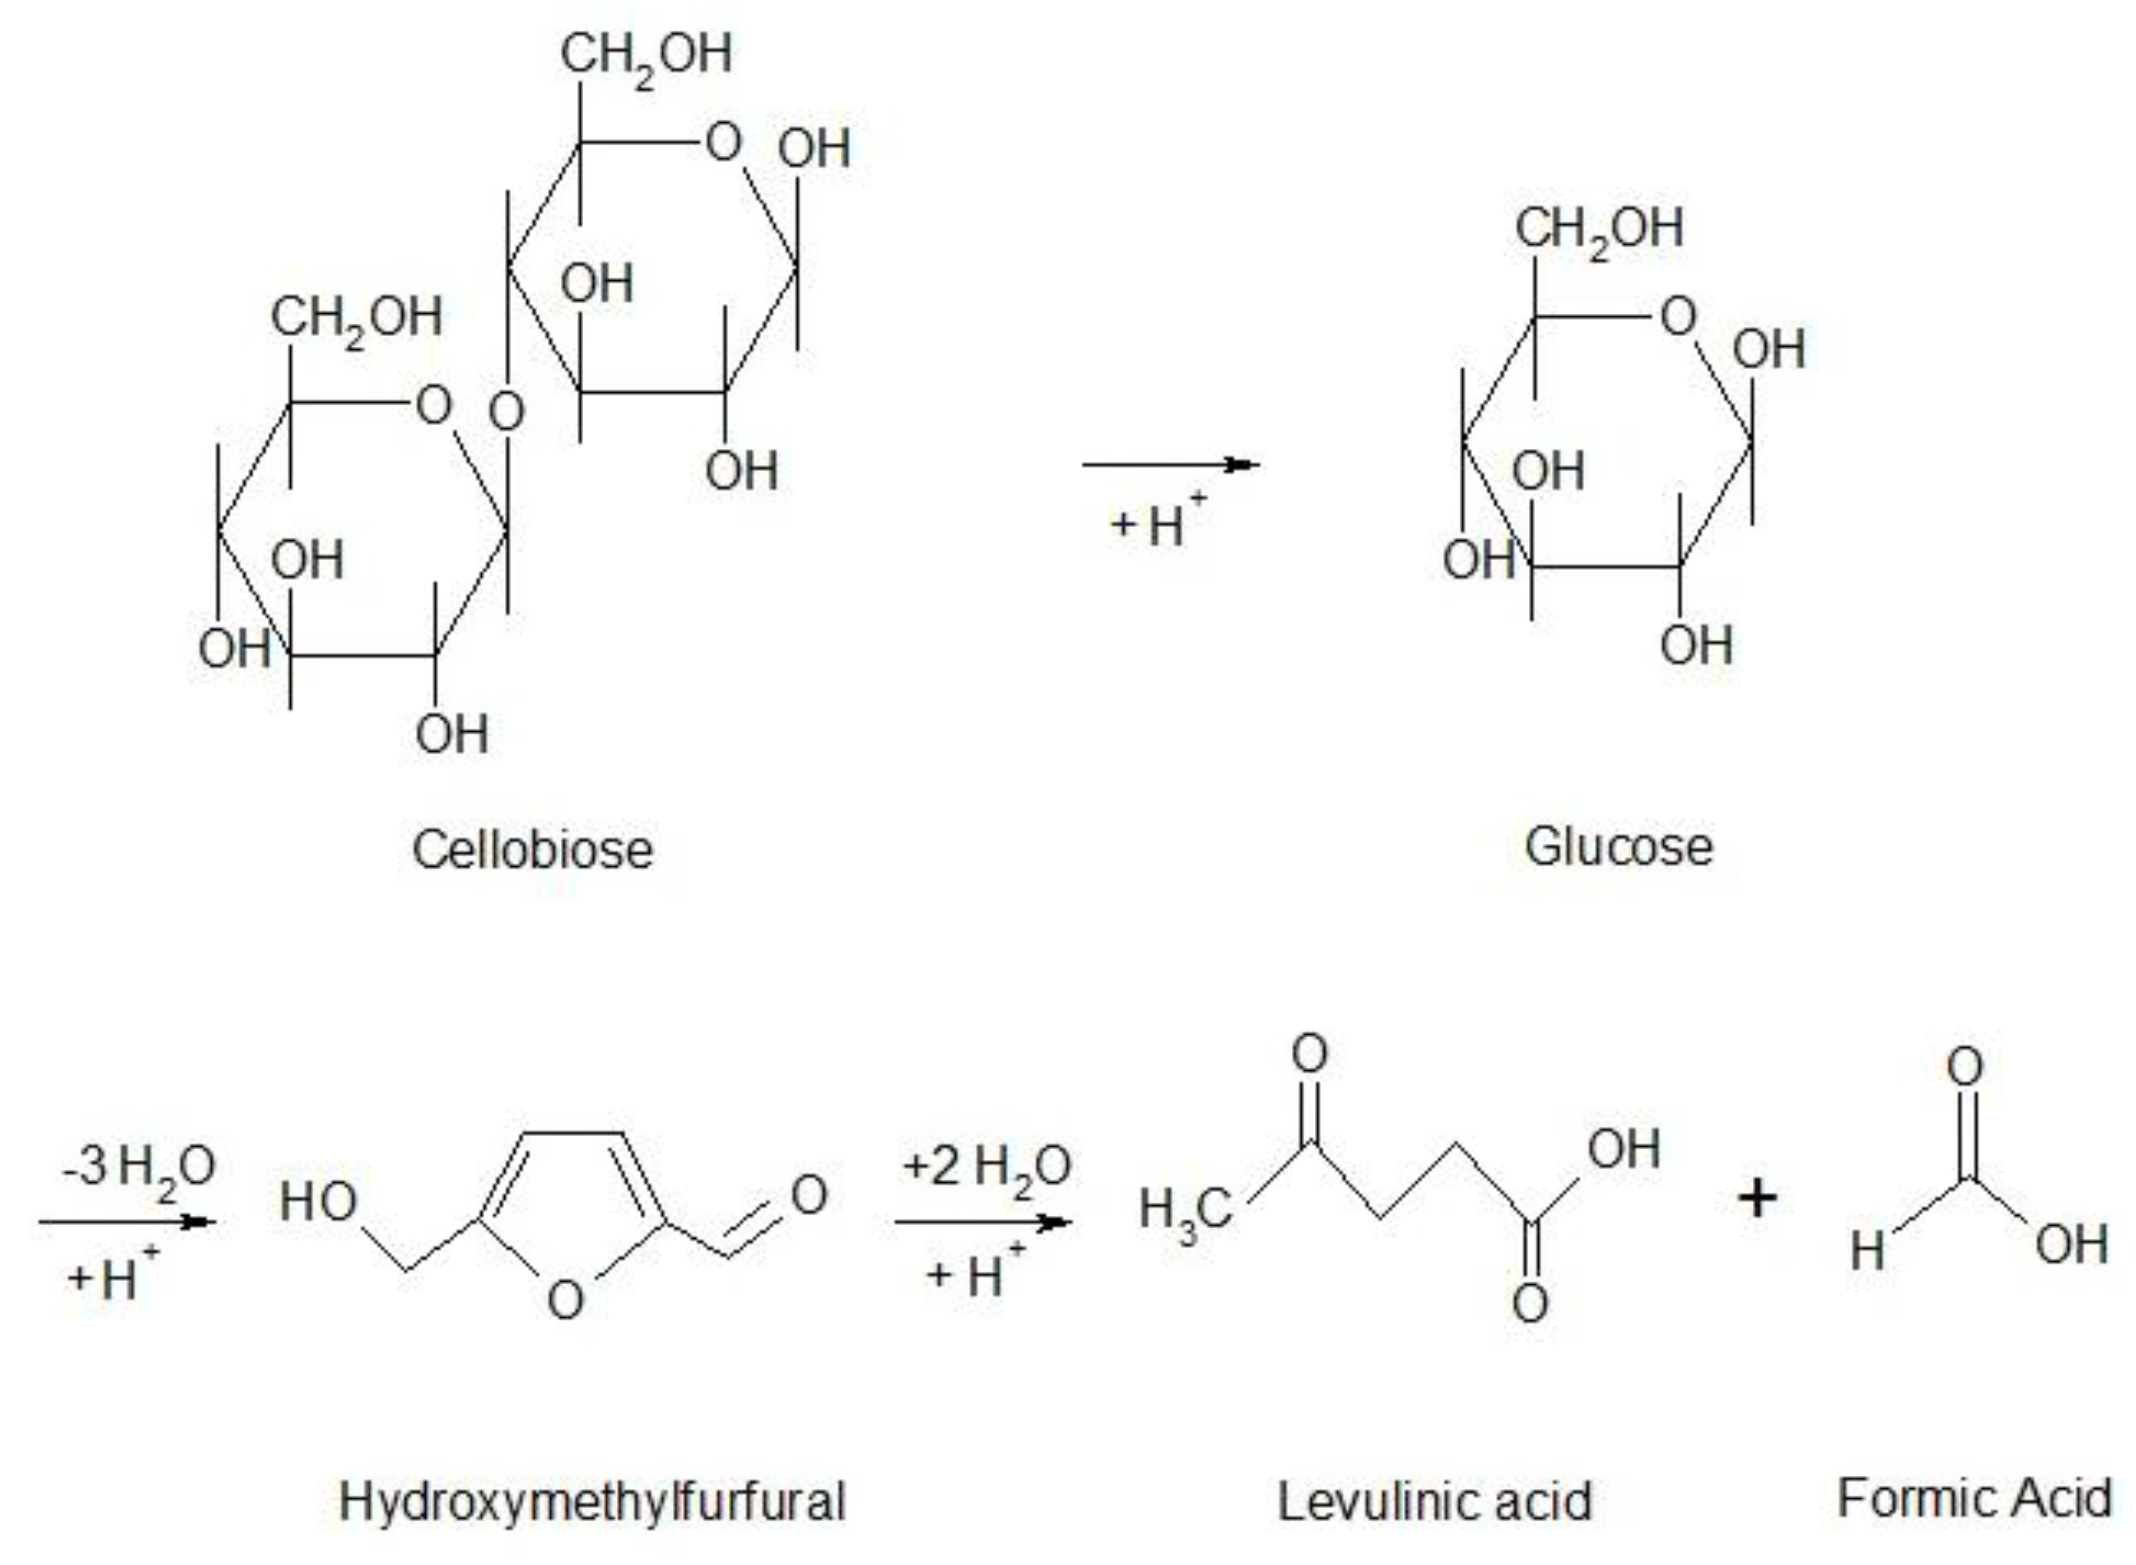
22]. During acid hydrolysis, the acid catalyzes the breakdown of glycosidic bonds between sugar residues, followed by the breakdown of released glucose to form hydroxymethylfurfural (HMF), formic acid (FA), and levulinic acid (LA) (
Figure 1) [
23]. Compounds, such as furfural, 5-HMF, and phenolic compoundsaffect the microorganism metabolism in the fermentation step. Dilute acid pre-treatment is more favourable for industrial applications due to the reduction of the operational and maintenance costs(corrosion problems). Additionally, this kind of pre-treatment generates fewerdegradation compounds than the concentrated acid pre-treatment [
18,
24,
25].
The lignocellulosic hydrolysates are very attractive as a substrate for fermentative conversion processes to bioethanol. The results of the latest research on the production of bioethanol from waste lignocellulosic biomass are presented in
Table 1.
Currently, lignocellulosic biomass is regarded as the forward-looking, large-scale available non-fossil carbon source for biofuels production. Therefore, there is a strong motivation for research into industrially and economically viable processes for conversion of biomass to fuels, including bioethanol. However, successful and effective conversion of lignocellulosic biomass to monosaccharides in high yields is still a challenge. Acid or enzymatic hydrolysis of biomass polysaccharides after a pre-treatment stage are the main currently-investigated saccharification methods [
32,
33,
34,
35,
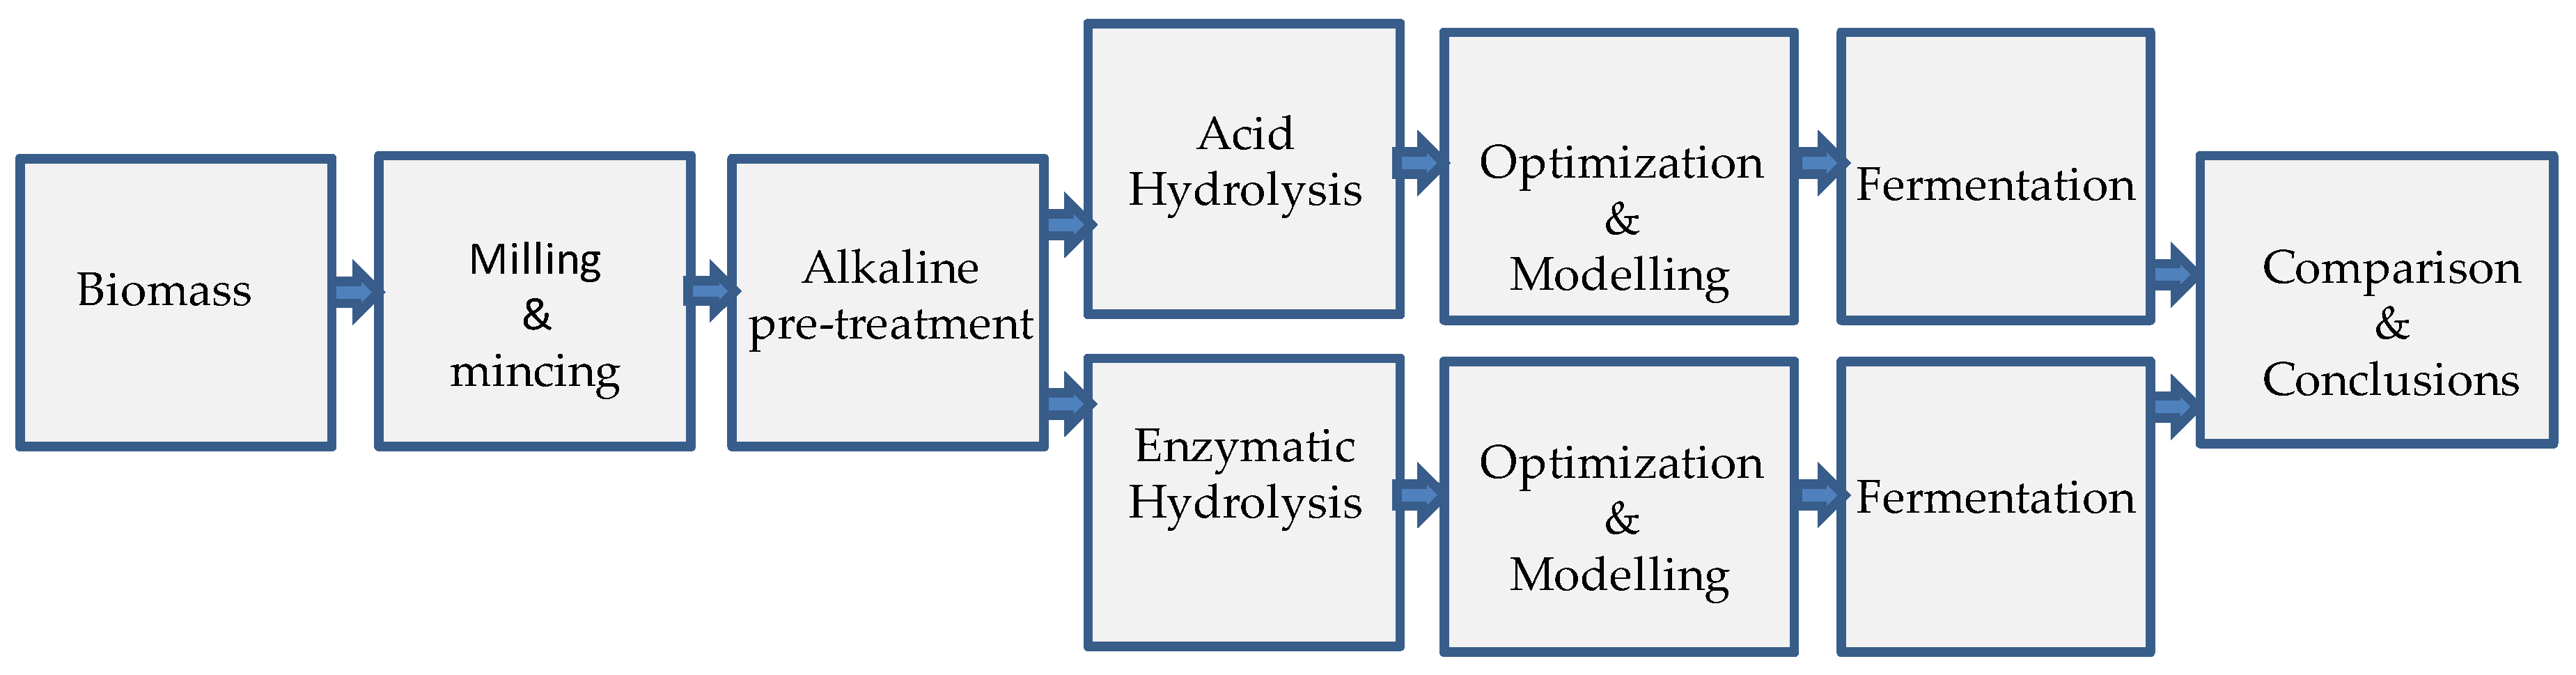
36]. Therefore, the primary objective of the present study is the comparison of the efficiency of two-stage hydrolysis processes, i.e., alkaline pre-treatment followed by acid hydrolysis, as well as alkaline pre-treatment followed by enzymatic hydrolysis, carried out in order to obtain reducing sugars from triticale straw. The comparison is to concern not only results obtained for mono sugars, but for bioethanol as well.
The aim of the work is also to examine the course and efficiency of the enzymatic hydrolysis using cellulolytic enzymes immobilized on diatomite. This procedure is intended to reduce process costs through the possibility of enzyme regeneration and reuse.
The optimization of the conditions of the two-stage hydrolysis and the evaluation of the influence of process parameters on the glucose yield were performed according to the Box-Behnken design for the following variables: concentration of NaOH, duration time of acid hydrolysis, temperature of acid hydrolysis, the content of Viscozyme L, and the duration time of the enzymatic hydrolysis process. Finally, the parameters’ significance on the performance of sugars were optimized using the response surface methodology. The effect of acid hydrolysis conditions on the content of typical fermentation inhibitors, including 5-HMF, furfural, and the total phenolic compounds was investigated. Additionally, pre-treatment and hydrolysis effects were evaluated by performing bioethanol fermentation on previously-obtained hydrolysates.
2. Results and Discussion
2.1. Biomass Characterisation
Milled and minced lignocellulosic biomass (triticale straw Triticum sp., originated from Wejherowo, Poland) was used in this study. The determined composition of the Triticum sp. was found to be: 43.6% cellulose, 23% hemicellulose, 21.5% lignin, 8.3% water extractives, 8.6% ethanol extractives, 1.2% ash, and a moisture content of 6.2% (on dry weight basis). Hemicellulose content was found as follows: xylose (18.1%), galactose (4.1%), and mannose with arabinose (0.8%).
2.2. Influence of Alkaline Pre-Treatment Conditions of the Chemical Composition of Triticale Straw
The optimization of the two-stage hydrolysis conditions and the evaluation of the influence of process parameters on the glucose yield were made for two test systems. In the first system, alkaline pre-treatment and acid hydrolysis were carried out, while, in the second system, alkaline pre-treatment followed by enzymatic hydrolysis. In both cases, the alkaline pre-treatment was carried out for six hours at a constant temperature of 65 °C. The treatment was carried out for the catalyst concentrations (NaOH) of 1%, 6%, and 11%. In the first stage of the research, the effect of alkaline pre-treatment on the change of triticale straw composition was determined. For this purpose, the composition of biomass (reducing sugars and lignin contents), as well as the degree of lignin removal, the degree of cellulose and hemicellulose recoveries were determined in the residue remaining after the alkaline treatment. The results (
Table 2) indicate that an increase in the concentration of NaOH causes an increase in the biomass loss of 37%, 49%, and 52%, respectively, for catalyst concentrations of 1%, 6%, and 11%. A similar dependence was obtained in [
12,
37,
38]. The research results indicate that the use of 1% NaOH already significantly lowers the lignin content. A further increase in the catalyst concentration above 1% does not significantly affect the lignin removal. The alkaline pre-treatment of the material influences the change in the proportion of the sugar polymer content. The use of 1% NaOH allows the content of all reducing sugars to increase. For NaOH concentrations greater than 1%, a decrease in reducing sugars coming from hemicellulose with a simultaneous increase in glucose concentration is observed.
2.3. Optimisation ofAlkaline Pre-Treatment Followed by Acid Hydrolysis
For the analysis of the influence of input variables on the result of two-stage hydrolysis, i.e., alkaline treatment and acid hydrolysis, experiments (
Table 3) were performed according to the Box-Behnken design for three variables. The following boundary values were assumed for the investigated variables: concentration of NaOH 1–11% at a constant temperature of 65 °C and alkaline pre-treatment time of 6h, duration of acid hydrolysis of 0.5–8 h, and the temperature of acid hydrolysis of 60–120 °C. As an output parameter, glucose yield (G
y) was selected as a parameter describing the efficiency of the process. Additionally,
Table 3 shows the obtained values of the sum of reducing sugars.
An influence of the process parameters (NaOH concentration, temperature and duration of acid hydrolysis) on the glucose yield was investigated. On the basis of multiple regression, the Equation (1) was proposed, describing the relationships occurring during the two-stage hydrolysis.
In Equation (1), X
1, X
2, and X
3 represent sodium hydroxide concentration, temperature, and time of acid hydrolysis, respectively. Y denotes glucose efficiency. Equation (1) enables calculating the theoretical glucose yield within the range of variables according to the boundary conditions. The parameters of Equation (1) are given in
Table 4. In order to determine the effect of the parameters significance on the performance of sugars, an analysis of variance for the surface of the model's response was made. The form of Equation (1) is the result of rejecting the least significant parameters in the next iterative steps. This procedure showed that the least important parameters in such a system is the interaction between concentration of catalyst and temperature (X
1·X
2). For this interaction, the
p-value was much higher than the assumed significance level
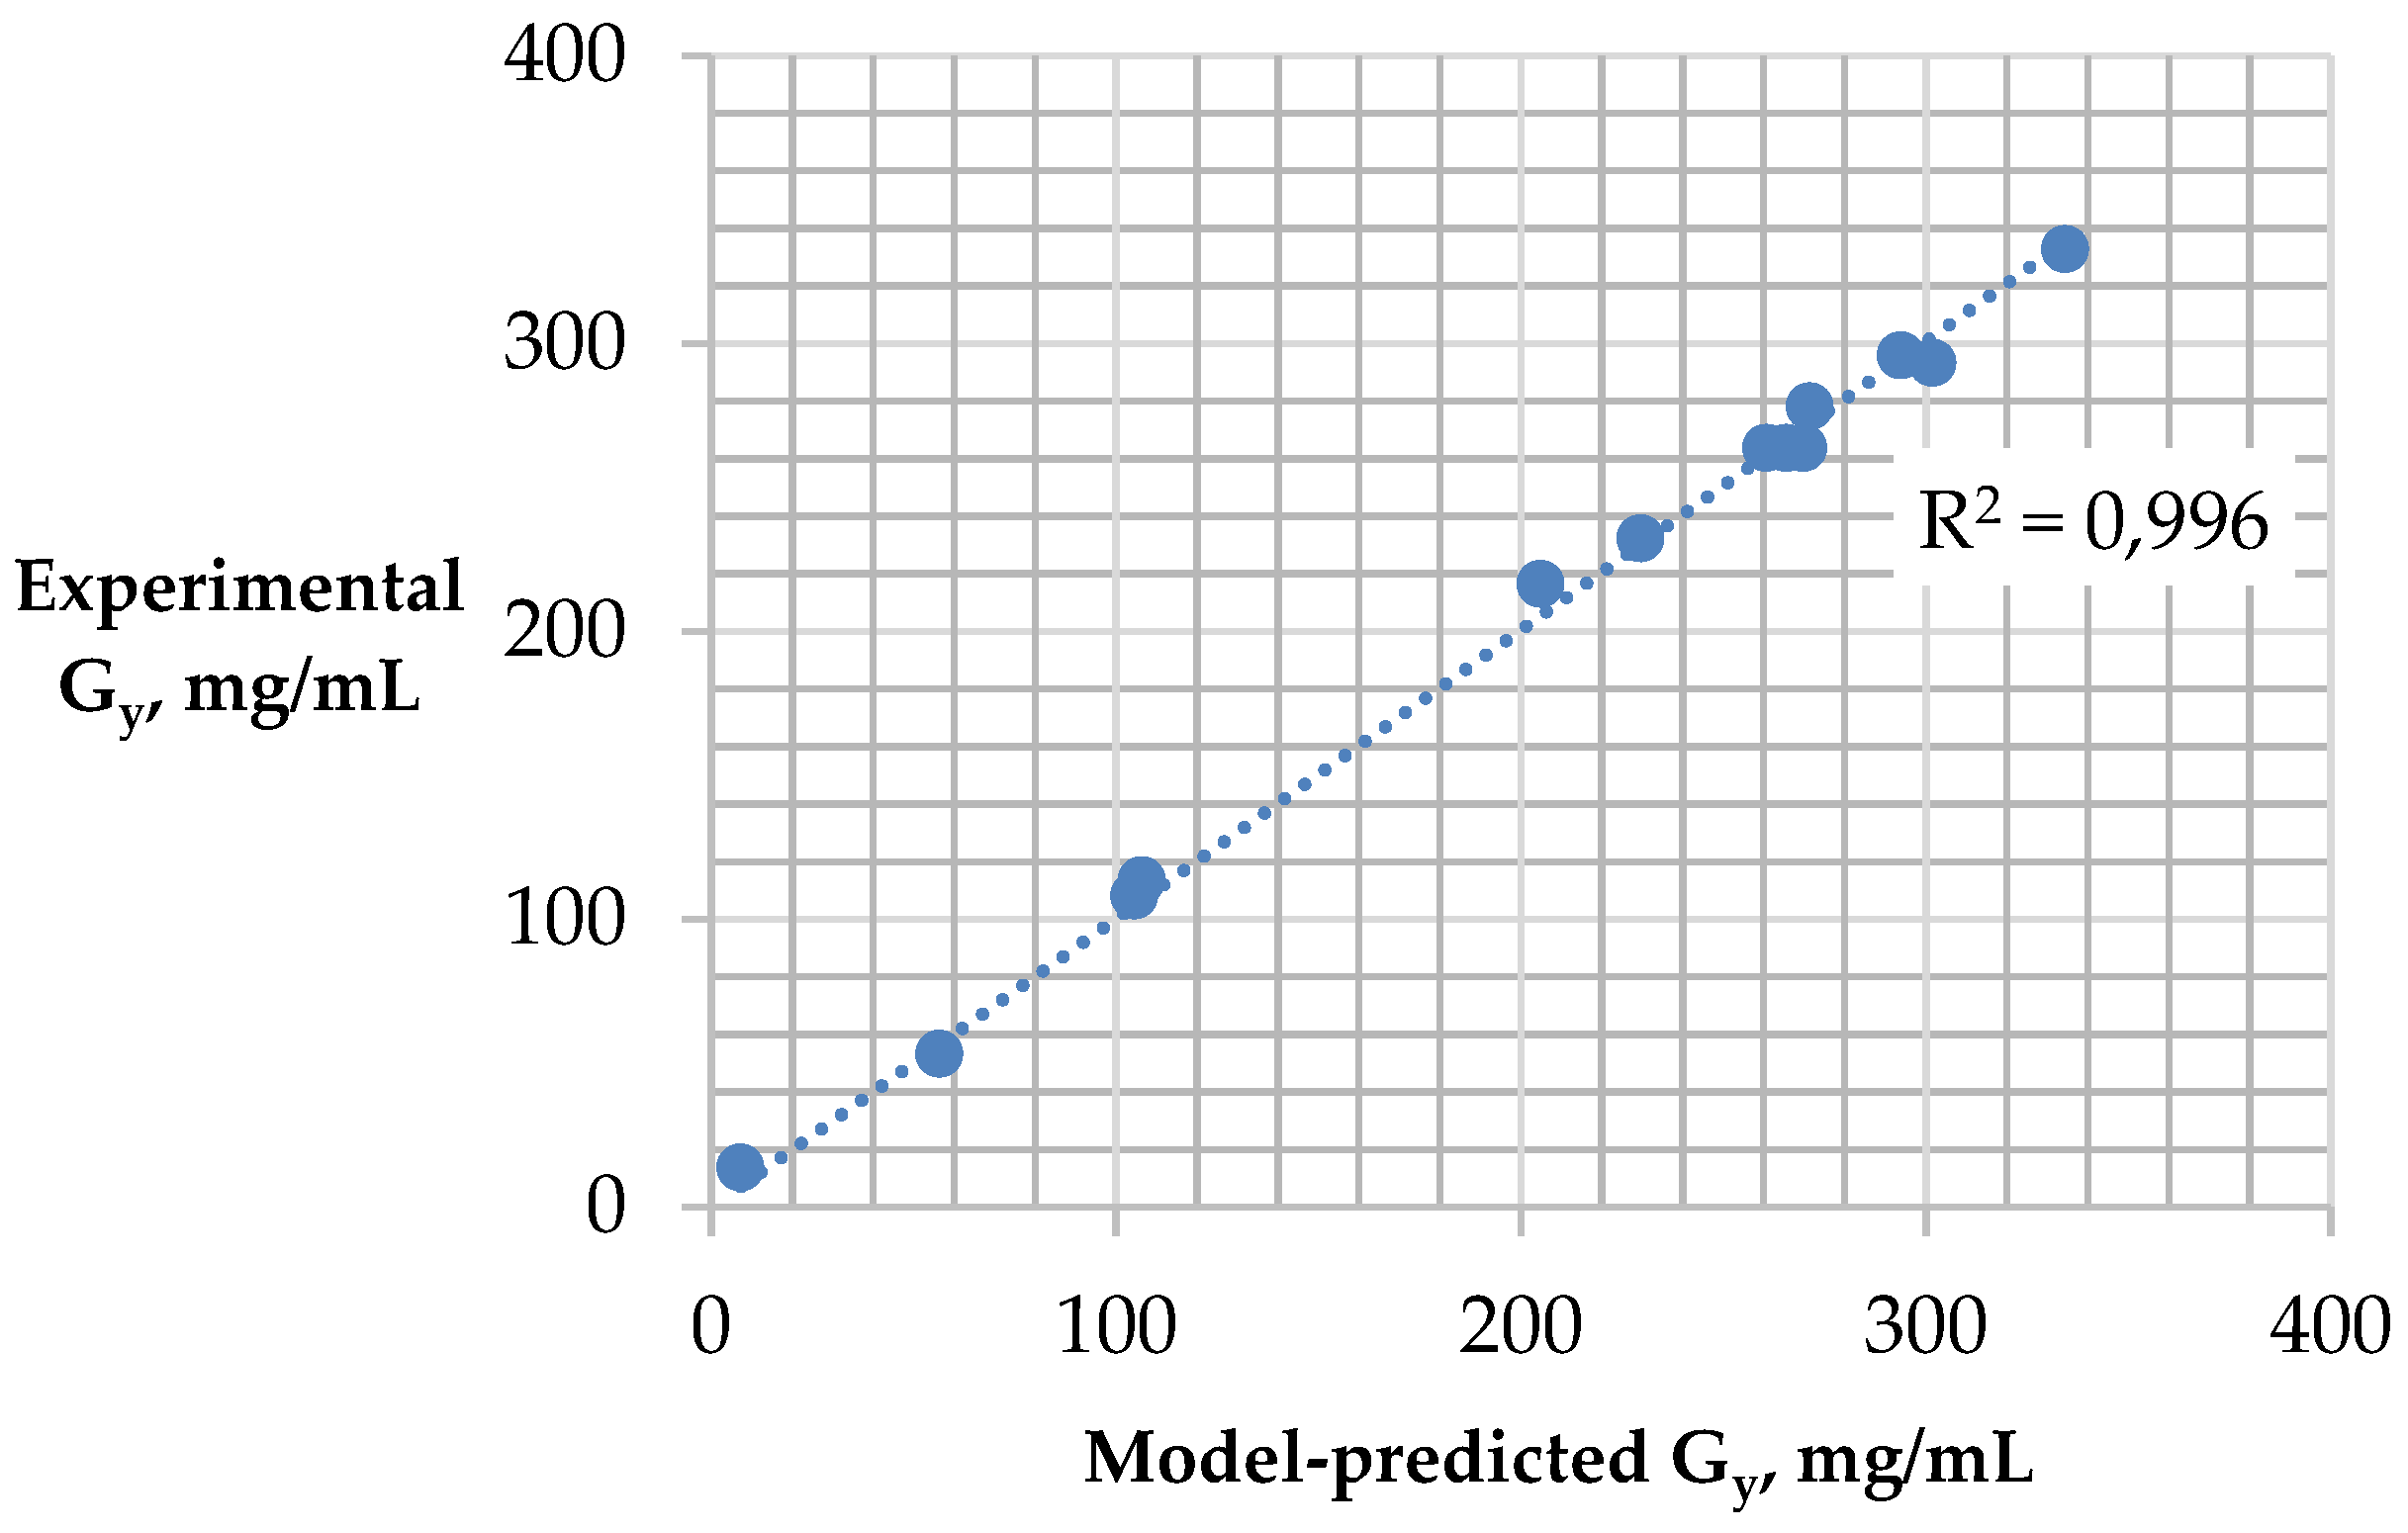
p < 0.1, which is why it was rejected. Based on analysis of variance, the obtained value of the determination coefficient (R
2 = 0.996,
Figure 2) indicates a very good correlation between the efficiency calculated on the basis ofEquation (1) and the actual glucose efficiency within the investigated range of variables.
The attached figures show model surface responses and are the effect of the interactions between two selected variable parameters, while maintaining the third parameter at a constant level. The model response is the concentration of glucose (glucose yield) after the two-stage hydrolysis, where in the second stage the obtained solid fraction after the alkaline pre-treatment was used. The analysis of the surface response was useful for the determination of the individual effects of each parameter and the impact of interactive effects of independent variables on the glucose yield. This approach allowed to determine the optimal conditions with respect to each investigated parameter.
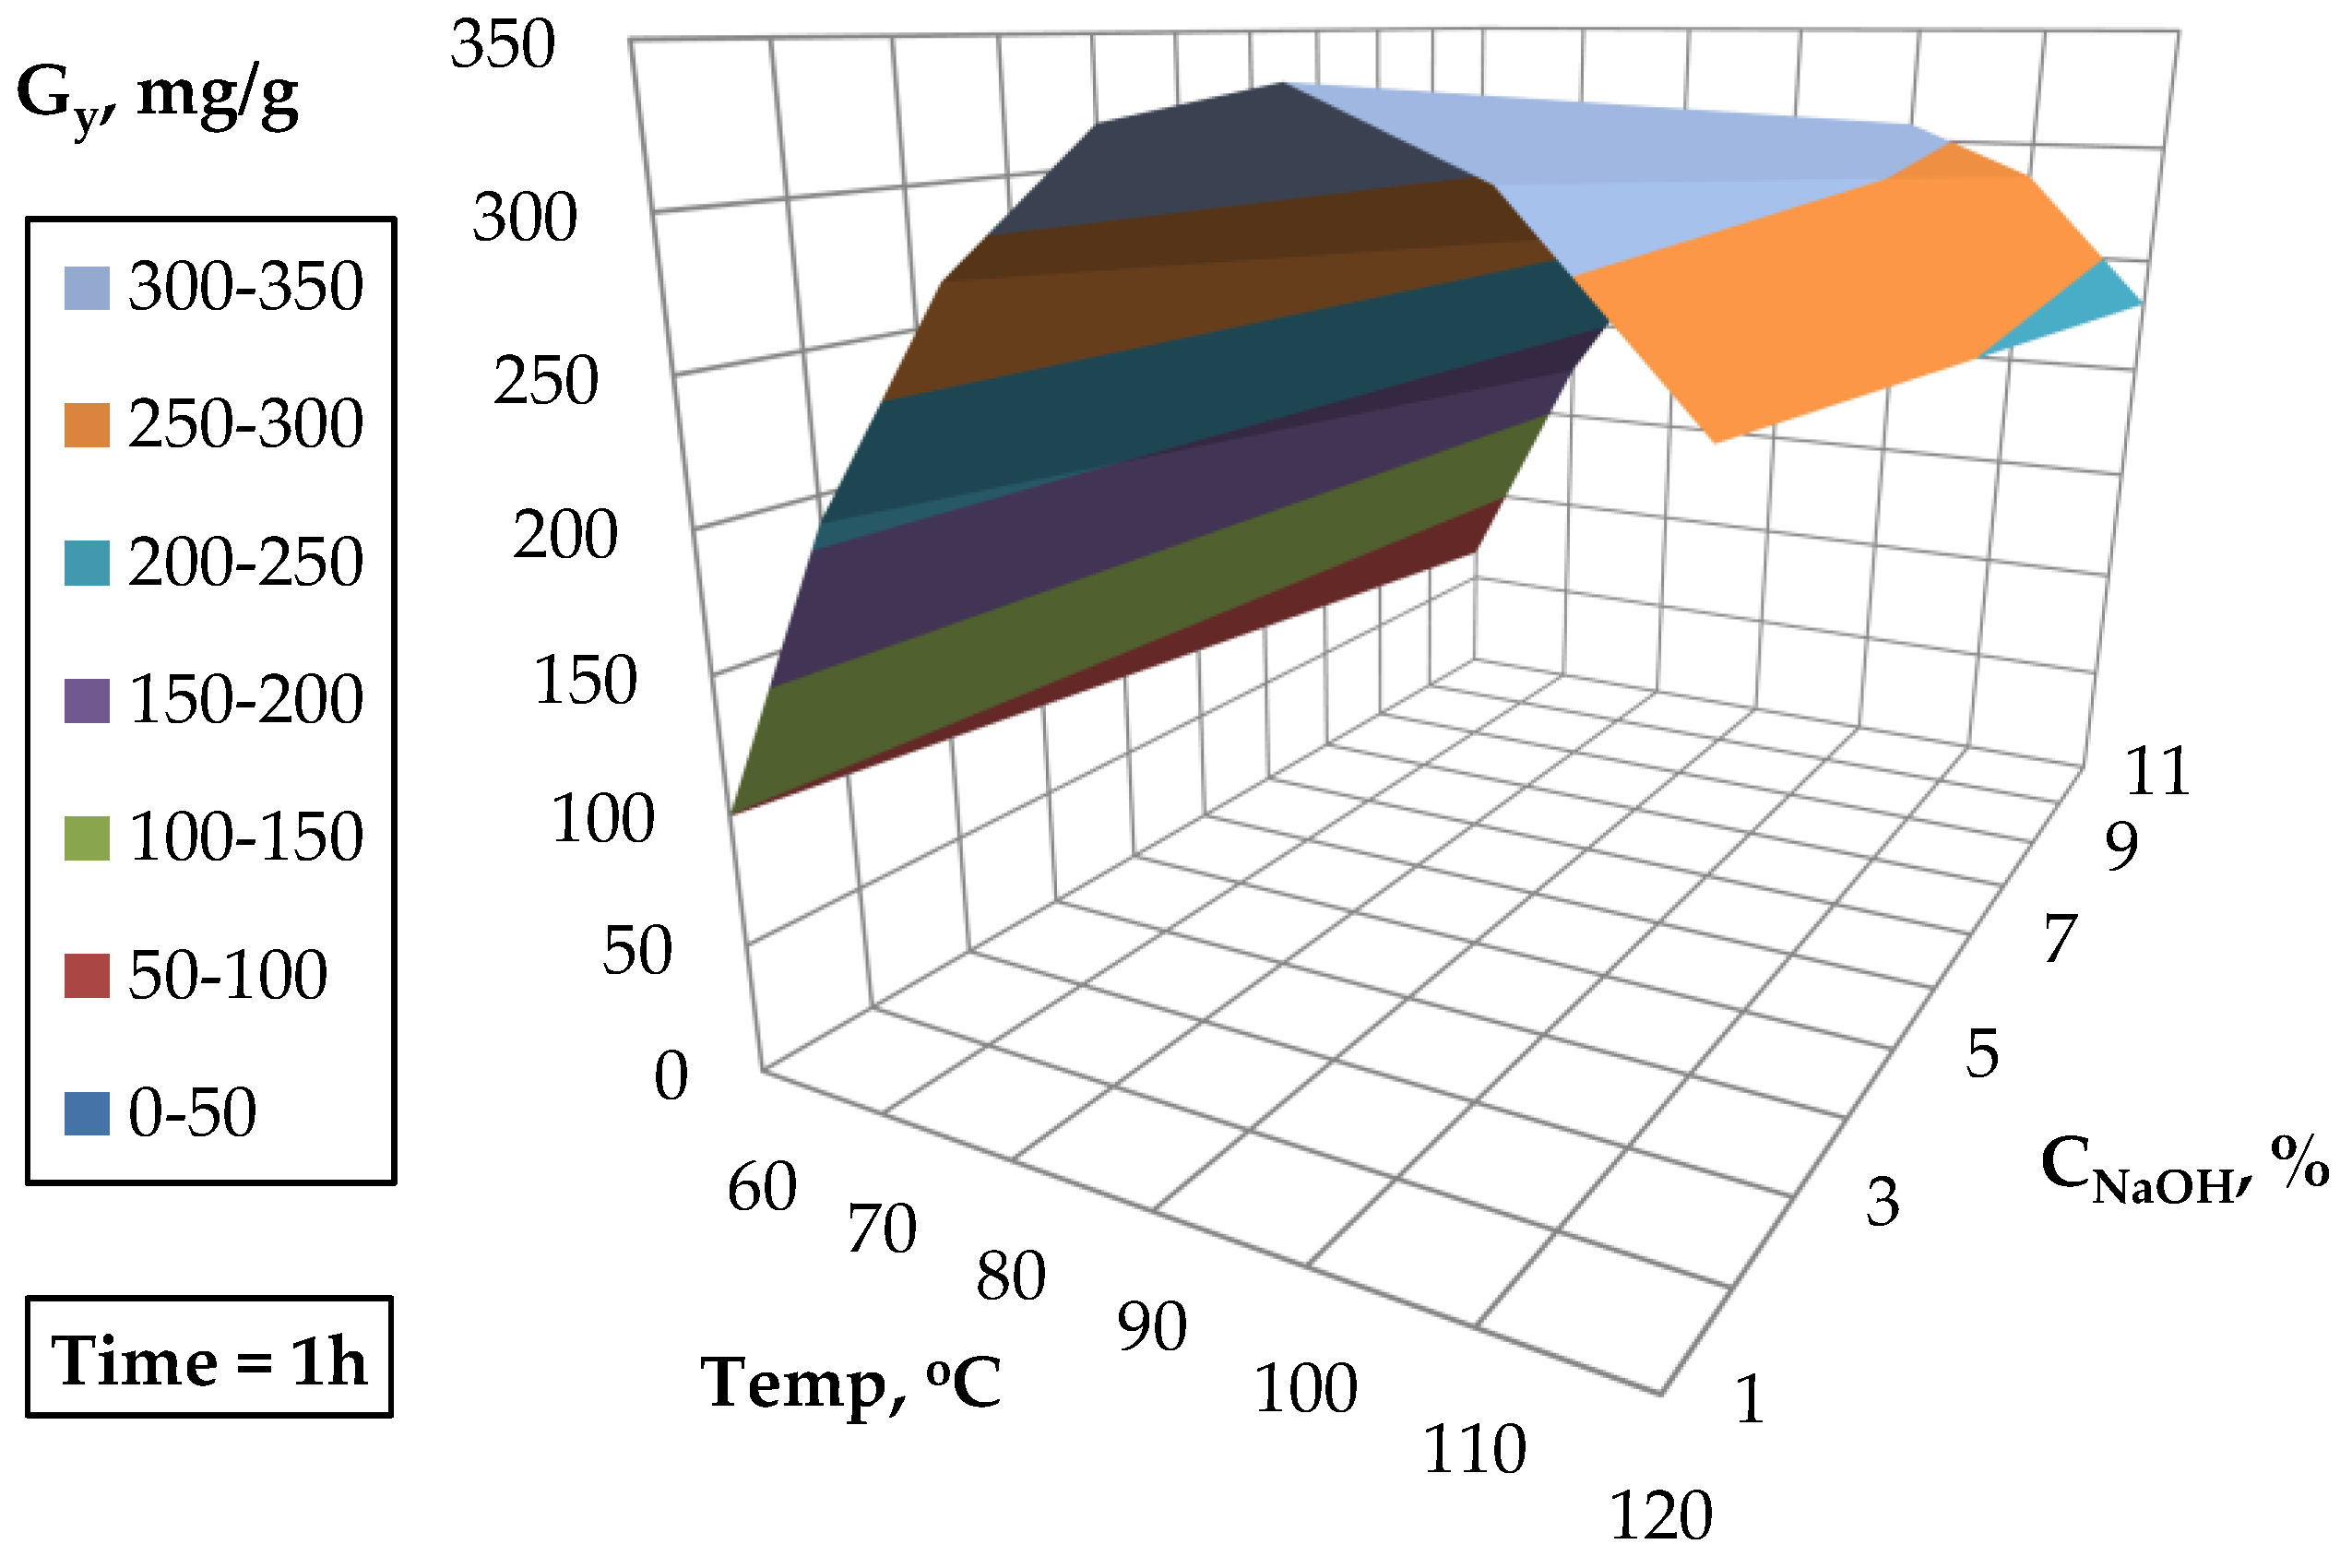
Figure 3 presents the effect of NaOH concentration and acid hydrolysis temperature on glucose yield (acid hydrolysis time 1h). The results indicate that the glucose yield reaches a maximum at about 100 °C. Increasing the temperature of acid hydrolysis above 100 °C results in a decrease of glucose yield due to the breakdown of simple sugars. The increase in NaOH concentration during the pre-treatment causes a decrease in a glucose yield. This is caused by a significant loss of mass during alkaline pre-treatment. Biomass loss is related to the catalyst concentration and it is equal to 38% for the treatment of 1% NaOH and 52% when 11% NaOH is used.
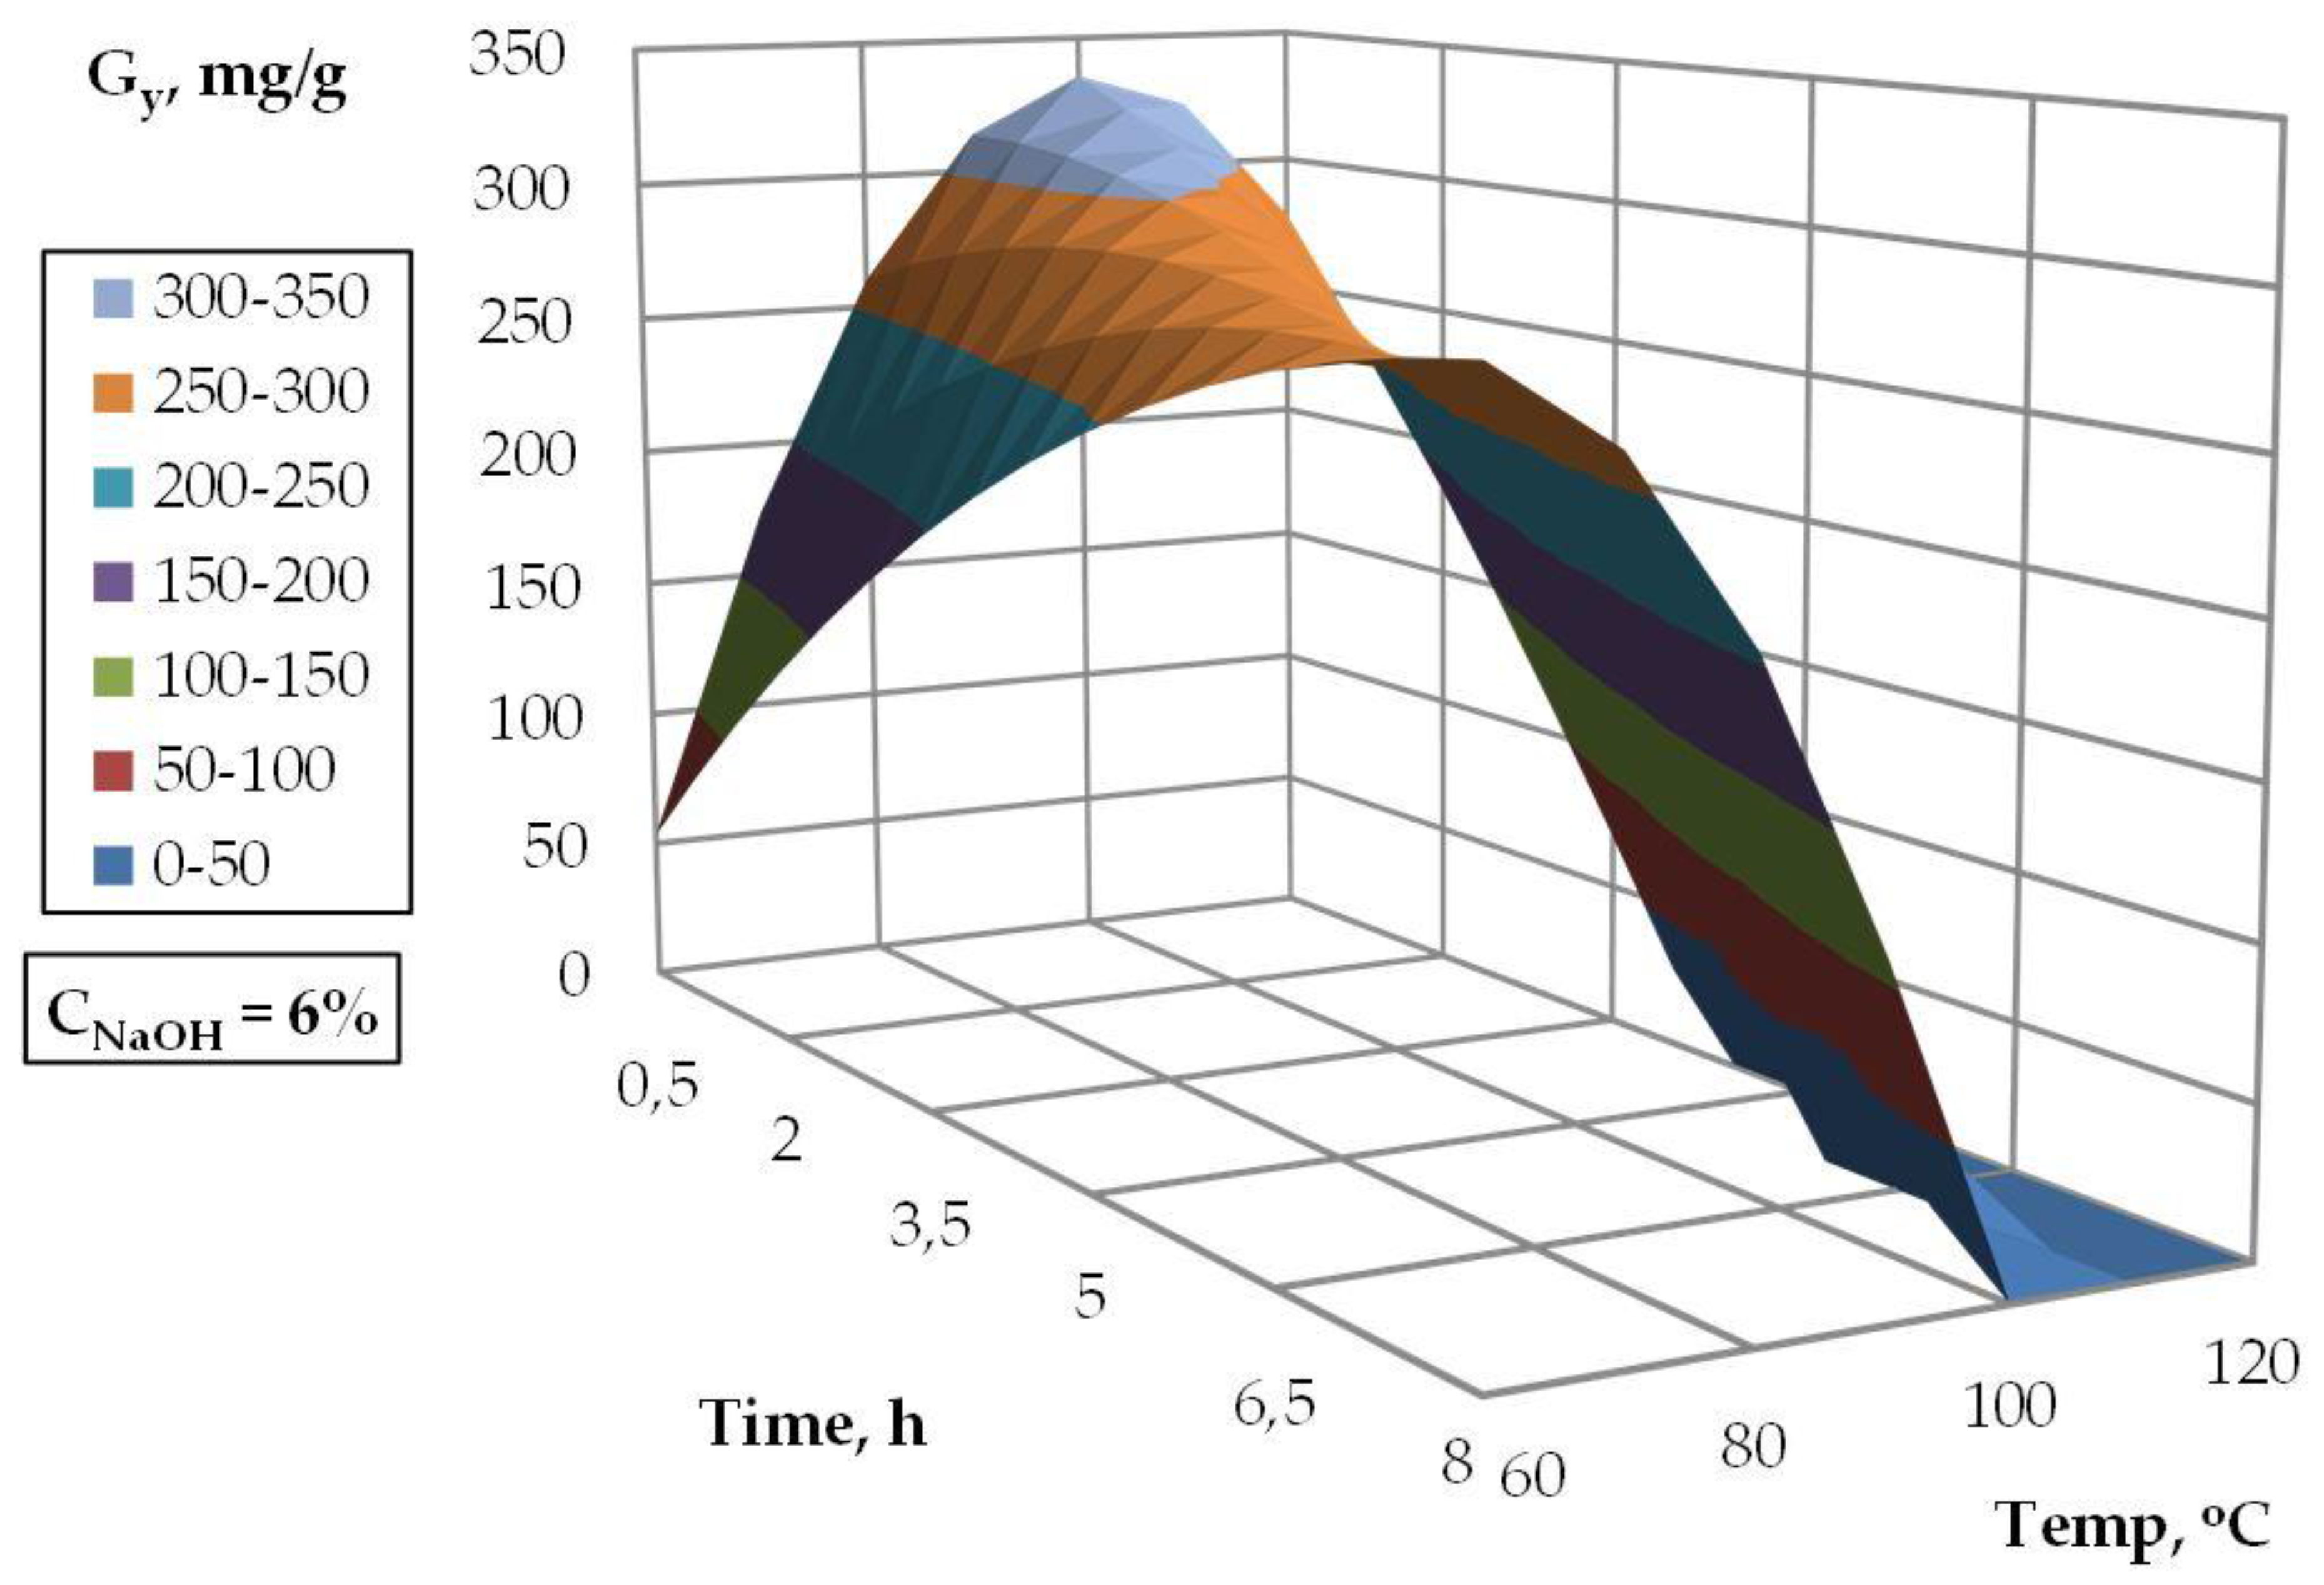
Figure 4 shows the effect of temperature and duration time of acid hydrolysis on the glucose yield for a constant sodium base concentration (6%). Glucose efficiency increases with increasing temperature, however, when the optimal temperature (100 °C) is reached, a significant decrease in glucose efficiency is observed if the temperature is further increased. For temperaturesin the range of 90–100 °C, and for a short time of acid hydrolysis (0.5 h), the highest glucose yields are obtained. An increase in time over 0.5 h results in a decrease in the hydrolysis efficiency. Only for the temperature of 60 °C, an increase in glucose efficiency along with the duration time of acid hydrolysis is observed.
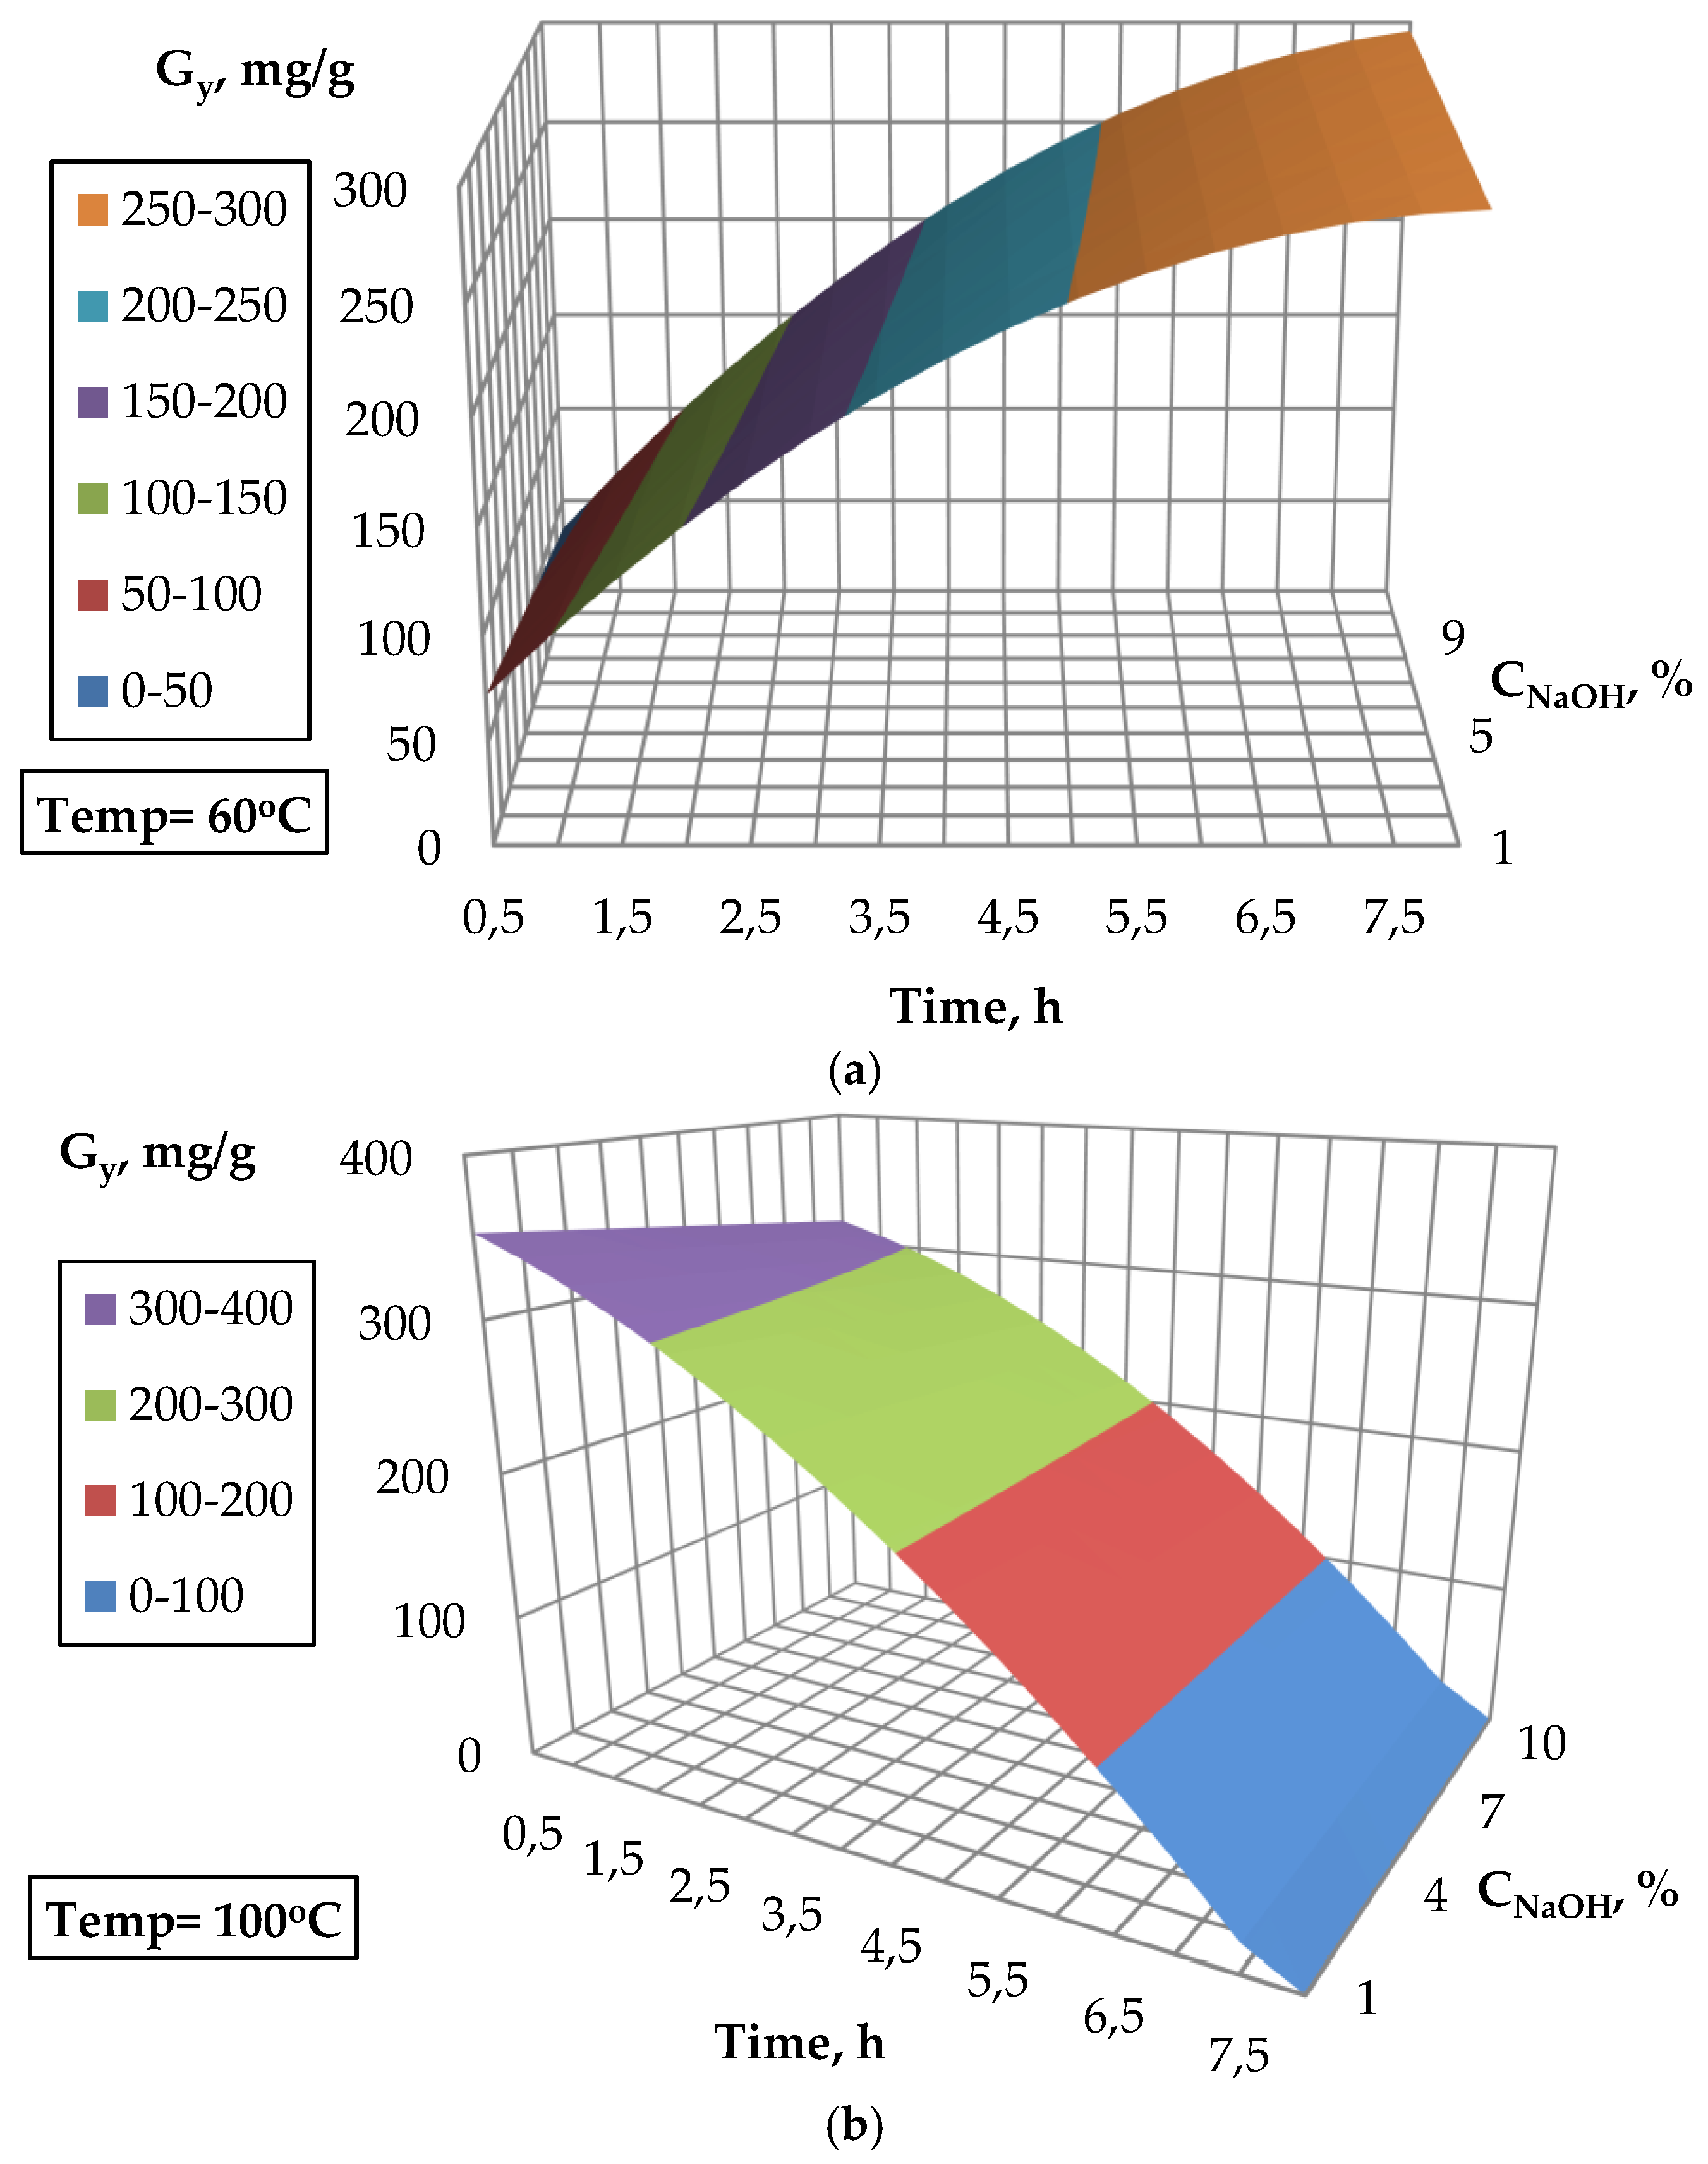
Figure 5a,b present an influence of the duration time of acid hydrolysis and NaOH concentration (alkaline treatment) on the glucose yield at a constant temperature of acidic hydrolysis. Two possibilities of interperation of two-stage hydrolysis should be considered here. In one variant, when the acid hydrolysis temperature is 100 °C (
Figure 5b), high yield of reducing sugars can only be achieved for a short duration of acidic hydrolysis (0.5 h). The increase in the duration of treatment results in a decrease of the glucoseyield due to the degradation of simple sugars. When a lower temperature of 60 °C is applied (other variant,
Figure 5a), the highest yield is achieved after 8 h of acidic hydrolysis. The choice of process temperature, besides the efficiency of reducing sugars, should also be supprted by the concentration of fermentation inhibitors in the resulting hydrolysate.
The analysis of the surface response areas (
Figure 3,
Figure 4 and
Figure 5) allowed to determine the optimal conditions for a two-stage process involving alkaline pre-treatment (6% NaOH, 6 h, 65 °C) and acid hydrolysis (100 °C, 0.5 h and 85% H
3PO
4). For these conditions, hydrolysis of the triticale straw was performed to obtain, from 1 g of raw material, 320 mg of glucose, 42.8 mg of xylose, 19 mg of galactose and 1.5 mg of arabinose, respectively. A similar result of the yield of sugars was obtained for acid hydrolysis with sulfuric acid (70% H
2SO
4, 30 °C, 2 h) of
Saccharum spontaneum, also after treatment with sodium base (7%, 48 h, 30 °C). For these conditions, a maximum yield of reducing sugars was obtained 369.6 mg/g [
14]. The acid hydrolysis was carried out on straw which had not been subjected to the previous alkaline pre-treatment, obtaining, from 1 g of raw material, 420 mg of glucose, 150 mg of xylose, 38 mg of galactose and 4.7 mg of arabinose, respectively. It is clear that the efficiency of reducing sugars for acid hydrolysis with the omission of the alkaline pre-treatment is the highest.
2.4. Optimisation ofAlkaline Pre-Treatment Followed by Enzymatic Hydrolysis
The system consists of 15 experiments planned according to the Box-Behnken design. Experiments include two-stage hydrolysis of biomass, i.e., alkaline pre-treatment followed by enzymatic hydrolysis. During the alkaline pre-treatment, NaOH concentration in the first step of hydrolysis is optimized at a constant process temperature of 65 °C, pre-treatment time of 6h, and granulation of 0.75 mm. In the second step, enzymatic hydrolysis values of the time and ratio of cellulolytic enzymes immobilized on a solid support are optimized. As the boundary conditions, on the basis of previous experiments, NaOH concentrations of 1%, 6%, and 11% were assumed, and for enzymatic hydrolysis time 8, 16, and 24 h and the content of Viscozyme L in a mixture of 0.9, 0.95, and 1 were selected. Box-Behnken design estimation allowed the determination of the response surface based on the quadratic equation. As the initial parameter representing the efficiency of the process, the mass of the obtained glucose was selected (glucose yield, G
y).
Table 5 shows the obtained values of the glucose and the sum of reducing sugars.
The influence of the input parameters, i.e., the NaOH concentration, the Viscozyme L content, and the duration time of the enzymatic hydrolysis process have been examined considering the glucose yield as the model output. The equation describing the relationships occurring during the two-stage hydrolysis was determined by multiple regression. The obtained regression equation describing the surface response takes the form:
In Equation (2) X
1, X
4, and X
5 represent sodium hydroxide concentration, Viscozyme L content, and the time of enzymatic hydrolysis, respectively. Y denotes a glucose yield. Equation (2) enables the calculation of the theoretical glucose yield within the range of variables according to boundary conditions. In order to obtain Equation (2), the least significant parameters were rejected in the consecutive iterative steps. It turned out that the least important parameters are: NaOH concentration, duration of enzymatic hydrolysis, and the ratio of enzymes raised to the square. Equation 2 is described by the model parameters contained in
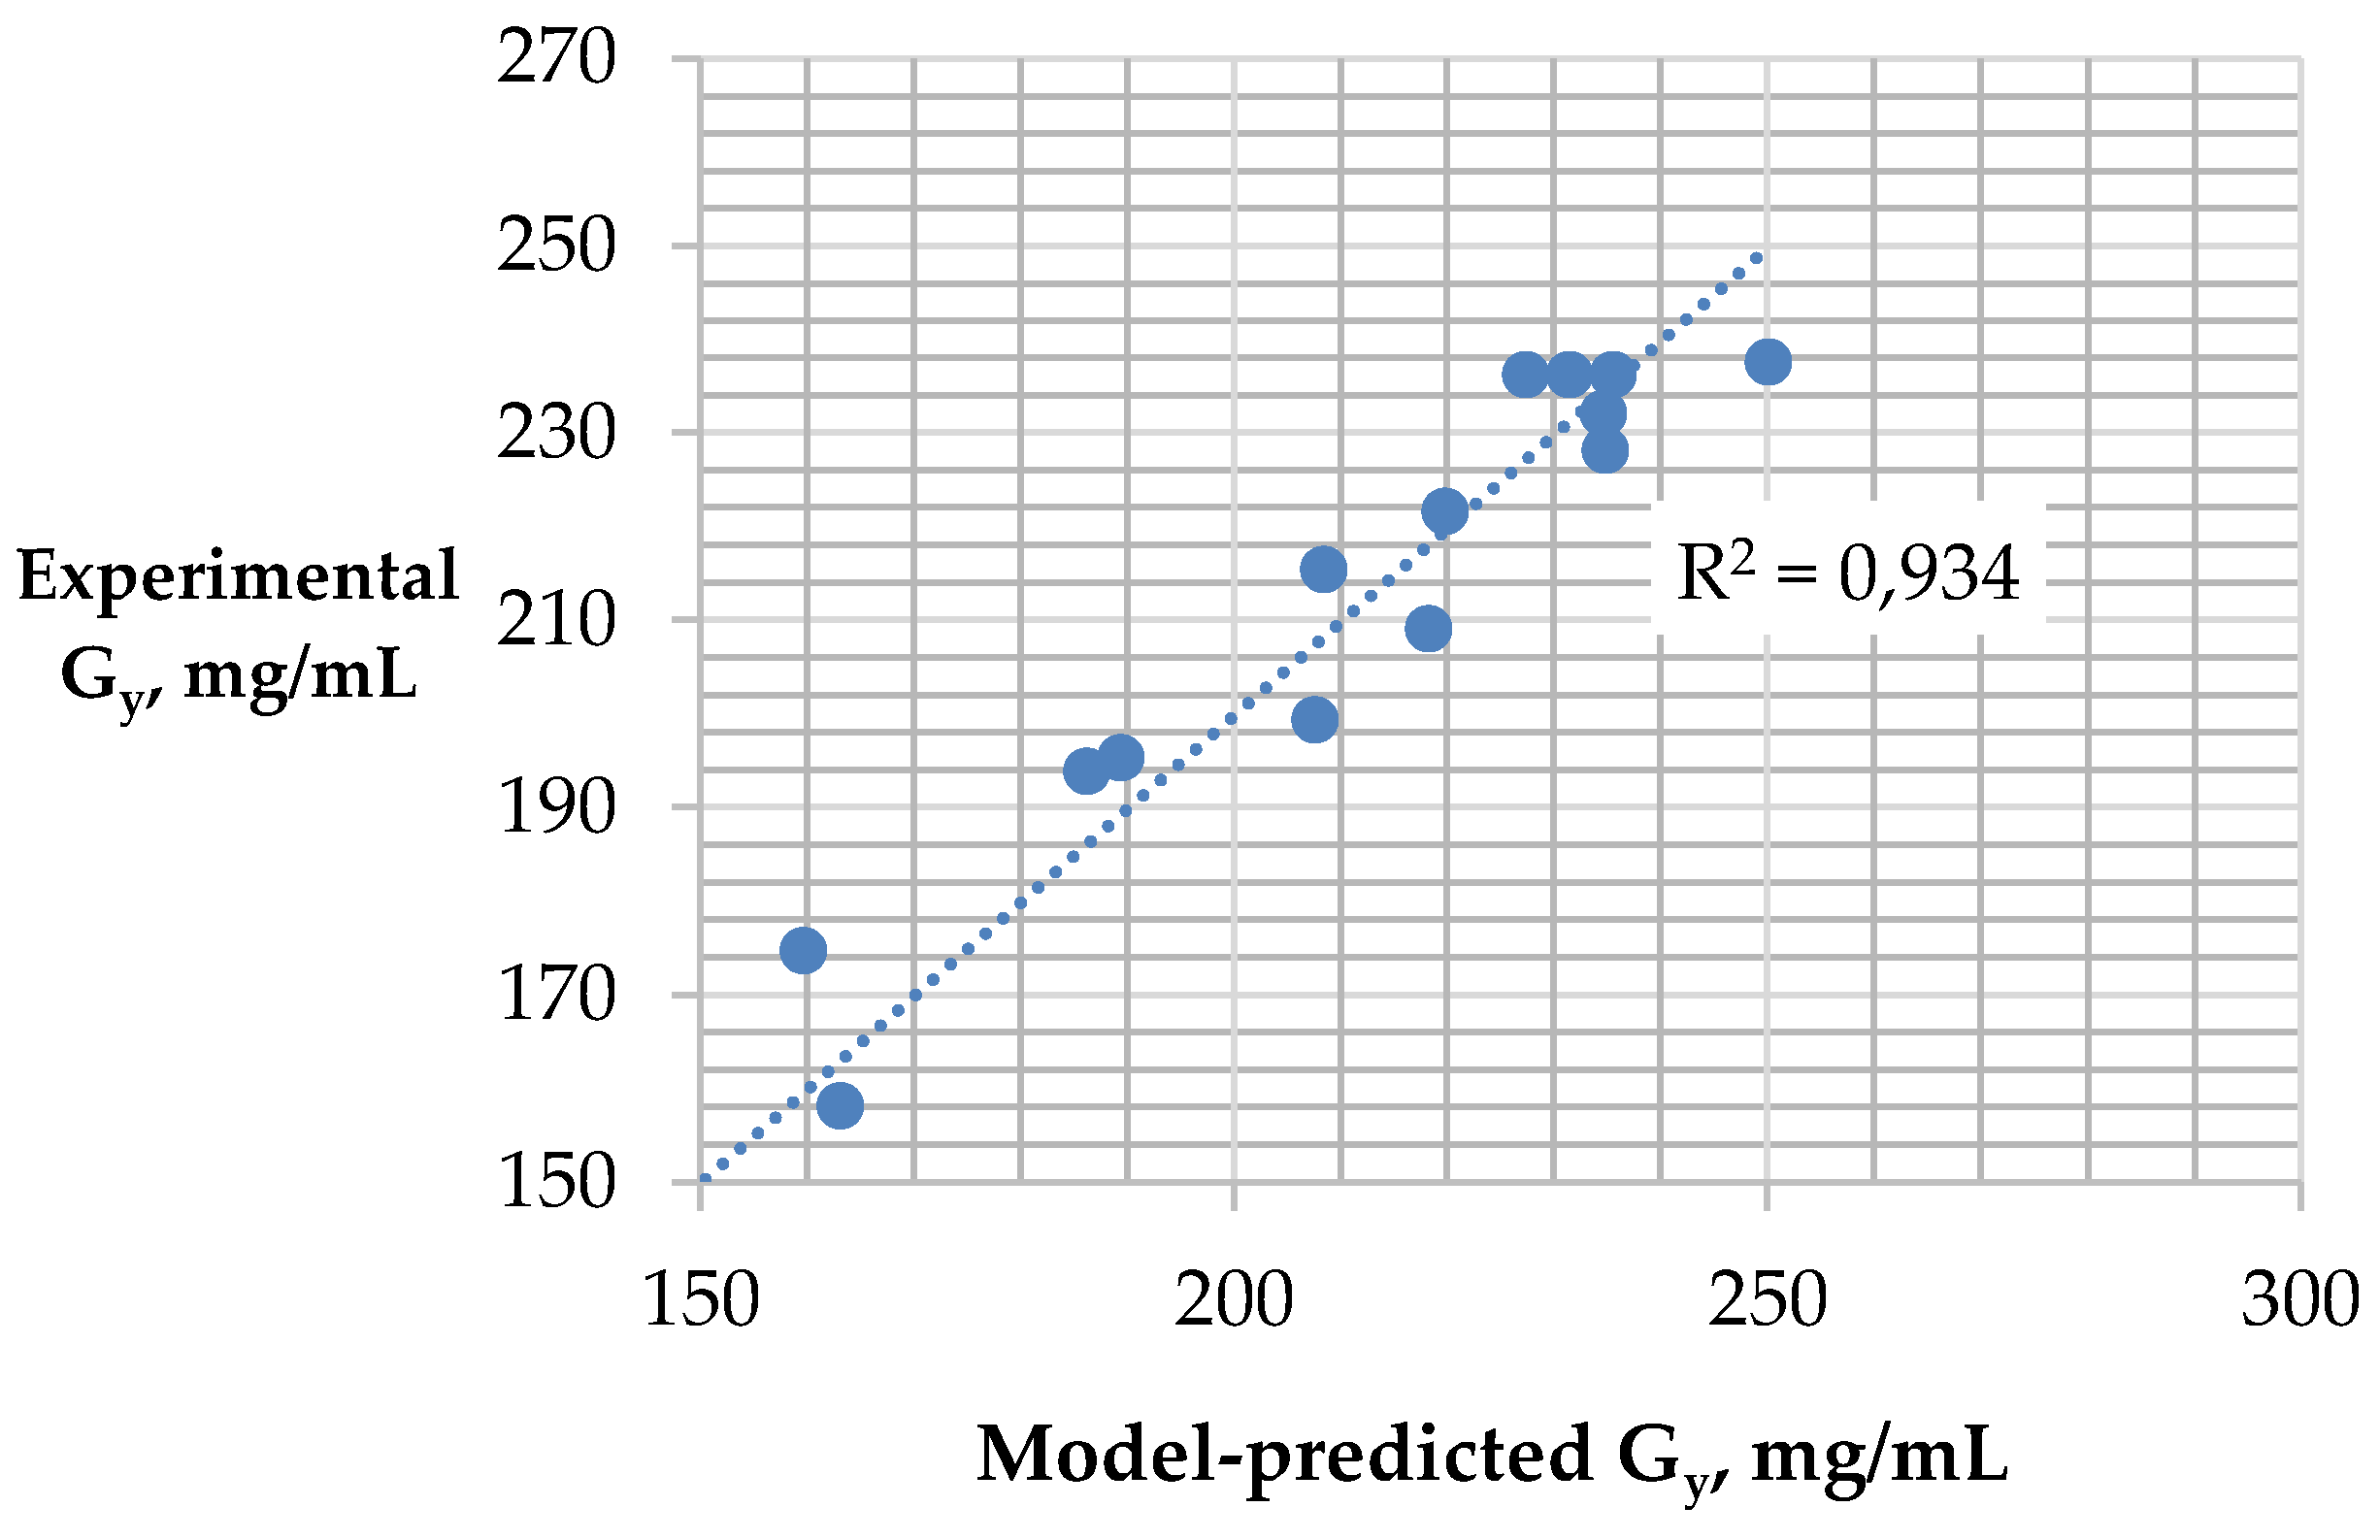
Table 6. Based on the analysis of variance, the obtained value of the determination coefficient (R
2 = 0.934) indicates a good correlation of the results calculated from the equation with the experimental results of glucose efficiency (
Figure 6).
The analysis of reaction mixture samples shows that the main product of lignocellulosic biomass hydrolysis is mainly glucose.
Table 5 presents the yield of this monosugars in the hydrolysates. The obtained result was compared with the sum of all reducing sugars. Physical studies have shown low content of cellobiose in hydrolysates, therefore, it was crucial to use a small addition of β-glucosidase in a mixture with Viscozyme L. Cellobiose is an inhibitor of cellulolytic enzymes and its presence lowers the efficiency of enzymatic hydrolysis.
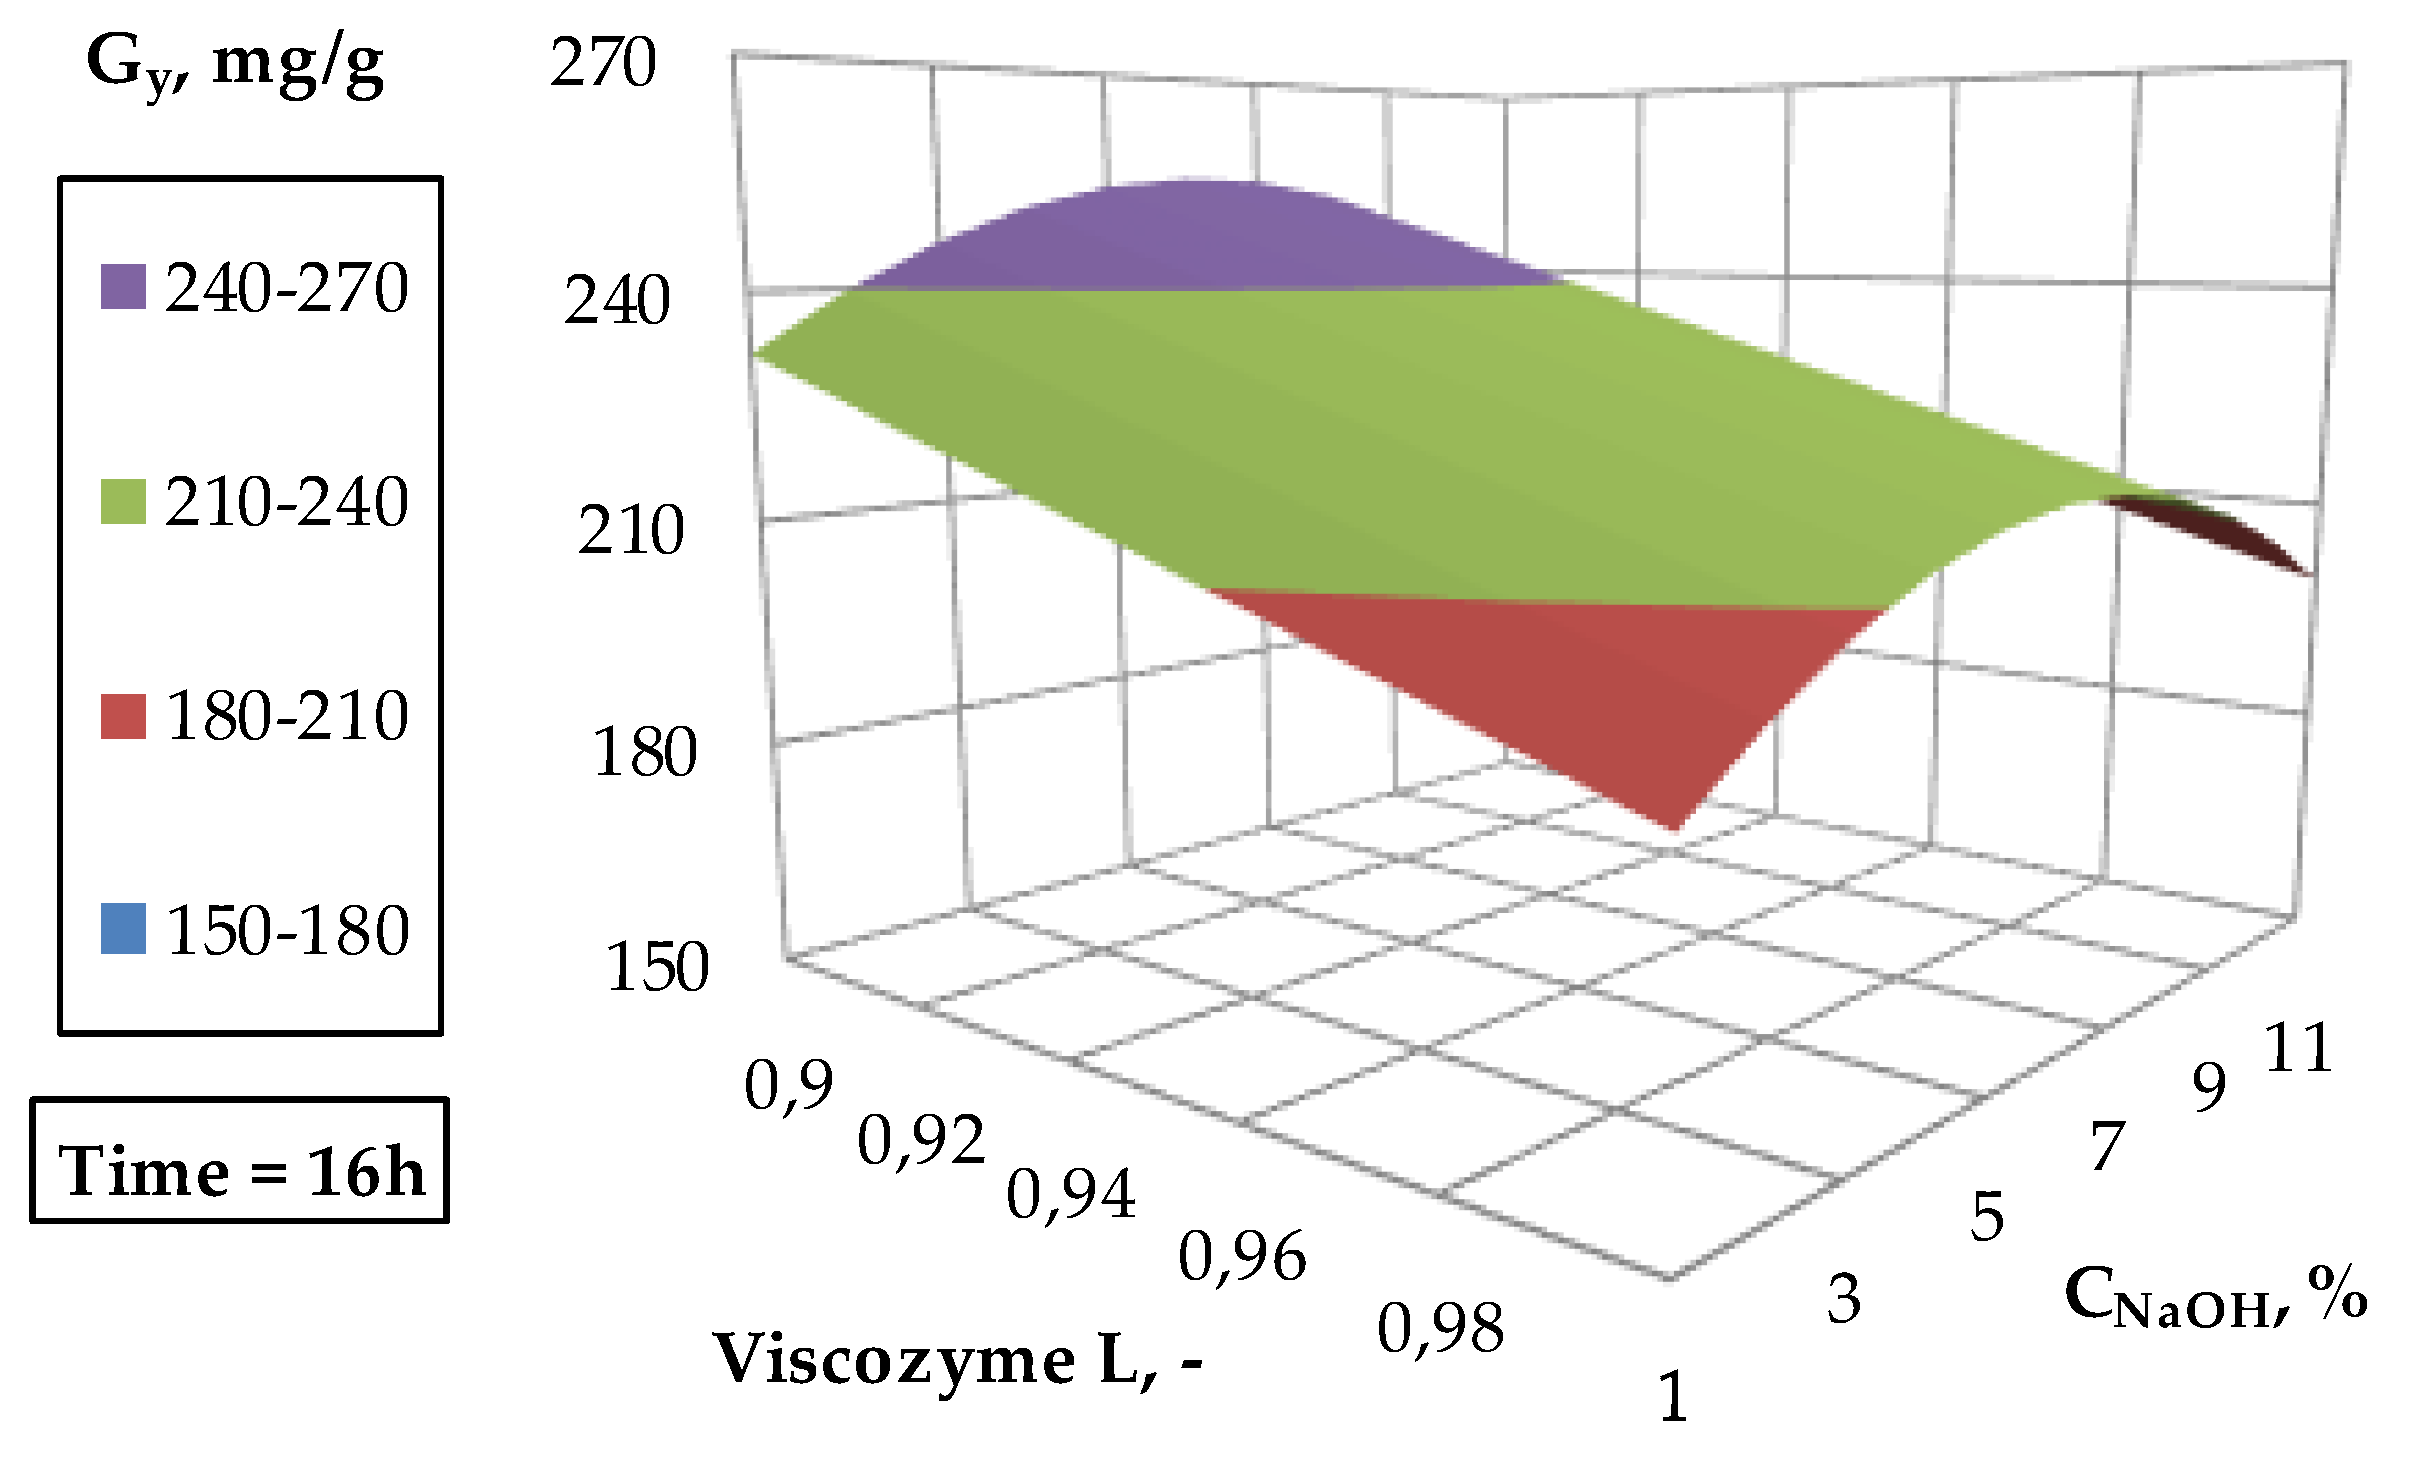
Figure 7 presents exemplary changes in glucose efficiency for enzymatic hydrolysis conducted for 16h in the range of variables described in
Table 5. Based on the shape of the response surface it can be stated that for the change in NaOH concentration, a local maximum around 9% is observed, above and below which the obtained glucose yields are lower. Therefore, 9% NaOH concentration is chosen as the optimal value.
Figure 7 also shows that there is a linear relationship between the yield of glucose and the ratio of β-glucosidase in the mixture with Viscozyme L during the enzymatic hydrolysis, where an increase in the ratio of β-glucosidase (or the decrease of Viscozyme L) corresponds with an increase in the yield of glucose after enzymatic hydrolysis. The mentioned changes are small enough to decide that the optimal addition of β-glucosidase chosen for further experiments is 0.05 in proportion to Viscozyme L equal to 0.95.
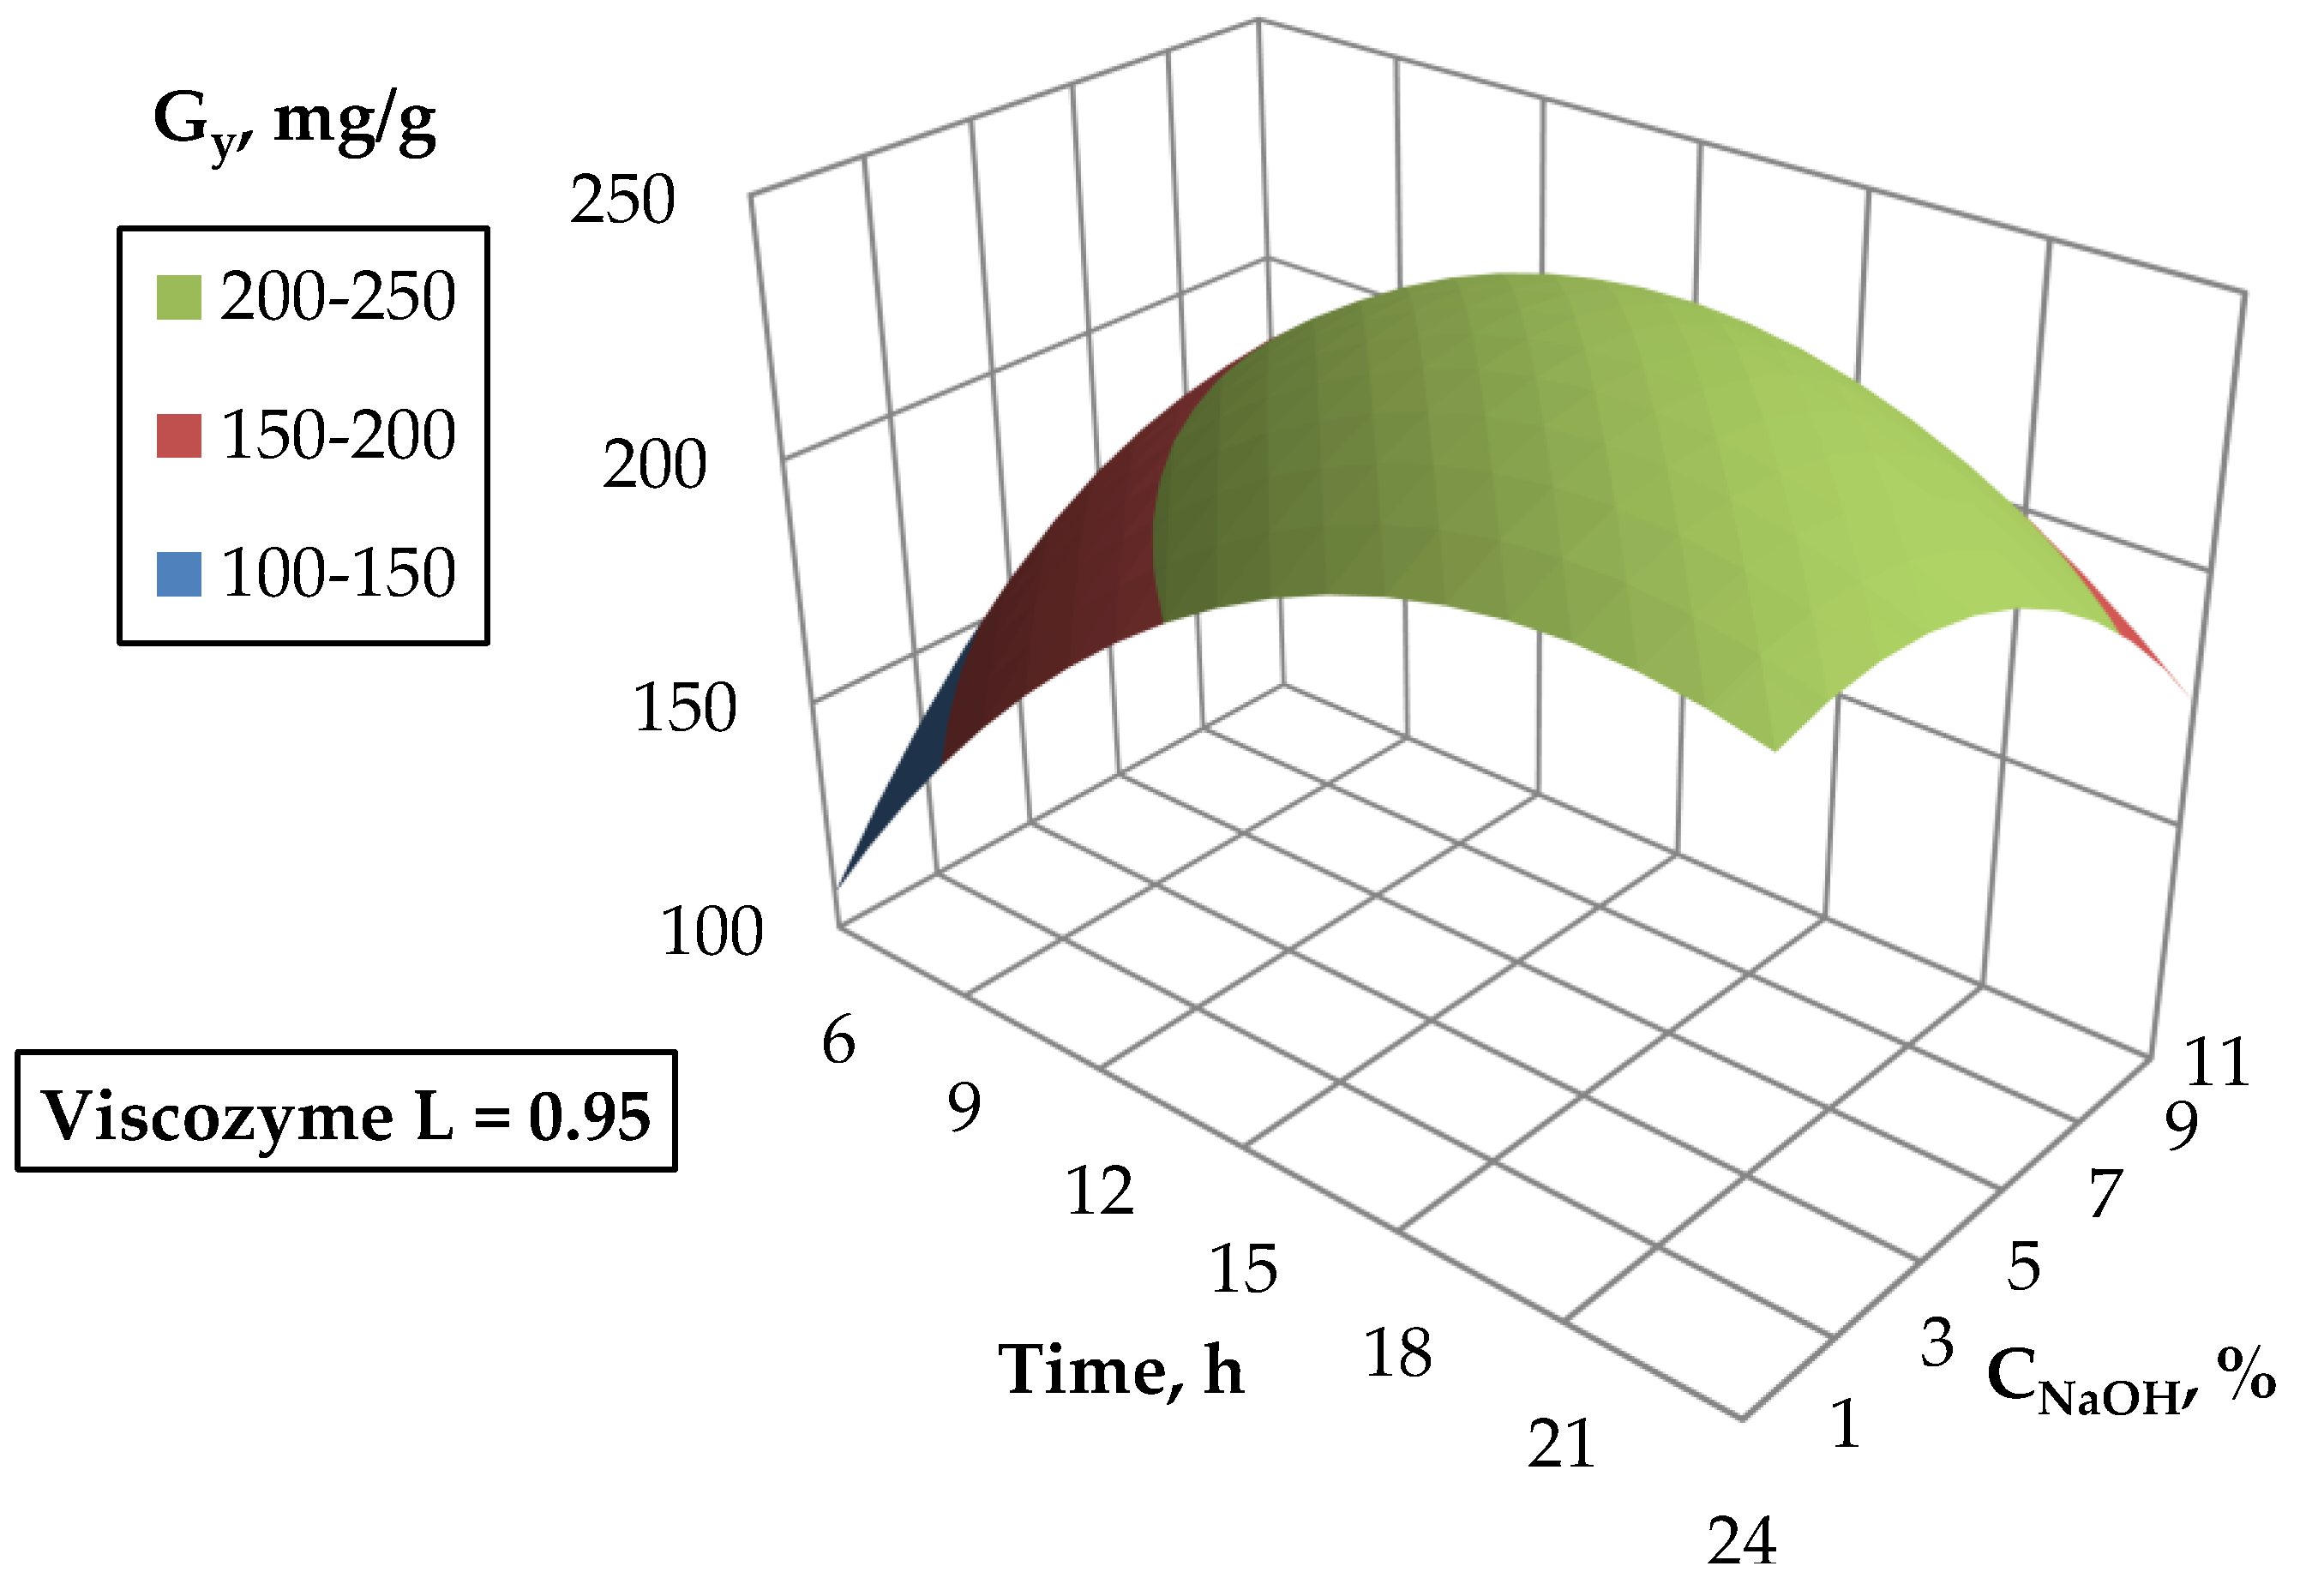
Figure 8 presents changes in glucose efficiency for enzymatic hydrolysis carried for Viscozyme L content of 0.95. Based on the course of the response surface it can be stated that for the change in NaOH concentration, a local maximum around 7–9% is observed. Obtained results confirm that 9% NaOH concentration is an adequate concentration of alkaline catalyst chosen as the optimal value. A relationship between time and glucose yield during enzymatic hydrolysis show that an increase of the hydrolysis time above 16 h is no longer reasonable. It was decided that the optimal time of enzymatic hydrolysis is equal to 16 h for Viscozyme L content of 0.95 and 9% concentration of NaOH.
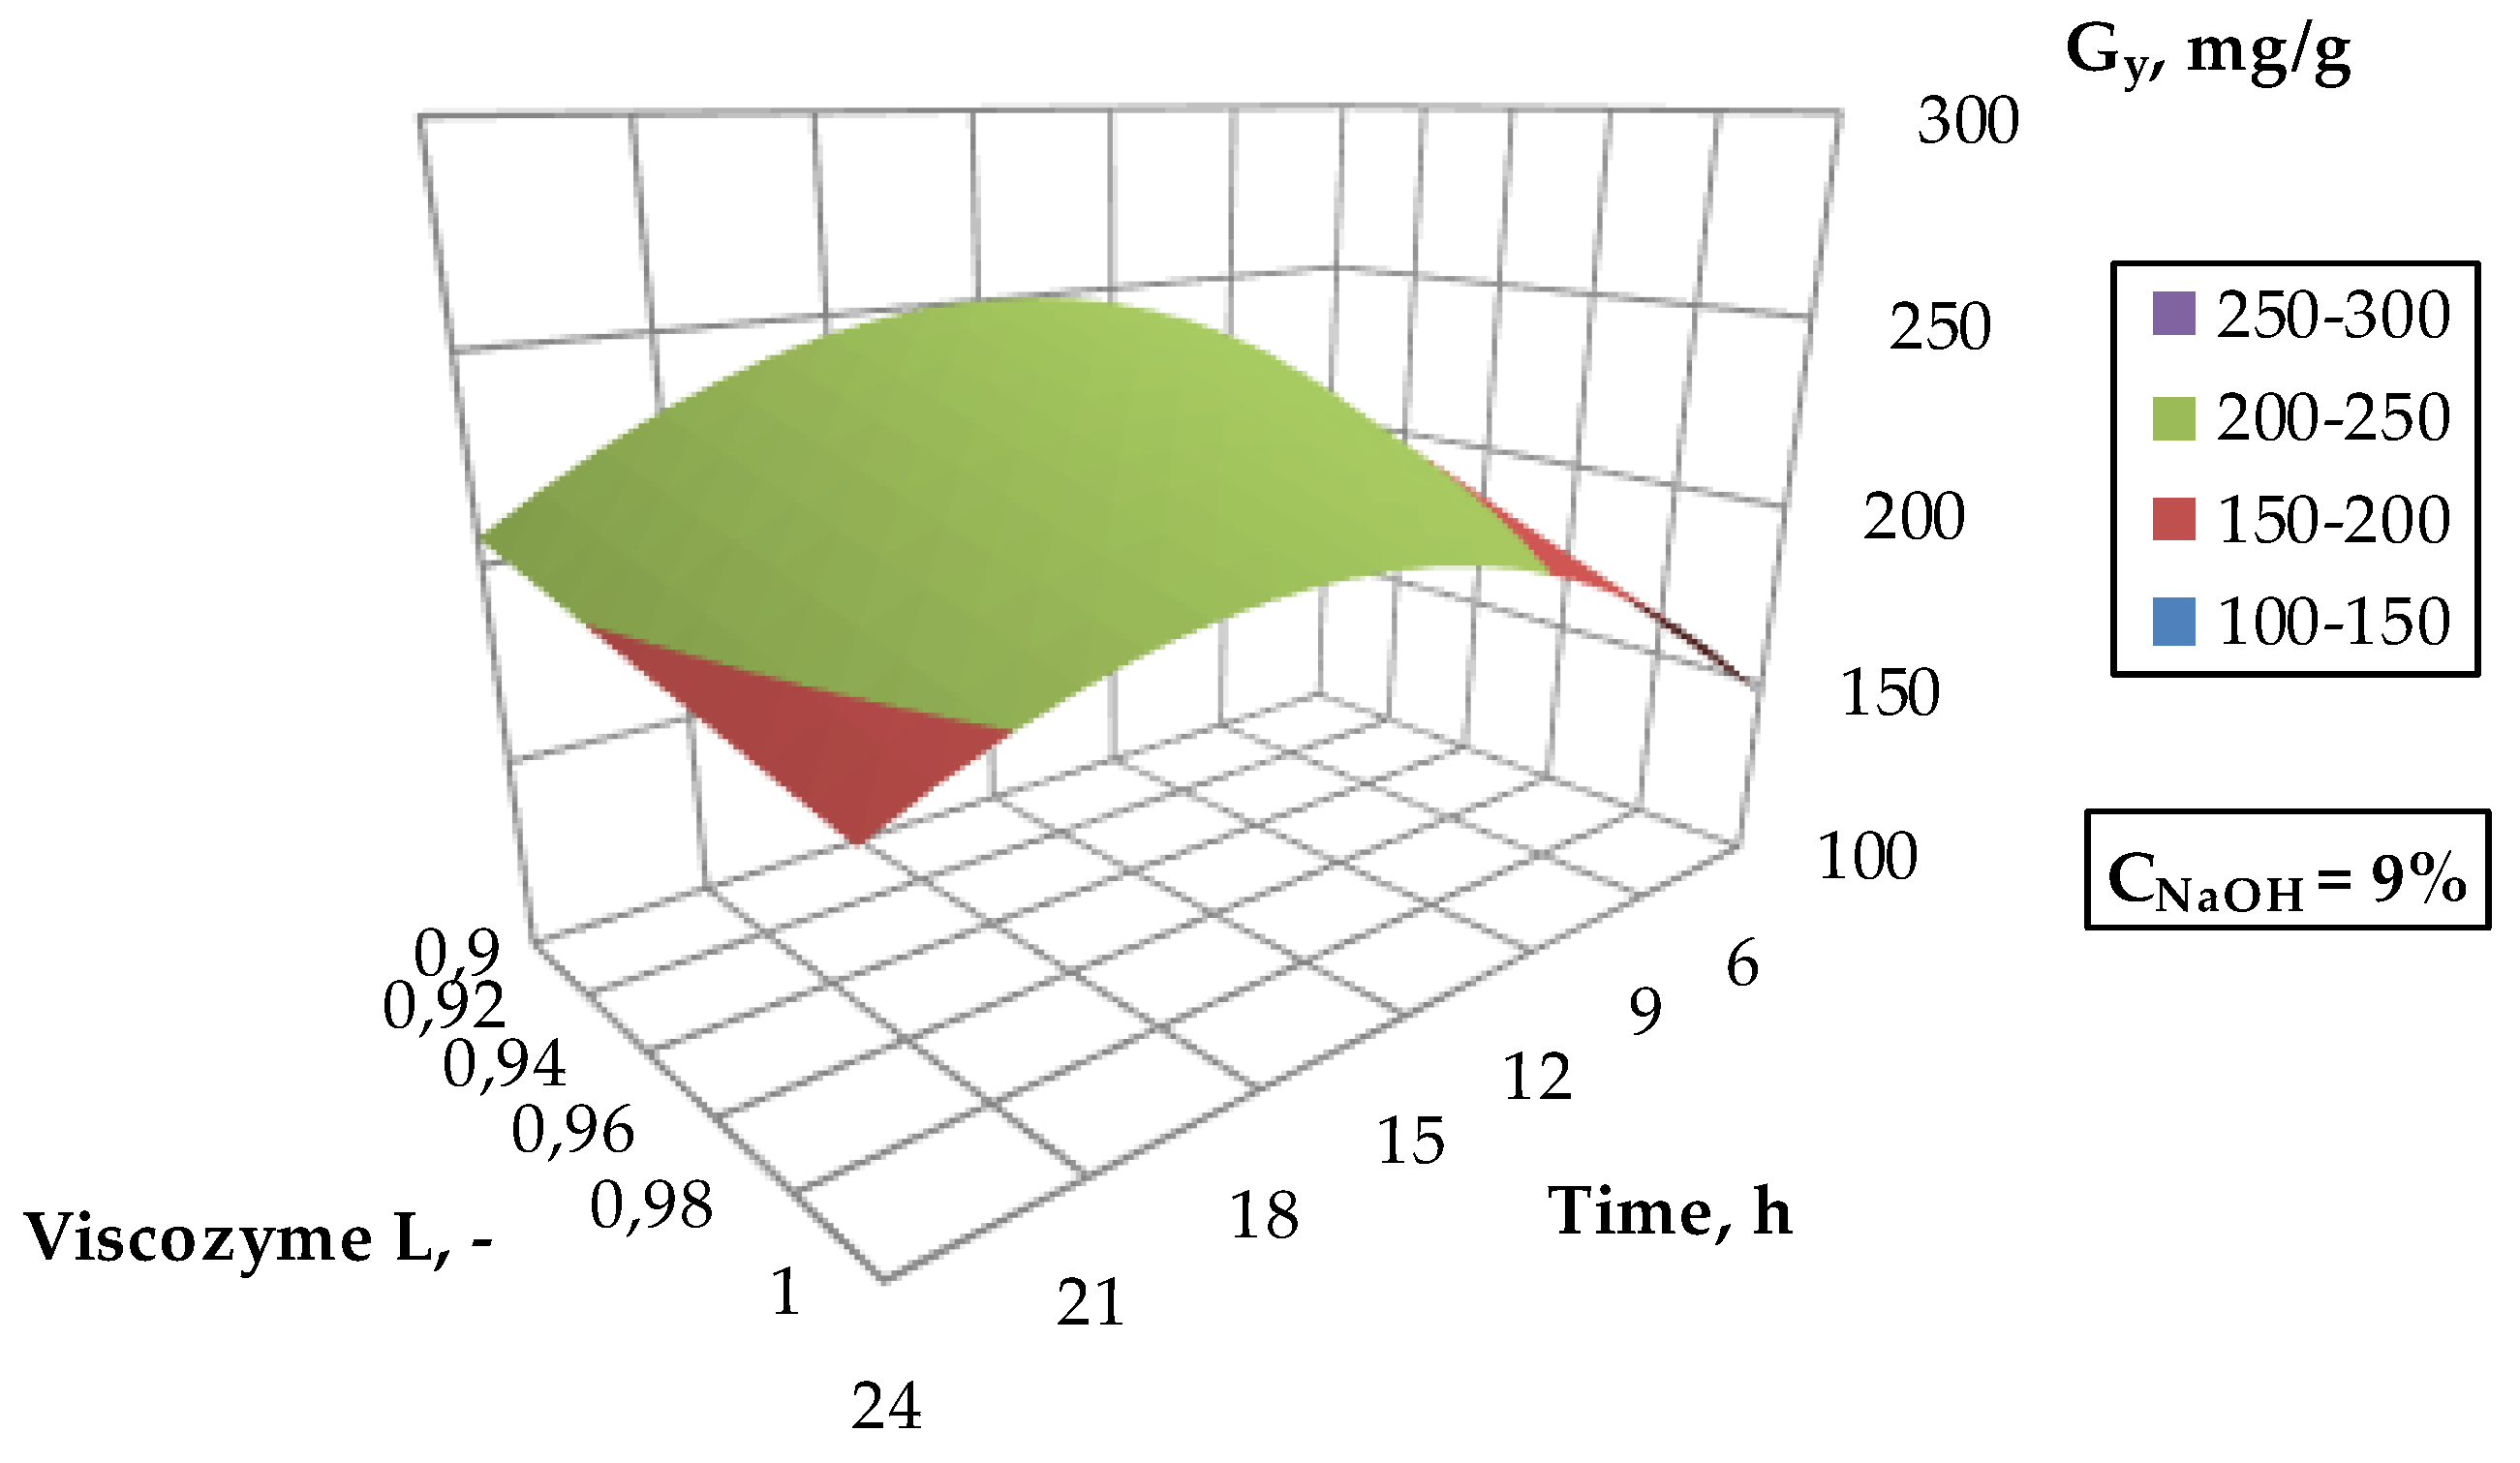
Figure 9 presents changes in response surface for glucose efficiency during the two-step alkaline and enzymatic hydrolysis conducted for NaOH concentration equal to 9%. A maximum in the range of about 15–17 h of the enzymatic hydrolysis time can be observed. The ratio of β-glucosidase to Viscozyme L does not show any significant changes in the hydrolysis course. Yet, the addition of β-glucosidase to Viscozyme L increases the cost of enzymatic hydrolysis, therefore, the content of Viscozyme L of 0.95 is taken as optimal on the basis of results given in
Figure 7 and
Figure 9.
Based on statistical analysis of experimental data and the analysis of response surface course and changes optimal values for further experiments have been determined. It can be stated that a NaOH concentration of 9%, an enzyme ratio equal to 0.95, and a time of 16 h is the set of optimal conditions for two-step alkaline-enzymatic hydrolysis.
2.5. Influence of the Pre-Treatment and Saccharification Conditions on the Formation of Fermentation Inhibitors
For the hydrolysis experiments using phosphoric acid according to the Box-Benkhen design, the content of typical fermentation inhibitors including 5-HMF, furfural, and the total phenolic compounds was determined (
Table 7). The application of acid hydrolysis involves the possibility of the transformation of sugars (including pentoses) to furfural and levulinic acid, and to 5-HMF in the case of glucose [
23,
39]. Partial hydrolysis of lignin as a result of which phenolic compounds pass into the hydrolysate solution is also possible. Therefore, the use of acid in the saccharification process of lignocellulosic biomass may be associated with the formation of compounds negatively affecting the metabolism of microorganisms (so-called inhibitors). Depending on the concentration, inhibitors may completely block the course of fermentation processes or affect the products of microbial metabolism [
40,
41]. Presence of inhibitors in the hydrolysate often involves the need to perform the detoxification prior to fermentation. In this work, the effect of the hydrolysis conditions with 85% phosphoric acid solution on the content of fermentation inhibitors was investigated. Analysis of the obtained results shows that temperature of hydrolysis is the most significant parameter influencing the formation of fermentation inhibitors. The rate and efficiency of catalytic conversion of simple sugars to furfural and HMF is higher for higher temperatures of the hydrolysis. At temperatures above 100 °C, degradation processes occur in which, apart from the destruction of sugars, there is also degradation of furfural, HMF, as well as phenolic compounds. The effects of degradation increase with the increase of the duration time of the hydrolysis process. This is why when the hydrolysis time is 8 h and the hydrolysis temperature is 120 °C, the concentrations of simple sugars and inhibitors are almost zero. The performance of the hydrolysis at lower temperature leads to the formation of inhibitors, however, their concentration is much lower than for the process carried out at higher temperature and for the same time. Comparing the processes carried out at temperatures of 90 and 60 °C for the duration time resulting in similar efficiency of reducing sugars (i.e., 0.5 h, 90 °C and 8 h, 60 °C), the concentration of selected inhibitors is similar (experiments 1 and 10,
Table 7). The concentration of total phenolic compounds is additionally affected by the alkaline pre-treatment. The use of alkaline treatment prior to acid hydrolysis (AlAcH) allowed to reduce the concentration of phenolic compounds by 29.2 mg/g
biomass, and furfural by 27.5 mg/g
biomass as compared to the process without alkaline treatment (AcH). However, the concentration of 5-HMF is almost doubled when alkaline pre-treatment is applied, mainly due to the higher content of glucan in the material after the alkaline pre-treatment. The higher the concentration of NaOH, the lower the concentrations of furfural and total phenolic compounds and the higher the concentration of NaOH, the higher the concentration of 5-HMF (compare the experiments i.e., 2 and 1, 4 and 3, etc.,
Table 7). No vanillin, vanillic acid, and guaiacol was identified in the investigated samples of hydrolysates. In order to determine the effect of inhibitors on the bioethanol yield, detoxification of AlAcH and AcH hydrolysates was carried out. For this purpose, sorption on silica gel modified with octadecyl groups was applied. The use of this type of adsorbent allowed the almost complete removal of furfural and phenolic compounds and about a three- to five-fold decrease in 5-HMF concentration. The applied method of detoxification is effective and allows for the removal of phenolic compounds and furan derivatives from the hydrolysates, without the simultaneous loss of reducing sugars. Authors of [
42] applied a XAD-4 sorbent polymer. As a result of detoxification with this method, 5-HMF was completely removed and the furfural concentration was reduced by about 6.5 times. In addition, acetic acid was also removed by means of electrodialysis. Interestingly, commonly-used activated carbon does not allow for complete removal of fermentation inhibitors. For example, the use of a two-stage detoxification (combination of hydrolysis treatment with calcium hydroxide and activated carbon) allows to remove 78.3% of the total phenolic and furan compounds from the solution after two-stage hydrolysis with sulfuric acid [
43]. The use of electrodialysis allows for the complete removal of acetic acid and more than 50% of total phenolic compounds, however, it has no significant effect on reducing the concentration of furan derivatives [
44]. After enzymatic hydrolysis, as in this study, no phenolic compounds, 5-HMF, and furfural were identified in the hydrolysate [
45].
2.6. Influence of the Pre-Treatment on the Bioethanol Yield
The industry uses various species and breeds of yeast belonging to the genus Saccharomyces. They are able to ferment simple sugars, i.e., glucose, fructose, mannose, maltose, and sucrose. During intensive fermentation, yeast cells are distributed throughout the entire volume of fluid. The yeasts of the upper fermentation (Saccharomyces cerevisiae) conduct the process at a higher temperature than the yeast of the lower fermentation (Saccharomyces carlsbergensis), the process itself is more intensive with the release of a large amount of CO2.
In this work, small-scale alcoholic fermentation was carried out. Hydrolysates of triticale straw, obtained as a result of alkaline pre-treatment and acid or enzymatic hydrolysis, carried out under previously-optimized conditions, were used as the process feed. Acid hydrolysis with 85% phosphoric acid (hydrolysis time of 0.5 h and temperature of 100 °C) was performed for untreated straw (AcH), as well as for the alkaline pre-treated straw (AlAcH, 6% NaOH, 6 h, 65 °C). The enzymatic hydrolysis under optimal conditions (EH, hydrolysis time of 16h, Viscozyme L content of 0.9, hydrolysis temperature of 42 °C) was also performed for the untreated material and for the alkaline pre-treated material (AlEH). In addition, acidic hydrolysates were detoxified (AcHD and AlAcHD, respectively). The results were compared to the results of fermentation carried out on glucose, untreated straw, and alkaline pre-treated straw. The course and results obtained for the different types of treatment were evaluated. Each time, the resultrefers to the amount of sludge or hydrolysate obtained from 3 g of raw material. The differences in the amount of the pre-treatment method on the sugar composition of hydrolysates, as well as the composition of the broth after the fermentation processes are presented in
Table 8.
The results indicate that the yeasts
Saccharomyces cerevisae are unable to digest sugar polymers present in the plant material if no cellulolytic enzymes are present in the reaction mixture.
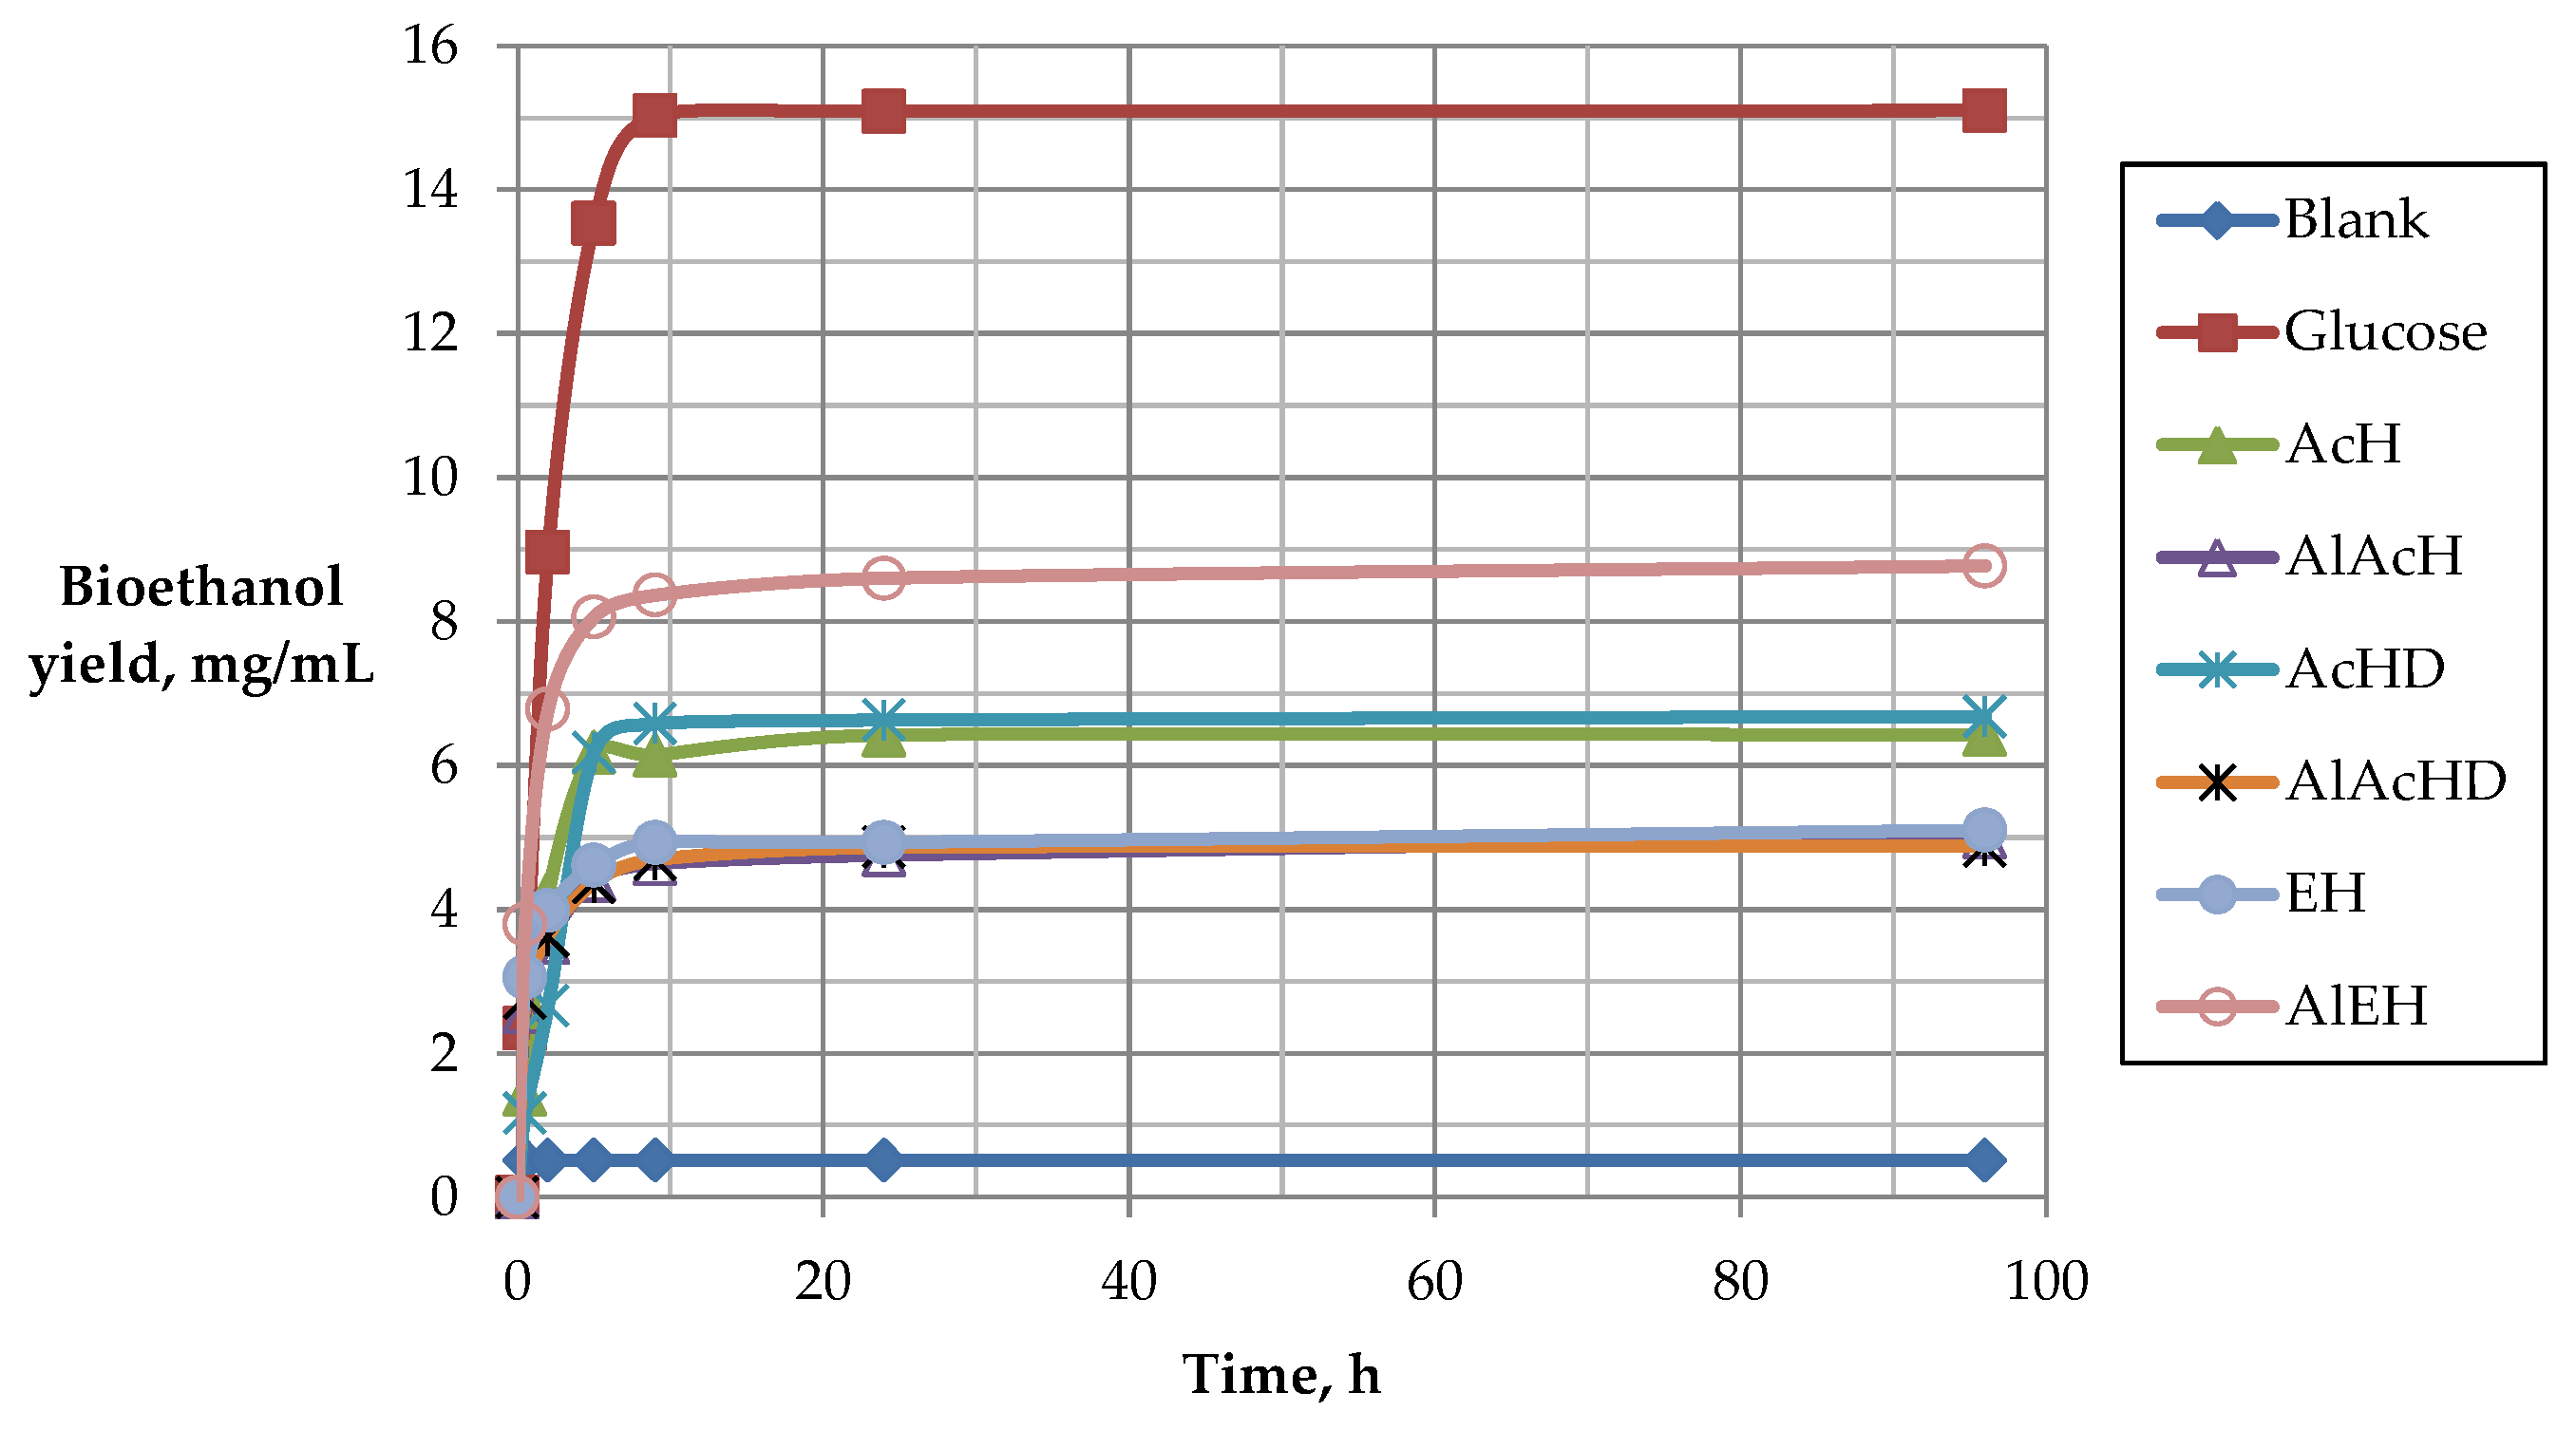
Figure 10 presents the courses of the fermentation processes. The highest ethanol yield was obtained after 9 h of the fermentation processes.
The highest ethanol concentration (8.8 mg/mL), corresponding to a yield of 0.29 g/gbiomass, was obtained for the fermentation carried out for alkaline pre-treated and enzymatically-hydrolyzed material. The ethanol concentration was 3.7 mg/mL higher than the concentration obtained for the hydrolysate subjected to enzymatic hydrolysis only. This result confirms the desirability of conducting alkaline pre-treatment.
The beneficial effect of alkaline treatment described above does not occur when the saccharification is carried out by means of acid hydrolysis. Higher ethanol yield 0.21 g/gbiomass was obtained for the process where the untreated material was hydrolyzed with acid (AcH) compared to the fermentation carried out on the material after two-stage treatment (alkaline pre-treatment and acid hydrolysis, AlAcH), where the bioethanol yield was 0.16 g/gbiomass. The given low yield may be due to the large weight loss (48%) as a result of the pre-alkaline treatment. Obtained results of alcoholic fermentation prove that using the alkaline pre-treatment prior to acid hydrolysis is pointless.
In addition, fermentation was carried out on acidic hydrolysates after the removal of fermentation inhibitors. Despite effective detoxification, no significant increase in ethanol yield was obtained. For the fermentation of AcHD hydrolysate, 0.3 mg/mL more ethanol was obtained than for AcH, while for AlAcHD, the increase in ethanol was even smaller and was only 0.1 mg/mL more than for the AlAcH fermentation.
In other studies, using
Saccharomyces cerevisiae, partial removal of inhibitors (vanillic acid, furfural, acetic acid, feluric acid, syringaldehyde) allowed to obtain a concentration of ethanol higher by 0.27 g/g
biomass [
8]. The detoxification by extraction with a mixture of trialkylamine, octanol, and kerosene significantly improved the efficiency of obtained bioethanol (21.8 mg/mL), in comparison with the ethanol yield obtained from the hydrolysate without detoxification (3.79 mg/mL) [
46]. Despite the poorer results obtained for acid compared to enzymatic hydrolysis, acid hydrolysis may be an attractive method of one-stage hydrolysis prior to alcoholic fermentation. It is mainly related to the low cost of acid compared to the enzyme cost and short preparation time of the fermentation feed material. Hydrolysates from waste lignocellulosic biomass, obtained by using phosphoric acid during hydrolysis, mayenrich the process feed for industrial processes of alcoholic fermentations of starch-rich substrates. This approach would increase the share of second-generation biofuels. In addition, when neutralized with phosphoric acid, e.g., with ammonia, a good medium for yeast is obtained, which promotes a reduction in the waste generation from the use of the acid during the saccharification.
Studies on the alcoholic fermentation of acid hydrolysates [
1] were also carried out using dilute sulfuric acid. Obtained hydrolysates were rich mainly in hemicellulose hydrolysis products (arabinose and glucose), and the fermentation of these compounds allowed obtaining ethanol (0.23g/g
biomass).
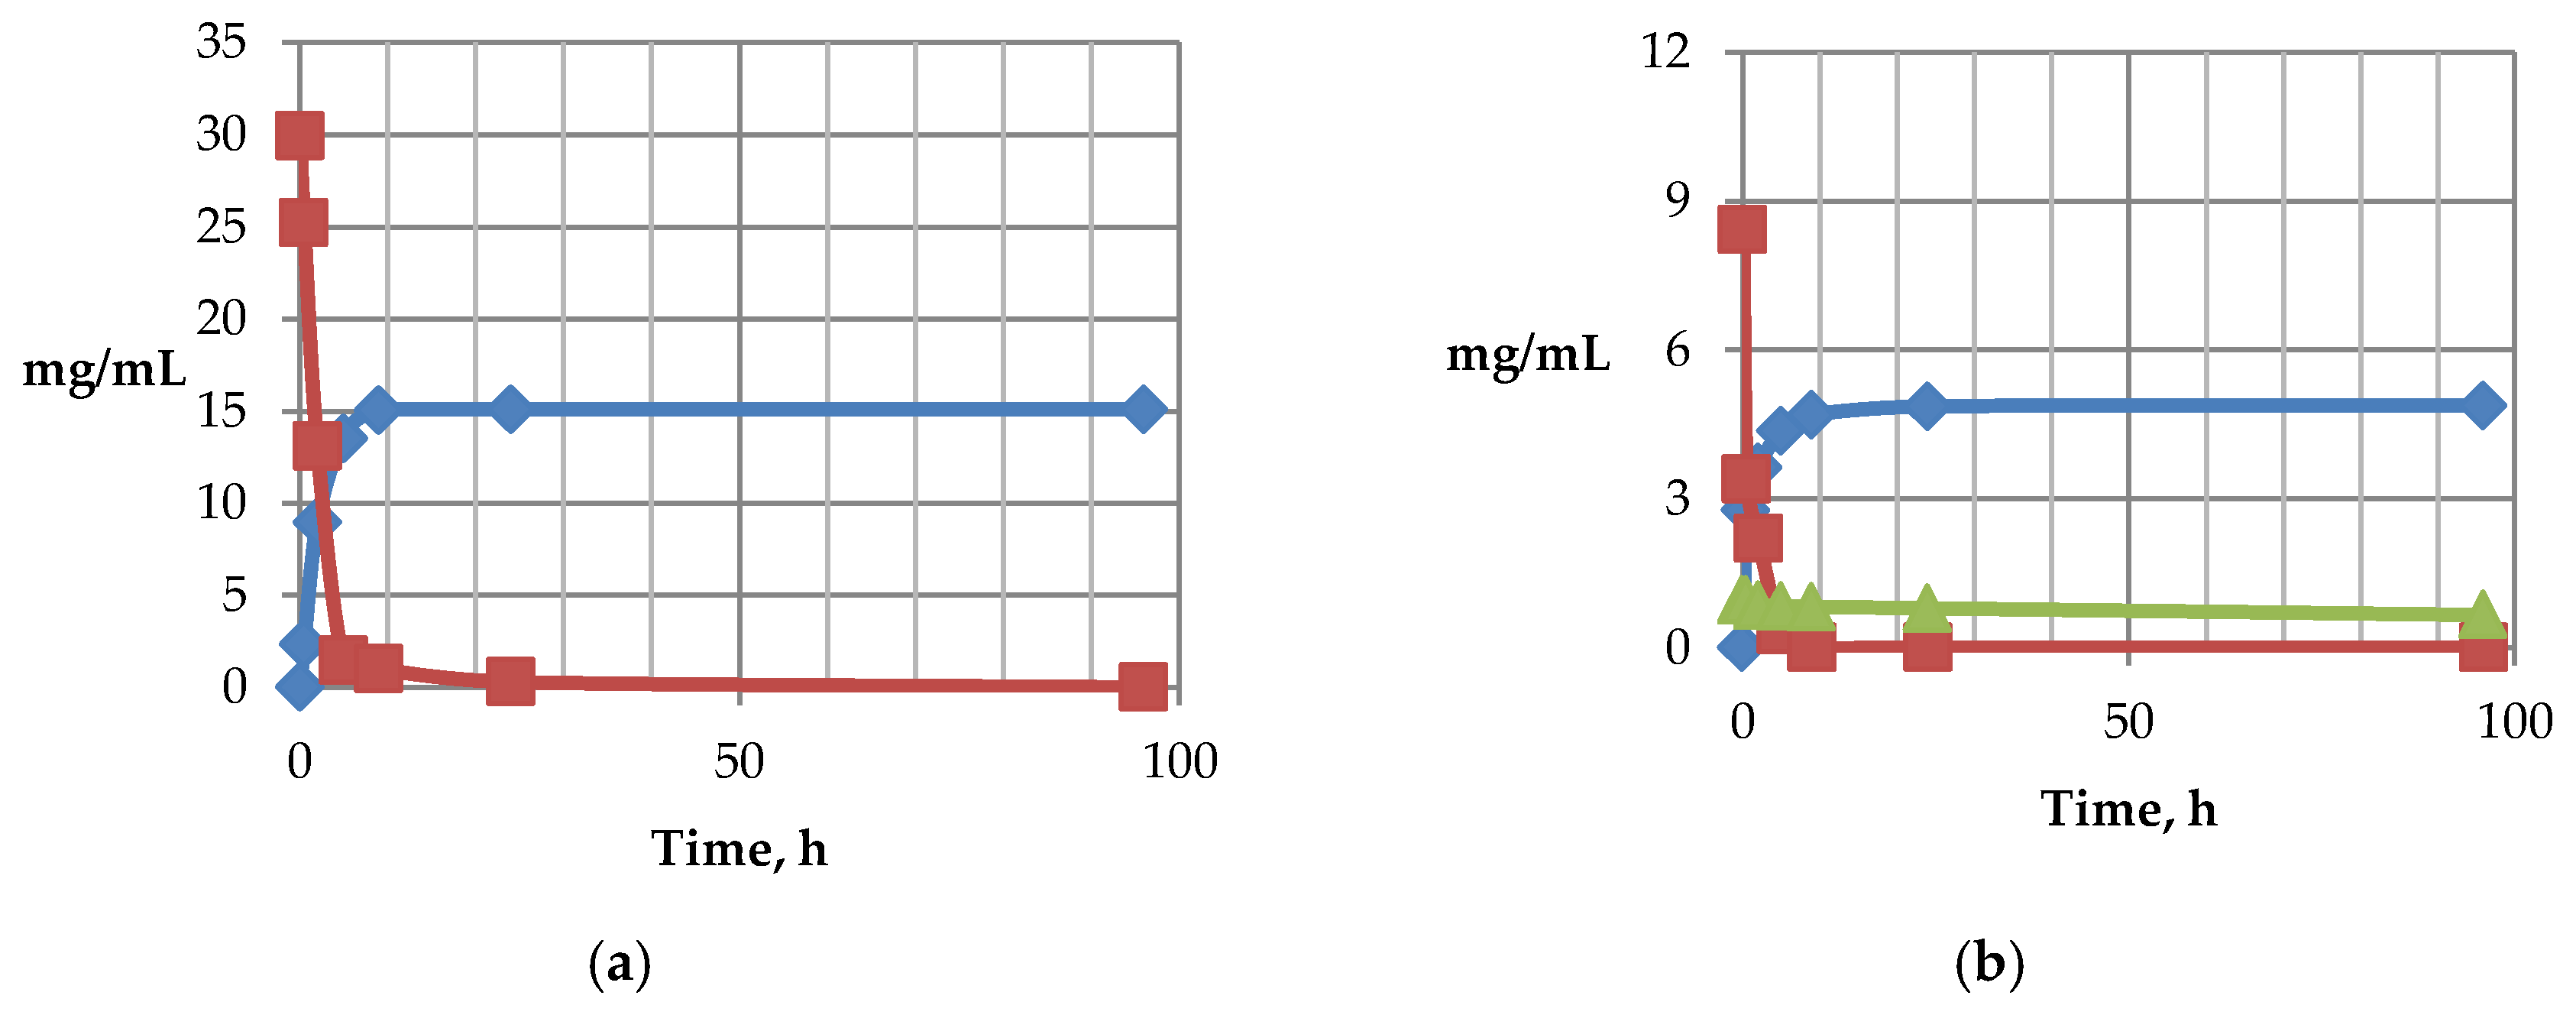
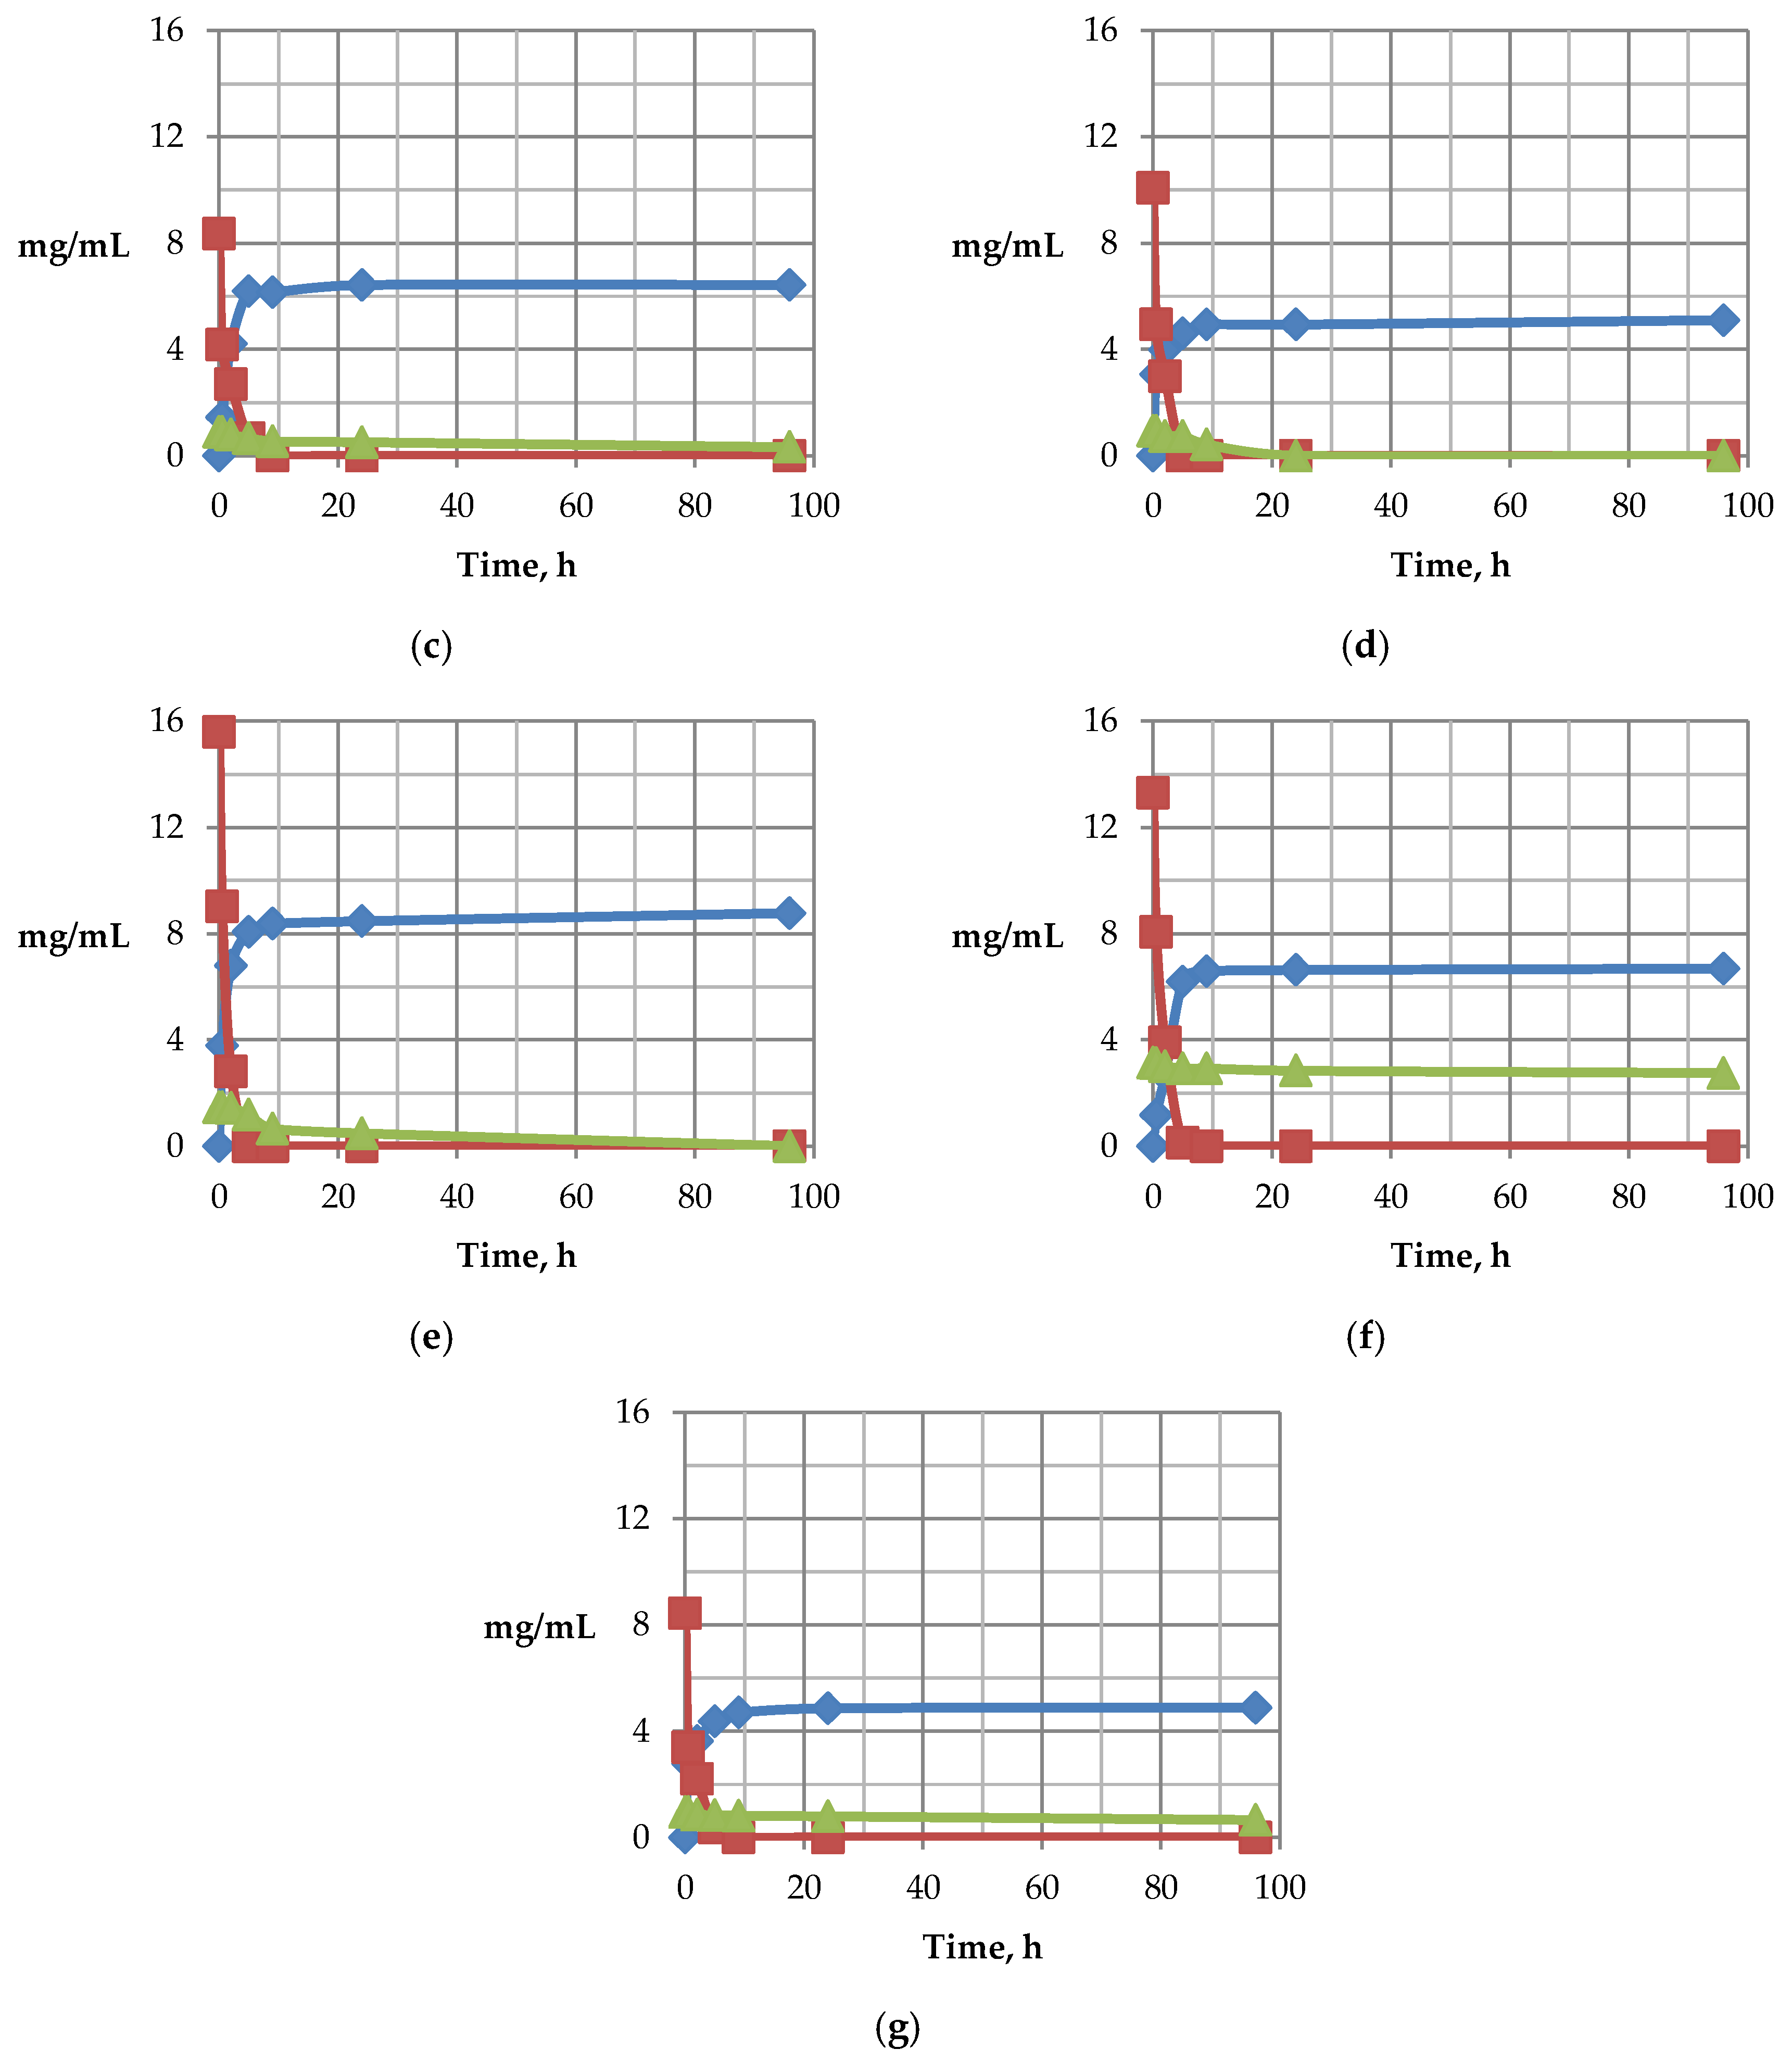
The results of fermentation on hydrolysates (
Figure 11) indicate that glucose is completely digested within the first 5 h of the process. During the fermentation of AlEH and EH hydrolysates, cellobiose is also digested, however, a significant loss of concentration of this disaccharide is observed only after complete consumption of glucose. Additionally, xylose undergoes digestion only after the complete digestion of glucose by yeast. Total xylose consumption was observed after 24 hours of fermentation. The order of sugar digestion described above is confirmed by other papers indicating that digestion of xylose by
Saccharomyces cerevisiae is possible only after complete consumption of glucose [
3]. Interestingly, the yeast
Saccharomyces cerevisiae D5A, during the fermentation of hydrolyzed trunks of palm trees, was not able to digest xylose [
6].
The research results show that cellobiose and xylose were not completely digested by yeast during fermentation on hydrolysates, both after one-step acid hydrolysis (AcH) and after acid hydrolysis preceded by alkaline pre-treatment (AlAcH). Only 30% and 64% of xylose, respectively, were converted into fermentation products. This result can be explained by the presence of fermentation inhibitors in AcH and AlAcH hydrolysates, however, even after removal of inhibitors (AcHD and AlAcHD), the fermentation of xylose does not proceed completely. It turns out that the presence of inhibitors affects the utilization of xylose in the alcoholic fermentation from
Pichia stipitis CBS 5776. The results presented in [
46] indicate that the xylose from the detoxified hydrolysate was digested completely after 60 h, and during the fermentation on the hydrolysate without detoxification only 15% of xylose was digested. The results of other studies indicate that the digestibility of xylose depends on its initial concentration in the hydrolysate and on the ratio of glucose to xylose. The highest conversion degree of xylose (83.2%) to ethanol and xylitol was achieved when the xylose concentration was about 5.5 times higher than the glucose concentration. A much worse result (20%) was achieved when the fermentation broth contained three times more glucose [
1].
Arabinose and galactose, regardless of the method and conditions of biomass pre-treatment and hydrolysis, are not consumed during the fermentation. The inability of
S. cerevisiae to metabolize arabinose has been previously demonstrated in [
1]. In addition, besides bioethanol, other typical byproducts were identified including glycerin, acetic acid, succinic acid, and methanol (
Table 8).
Table 9 presents a summary of the research results from this work compared to other published results regarding similar biomass types.
Alcoholic fermentation of sugars in the presence of yeast belongs to the rapidly-growing industry and is used in brewing, viticulture, distilling, candling of fruit, yeast production, bread, as well as in environmental protection. This process involves the oxidation of carbohydrates by appropriate yeast strains, resulting in the formation of ethyl alcohol, used for food and industrial purposes. The raw materials used in the fermentation industry are divided into three groups. The first includes sugar products: molasses, fruit juices, sugar cane, the second: starch materials (rye, barley, and wheat), and the third: cellulose products (wood and sulphite waste liquids). Yeast contains enzymes that hydrolyze disaccharides to simple sugars. Only four hexoses are fermented under the influence of yeasts: d-glucose, d-mannose, d-fructose, and d-galactose. The last one is hardly fermented and not under the influence of all yeast species. Alcohol as the final fermentation product is isolated by distillation. The yield calculated on the ratio of fermenting sugars is about 90%.

 ,
, 


