The Determination of Load Profiles and Power Consumptions of Home Appliances


1
Electronics and Automation Department, Cankiri Karatekin University, Cankiri 18200, Turkey
2
Technology Faculty, Electrical and Electronics Engineering Department, Gazi University, Ankara 06500, Turkey
*
Author to whom correspondence should be addressed.
Energies 2018, 11(3), 607; https://doi.org/10.3390/en11030607
Submission received: 26 January 2018
/
Revised: 14 February 2018
/
Accepted: 7 March 2018
/
Published: 9 March 2018
(This article belongs to the Section F: Electrical Engineering)
Abstract
:In recent years, the increment of distributed electricity generation based on renewable energy sources and improvement of communication technologies have caused the development of next-generation power grids known as smart grids. The structures of smart grids have bidirectional communication capability and enable the connection of energy generated from distributed sources to any point on the grid. They also support consumers in energy efficiency by creating opportunities for management of power consumption. The information on power consumption and load profiles of home appliances is essential to perform load management in the dwelling accurately. In this study, the power consumption data for all the basic home appliances, utilized in a two-person family in Çankırı, Turkey, was obtained with high resolution in one-second intervals. The detailed power consumption analysis and load profile were executed for each home appliance. The obtained data is not only the average power consumption of each appliance but also characterizes different operating modes or their cycles. In addition, the impact of these devices on home energy management studies and their standby power consumptions were also discussed. The acquired data is an important source to determine the load profile of individual home appliances precisely in home energy management studies. Although the results of this study do not completely reflect the energy consumption behavior of the people who live in this region, they can reveal the trends in load demands based on a real sample and customer consumption behavior of a typical two-person family.
1. Introduction
Smart grids (SGs) that attract intensive attention are reliable power grids having self-healing ability, comprising the consumers producing their own energy based on renewable energy sources with minimum cost and allowing the use of available infrastructure with full capacity [1,2,3,4]. In addition, SGs give the opportunity for consumers to operate demand response programs independently so that the optimal matching between source and load can be spread to each region of the horizontal time axis by considering consumer habits. In the beginning, demand response was supposed as a change in normal consumption demand taking into account the decrease or increase of the electrical energy production [5]. Initial demand response programs were used to control loads at peak times in the United States [6]. Demand response programs, considered as a power system resource and an essential part of SGs currently, bring economic benefits to the consumers and utility by spreading the consumption of electrical loads to the time axis, and they also enhance the reliability and sustainability of power grids [6,7]. In many countries, incentives are given directly or indirectly to encourage the use of demand response programs. Dynamic demand response programs were accepted by the European Union as a strategic tool to achieve three main objectives, which are reducing greenhouse gases by 20%, increasing the energy production based on renewable energy sources by 20%, and increasing energy efficiency by 20% [8]. Although the electricity consumed in buildings varies from country to country, it is equal to 30–40% of the total electricity consumption all over the world [9]. According to the data by the Turkish Statistical Institute, the electricity which is consumed by houses and commercial and government buildings approximately constitutes 45% of overall energy consumption in Turkey [10]. While industrial and commercial buildings make use of demand response opportunities all around the world, the vast majority of residential buildings cannot use these opportunities [11]. It is the opinion that dwelling comfort may be reduced and energy consumption habits are the biggest obstacle for the implementation of demand respond programs at homes [12]. However, intelligent home energy management systems have gained popularity in recent years with the aim of enhancing the dwelling comfort in parallel with the advances in information and internet technologies [13,14]. Therefore, home energy management studies play a crucial role in enabling demand response programs to be used effectively in residences [15].
The determination of residential load profile and electric power consumption has an effect upon the accuracy of demand response studies. Thus, several methods were used to generate the load profile and power consumption of home appliances precisely [16,17,18,19]. The bottom-up approach is often used to generate real electricity consumption data of a residence in the literature [20]. The most important disadvantage of the bottom-up approach is that it needs the detailed load consumption data [21]. To date, in many publications, representative data and statistical averages of the consumption of electrical appliances have been used to overcome this problem. Ref. [22] classified the buildings in Singapore based on their energy consumption and built their mathematical models and load profiles using the bottom-up model. Then, the produced load models were compared with real models and they classified the houses by the number of rooms they had. Abeykoon V. et al. described the electrical home appliances using machine learning algorithms with the information gathered from power consumption data of home appliances with fast and high precision [23]. This modeling was accomplished for the vast majority of the devices, but there is a need for more sample consumption and training of the algorithm in order to achieve the same success in the devices that contain complex operating modes. Pipattanasomporn M. et al. specified load profiles based on the power consumption data for the specified home appliances and described the demand management potentials of these loads. Although the major electrical appliances used in the two separate houses were determined as data sources in this study, the number of these appliances can be inadequate as a source for demand response studies. In [17], the monthly power consumption of home appliances was predicted using a multiple regression model. In addition, the effect of seasonal variation on the monthly power consumption was examined. In 2007, the power consumption of home appliances in 72 dwellings was monitored for over two years and the data was recorded in five-minute intervals [24]. The results of the study showed that the energy consumption increased by 4.5% in the second year due to an increase in the appliances that were left in standby mode. Munhaw K. et al. designed a measurement and control system for the power consumption of home appliances [25]. The developed prototype suggests that home appliances can be controlled effectively by pursuing the electricity tariff prices. The results of literary reviews show that the information based on the load profiles and power consumption of home appliances is used extensively in many fields such as demand management, energy efficiency, determination of load usage trends, etc.
There are few studies focusing on the data for the power consumption and specific load profiles with high resolution of home appliances which is required in many areas. This is the main reason why the standard load profile and the average electricity consumption of home appliances were used in previous years. With the advent of SGs, more realistic load profiles and power consumption data are needed in the distribution system. The main purpose of this work is to meet the detailed power consumption data and describe load profiles of all operating modes of home appliances with different operating modes. In addition, this study aims to demonstrate demand management opportunities and the impact of standby consumption on energy efficiency by analyzing the obtained data. For this purpose, the power consumption data of 12 different home appliances used by a two-person family living in Çankırı, Turkey was recorded with high time resolution in one-second intervals from October to December 2016. A special measurement system composed of wireless power measurement plugs and a minicomputer was designed. The detailed power consumption of the home appliances was analyzed and the load profiles were created by taking different utilization modes of the devices into account. The obtained data is essential considering they can constitute a complete source of accurate and precise identification of electrical home appliances in residential energy management studies. Therefore, this paper is unique research demonstrating energy use behaviors of a two-person family in the climate and geographical conditions of Çankırı.
2. Home Appliances Power Consumption and Measurement Method
2.1. Home Appliances
In this study, 12 different home appliances in the house where two adults live were monitored and recorded for 3 months in terms of the frequency of usage and power consumption data. It was determined how often residents used each device, and the variation of energy consumption in different usage modes of the device was examined in detail. The devices selected for power consumption analysis can be found in a typical home such as refrigerator, washing machine, dishwasher, oven, iron, hair dryer, kettle, hood, toaster, LED (light-emitting diodes) television, printer, and computer. An electricity load profile was analyzed for each device considering the habit of use, the frequency of usage, and the total usage durations of home electrical appliances. Table 1 shows the brand, model, amount of power consumption, plug ID number, and efficiency class of all the devices used in the home.
2.2. Proposed Measurement Methodology
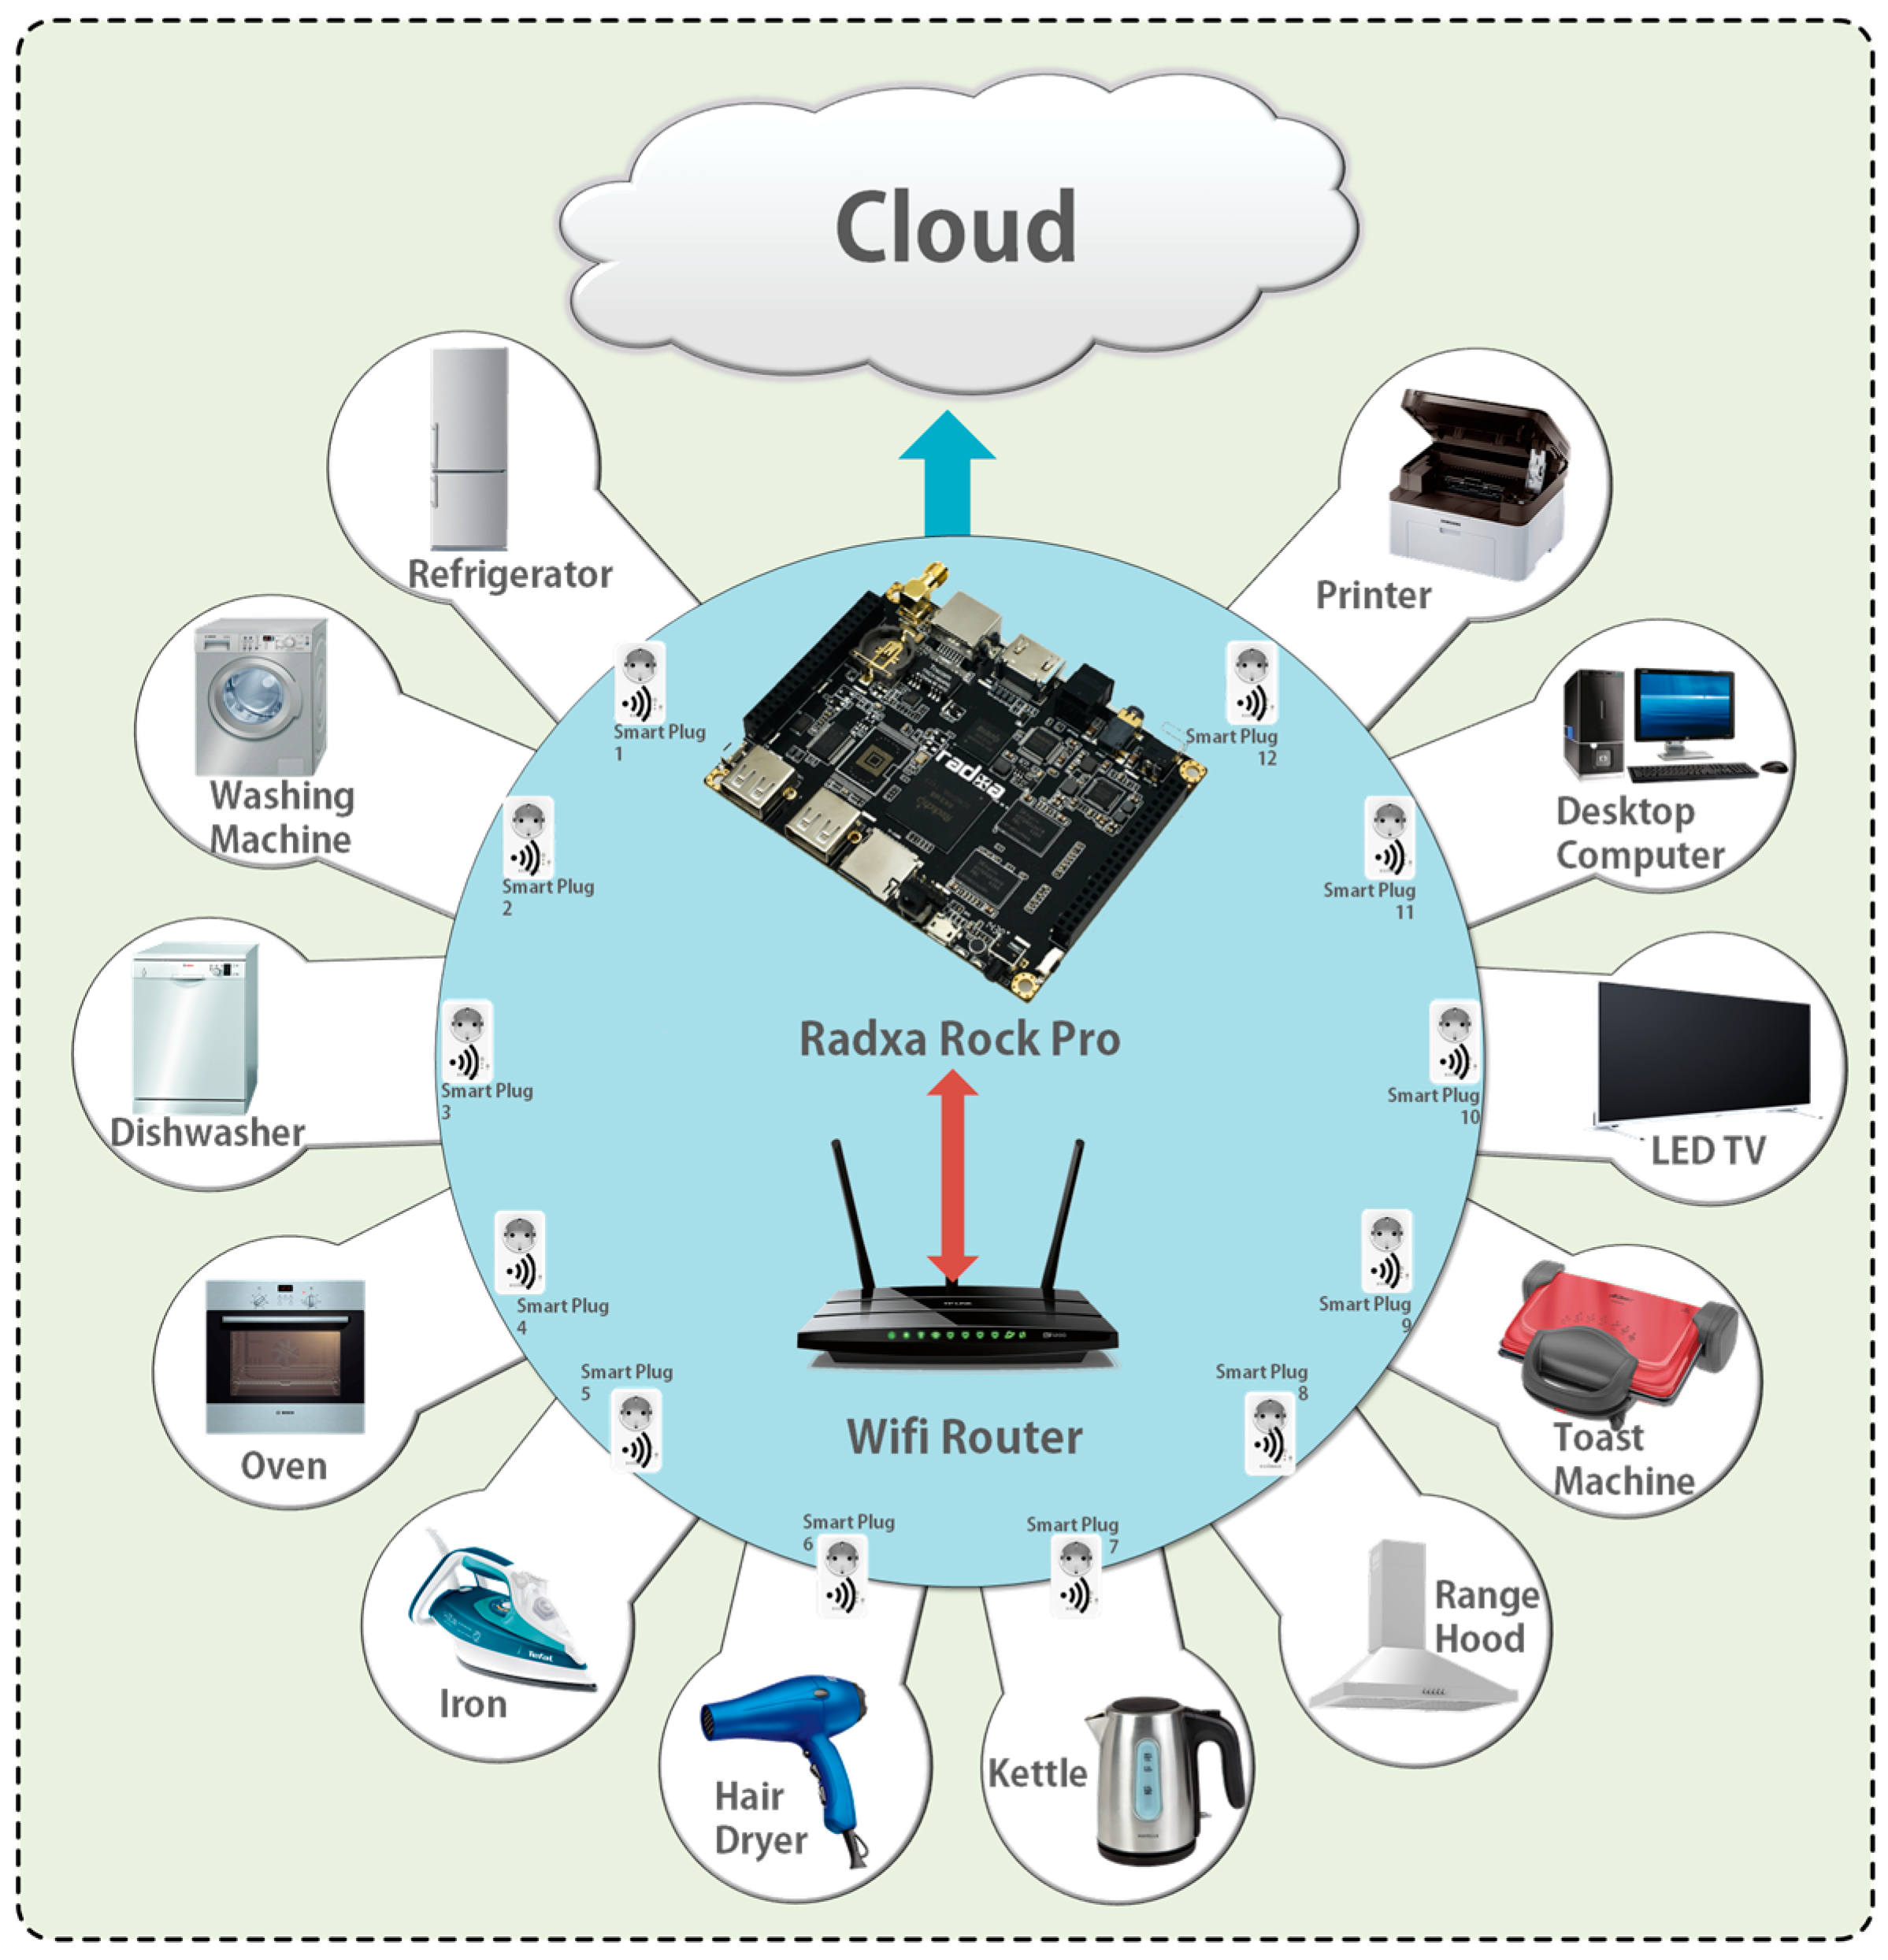
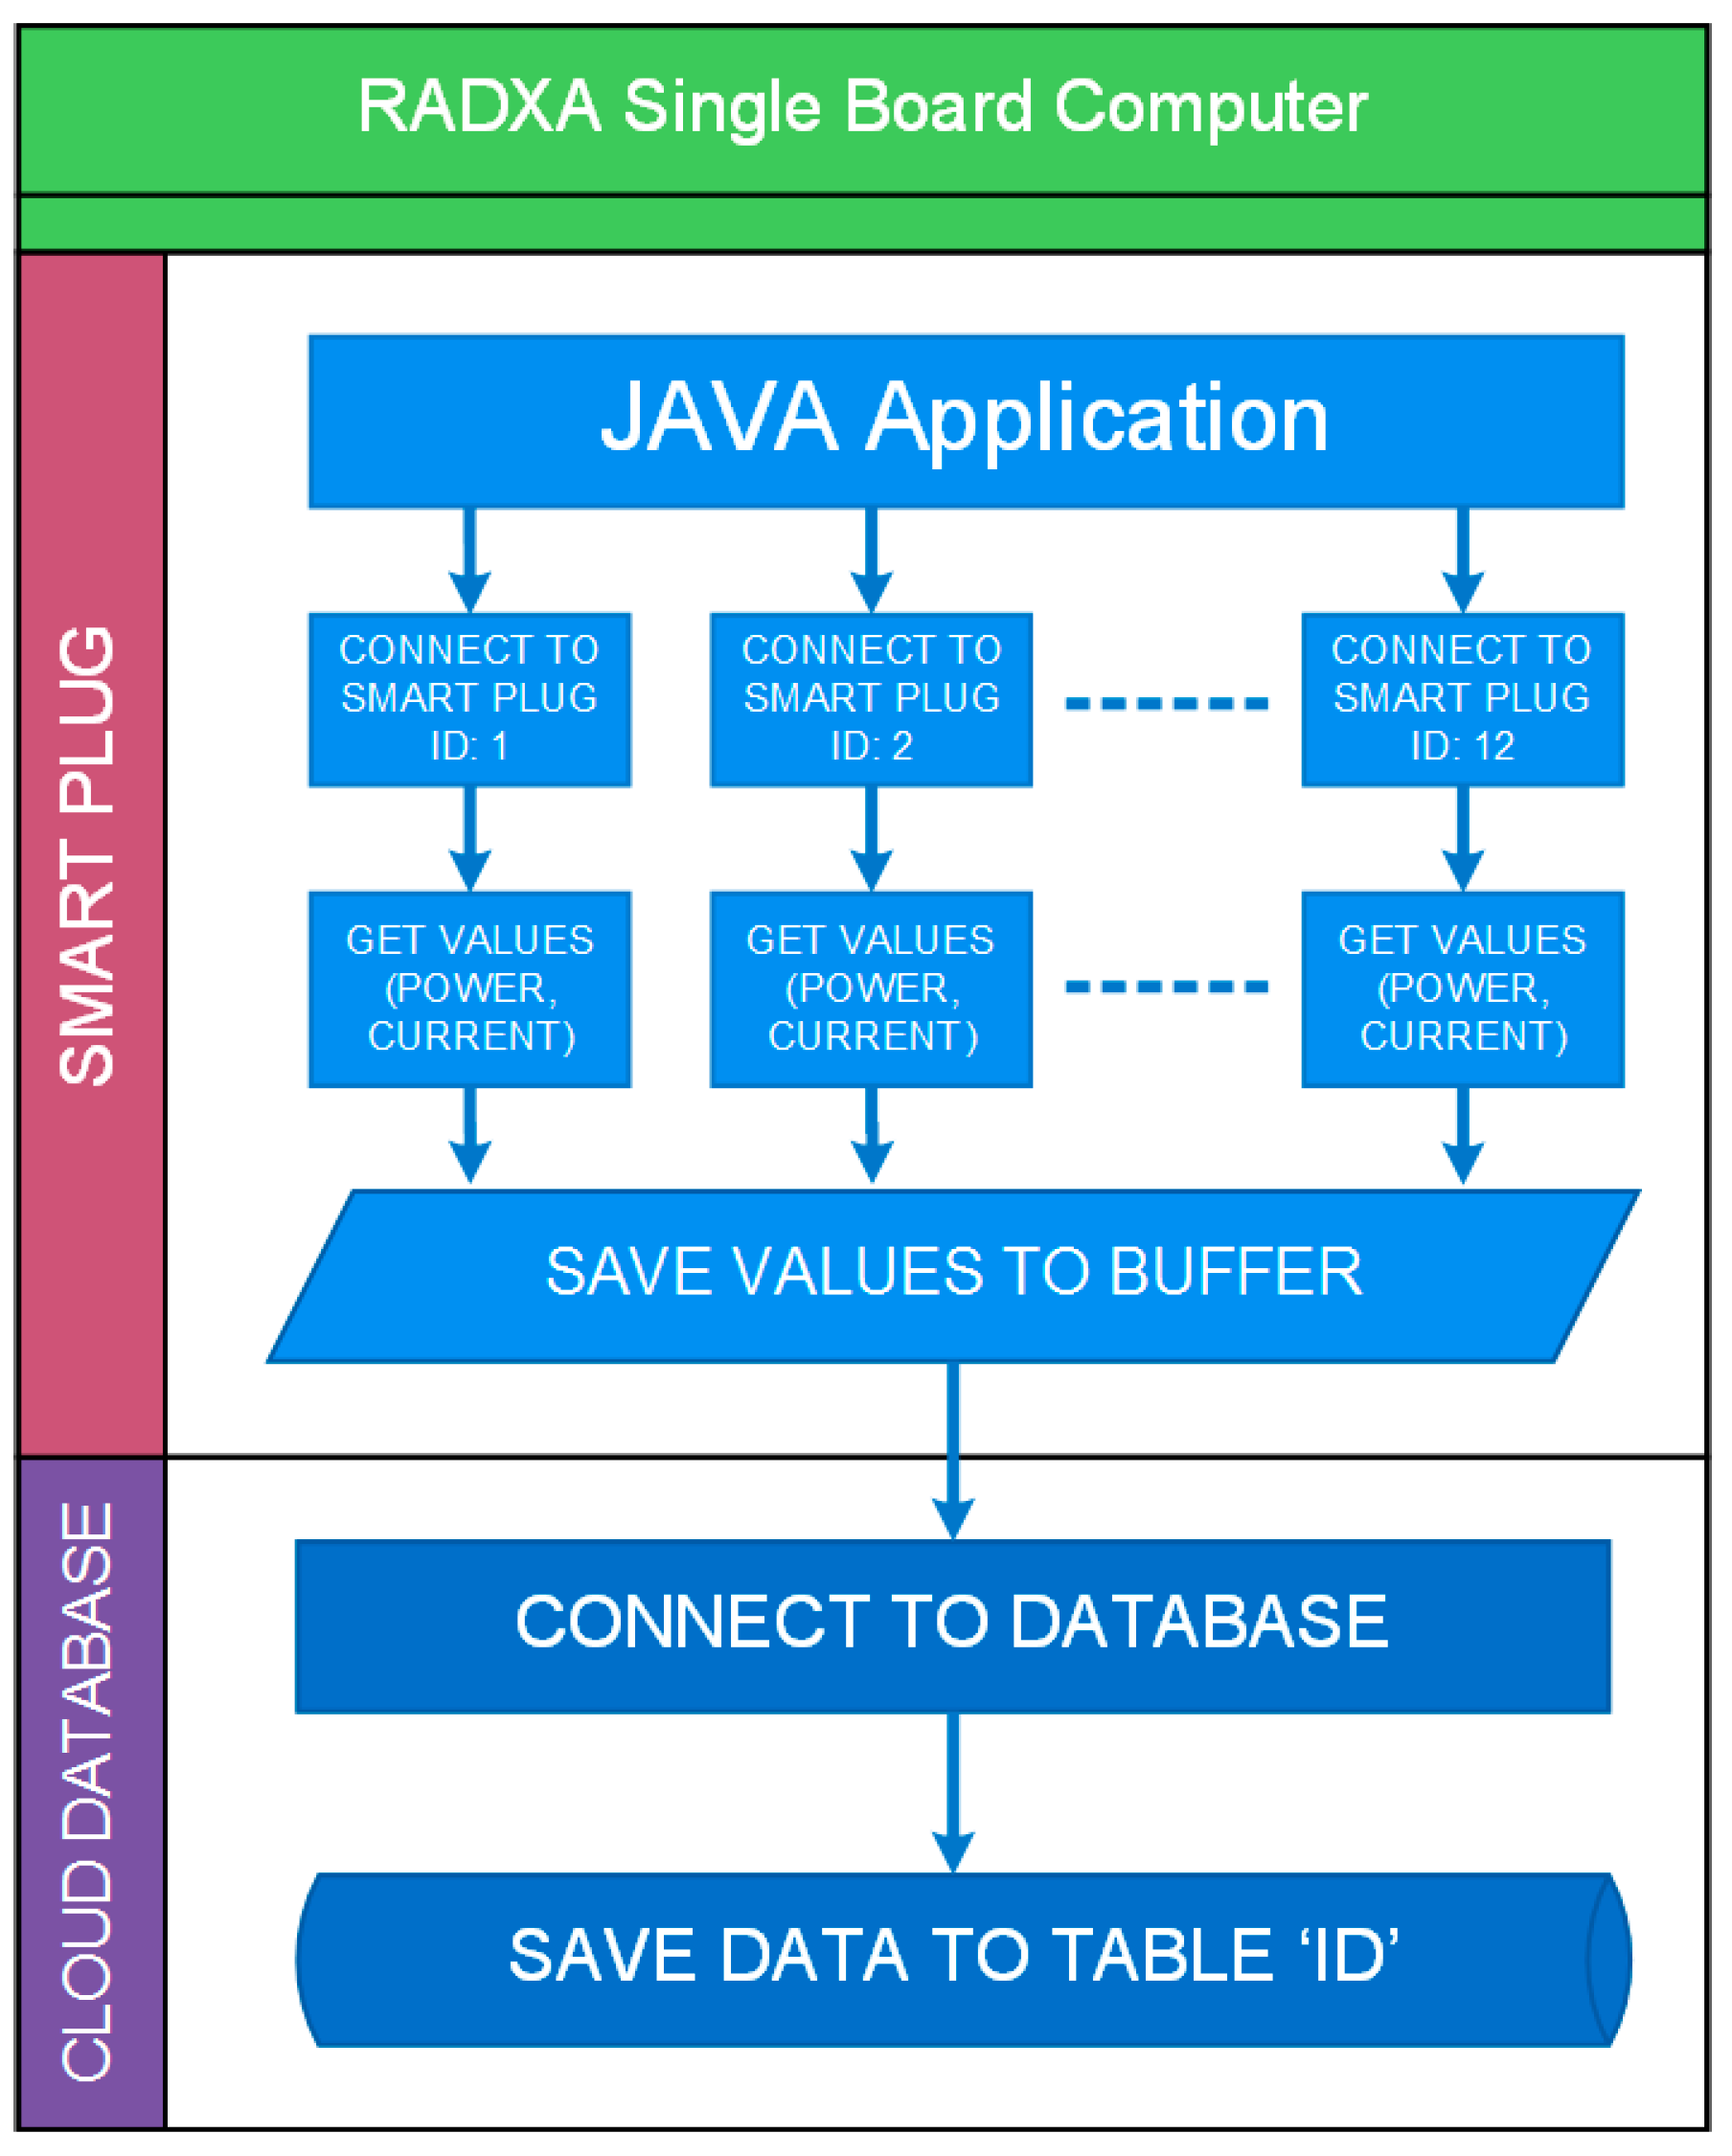
A special measuring system was designed to obtain the power consumption data of home appliances with high resolution. The designed system consists of an Edimax Smart Plug wireless power meter and Radxa RockPro single board computer (SBC). The Edimax Smart Plug was connected to each device to determine the power consumption data. The consumed power value of each device was taken from the wireless power measurement plug monitored by a Radxa RockPro SBC minicomputer with Quad Core ARM processor, 2GB of RAM and 8GB of storage space. A software based on Java was developed on the minicomputer and a Linux operating system was installed with the aim of collecting data from smart plugs. The block diagram of the implemented system and the flowchart of the developed software are given in Figure 1 and Figure 2, respectively.
In the developed software, the IP numbers of smart plugs are defined according to plug IDs and smart plugs are contacted in terms of their ID number order. The basic steps of the algorithm can be explained as follows: if the connection between smart plugs and the minicomputer is successful, the data reading process is started. When the connection is unsuccessful, the minicomputer tries reconnection three times. If the connection is still unsuccessful, then the algorithm skips this plug and moves to another plug by informing the system administrator. After the successful connection with the smart plug, current and power values are obtained by giving authorization. The obtained values are formatted with 2 decimal places. The measured values are divided into sequences and transmitted to a cloud database. If there is a table belonging to that device in the database, the data is directly recorded in the corresponding table, and if the table belonging to the device is not found in the database, a new table is automatically created. The database tables are named according to the date of the corresponding day. The recording time of the data is also added to a recording file and the data recording operation is completed. The algorithm saves the current, voltage, power, operating status of devices, clock, date, and plug ID number information in the database with 1-sec intervals for each plug. The flow diagram of the data acquisition and storage in the database is shown in Figure 3. The prepared algorithm ensures that very precise data of power consumption can be obtained by continuous data recording.
3. Numerical Results
In this section, the results of the power consumption measurements of the specified home appliances are discussed in detail for each device considering different operating modes. The data recorded for three months (from October to December 2016) and a detailed assessment was visualized by consumption data in November 2016 and dealt with in this section. The power consumption data for the remaining months except November is given and the accuracy of the measurements was verified by the residential electricity bill.
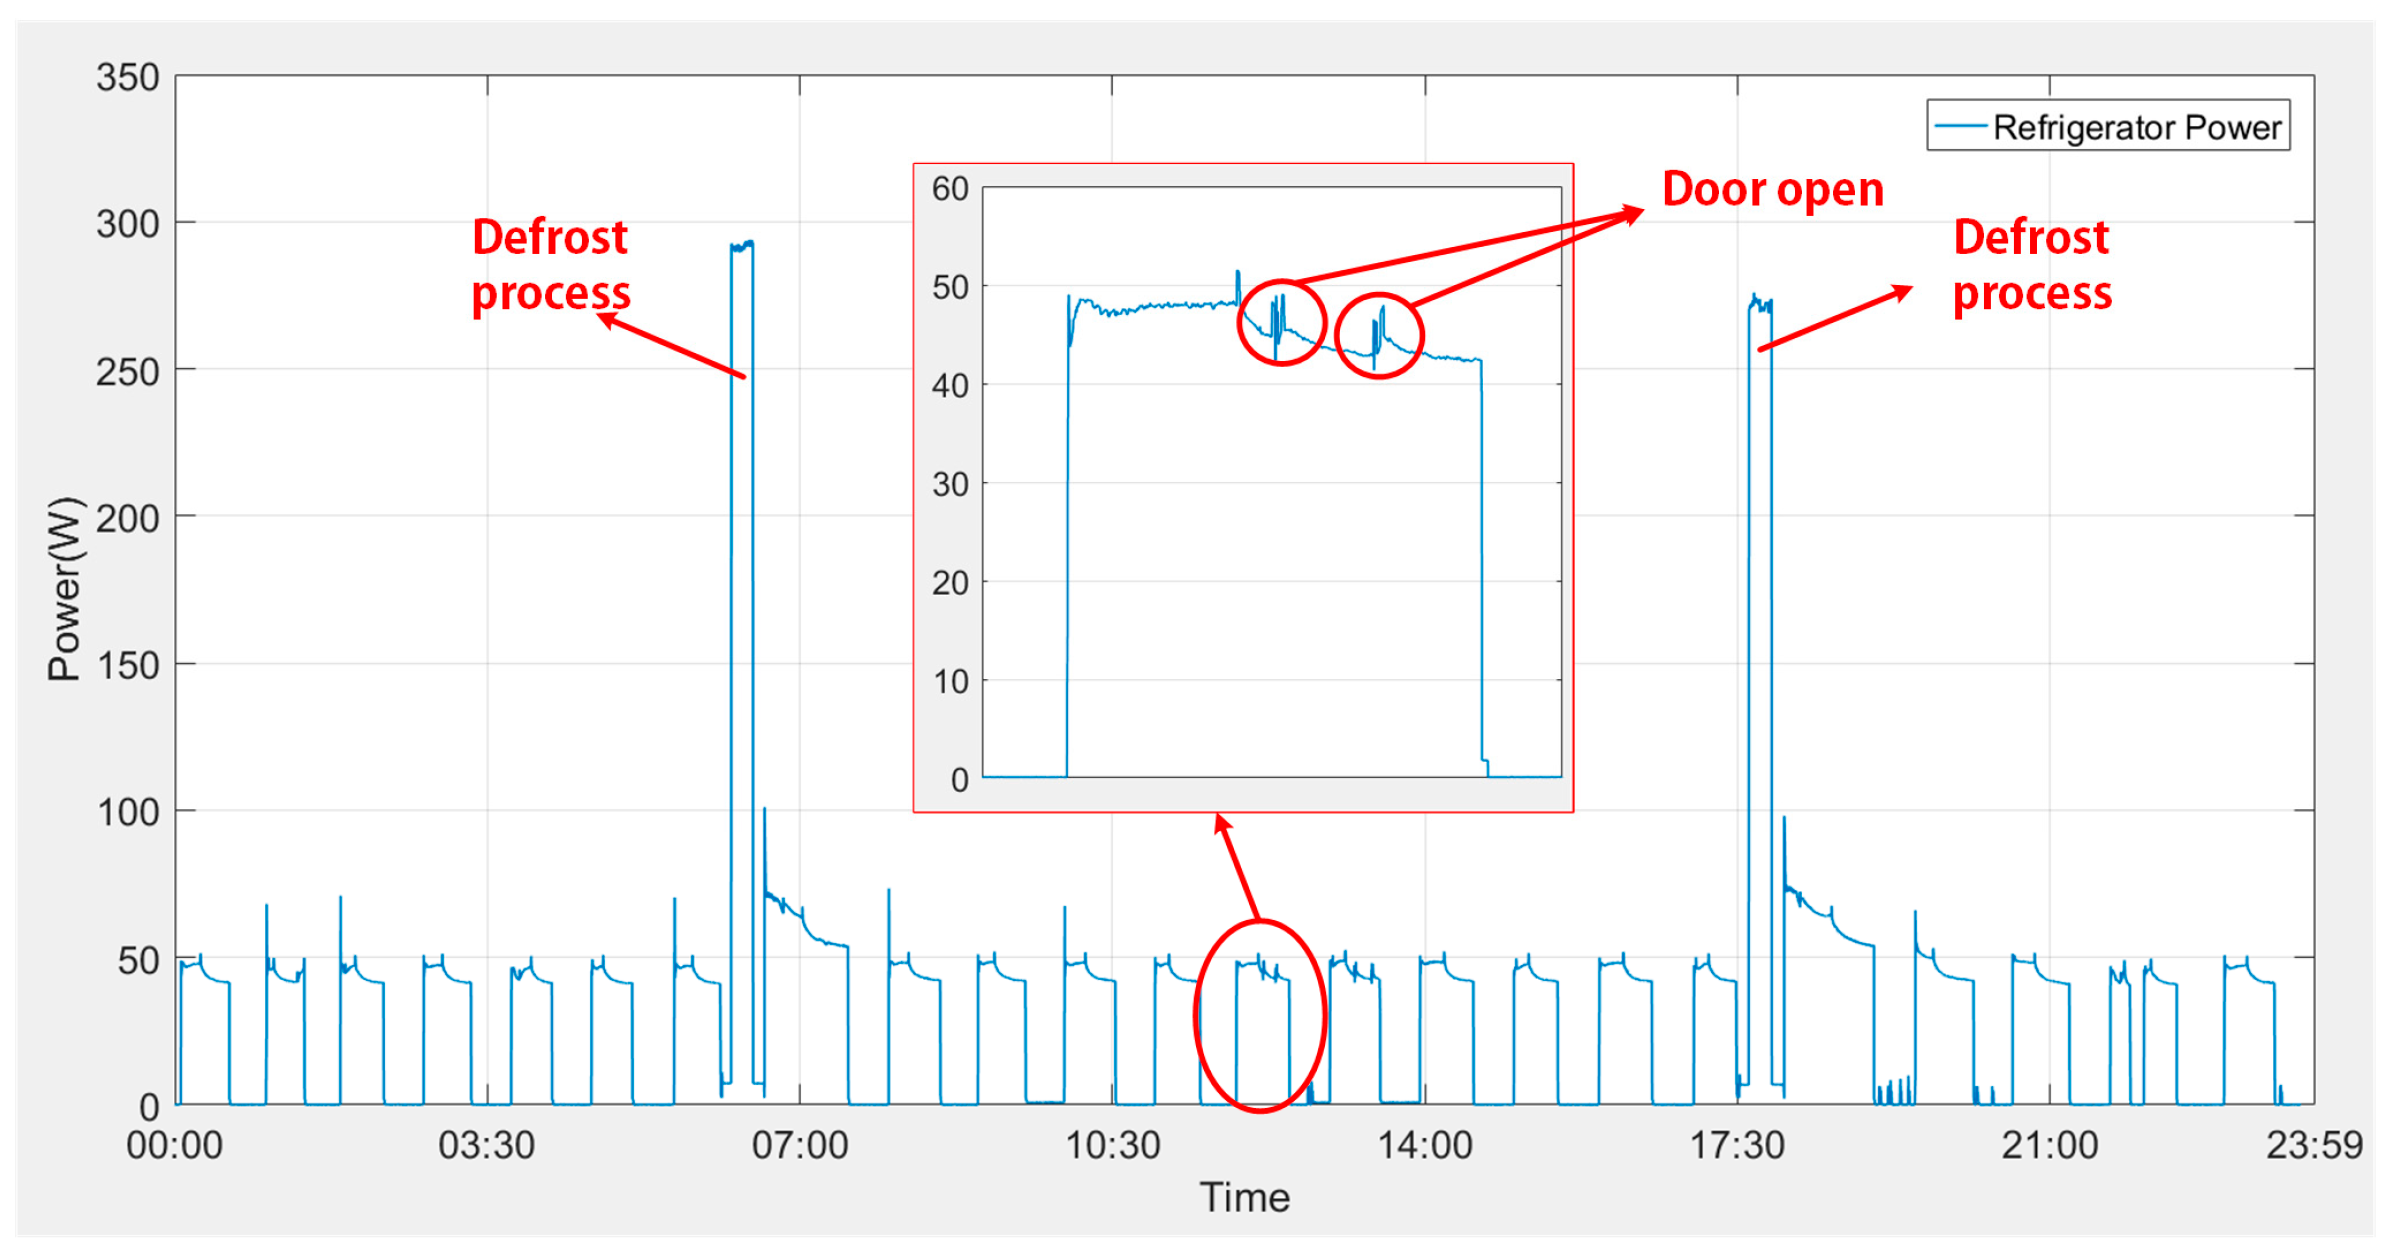
Refrigerator: The refrigerator was dealt with primarily and the daily power consumption of the refrigerator was depicted in detail in Figure 4. The refrigerator was operating for cooling at certain intervals during the day and its energy consumption during a cooling process was determined as approximately 46 W/h. The total cooling time per day was roughly measured as 13 h and 28 min. When Figure 4 is examined, it is seen that the refrigerator performs defrosting twice for 15 min each time and consumes approximately 280 W during a defrosting process. The daily consumption effect of the defrosting process was measured as 140 W. The hourly and daily average power consumption of the refrigerator were found as 32.61 W and 782.64 W, respectively.
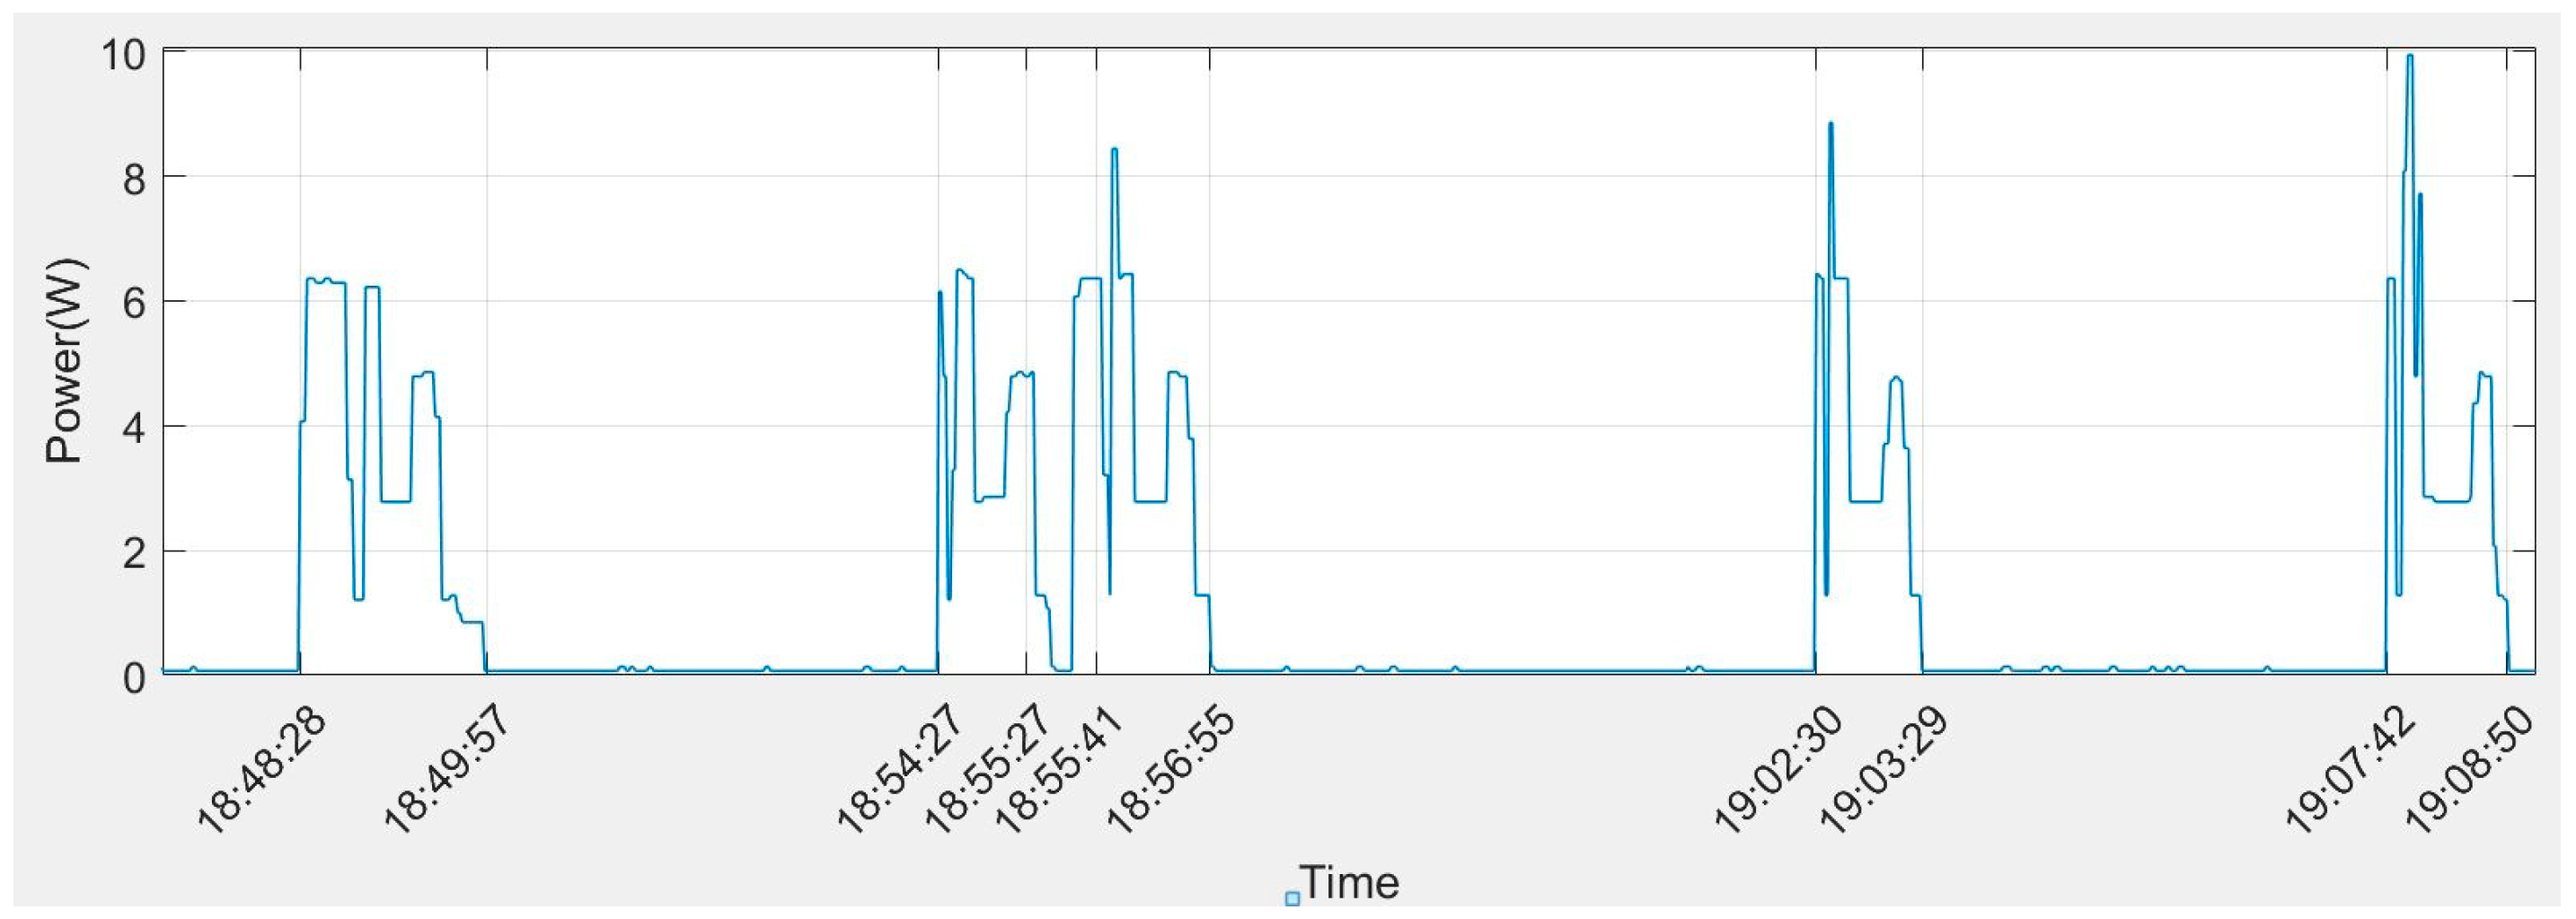
To obtain the detailed power consumption data taking into account the opening of the door of the refrigerator, the change of power consumption was given in Figure 4 and Figure 5. In Figure 5, the time–area of the refrigerator’s opening 5 times is considered in detail. On the first opening, the door of the refrigerator was left open for 30 s. After the door was closed again, the refrigerator operated the fan motor for 1 min and expended approximately 4.1 W during this process. When the door was opened for the second time, the duration of opening time was 5 s and the effect on power consumption was measured as 3.84 W/h. The refrigerator’s door was opened for 15 s for the third times and the effect on the hourly power consumption was measured as 4.4 W/h. In the fourth and fifth openings of the door, the power consumption was determined as 4.02 W/h and 3.96 W/h, respectively. It was observed that the refrigerator’s door was opened 15 times and for 15 s on an average day in this home. According to these assumptions, due to the opening of the door, the refrigerator consumed 0.25 W power for each time and this value corresponded to 3.75 W in the daily power consumption.
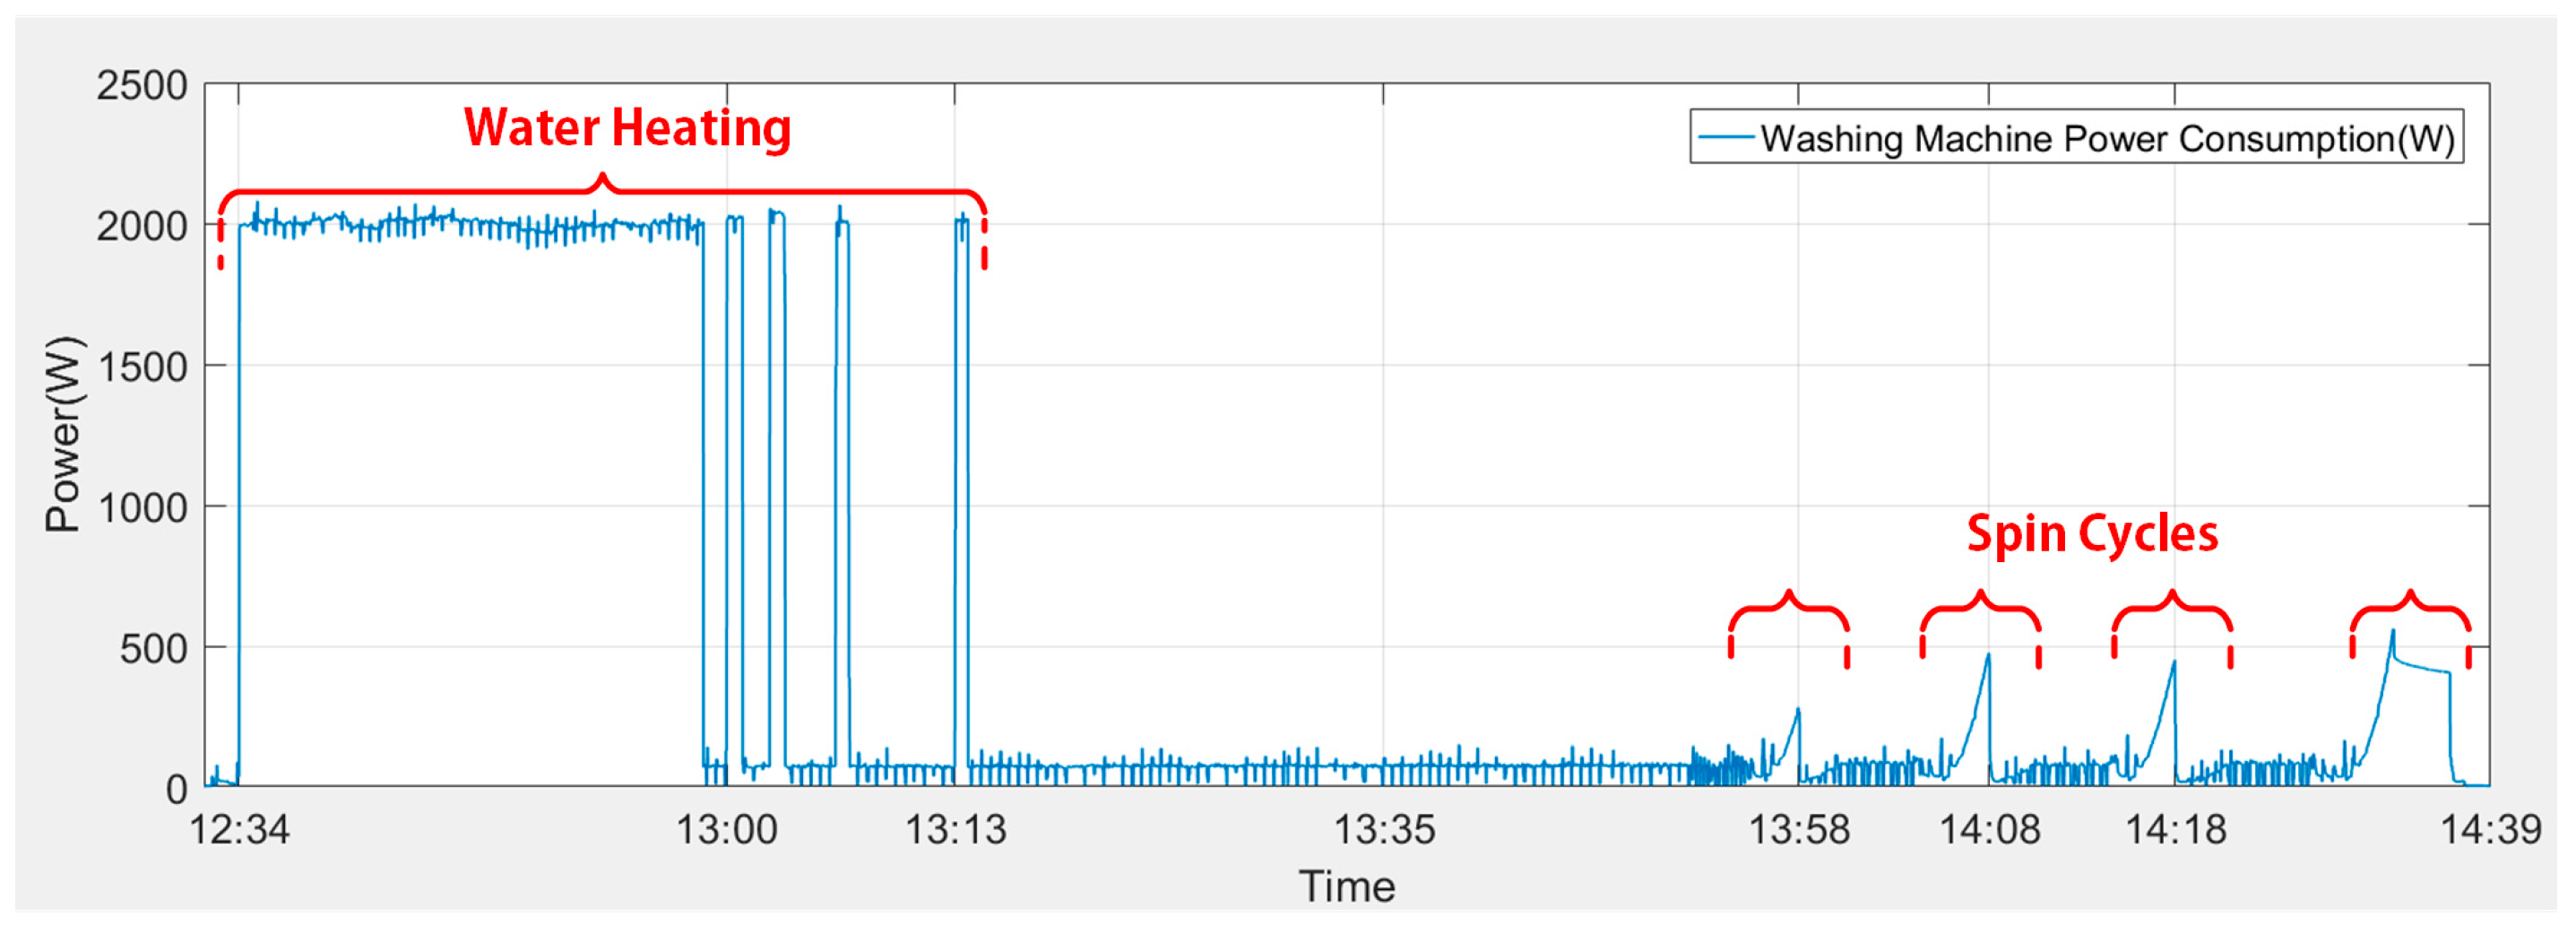
Washing Machine: The power consumed by the washing machine, which has 8 kg capacity, was measured and recorded in different washing programs. The results showed that consumers needed the washing machine using different washing modes three times in a week with full loads. We firstly investigated the cotton and synthetics wash programs at 40 °C. The duration of this washing program was 2 h and 6 min, and the heater of the machine worked to raise the water temperature to 40 °C during 1/4 of the washing time. Using the heater during operation time, the power consumption was determined as 961.09 W and the total power consumption of the machine was recorded as 1064.21 W for this washing option. It was easily calculated that the hourly power consumption of the washing machine was 506.77 W in washing conditions. It was observed that roughly 90.3% of the power consumption of the washing machine was caused by the water heater. The determination of time period for water heating was acquired from the recorded data. The data obtained from the washing modes is indicated in Figure 6.
Afterwards, we examined the mixed washing program at 30 °C. In this option, the washing time lasted 1 h and 1 min, and the total power consumed by the machine during the washing was measured as 286.19 W. The large part of the power consumption was constituted by the heater to raise the water temperature to 30 °C, similar to the previous operation mode. In this operation program, the power consumed by the heater was determined as 234.46 W. This rate corresponded to 81.9% of the total power consumption. Figure 7 shows the power consumption curve of the washing process for the 30 °C mixed washing program.
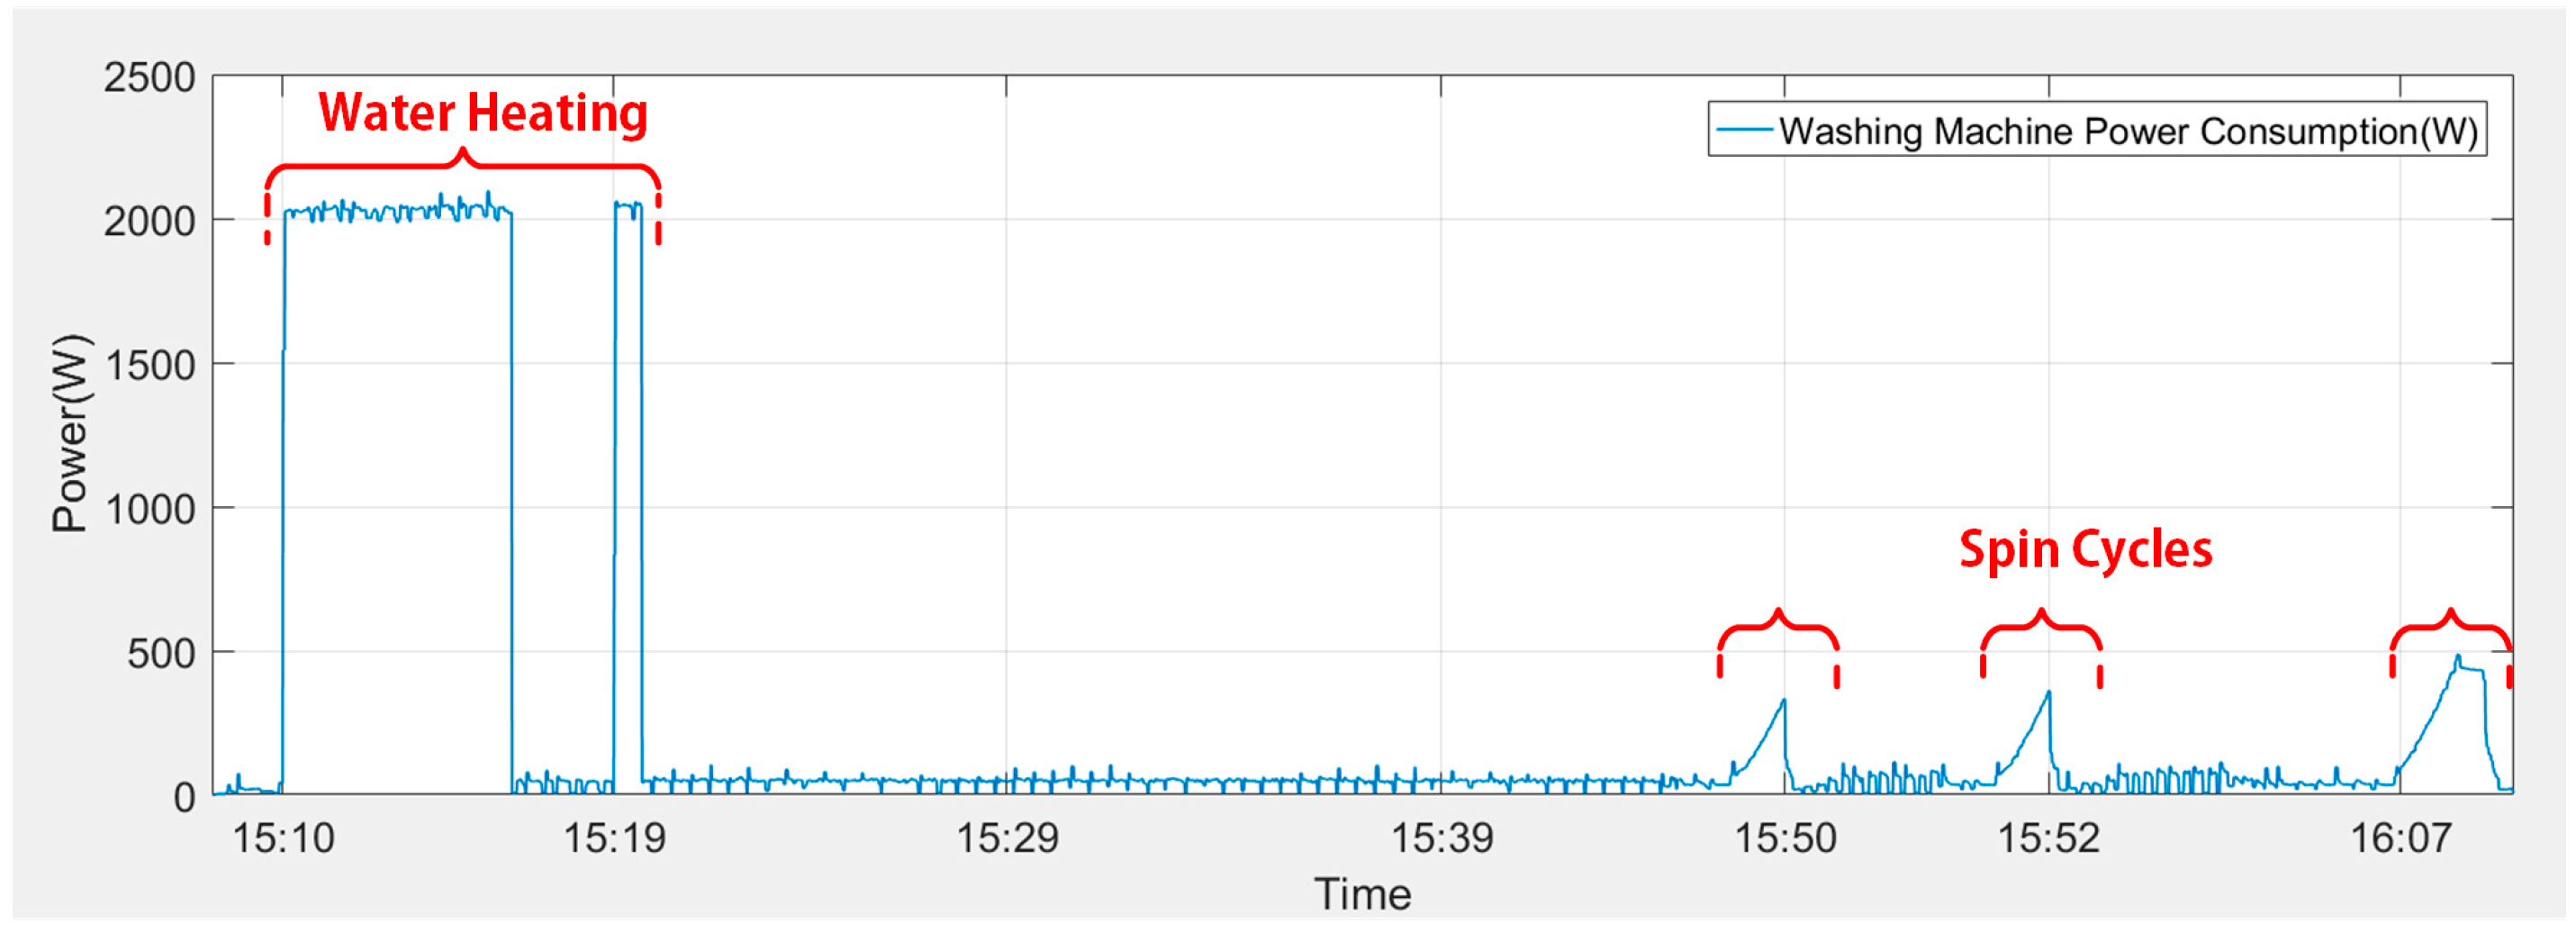
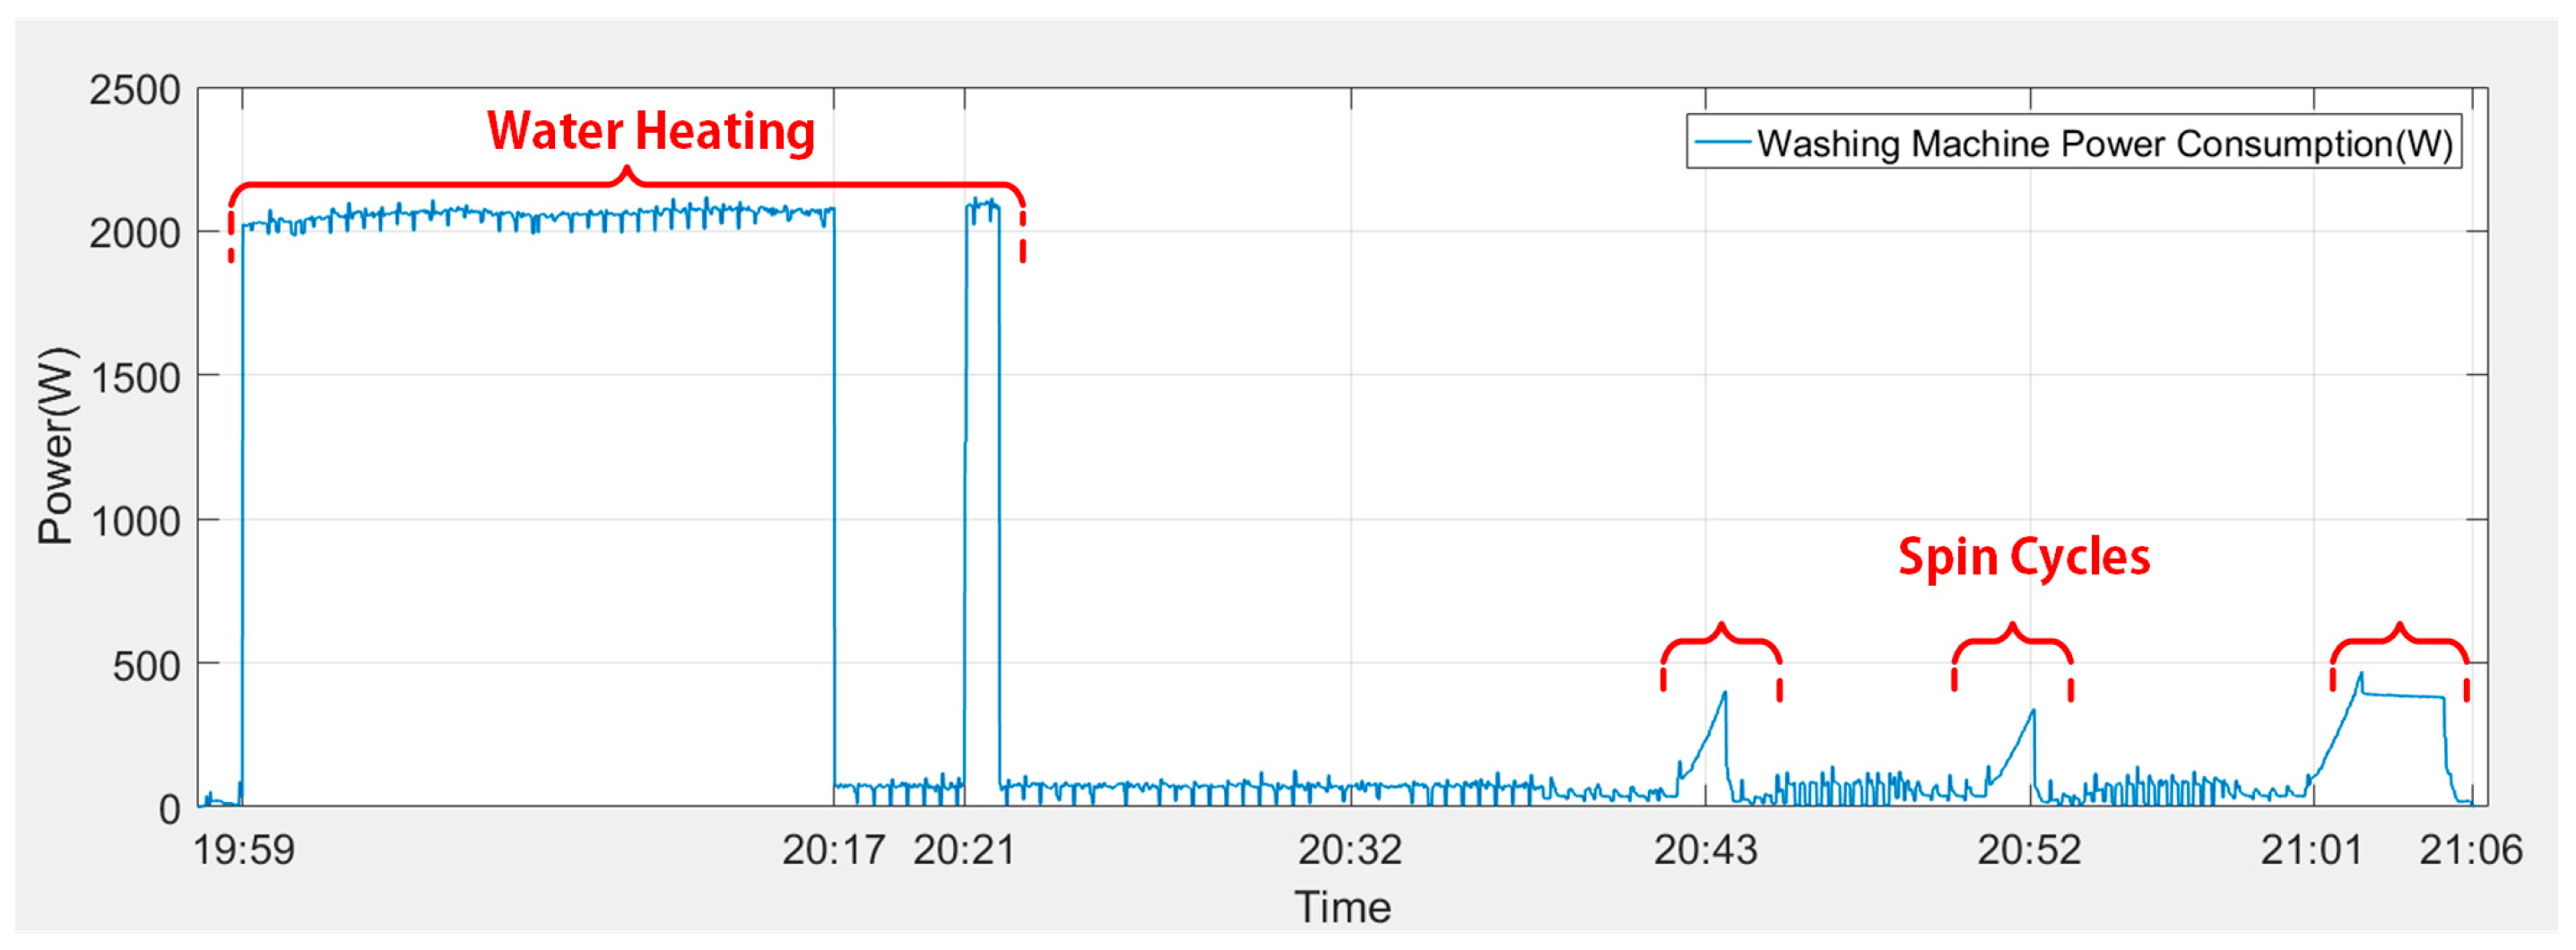
The last washing program preferred by consumers in a week was the mixed washing program at 40 °C. The washing time lasted for 1 h and 6 min. During this washing process, the total power consumed by the machine was measured as 713.11 W. The amount of power consumed in the heating process was determined as 650.97 W and this power constituted 91.2% of the total power consumption. Figure 8 depicts the power consumption curve of the washing process for the 40 °C mixed washing program.
Dishwasher: The frequency of use of the dishwasher and the total power consumption was determined. When the usage samples of the dishwasher were examined, it was found that two washing programs were generally preferred in the home. The first washing program was the 55 °C economy program in which dishes were washed for a long time. The washing time of this program was 3 h and 11 min. The dishwasher consumed 871.97 W of power throughout this program. The water heating cycle lasted for a total of 22 min and consumed approximately 774.33 W for the heating. The ratio of the energy consumed in the heating cycle to the total energy was calculated as 88%. Figure 9 demonstrates the power consumption curve of the 55 °C economy program.
The other washing program was the 65 °C power mode program. In this program, the washing time took 56 min. This operation time was shorter than the 55 °C economy program by about 3 times, and the water temperature reached the desired temperature in 31 min. The amount of energy used for water heating increased considerably, because the water temperature was increased in a short time compared to the 55 °C economy program. The amount of power consumed during the heating time was measured as 1113.46 W and the total amount of power consumed by the dishwasher was recorded as 1125.2 W. When the obtained data was evaluated, 98.9% of the power was spent for water heating. The energy consumption curve of the dishwasher in the 65 °C power program is shown in Figure 10. When Figure 9 and Figure 10 are compared, Figure 10 shows that the water heating consumption is too much despite the washing time being much shorter. It can be explained by the fact that water has to heat 10 degrees more in power mode in a period 3 times shorter than the economy mode.
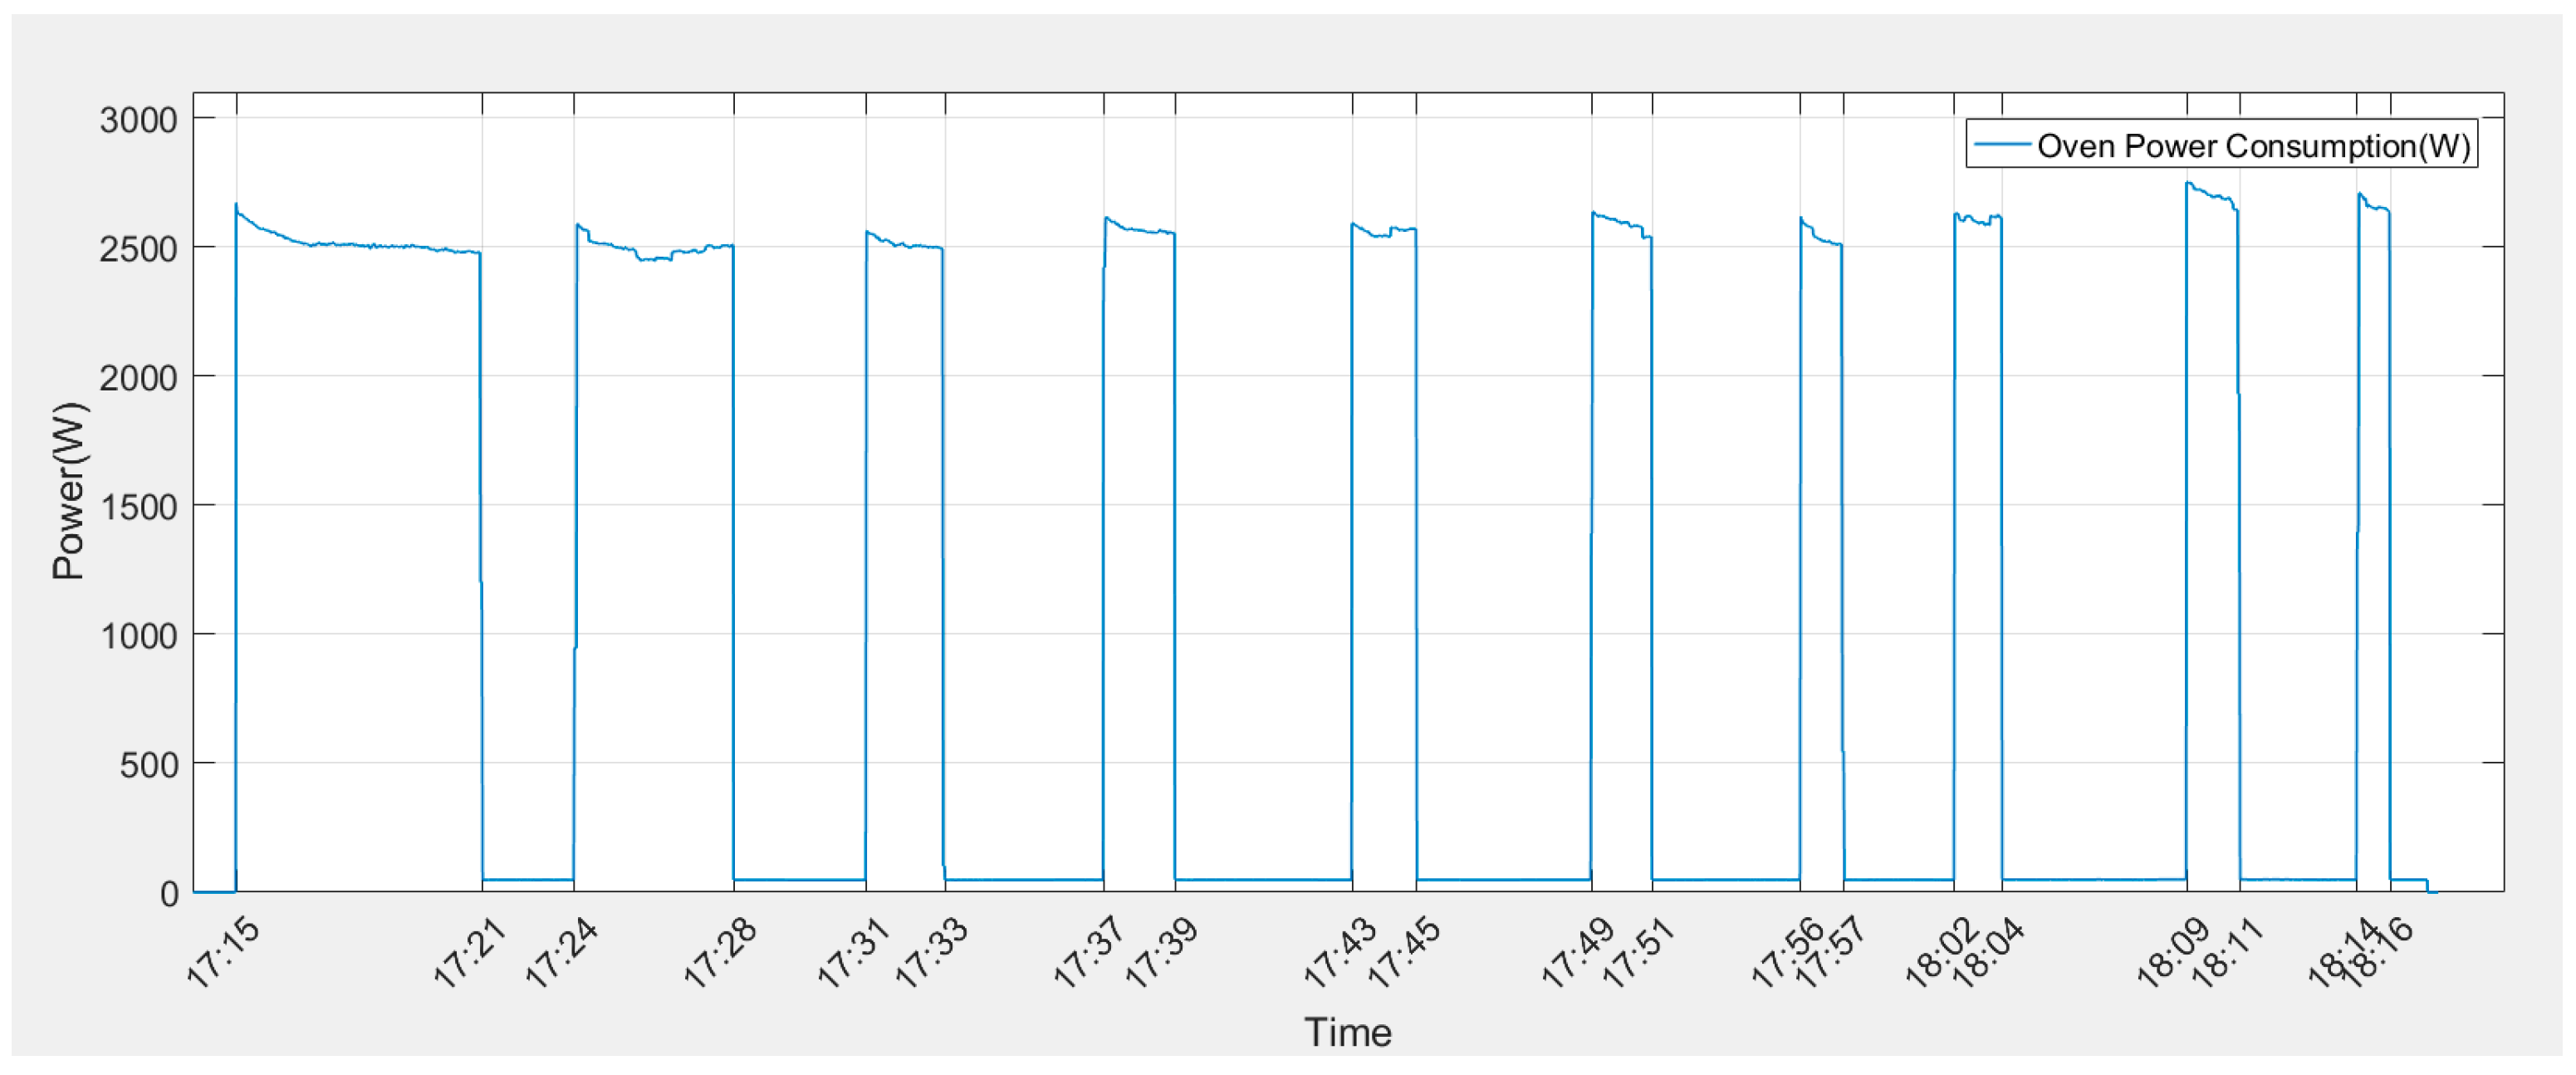
Oven: Another home appliance that plays a significant role in energy consumption in the home is an oven. When the usage samples of the oven were examined, it was observed that the household needed to cook with the oven for three times at 180 °C and once at 150 °C on average within a week. The power consumption curve of the oven is shown in Figure 11, if the consumer chooses the 180 °C temperature for baking, taking 1 h and 2 min. When the oven was operated, the heating resistor remained on for a long time and then it was switched off when the oven temperature reached an adequate level. Therefore, the power consumption was very high. While the heating resistor did not operate, the oven only needed power to perform lighting. The heating resistor was switched on occasionally until the cooking process was completed, keeping the temperature of the oven at the desired value. The heating resistor remained active for 24 min and 50 s in this cooking process and the total power consumption of the heating resistor was measured as 947.49 W during the baking interval. The sum of the time when the heating resistor was not in operation was obtained as 38 min and 27 s. The power consumed by the oven for lighting, fan, and other electronic components was calculated as 104.96 W with the heating resistor switched off. The total amount of power that the oven spent was measured as 1052.45 W during the cooking period. If lighting and other energy-consuming components were considered to be in operation during heating, the heating resistor consumed approximately 842.53 W of power, which equaled to 80.05% of the total power consumed.
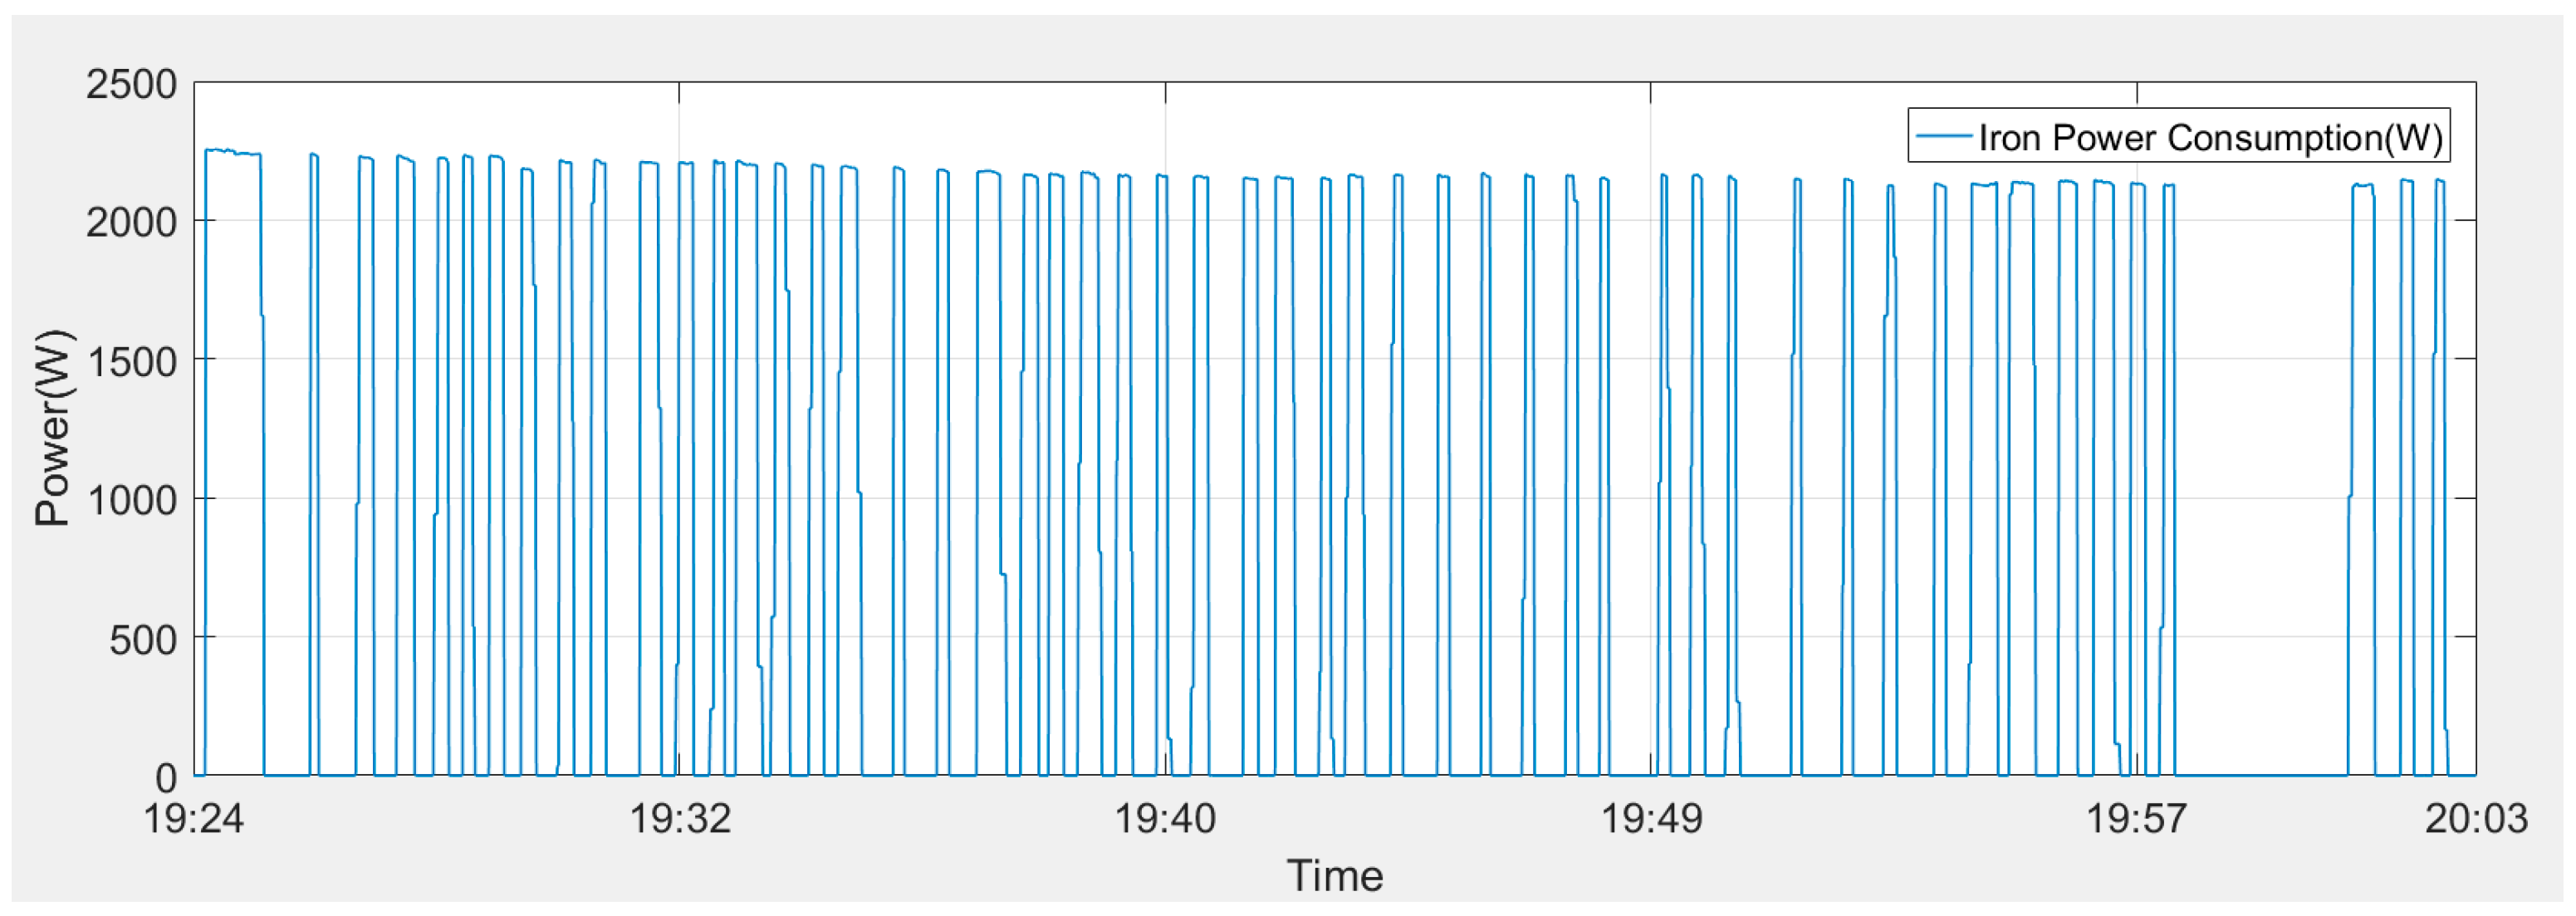
Iron: An iron with three temperature scales for the ironing of different cloths was analyzed, and the consumer generally preferred to use it at the temperature level 2. The average time for ironing was measured as 38.5 min a day per week. If Figure 12 depicting the power consumption curve of the iron is examined, the heating and standby cycles can be seen. Considering an ordinary ironing time, it was observed that the heating worked for about 15 min and waited for 23 min. The total power consumed in this ironing period was 486.3 W.
Hair Dryer: The other selected device was a hair dryer. The power consumption data belonging to the hair dryer was measured and recorded. The results of the measurements showed that the hair dryer was used for 2 min in high-speed blowing mode every day and 3 times in a week for an additional 11 min. Slow-speed blowing mode usage of the hair dryer did not present, because the users never used this mode in November 2016. If the average frequency of the usage of the hair dryer was calculated, the weekly total duration was found to be approximately 43 min. The weekly average power consumption of the hair dryer was calculated to be 1263.77 W. Figure 13 shows the power consumption curve of the hair dryer in high-speed blowing mode for one usage period.
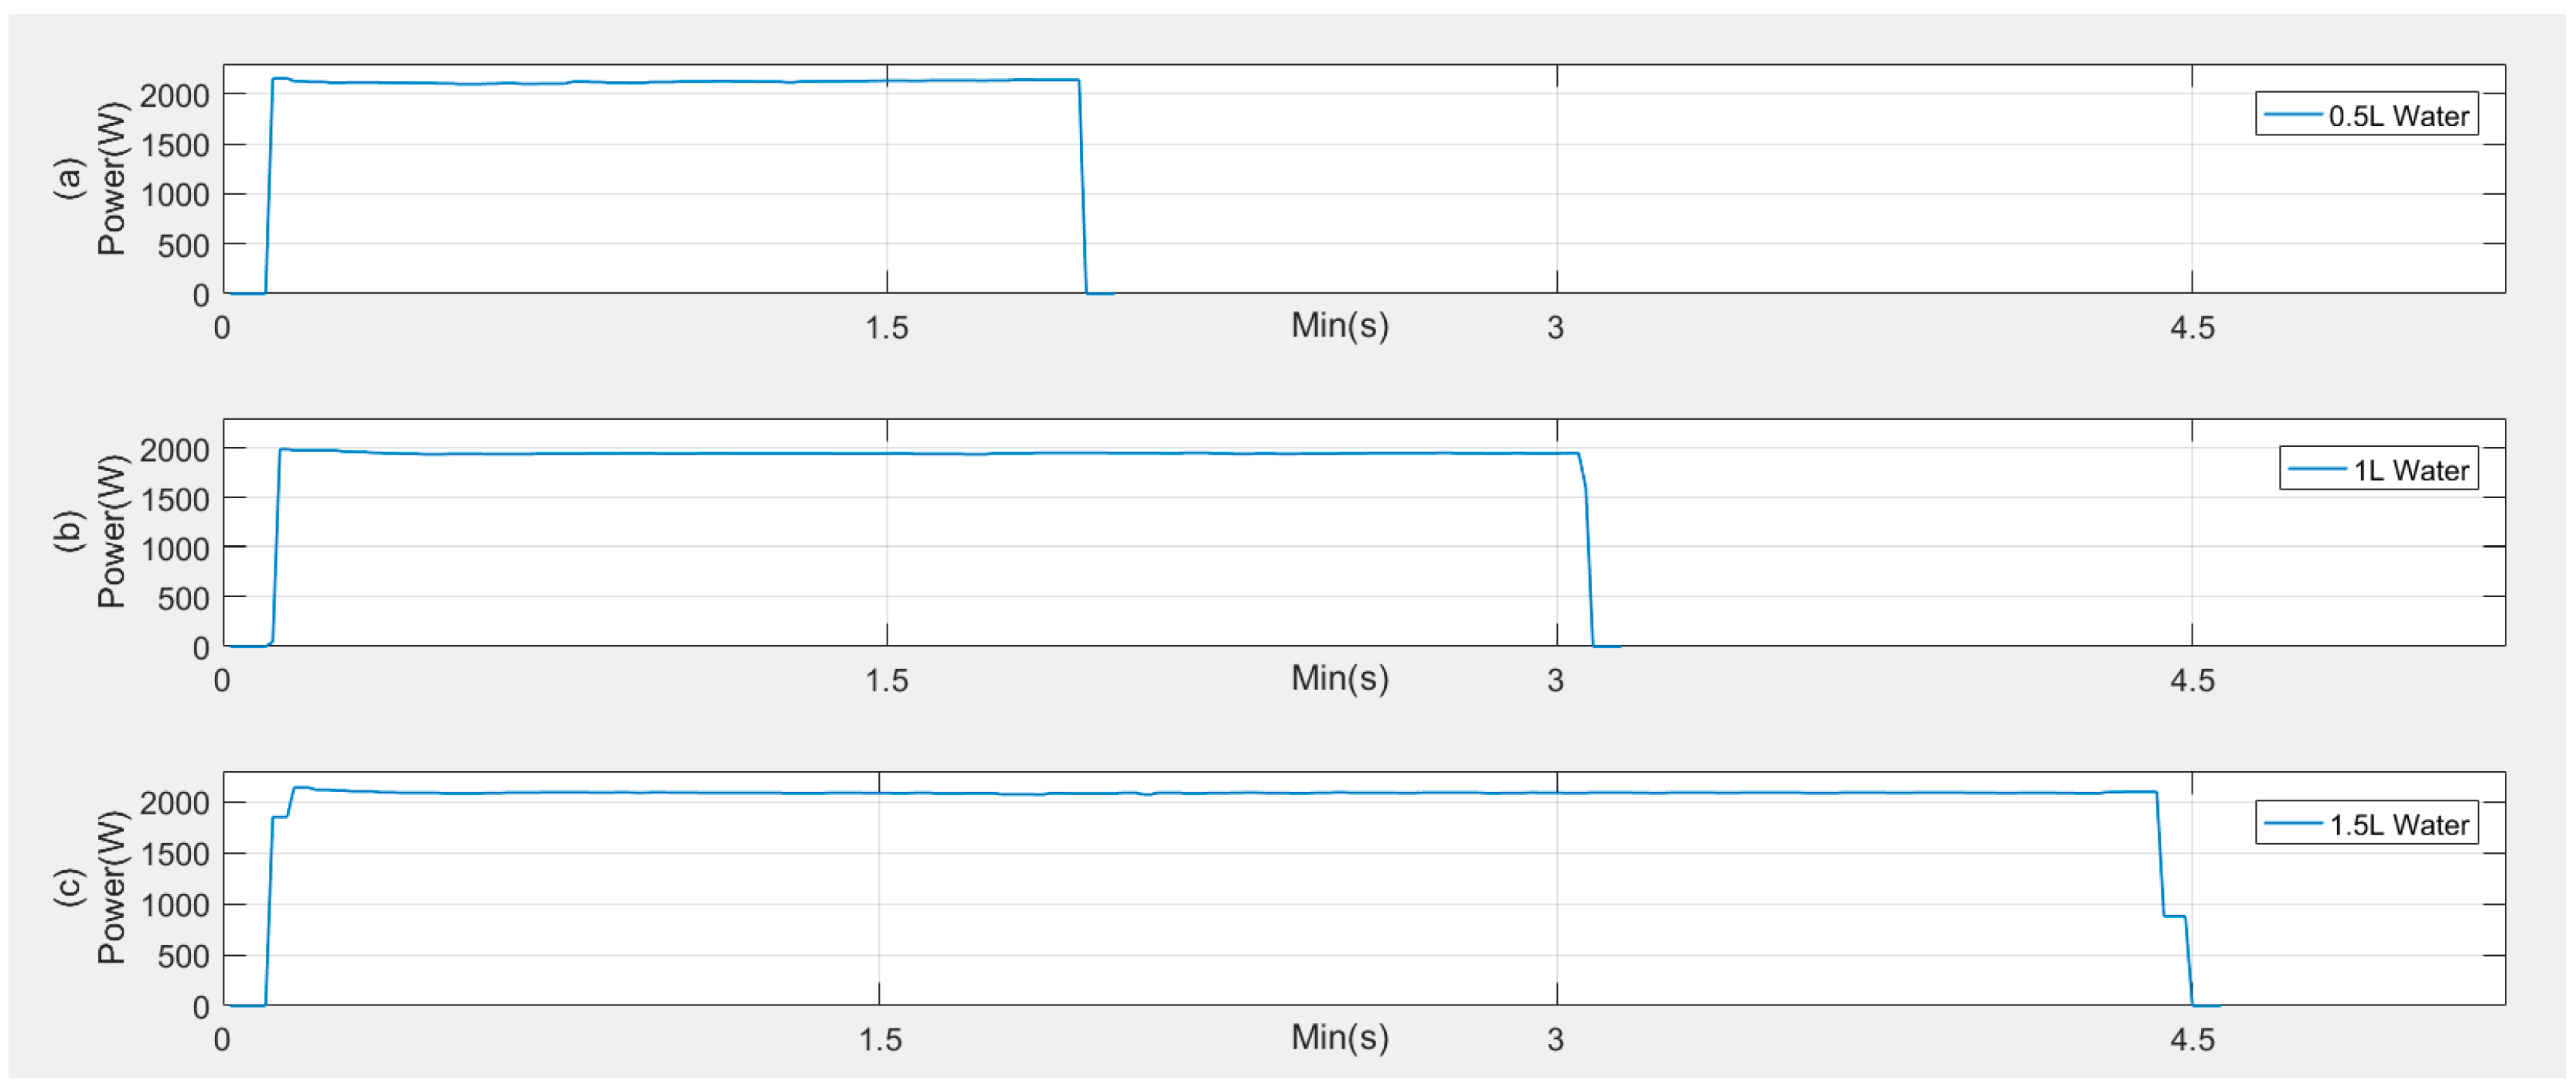
Kettle: Another home appliance evaluated was a kettle needed frequently in the kitchen. Although the kettle had the ability to heat the total two liters of water, it was observed that the investigated household utilized it to heat up to 0.5 liters of water generally. The kettle boiled 0.5 liters of water in approximately 1 min 53 s and in this duration the consumed power was 66.56 W. In addition, when the amount of water in the kettle was 1 L and 1.5 L, the time needed to boil the water was recorded as 3 min 17 s and 4 min 30 s, respectively. The power consumed for these processes was measured as 104.84 W and 155.06 W, respectively. Figure 14 depicts the power consumption curve of the kettle used with different amounts of water.
Range Hood: One of the major devices in the kitchen is a range hood. In the home where the energy analysis was done, the range hood with 3 different fan speeds was operated under the fan speed level 3 generally. The operation time of the range hood using the fan speed level 3 was determined as 3 h 11 min in total in a week. The power consumption data and the operation times for the different fan speeds of the range hood in a week were determined. The range hood whose fan speed was adjusted at level 1 was run two times in a week for about 34 min without lighting, and its average power consumption was measured as 41.79 W per run. When the fan speed of the range hood was at level 2, it was detected to be used for 18 min once a week and the power consumption was measured as 24.82 W. At level 3, the highest level of fan speed, the range hood was utilized for an average of 18 min, 5 times a week, and it consumed 32.88 W of power for each use. The hourly consumption values of the range hood were determined as 73.76 W for fan speed level 1, 82.75 W for level 2, and 93.95 W for level 3. The range hood consumed 0.96 W of power per min and 58.15 W of power per hour for lighting. Figure 15 shows the power consumption graphs for different fan speeds of the range hood with and without lighting.
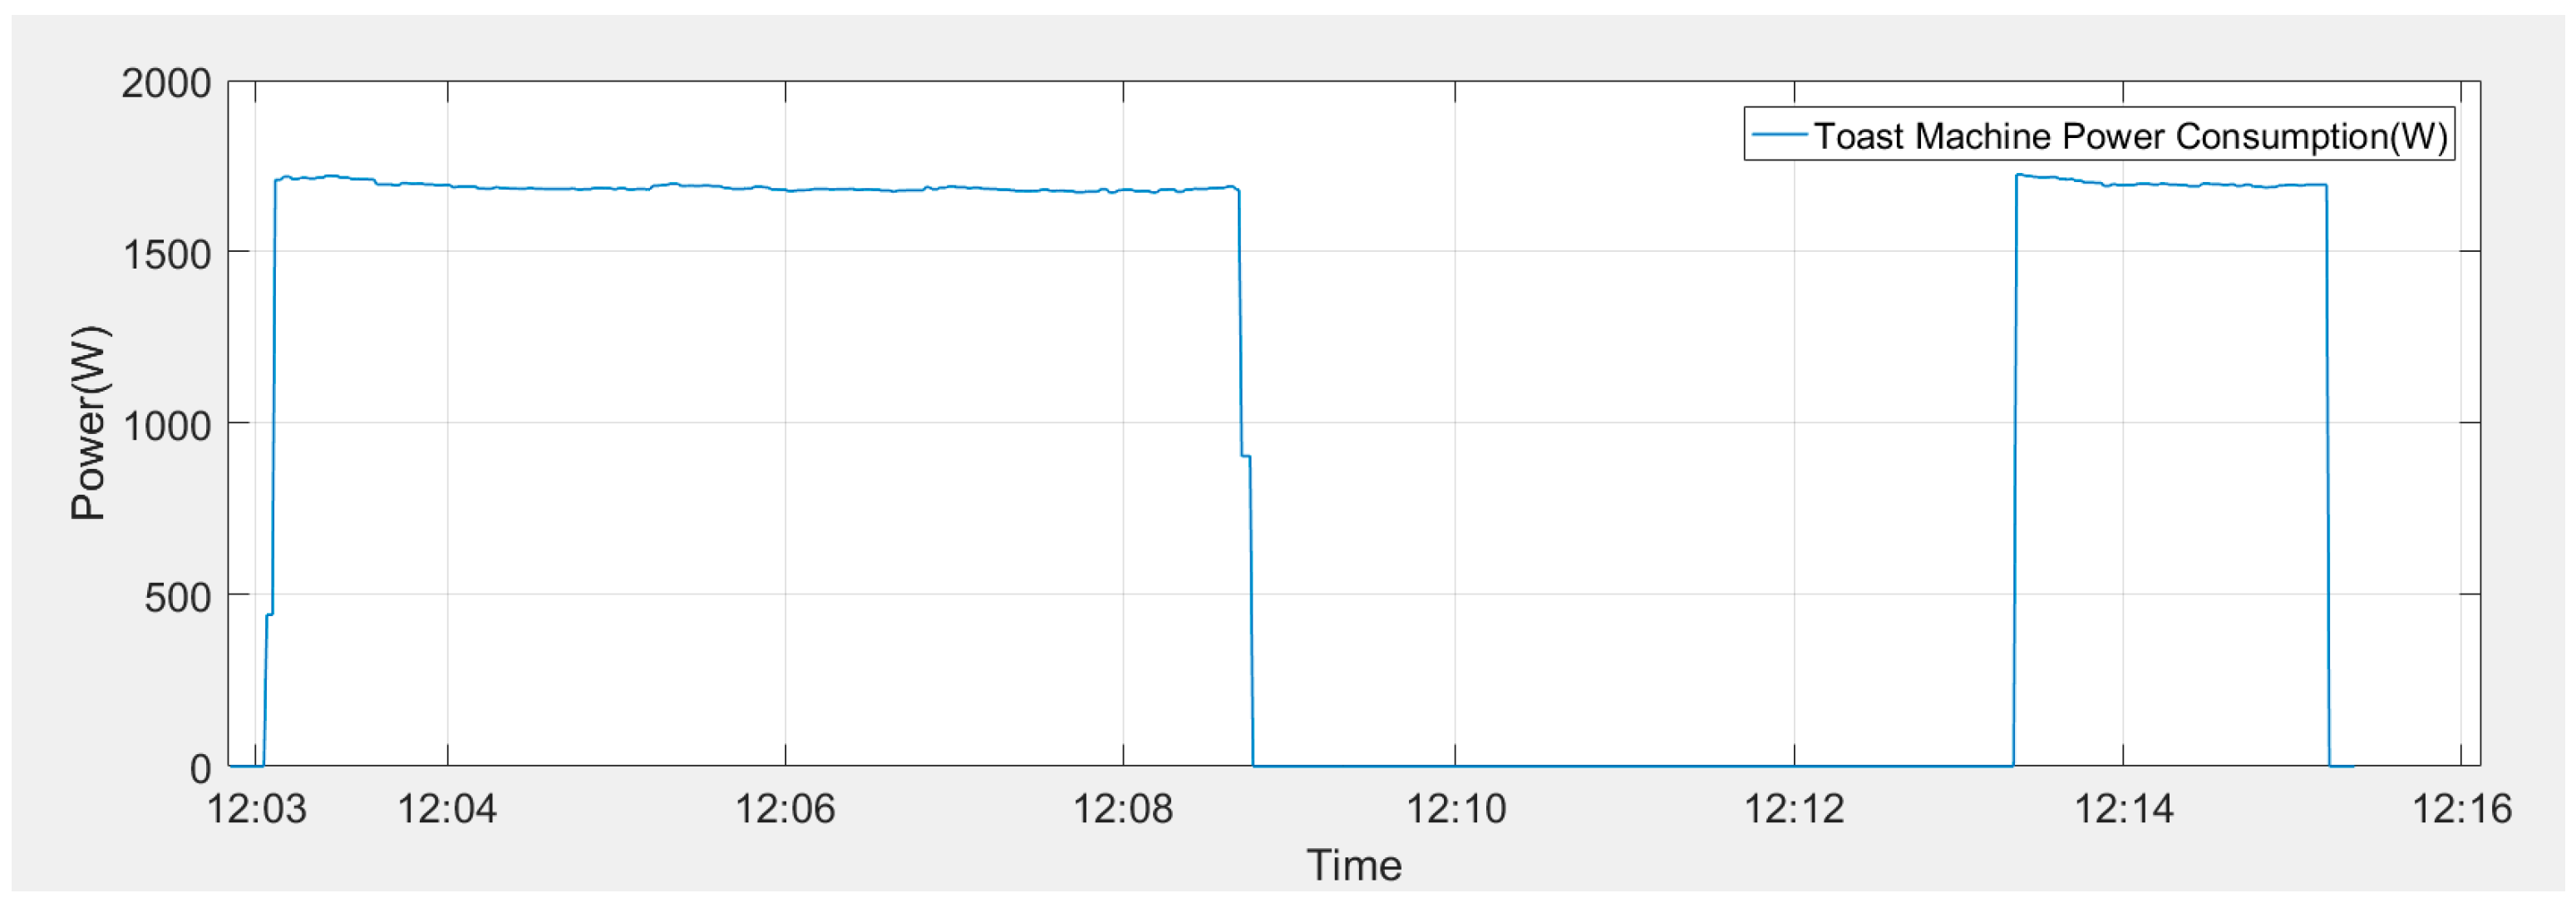
Toast Machine: Another home appliance analyzed in terms of power consumption and usage frequency was a toast machine. The results of the measurements show that the consumers utilized the toast machine 14 times in a month at the highest heating level. It was seen that the toast machine was used for an average of 13 min and it only consumed power during 7 min 44 s for each use. During the working period, the total energy consumption was measured as 209.47 W. The power consumption of the toast machine was calculated as 2932.58 W monthly. Figure 16 depicts the average power consumption curve of the toast machine for each use.
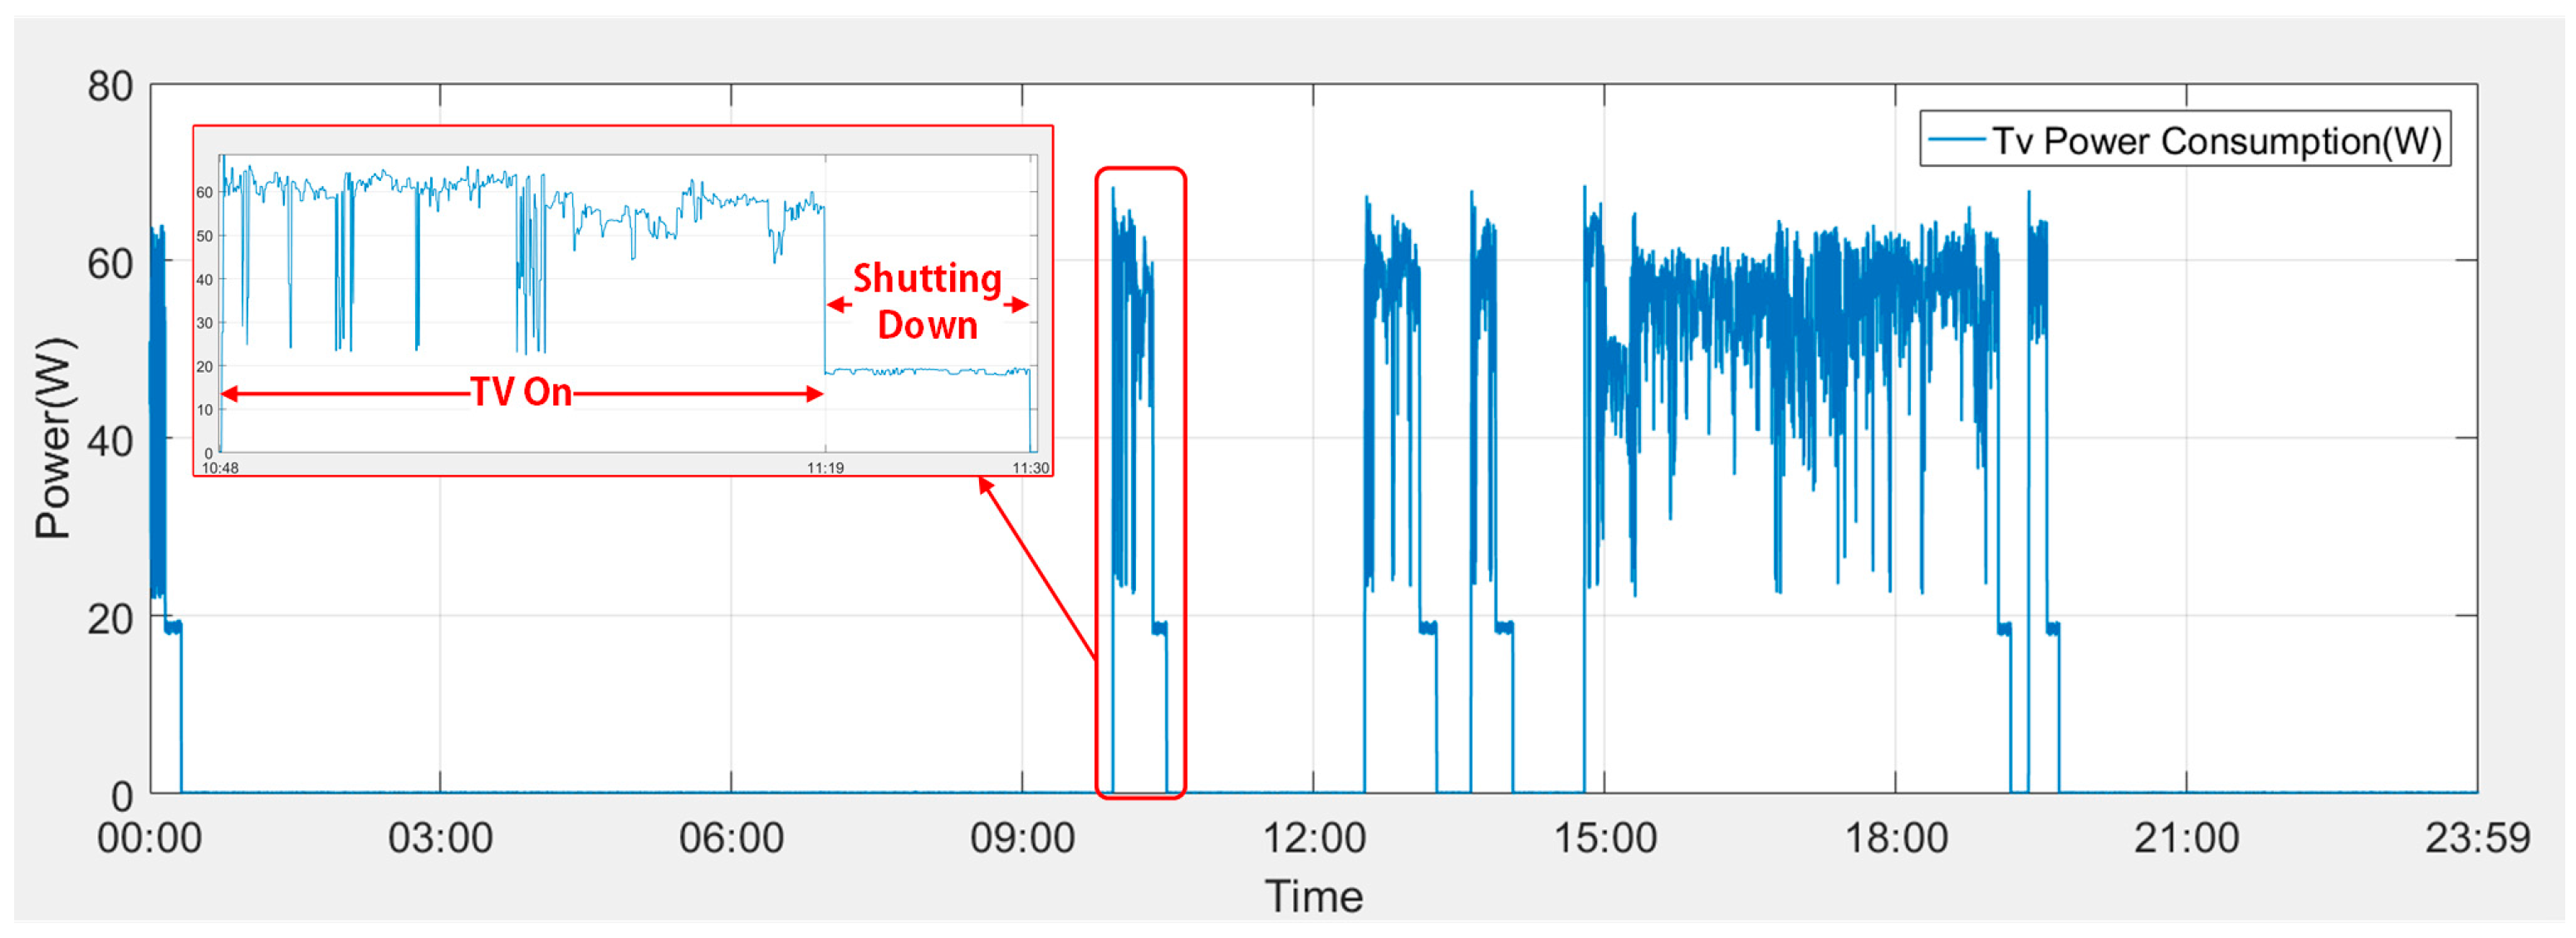
Television: Another home appliance analyzed concerning load profile and power consumption was a television with LED panel. The television power consumption can reveal the television watching habits of the household. It was found that the duration of the television watching was different on weekdays and weekends. The household watched the television for 6 h and 33 min during the weekdays. It was shown that color change in the image and tracking down channel change cases affected the television power consumption. The average power consumption during the hourly watching period was measured as 54.64 W. If the television is switched off from the remote control only, the television continues the power consumption throughout standby mode with its video panel closed. From the moment the television was turned off using the remote control only, it consumed 18.69 W for 10 min on average. In addition, the television power consumption was measured as 376.58 W per day on the weekend, and the power consumed during standby period composed 0.5% of total consumption. Figure 17 illustrates the power consumption graph regarding a day of the weekend.
Computer: A desktop computer is another device frequently used during a day in the house and one we analyzed in terms of energy utilization. The computer’s average daily usage measured as 2 h and 14 min with peripheral devices, which included a standard box, a desktop speaker, and two LCD monitors, one 19” and the other one 24”. The power consumed by the computer in standby mode was measured as 5.09 W per hour and never taken to sleep mode. It was calculated that this value caused 110.79 W per day of power consumption and 3323.7 W per month of power consumption in standby mode. The average hourly power consumption of the computer during operation and total power consumption for one day of use were measured as 173.48 W and 387.4 W, respectively. The computer consumed a total of 14,946.6 W power per month and about 22% of this power was depleted while the computer was in standby mode. Figure 18 depicts the power consumption curve of the computer throughout the utilization time.
Printer: The last device analyzed was a laser printer. Although the laser printer power consumption is related to its usage frequency, this power consumption was found to be 44.05 W daily on average for the home investigated. The average utilization time of the printer corresponded to 7 min 53 s per day. The example of the power consumption during the day is given in Figure 19. The remarkable point in the energy consumption of the printer is that the printer consumes in standby mode about 3 W per hour and this value equals to 2153.4 W of power consumption for a month. If the printer is plugged in constantly, the energy consumed in standby mode is about 3 times the energy used in running for daily work. The results exhibited that the printer consumed power equal to about 2858.2 W per month.
4. Assessment of Energy Consumption
After the power consumption values of the home appliances were recorded with high resolution, the evaluation of the data was made. The usage frequency of each device was recorded daily, weekly, and monthly and their utilization ratios in Table 2 were determined considering the operating frequencies of these devices for November.
As the measurement periods have one-second resolution, the total working time of each device is taken as seconds and the total amount of power consumed in each usage based on the hourly power consumption data is found. The monthly power consumption of each device can be calculated using Equation (1) considering their usage frequency and power values.
In the Equation (1), PMeasured (), Duration (), and Density () represent the amount of hourly power, the total operating time, and the usage frequency of devices, respectively. The usage frequency was categorized daily, weekly, and monthly for each device and their usage density was found by using Equation (2).
In addition, it was discovered that some devices consumed energy in the standby mode, and the amount of unnecessary energy was calculated by using Equation (3) per month.
where PMeasured-StanBy () stands for the power consumption value in the standby mode. The total power consumption of the home appliances is approximately calculated at 99.4 kW for November. The electricity bill in November 2016 showed that the actual power consumption of the dwelling was 124.4 kW and this result proved the measurement accuracy. The difference between the real consumption and the measurement results represents the power needed by lighting, combi boiler, and low-power devices which was excluded.
Table 3 shows the total power consumption of the home appliances for three months. Table 4 shows how the power consumption of each home appliance impacts total power consumption from October to December.
When the results from Table 3 were analyzed, the monthly power consumption was calculated as 121.41 kW on average for the family comprising two persons. In addition, to determine how much energy the consumers use at what time of day, a day was allocated 3 parts according to the energy tariff policy applied in Turkey. Considering this classification, the hours between 06.00 am and 17.00 pm were the daylight tariff part, the hours between 17.00 pm and 22.00 pm were the peak tariff part, and the hours between 22.00 pm and 06.00 am were the night tariff part. When the home energy consumption was classified according to the three mentioned parts, it was seen that the daytime consumption amount for November and December was higher than the others and the amount of demand consumption for October was more than the other energy tariff times. In addition, peak usage of the three months took place in December. This result can be attributed to increased combi boiler usage excluded in the test depending on drops in temperature in December. Table 5 indicates how often power is used in energy tariff periods for each month.
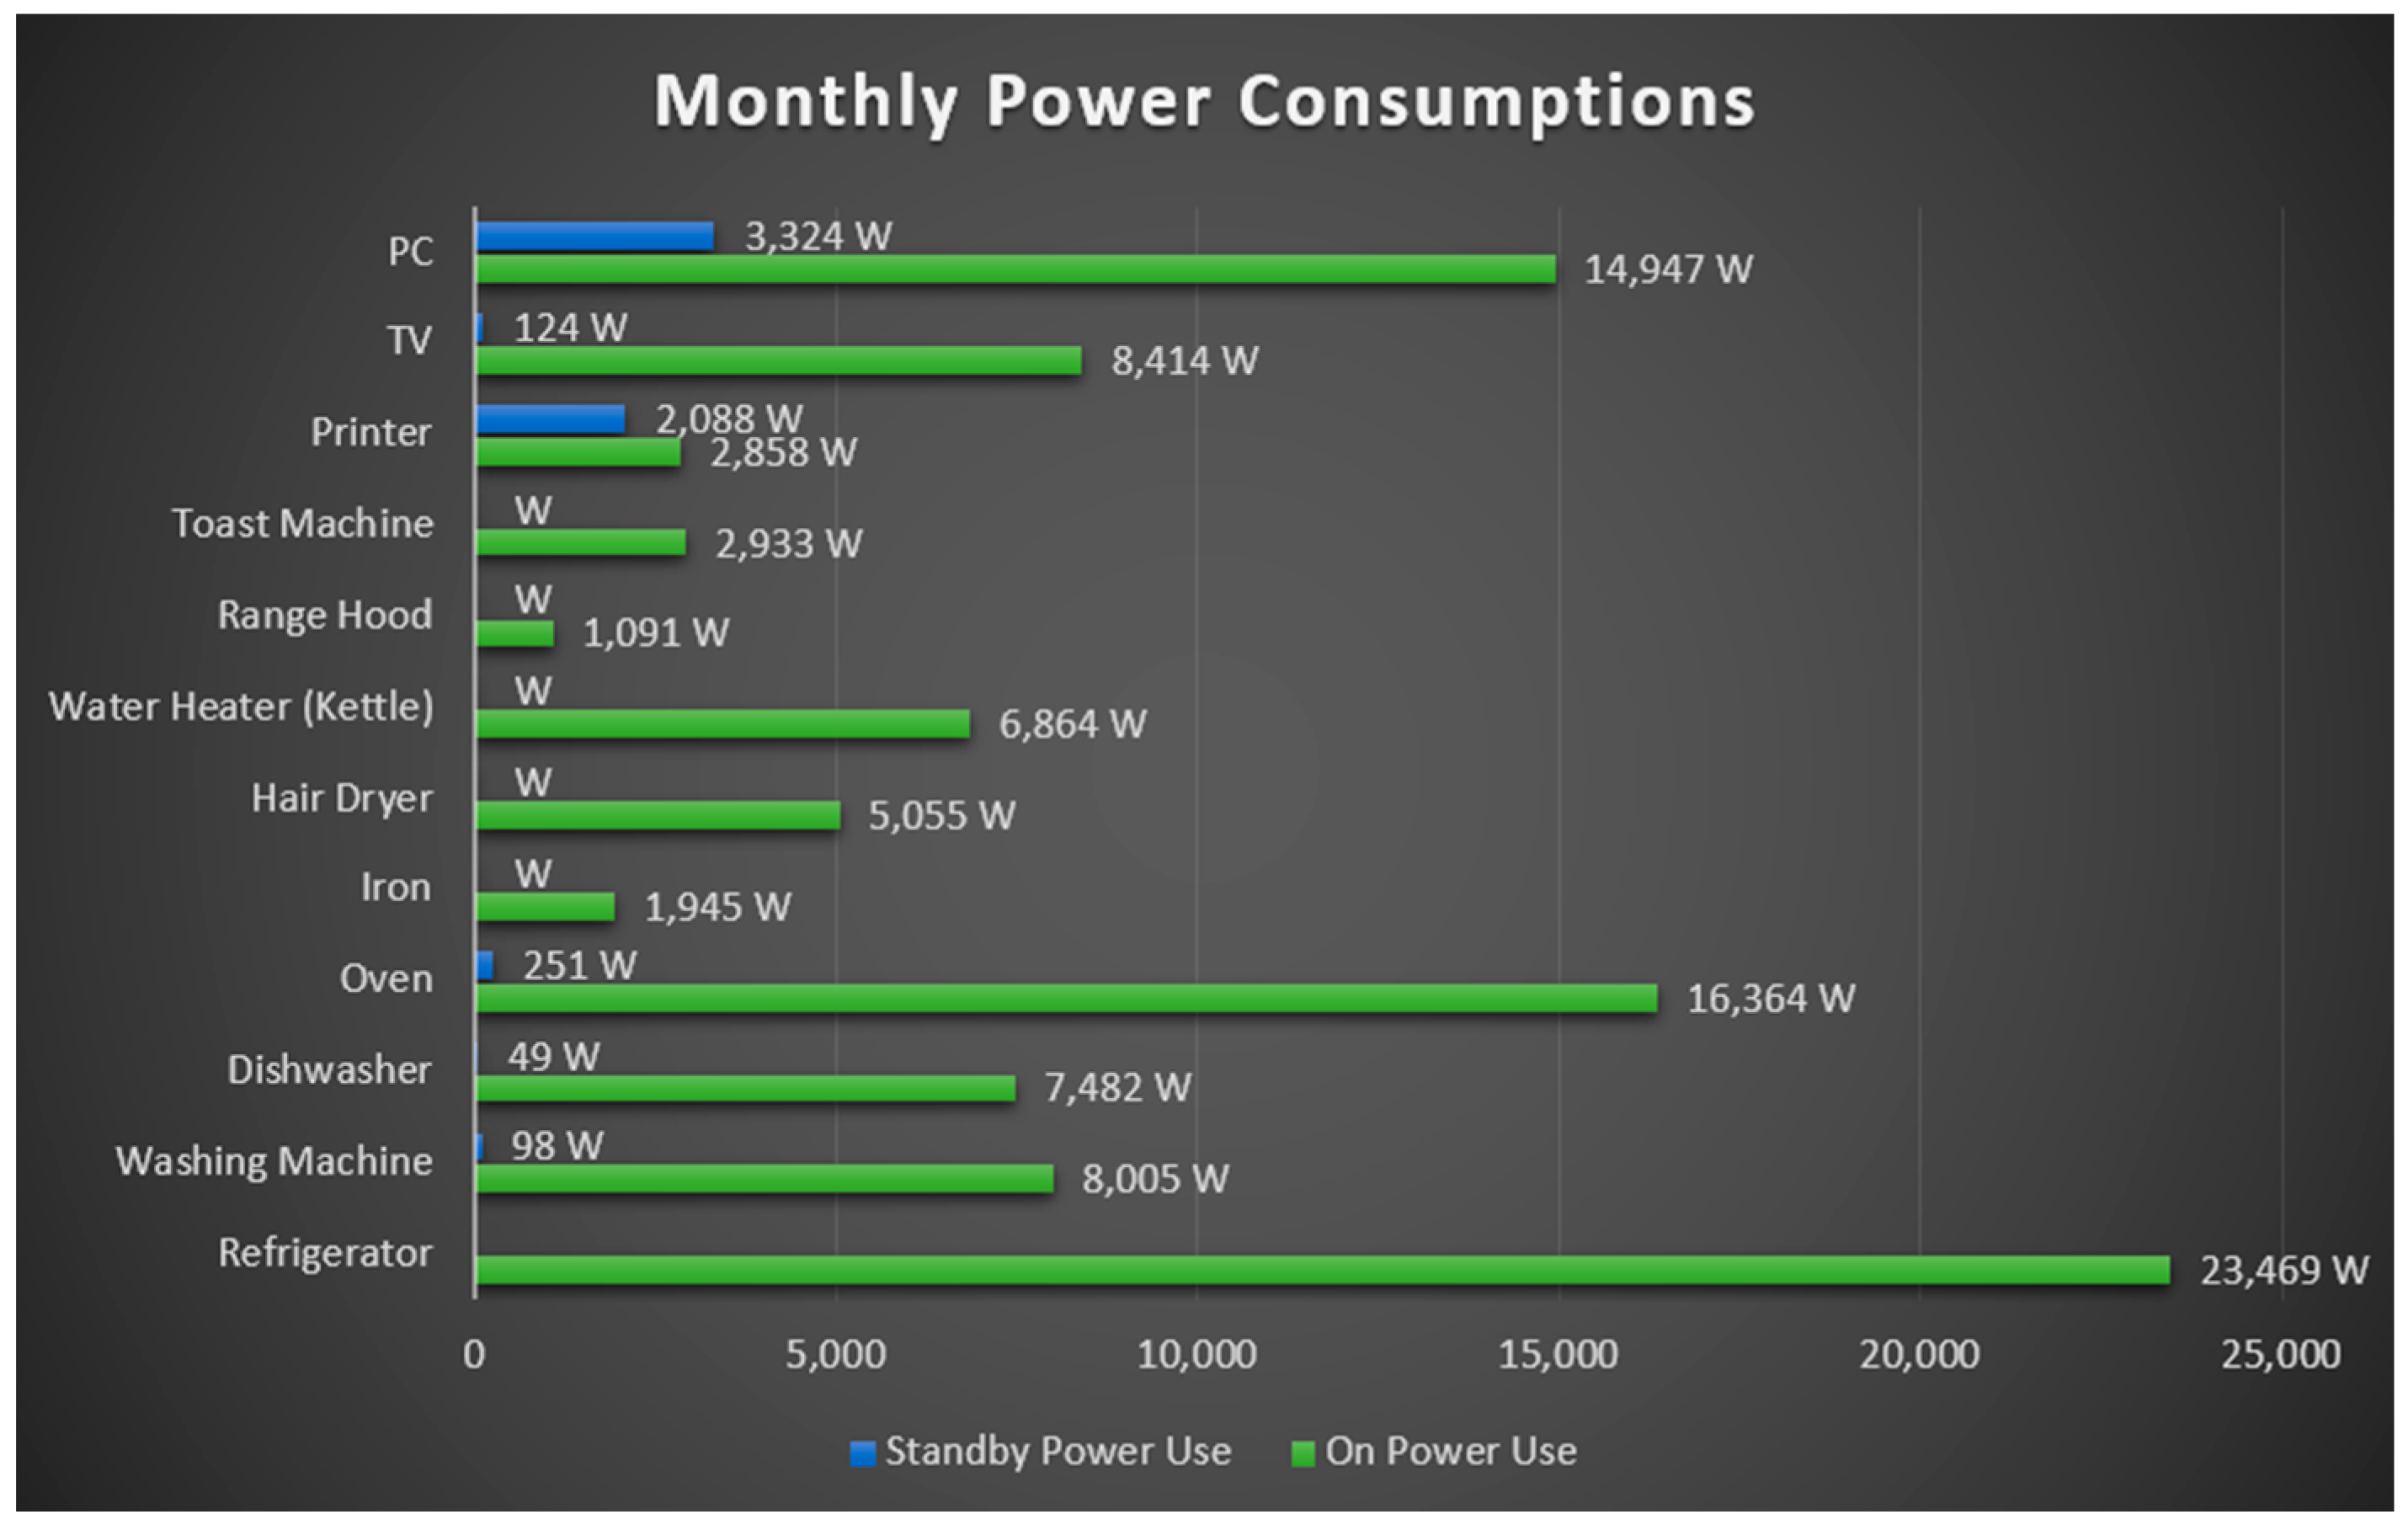
Finally, the home appliances that consume energy in standby mode were investigated to improve energy efficiency. It was determined that the computer, television, printer, oven, dishwasher, and washing machine consumed energy in standby mode. Figure 20 shows the ratio of total and standby power usage for November 2016. Standby energy use for that month was up to 4.7% of the total energy.
5. Assessment of Demand Side Opportunities
In the triple time electricity tariff, which is one of the two tariff options offered by electricity distribution companies for residences in Turkey, the unit energy price varies according to the hours of the day. In this section, the possibility of using the home appliances at another time of the day is evaluated without sacrificing dwelling comfort in the case of the household using the triple time electricity tariff. Therefore, the home appliances were classified into two groups according to the dwelling comfort. The first group comprised washing machine, dishwasher, and iron deferrable electrical loads, and the second group undeferrable electrical loads, such as television, computer, refrigerator, and others. The results of the classification of the home appliances are given in Table 6. The classification of the electrical loads may vary considering consumer priorities. When Table 6 is examined, approximately 15% of the total power consumption in a month is at the deferrable loads and the consumers can easily plan its usage time without sacrificing dwelling comfort.
6. Conclusions
In this study, home appliances’ realistic load profiles and power consumption data needed by SG studies were constituted with high resolution. For this purpose, the special measurement system, including a wireless smart plug for power measurement and minicomputer, was designed. The power consumption data of 12 different home appliances employed by a two-person family living in Çankırı, Turkey was recorded for three months. By evaluating and observing the obtained data, the working cycles of each home appliance are determined in detail. Energy consumption behavior and power consumption analysis were performed and detailed load profile data for each home appliance was given on a website at http://profil.guctakip.com. To increase energy efficiency, energy-consuming devices in standby mode were detected and their energy consumption was investigated by comparing overall consumption rate. In addition, according to the energy tariff periods employed in Turkey, all consumption data was evaluated. It was determined that about 15% of the total load at home can be shifted taking energy tariffs into account. The main contribution of this study is to create a realistic load profile and power consumption data which can be used by researchers interested in SG studies and power distribution companies. This data educates consumers about energy efficiency by revealing standby power consumption of a real home. It is expected that residential consumers take the opportunities of demand side management and available resources can be employed with optimum capacity.
Author Contributions
Fatih Issi and Orhan Kaplan proposed the main idea, performed the measurements, and wrote the manuscript. All authors have approved the final version of this manuscript.
Conflicts of Interest
The authors declare no conflict of interest.
References
- Clastres, C. Smart grids: Another step towards competition, energy security and climate change objectives. Energy Policy 2011, 39, 5399–5408. [Google Scholar] [CrossRef] [Green Version]
- Jia, D.; Meng, X.; Song, X. Study on technology system of self-healing control in smart distribution grid. In Proceedings of the 2011 International Conference on Advanced Power System Automation and Protection, Beijing, China, 16–20 October 2011; Volume 1, pp. 26–30. [Google Scholar]
- Hussain, H.; Javaid, N.; Iqbal, S.; Hasan, Q.; Aurangzeb, K.; Alhussein, M. An Efficient Demand Side Management System with a New Optimized Home Energy Management Controller in Smart Grid. Energies 2018, 11, 190. [Google Scholar] [CrossRef]
- Lobaccaro, G.; Carlucci, S.; Löfström, E. A Review of Systems and Technologies for Smart Homes and Smart Grids. Energies 2016, 9, 348. [Google Scholar] [CrossRef]
- Beaudin, M.; Zareipour, H. Home energy management systems: A review of modelling and complexity. Renew. Sustain. Energy Rev. 2015, 45, 318–335. [Google Scholar] [CrossRef]
- Hurley, D.; Peterson, P.; Whited, M. Demand Response as a Power System Resource; Synapse Energy Economics Inc.: Cambridge, MA, USA, 2013. [Google Scholar]
- Shakeri, M.; Shayestegan, M.; Abunima, H.; SalimReza, S.M.; Akhtaruzzaman, M.; Alamoud, A.R.M.; Sopian, K.; Amin, N. An intelligent system architecture in home energy management systems (HEMS) for efficient demand response in smart grid. Energy Build. 2017, 138, 154–164. [Google Scholar] [CrossRef]
- Agnetis, A.; Pascale, G.d.; Detti, P.; Vicino, A. Load Scheduling for Household Energy Consumption Optimization. IEEE Trans. Smart Grid 2013, 4, 2364–2373. [Google Scholar] [CrossRef]
- Zhang, D.; Shah, N.; Papageorgiou, L.G. Efficient energy consumption and operation management in a smart building with microgrid. Energy Convers. Manag. 2013, 74, 209–222. (In English) [Google Scholar] [CrossRef]
- Turkish Statistical Institute (TÜİK). Distribution of Net Electricity Consumption by Sectors; Turkish Statistical Institute: Ankara, Turkey, 2016.
- Shirazi, E.; Zakariazadeh, A.; Jadid, S. Optimal joint scheduling of electrical and thermal appliances in a smart home environment. Energy Convers. Manag. 2015, 106, 181–193. (In English) [Google Scholar] [CrossRef]
- Faruqui, A.; Sergici, S. Household response to dynamic pricing of electricity: A survey of 15 experiments. J. Regul. Econ. 2010, 38, 193–225. [Google Scholar] [CrossRef]
- Tang, S.; Kalavally, V.; Ng, K.Y.; Parkkinen, J. Development of a prototype smart home intelligent lighting control architecture using sensors onboard a mobile computing system. Energy Build. 2017, 138, 368–376. (In English) [Google Scholar] [CrossRef]
- Wu, X.; Hu, X.; Yin, X.; Moura, S. Stochastic Optimal Energy Management of Smart Home with PEV Energy Storage. IEEE Trans. Smart Grid 2017, PP. [Google Scholar] [CrossRef]
- Kuzlu, M.; Pipattanasomporn, M.; Rahman, S. Hardware Demonstration of a Home Energy Management System for Demand Response Applications. IEEE Trans. Smart Grid 2012, 3, 1704–1711. [Google Scholar] [CrossRef]
- Pipattanasomporn, M.; Kuzlu, M.; Rahman, S.; Teklu, Y. Load Profiles of Selected Major Household Appliances and Their Demand Response Opportunities. IEEE Trans. Smart Grid 2014, 5, 742–750. [Google Scholar] [CrossRef]
- Tewathia, N. Determinants of the household electricity consumption: A case study of Delhi. Int. J. Energy Econ. Policy 2014, 4, 337–348. [Google Scholar]
- Ahmed, M.S.; Mohamed, A.; Homod, R.Z.; Shareef, H.; Sabry, A.H.; Khalid, K.B. Smart plug prototype for monitoring electrical appliances in Home Energy Management System. In Proceedings of the 2015 IEEE Student Conference on Research and Development (SCOReD), Kuala Lumpur, Malaysia, 13–14 December 2015; pp. 32–36. [Google Scholar]
- Bissey, S.; Jacques, S.; Le Bunetel, J.-C. The Fuzzy Logic Method to Efficiently Optimize Electricity Consumption in Individual Housing. Energies 2017, 10, 1701. [Google Scholar] [CrossRef]
- Capasso, A.; Grattieri, W.; Lamedica, R.; Prudenzi, A. A bottom-up approach to residential load modeling. IEEE Trans. Power Syst. 1994, 9, 957–964. [Google Scholar] [CrossRef]
- Schlösser, T.; Angioni, A.; Ponci, F.; Monti, A. Impact of pseudo-measurements from new load profiles on state estimation in distribution grids. In Proceedings of the 2014 IEEE International Instrumentation and Measurement Technology Conference (I2MTC) Proceedings, Montevideo, Uruguay, 12–15 May 2014; pp. 625–630. [Google Scholar]
- Chuan, L.; Ukil, A. Modeling and Validation of Electrical Load Profiling in Residential Buildings in Singapore. IEEE Trans. Power Syst. 2015, 30, 2800–2809. [Google Scholar] [CrossRef]
- Abeykoon, V.; Kankanamdurage, N.; Senevirathna, A.; Ranaweera, P.; Udawapola, R. Electrical Devices Identification through Power Consumption using Machine Learning Techniques. Int. J. Simul. Syst. Sci. Technol. 2016, 17. [Google Scholar] [CrossRef]
- Firth, S.; Lomas, K.; Wright, A.; Wall, R. Identifying trends in the use of domestic appliances from household electricity consumption measurements. Energy Build. 2008, 40, 926–936. (In English) [Google Scholar] [CrossRef] [Green Version]
- Kam, M.; Suryadevara, N.K.; Mukhopadhyay, S.C.; Gill, S.P.S. WSN based utility System for effective monitoring and control of household power consumption. In Proceedings of the 2014 IEEE International Instrumentation and Measurement Technology Conference (I2MTC) Proceedings, Montevideo, Uruguay, 12–15 May 2014; pp. 1382–1387. [Google Scholar]
Figure 1.
The block diagram of the implemented system.

Figure 2.
The flowchart of the developed Java software.

Figure 3.
The flowchart of the monitoring and recording software.

Figure 4.
The daily power consumption of the refrigerator.

Figure 5.
The power consumption when the refrigerator door is opened.

Figure 6.
The power consumption of the washing machine for the cotton and synthetics washing programs at 40 °C.
Figure 6.
The power consumption of the washing machine for the cotton and synthetics washing programs at 40 °C.

Figure 7.
The power consumption of the washing machine for the mixed washing program at 30 °C.

Figure 8.
The power consumption of the washing machine for the mixed washing program at 40 °C.

Figure 9.
The power consumption of the dishwasher for the 55 °C economy program.

Figure 10.
The power consumption of the dishwasher for the 65 °C power program.
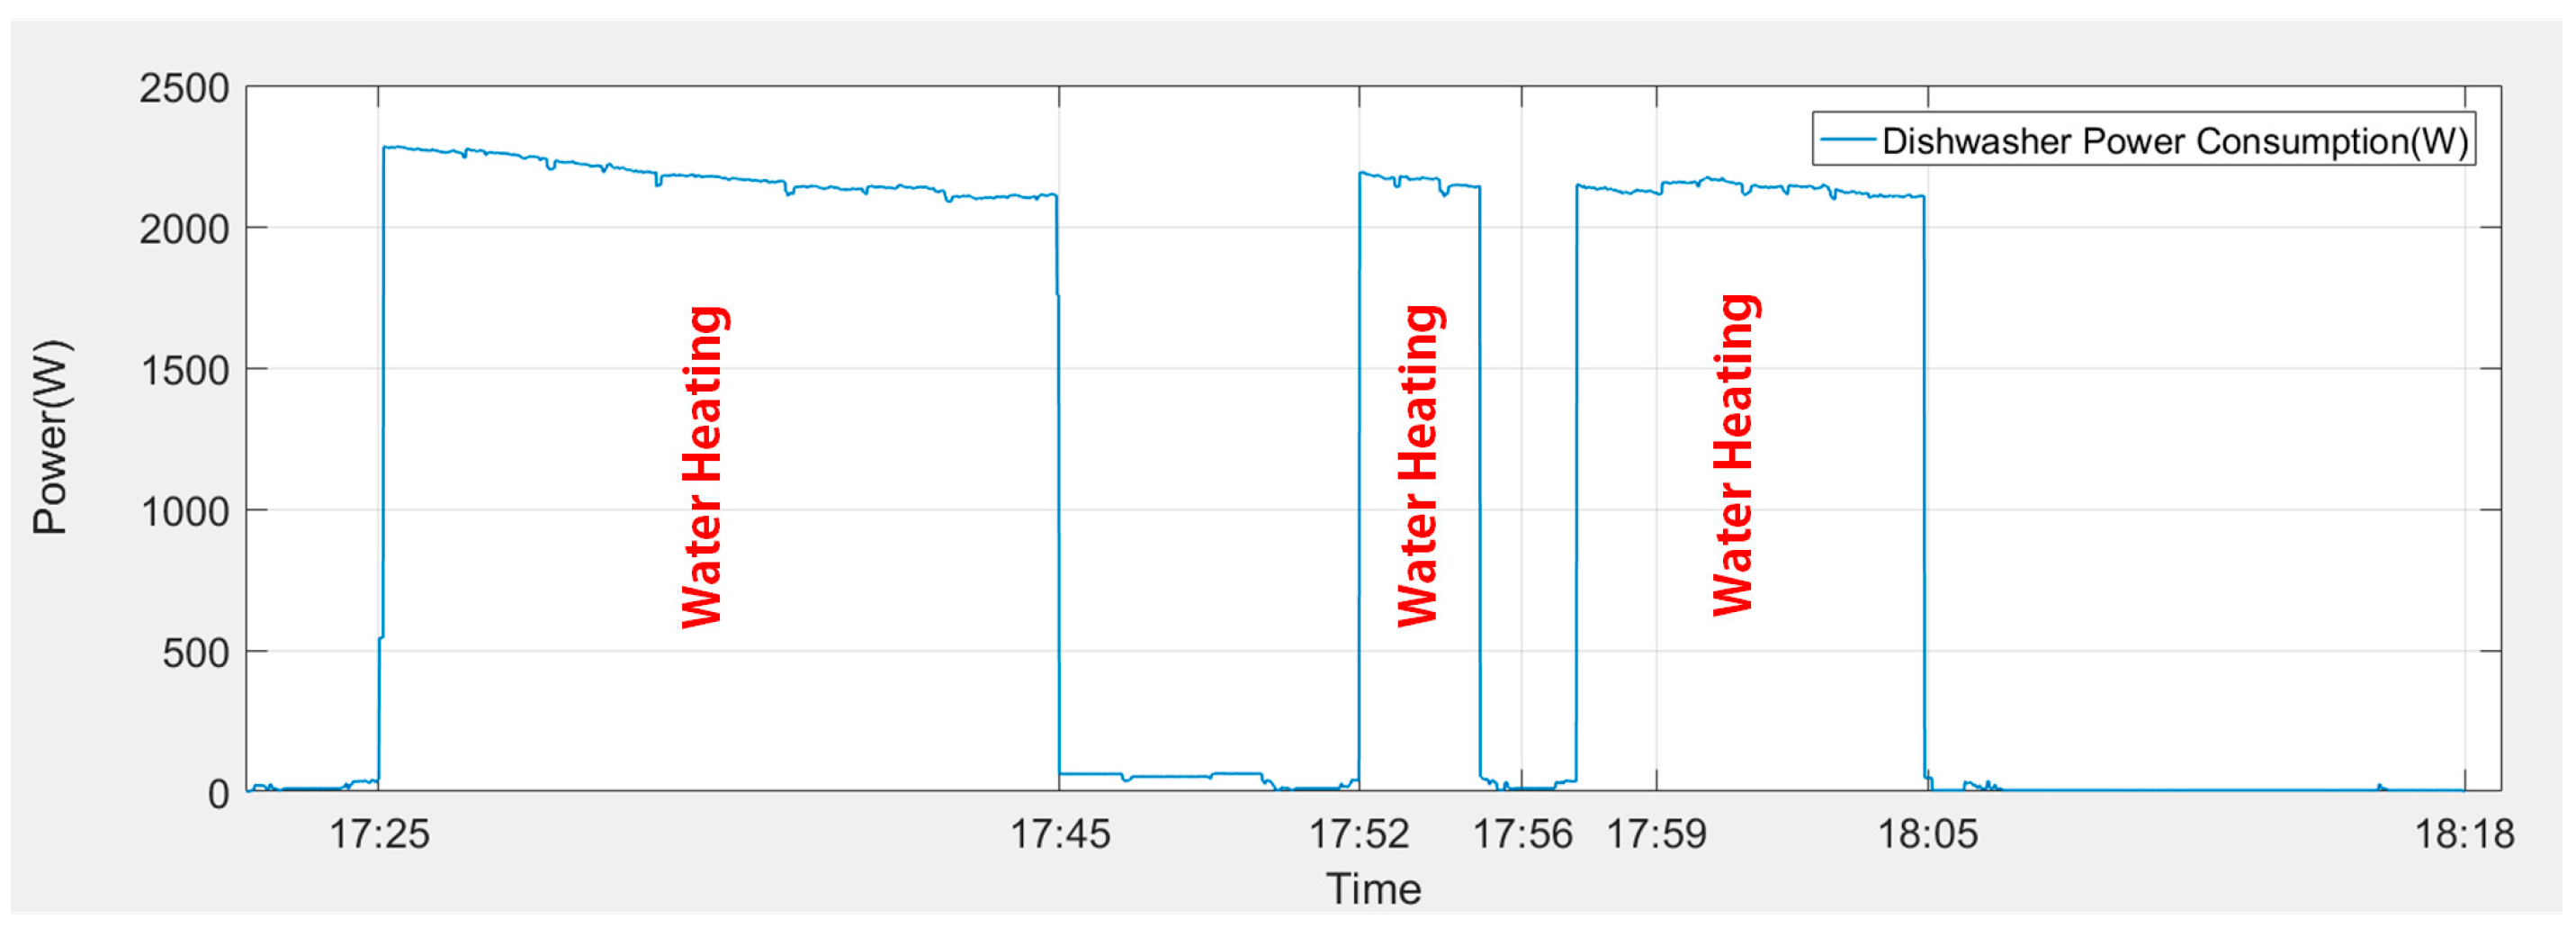
Figure 11.
The power consumption curve of the oven for cooking at 180 °C temperature.

Figure 12.
The power consumption curve for one ironing period in the operating mode level 2.

Figure 13.
The power consumption curve of the hair dryer in high-speed blowing mode.

Figure 14.
The power consumption curve of the kettle for (a) 0.5 L water, (b) 1 L water, and (c) 1.5 L water.
Figure 14.
The power consumption curve of the kettle for (a) 0.5 L water, (b) 1 L water, and (c) 1.5 L water.

Figure 15.
The power consumption curve of the range hood for fan speed (a) level 1, (b) level 2, and (c) level 3.
Figure 15.
The power consumption curve of the range hood for fan speed (a) level 1, (b) level 2, and (c) level 3.
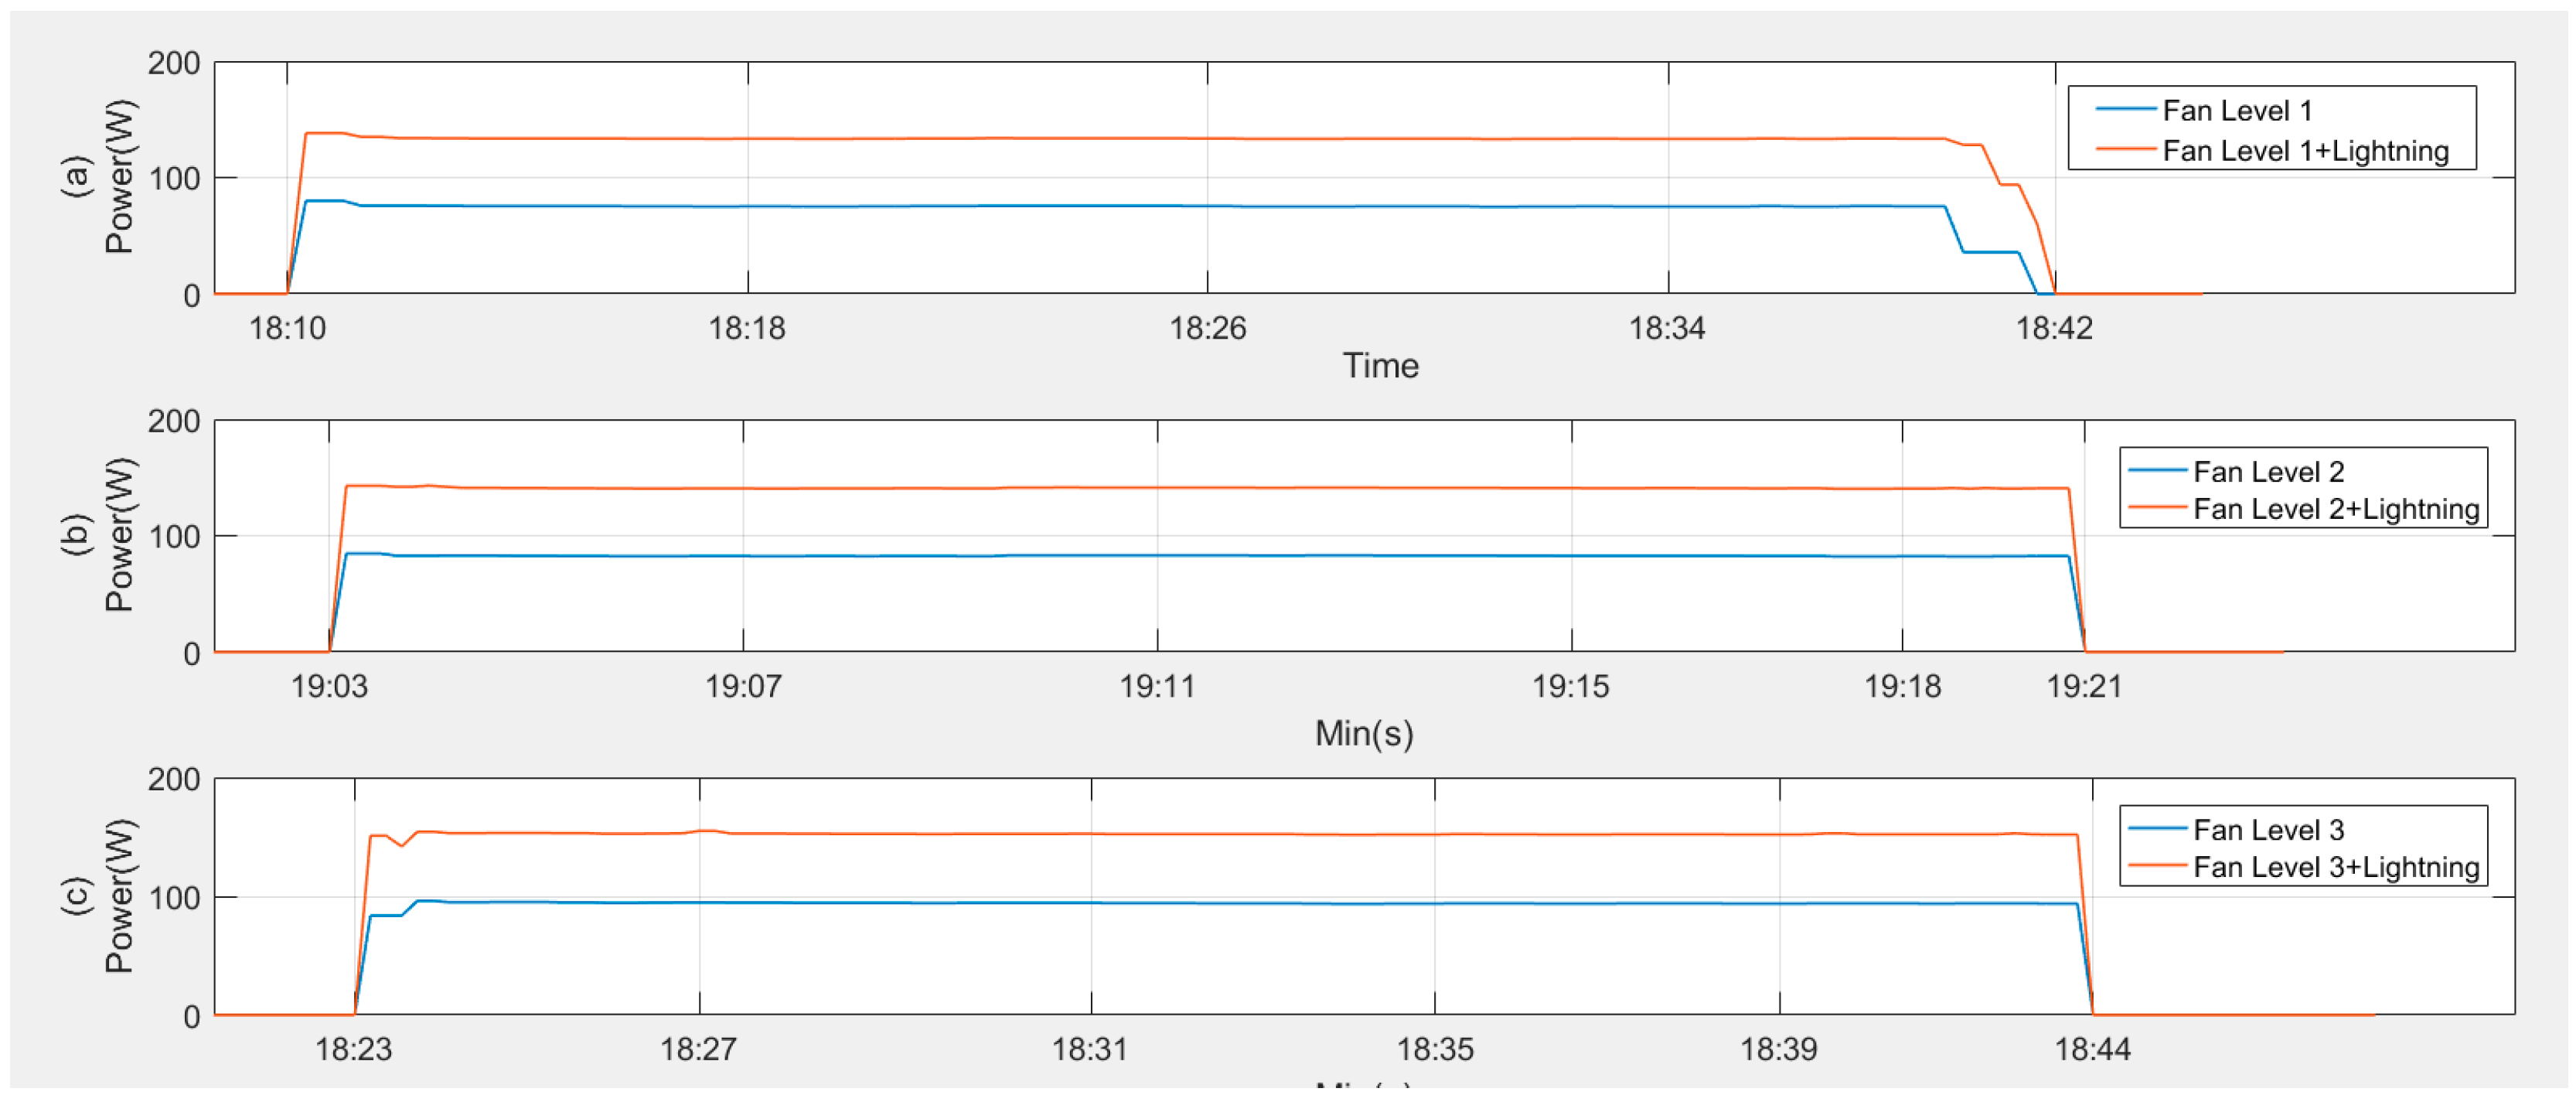
Figure 16.
The power consumption curve of the toast machine for the obtained sample case.

Figure 17.
The power consumption curve of the television.

Figure 18.
The power consumption curve of the desktop computer during one day utilization.

Figure 19.
The example power consumption curve for the laser printer.
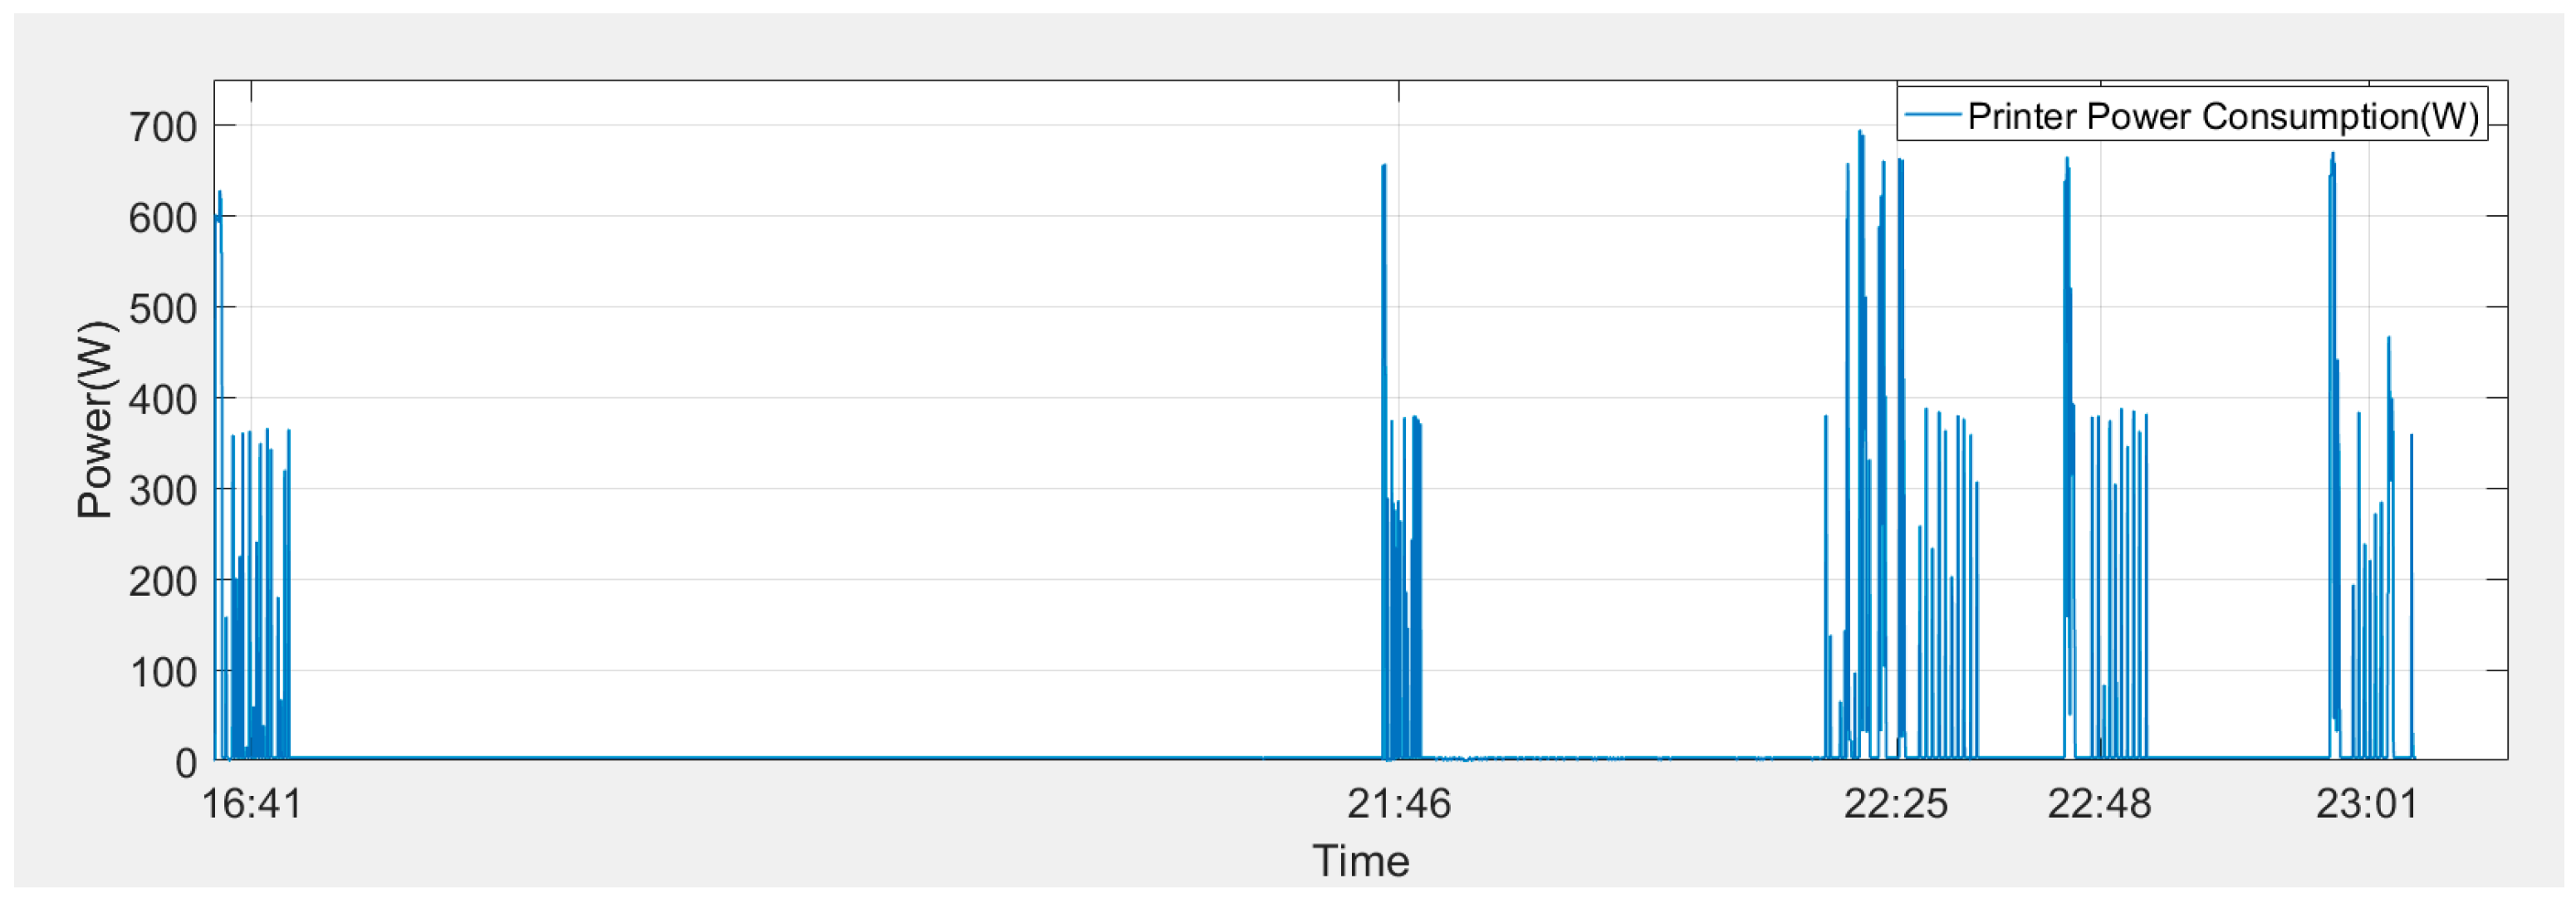
Figure 20.
The total and standby power consumption of the household appliances for November.


Table 1.
The brand, model, efficiency class, and power consumption of the home appliances used in load profile analysis.
Table 1.
The brand, model, efficiency class, and power consumption of the home appliances used in load profile analysis.
| ID | Device | Model | Efficiency Rating | Average Power Ratio | |
|---|---|---|---|---|---|
| SP1 | Refrigerator | Bosch KDN56AW35N |  | 309 kWh/year | |
| SP2 | Washing Machine | Bosch WAT24460TR |  | 0.70 kWh–40 °C | |
| SP3 | Dishwasher | Bosch SMS43D12TR |  | 1.02 kWh | |
| SP4 | Oven | Bosch HBN551E1T |  | 0.79 kWh | |
| SP5 | Iron | Tefal Ultimate 400 | 2600 Wh | ||
| SP6 | Hair Dryer | Fakir Cosmic 2000 | 2000 Wh | ||
| SP7 | Kettle | Clatronic WKS2882 | 2400 Wh | ||
| SP8 | Range Hood | Ferre FMP600 | 145Wh | ||
| SP9 | Toast Machine | Arzum AR279 | 1800 Wh | ||
| SP10 | LED Television | LG 47LB670V |  | 70 kWh/year | |
| SP11 | PC | Case | Standard | - | |
| Monitor 1 | LG E1960 LCD | 17 Wh | |||
| Monitor 2 | LG W2846L LED | 28 Wh | |||
| Speaker | Creative A60 | 5.5 Wh | |||
| SP12 | Printer | Samsung ML-1610 | 300 Wh | ||
Table 2.
Usage density and power consumption of household appliances for November 2016.
| Device | Mode | Duration | Total Power per Run | Usage Density | Average Total Consumption (Monthly) | Additional Info | |
|---|---|---|---|---|---|---|---|
| Refrigerator | (−18 °C) (+4 °C) | 24 h | 782.83 W | All Time | 23,469 W | Defrosting Power Ratio | 17.8% |
| Washing Machine | 30 °C Mix | 1 h 1 min | 286.19 W | 1 per week | 8005.48 W | Heating Power Ratio | 81.9% |
| 40 °C Mix | 1 h 8 min | 650.97 W | 91.2% | ||||
| 40 °C Synthetic | 2 h 6 min | 1064.21 W | 90.3% | ||||
| Dishwasher | 55 °C Economy | 3 h 11 min | 871.97 W | 6 per month | 5231.82 W | Heating Power Ratio | 88% |
| 65 °C Power | 56 min | 1125.2 W | 2 per month | 2250.4 W | 98.9% | ||
| Oven | 150 °C | 50 min | 933.62 W | 1 per week | 16,363.88 W | Resistor Power Raito | 80.02% |
| 180 °C | 1 h 2 min | 1052.45 | 3 per week | ||||
| Iron | Level 2 | 38.5 min | 486.3 W | 1 per week | 1945.2 W | Heating Time Ratio | 63.8% |
| Hair Dryer | High Heating & Blowing | 43 min | 1263.77 W | 1 per week | 5055.08 W | - | - |
| Kettle | 0.5 L | 1 min 53 s | 66.56 W | 2 per day | 6864.2 W | - | - |
| 1 L | 3 min 17 s | 104.84 W | 6 per week | ||||
| 1.5 L | 4 min 30 s | 155.06 W | 1 per week | ||||
| Range Hood | Level 1 | 34 min | 41.79 W | 2 per week | 1091.2 W | Additional Lightning Power | 0.96 W/min |
| Level 2 | 18 min | 24.82 W | 1 per week | ||||
| Level 3 | 21 min | 32.88 W | 5 per week | ||||
| Toast Machine | Level 3 | 13 min | 209.47 W | 14 per month | 2932.58 W | - | - |
| Printer | Total Printing | 7 min 53 s | 44.05 W | 16 per month | 2858.2 W | Stand By Power | 3 W/h |
| Stand-By | 23 h 52 min | 3 W | |||||
| Television | Weekday | 4 h 17 min | 245.39 W | 22 per month | 8413.7 W | Shutting Down Power | 3.11 W |
| Weekend | 6 h 33 min | 376.89 W | 8 per month | ||||
| PC | On Power | 2 h 14 min | 387.43 W | Everyday | 14,946.6 W | Stand By Power | 5.09 W/h |
| Stand By | 21 h 46 min | 110.79 W | |||||
| TOTAL | 99,427.34 W | ||||||
Table 3.
The total power consumption of home appliances from October to December.
| Device | October (Watt) | November (Watt) | December (Watt) |
|---|---|---|---|
| Refrigerator | 24,803.68 | 23,469.00 | 23,120.41 |
| Washing Machine | 9827.95 | 8005.48 | 9127.25 |
| Dishwasher | 6486.34 | 7482.22 | 9603.37 |
| Oven | 5939.47 | 16,363.88 | 19,192.35 |
| Iron | 2001.68 | 1945.20 | 2601.76 |
| Hair Dryer | 3787.19 | 5055.08 | 5120.20 |
| Kettle | 5098.33 | 6864.20 | 8106.64 |
| Range Hood | 622.31 | 1091.20 | 982.55 |
| Toast Machine | 793.64 | 2932.58 | 3871.99 |
| Printer | 944.74 | 2858.20 | 2657.86 |
| Television | 4968.59 | 8413.70 | 9627.10 |
| PC | 8684.56 | 14,946.60 | 14,183.56 |
| Other | 17,367.52 | 24,991.66 | 40,304.96 |
| Total | 91,330 | 124,420 | 148,500 |
Table 4.
The energy consumption ratios of each home appliance from October to December.
| Device | October | November | December |
|---|---|---|---|
| Refrigerator | 27.16% | 18.86% | 15.57% |
| Washing Machine | 10.76% | 6.43% | 6.15% |
| Dishwasher | 7.10% | 6.01% | 6.47% |
| Oven | 6.50% | 13.15% | 12.92% |
| Iron | 2.19% | 1.56% | 1.75% |
| Hair Dryer | 4.15% | 4.06% | 3.45% |
| Kettle | 5.58% | 5.52% | 5.46% |
| Range Hood | 0.68% | 0.88% | 0.66% |
| Toast Machine | 0.87% | 2.36% | 2.61% |
| Printer | 1.03% | 2.30% | 1.79% |
| Television | 5.44% | 6.76% | 6.48% |
| PC | 9.51% | 12.01% | 9.55% |
| Other | 19.02% | 20.09% | 27.14% |
| Total | 100% | 100% | 100% |
Table 5.
The amount of power consumption according to energy tariff.
| Month | Day Time (kW) | Demand Time (kW) | Night Time (kW) | Total (kW) |
|---|---|---|---|---|
| October | 32.35 | 33.83 | 25.14 | 91.33 |
| November | 48.40 | 41.05 | 34.97 | 124.42 |
| December | 68.10 | 49.40 | 30.99 | 148.50 |
| Total (kW) | 148.85 | 124.28 | 91.1 | 364.25 |
Table 6.
The classification of home appliances.
| Device | Deferrable | Undeferrable |
|---|---|---|
| Refrigerator | ✔ | |
| Washing Machine | ✔ | |
| Dishwasher | ✔ | |
| Oven | ✔ | |
| Iron | ✔ | |
| Hair Dryer | ✔ | |
| Kettle | ✔ | |
| Range Hood | ✔ | |
| Toast Machine | ✔ | |
| Printer | ✔ | |
| Television | ✔ | |
| PC | ✔ |
© 2018 by the authors. Licensee MDPI, Basel, Switzerland. This article is an open access article distributed under the terms and conditions of the Creative Commons Attribution (CC BY) license (http://creativecommons.org/licenses/by/4.0/).
Share and Cite
MDPI and ACS Style
Issi, F.; Kaplan, O. The Determination of Load Profiles and Power Consumptions of Home Appliances. Energies 2018, 11, 607. https://doi.org/10.3390/en11030607
AMA Style
Issi F, Kaplan O. The Determination of Load Profiles and Power Consumptions of Home Appliances. Energies. 2018; 11(3):607. https://doi.org/10.3390/en11030607
Chicago/Turabian StyleIssi, Fatih, and Orhan Kaplan. 2018. "The Determination of Load Profiles and Power Consumptions of Home Appliances" Energies 11, no. 3: 607. https://doi.org/10.3390/en11030607
Note that from the first issue of 2016, this journal uses article numbers instead of page numbers. See further details here.