Performance and Greenhouse Gas Reduction Analysis of Biogas-Fueled Solid-Oxide Fuel Cells for a Sewage Sludge and Food Waste Treatment Facility


School of Mechanical Engineering, Pusan National University, Busan 46241, Korea
*
Author to whom correspondence should be addressed.
Energies 2018, 11(3), 600; https://doi.org/10.3390/en11030600
Submission received: 12 February 2018
/
Revised: 5 March 2018
/
Accepted: 6 March 2018
/
Published: 8 March 2018
Abstract
:The supply rate goal for new and renewable energy has been set to 20% by 2030 through the expansion of biogas production. The goal to reduce CO2 and greenhouse gas emissions by 37% below the business-as-usual (BAU) level of 851 million by 2030 was set by the Korean Government. However, biogas from corresponding treatment facilities is not used for the purpose of energy production, but is incinerated to raise the temperature of digesters. This study aimed to conduct a simulation of a solid oxide fuel cell (SOFC) hybrid plant using actual biogas operation data, analyzing annual performance. The 2450 kW SOFC system was set to its maximum capacity, with the available amount of biogas and the heat of the exhaust gas used to heat the anaerobic digester, but the amount of digester heat decreased in summer because of high air temperature. Up to 55% of total power usage could be produced via biogas, and a 45% reduction in CO2 was achieved.
1. Introduction
The anaerobic digestion of organic waste involves the fermentation of organic materials without the presence of oxygen. This process has widely been used as a method for the stabilization of sewer sludge since the early twentieth century. It has several advantages, such as reducing the volume of sludge, remediation, and the production of biogas, which is an energy byproduct that mainly consists of methane and CO2 [1]. The supply rate goal for new and renewable energy has been set to 20% by 2030, through the expansion of biogas production. The Korean Government aims to reduce CO2 and greenhouse gas emissions by 37% below the “business-as-usual” level of 851 million tons by 2030 [2]. Thus, a significant amount of attention has been paid to clean energy research and development, as well as projects related to reducing greenhouse gas emissions.
Reducing waste can be facilitated by using bio-gasification. In addition to greenhouse gas reduction, the production of new and renewable energy can be expected [3]. Biogas can be used in boiler fuels, power generation and cogeneration in gas engines and turbines, and as fuel in fuel cells [4]. Some of the biogas produced in Korea is used in boiler fuel to increase the temperature in digesters, and the rest is used in incineration treatment facilities. In recent years, the use of biogas has increased to connect city gas piping networks or to supply fuel for vehicles, with the development of technology that increases the purity of the methane in biogas [5]. These efforts can improve the environmental impact and economic feasibility of using biogas.
One of the main uses of biogas is engine power generation. There is 6 kW of energy in 1 Nm3 of biogas, which produces 2.1 kWh of electricity, assuming a power generation efficiency of 35%. Since the mid-1980s, co-combustion power generation systems in diesel engines have be used in sewage treatment facilities. In the Su-Young wastewater treatment plant in Busan, a dedicated biogas engine with a capacity of 750 kW, was introduced in 2002. A gas engine with a capacity of 375 kW was installed in the Jeju wastewater treatment plant in 2005. A gas engine with a 280 kW engine was installed in the Jecheon wastewater treatment plant in 2007, and two gas engines with 1500 kW engines were installed in the Nanji Sewage Treatment Center. The number of biogas power plant facilities in Korea is growing, but the focus has been on gas engines rather than gas turbines and fuel cells.
The government has focused on expanding the facilities that treat organic wastes. However, there has not been much facility expansion for biogas production and utilization. Co-generation facilities that use biogas are expected to expand according to current policies. It is necessary to establish mid- to long-term planning for systematic and efficient progress through analysis of biogas production and utilization. According to the Policy of Energy Generation from Wastes from the Ministry of Environment, a 3Es paradigm that integrates the environment, economy, and energy has been adopted.
Fuel cells produce power using heat and electricity created by the electrochemical reaction of fuel and oxygen. Fuel cells have very high efficiency of up to 40–60%, and if the exhaust heat can be used, it can be converted to energy with up to 80% efficiency. The efficiency is higher than that of thermal power generation when fuel for power generation can be reduced and co-generation power can be obtained. Furthermore, the amounts of NOx and CO2 emitted are about 1/38 and 1/3 that of thermal power generation using coal. The noise is also very low, and nearly no pollution is emitted. It is thus considered a pollution-free energy technology.
A solid-oxide fuel cell (SOFC) is simpler than a molten carbonate fuel cell (MCFC), which must deal with CO2 [6]. Furthermore, the solid electrolyte is more convenient, and it has the highest efficiency of all fuel cells. Since the electrolyte is solid, there is no concern about leakage or humidification. A SOFC is a high-temperature fuel cell that is operated at around 700–1000 °C. The cell has high efficiency due to its low voltage loss as a result of the high working temperature.
SOFC systems directly fed by biogas have been verified as practicable for a variety of SOFC configurations in several studies. The combination of high CH4 concentration and Viking producer gas, yields an encouraging possibility for a fuel for SOFCs [7]. This possibility for use has already been reported by Hoffmann et al. who set a single fuel cell on pure gas from the Viking gasifier for 150 h without compromising the cell catalysts [8]. A component of the SOFC modeling was performed using an electrochemical model, looking at the ideal operating utilization and full load effects [9]. Shiratori et al. [10] evaluated SOFCs fed by only biogas, with an internal reforming mode maximum of 800 °C to protect cell materials. They discovered that system models are useful and make up for weak research guiding single SOFC and hybrid systems over recent decades. Yi et al. [11] investigated new incorporated H2 reforming systems and showed that system efficiency drops by around 1.1% when using biogas instead of liquid natural gas.
Farhad et al. [12,13] set and operated a full and partial load analysis of single SOFC and hybrid systems, with combined heat and power (CHP), by a simulation. Vakouftsi et al. [14] performed three case studies using computer models of existing states within an internal reforming SOFC system configuration that was fed according to a stream carbon ratio (SCR). The integrated system components were thermodynamically modeled under steady-state conditions. Mass and energy balances were applied for each component using lumped models.
Efforts have also been made to incorporate micro gas turbines (MGTs) with SOFCs to satisfy increasing demand for highly efficient energy production, along with reducing environmental pollutant substances. SOFC-MGT hybrid power systems, with outputs of tens to hundreds of electrical kilowatts, have been presented experimentally [15,16,17]. Therefore, biogas is considered as one of the most promising renewable energy sources for distributed power generation and heat supply without additional fuels, and SOFC-MGT fueled biogas appears to be one of the best potential alternatives for distributed power generation and heat supply.
This study evaluated the performance of an SOFC hybrid system, using actual biogas operation data derived from the processing of food waste and sewer sludge. Data on greenhouse gas reduction was also provided, from the perspective of power production. Biogas from the examined treatment facility is not used for the purpose of energy production and is only incinerated to increase the temperature of a digester. Thus, the aim was to generate and use power directly, as well as to obtain thermal energy to increase the temperature in the digester, in order to recover waste biogas. This study also clarified the relationship between the scale of a plant and the optimal size of equipment.
2. System Description
2.1. Sewage Sludge and Food Waste Treatment Facility
In this study, we designed and analyzed two CHP systems, based on data collected from a biogas plant located in Busan, Republic of Korea. The plant was originally built in 1988 to handle the sewage produced by one million people, and it was renovated in 2013 to meet enhanced discharge regulations by introducing a new membrane bioreactor. As one of the sub-processes, the plant operates four 7000 m3 capacity anaerobic digesters to reduce the organic contents of the sewage sludge and to produce biogas as a profitable by-product. For the anaerobic digester, organic-rich food waste is added to increase digestion efficiency by providing a good nutrient balance for anaerobic bacteria. Figure 1 shows the layout of the biogas facility in Busan, Republic of Korea. There are four egg-shaped anaerobic digesters that have a capacity of 7000 m3 (a total of 28,000 m3). The anaerobic digesters can process a maximum of 220 tons of waste per day. The digestion temperature is controlled to 35~37 °C, with an optimum temperature of 36.5 °C, to activate anaerobic bacteria. Plant operators must maintain this temperature.
The primary purpose of the plant is processing organic matter within 20 days, rather than producing biogas. The heat load of the anaerobic digesters is estimated by summing the heat related to sludge heating and the convective heat lost through the temperature of the atmosphere and earth:
Table 1 reports the parameters used for estimating the heat loads of the anaerobic digesters. For the calculation, the temperature of the incoming sludge was assumed to be the same as the ambient temperature. The surface area of the anaerobic digesters was estimated as 1866 m2. The digester was assumed to be completely filled and well-mixed with a mechanical agitator and an air blower. The digester was partially affected by the thermal condition of the ground; therefore, the surface area was divided into three portions: the surface buried in the soil (bottom side), the thick wall revealed to the air (body side), and the thin wall revealed to the air (roof side). The wall was made from concrete, and the sludge was only treated as waste water.
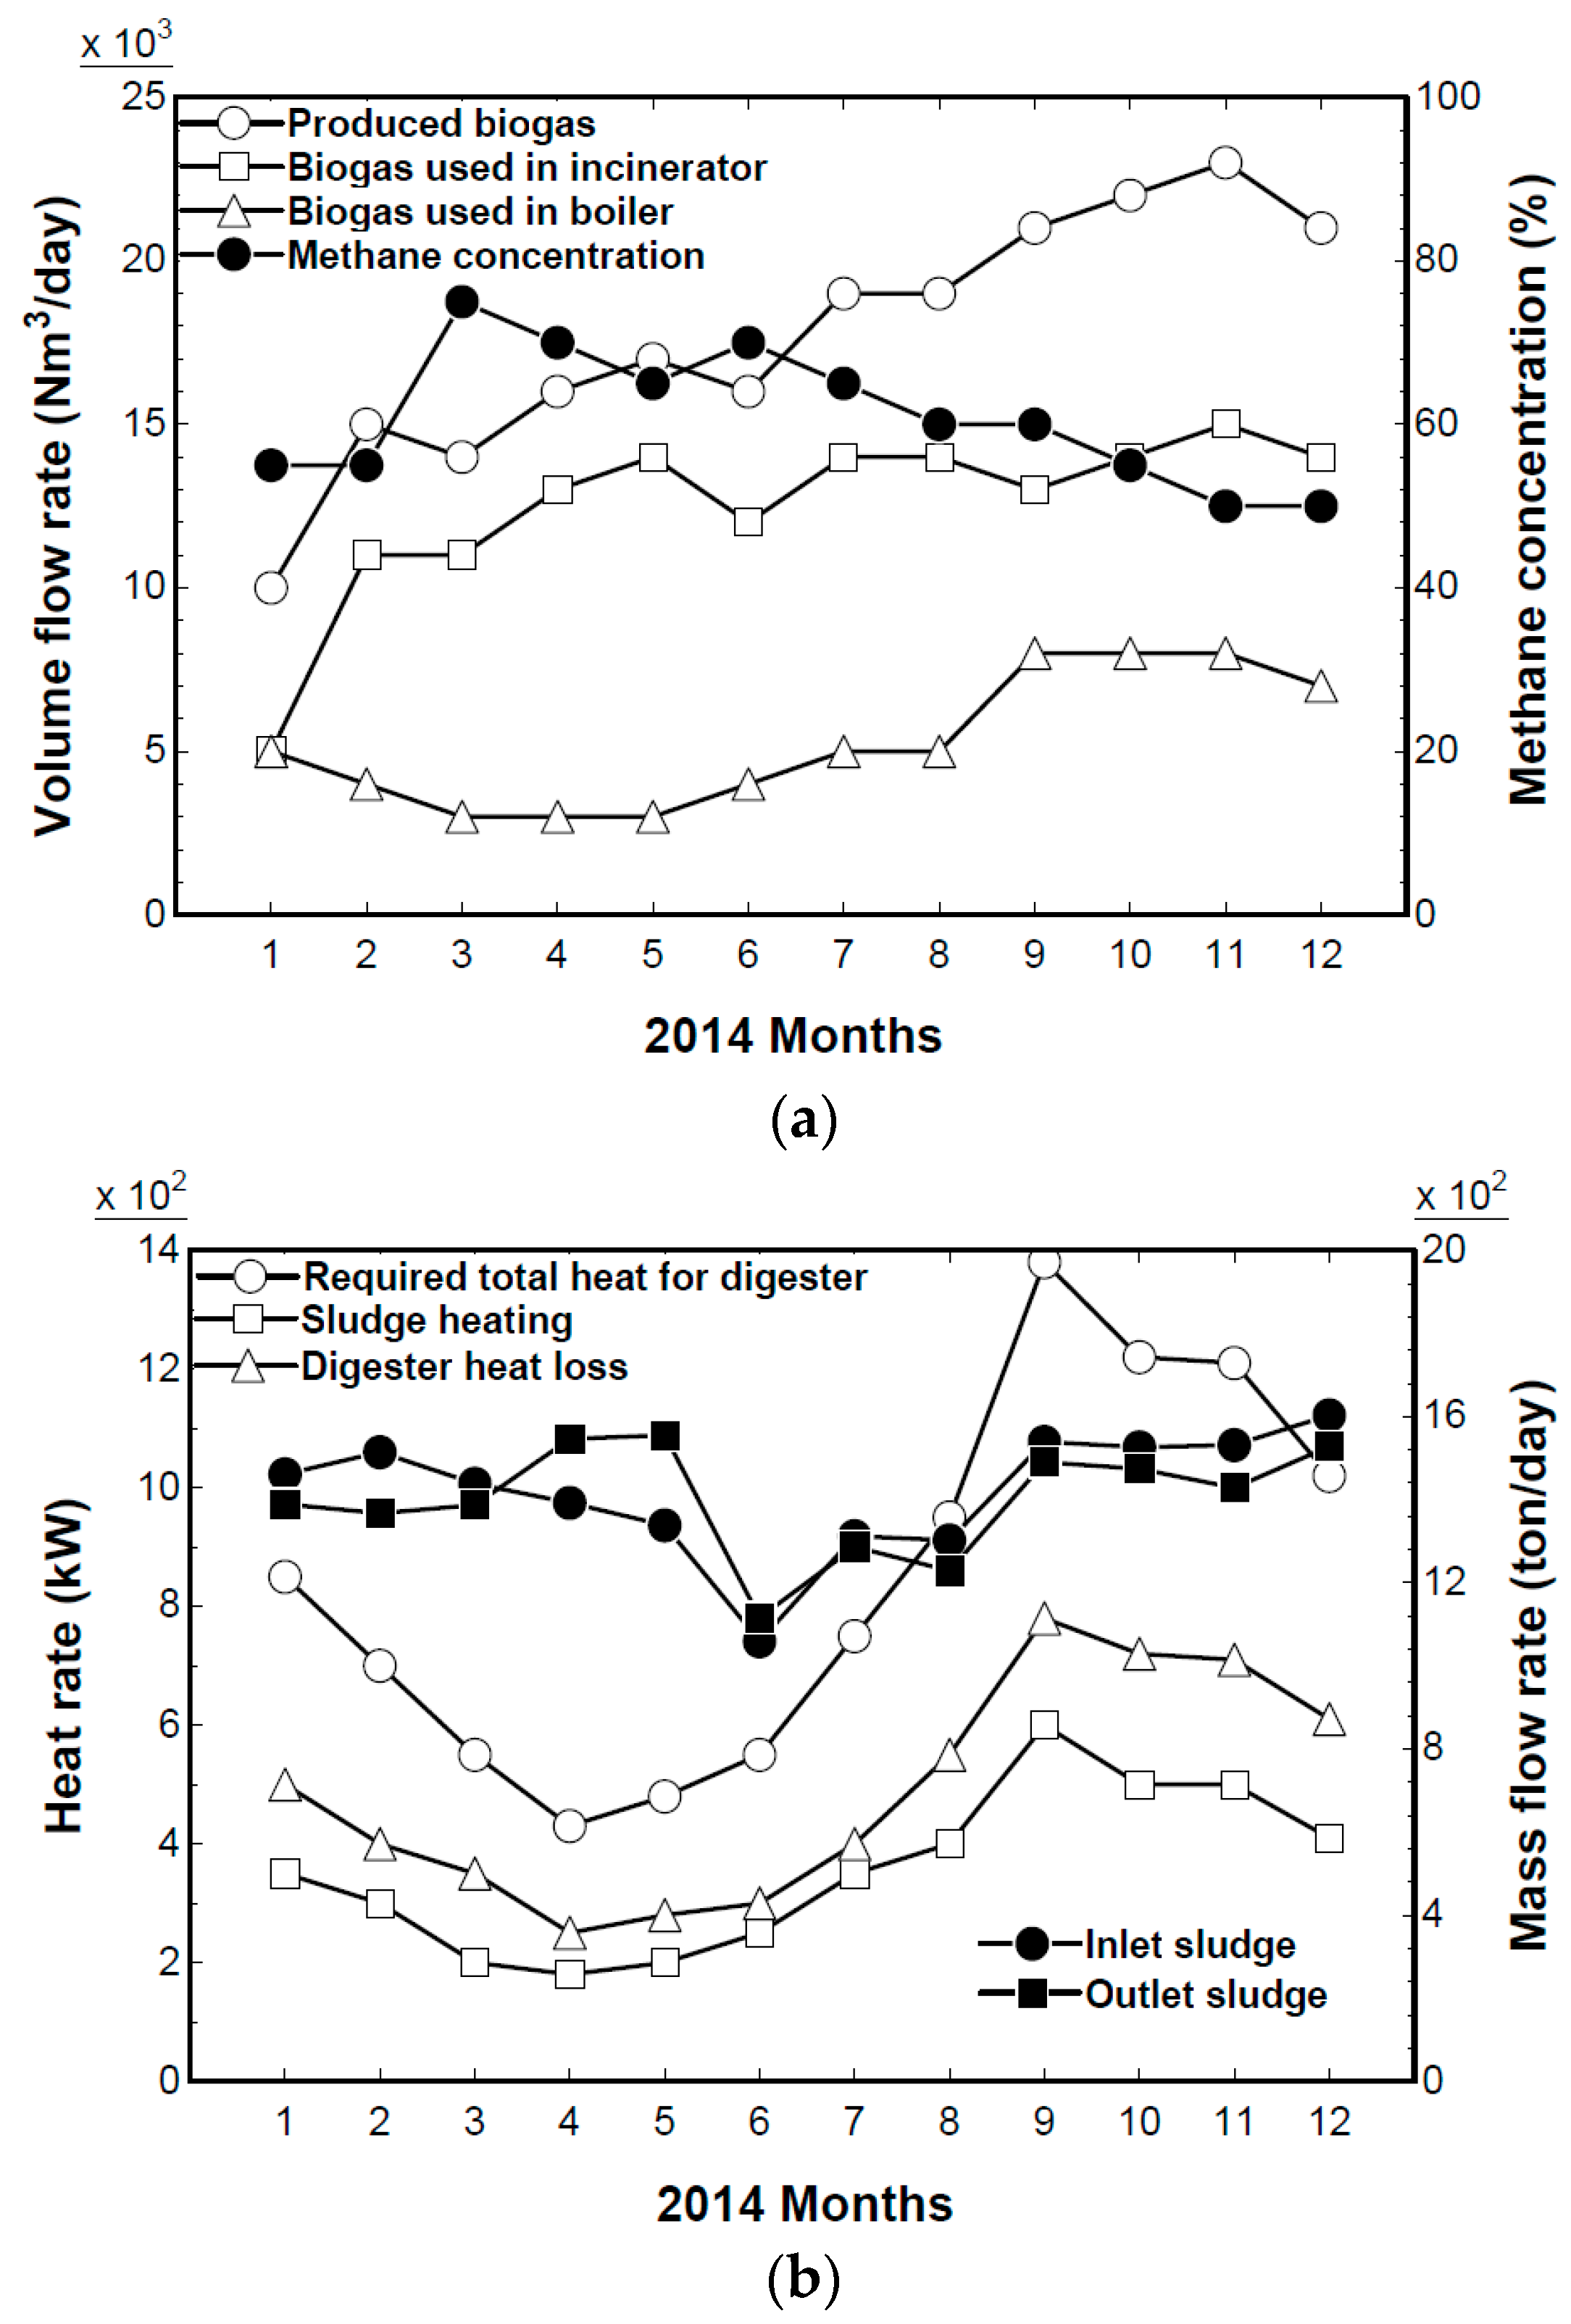
Figure 2 shows the operating data for the facility. The operating biogas and methane concentrations are shown in Figure 2a, along with the monthly average daily biogas produced for one year (2014). This plant produced max. 23,000 Nm3/day of biogas, and about 25% of total biogas was used to heat the digester. Figure 2b shows the heat loads of the target plant. The biogas used in the boiler decreased in temperature in summer because of the small amount of digester heat. Figure 2c shows the digester and ambient temperatures. There were overhaul periods in late winter, which is why digester temperatures for these periods were below 30 °C.
2.2. Biogas Fueled External Reforming of the Solid Oxide Fuel Cell (SOFC) Hybrid System
Figure 3 shows a schematic of a biogas-fueled external reforming SOFC system. The efficiency of the power unit can be an important design variable. Thus, a SOFC that has a high operating temperature and high efficiency was used as a power generation device, and biogas was used as a fuel for hydrogen production. A steam reforming method was also used due to its system efficiency and ability to recycle steam. External reforming was used for fuel reforming. The advantages of external reforming are lower thermal fatigue and impact due to the formation of uneven temperature distribution inside cells, as well as lower carbon generation risk. Since carbon oxide can be used as a fuel, a separate shift reactor was not installed.
The steam for reforming was obtained by recycling the steam in the stack anode outlet, in consideration of the space available. As a result, there was no need for space to store a large amount of water or for additional evaporation and water treatment devices. The steam reforming reaction was an endothermic reaction with a high fuel-reforming rate at high temperatures. Therefore, a reformer was installed at the stack cathode outlet to use the high-temperature waste heat. This helped to avoid having temperatures that exceeded the limits of the material. The temperature of the fuel supplied to the stack and air was designed to alleviate thermal fatigue and the impact of uneven temperature distributions, for safety. The maximum temperature for the attached devices, such as the heat exchanger, was set to 950 °C, based on the heat durability of the materials [18,19]. The maximum cell operating temperature was also 950 °C.
During the process, biogas from the storage tank was mixed with recirculation gas in the stack anode and then sent to the reformer. Hydrogen was generated in the reformer as methane, resulting in steam. The reformed gas included carbon monoxide, carbon dioxide, steam, a small amount of unreformed methane, and hydrogen. The reformed gas, with a high concentration of hydrogen, was supplied to the cell’s anode. Air was used to supply oxygen for electrochemical reactions and cell cooling. It was sent to the cell’s cathode through an air blower and preheater.
Hydrogen and carbon monoxide at the cell’s anode reacted with oxygen ions, which were passed through the cathode and electrolyte layer electrochemically to generate steam and carbon dioxide and emit electrons. The excess air supplied to the stack absorbed the heat generated via the irreversible process of the reaction and was then discharged. The waste heat was recycled as a heat source in the reformer. The outlet gas of the stack anode included unreacted hydrogen, carbon monoxide, and a small amount of methane, and it was combusted along with outlet air in the combustor. The high-temperature gas at the combustor outlet was recovered as a heat source for preheating air and as heat energy for steam generation at the economizer.
3. System Modeling
Matlab and Simulink were used to analyze system performance. Thermophysical properties were estimated using REFPROP 9.1, with the systems in steady state and heat losses ignored. The mass flow rate and heat in the exhaust gas were expressed in relation to air, to represent the different components of the exhaust gas. Because noncombustible biogas gases were below 1%, except for carbon dioxide, the biogases were simply assumed to be CH4 and CO2.
3.1. Reformer
Air and fuel enter the tubular SOFC, where electricity and heat are produced by electrochemical reactions. Steam-methane reforming can be described by the following reforming and shifting reactions:
We assumed that the main reactions reached equilibrium at a given steam and carbon ratio (S/C), temperature, and pressure. The relationship between the equilibrium constant (K) and Gibbs free energy (G) can be calculated using the following chemical equilibrium equation:
where R is the gas constant, and T is the temperature (K). The equilibrium constant is different for each reaction equation. The equilibrium constant (Kr) in the reforming reaction and the equilibrium constant (Ks) in the transition reaction can be given by:
where P is a partial pressure.
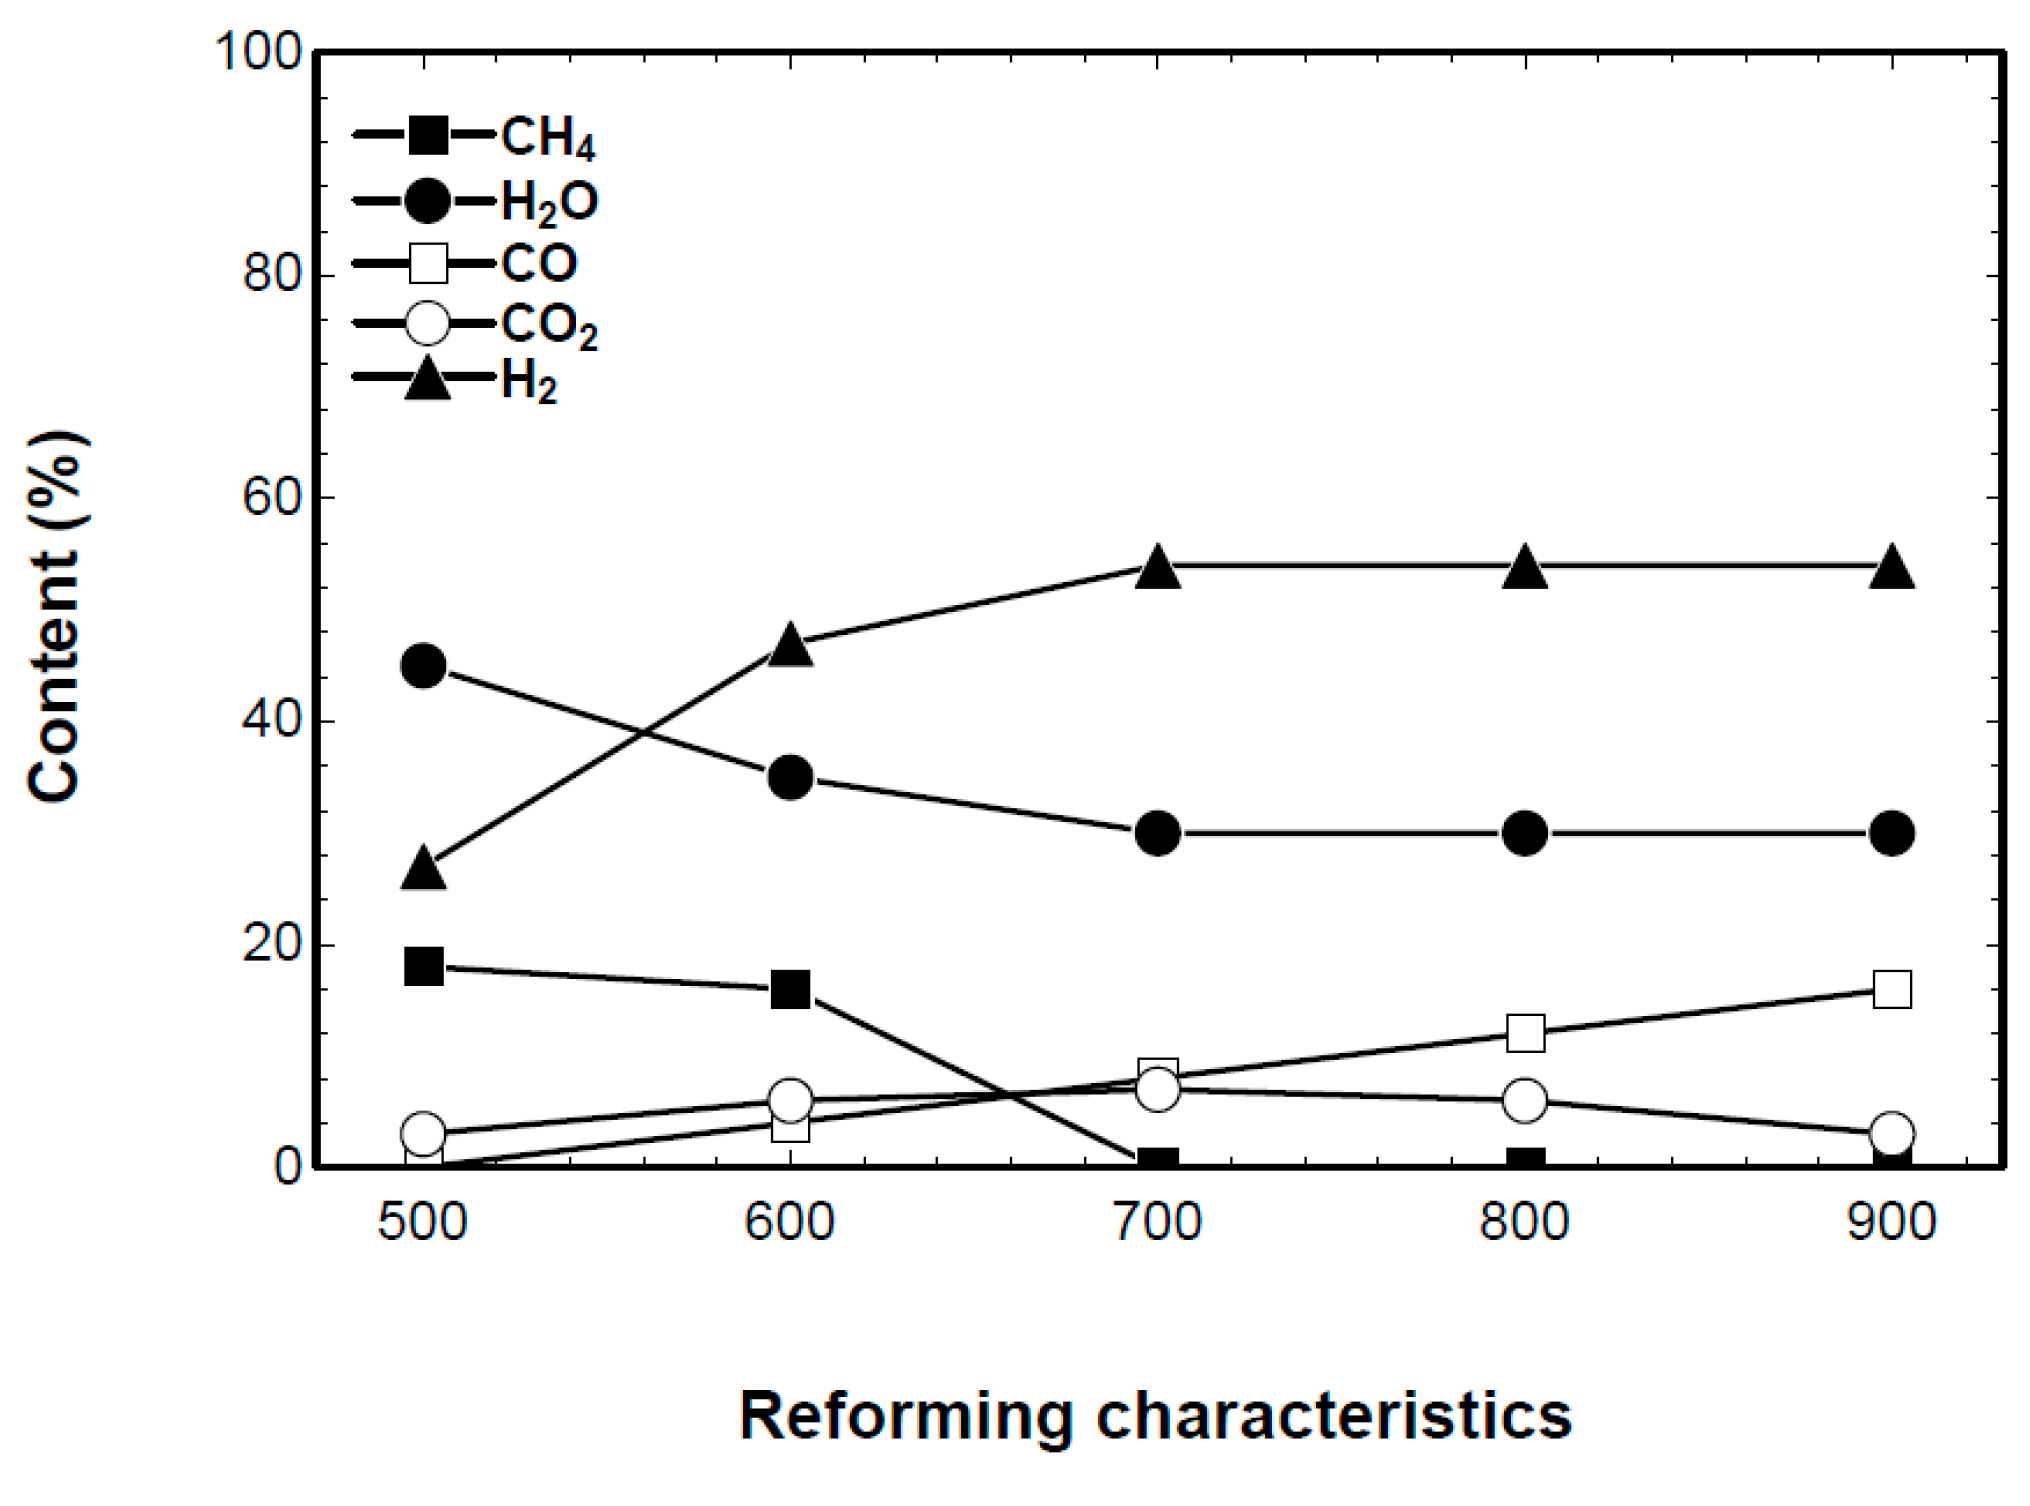
Figure 4 shows the changes in the SOFC gas content with respect to the reforming temperature for a power output of 350 kW, S/C of 3, temperature efficiency of the pre-heater of 85%, and current density of 3000 A/m2. With increasing reforming temperature, H2 content increases initially, then peaks and remains at about 55% from 700 °C to 900 °C with biogas (60% methane).
3.2. Circuit Voltage
The following equations represent the electrochemical reaction of hydrogen and carbon monoxide in the cell anode and the cell’s induced voltage (V):
where E is the theoretical open circuit voltage, and Vact, Vohm, and Vtrans are the activation, resistance, and concentration overvoltage, respectively. The theoretical open circuit voltage depends on the operating temperature, operating pressure, and fuel composition, which is expressed in the following equation based on Gibbs free energy and the Nernst equation:
where F is the Faraday constant, and the superscript ° indicates a standard state.
3.3. Overvoltage
The actual voltage induced during load operation decreases due to irreversible factors. Some of the main losses are because of activation overvoltage, resistance overvoltage, and concentration overvoltage. Activation energy is needed to induce the electrochemical reaction in the electrode, and the resulting voltage drop is called the activation overvoltage. General equations used to calculate activation overvoltage include the Tafel, Butler-Volmer, and Achenbach equations [20]. The Achenbach equation was used in this study, which is based on electrical resistance (Ω):
The activation energy (Ea) of the anode used in this equation was 110 kJ/mol, that of the cathode was 160 kJ/mol, and the coefficients , Da,CO, and Dc were 2.13 × 10⁸, 2.98 × 10⁸, and 1.49 × 10¹⁰ A/m2, respectively. The value of m was 0.25. The subscript a refers to the anode, and c refers to the cathode. The resistance overvoltage is the loss incurred due to the resistance (Ωohm) during electrolyte and electron migration in the electrode. It can be calculated using the following equations, along with the resistivity (ρ) and electrical resistance equations:
where i is the current density, δ is the thickness, and the subscript e refers to the electrolyte layer. The concentration overvoltage is the loss due to changes in concentration as reactants are consumed in the reaction area between the electrolyte and electrode. It can be calculated using the following limiting current density model, with the limiting current density (iL) set as 9000 A/m2:
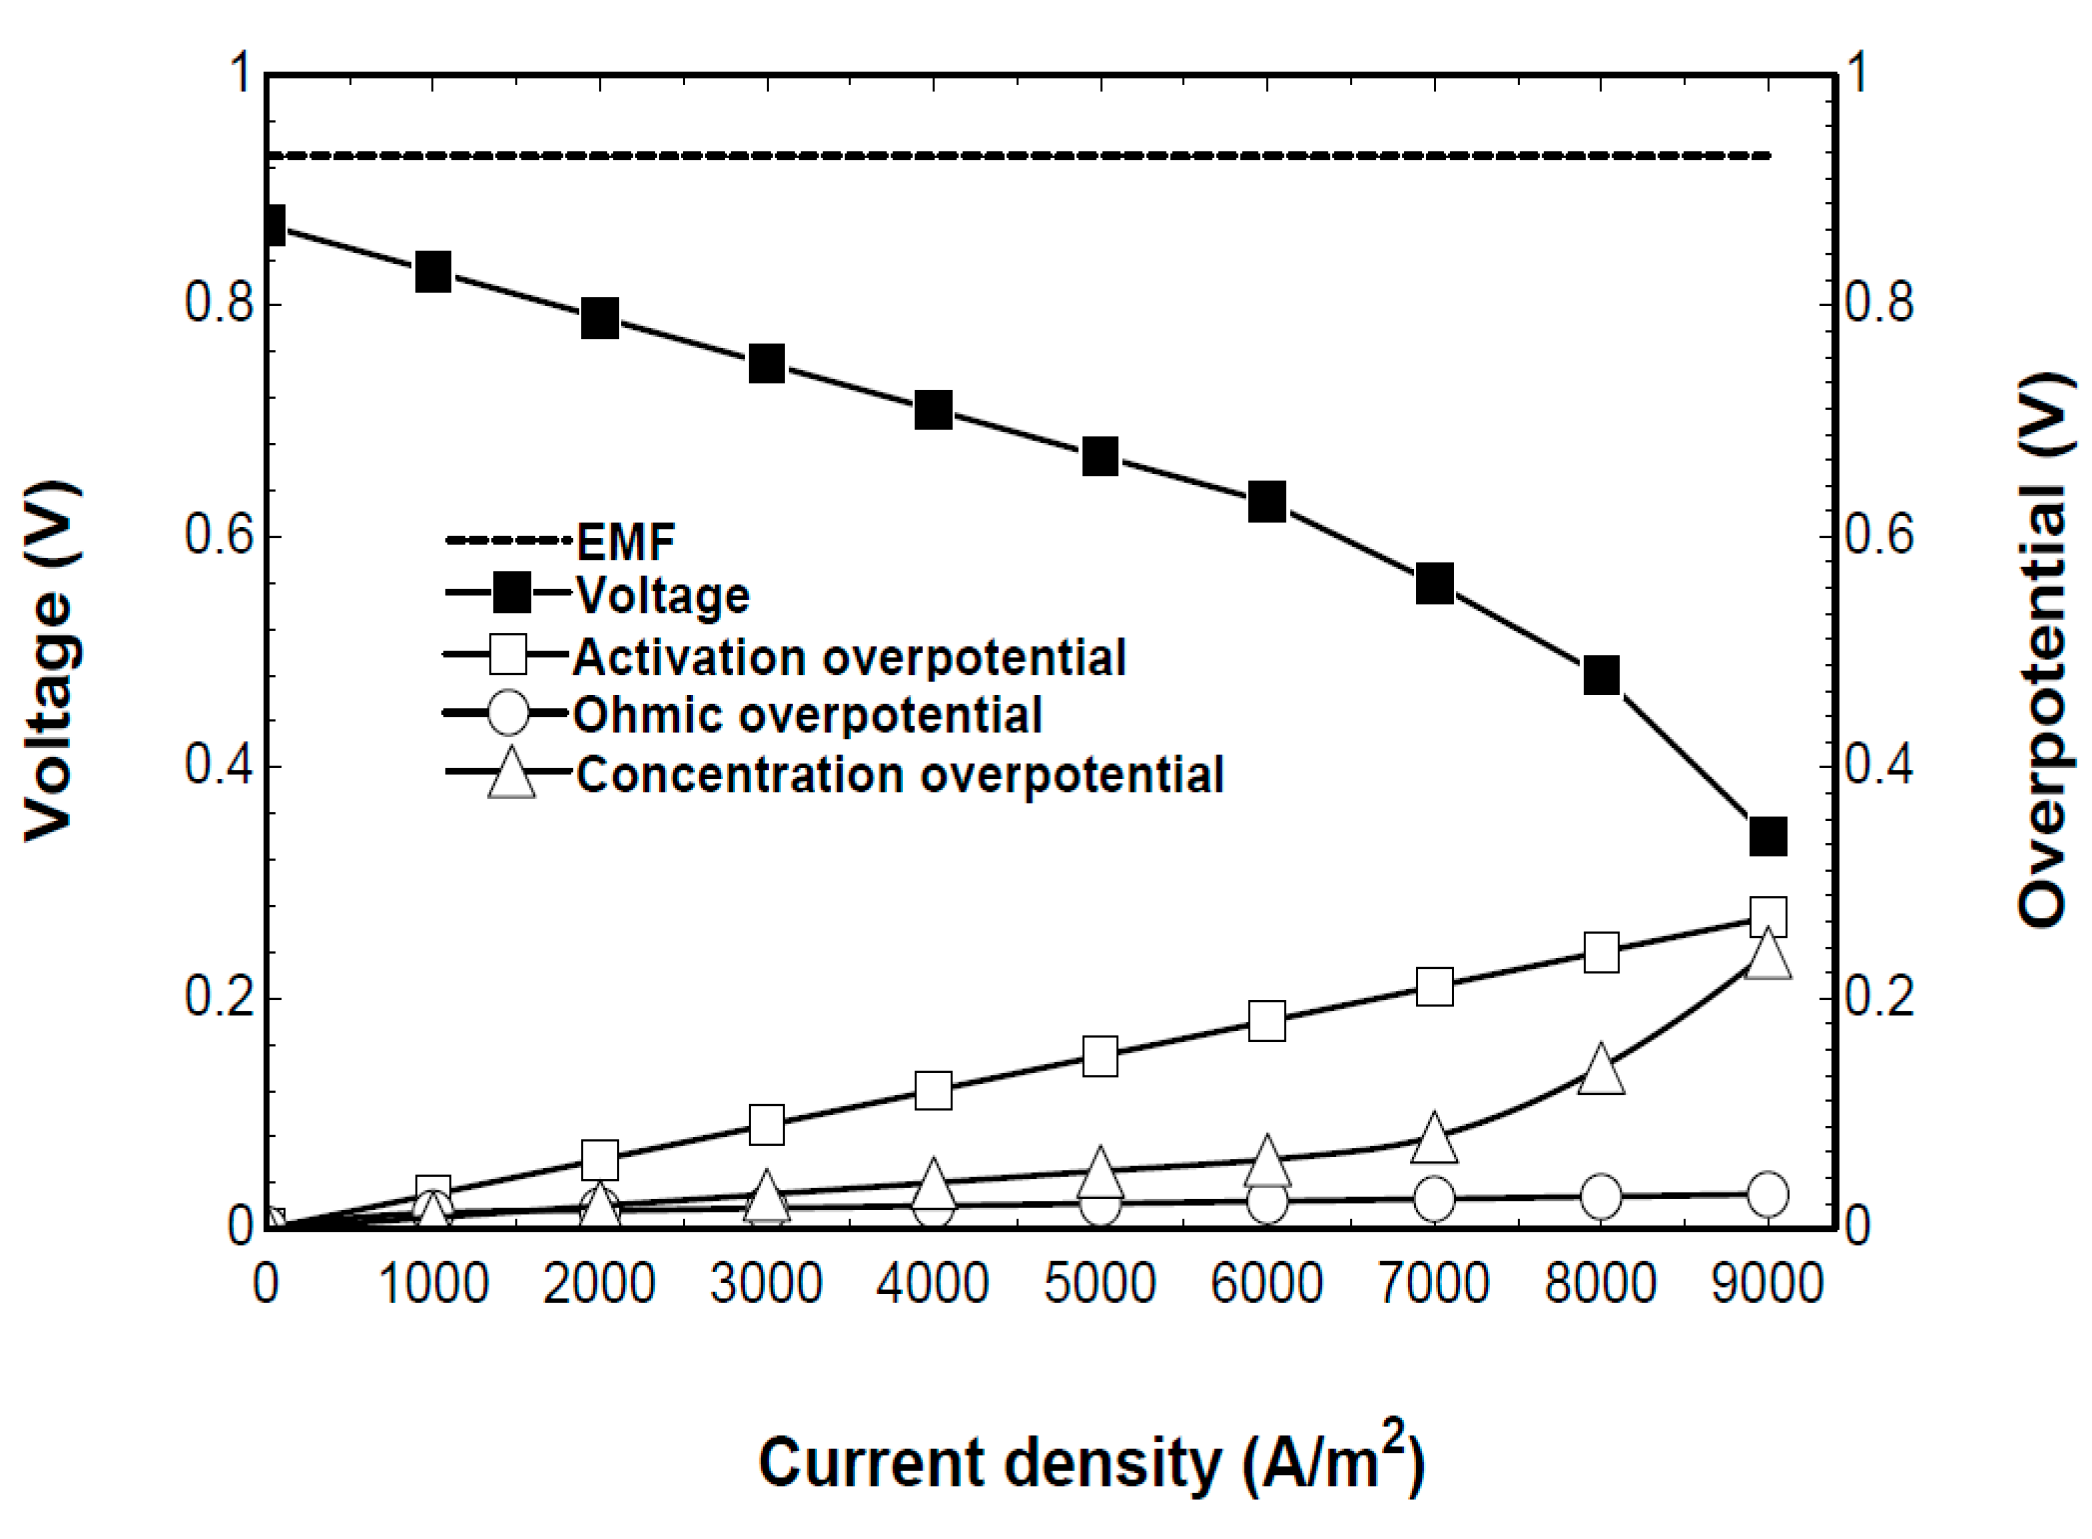
Figure 5 shows the changes in the cell’s induced voltage and overvoltage with respect to the cell’s current density. The cell operating temperature was 950 °C, S/C was 3, the temperature efficiency of the pre-heater was 85%, and the utilization rate of hydrogen fuel was 80%. The open circuit voltage of standard pressure at 3000 A/m2 was 0.93 V, and the actual voltage induced by overvoltage loss and the Nernst effect was approximately 0.75 V. The actual induced voltage decreased as the cell’s current density increased, which was due to the increase in overvoltage activation. The concentration of overvoltage significantly increased around the current density limit, which was a high current density level, thereby rapidly decreasing the induced voltage. The resistance overvoltage was nearly negligible due to the use of a material with high electron and ion conductivity and a thin electrode and electrolyte.
3.4. System Efficiency and Air Volume
The hydrogen and carbon monoxide in the anode should have the same cell voltage induced by each of the reactions. Thus, each of the reaction amounts can be calculated. The current amount, according to the reaction amount, is multiplied by the AC and DC conversion efficiency, as well as the voltage, to produce the electrical output (We,sofc) created by the fuel cell stack.
The electrical efficiency (ηe,sofc) is that of the fuel cell system (SOFC system), as shown in Equation (22):
Waux,sofc is the total required power for the operation of auxiliary devices in the SOFC system. The amount of air used for the electrochemical reaction and cell cooling was calculated using the following energy balance equation at the stack:
where ΔHa and ΔHc are the differences in enthalpy between the inlet and outlet at the anion and cathode, respectively. and HCCO are the total low calorific values of hydrogen and carbon monoxide fuel.
4. Results and Discussion
The conditions used in the system performance analysis are presented in Table 2. The system modeling method used in the simulation calculation was the same as that described in Section 3. In Section 4, the system’s characteristics were analyzed by investigating the effects on the system performance of the S/C, the cell’s operating temperature, and the current density in the reformer. We validated the simulation results in comparison to POSCO (Pohang Steel Company) Energy Corporation’s manufactured SOFC [21].
4.1. Effects of Steam/Carbon Ratio on SOFC Operation
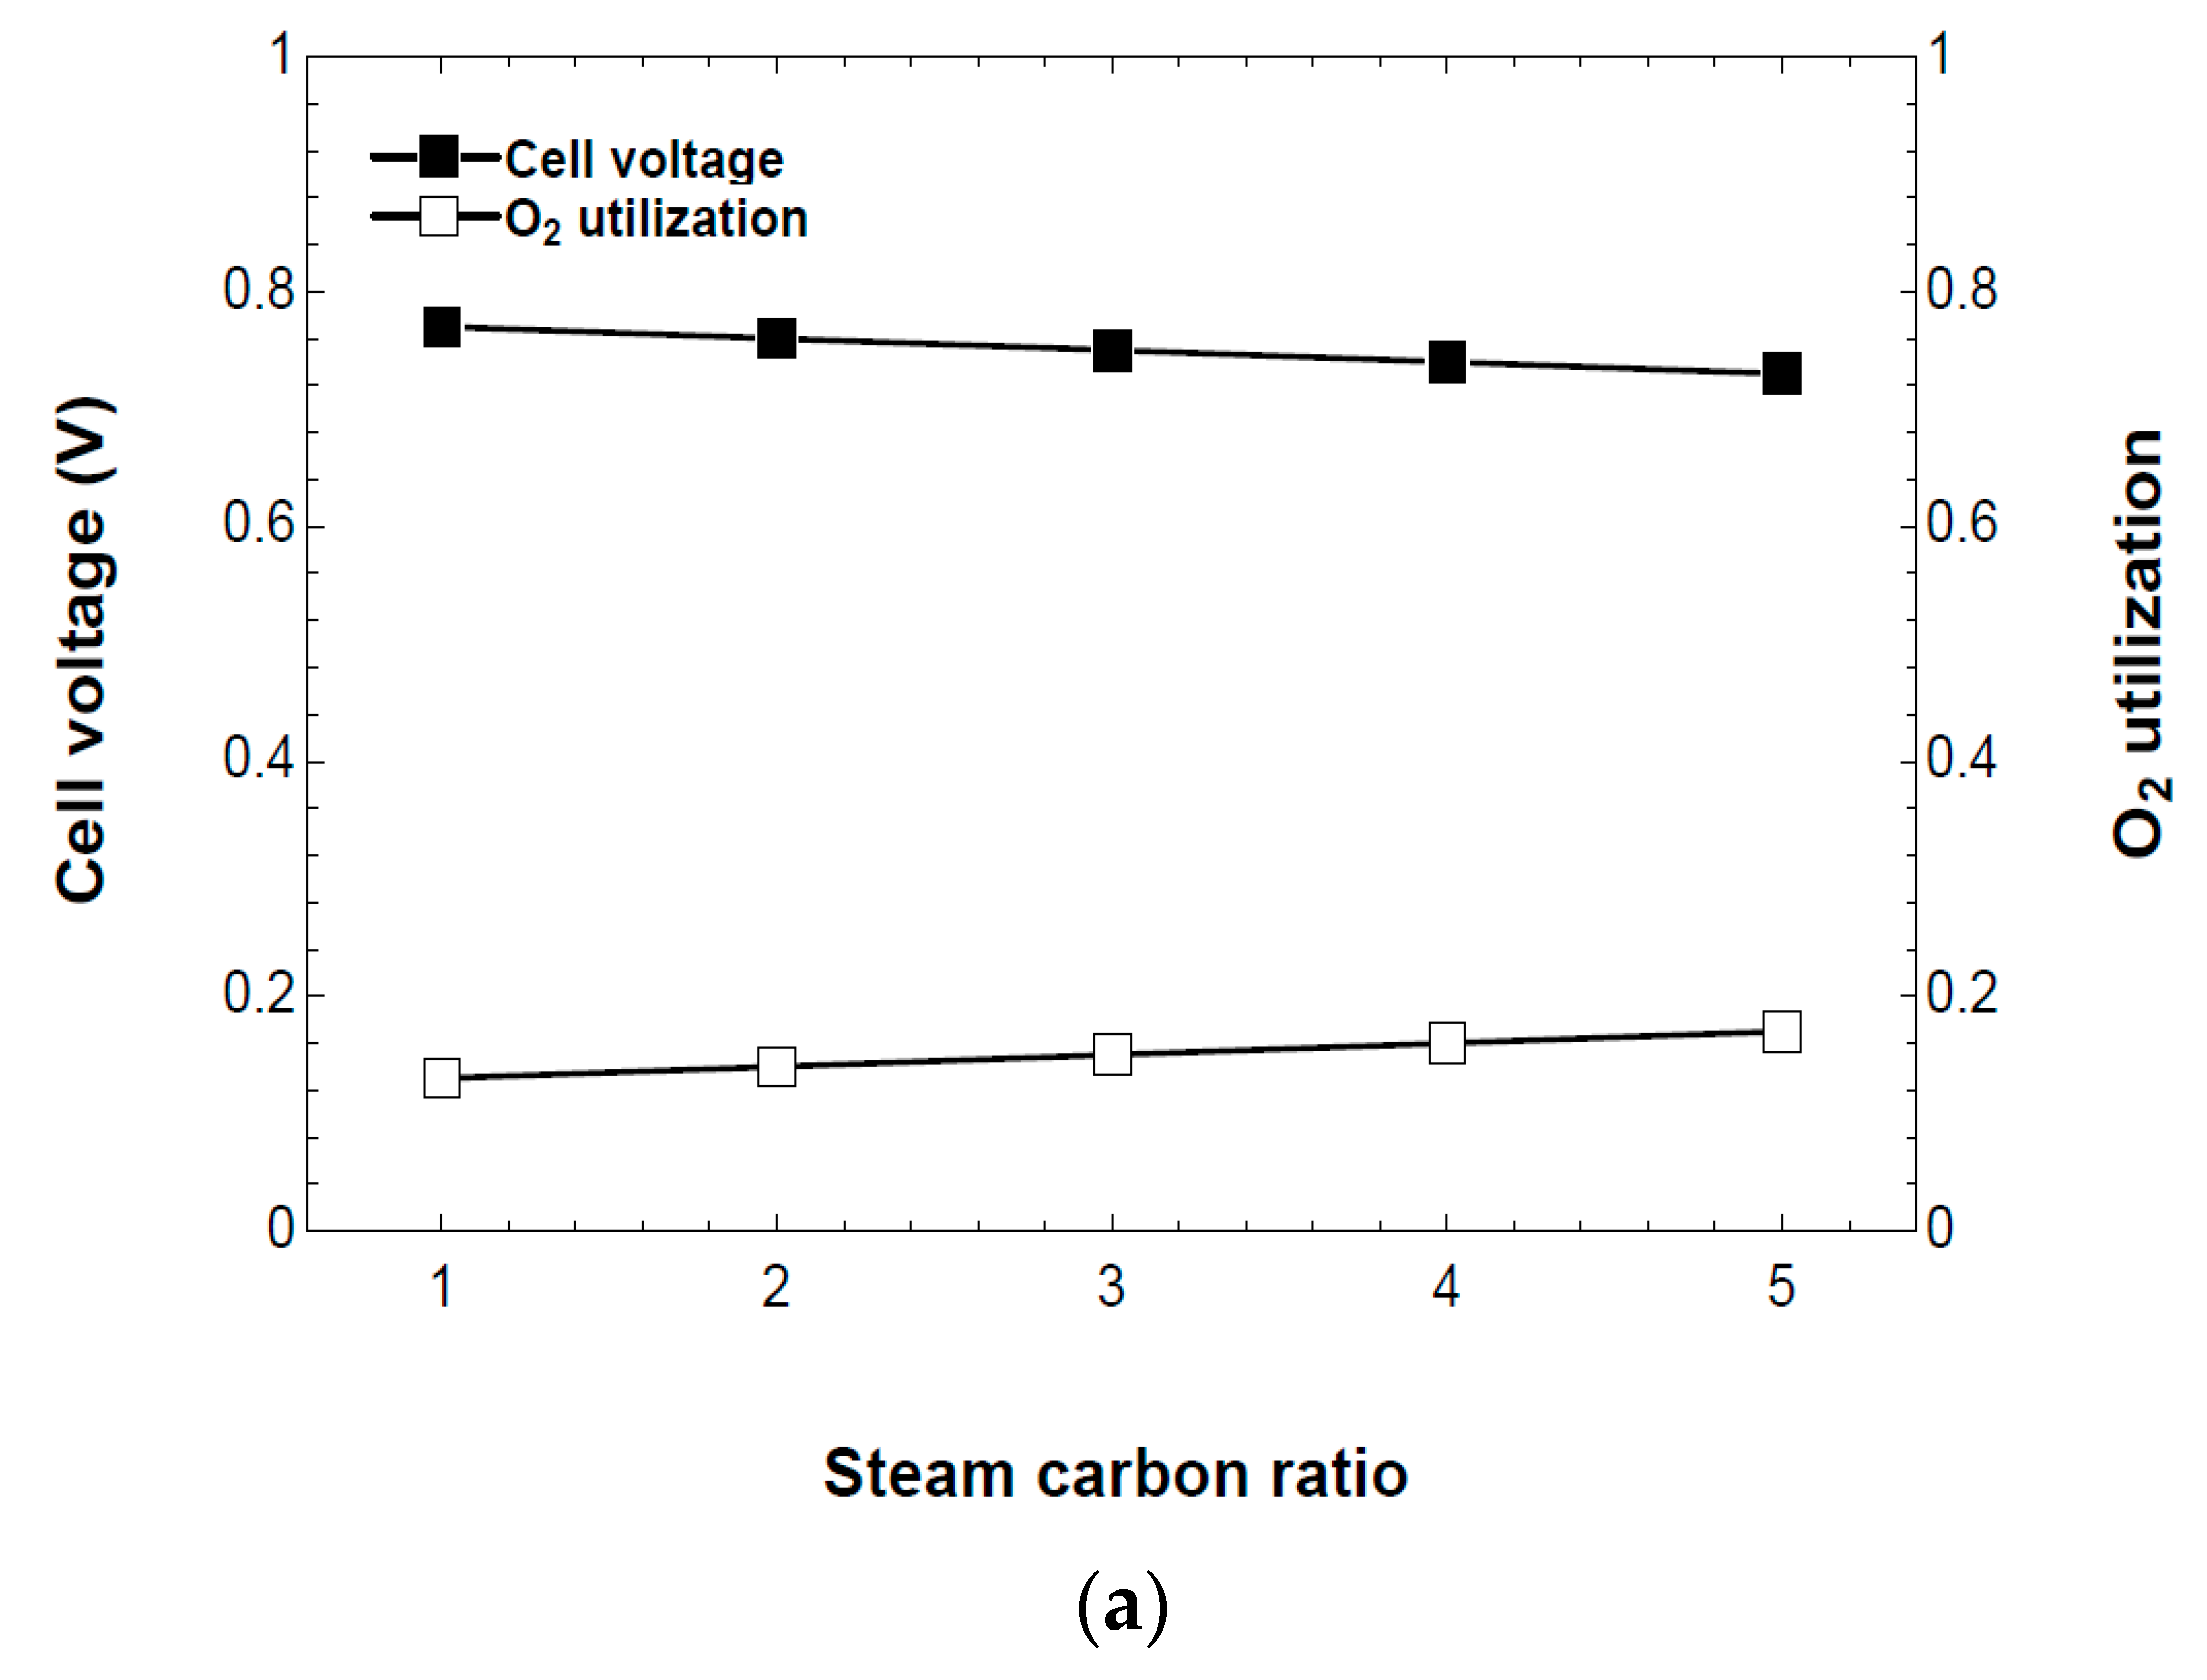
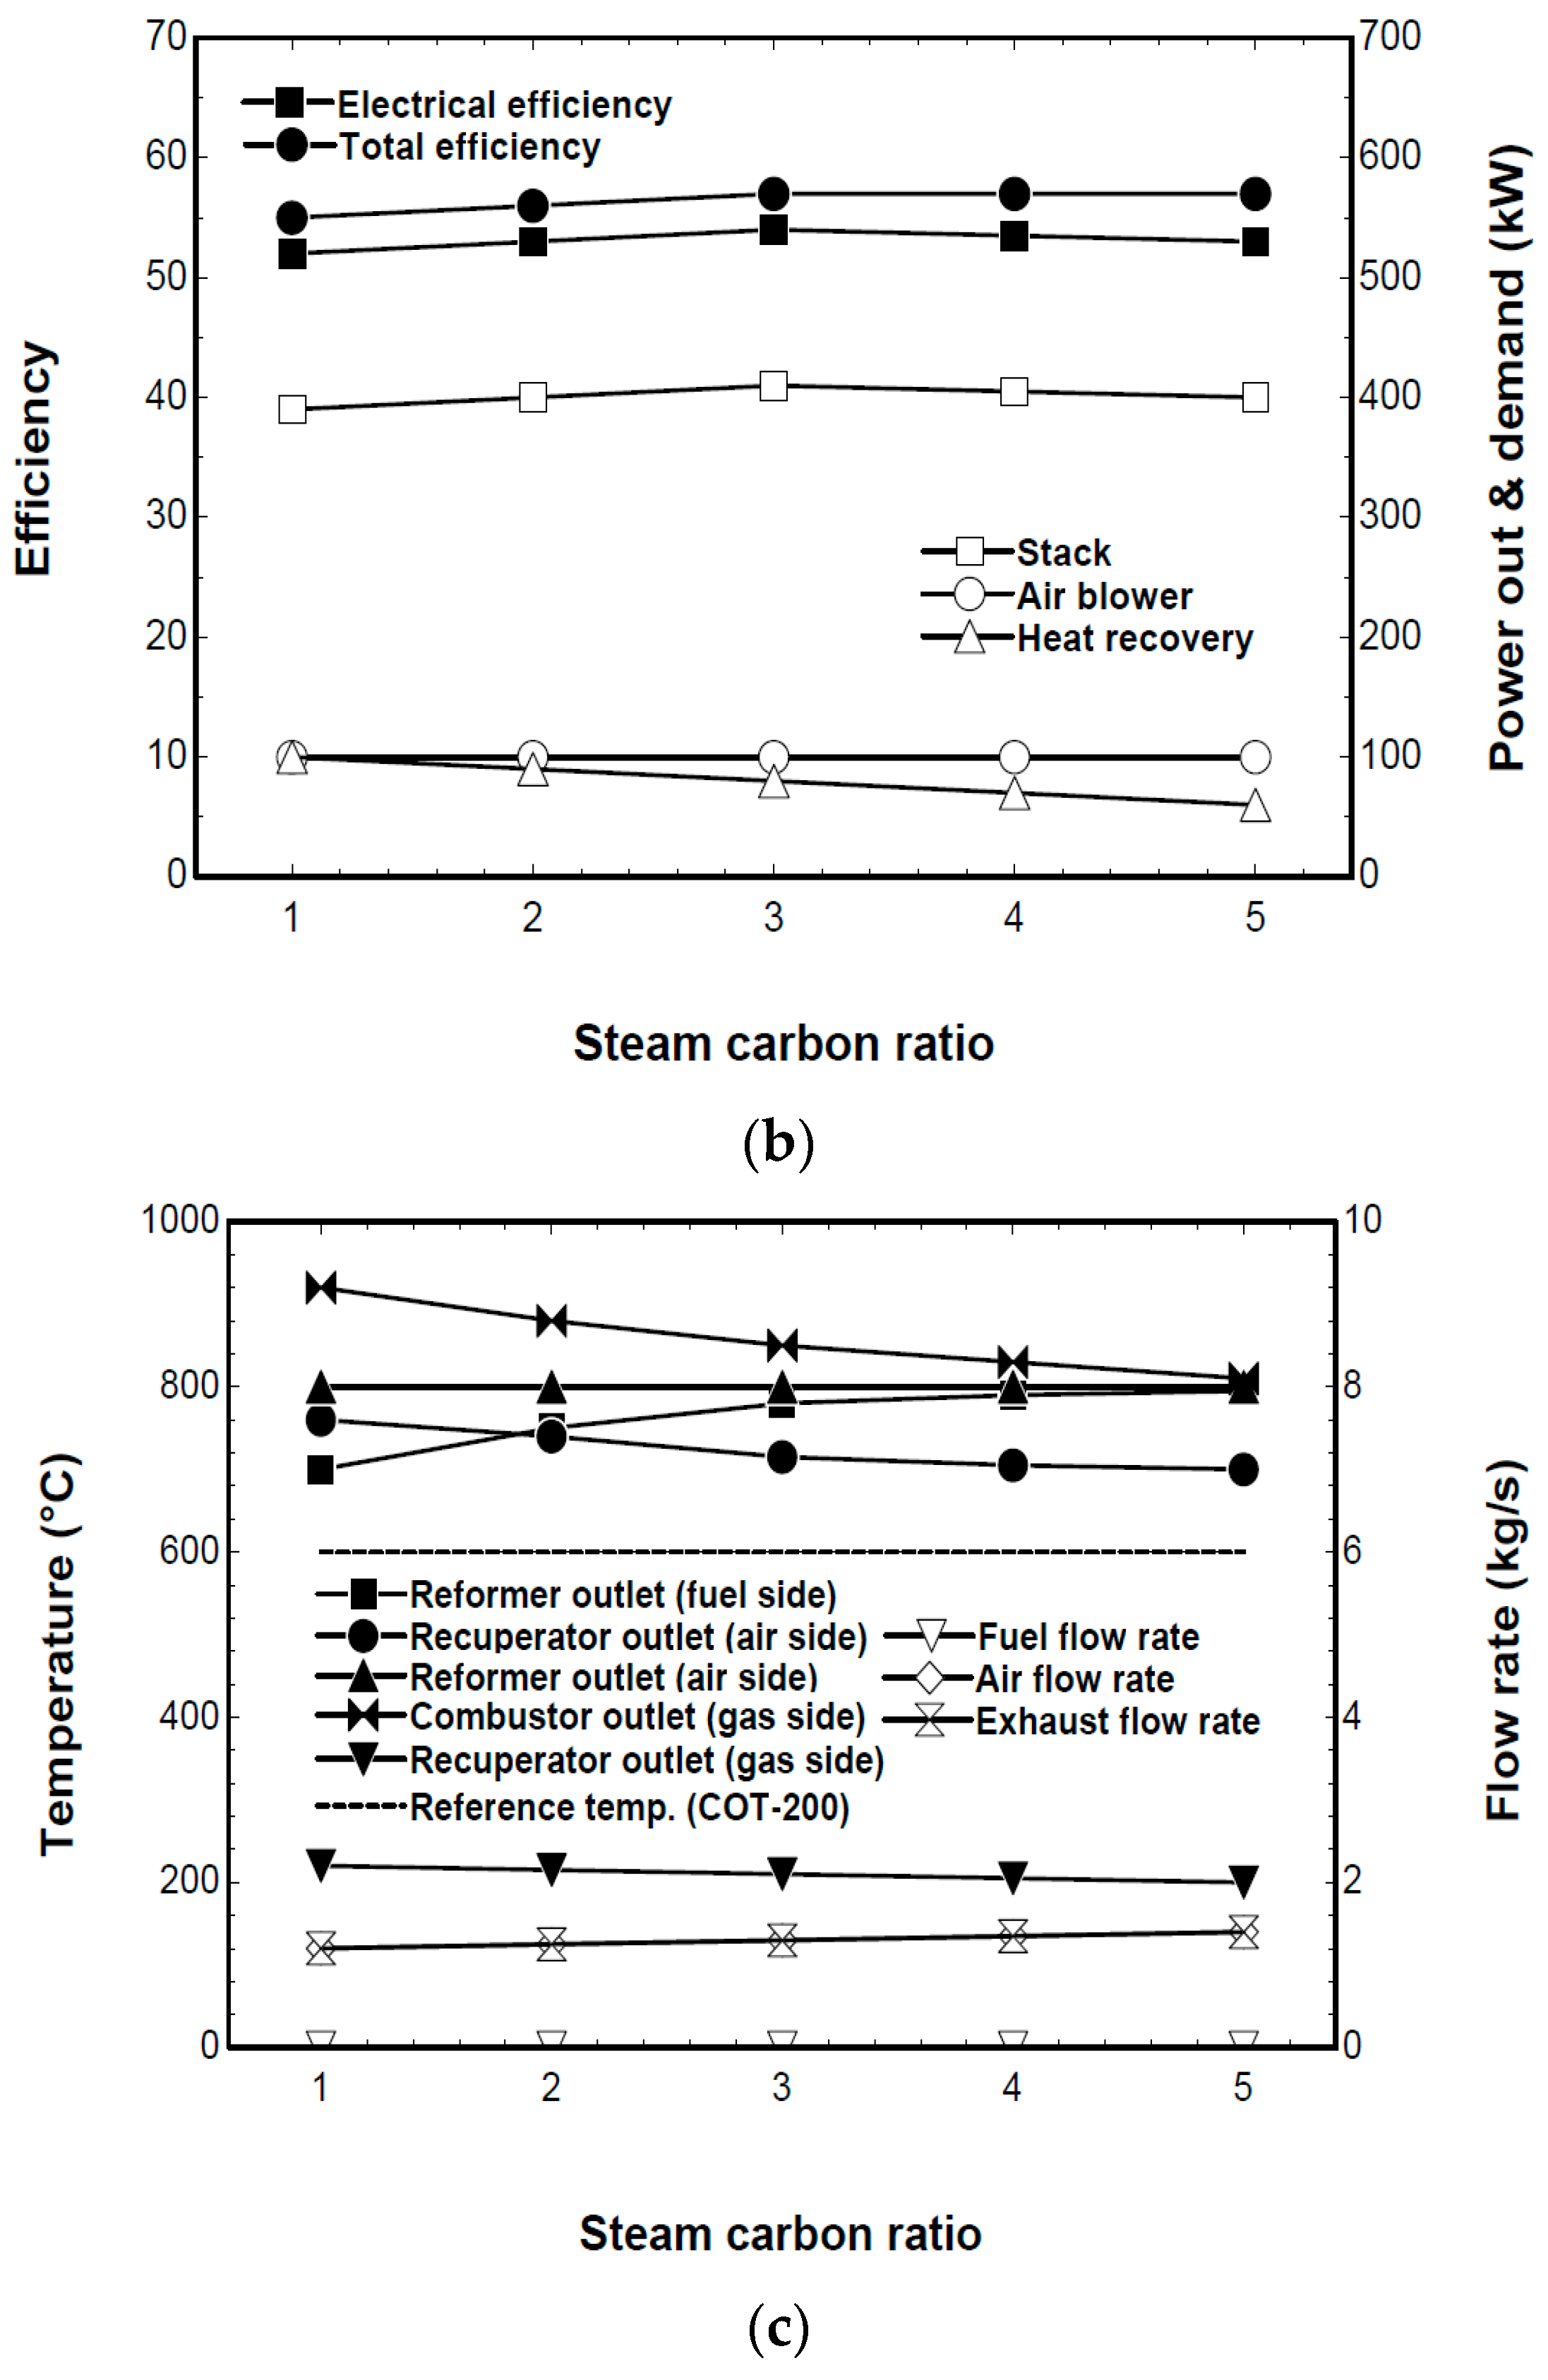
Figure 6 shows the effects of the S/C ratio, with regard to the performance characteristics of a system with a stack operating temperature of 950 °C, current density of 3000 A/m2, preheater temperature efficiency of 85%, and hydrogen fuel utilization rate of 80%. Figure 6a shows that the cell’s induced voltage decreased slightly and its oxygen utilization rate increased slightly as S/C increased. The increase in S/C meant there was an increase in the recirculation rate of the outlet gas in the stack anode. Thus, the ratio of steam and carbon dioxide increased in the gas composition in the cell anode. As a result, the Nernst loss of the cell’s electrochemical reaction increased, thereby decreasing the induced voltage.
As shown in Figure 6a,b, there was a slight increase in the oxygen utilization rate, despite a reduction in the induced voltage. The reason for this was the off-set action caused by the following chain of effects: increase in S/C → increase in recirculation rate → reduction in fuel supply in the combustor → reduction in outlet temperature in the combustor (inlet temperature in the preheater) → reduction in stack-supplied air temperature → increase in cooling effect → reduction in air volume in the cathode. However, the effect of S/C on induced voltage and efficiency was minimal. Figure 6c shows that the stack’s fuel supply temperature range was below the minimum temperature limit when S/C was 2.2. This condition needs to be restricted for safe operation of the stack.
4.2. Effect of Cell Operating Temperature to SOFC Operation
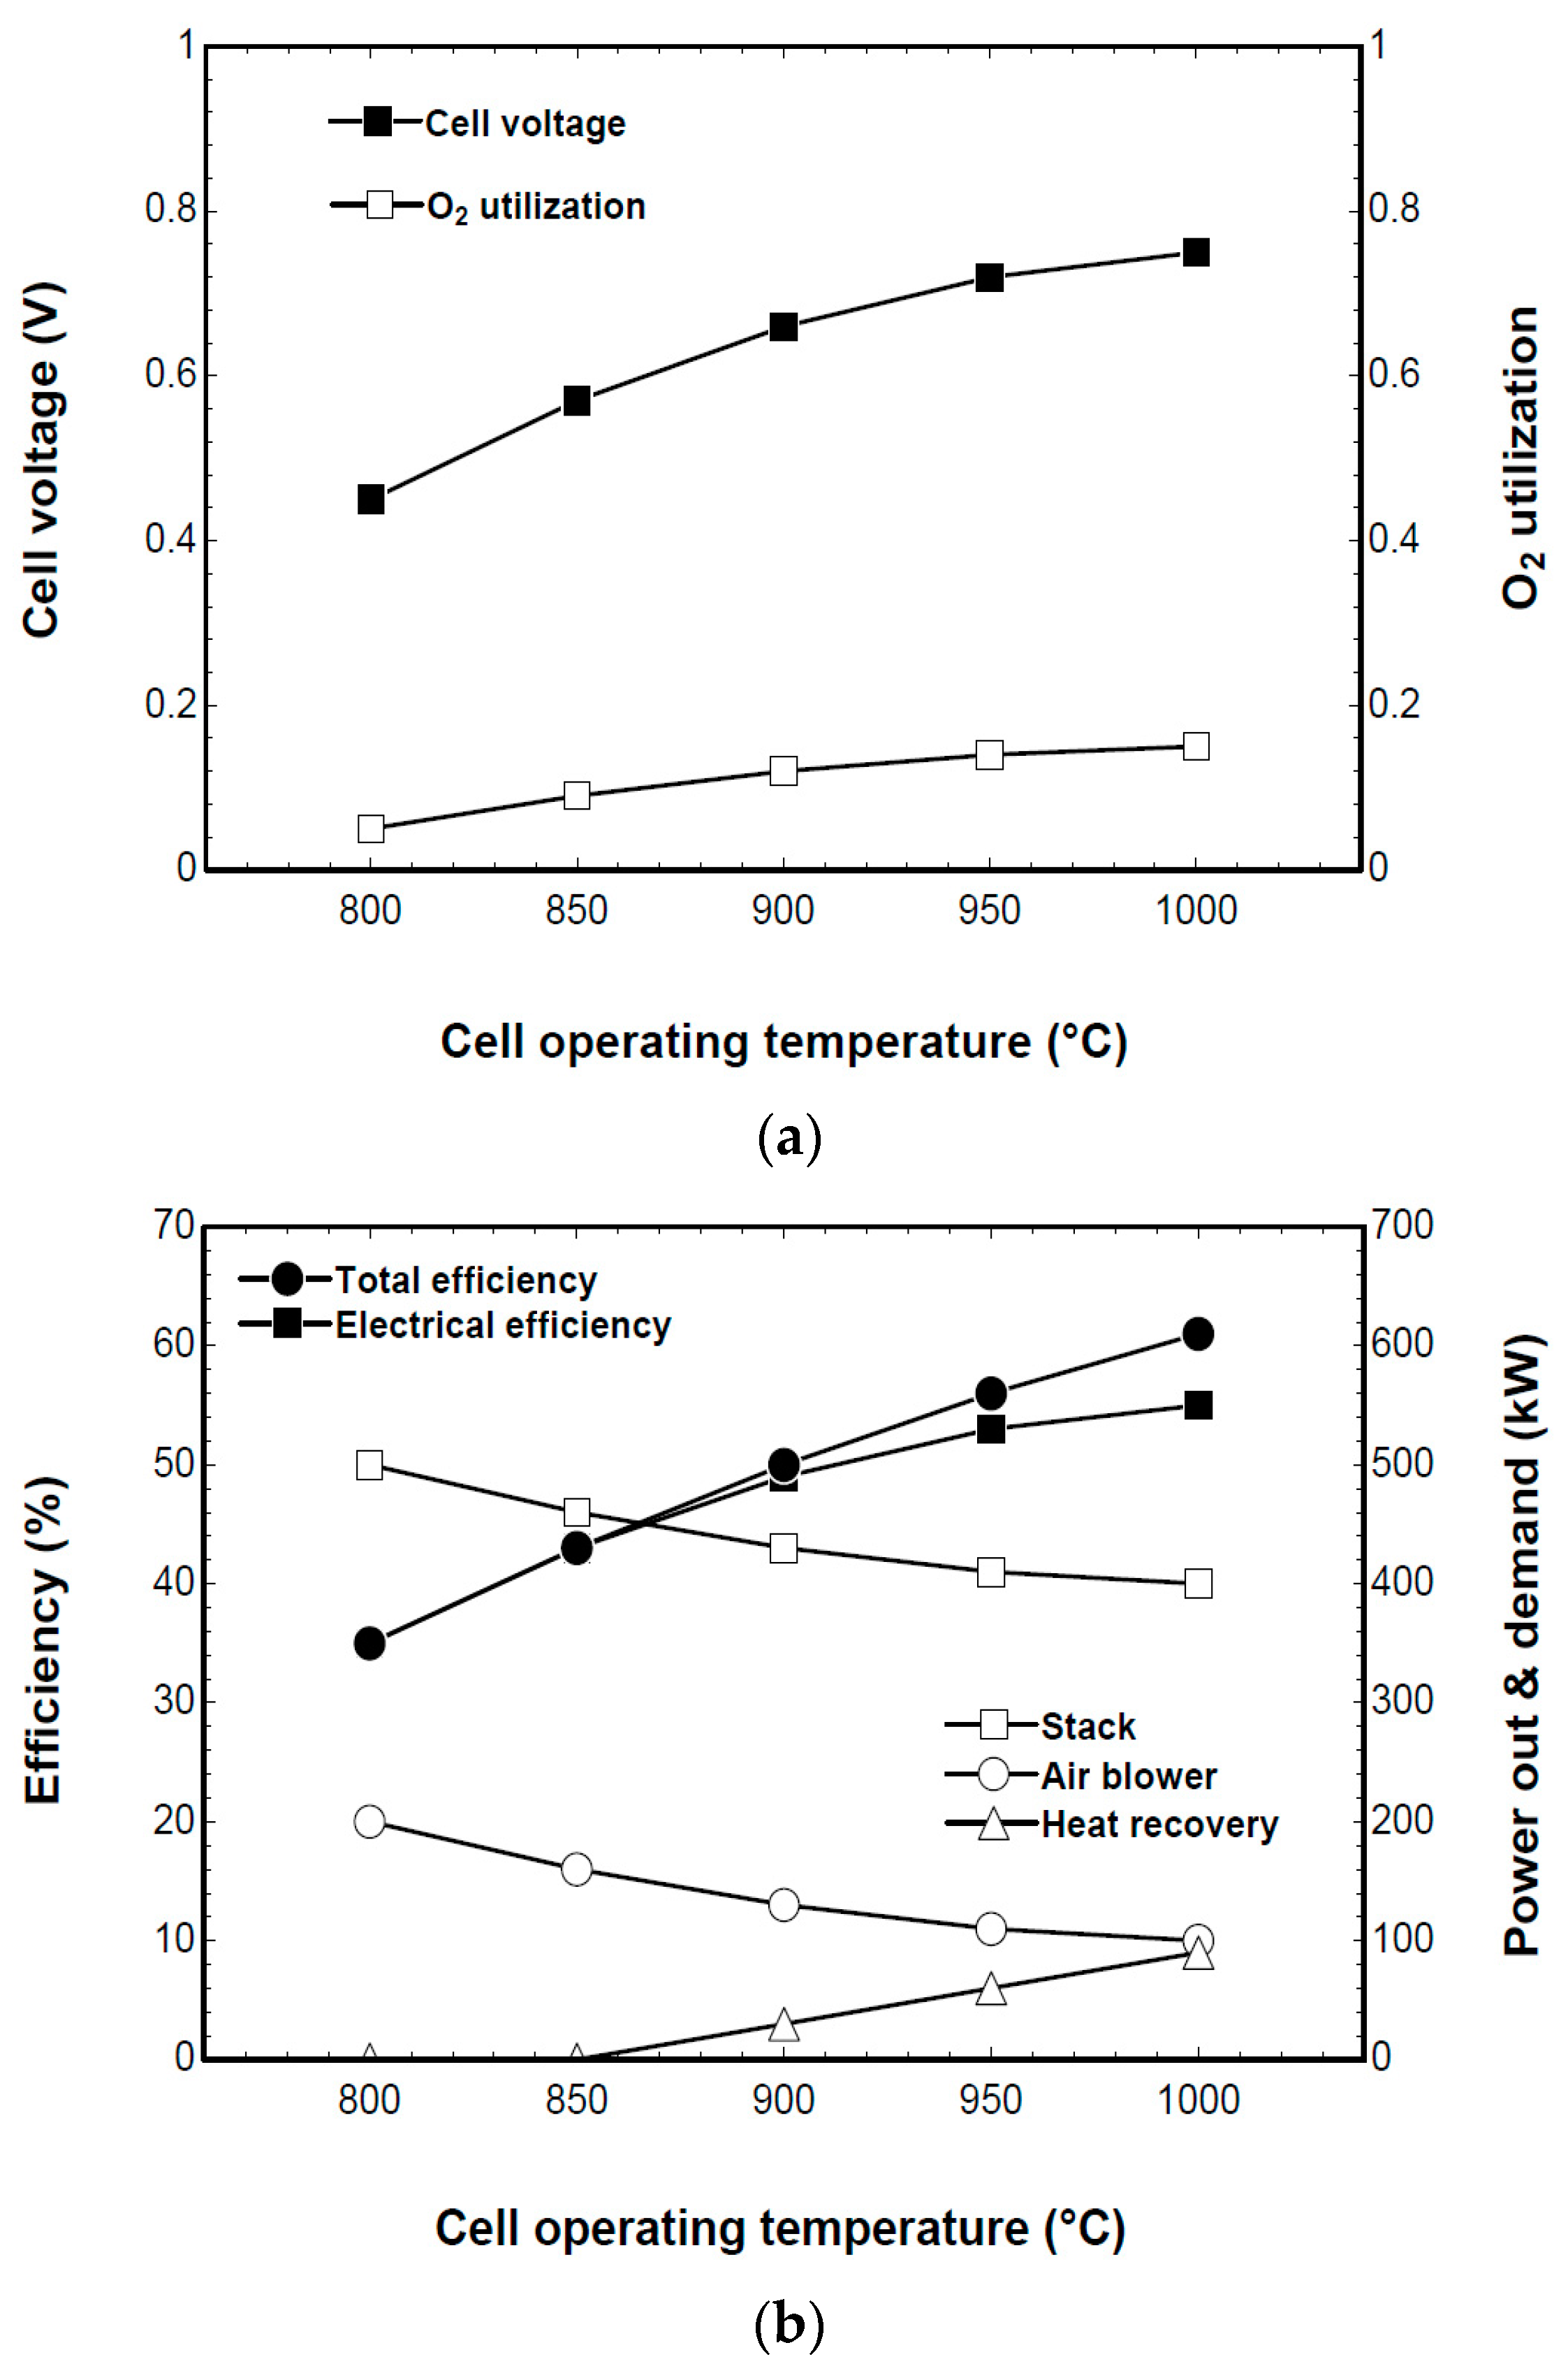
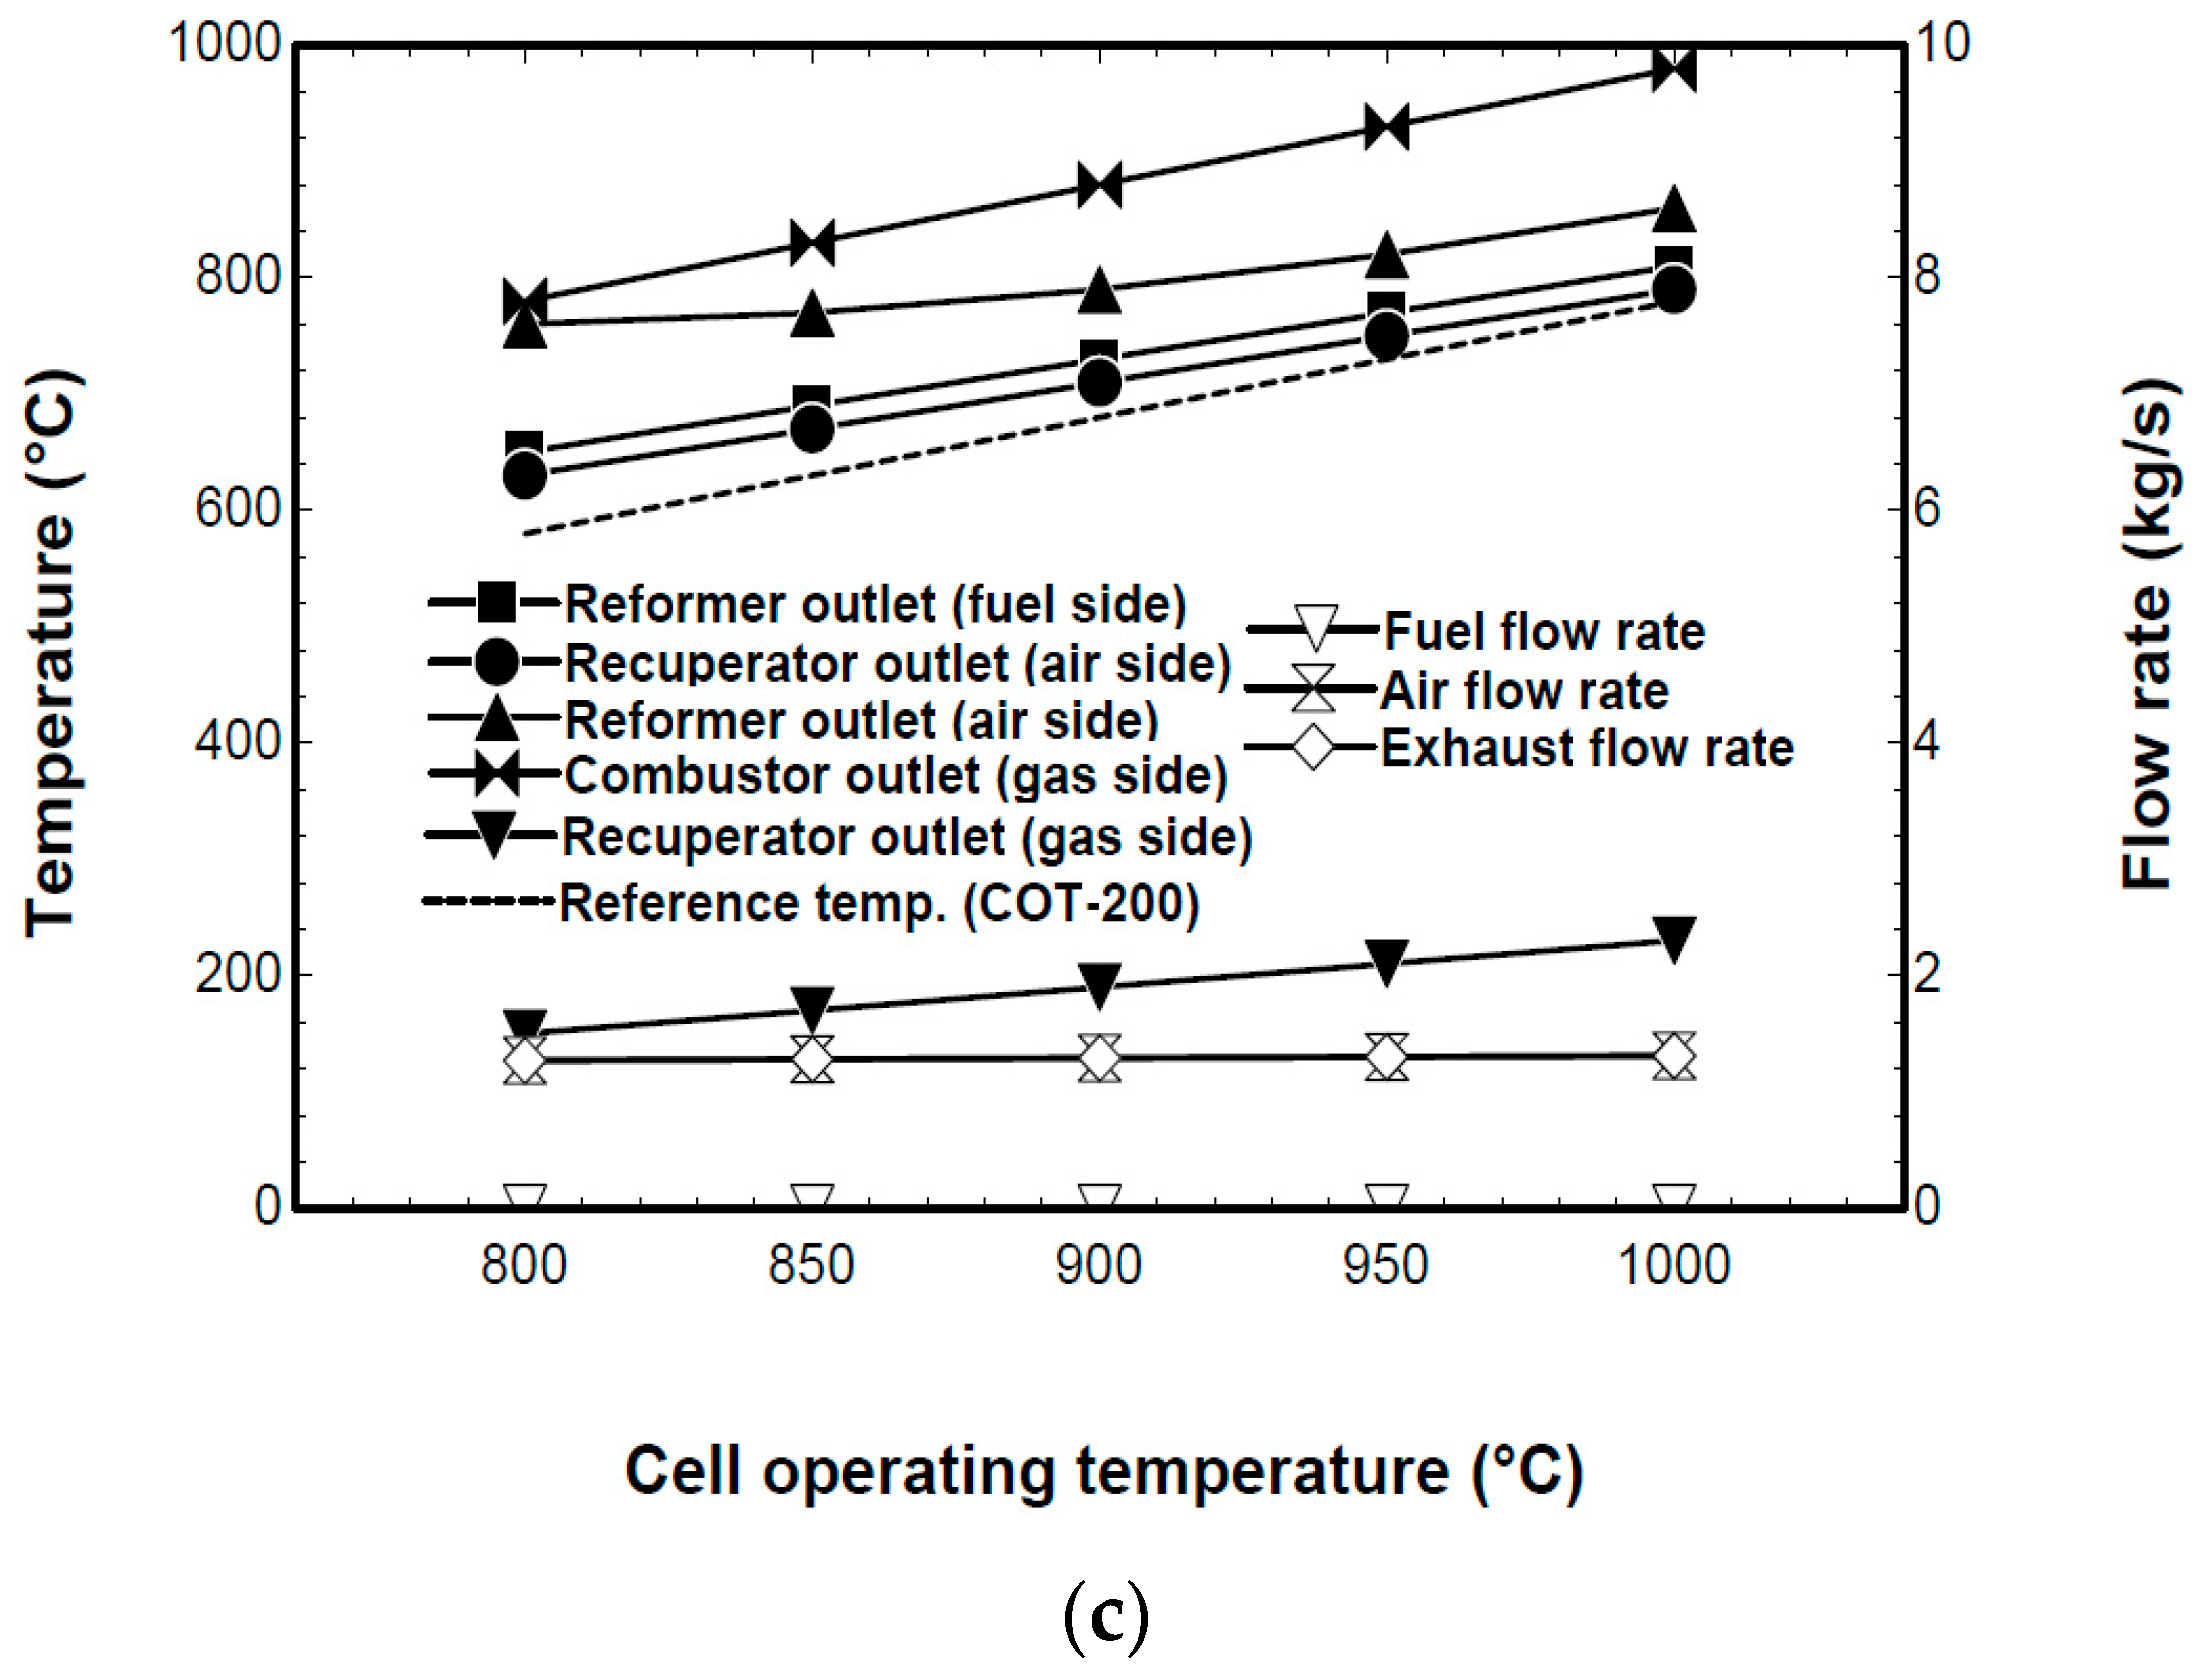
Figure 7 shows the effects of the stack’s operating temperature, with regard to the performance characteristics of a system with a current density of 3000 A/m2, S/C of 3, preheater temperature efficiency of 85%, and hydrogen fuel utilization rate of 80%. Figure 7a shows the cell’s induced voltage and oxygen utilization rate of supplied air. The oxygen utilization rate of supplied air is the ratio of the amount of oxygen used in the electrochemical reactions in the stack to the total amount of oxygen in the supplied air. Figure 7b shows the system’s efficiency and output, which is defined based on the low calorific value of methane. Figure 7c shows the change in temperature. Total efficiency was defined by including the heat energy recovered from the economizer and the power in the feed water pump in the output and required power.
Figure 7a shows that the cell’s induced voltage and oxygen utilization rate increased as the stack operating temperature increased. The induced voltage increased because the reduced activation overvoltage had a large effect, despite the decrease in reversible open circuit voltage as the operating temperature increased. The oxygen utilization rate increased due to the reduced amount of air required in the stack for two reasons. Firstly, there was a reduction in energy generated in the cell as a result of the lower active overvoltage (i.e., an irreversible decrease in the resistance of the electrochemical reaction). Secondly, there was an increase in cooling action as a result of the large difference between the supplied air temperature and the operating temperature of the stack. This was verified by the changes in the air outlet temperature in the preheater and reduction in power required by the blower according to the air volume, as shown in Figure 7b,c.
Figure 7b shows that the electrical efficiency of the system significantly increased with operating temperature. This was due to the reduction in power required by the blower and the increase in the cell’s induced voltage. Total efficiency also showed the same trend. Thermal energy for steam generation at temperatures below 900 °C could not be recovered. As shown in Figure 7b, electrical efficiency was 54% and total efficiency was 58% when the cell’s operating temperature was 950 °C.
Figure 7c shows that the temperature in each unit of the system increased with operating temperature. No safety problems occurred in the calculation range. The inlet temperature of the stack fuel and air was also below the maximum temperature of the stack-supplied fluid.
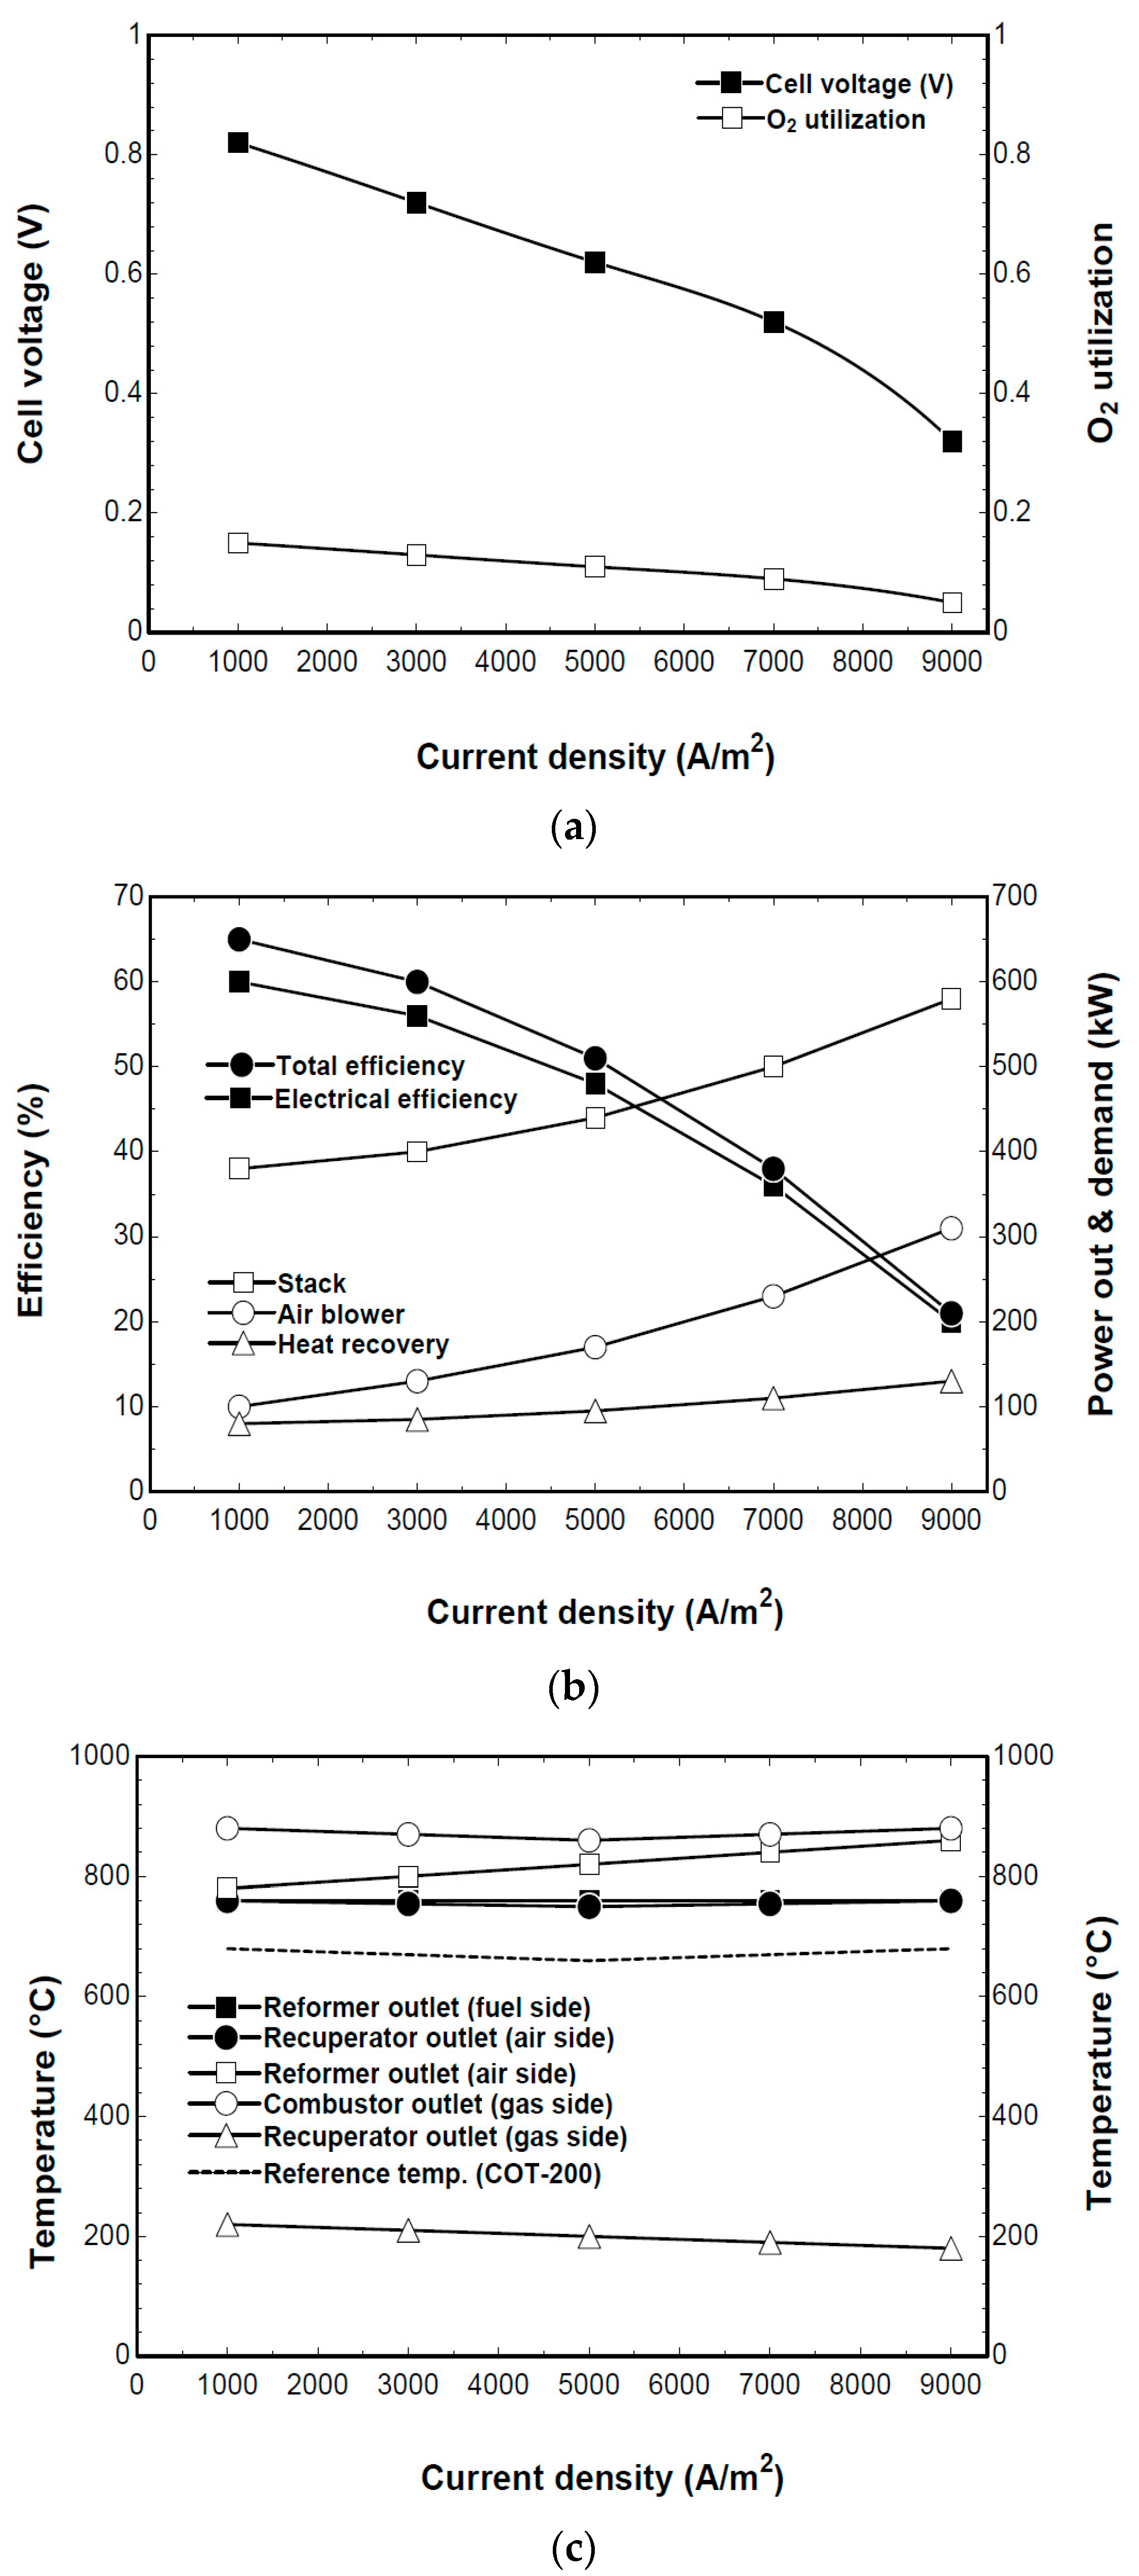
4.3. Effect of Current Density to SOFC Operation
Figure 8 shows the effects of the cell current density, with respect to the performance characteristics of the system. The stack’s operating temperature was 950 °C, S/C was 3, the preheater temperature efficiency was 85%, and the hydrogen fuel utilization rate was 80%. Figure 8a shows the cell’s induced voltage. The oxygen utilization rate decreased as the stack’s current density increased. An increase in current density means there is an increase in the level of reaction per unit area. Thus, there was no significant change in the reversible open circuit voltage, but the overvoltage increased, which caused a decrease in the induced voltage.
The reduction in the cell’s oxygen utilization rate and the reduction in induced voltage were due to an increase in overvoltage. This resulted in a higher calorific value, which required an increase in air volume for cell cooling. Figure 8b verifies that there was an increase in the power required by the blower as the air volume increased. The electrical efficiency and total efficiency also decreased due to the reduction in induced voltage and increase in power required by the blower as the current density increased. The recovery of heat energy at the economizer was also possible in all calculation ranges.
Figure 8c shows that the temperature in each unit of the system did not exceed the minimum temperature limit of the stack-supplied fluid or the heat durability of the materials. This concludes the validation of the simulation results of the SOFC model. The simulation results are summarized in Table 3.
4.4. Thermodynamic Performance Analysis
For the simulation of the SOFC operation, the system was first operated up to its maximum capacity with the available amount of biogas. Next, the amount of heat in the exhaust gas was calculated to confirm whether or not the anaerobic digester was sufficiently heated. If the amount of heat in exhaust gas was not able to heat the anaerobic digester, the SOFC load decreased to accommodate the biogas boiler.
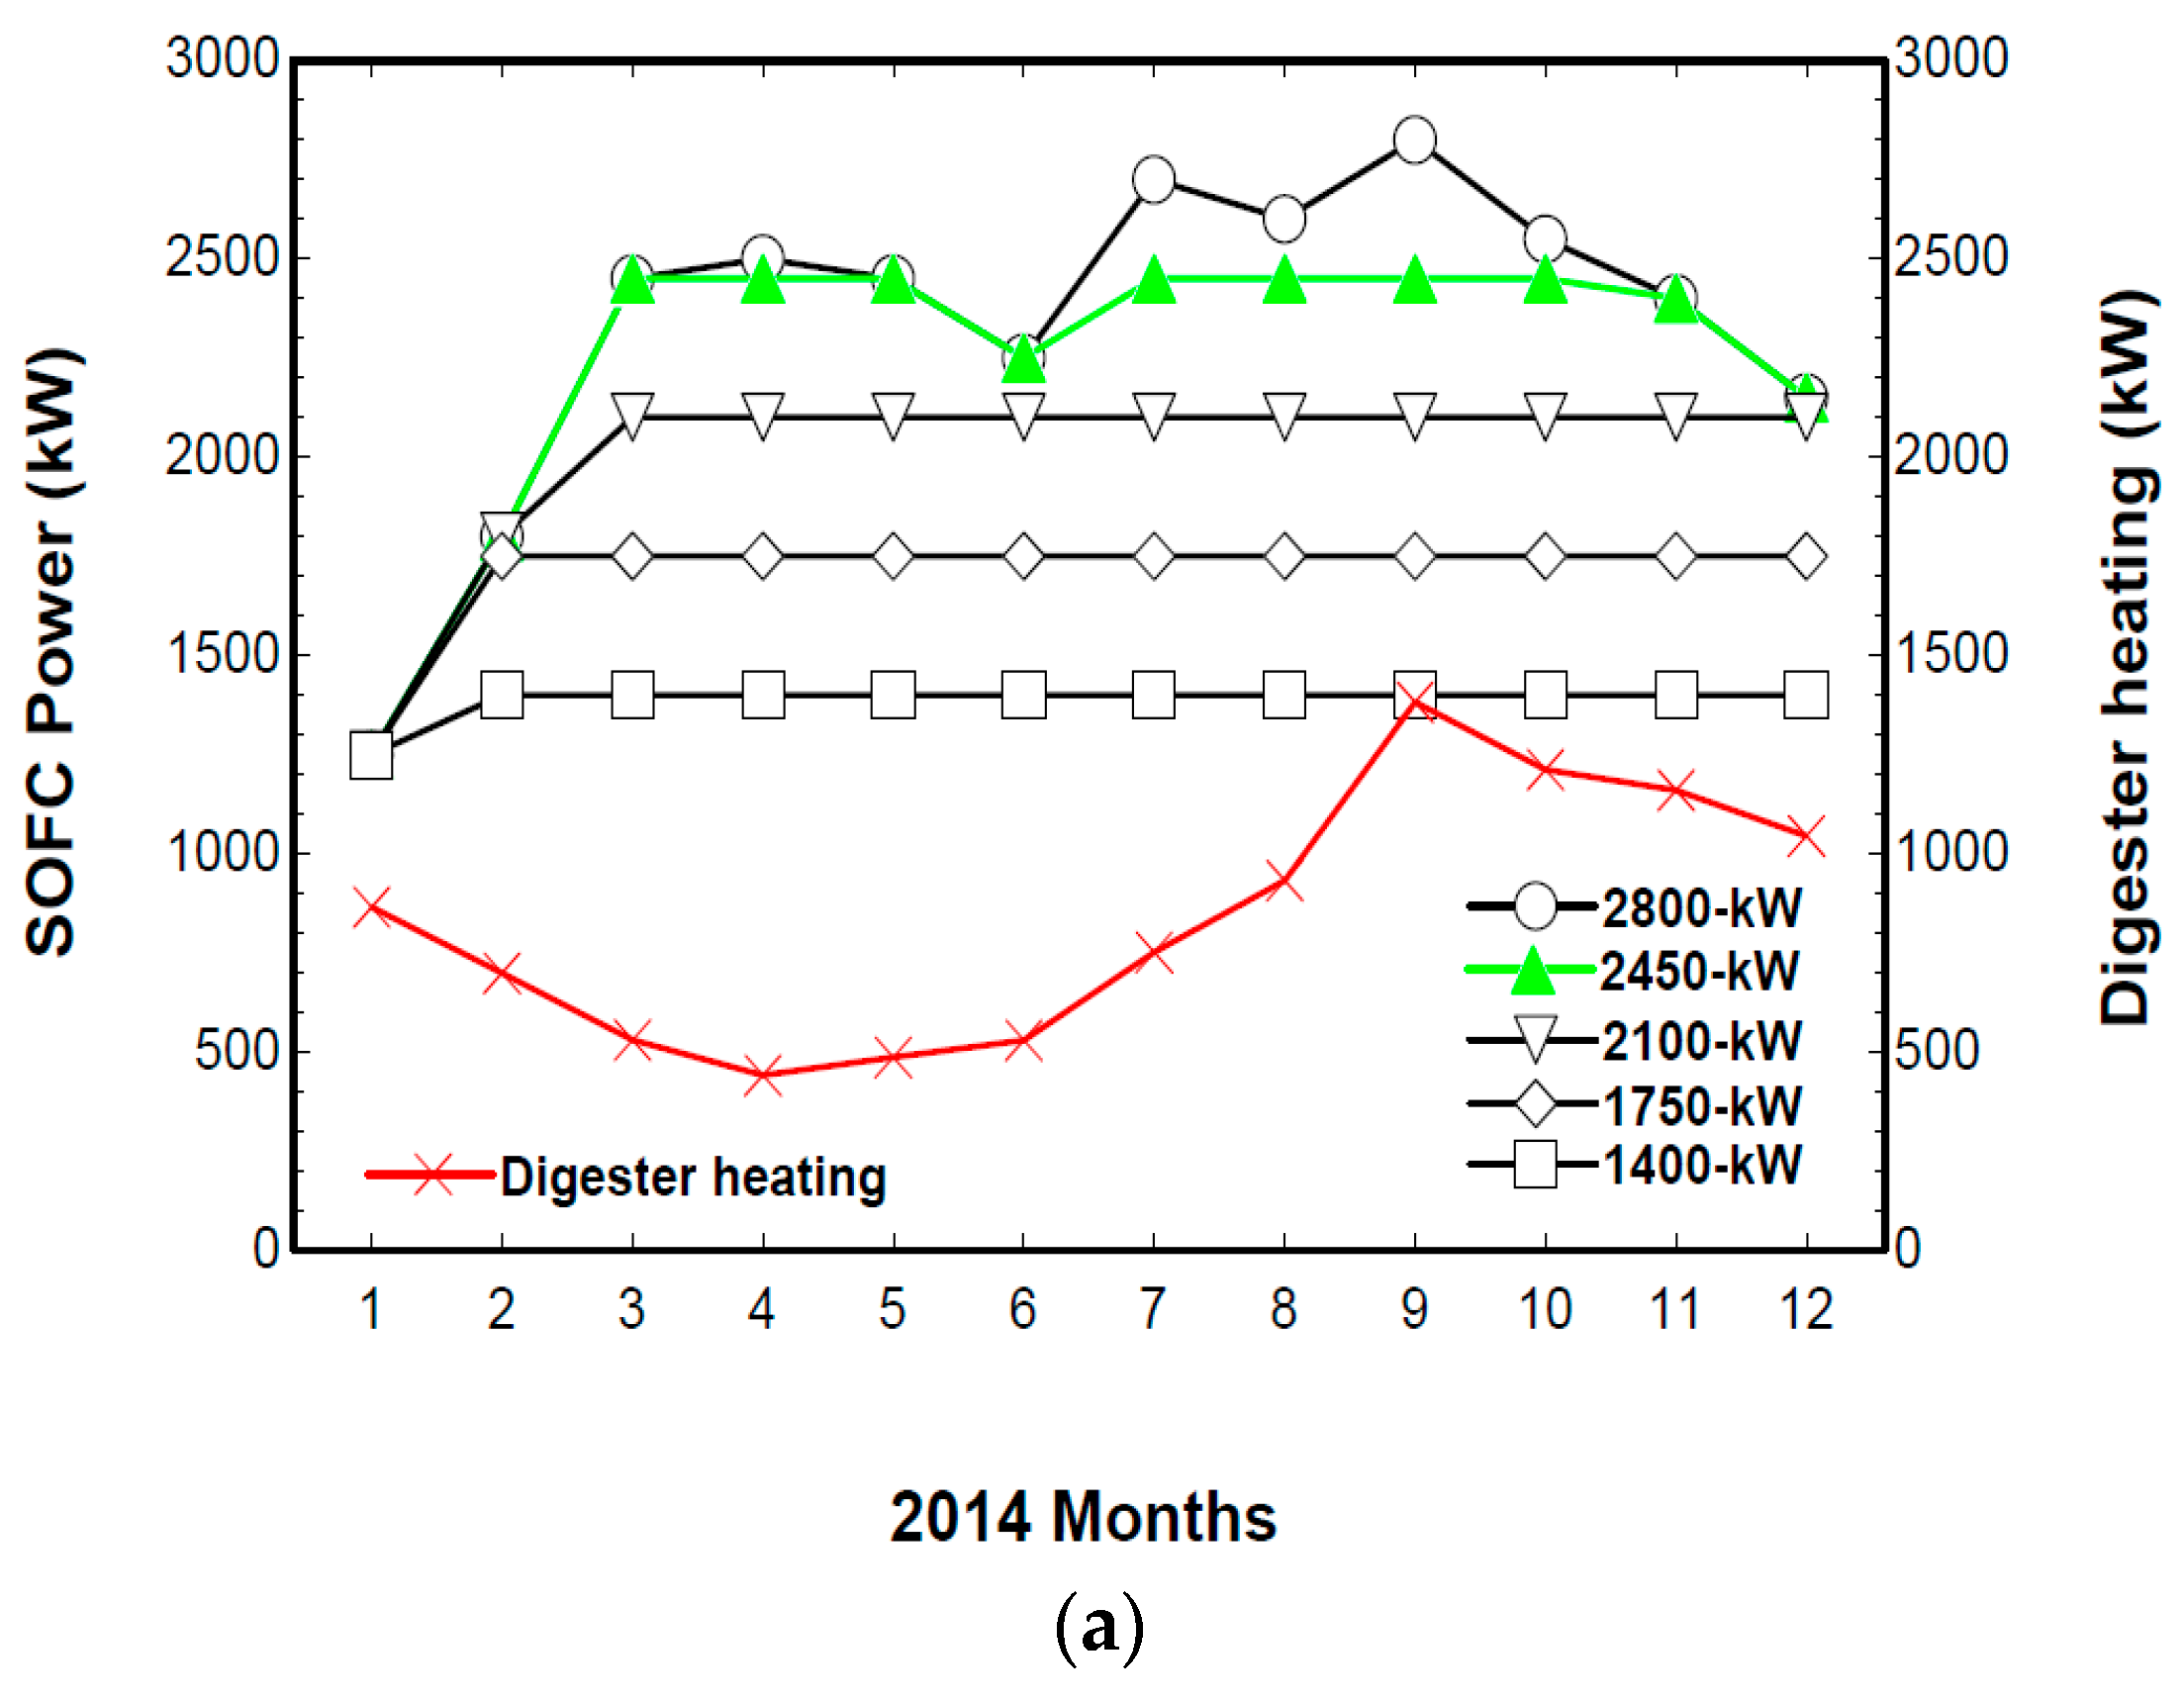
Figure 9 shows the annual operating characteristics of different sizes of SOFCs with parallel operation. In the case of a 2450 kW SOFC, all available biogas burned. But in the case of less than a 2450 kW SOFC, a part of the biogas remained and operating hours increased (Figure 9a). The exhaust temperature indicated a maximum of 247 °C because of partial-load operation and seasonal temperature fluctuations (Figure 9b). The mass flow rate of the exhaust gas varied along with the net power output, as shown in Figure 9c. On all occasions, the heat of the exhaust gas was able to heat the anaerobic digester, but the digester heat level decreased sharply in summer because of the high air temperature.
The SOFC produced a maximum electric output power of 2450 kW. The amount of biogas required to feed the SOFC was constant throughout the year, except for the overhaul period. The greenhouse gas reduction and electricity benefits are shown in Table 4 [22], according to the operation conditions of a 2450 kW SOFC.
4.5. Greenhouse Gases Reduction Analysis
Greenhouse gas emission activities due to production and treatment activities, can be divided into direct and indirect emissions (Table 5) [22] according to their operational boundary. Sources of greenhouse gas emissions were household sewage and food waste treatment facilities, biogas recovery and recycling facilities, and vehicles. Indirect emissions due to power usage were also a source of greenhouse gas emissions. The majority of emissions were from sewage treatment processes, which accounted for 85% or more of the total greenhouse gas emission.
The biological treatment of waste is carried out to reduce waste volume, stabilize waste, destroy waste pathogens, and produce biogases for energy use. CH4 and N2O are produced through these activities. Emission activities mainly occur at public food processing facilities from composting and anaerobic digestion.
Table 6 shows the greenhouse gas emission coefficients of biogas combustion. Biogas combustion refers to greenhouse gas emissions generated from the intentional combustion inside devices designed to be used remotely or to perform processes at specific facilities. The total greenhouse gas emission of biogas combustion can be calculated as follows:
where Ei,j is the total greenhouse gas emission of biogas (i) combustion (tGHG); Qi is the used biogas (103 m3); ECi is the net lower heating value (MJ/m3); EFi,j is the greenhouse gas (j) emission coefficient (kg of greenhouse gas/TJ); and fi is the biogas oxidation coefficient (CH4, N2O does not apply).
Table 7 shows the greenhouse gas emission coefficients for electricity use. The indirect greenhouse gas emissions generated were due to power use in business activities and facilities. Both the level of greenhouse gas emission in the business place and the direct greenhouse gas emissions should be included, due to the use of fuel combustion and raw materials. Purchased power, in most businesses, is one of the largest sources of greenhouse gas emission. The total greenhouse gas emission of supplied electricity can be calculated as follows:
where Q is the supplied electricity (MWh), EFi is the electricity indirect emission coefficient (tGHG/MWh), and j is the type of greenhouse gas.
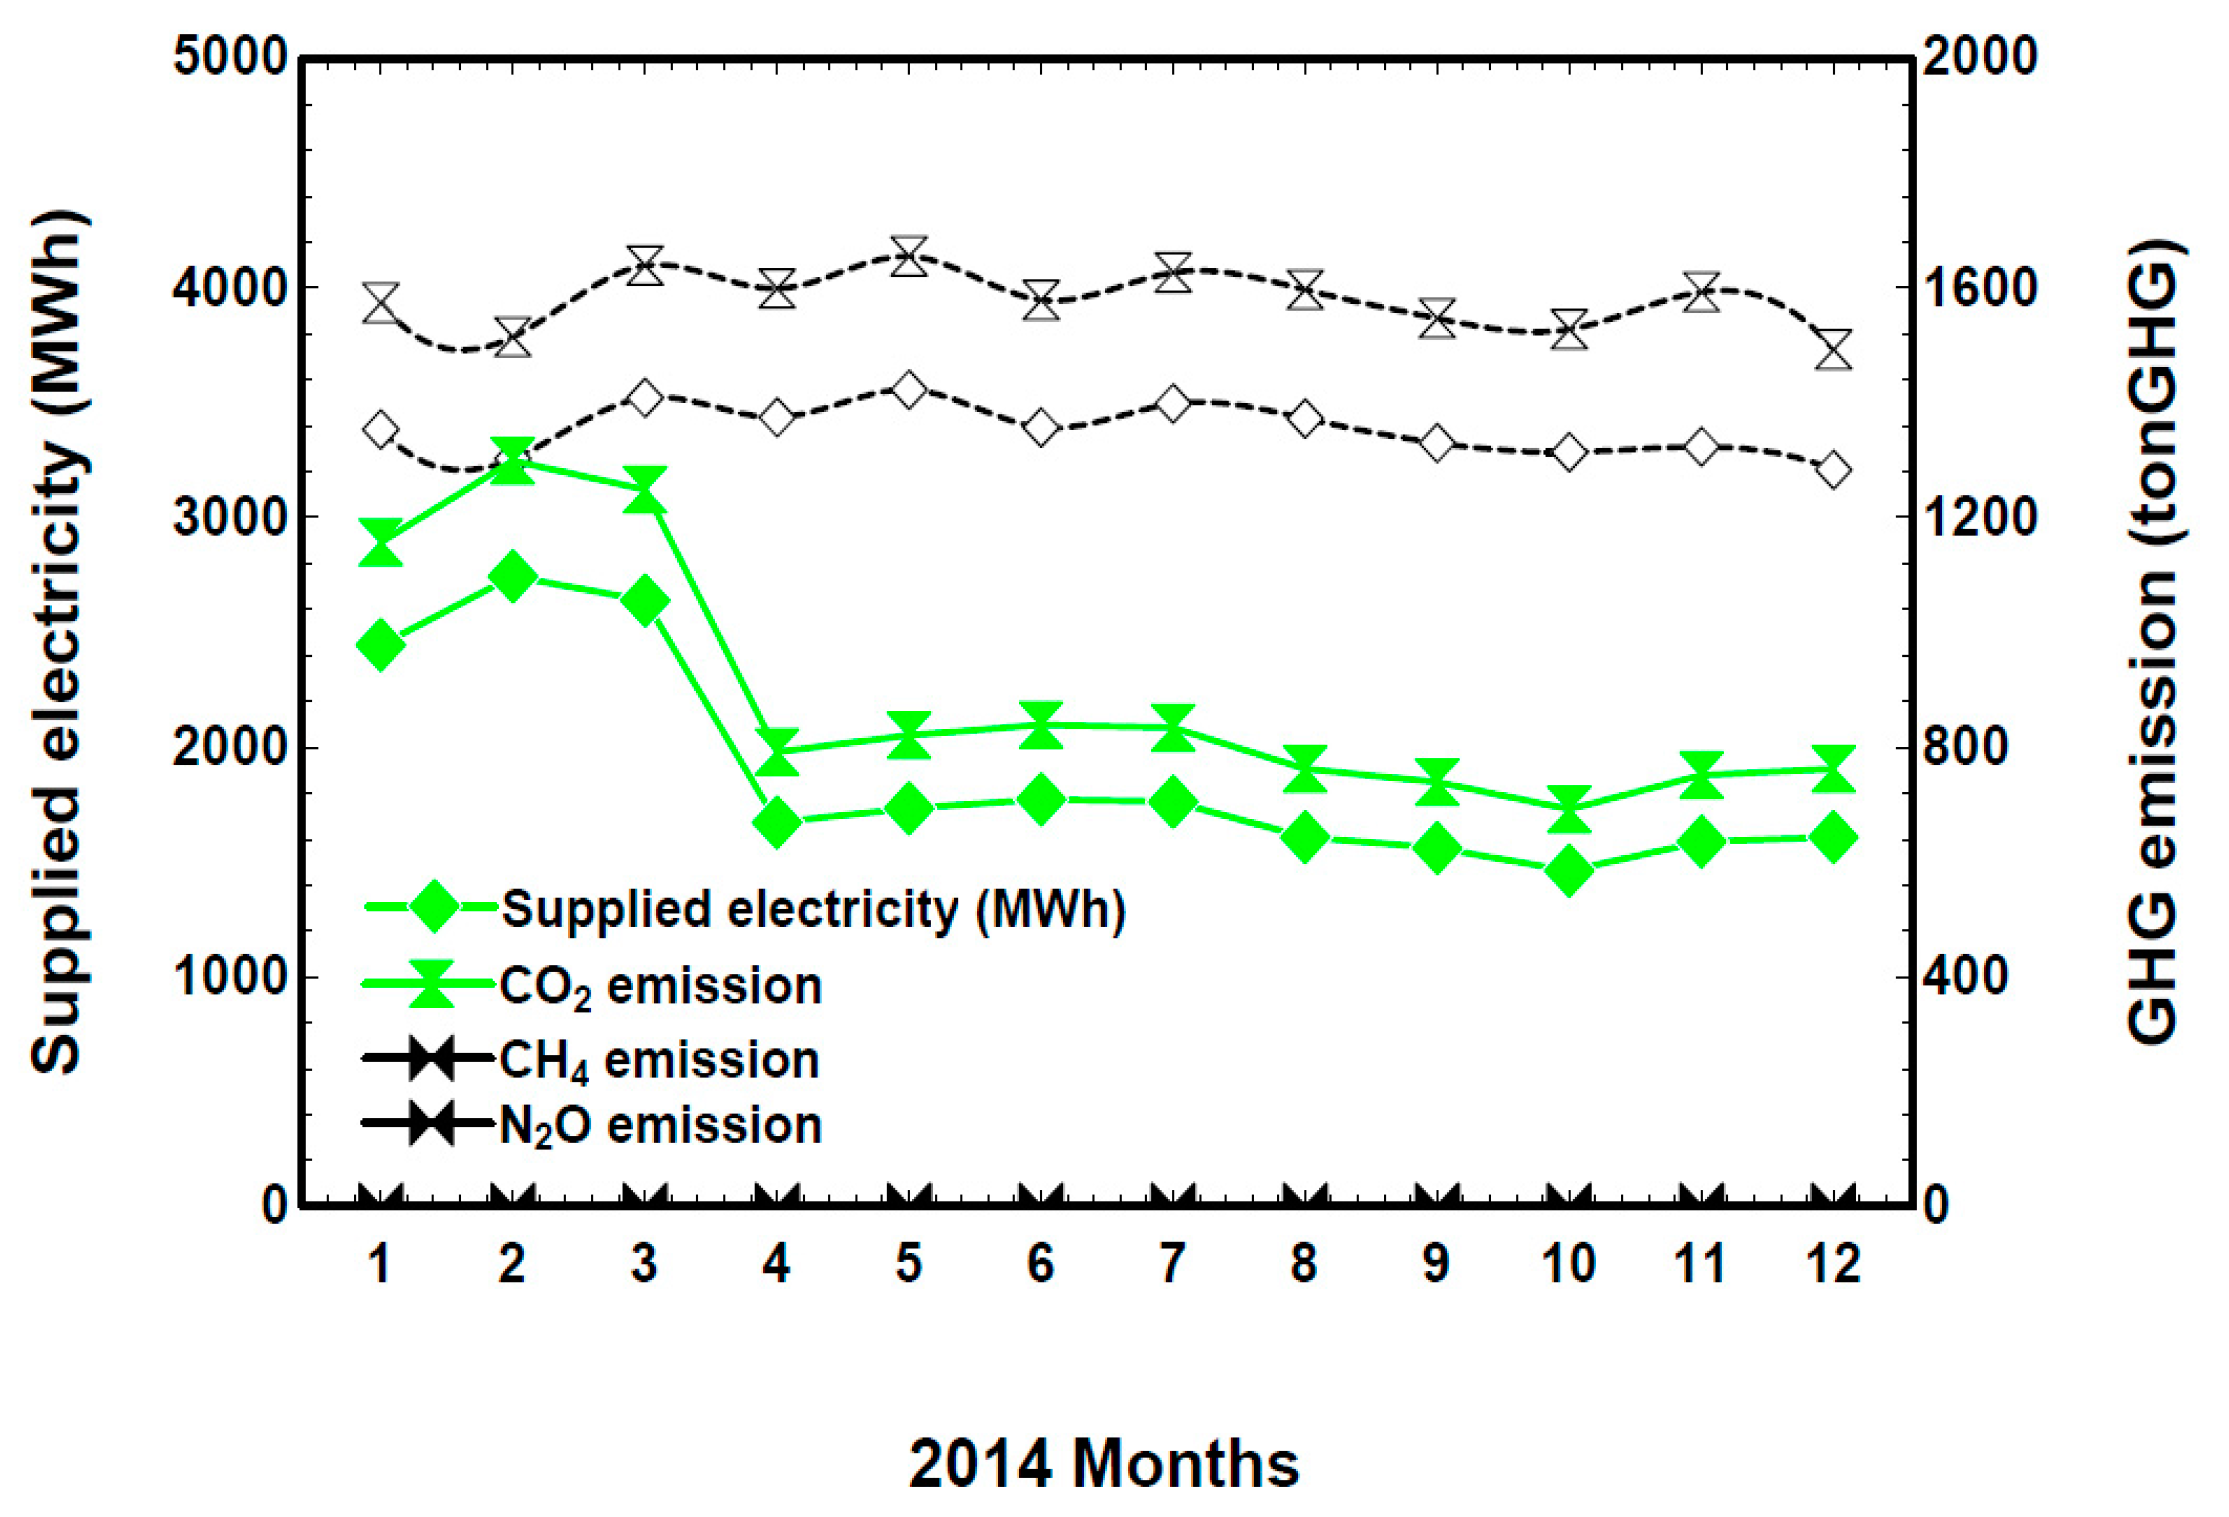
Figure 10 shows the yearly greenhouse gas emissions when considering the supplied electricity and biogas used. Supplied electricity was constant across all the seasons of the year (Figure 10a). Monthly, the plant used about 3500 kWh of electricity and emitted 1600 ton/MWh of greenhouse gas. The biogas used by the boiler decreased in summer, due to the high temperatures (Figure 10b). The plant produced 500,000 Nm3 of biogas per month, through the anaerobic digestion of sewage sludge and food waste. The temperature in the digester increased, and the greenhouse gas emission was calculated for the fuel cell project.
Figure 11 shows the yearly dynamic supplied electricity requirements and greenhouse gas emissions for biogas-fuelled 2450 kW SOFCs. For this system, up to 55% of the total power usage can be produced via biogas with a 45% reduction of CO2, which exceeds the government goal of 37%.
5. Conclusions
The sewage treatment plant in Busan, Korea, has an annual sludge-treatment capacity of 132,601,000 m3. It can produce biogas through the anaerobic digestion of sludge, but the generated biogas is recovered and used as fuel to increase the temperature in the digester, and the rest is burned and dumped at the waste gas incinerator. In this study, the biogas produced was recovered and used to generate power through an SOFC.
The appropriate parameters of a 350 kW SOFC were an S/C of 3, cell operating temperature of 950 °C, current density of 3000 A/m2, preheater temperature efficiency of 85%, and hydrogen fuel utilization rate of 80%, according to the simulation. We also analyzed the performance of different sizes of SOFCs for an anaerobic digester with a 28,000 m3 capacity. The 2450 kW SOFC system was set to its maximum capacity, with the available amount of biogas and the heat of the exhaust gas used to heat the anaerobic digester; however, the amount of digester heat decreased in summer because of the high air temperature. Up to 55% of the total power usage could be produced via biogas, and a 45% reduction in CO2 was achieved. This study showed that the SOFC system could be sufficiently competitive as a distributed power supply device within a few years, due to mass production and technical advancement.
Acknowledgments
This research was supported by the National Research Foundation of Korea (NRF) with a grant funded by the Korean Government (MSIT) through the Global Core Research Center for Ships & Offshore Plants (No. 2011-0030013).
Author Contributions
S.K. designed and simulated the system and wrote the paper. T.S. analyzed the data, and K.C.K. supervised the project.
Conflicts of Interest
The authors declare no conflict of interest.
References
- Biogas Installation & Operation Manual. Available online: http://m.nier.go.kr (accessed on 6 January 2017).
- Ministry of Environment, Policy. Available online: http://www.me.go.kr (accessed on 6 January 2017).
- Korea Environment Corporation. Waste to Energy. Available online: http://www.keco.or.kr (accessed on 6 January 2017).
- Hakawati, R.; Smyth, B.M.; McCullough, G.; Rosa, F.D.; Rooney, D. What is the most energy efficient route for biogas utilization: Heat, electriity or transport? Appl. Energy 2017, 206, 1076–1087. [Google Scholar] [CrossRef]
- Hwangbo, S.; Lee, S.; Yoo, C. Optimal network design of hydrogen production by integrated utility and biogas supply networks. Appl. Energy 2017, 208, 195–209. [Google Scholar] [CrossRef]
- Bove, R.; Lunghi, P. Experimental comparison of MCFC performance using three different biogas types and methane. J. Power Sources 2005, 145, 588–593. [Google Scholar] [CrossRef]
- Larmine, J.; Dickes, A. Fuel Cell Systems Explained, 2nd ed.; Wiely: West Sussex, UK, 2003; ISBN 13:978-0-470-84857-9 (H/B). [Google Scholar]
- Hofmann, P.; Schweiger, A.; Fryda, L.; Panopoulos, K.D.; Hohenwarter, U.; Bentzen, J.D.; Ouweltjes, J.P.; Ahrenfeldt, J.; Henriksen, U.; Kakaras, E. High temperature electrolyte sypported Ni-GDC/YSZ/LSM SOFC operation on two-stage Viking gasifier product gas. J. Power Sources 2007, 173, 357–366. [Google Scholar] [CrossRef]
- Bang-Moller, C.; Rokni, M. Thermodynamic performance study of biomass gasification, solid oxide fuel cell and micro gas turbine hybrid systems. Energy Convers. Manag. 2010, 51, 2330–2339. [Google Scholar] [CrossRef]
- MosayebNezhad, M.; Mehr, A.S.; Oshima, T.; Sasaki, K. Internal reforming SOFC running on biogas. Int. J. Hydrogen Energy 2010, 35, 7905–7912. [Google Scholar]
- Yi, Y.; Rao, A.D.; Brouwer, J.; Samuelsen, G.S. Fuel flexibility study of an integrated 25 kW SOFC reformer system. J. Power Sources 2005, 144, 67–76. [Google Scholar] [CrossRef]
- Farhad, S.; Hamdullahpur, F.; Yoo, Y. Performance evaluation of different configurations of biogas-fuelled SOFC micro-CHP systems for residential applications. Int. J. Hydrogen Energy 2010, 35, 3758–3768. [Google Scholar] [CrossRef]
- Farhad, S.; Yoo, Y.; Hamdullahpur, F. Effects of fuel processing methods on industrial scale biogas-fuelled solid oxide fuel cell system for operating in wastewater treatment plants. J. Power Sources 2010, 195, 1446–1453. [Google Scholar] [CrossRef]
- Vakouftsi, E.; Marnellos, G.E.; Athanasiou, C.; Coutelieris, F. CFD modeling of a biogas fuelled SOFC. Solid State Ion. 2011, 192, 458–463. [Google Scholar] [CrossRef]
- Veyo, S.E.; Vora, S.D.; Litzinger, K.P.; Lundberg, W.L. Status of pressurized SOFC/GAS turbine power system development at Siemens Westinghouse. In Proceedings of the ASME Turbo Expo, Amsterdam, The Netherlands, 3–6 June 2002. [Google Scholar]
- Litzinger, K.P. Comparative evaluation of SOFC gas turbine hybrid options. In Proceedings of the ASME Turbo Expo Conference, Reno, NV, USA, 6–9 June 2005. [Google Scholar]
- Aicher, T.; Lenz, B.; Gschnell, F.; Groos, U.; Feferici, F.; Caprile, L.; Parodi, L. Fuel processors for fuel cell APU application. J. Power Sources 2006, 154, 503–508. [Google Scholar] [CrossRef]
- Mueller, F.; Jabbari, F.; Gaynor, R.; Brouwer, J. Novel solid oxide fuel cell system controller for rapid load following. J. Power Sources 2007, 172, 308–323. [Google Scholar] [CrossRef]
- Massardo, A.F.; Lubelli, F. Internal Reforming Solid Oxide Fuel Cell-Gas Turbine Combined Cycles: Part A—Cell Model and Cycle Thermodynamic Analysis. J. Eng. Gas Turbines Power 2000, 122, 27–35. [Google Scholar] [CrossRef]
- Achenbach, E. Three-dimensional and time-dependent simulation of a planar solid oxide fuel cell stack. J. Power Sources 1994, 49, 333–348. [Google Scholar] [CrossRef]
- POSCO Energy Corporation. Available online: http://www.poscoenergy.com (accessed on 6 January 2017).
- Busan Environmental Corporation. Available online: http://www.bego.go.kr (accessed on 6 January 2017).
Figure 1.
Schematic of a biogas plant in Busan, Republic of Korea.
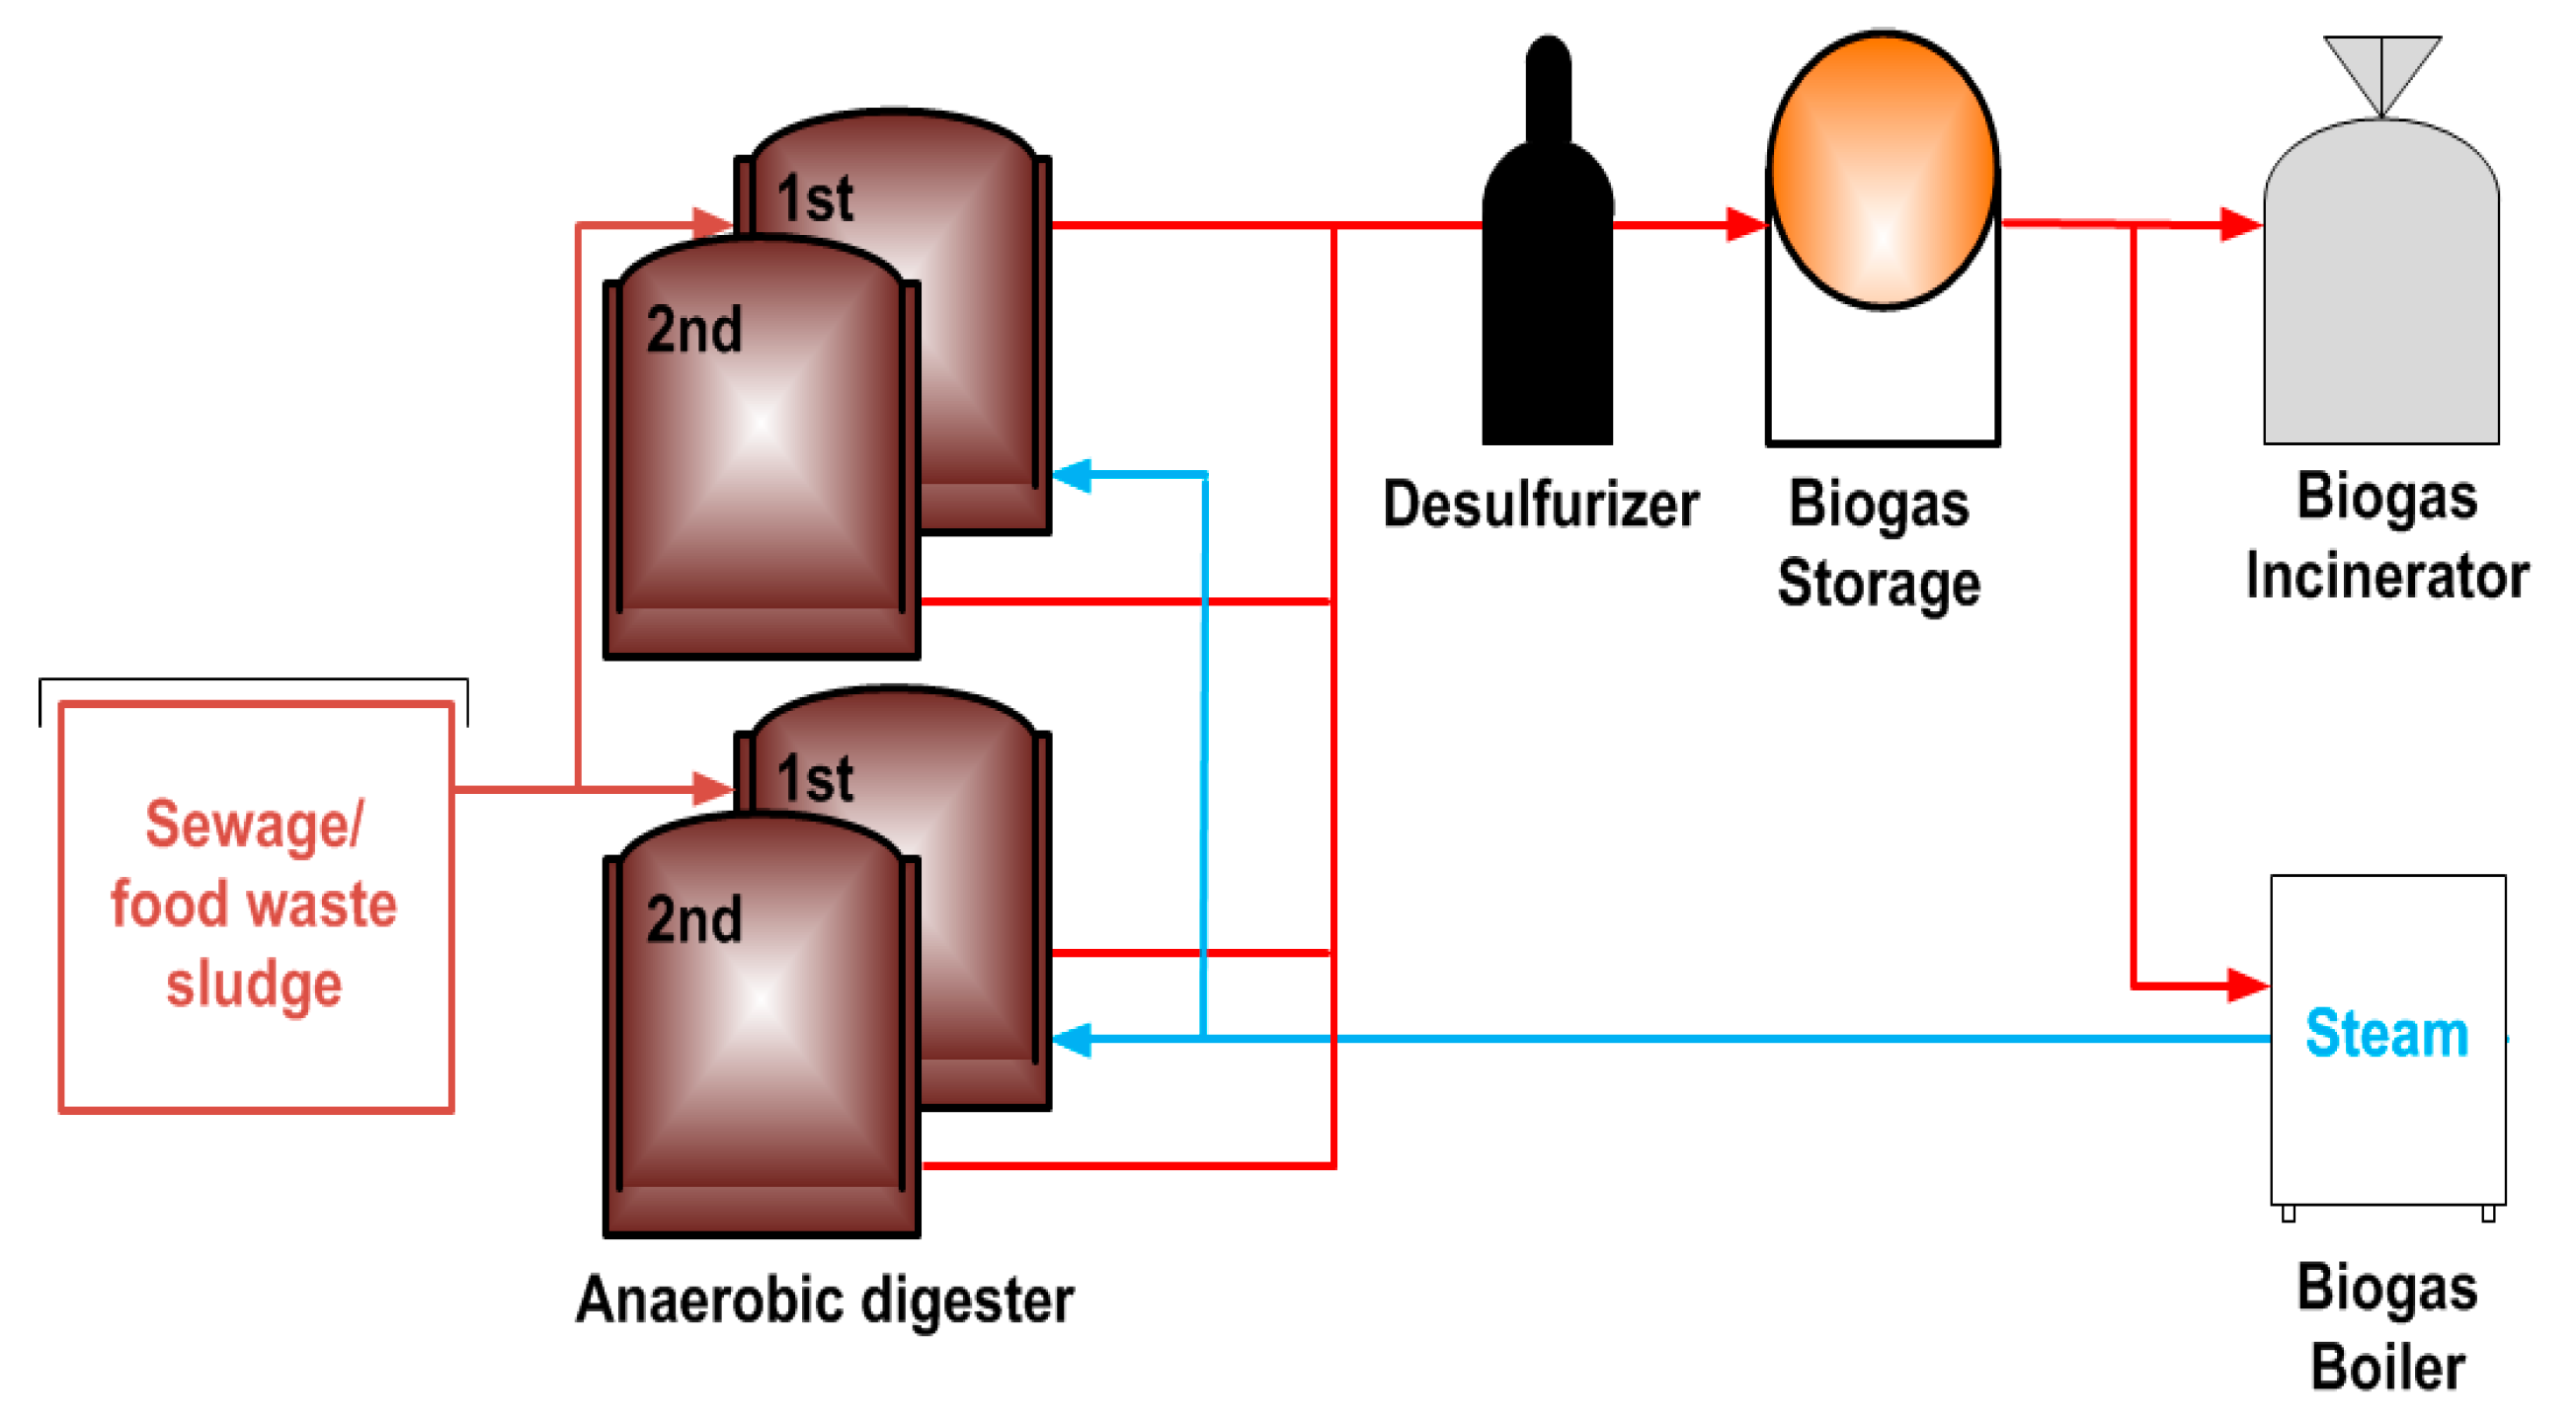
Figure 2.
Operating data for the biogas plant. (a) Biogas and methane concentration; (b) Digester heat rate and sludge mass flow rate; (c) Digester and ambient temperature.
Figure 2.
Operating data for the biogas plant. (a) Biogas and methane concentration; (b) Digester heat rate and sludge mass flow rate; (c) Digester and ambient temperature.

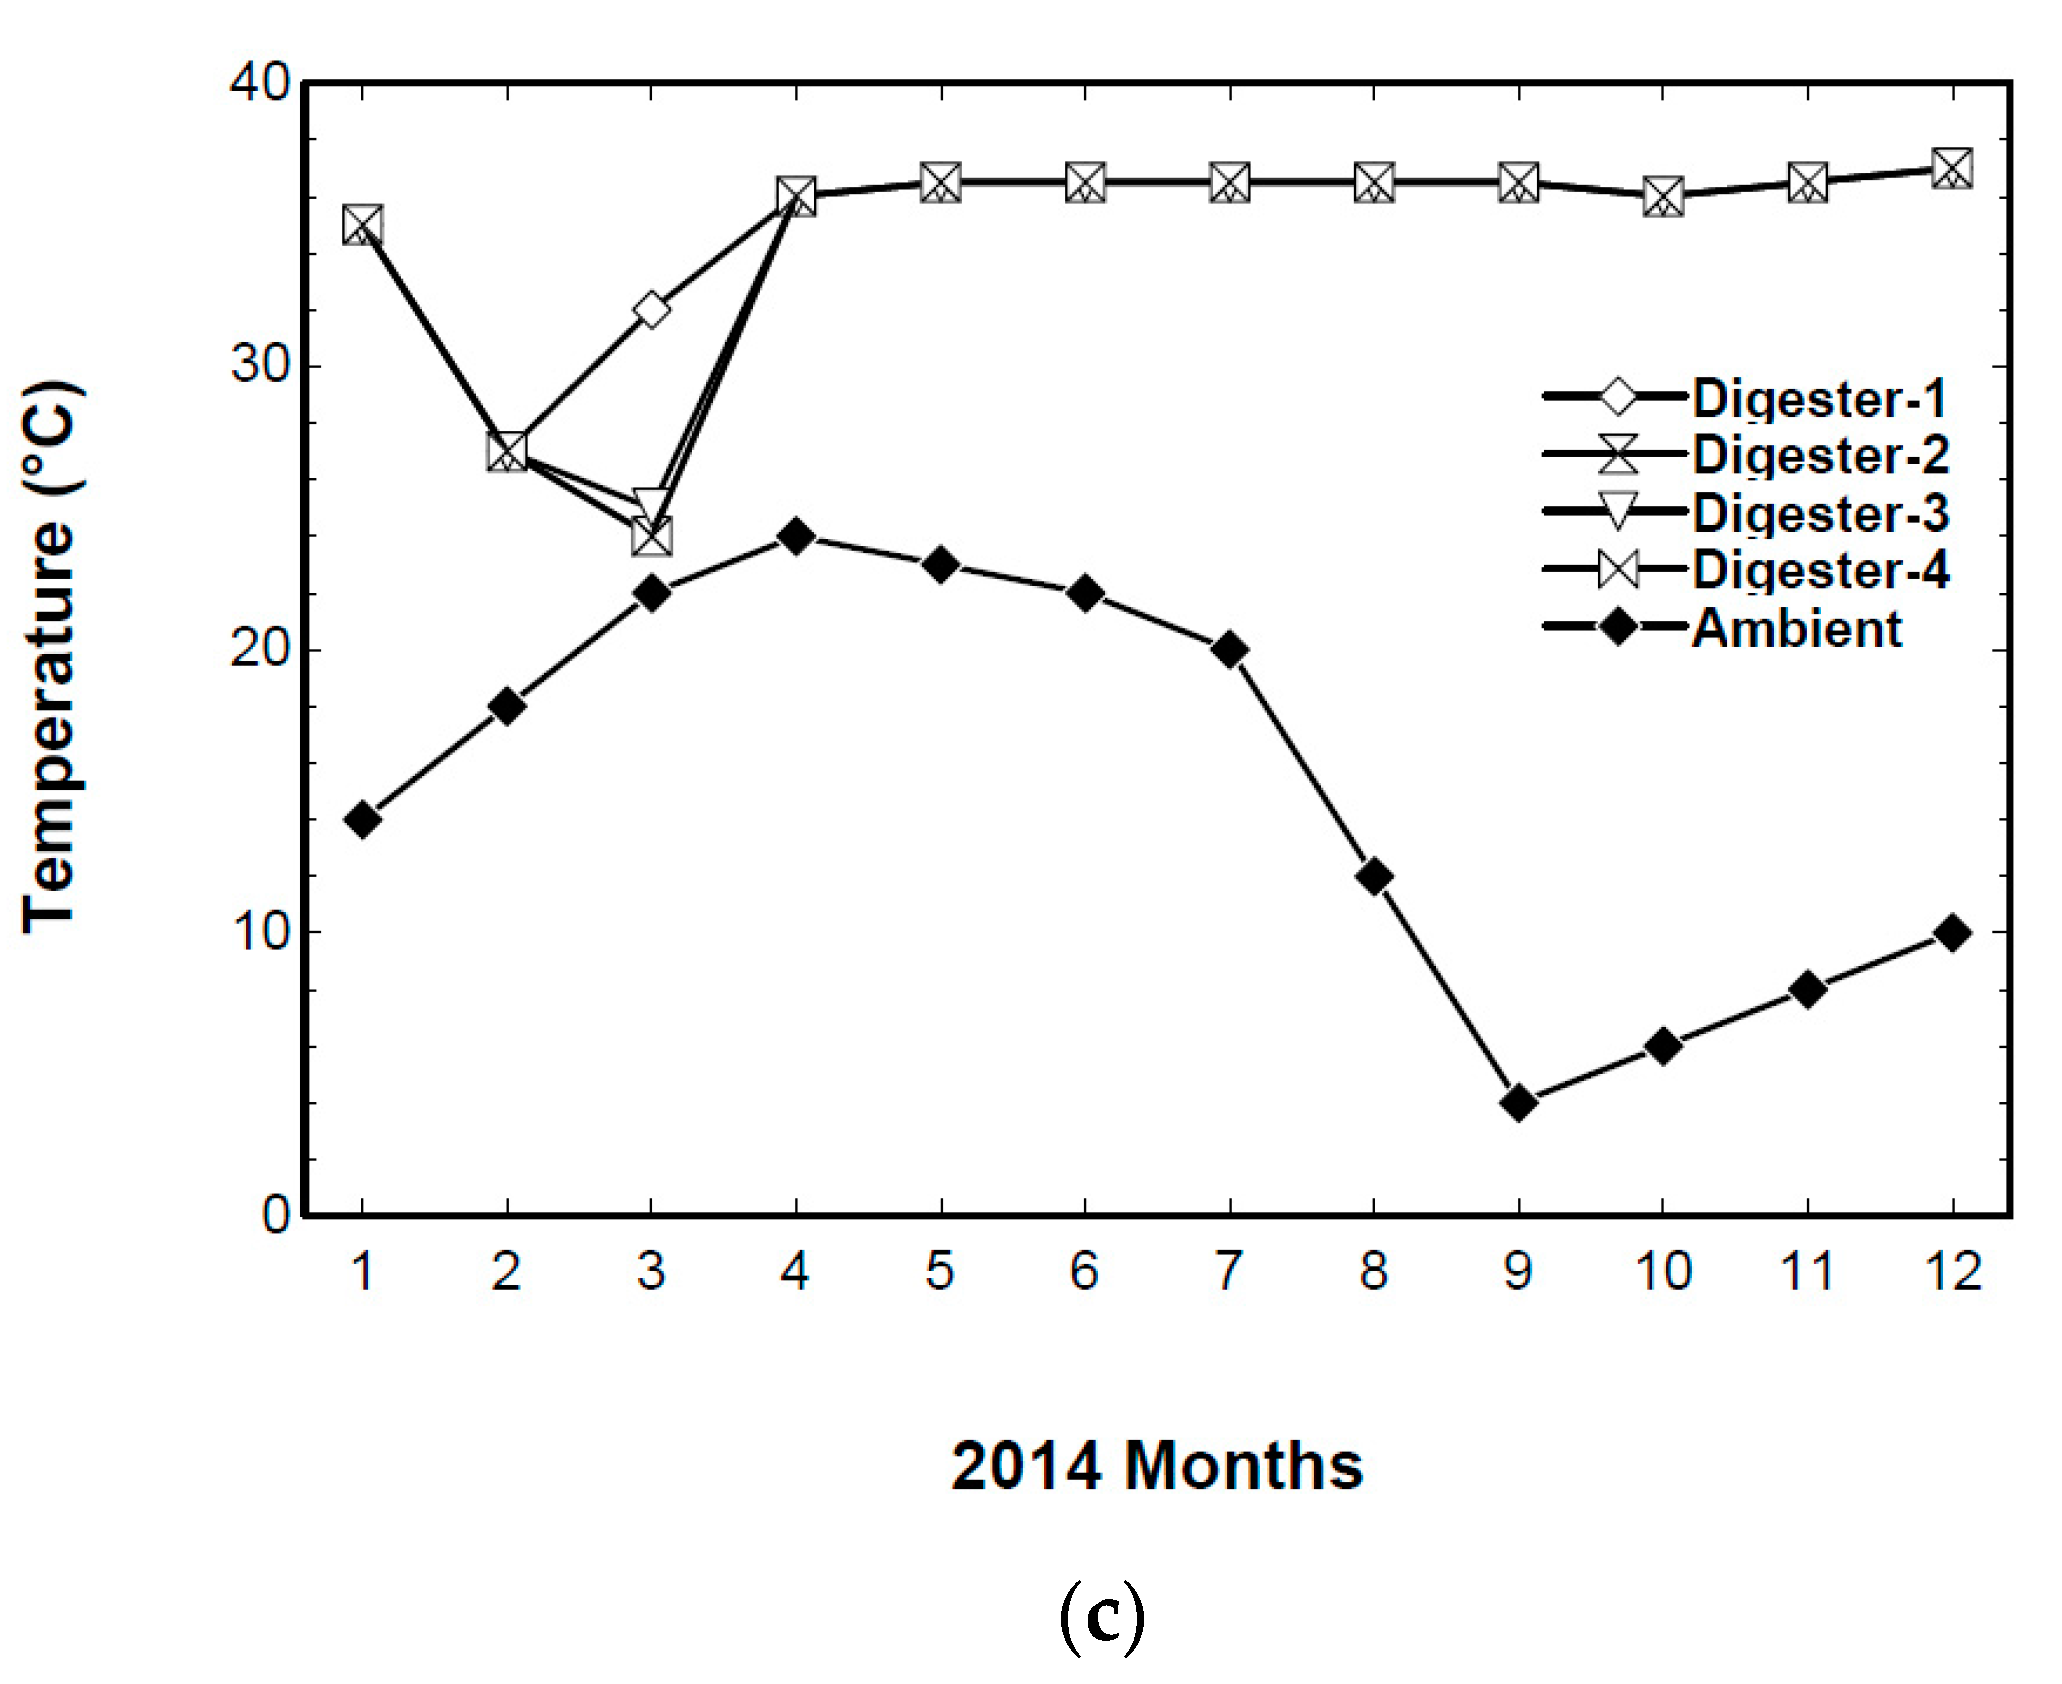
Figure 3.
Schematic of a biogas-fueled external reforming SOFC hybrid system.
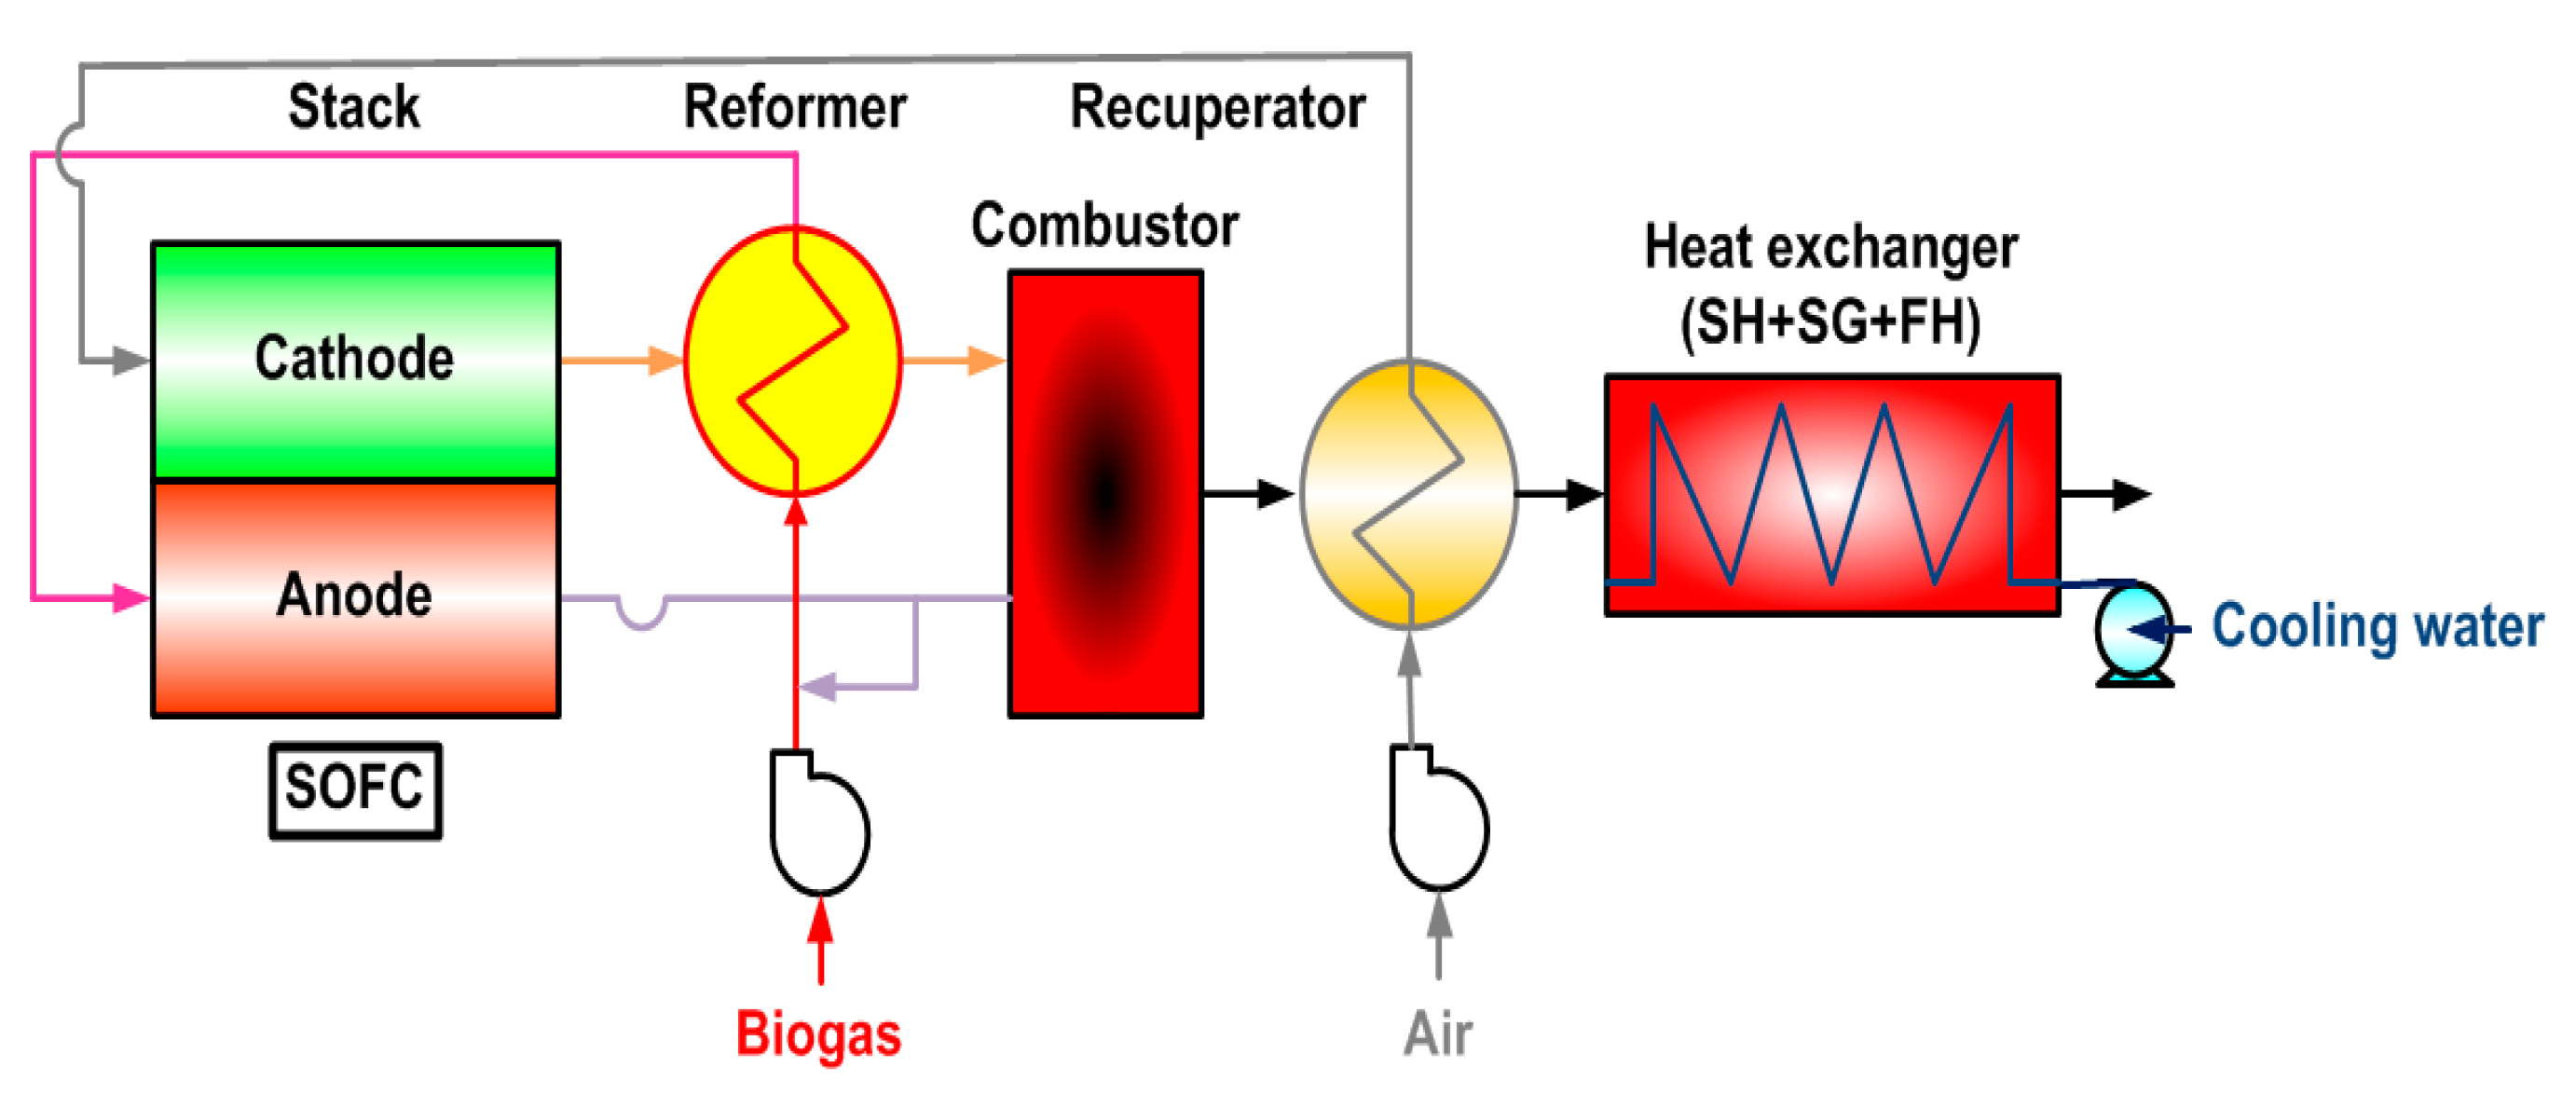
Figure 4.
Hydrogen reforming characteristics of a SOFC.

Figure 5.
Cell voltage and over-potential of the SOFC.

Figure 6.
The effect of the steam carbon ratio on the SOFC (a) Cell voltage and oxygen utilization; (b) The efficiency of the SOFC; (c) The mass flow rate and the outlet temperature of components in the SOFC.
Figure 6.
The effect of the steam carbon ratio on the SOFC (a) Cell voltage and oxygen utilization; (b) The efficiency of the SOFC; (c) The mass flow rate and the outlet temperature of components in the SOFC.


Figure 7.
The effect of the cell operating temperature on the SOFC: (a) Cell voltage and oxygen utilization; (b) Efficiency of the SOFC; (c) Mass flow rate and the outlet temperature of components in the SOFC.
Figure 7.
The effect of the cell operating temperature on the SOFC: (a) Cell voltage and oxygen utilization; (b) Efficiency of the SOFC; (c) Mass flow rate and the outlet temperature of components in the SOFC.


Figure 8.
The effect of the cell current density on the SOFC: (a) Cell voltage and oxygen utilization; (b) Efficiency of the SOFC; (c) Mass flow rate and the outlet temperature of components in the SOFC.
Figure 8.
The effect of the cell current density on the SOFC: (a) Cell voltage and oxygen utilization; (b) Efficiency of the SOFC; (c) Mass flow rate and the outlet temperature of components in the SOFC.

Figure 9.
Operating characteristics of SOFCs with parallel operation in 2014. (a) Power and digester heating; (b) Exhaust gas temperature; (c) Exhaust gas mass flow rate.
Figure 9.
Operating characteristics of SOFCs with parallel operation in 2014. (a) Power and digester heating; (b) Exhaust gas temperature; (c) Exhaust gas mass flow rate.

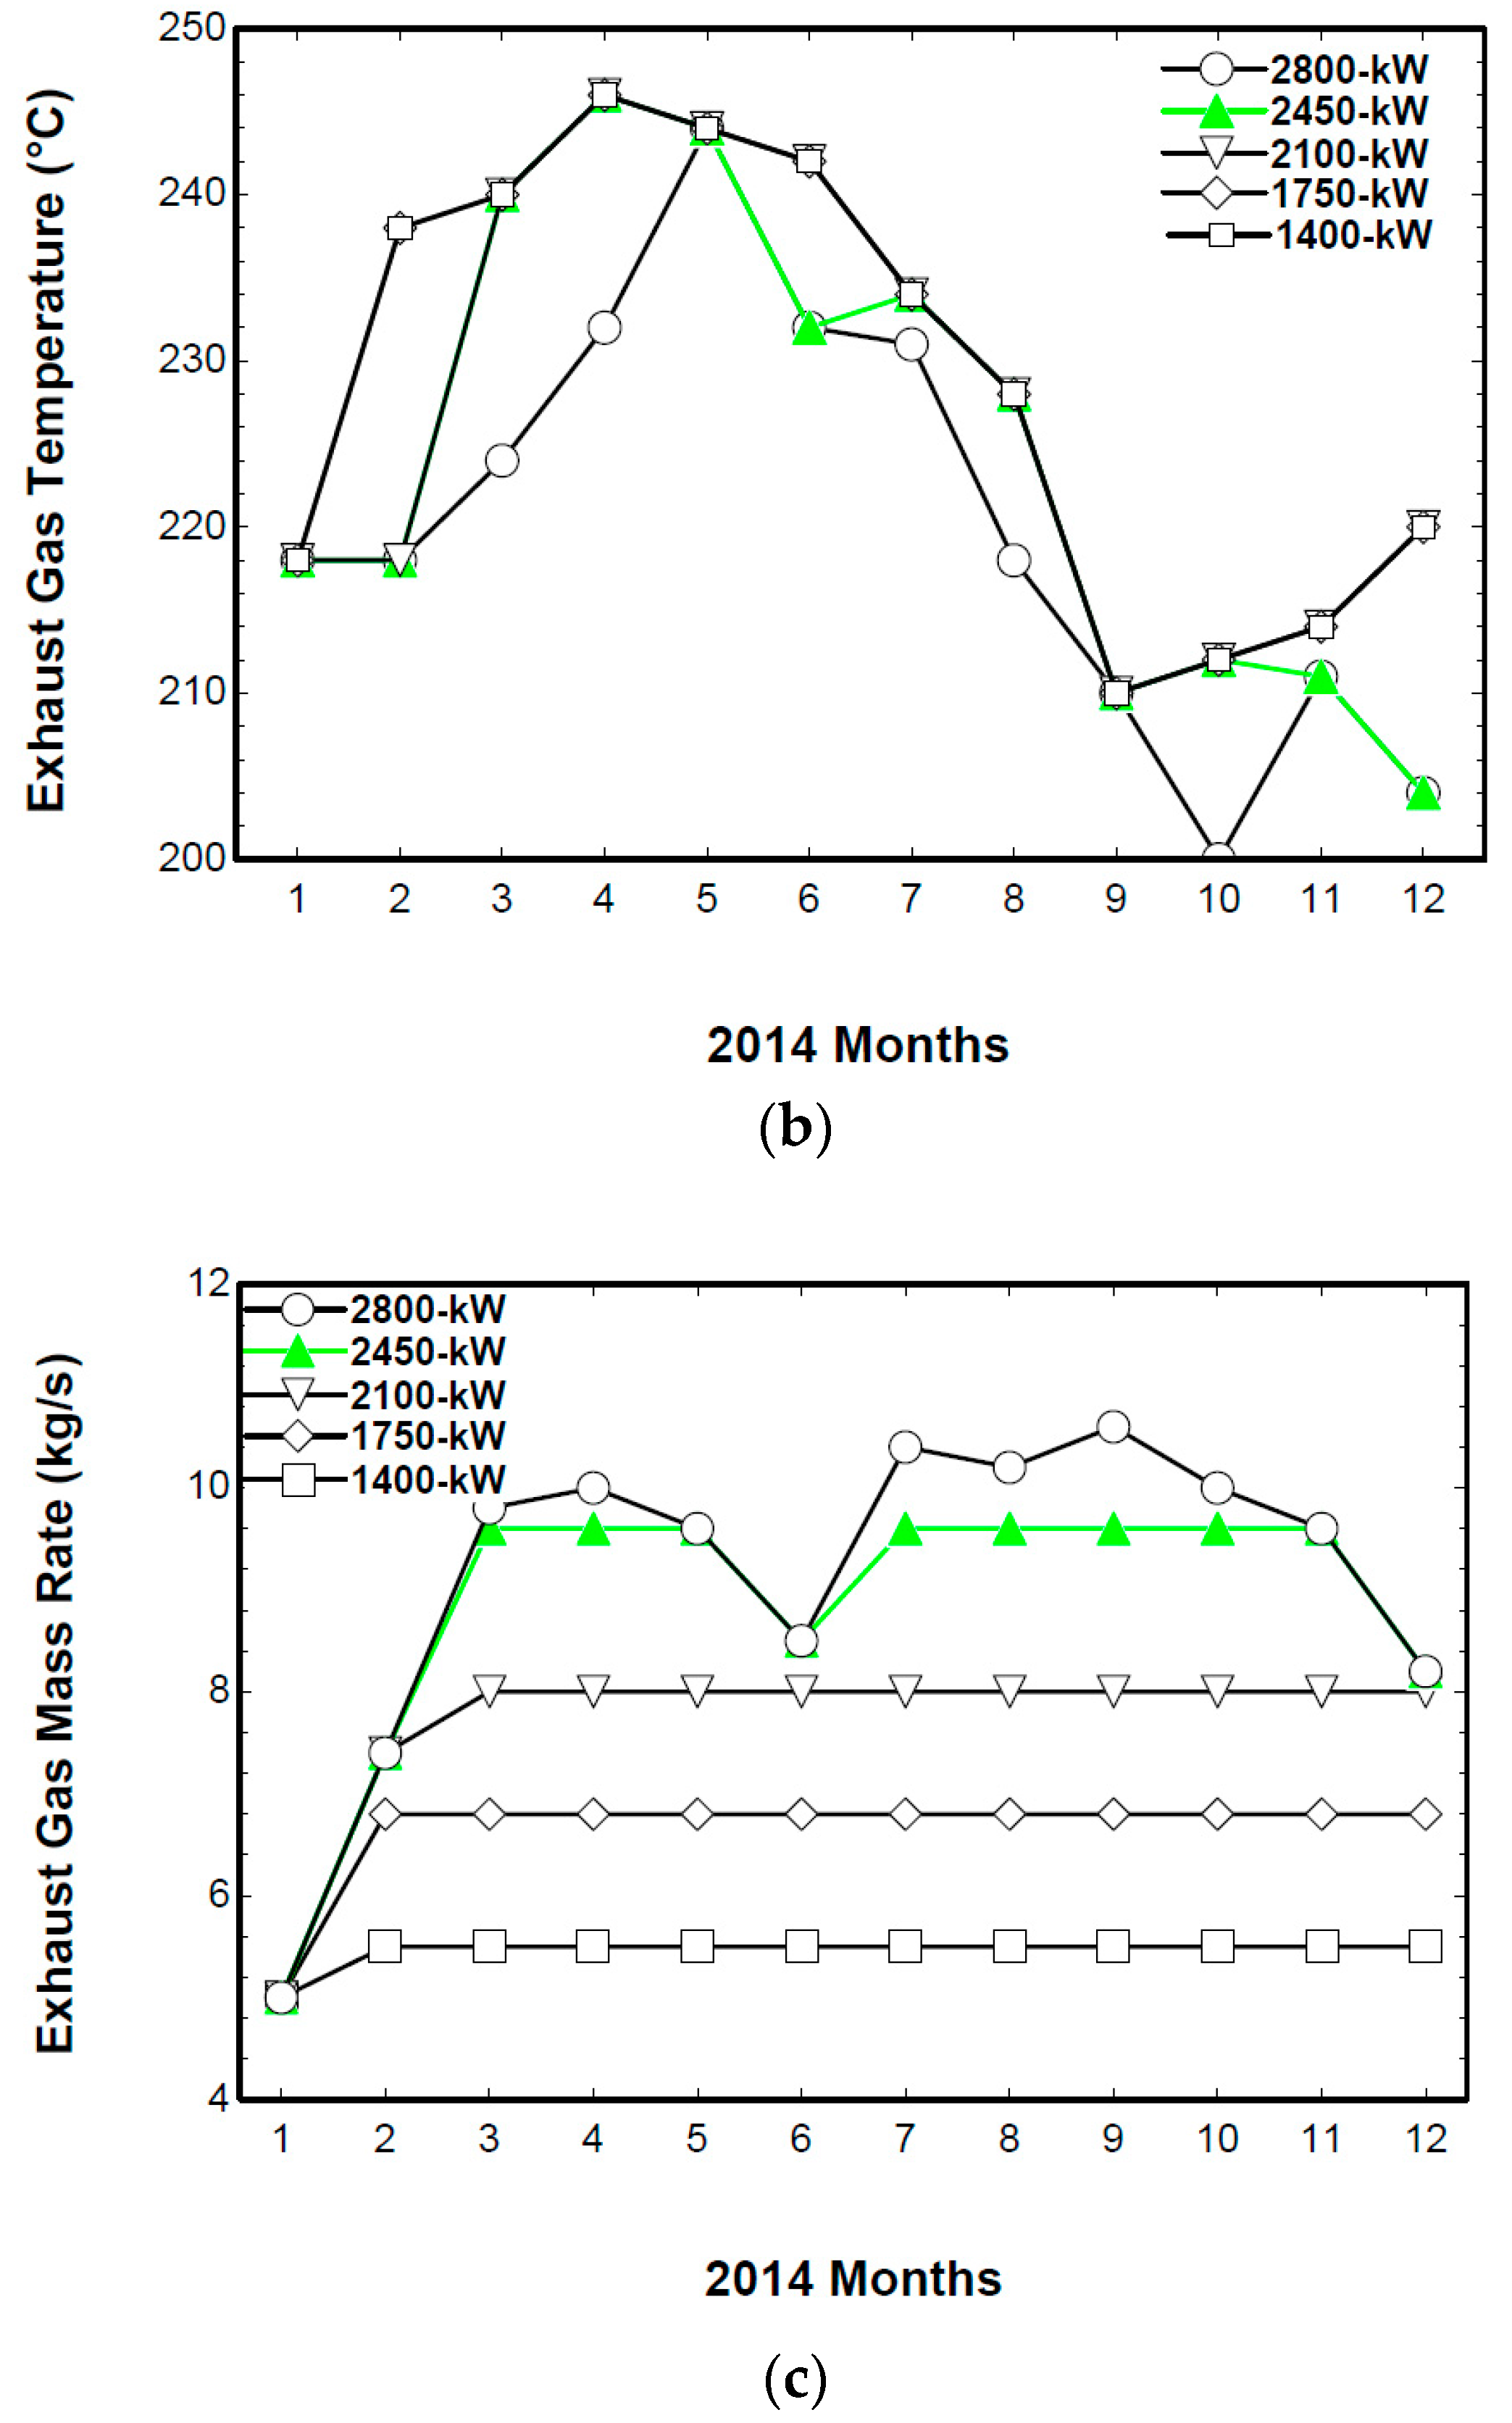
Figure 10.
Electricity consumption and greenhouse gas of 2450 kW SOFCs in 2014. (a) Supplied electricity and GHG emission; (b) GHG emission and used biogas.
Figure 10.
Electricity consumption and greenhouse gas of 2450 kW SOFCs in 2014. (a) Supplied electricity and GHG emission; (b) GHG emission and used biogas.
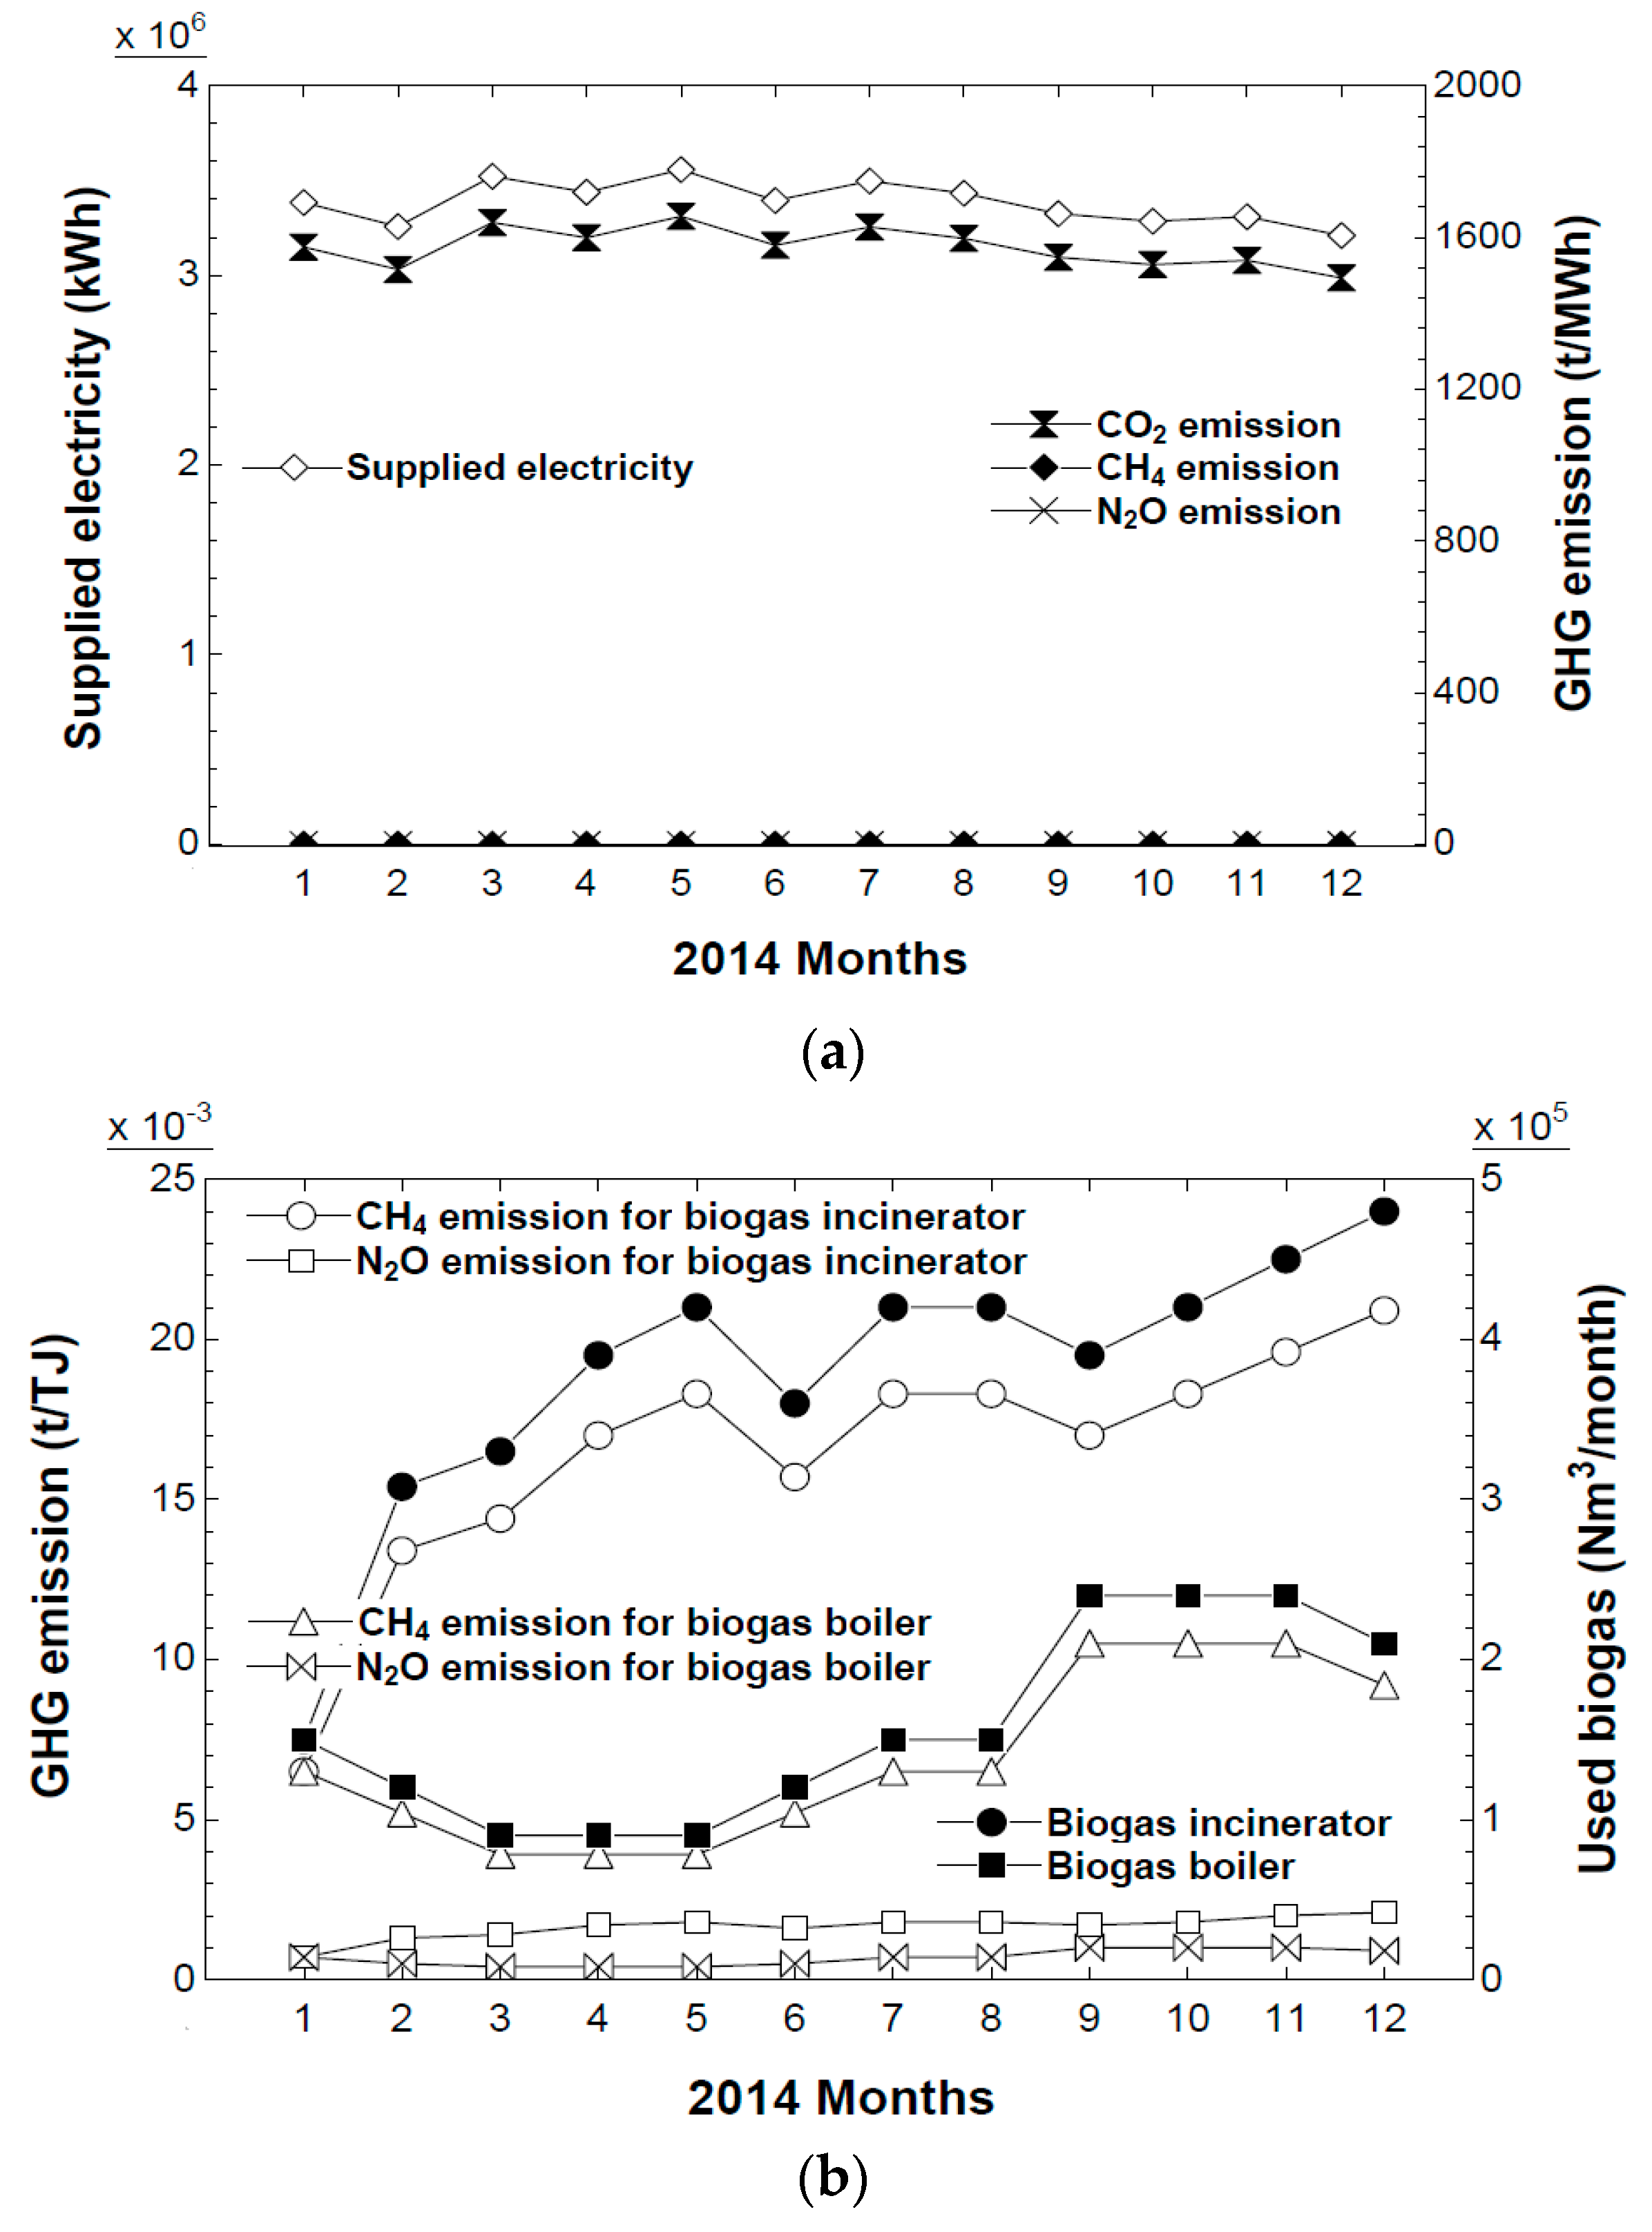
Figure 11.
Electricity consumption and greenhouse gas of 2450 kW SOFCs in 2014.


Table 1.
Parameters for the estimated the required heat rates of the anaerobic digesters.
| Parameters | Total Value | Units | Value | Units | Value | Units |
|---|---|---|---|---|---|---|
| Volume | 28,000 | m3 | 7000 | m3 | 7000 | m3 |
| Top area (n = 1) | 3772 | m2 | 0.4 | m | 3.345 | W/m2-K |
| Middle area (n = 2) | 2263 | m2 | 0.5 | m | 2.843 | W/m2-K |
| Base area (n = 3) | 1509 | m2 | 0.5 | m | 0.63 | W/m2-K |
| Sludge-specific heat | 1 | kJ/kg-K | 1 | kJ/kg-K | 1 | kJ/kg-K |
Table 2.
Parameters of the SOFC for lumped analysis.
| Parameters | Unit | Value |
|---|---|---|
| Electrical output | kW | 350 |
| Anode thickness | μm | 200 |
| Cathode thickness | μm | 2000 |
| Electrolyte thickness | μm | 20 |
| H2 utilization ratio | % | 80 |
| Limiting current density | A/m2 | 9000 |
| Inverter efficiency | % | 95 |
| Reformer temperature effectiveness | % | 10 |
| Recuperator temperature effectiveness | % | 85 |
| Steam carbon ratio | - | 3 |
| Air compressor adiabatic efficiency | % | 75 |
| Water pump efficiency | % | 85 |
| Recuperator pressure drop (air line) | % | 4 |
| Stack pressure drop (air line) | % | 6 |
| Reformer pressure drop (air line) | % | 4 |
| Combustor pressure drop (gas line) | % | 2 |
| Recuperator pressure drop (gas line) | % | 2 |
| Boiler pressure drop (gas line) | % | 3 |
| Mixer pressure drop (fuel line) | % | 2 |
| Reformer pressure drop (fuel line) | % | 2 |
| Stack pressure drop (fuel line) | % | 6 |
| Combustor pressure drop (fuel line) | % | 8 |
Table 3.
Operation conditions of 350 kW SOFC.
| Steam Carbon Ratio | Cell Voltage (V) | O2 Utilization | Electrical Efficiency (%) | SOFC Outlet Temperature (°C) | Exhaust Gas Flow (kg/s) |
| 1 | 0.78 | 0.16 | 52 | 220 | 1.2 |
| 2 | 0.77 | 0.165 | 53 | 215 | 1.25 |
| 3 | 0.76 | 0.17 | 54 | 210 | 1.3 |
| 4 | 0.75 | 0.175 | 53 | 205 | 1.35 |
| 5 | 0.74 | 0.18 | 54 | 200 | 1.4 |
| Operation Temperature (°C) | Cell Voltage (V) | O2 Utilization | Electrical Efficiency (%) | SOFC Outlet Temperature (°C) | Exhaust Gas Flow (kg/s) |
| 800 | 0.46 | 0.03 | 36 | 150 | 1.27 |
| 850 | 0.58 | 0.08 | 45 | 170 | 1.28 |
| 900 | 0.66 | 0.11 | 51 | 190 | 1.29 |
| 950 | 0.70 | 0.13 | 54 | 210 | 1.3 |
| 1000 | 0.72 | 0.14 | 55 | 230 | 1.31 |
| Current Density (A/m2) | Cell Voltage (V) | O2 Utilization | Electrical Efficiency (%) | SOFC Outlet Temperature (°C) | Exhaust Gas Flow (kg/s) |
| 1000 | 0.82 | 0.18 | 60 | 212 | 1.0 |
| 3000 | 0.72 | 0.16 | 54 | 210 | 1.3 |
| 5000 | 0.60 | 0.13 | 46 | 198 | 1.7 |
| 7000 | 0.46 | 0.09 | 36 | 196 | 2.2 |
| 9000 | 0.30 | 0.04 | 20 | 194 | 2.8 |
Table 4.
Operation condition of 2450 kW SOFCs in 2014.
| 2014. Month (Day) | SOFC Power (MWh) | Supplied Power (MWh) | Greenhouse Gas Emission (ton/MWh) | Greenhouse Gas Reduction (ton/MWh) | Electricity Benefits ($) |
|---|---|---|---|---|---|
| 1(31) | 937 | 2446 | 1157 | 444 | 89,057 |
| 2(12) | 513 | 2744 | 1299 | 243 | 47,163 |
| 3(15) | 882 | 2639 | 1249 | 418 | 82,908 |
| 4(30) | 1764 | 1673 | 792 | 835 | 141,120 |
| 5(31) | 1823 | 1734 | 821 | 863 | 138,533 |
| 6(30) | 1620 | 1773 | 839 | 767 | 119,880 |
| 7(31) | 1734 | 1763 | 834 | 821 | 130,014 |
| 8(31) | 1823 | 1609 | 762 | 863 | 144,001 |
| 9(30) | 1764 | 1561 | 739 | 835 | 139,356 |
| 10(31) | 1823 | 1462 | 692 | 863 | 145,824 |
| 11(30) | 1721 | 1588 | 751 | 815 | 139,385 |
| 12(31) | 1599 | 1609 | 762 | 757 | 145,564 |
Table 5.
Greenhouse gases emission in 2014.
| Emission | Greenhouse Gas (t/MWh) | |||
|---|---|---|---|---|
| Direct | Gas | Sewer | CH4, N2O | 108,893 |
| Gas | City gas | CO2, CH4, N2O | 13 | |
| Gas | Propane | CO2, CH4, N2O | 5 | |
| Gas | Biogas | CH4, N2O | 17 | |
| Vehicle | Gas/diesel | CO2, CH4, N2O | 60 | |
| Vehicle | Gasoline | CO2, CH4, N2O | 2 | |
| Indirect | Supplied Electricity | CO2, CH4, N2O | 18,817 | |
Table 6.
Greenhouse gas emission coefficients of biogas combustion.
| Emission (Energy Industry) | CO2 (kgCO2/TJ) | CH4 (kgCH4/TJ) | N2O (kgN2O/TJ) | ||
|---|---|---|---|---|---|
| Biomass | Gas | Landfill | 54,600 | 1 | 0.1 |
| Biomass | Gas | Sludge | 54,600 | 1 | 0.1 |
| Gas | The rest | 54,600 | 1 | 0.1 | |
Table 7.
Greenhouse gas emission coefficients for electricity use.
| Emission | CO2 (tCO2/MWh) | CH4 (kgCH4/ MWh) | N2O (kgN2O/MWh) |
|---|---|---|---|
| electricity | 0.4653 | 0.0054 | 0.0027 |
© 2018 by the authors. Licensee MDPI, Basel, Switzerland. This article is an open access article distributed under the terms and conditions of the Creative Commons Attribution (CC BY) license (http://creativecommons.org/licenses/by/4.0/).
Share and Cite
MDPI and ACS Style
Kim, S.; Sung, T.; Kim, K.C. Performance and Greenhouse Gas Reduction Analysis of Biogas-Fueled Solid-Oxide Fuel Cells for a Sewage Sludge and Food Waste Treatment Facility. Energies 2018, 11, 600. https://doi.org/10.3390/en11030600
AMA Style
Kim S, Sung T, Kim KC. Performance and Greenhouse Gas Reduction Analysis of Biogas-Fueled Solid-Oxide Fuel Cells for a Sewage Sludge and Food Waste Treatment Facility. Energies. 2018; 11(3):600. https://doi.org/10.3390/en11030600
Chicago/Turabian StyleKim, Sunhee, Taehong Sung, and Kyung Chun Kim. 2018. "Performance and Greenhouse Gas Reduction Analysis of Biogas-Fueled Solid-Oxide Fuel Cells for a Sewage Sludge and Food Waste Treatment Facility" Energies 11, no. 3: 600. https://doi.org/10.3390/en11030600
Note that from the first issue of 2016, this journal uses article numbers instead of page numbers. See further details here.