Data-Driven Method for Wind Turbine Yaw Angle Sensor Zero-Point Shifting Fault Detection


1
School of Instrumentation Science and Opto-electronics Engineering, Beihang University, Beijing 100083, China
2
Beijing Power Concord Technology Co. Ltd. Beijing 100048, China
*
Author to whom correspondence should be addressed.
Energies 2018, 11(3), 553; https://doi.org/10.3390/en11030553
Submission received: 10 February 2018
/
Revised: 24 February 2018
/
Accepted: 1 March 2018
/
Published: 5 March 2018
(This article belongs to the Section A: Sustainable Energy)
Abstract
:Wind turbine yaw control plays an important role in increasing the wind turbine production and also in protecting the wind turbine. Accurate measurement of yaw angle is the basis of an effective wind turbine yaw controller. The accuracy of yaw angle measurement is affected significantly by the problem of zero-point shifting. Hence, it is essential to evaluate the zero-point shifting error on wind turbines on-line in order to improve the reliability of yaw angle measurement in real time. Particularly, qualitative evaluation of the zero-point shifting error could be useful for wind farm operators to realize prompt and cost-effective maintenance on yaw angle sensors. In the aim of qualitatively evaluating the zero-point shifting error, the yaw angle sensor zero-point shifting fault is firstly defined in this paper. A data-driven method is then proposed to detect the zero-point shifting fault based on Supervisory Control and Data Acquisition (SCADA) data. The zero-point shifting fault is detected in the proposed method by analyzing the power performance under different yaw angles. The SCADA data are partitioned into different bins according to both wind speed and yaw angle in order to deeply evaluate the power performance. An indicator is proposed in this method for power performance evaluation under each yaw angle. The yaw angle with the largest indicator is considered as the yaw angle measurement error in our work. A zero-point shifting fault would trigger an alarm if the error is larger than a predefined threshold. Case studies from several actual wind farms proved the effectiveness of the proposed method in detecting zero-point shifting fault and also in improving the wind turbine performance. Results of the proposed method could be useful for wind farm operators to realize prompt adjustment if there exists a large error of yaw angle measurement.
1. Introduction
During the past decades, wind energy has experienced rapid development for the advantages of cleanness, renewability, and environmental friendliness. In the meantime, the capacity of the single Wind Turbine (WT) is growing continuously. This calls for a higher demand for WT control systems and condition monitoring systems for the purposes of extracting wind energy more efficiently and protecting the WT [1,2,3].
In particular, a yaw system allows the WT to align to the wind direction and plays an important role in increasing wind power production and decreasing the fatigue load on the blades, especially with active yaw control systems [4,5,6,7]. It was reported that even a relatively small yaw error (less than 10 degree) could reduce the WT production significantly [2]. The impact of yaw error on the aeroelastic characteristics of the horizontal axis of WT blades has been investigated. The conclusions were drawn that the yaw misalignments would adversely influence the dynamic aeroelastic stability of the blades [4,8]. Furthermore, an effective yaw system could be useful for the design of a pitch controller for the purpose of WT power regulation and blade load mitigation [1].
It is apparent that accurate yaw angle measurement (angle between wind direction and nacelle position) is the basis for effective yaw controllers [9,10,11]. In [12], an intelligent approach based on k Nearest Neighbor (KNN) was proposed to estimate the yaw position of the WT using a simulated dataset. The postulate of this approach was that the accurate yaw position should be known in the model training phase. However, in real applications, the wind vanes are always imprecise [13]. It is essential to develop a method to determine the error of the yaw angle measurement on wind turbines. Actually, very few publications have reported such approaches. In [13], the Support Vector Machine (SVM) method was adopted to effectively estimate the WT yaw error based on wind data, electrical data, control data, and bending moment of the rotor blades. However, in actual applications, the bending moments are always unavailable. On the other hand, from the perspective of wind farm operators, it would be useful to develop a method for providing the yaw angle measurement error qualitatively. In this way, if the measurement error is larger than a pre-defined threshold, engineers would be sent to fix this problem. At the time of this writing, there are still no publications focusing on evaluating the yaw angle measurement error qualitatively.
Since the yaw angle measurement is affected the most adversely by zero-point shifting, the zero-point shifting fault of the yaw angle sensor is firstly defined in this paper. A data-driven method to detect the yaw angle sensor fault qualitatively is proposed accordingly based only on the Supervisory Control and Data Acquisition (SCADA) data. SCADA systems have been used widely in power systems, including electricity grids, wind farms, etc., for monitoring and controlling in real time [14,15,16]. Although more than one hundred parameters are included in the SCADA system, only several related parameters are considered in our work, i.e., yaw angle, wind speed, wind power output, blade pitch angle, pitch motor power, yawing set value, and WT operation mode. The reason why we choose these parameters will be explained in this paper. The wind power data of different measured yaw angles (with error) are analyzed in our approach to evaluate the error of the yaw angle sensor and detect the zero-point shifting fault. A data preprocessing scheme is designed to make sure the power data analysis is based on the same condition. Case studies based on the SCADA data of wind turbines from several wind farms in China proved the effectiveness of the proposed method in yaw angle sensor fault detection. Compared with earlier works, contributions of this work are:
- (a).
- The wind turbine yaw angle zero-point shifting fault is defined in this paper. This definition could be useful for wind farm operators to realize reasonable maintenance in order to reduce maintenance costs and improve wind turbine production.
- (b).
- A data-driven method for zero-point shifting fault detection based only on SCADA data is proposed. The cost of fault detection could be significantly reduced by using only SCADA data.
- (c).
- A data preprocessing procedure is adopted to eliminate the influences of some other factors on the power performance of the wind turbine.
- (d).
- The results from several wind farms proved the effectiveness of the proposed method. Meanwhile, the results also show that the proposed method could be useful for both prompt yaw angle sensor adjustment and to improve the performance of wind turbines.
This paper is organized as follows. Section 2 introduces the WT control system and yaw angle measurement scheme adopted in wind turbines. The yaw angle sensor zero-point fault is also defined in Section 2. The proposed data-driven method of detecting the zero-point shifting fault is presented in Section 3, followed by the case studies and discussions in Section 4. Conclusions are finally drawn in Section 5.
2. The WT Control System and Definition of Yaw Angle Sensor Zero-Point Shifting Fault
2.1. WT Control System
The considered WTs in this research are all horizontal axis direct driven WTs. The rated power of each WT is 2 MW. The cut-in wind speed of the considered WTs is 3 m/s, while the cut-out wind speed is 20 m/s.
The blade pitch angle remains at until the generated power reaches the rated power of the WT with the increasing wind speed. The blade pitch control system would be activated to regulate the pitch angle in order to keep the generated power around the rated power.
The yaw control system allows the WT to align to the wind direction for the purpose of extracting the energy of wind more efficiently. If the 15 s-averaged yaw angle is larger than , the yaw control system is activated to reduce the yaw angle in order to align the WT to the wind direction. The yaw control operation is terminated if the 5s-averaged yaw angle is less than . This control scheme can effectively align the WT to wind direction while reducing the cost of the control system.
2.2. Yaw Angle Measurement Scheme
In this paper, the WT yaw angle means the angle between the absolute wind direction (azimuth) and the turbine nacelle position, as shown in Figure 1. The yawing system will be activated to reduce the yaw angle to zero if the yaw angle is larger than a predefined threshold.
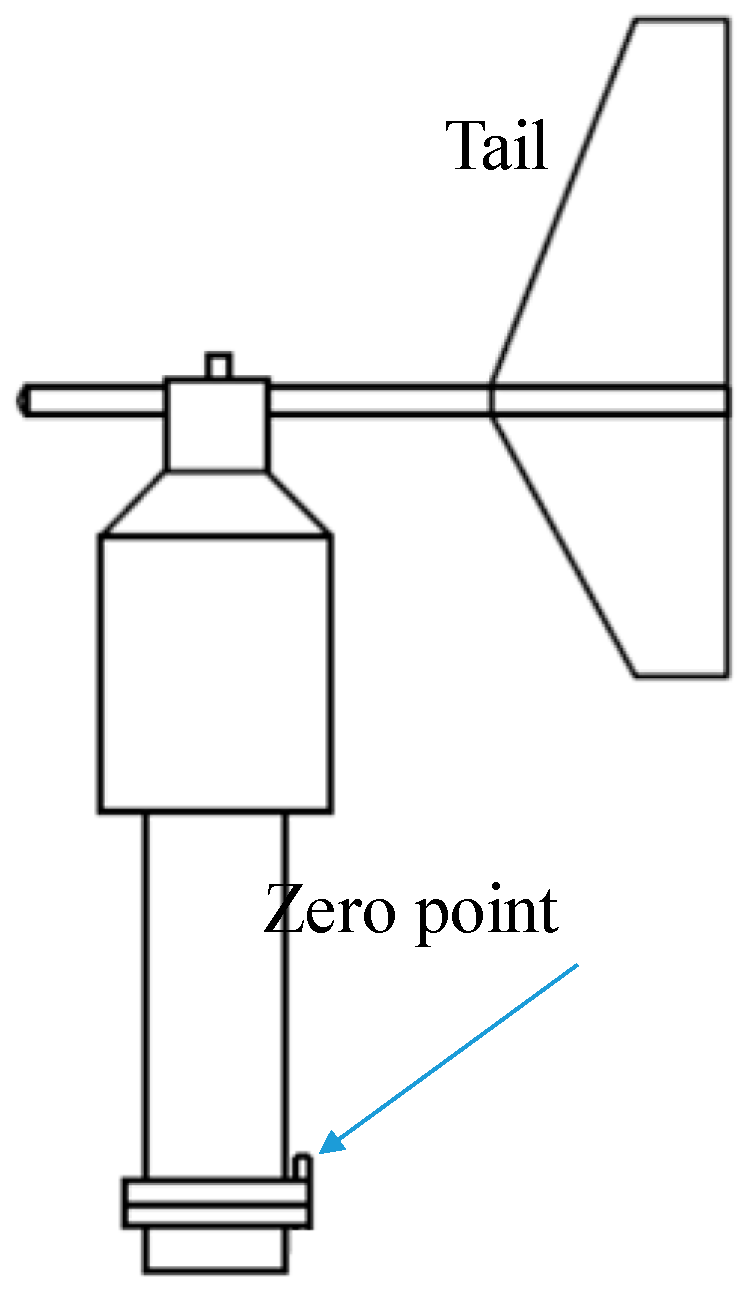
The yaw angle is usually measured by the wind direction sensor mounted on the top of the WT nacelle. Figure 2 shows the diagram of a typical wind direction sensor [17]. This sensor could be used to measure the azimuth (absolute wind direction to the North) or the yaw angle, depending on the zero-point position of the sensor. If the zero point of the sensor is permanently set on the top of the nacelle position line rather than the top of N-S line shown in Figure 1, the measurement result of the sensor would be the yaw angle, rather than the azimuth.
The specification of the adopted yaw angle sensor on the considered WTs is shown in Table 1. The yaw angle sensor measures the yaw angle every 100 ms. The SCADA system collects every yaw angle sensor measurement value but only logs the one-second-averaged value. So, the yaw angle value in the SCADA system is the average yaw angle during one second.
2.3. Zero-Point Shifting Point Definition
In the real applications, the zero point of the wind direction sensor might deviate from the nacelle position line by for the reason of installation or operation in harsh environments, as shown in Figure 3. In this situation, the measurement result of the wind direction sensor would be , which includes a systematic error for the yaw angle measurement in the SCADA system. The systematic error will lead to a misalignment between nacelle position and wind direction, which would lead to a reduction of wind power production in the operation of the wind turbine.
In this paper, the yaw angle sensor is considered to have zero-point fault if the zero-point shifting angle is larger than a set threshold. It has been reported that a yaw error less than could reduce the power output significantly. Furthermore, the threshold of the yaw angle to activate the yaw control system is in the considered WTs in this research. Thus, the zero-point shifting fault threshold is set as (less than and more than half of ).
Definition 1.
The condition of the yaw angle sensor with the zero-point shifting angle is defined as yaw angle sensor zero-point shifting fault.
The existing method to detect this fault is by periodic, manual inspection according to the maintenance strategy. In this paper, a data-driven method based on the on-line SCADA data is proposed to detect the yaw angle sensor zero-point shifting fault. The result of the proposed method could be useful for prompt maintenance of the yaw angle measurement system. The production of the WT would be increased by the prompt maintenance. Furthermore, the maintenance costs would also be reduced based on the result of our method.
2.4. Dataset
The proposed data-driven method for WT yaw angle sensor zero-point shifting fault detection is based only on the SCADA data. Since the SCADA systems are already in-place for most of the modern WTs, it would be cost effective to use only SCADA data. Furthermore, it is easier to obtain on-line results of fault detection using only SCADA data.
The SCADA system logs data every one-second. If more measurement values are obtained by a certain sensor, the SCADA system only logs the one-second-averaged value of these measurements. More than one hundred parameters are included in SCADA data, such as WT control data, WT operation data, WT condition data, WT mode data, etc. However, only several parameters related to the power performance are considered in our approach to detect the yaw angle sensor zero-point shifting fault. Besides the yaw angle value in SCADA data, the other considered parameters are shown in Table 2. The WT performance parameters are adopted to evaluate the wind turbine performance under different yaw angles . The WT controller parameters and WT operation mode parameter are adopted in the pre-processing procedure. The time interval of the dataset is 5 s in our approach based on the consideration of detection accuracy and also computational efficiency.
3. The Proposed Approach for Wind Turbine Yaw Angle Sensor Zero-Point Shifting Fault Detection
3.1. The Principle and Structure of the Proposed Approach
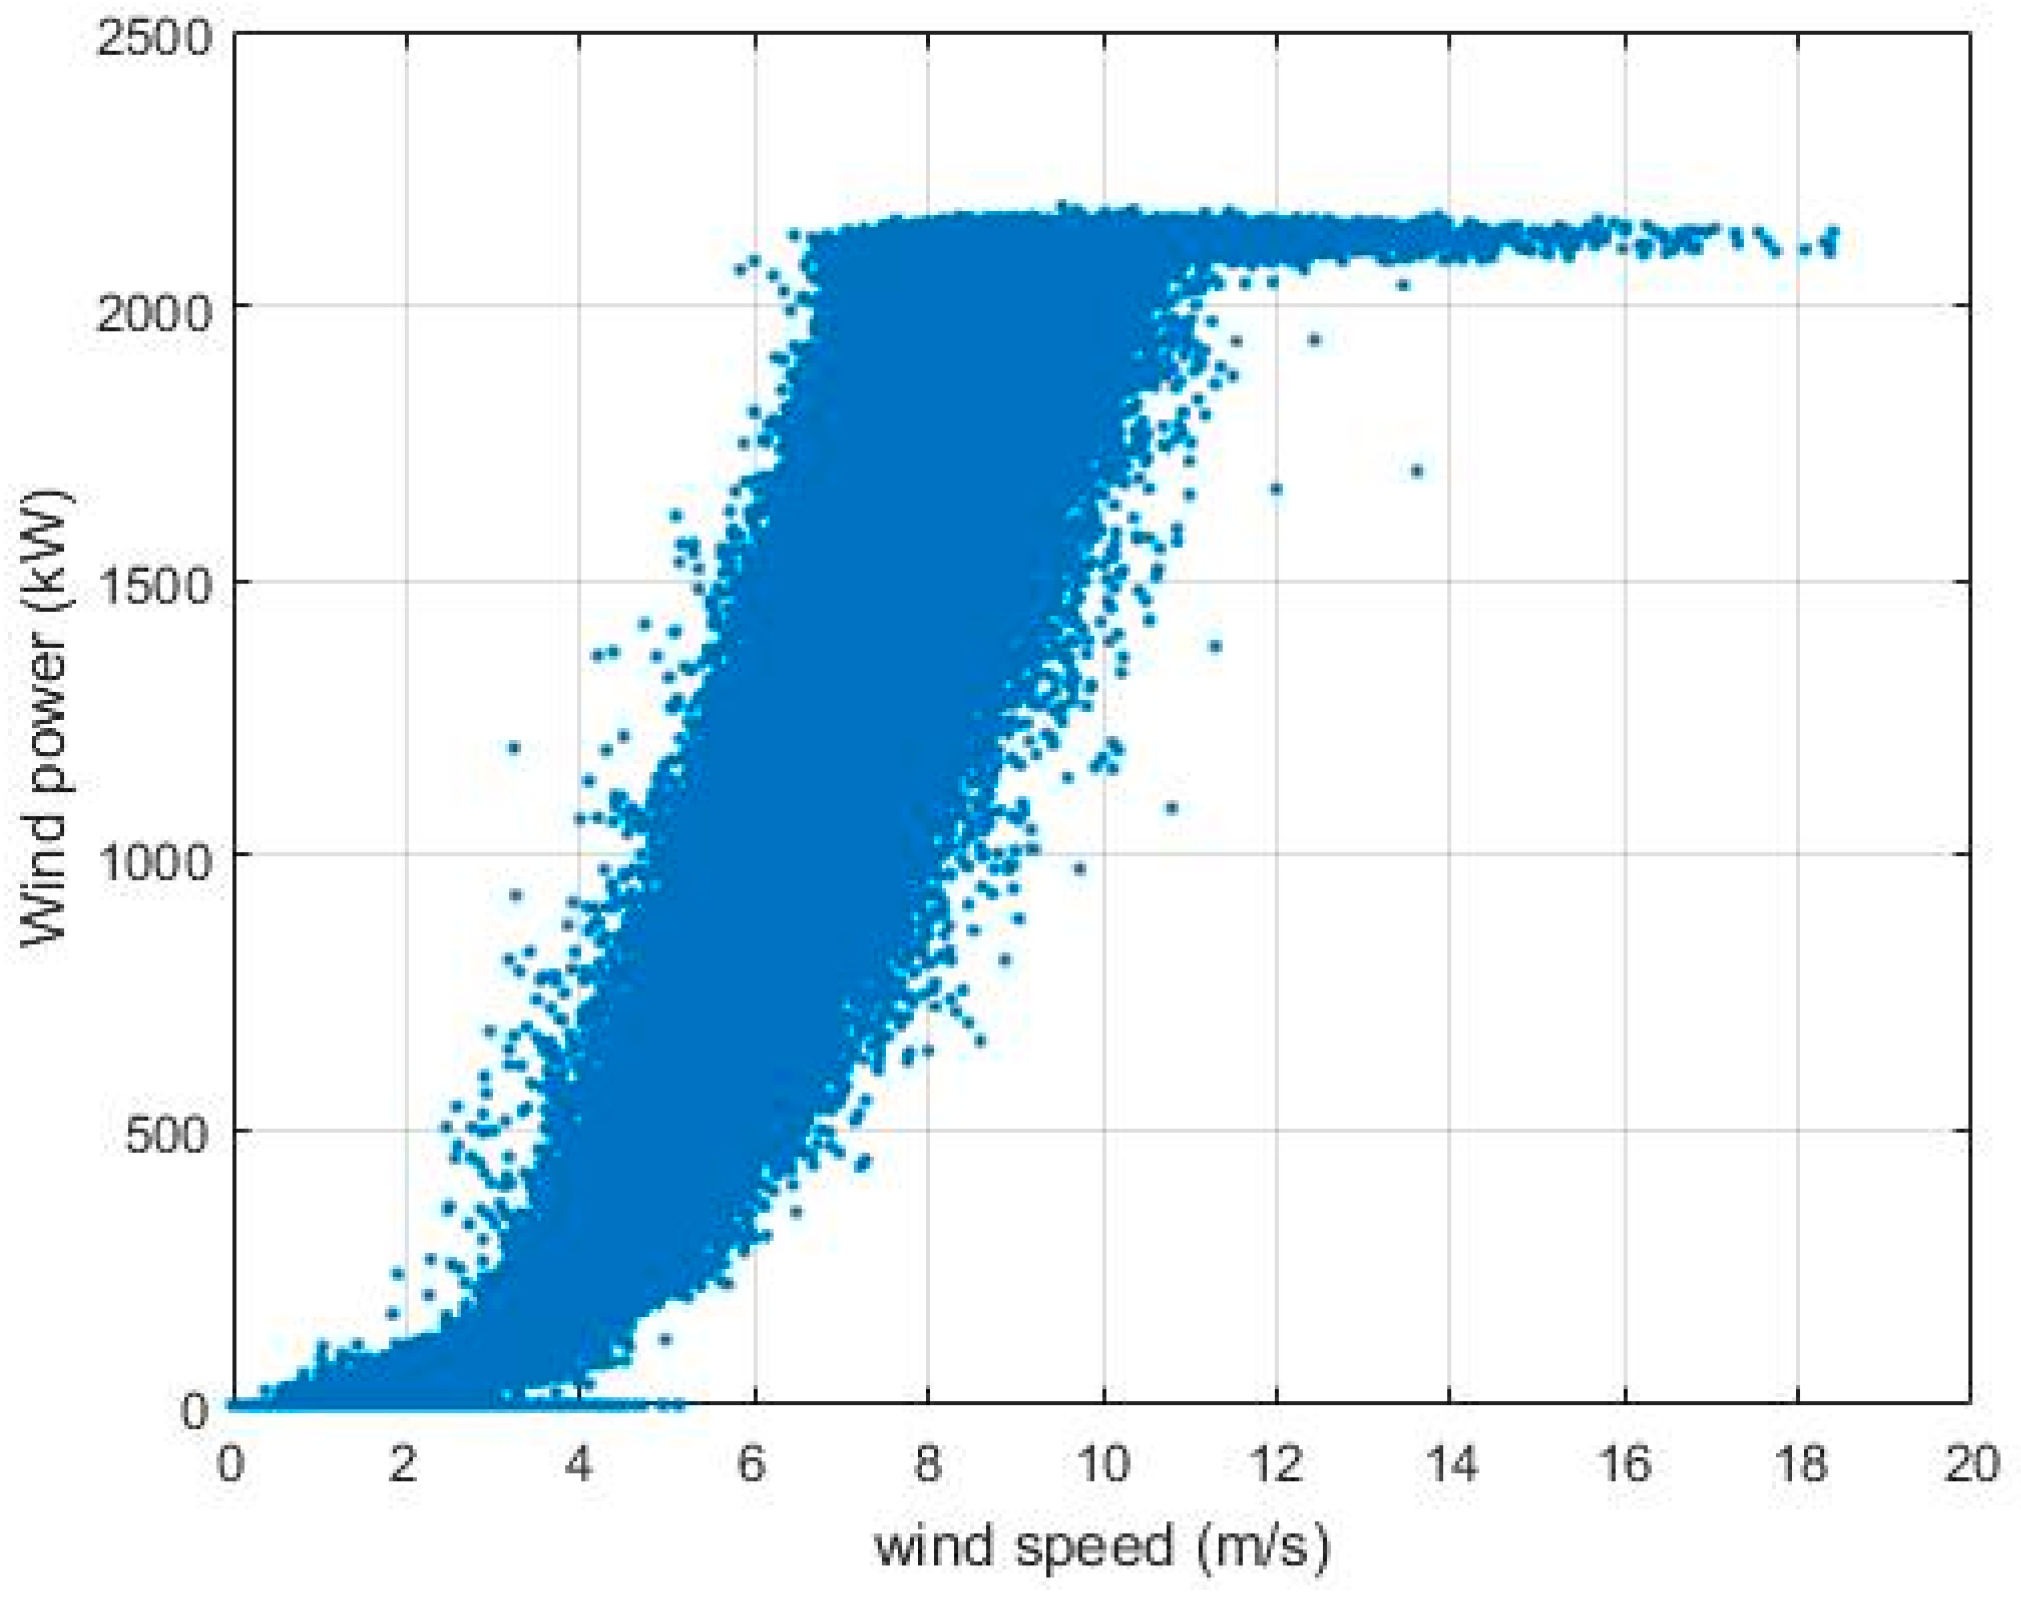
The power output of a wind turbine is influenced by several factors, such as wind speed, yaw angle, blade pitch angle, wind turbine condition, and so on. Figure 4 shows the power output of a wind turbine with installed capacity of 2 MW corresponding to wind speed. It can be observed that the power output of the wind turbine varies a large amount even under the same wind speed. For example, the wind power output ranges from less than 600 kW to more than 1500 kW for wind speed 6–6.2 m/s.
There are several factors influencing the wind power output of a wind turbine. Betz’s law [18] explains how the wind speed and yaw angle influence the power output, as shown by Equation (1). Where is the generated wind power, is the air density, is the wind speed, is the power coefficient, while is the yaw angle.
It can be concluded from Equation (1) that the power performance of a wind turbine should be the best if . Considered from another point of view, the SCADA data with the best power performance should correspond to zero yaw angle (wind turbine blade plane faces perpendicular to wind direction) in practice.
The yaw angle is controlled based on the measurement of the yaw angle sensor. If the zero-point of the yaw angle sensor deviates from the nacelle position line, a systematic error would occur for the measurement of the yaw angle sensor, as shown in Figure 3. The starting point of the proposed approach is to analyze the power performance under different yaw angles with the aim of analyzing the yaw angle sensor zero-point shifting fault based on SCADA data. The yaw angle in the SCADA system with the best power performance is considered as the yaw angle measurement error.
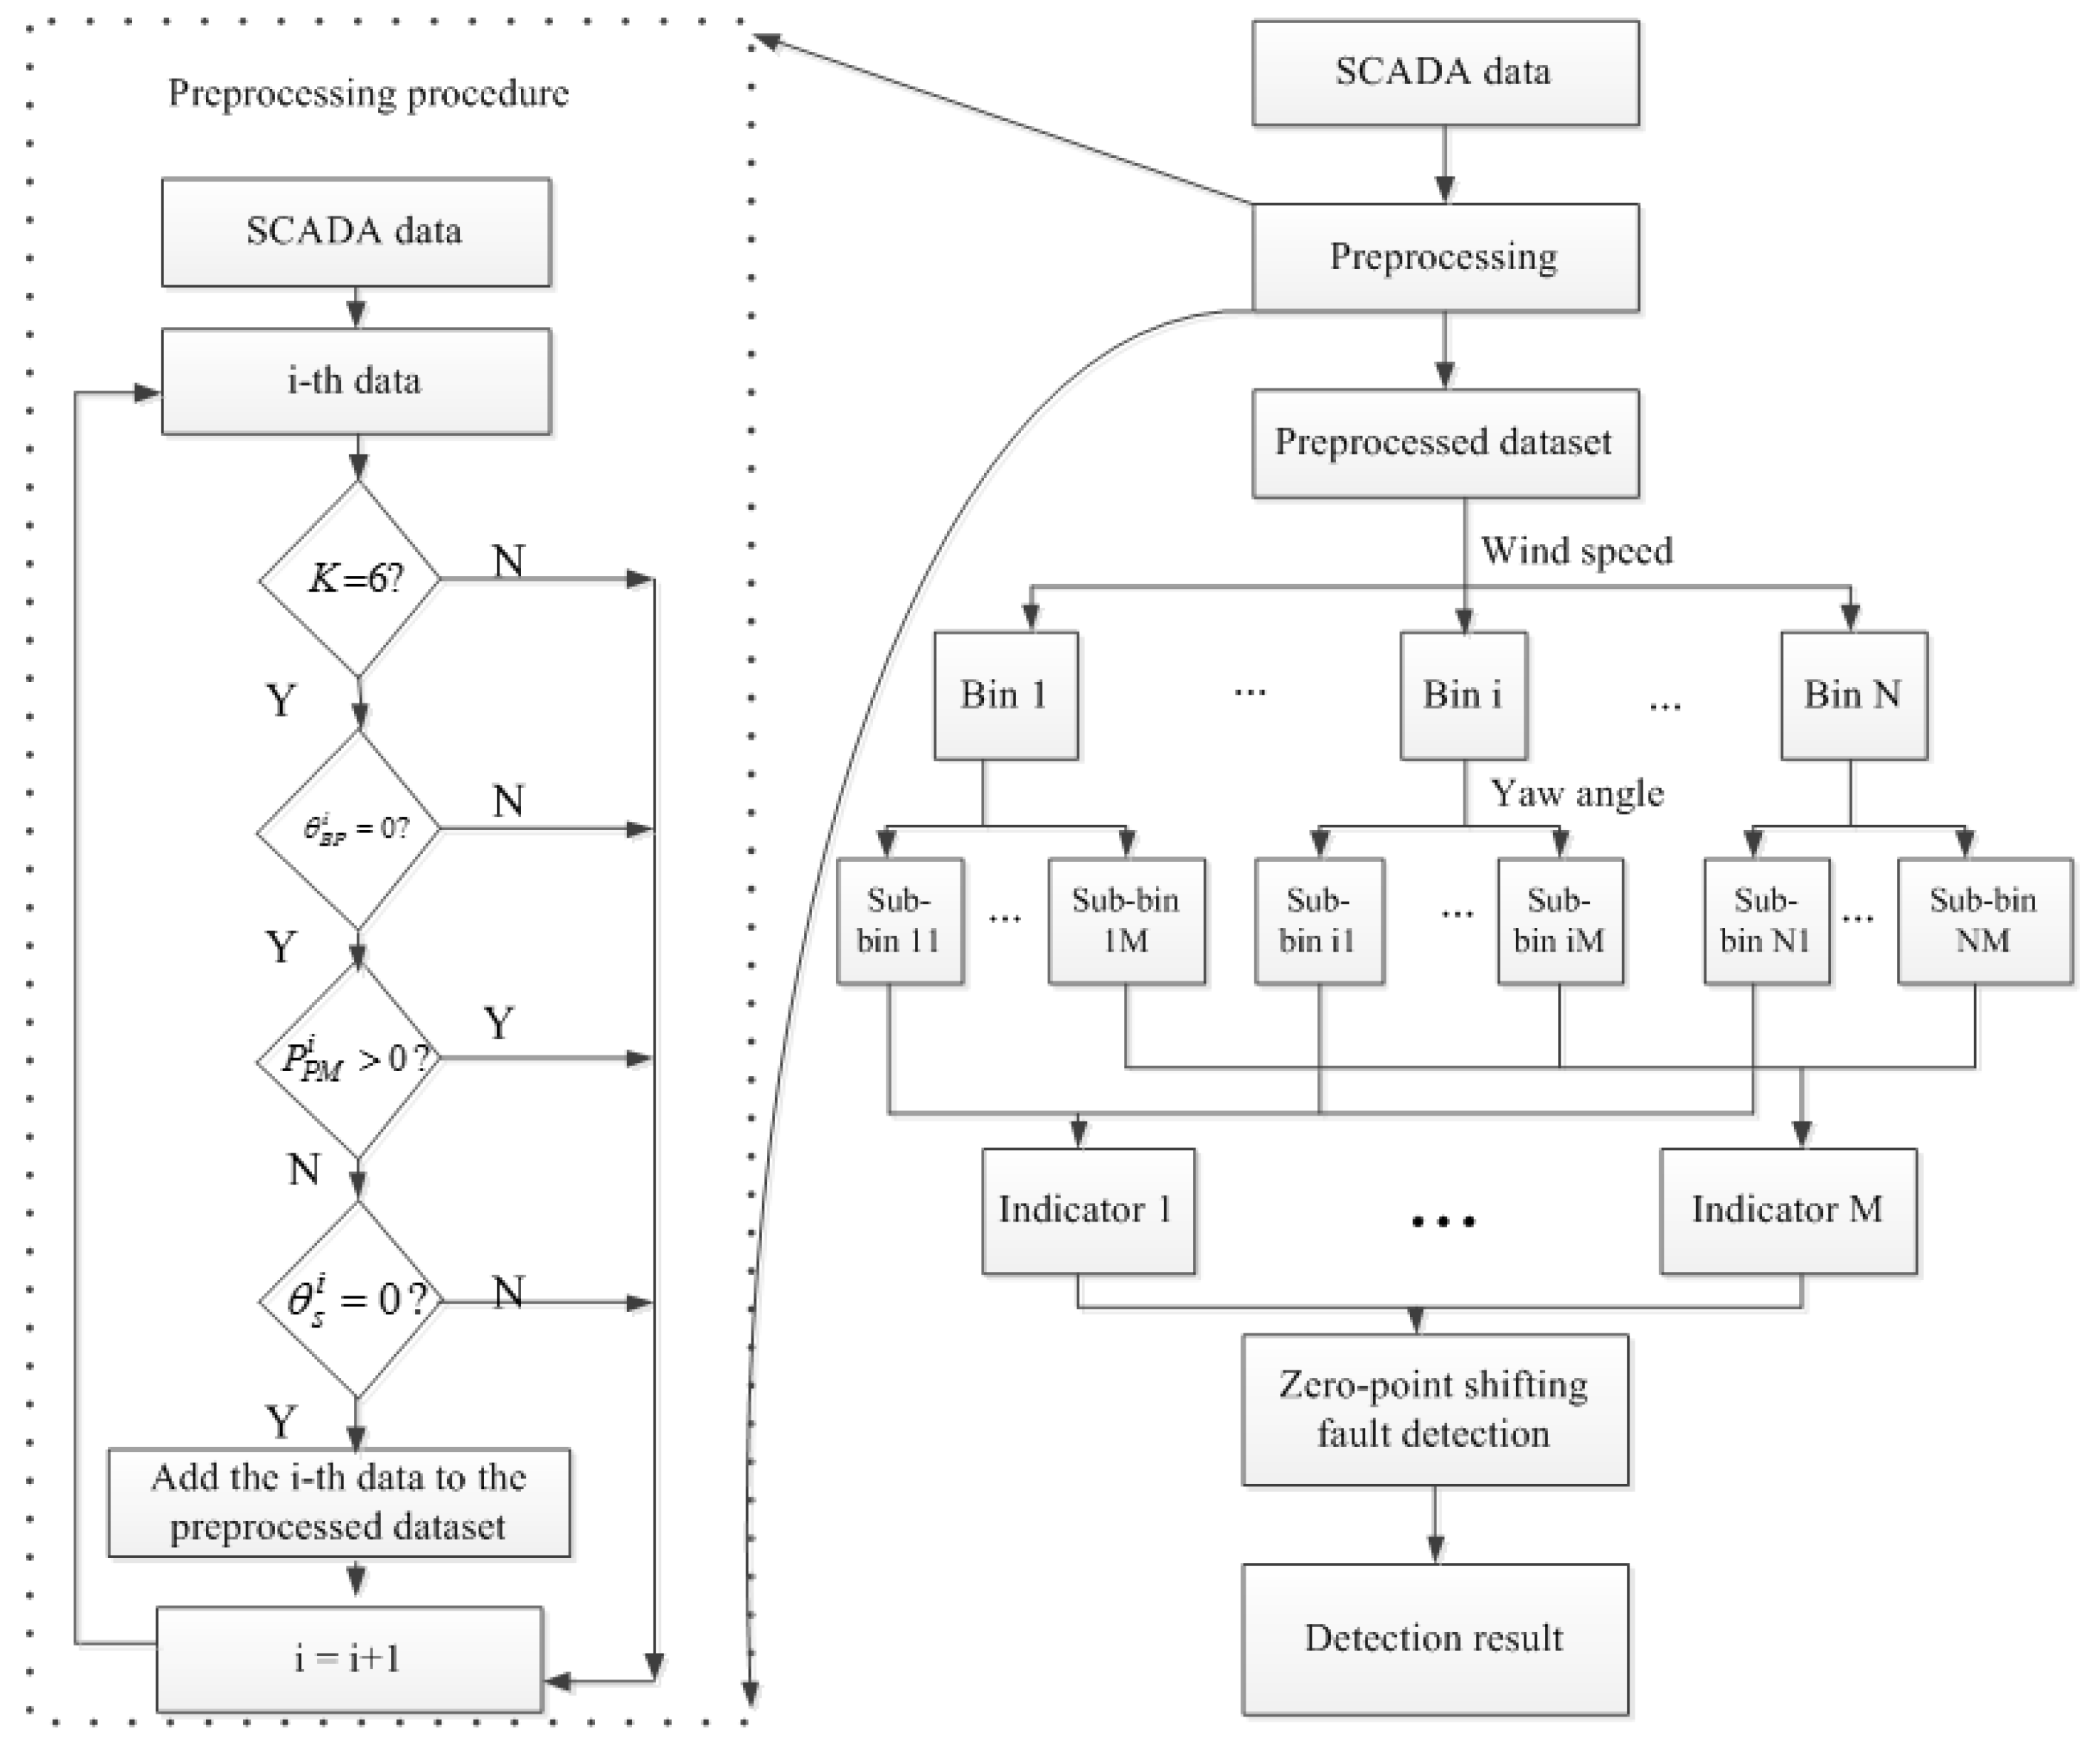
The overall structure of the proposed method is shown in Figure 5. Given the raw SCADA dataset , a preprocessing procedure is necessary to eliminate the influence of the blade pitch system and wind turbine operation mode on the performance of the wind turbine. In order to analyze the power performance more effectively, the SCADA data are partitioned into different bins by both wind speed and yaw angle. The data in the same bin have similar wind speed and yaw angle values. An indicator reflecting the power performance of each yaw angle is proposed in our work based on the partitioned data bins. The larger the indicator, the better is the power performance. The yaw angle value with the largest indicator value is considered as the yaw angle sensor zero-point shifting angle according Betz’s law. An alarm for a zero-shifting fault would be activated if the shifting angle is larger than . Details of each procedure will be shown in the next.
3.2. Data Preprocessing
As mentioned above, a data preprocessing procedure is necessary in the proposed method. In this work, the zero-point shifting fault is detected by comparing the values of the performance indicators of each data bin. The object of the data preprocessing is to eliminate the influence of the factors other than yaw angle on the power performance when calculating the performance indicator. Since the performance indicator is calculated based on the power performance, several factors influencing the wind turbine output are considered in the data preprocessing procedure.
According to the wind turbine control scheme, blade pitch angle is an important factor influencing the output of a wind turbine [19]. The blade pitch system is considered in this work for data preprocessing. Given a dataset, the data is filtered out if the blade pitch angle is not zero and the power of the pitch control motor is larger than zero. A pitch angle larger than zero means the power output of this wind turbine is regulated by the pitch angle, while a value for the power of the pitch control motor larger than zero means the wind turbine is in the operation of pitch controlling. Only data with zero pitch angle and zero pitch control motor power are selected for the purpose of eliminating the influences of the pitch system on power performance.
Yawing set value is the angle the blade plane can be rotated by the yaw control scheme. A non-zero yawing set value means the yaw control scheme is active and the wind turbine is still rotating. Therefore, data with a non-zero yawing set value are not stable and are thereby filtered out in the preprocessing procedure.
Finally, only the data when the wind turbine is in normal operation mode (K = 6) are selected for the detection method. Hence, the data collected when the operation mode parameter is not in the normal operation mode are also filtered out.
The preprocessing procedure mentioned above could be summarized as follows:
- Step 1:
- Given a datum, if the operation mode parameter is not 6, filter out this datum and go to the next datum. Otherwise go to Step 2.
- Step 2:
- If the blade pitch angle is not zero, filter out this datum and go to the next datum. Otherwise go to Step 3.
- Step 3:
- If the power of the pitch control motor is larger than zero, filter out this datum and go to next datum. Otherwise go to Step 4.
- Step 4:
- If the yawing set value is not zero, filter out this datum and go to next datum. Otherwise go to Step 5.
- Step 5:
- Add the processed data from Step 1 to Step 4 to the preprocessed dataset and go to next datum, until all the data are processed.
3.3. Zero-Point Shifting Fault Detection Based on the Preprocessed Dataset
Within the preprocessed dataset, the wind power data are only influenced by wind speed and yaw angle. The dataset is firstly partitioned into different bins according to the wind speed. The i-th bin of the dataset is shown in Equation (2), where is the minimum wind speed of the i-th bin. The wind speed step is set to be 0.2 m/s. In this way, the data in the same bin have very similar wind speeds (difference no larger than 0.2 m/s).
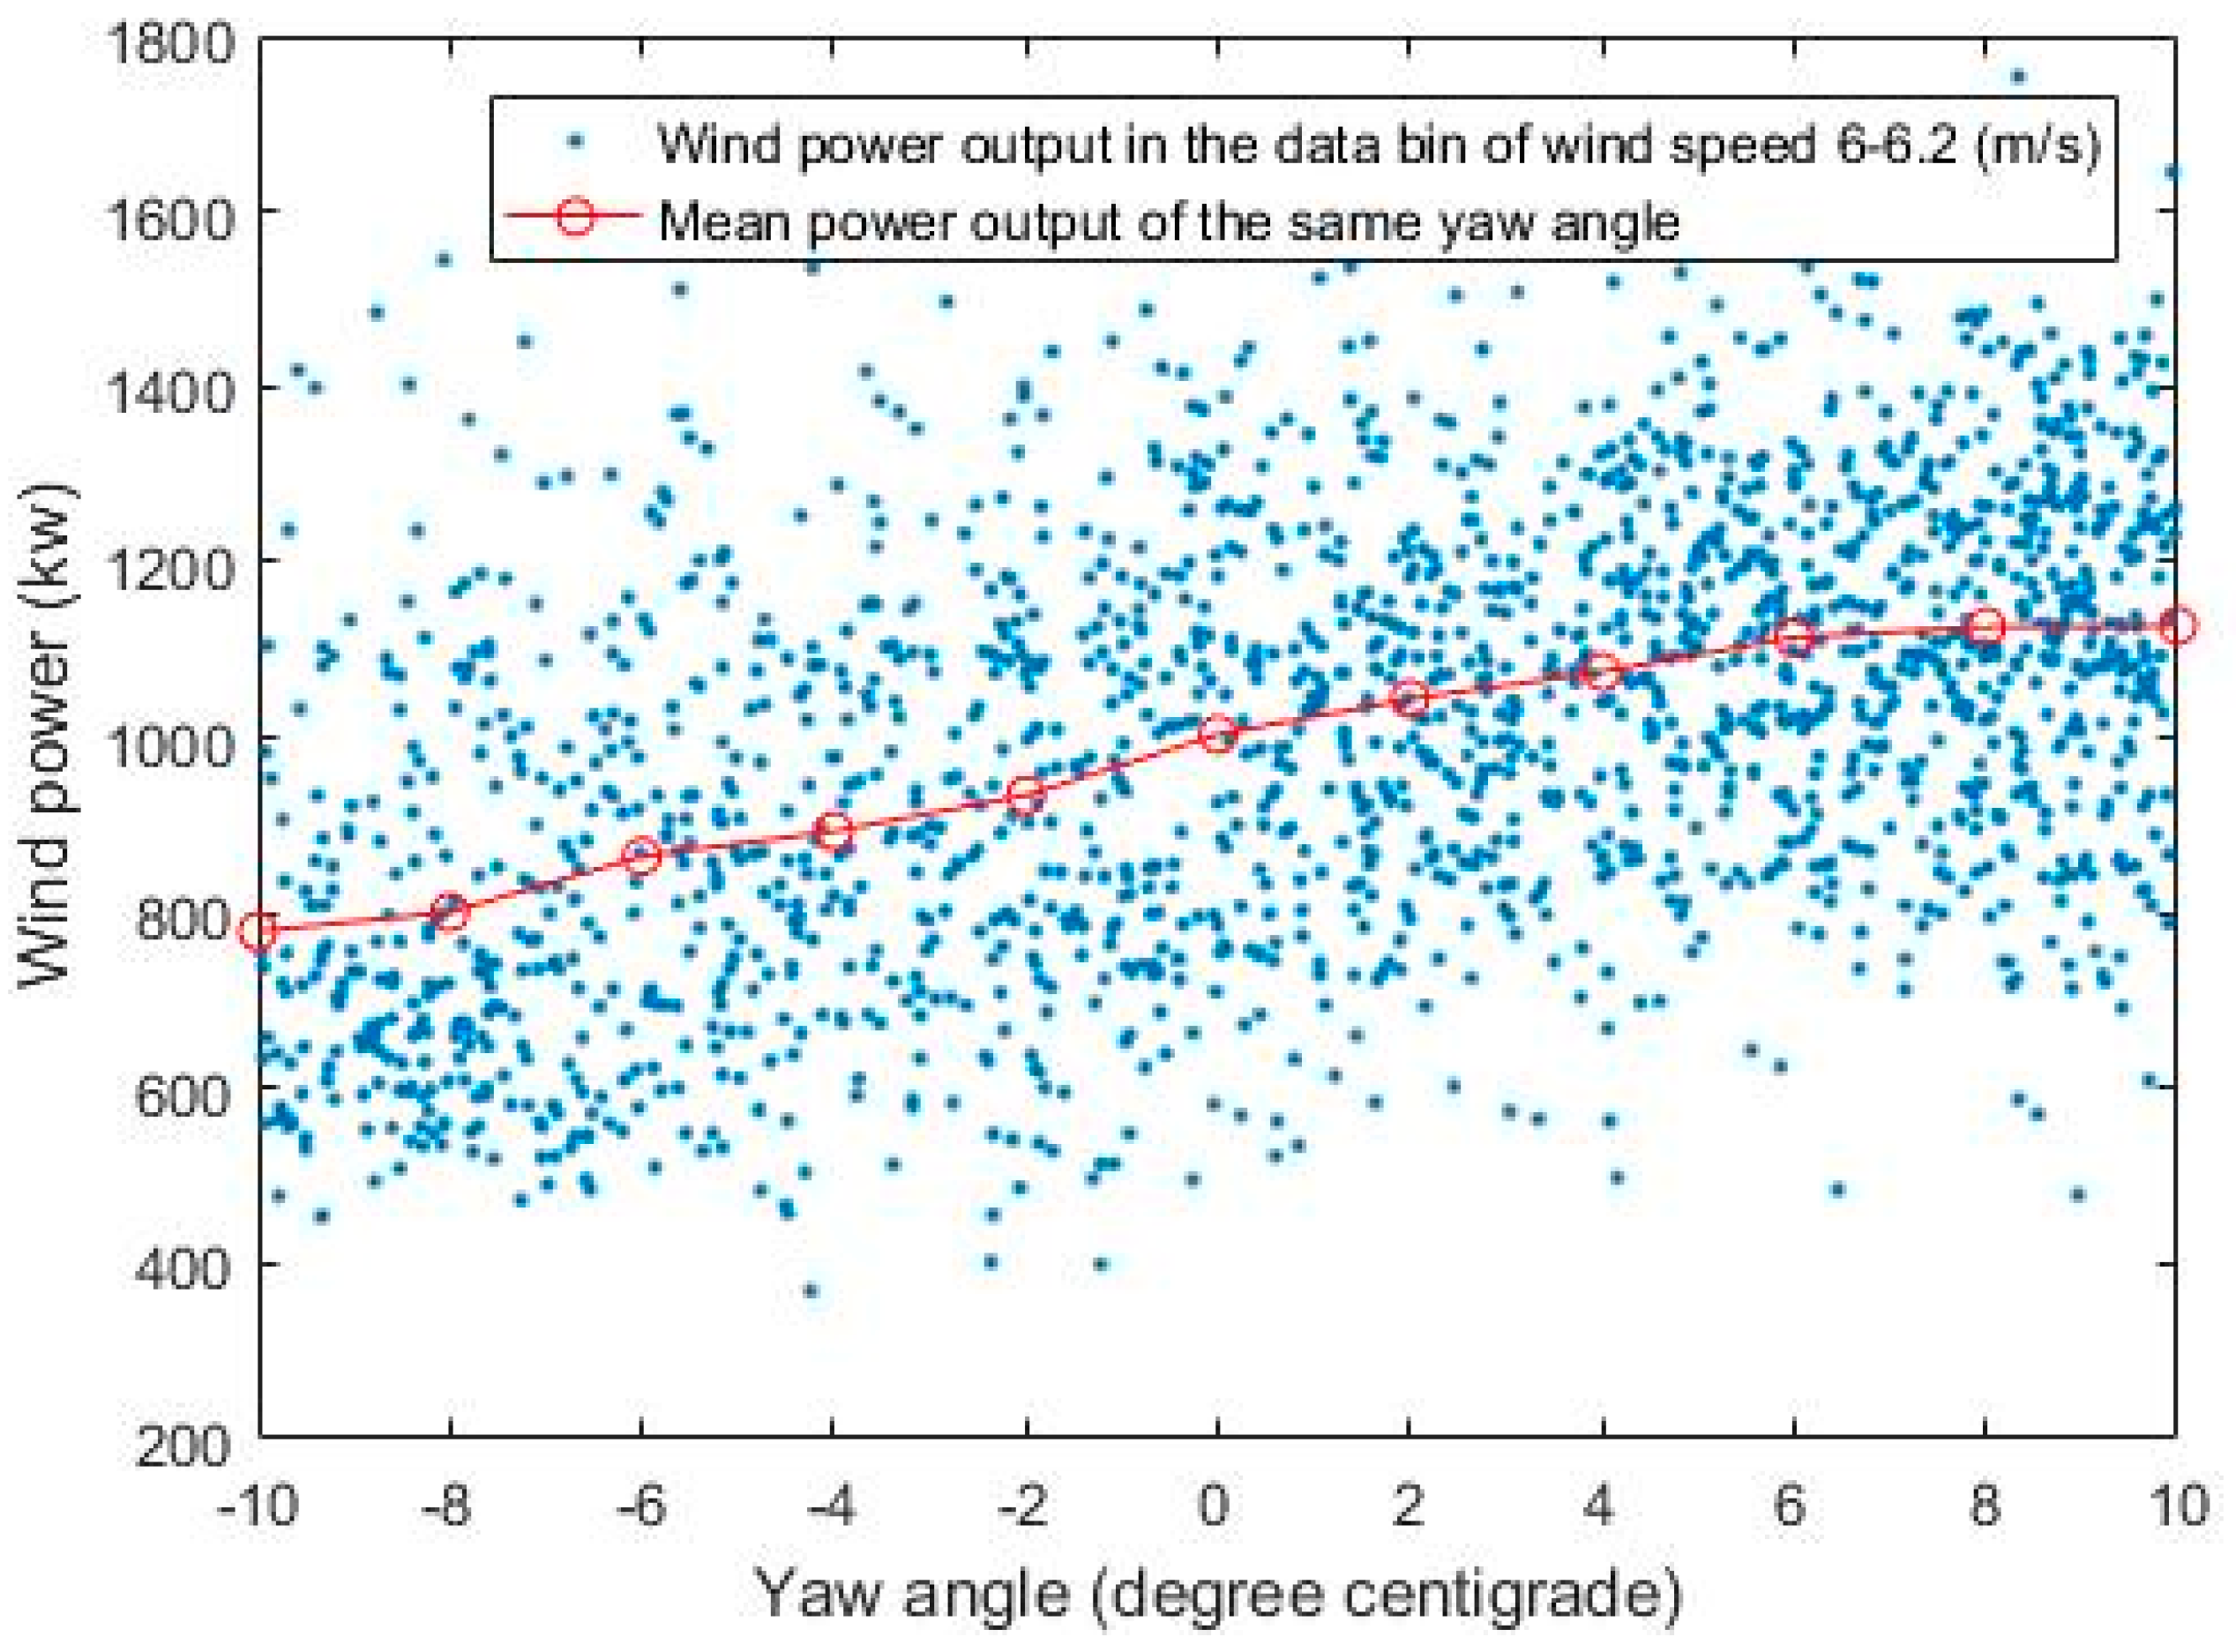
Wind power value is only influenced by yaw angle in the same bin, as shown in Figure 6. In order to obtain a statistical result of the relationship between wind power and yaw angle for each bin, each bin is further partitioned into different sub-bins according to the yaw angle value, as shown in Equation (3).
where is the minimum yaw angle of the j-th sub-bin. Since the accuracy of the yaw angle sensor is , the yaw angle step is set to be . The wind power data of each sub-bin are averaged to represent the statistical power performance of the sub-bin after noise processing by Pauta criterion, the red circle line as shown in Figure 6.
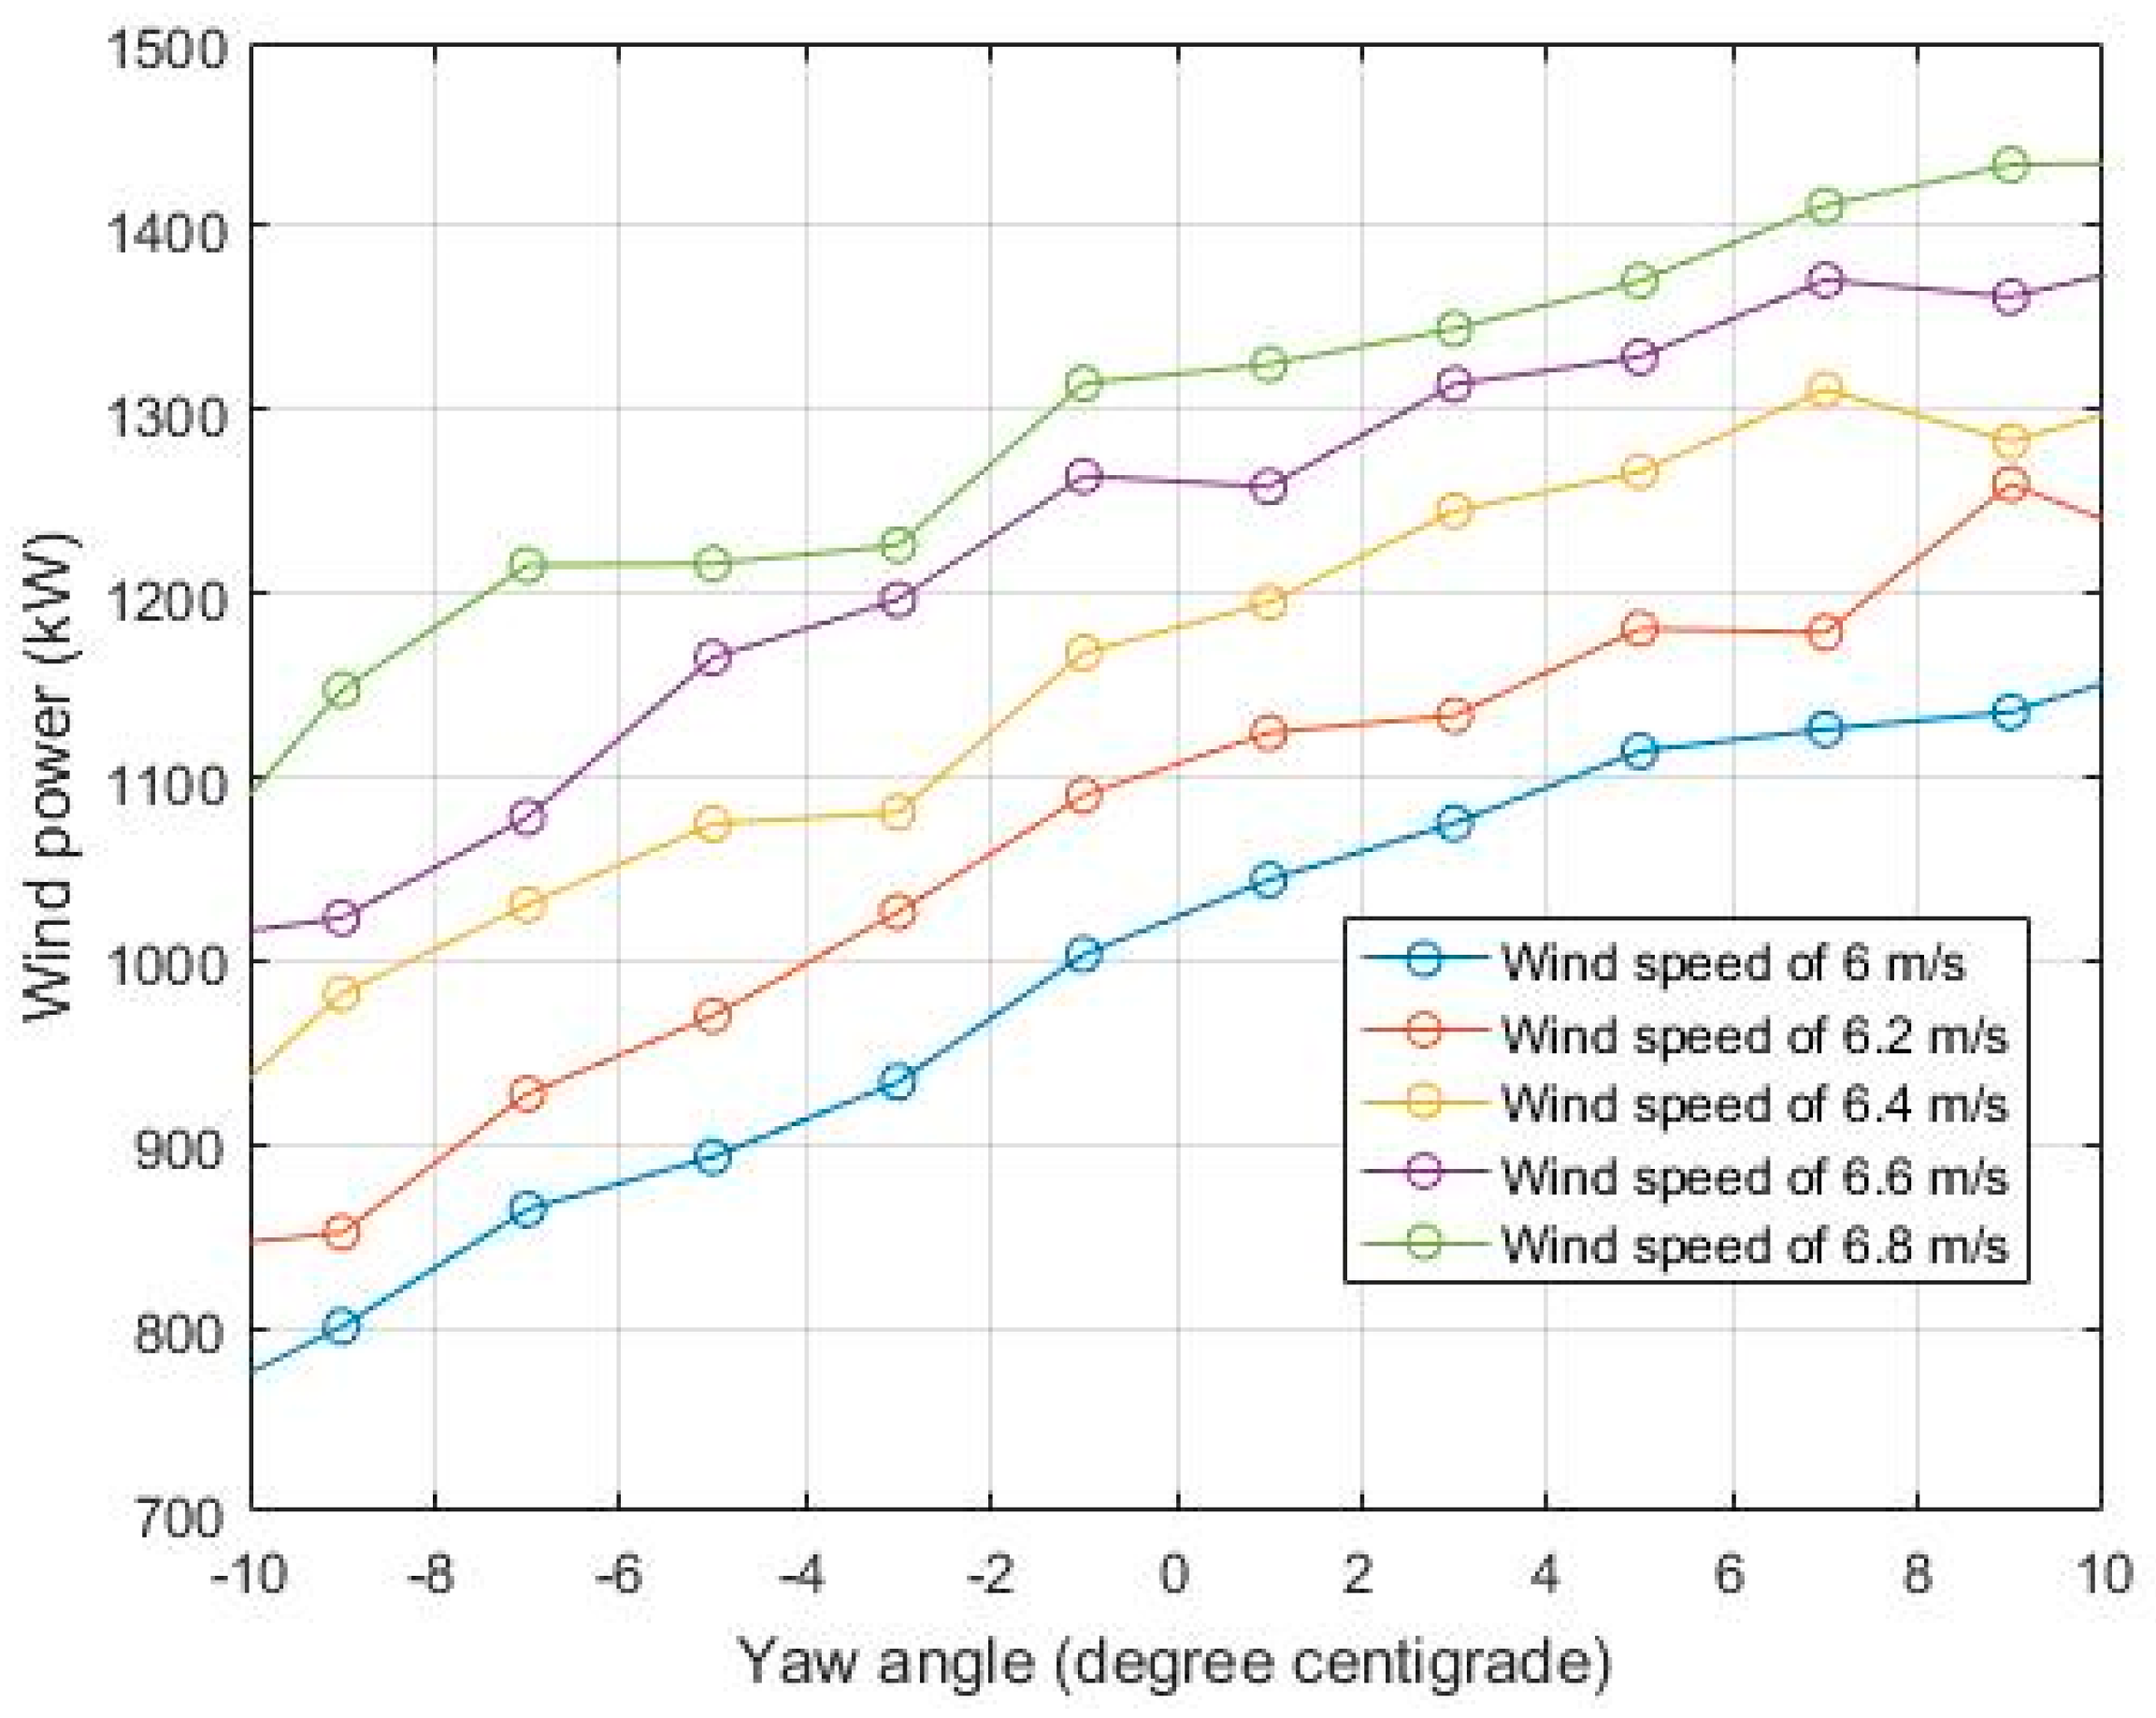
Figure 7 shows the statistical average power performance of a wind turbine corresponding to the measured yaw angle based on 7 days’ SCADA data. In order to clearly show the trend of the statistical power performance, only data with wind speed ranges from 6 m/s to 7 m/s are shown. It has to be noted that in real applications, wind speed ranges from 4 m/s to 8 m/s are considered, since the wind power output varies the most during this wind speed range.
The power performance should be the best when the yaw angle is zero (blade plane faces the wind direction perpendicularly). In order to identify the statistical power performance of each yaw angle, an indicator is calculated for each yaw angle. The indicator is defined as follows:
where is the number of wind speed bins and is the statistical performance as shown in the red circle line in Figure 6 and is calculated by:
The yaw angle with the largest indicator value is considered as the yaw angle zero-point shifting error. A zero-point shifting fault would be identified if this yaw angle is larger than or less than in this approach. It has to be noted that the outlier errors are eliminated by the Pauta criterion [20] for both Equations (4) and (5).
4. Case Studies and Discussions
4.1. Fault Detection Results of a Wind Farm in Hunan Province, China
The proposed approach has been applied in several wind farms to detect the yaw angle sensor zero-point shifting fault. One of the wind farms is located in Hunan province, China. The wind turbines in this farm are all manufactured by a Chinese manufacturer (Xiangtan Electric Manufacturing Group, Xiangtan City, China). The installed capacity of these wind turbines is 2 MW. The yaw measurement scheme is mentioned in Section 2.2, while the accuracy of the adopted yaw angle sensor is . The threshold value to activate the yaw control scheme is . Limited data from this wind farm are available with yaw angles outside the range of . Thus, only the data with yaw angles in the range of are considered and analyzed in this approach. The detection methods are validated by manual inspection. It needs to be noted that the validation results are only available for the wind turbines for which the yaw angle sensor is detected to be faulty by the proposed method. This is because only the wind turbines with detected faults are inspected by engineers of the wind farm due to the cost of maintenance and the difficulties of accessing the yaw angle sensor.
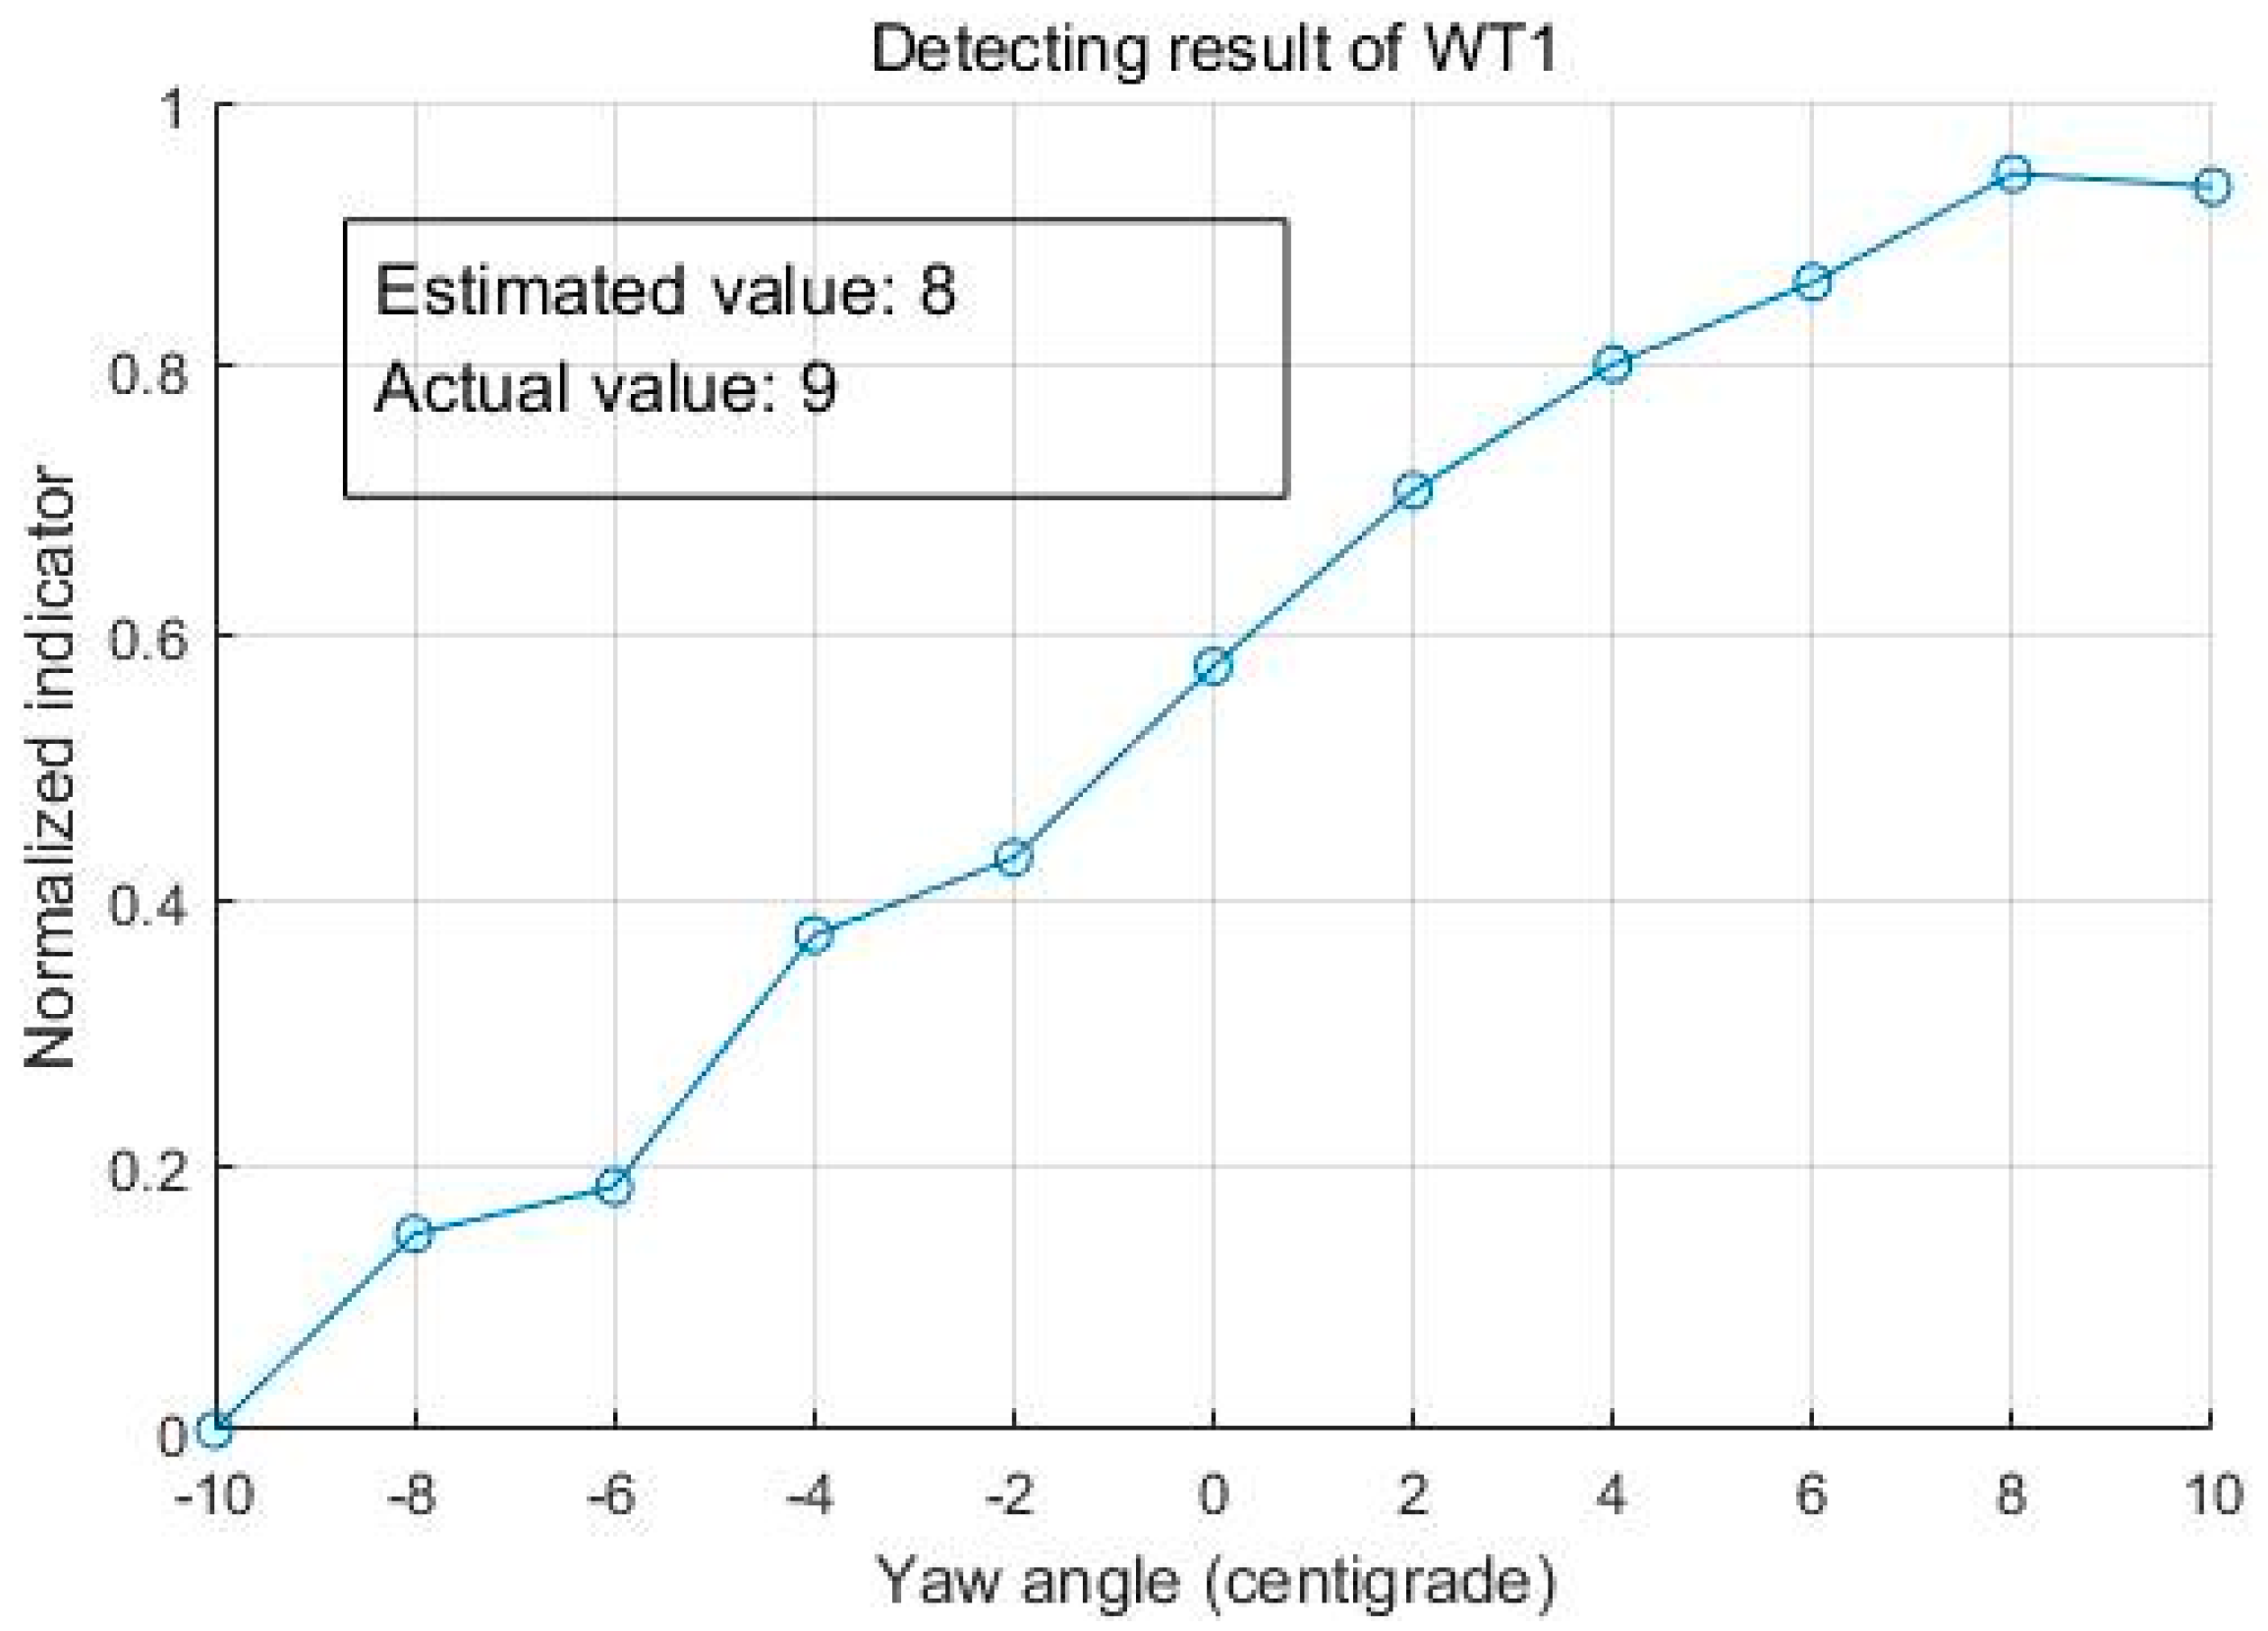
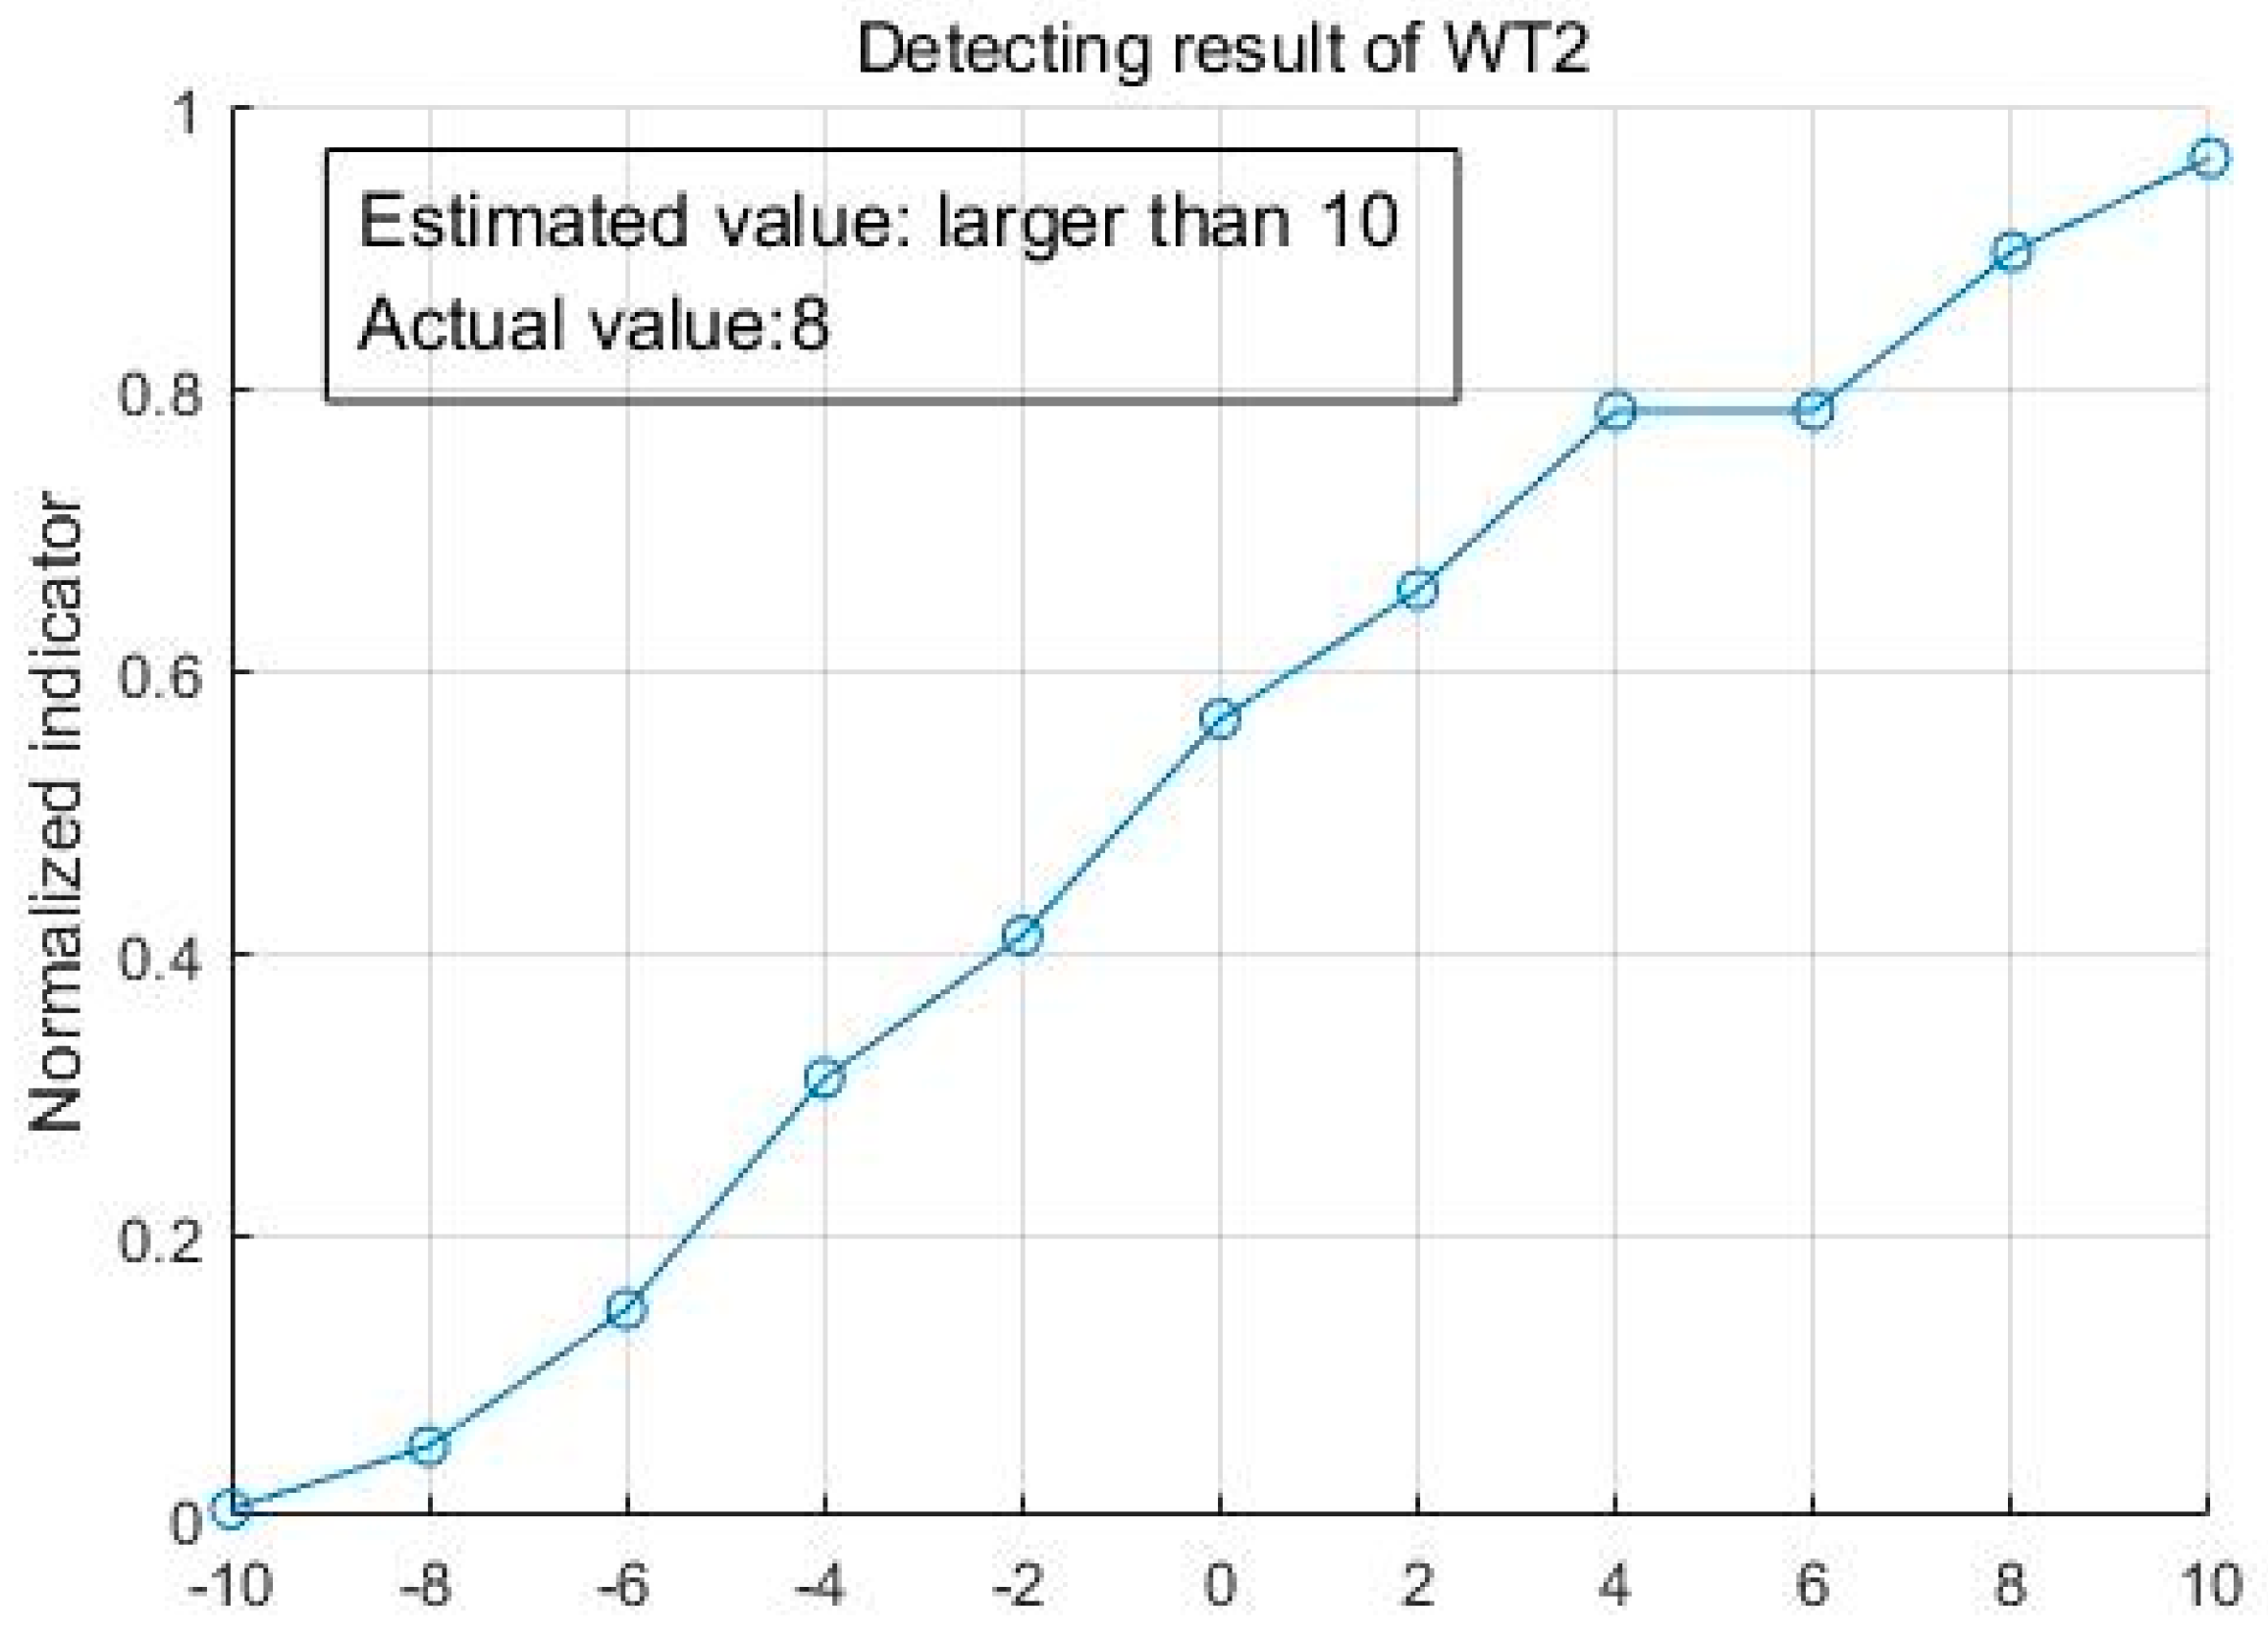
For this wind farm, two wind turbines are detected to have yaw angle sensor zero-point shifting faults. These two wind turbines are denoted as WT1 and WT2 in this paper. Figure 8 and Figure 9 show the normalized indicators of WT1 and WT2, respectively.
As can be seen in Figure 8, the yaw angle with the largest indicator value is , a fault alarm was activated for WT1 based on the definition of the zero-point shifting fault. The actual angle of zero-point shifting was by manual inspection for WT1. Similarly, the zero-point shifting angle of WT2 was detected to be larger than while the actual value is . Thus, the proposed method effectively detected the yaw angle sensor zero-point shift faults for the two wind turbines.
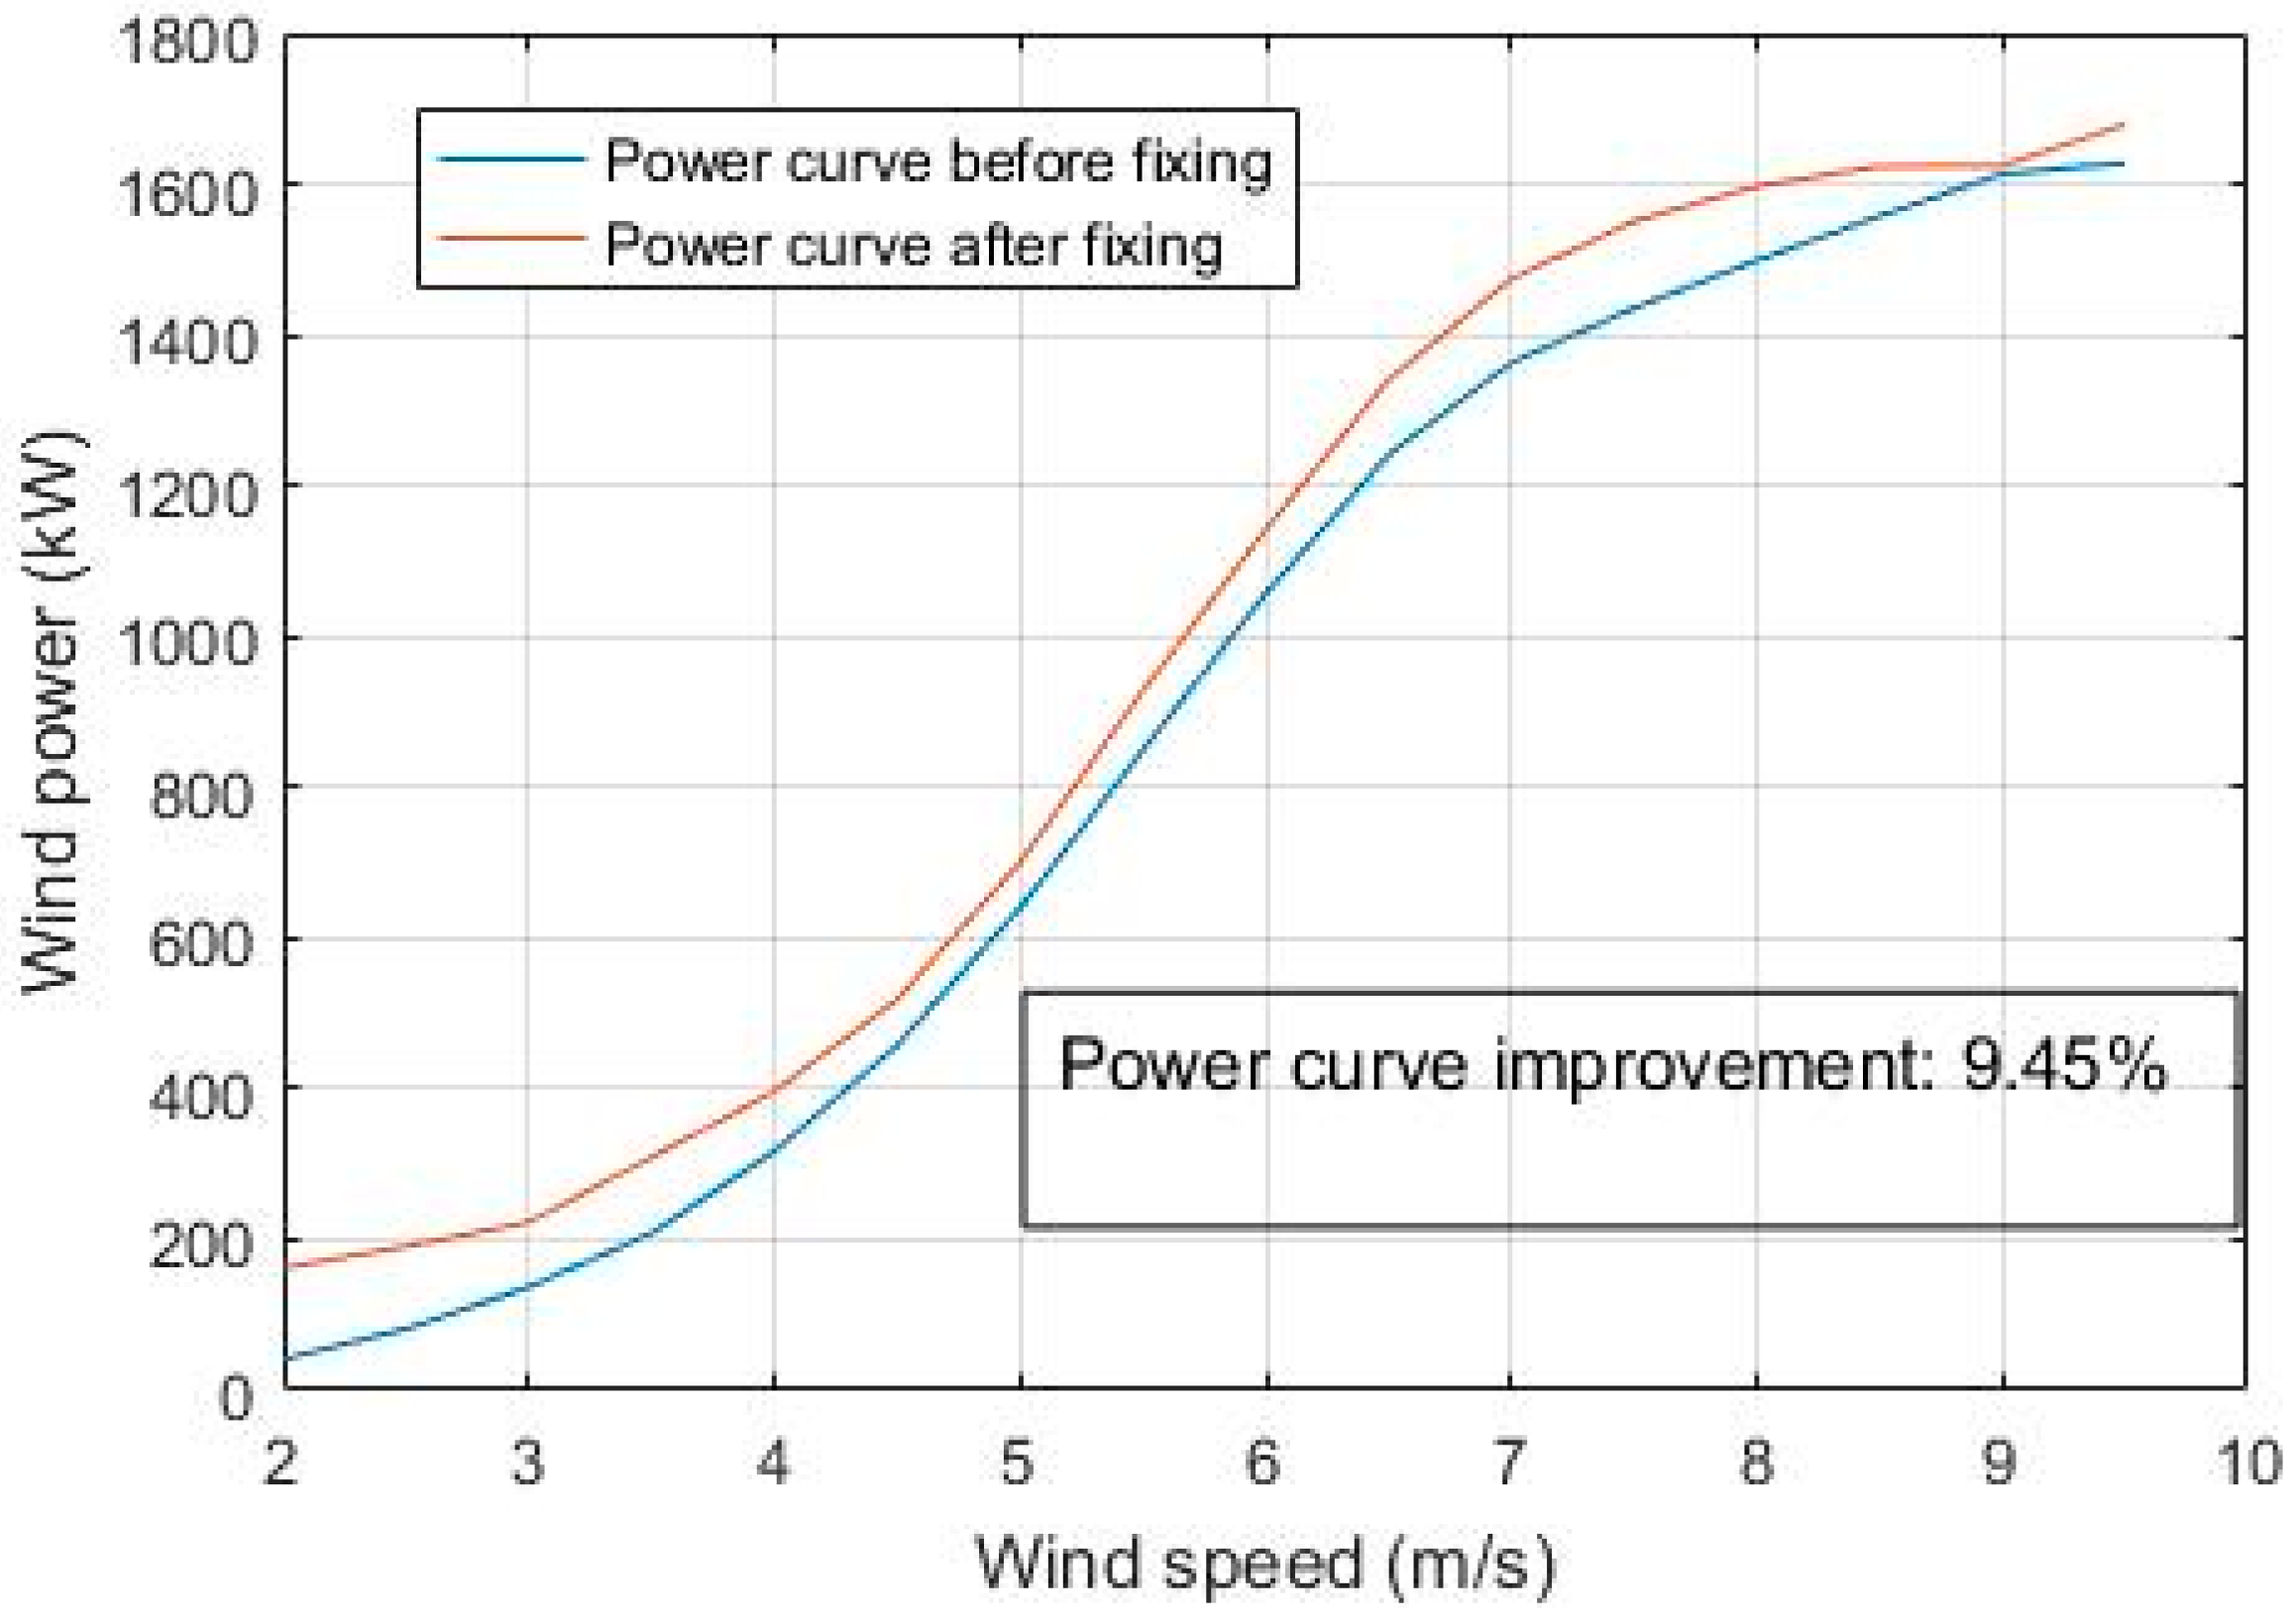
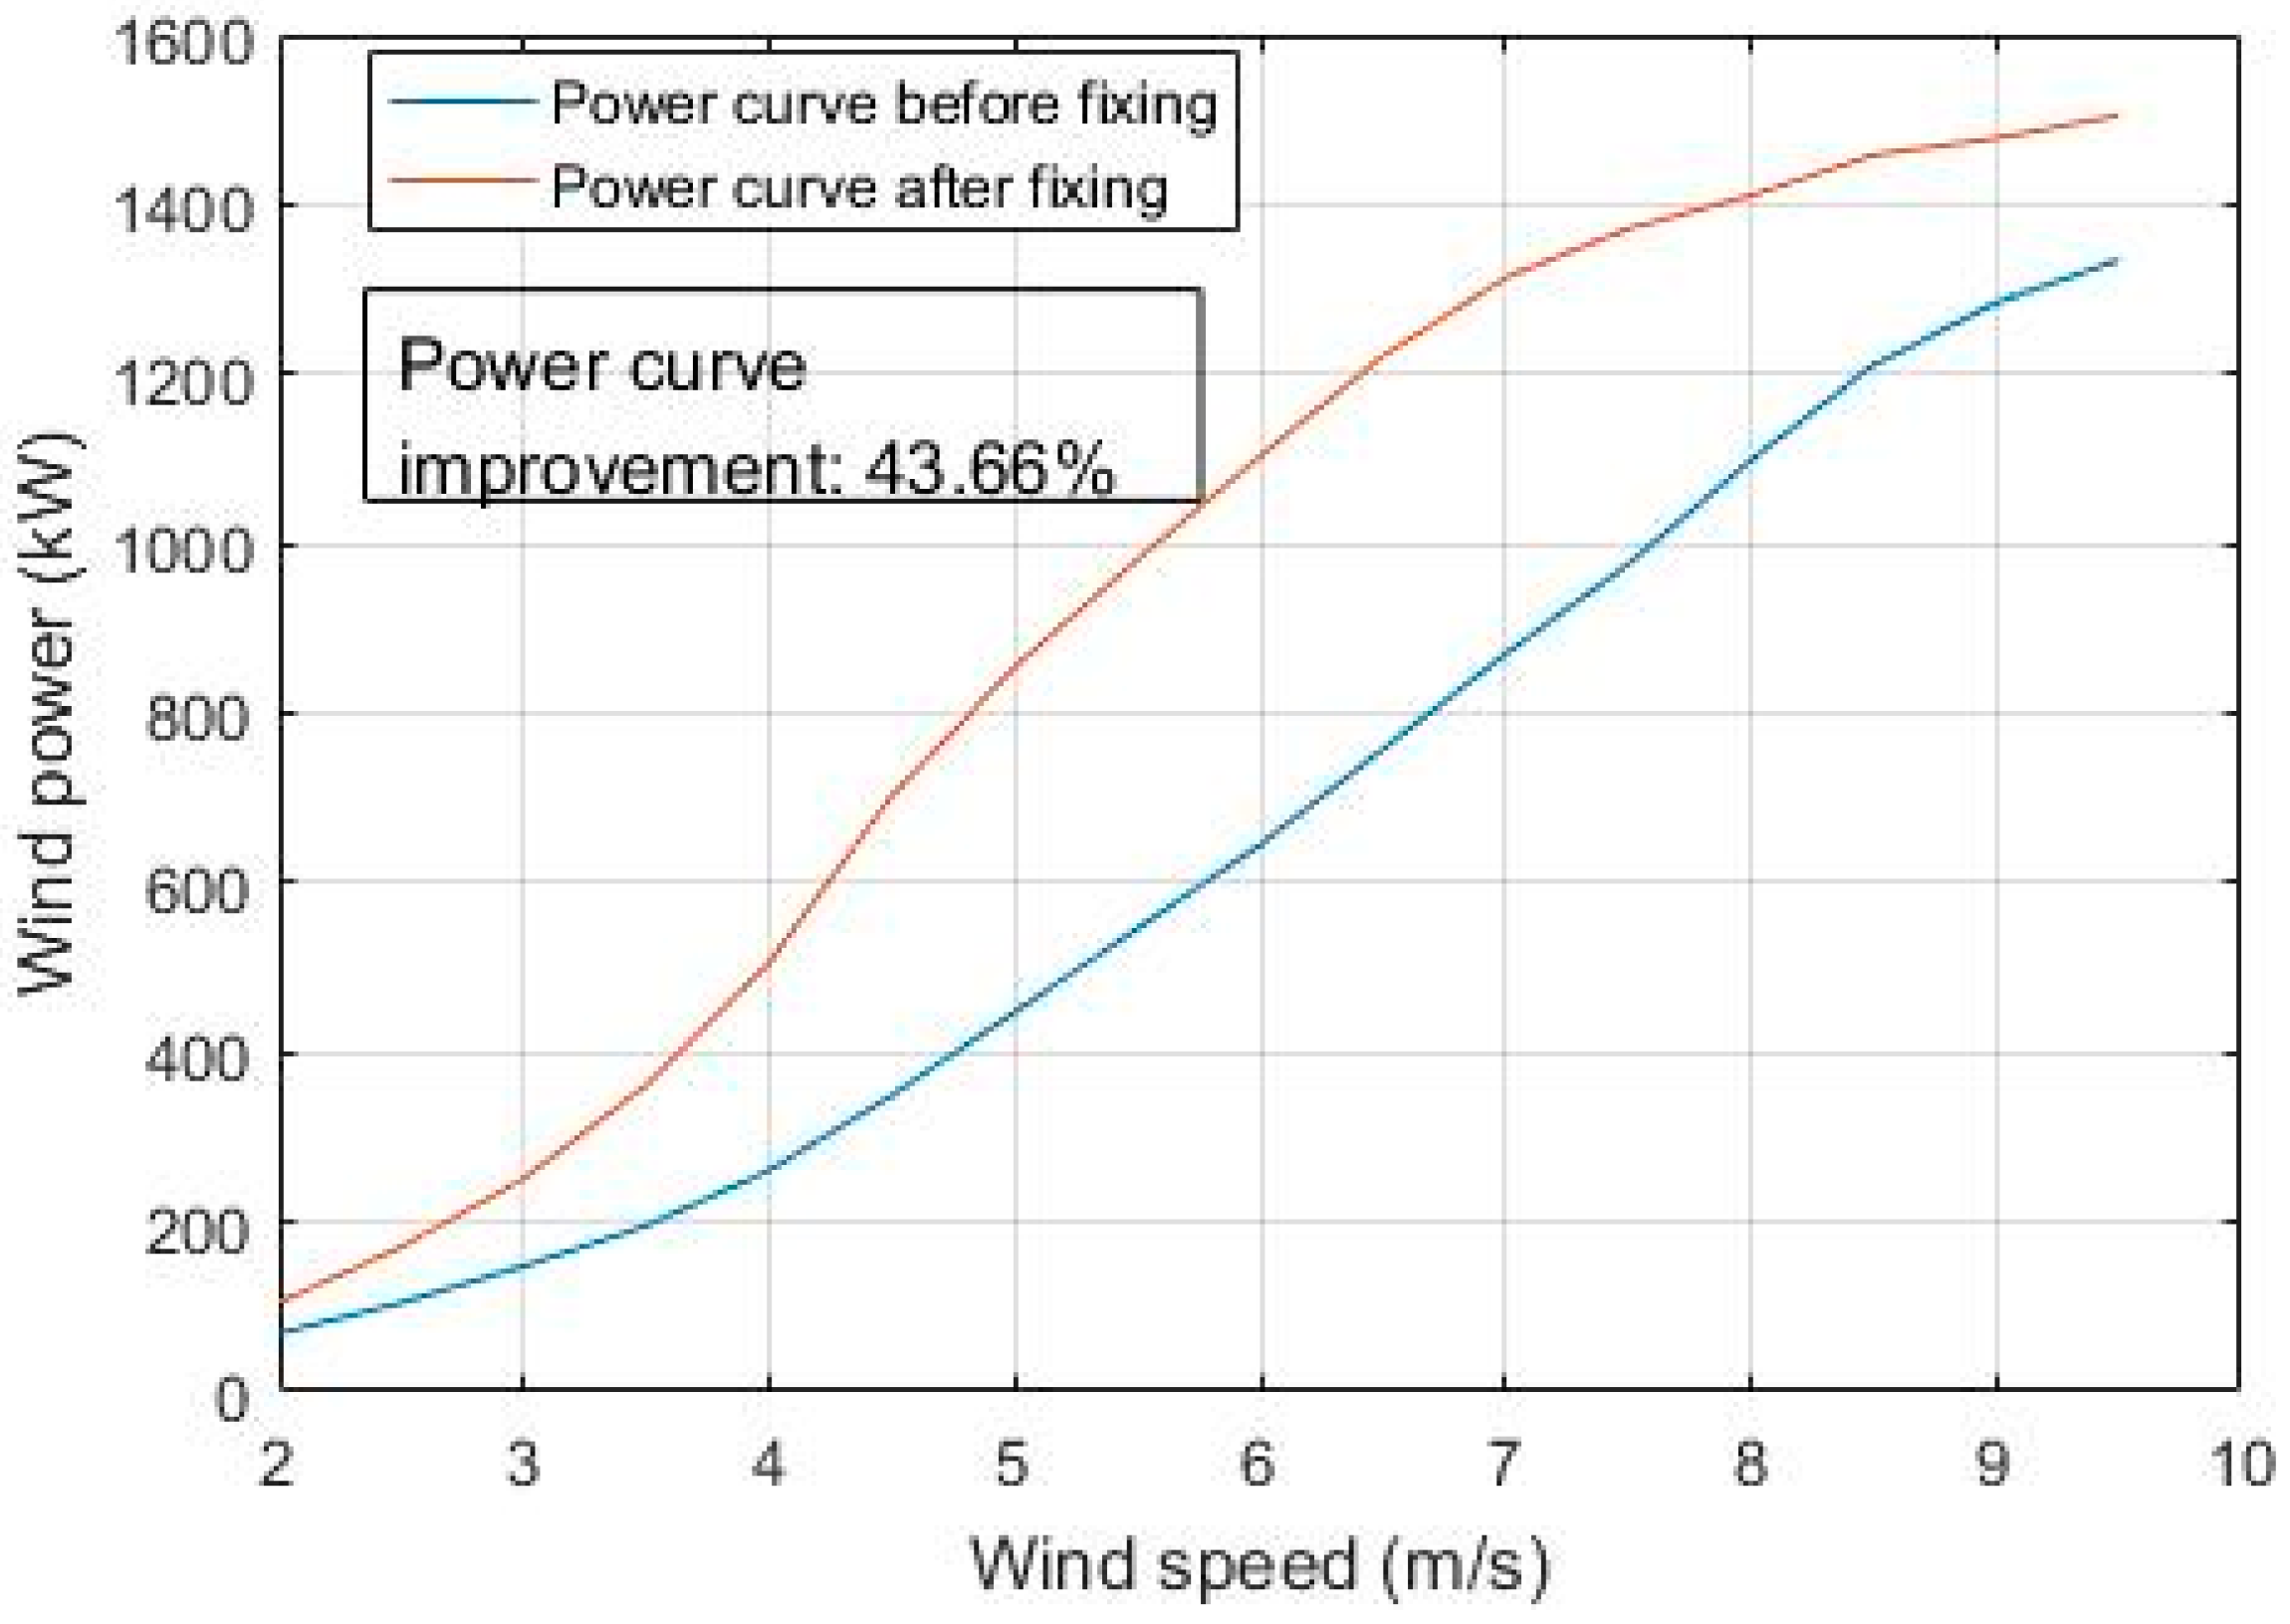
Yaw angle sensors on both of the two wind turbines have been adjusted by engineers according to the results of our method. In order to evaluate the effectiveness of improving the wind turbine performance by adjusting the yaw angle sensor, comparisons between power curves 7 days before and 7 days after adjustment were conducted, as shown in Figure 10 and Figure 11. The improvement of the power curve is calculated by:
where is the i-th power value according to the International Electrotechnical Commission (IEC) standard for the data after the WT was fixed by engineers, while is the i-th power value for the data before fixing. The power curve values are generated according to the IEC standard [21].
It can be observed that after fixing the yaw angle sensor, the power curve could be significantly improved by as much as 9.45% for WT1 and 43.66% for WT2. This means the result of the proposed method is useful for wind turbine yaw angle sensor zero-point shifting fault detection and also for improvement of the wind turbine performance.
4.2. More Results of the Proposed Method
The proposed method was applied to three more wind farms to detect the zero-point shifting fault. Five of the total 72 wind turbines were detected as having a zero-point shifting fault. The manual inspection results and power curve improvements are shown in Table 3.
The proposed method detected four of the faults accurately, while giving a false fault alarm for only one wind turbine. Furthermore, the power curves of the wind turbines were all improved by fixing the yaw angle sensor zero-point.
4.3. Discussions
The conclusion could be drawn based on the validation data that the proposed method could be useful for yaw angle sensor zero-point fault detection and is also effective for improving the power performance of a wind turbine.
However, the proposed approach only provides qualitative detection results for yaw angle sensors’ zero-point position. It is difficult to obtain a precise estimation of the zero-point shifting angle, since the yaw angle resolution is only . Furthermore, the data with a yaw angle out of the range of is rare. Hence, it is difficult to obtain a quantitative result of zero-point shifting angle based on the dataset if the angle is out of the range of .
There are several directions for future studies that could improve the proposed method:
- (a).
- The effectiveness of the proposed method was proved for the wind turbines with zero-point shifting fault. However, the actual condition of the yaw angle sensors which were detected as normal were not inspected manually due to the cost of maintenance and the difficulties of accessing the yaw angle sensor. The effectiveness of the proposed method could be further evaluated if more wind turbines are inspected manually.
- (b).
- The threshold in the definition of zero-point shifting fault is set as in this work. This threshold value could be further evaluated in the operation of wind farms, and could be adjusted in order to further reduce the maintenance cost and wind farm production loss.
- (c).
- Since the accuracy of the adopted yaw angle sensor is , the yaw angle resolution in the method is currently . It is difficult to obtain a precise estimation of zero-point shifting angle quantitatively. This work could be extended to provide the exact zero-point shifting angle if a more accurate yaw angle sensor is adopted.
5. Conclusions
Wind turbine yaw control systems play an important role in improving the wind power production of a wind turbine and mitigating the fatigue loads on the blades. An effective yaw control of a wind turbine is based on accurate measurement of the yaw angle sensor mounted on the nacelle of the wind turbine. However, the zero-point of the sensor might deviate from the correct position due to an error in installation or due to operation under harsh environmental conditions.
In order to provide the wind farm operators clear evidence of the yaw angle measurement reliability, the yaw angle measurement error was qualitatively evaluated in this paper to determine the extent of zero-point shifting. With the aim of evaluating the zero-point shifting error qualitatively, the yaw angle sensor zero-point shifting fault was firstly defined in this paper. The definition of the zero-point shifting fault could be a reasonable indication for timely and cost-effectively maintenance of the yaw angle sensor. An on-line data-driven method based on SCADA data was proposed accordingly to detect the zero-point fault for wind turbine yaw angle sensors. The proposed method is based on analyzing the power performance under different yaw angles. In order to deeply analyze the power performance, the SCADA data was partitioned into different bins with the object that all the data share similar wind speed and yaw angle values in a same bin. An indicator was then proposed in this method to evaluate the power performance under each yaw angle. The yaw angle with the largest indicator was considered as the yaw angle measurement error in our work. A zero-point shifting fault alarm would be triggered if this error is larger than a predefined threshold, i.e., ±8°in the current work. The effectiveness of the proposed method was proven by the wind turbines from four wind farms. The validation results show that the proposed method could effectively detect the zero-point shifting fault and be effective in improving the performance of wind turbines. The future directions that could be studied to improve the proposed method were also discussed in the paper.
Acknowledgments
This work is supported by the National Natural Science Foundation of China (No. 61573046) and Program for Changjiang Scholars and Innovative Research Team in University (No. IRT1203).
Author Contributions
Yan Pei and Zheng Qian conceived and designed the experiments; Yan Pei and Bo Jing performed the experiments; Dahai Kang and Lizhong Zhang analyzed the data; Yan Pei wrote the paper.
Conflicts of Interest
The authors declare no conflict of interest.
References
- Girsang, I.P.; Dhupia, J.S. Pitch controller for wind turbine load mitigation through consideration of yaw misalignment. Mechatronics 2015, 32, 44–58. [Google Scholar] [CrossRef]
- Bowen, A.J.; Zakay, N.; Ives, R.L. The field performance of a remote 10 kW wind turbine. Renew. Energy 2003, 28, 13–33. [Google Scholar] [CrossRef]
- Salem, A.A.; Abu-Siada, A.; Islam, S. Condition Monitoring Techniques of the Wind Turbines Gearbox and Rotor. Mark Twain J. 2014, 2, 53–56. [Google Scholar] [CrossRef]
- Jeong, M.S.; Kim, S.W.; Lee, I.; Yoo, S.J.; Park, K.C. The impact of yaw error on aeroelastic characteristics of a horizontal axis wind turbine blade. Renew. Energy 2013, 60, 256–268. [Google Scholar] [CrossRef]
- Cortina, G.; Sharma, V.; Calaf, M. Investigation of the incoming wind vector for improved wind turbine yaw-adjustment under different atmospheric and wind farm conditions. Renew. Energy 2017, 101, 376–386. [Google Scholar] [CrossRef]
- Wu, Z.; Wang, H. Research on Active Yaw Mechanism of Small Wind Turbines. Energy Procedia 2012, 16, 53–57. [Google Scholar] [CrossRef]
- Tian, W.; Vanzwieten, J.H.; Pyakurel, P.; Li, Y. Influences of yaw angle and turbulence intensity on the performance of a 20 kW in-stream hydrokinetic turbine. Energy 2016, 111, 104–116. [Google Scholar] [CrossRef]
- Dai, L.; Zhou, Q.; Zhang, Y.; Yao, S.; Kang, S.; Wang, X. Analysis of wind turbine blades aeroelastic performance under yaw conditions. J. Wind Eng. Ind. Aerodyn. 2017, 171, 273–287. [Google Scholar] [CrossRef]
- Rijanto, E.; Muqorobin, A.; Nugraha, A.S. Design of a yaw positioning control system for 100 kW horizontal axis wind turbines based on on/off control with dead band and hysteresis. Int. J. Appl. Eng. Res. 2012, 6, 2327–2340. [Google Scholar]
- Chen, F.Q.; Yang, J.M. Fuzzy PID controller used in yaw system of Wind Turbine. In Proceedings of the International Conference on Power Electronics Systems and Applications, Hong Kong, China, 20–22 May 2009; pp. 1–4. [Google Scholar]
- Ouyang, T.; Kusiak, A.; He, Y. Predictive model of yaw error in a wind turbine. Energy 2017, 123, 119–130. [Google Scholar] [CrossRef]
- Yesilbudak, M.; Sagiroglu, S.; Colak, I. A novel intelligent approach for yaw position forecasting in wind energy systems. Int. J. Electr. Power. 2015, 69, 406–413. [Google Scholar] [CrossRef]
- Sheibat-Othman, N.; Othman, S.; Tayari, R.; Sakly, A.; Odgaard, P.F.; Larsen, L.F.S. Estimation of the wind turbine yaw error by support vector machines. IFAC PapersOnLine 2015, 48, 339–344. [Google Scholar] [CrossRef]
- Naveen, P.; Ing, W.K.; Danquah, M.K.; Sidhu, A.S.; Abu-Siada, A. Cloud computing for energy management in smart grid—An application survey. IOP Conf. Ser. Mater. Sci. Eng. 2016, 121, 12010. [Google Scholar] [CrossRef]
- Masoum, A.S.; Hashemnia, N.; Abu-Siada, A.; Masoum, M.A.S.; Islam, S.M. Performance evaluation of on-line transformer winding short circuit fault detection based on instantaneous voltage and current measurements. In Proceedings of the 2014 IEEE PES General Meeting|Conference & Exposition, National Harbor, MD, USA, 27–31 July 2014; pp. 1–5. [Google Scholar]
- Eren, H.; Hatipoglu, D. Security issues and quality of service in real time wireless PLC/SCADA process control systems. In Proceedings of the 2008 IEEE Sensors Applications Symposium, Atlanta, GA, USA, 12–14 Feburary 2008; pp. 161–165. [Google Scholar]
- Song, D.; Yang, J.; Fan, X.; Liu, Y.; Liu, A.; Chen, G.; Joo, Y.H. Maximum power extraction for wind turbines through a novel yaw control solution using predicted wind directions. Energy Convers. Manag. 2018, 157, 587–599. [Google Scholar] [CrossRef]
- Rauh, A.; Seelert, W. The Betz optimum efficiency for windmills. Appl. Energy 1984, 17, 15–23. [Google Scholar] [CrossRef]
- Kusiak, A.; Zheng, H.; Song, Z. Power optimization of wind turbines with data mining and evolutionary computation. Renew. Energy 2010, 35, 695–702. [Google Scholar] [CrossRef]
- Gao, Z.; Liu, B.; Gao, H.; Meng, X.; Tang, C.; Wu, X.; Huang, Z.H. The correlation between the cylinder pressure and the ion current fitted with a Gaussian algorithm for a spark ignition engine fuelled with natural-gas-hydrogen blends. Proc. Inst. Mech. Eng. Part D J. Automob. Eng. 2014, 228, 1480–1490. [Google Scholar] [CrossRef]
- IEC. 61400-12-1: Power Performance Measurements of Electricity Producing Wind Turbines; IEC: Geneva, Switzerland, 2006. [Google Scholar]
Figure 1.
Yaw angle measurement scheme.
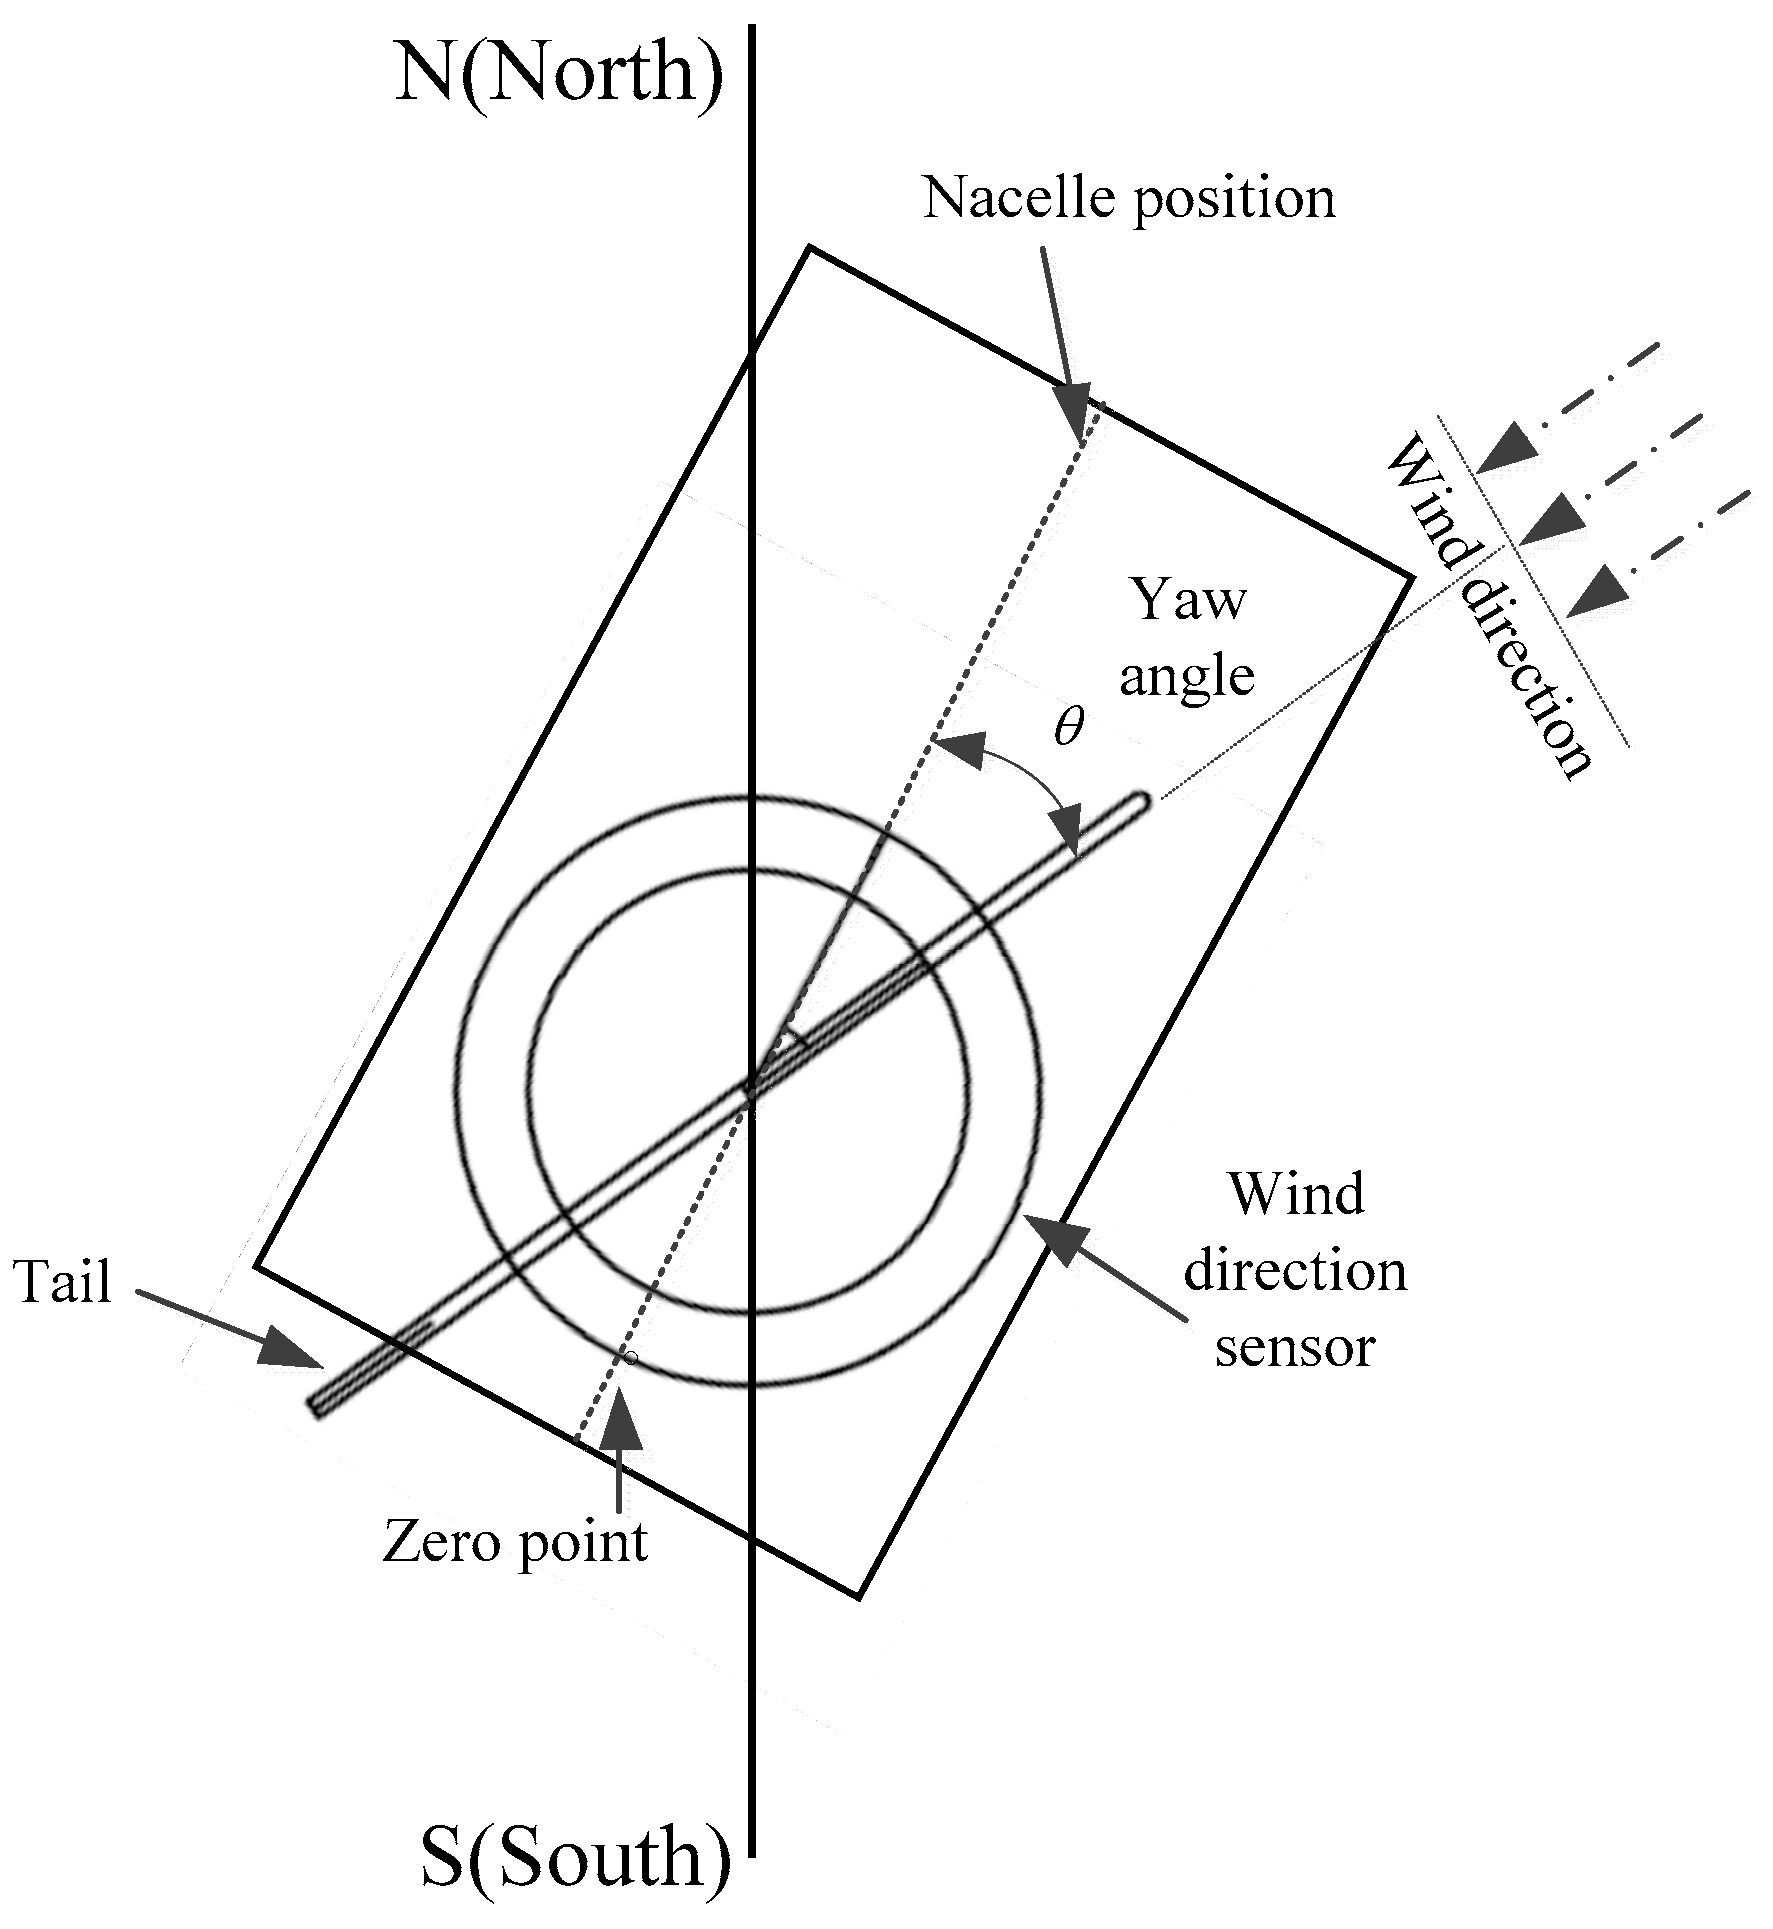
Figure 2.
Diagram of the wind direction sensor.

Figure 3.
Yaw angle measurement with zero-point shifting.
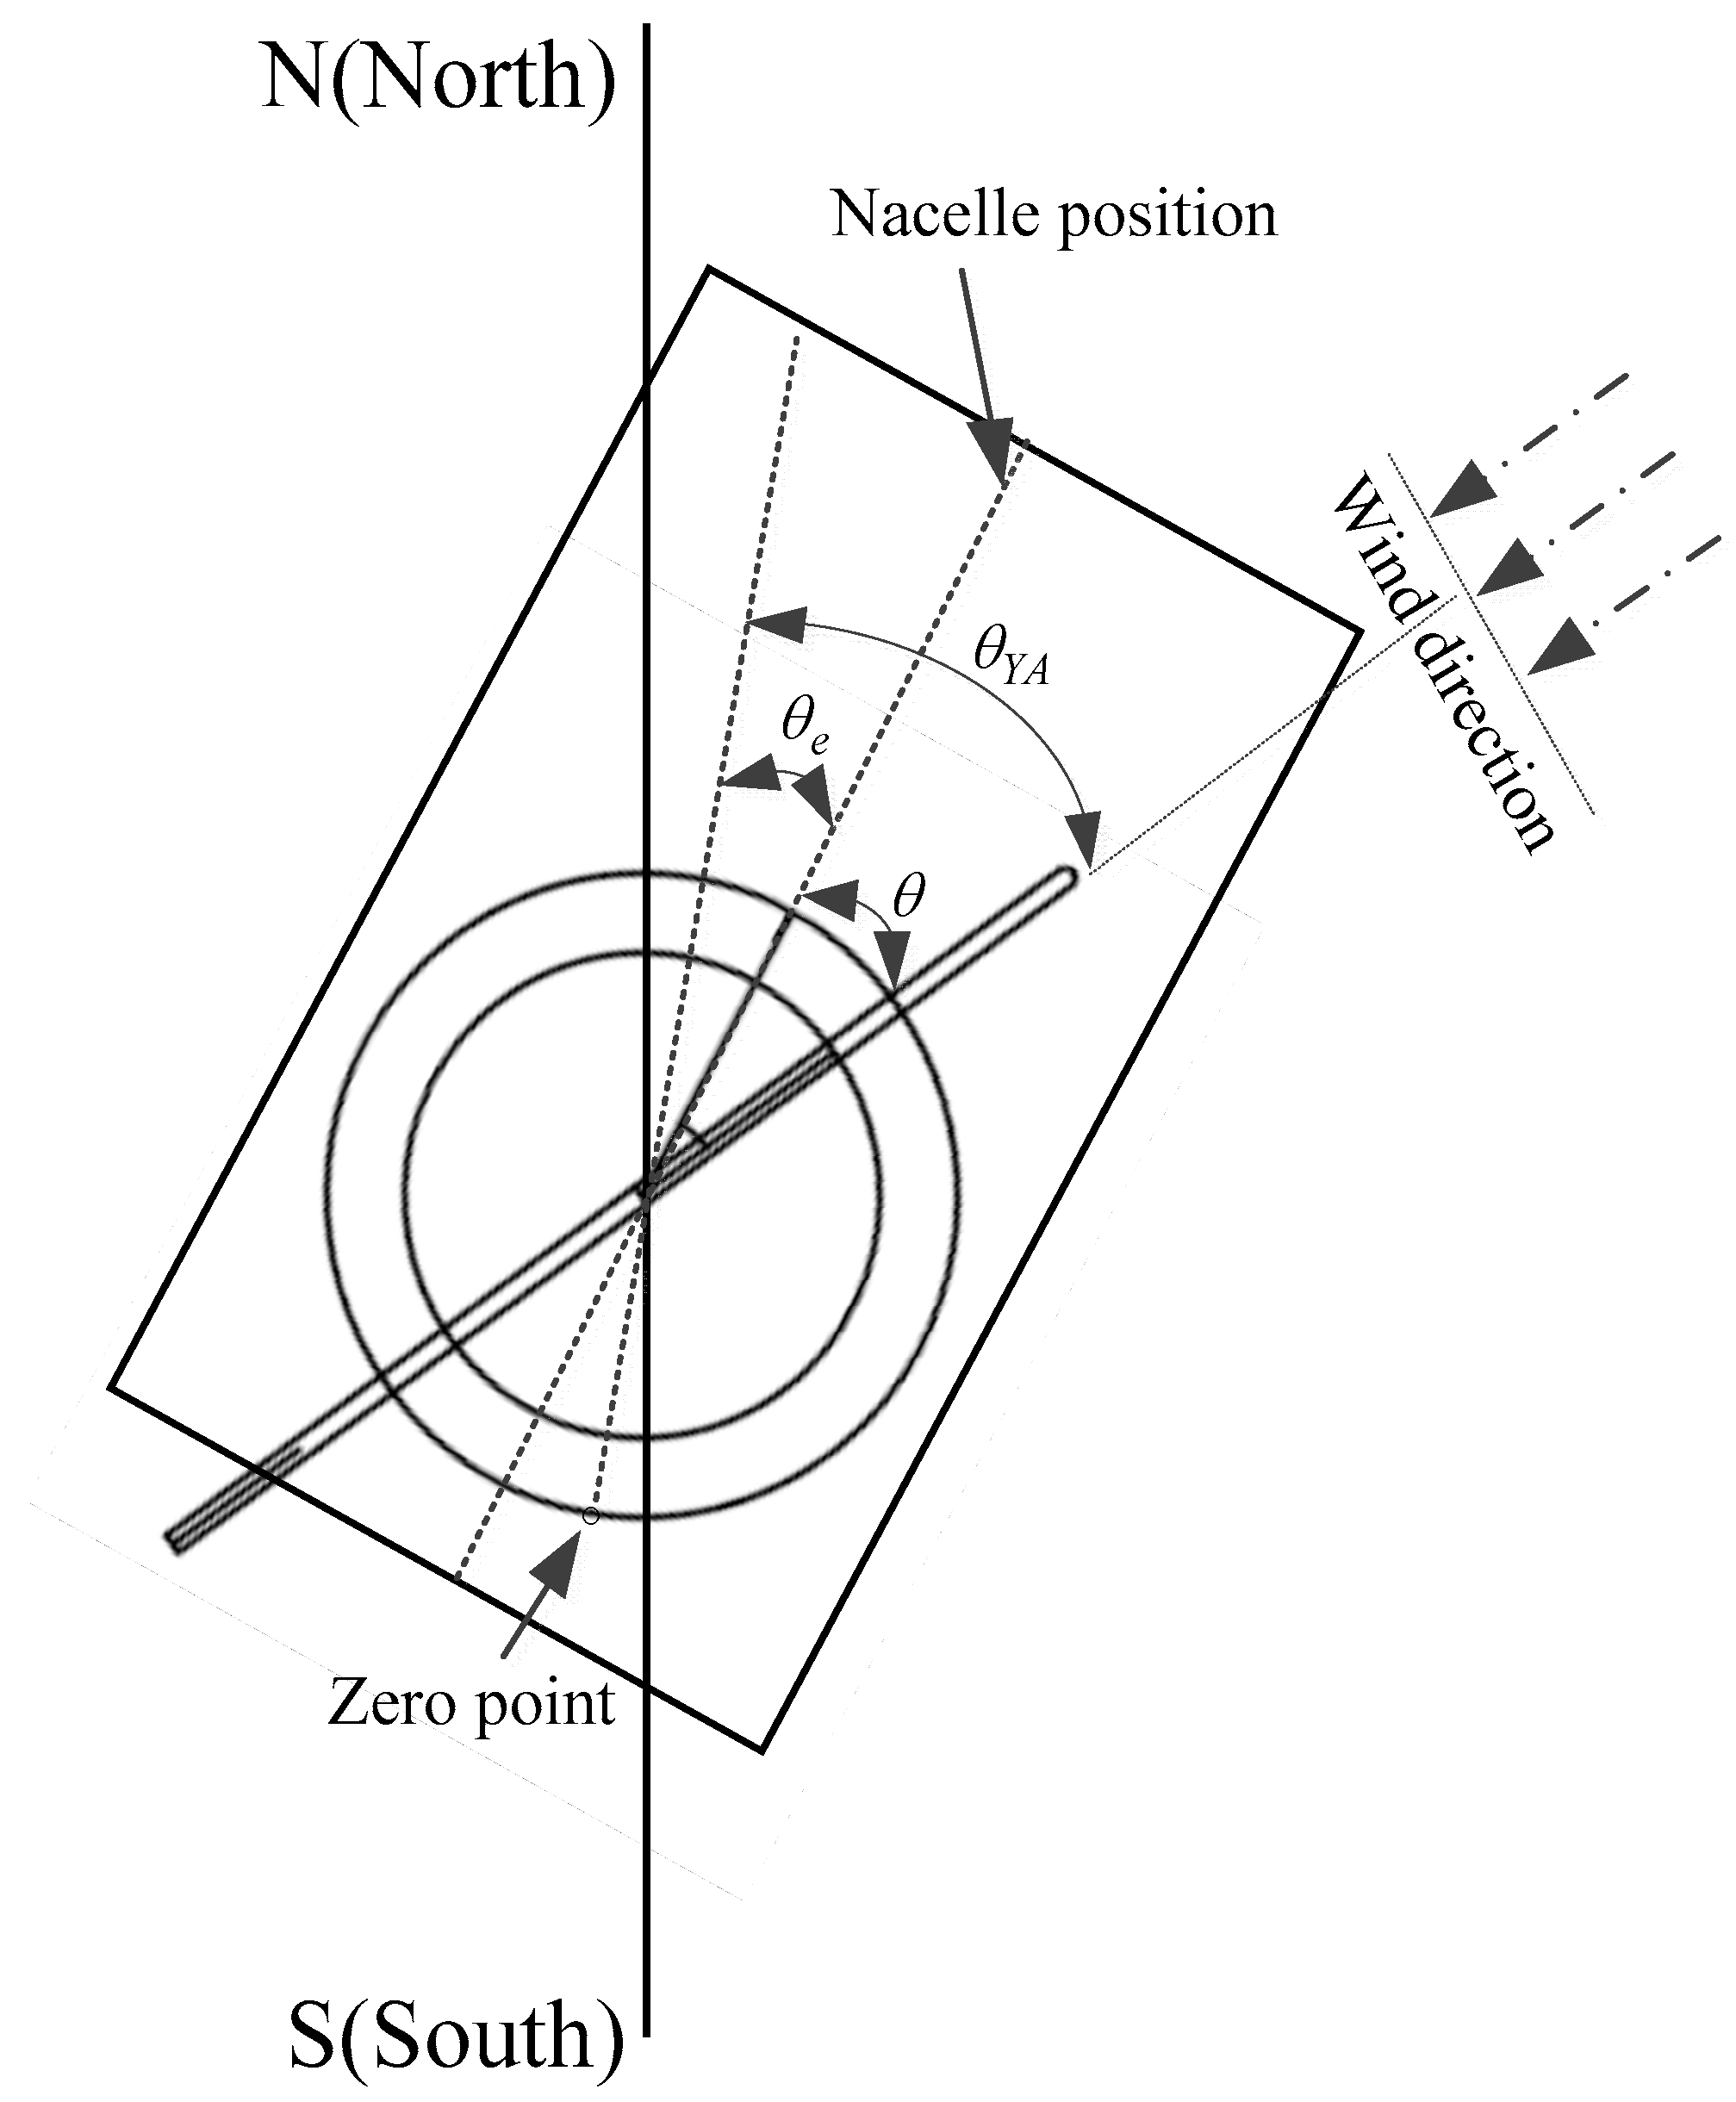
Figure 4.
Power output corresponding to wind speed.

Figure 5.
Overall structure of the proposed method. SCADA = Supervisory Control and Data Acquisition. The symbols in this figure share the same meaning with the ones in Table 2.
Figure 5.
Overall structure of the proposed method. SCADA = Supervisory Control and Data Acquisition. The symbols in this figure share the same meaning with the ones in Table 2.

Figure 6.
Wind power output with the wind speed range of 6–6.2 m/s.

Figure 7.
Wind power performance corresponding to the measured yaw angle.

Figure 8.
Indicators for WT1.

Figure 9.
Indicators for WT2.

Figure 10.
Power curve comparison for WT1.

Figure 11.
Power curve comparison for WT2.


Table 1.
Specification of the yaw angle sensor.
| Measuring Range | Accuracy | Start-Up Wind Speed | Permitted Temperature | Permitted Humidity |
|---|---|---|---|---|
| 0–360° | ±1° | 0.5 m/s | −30–70 °C | 0–95% RH |
Table 2.
The adopted parameters in the proposed approach. WT = wind turbine.
| Type | Data |
|---|---|
| WT performance parameters | Wind speed , active power output |
| WT controller parameters | Blade pitch angle , pitch motor power , yawing set value |
| WT operation mode parameter | Operation mode |
Table 3.
Detection results for other three wind farms.
| Wind Turbine | Detection Result | Actual Result | Fixing Date | Improvement |
|---|---|---|---|---|
| WT3 | Fault | Fault | 28 December 2017 | 13% |
| WT4 | Fault | Normal | NA | NA |
| WT5 | Fault | Fault | 28 December 2017 | 0.1% |
| WT6 | Fault | Fault | 18 December 2017 | 28% |
| WT7 | Fault | Fault | 25 December 2017 | 1% |
© 2018 by the authors. Licensee MDPI, Basel, Switzerland. This article is an open access article distributed under the terms and conditions of the Creative Commons Attribution (CC BY) license (http://creativecommons.org/licenses/by/4.0/).
Share and Cite
MDPI and ACS Style
Pei, Y.; Qian, Z.; Jing, B.; Kang, D.; Zhang, L. Data-Driven Method for Wind Turbine Yaw Angle Sensor Zero-Point Shifting Fault Detection. Energies 2018, 11, 553. https://doi.org/10.3390/en11030553
AMA Style
Pei Y, Qian Z, Jing B, Kang D, Zhang L. Data-Driven Method for Wind Turbine Yaw Angle Sensor Zero-Point Shifting Fault Detection. Energies. 2018; 11(3):553. https://doi.org/10.3390/en11030553
Chicago/Turabian StylePei, Yan, Zheng Qian, Bo Jing, Dahai Kang, and Lizhong Zhang. 2018. "Data-Driven Method for Wind Turbine Yaw Angle Sensor Zero-Point Shifting Fault Detection" Energies 11, no. 3: 553. https://doi.org/10.3390/en11030553
Note that from the first issue of 2016, this journal uses article numbers instead of page numbers. See further details here.