Classification of Many Abnormal Events in Radial Distribution Feeders Using the Complex Morlet Wavelet and Decision Trees

1
Department of Electrical and Computer Engineering, Southern Illinois University, 1230 Lincoln Dr., Carbondale 62901, IL, USA
2
Department of Electrical Engineering, Al Baha University, Al Baha 65527, Saudi Arabia
*
Author to whom correspondence should be addressed.
Energies 2018, 11(3), 546; https://doi.org/10.3390/en11030546
Submission received: 4 February 2018
/
Revised: 24 February 2018
/
Accepted: 28 February 2018
/
Published: 3 March 2018
Abstract
:Monitoring of abnormal events in a distribution feeder by using a single technique is a challenging task. A number of abnormal events can cause unsafe operation, including a high impedance fault (HIF), a partial breakdown to a cable insulation, and a circuit breaker (CB) malfunction due to capacitor bank de-energization. These abnormal events are not detectable by conventional protection schemes. In this paper, a new technique to identify distribution feeder events is proposed based on the complex Morlet wavelet (CMW) and on a decision tree (DT) classifier. First, the event is detected using CMW. Subsequently, a DT using event signatures classifies the event as normal operation, continuous and non-continuous arcing events (C.A.E. and N.C.A.E.). Additional information from the supervisory control and data acquisition (SCADA) can be used to precisely identify the event. The proposed method is meticulously tested on the IEEE 13- and IEEE 34-bus systems and has shown to correctly classify those events. Furthermore, the proposed method is capable of detecting very high impedance incipient faults (IFs) and CB restrikes at the substation level with relatively short detection time. The proposed method uses only current measurements at a low sampling rate of 1440 Hz yielding an improvement of existing methods that require much higher sampling rates.
1. Introduction
The deterioration of medium voltage distribution feeder equipment develops over time until a major outage takes place. Therefore, to improve reliability and longevity of equipment, the incipient failing equipment must be detected and maintained [1,2]. These failures may result in an unsafe operation or wildlife hazards. An energized broken conductor touching high impedance surfaces such as wet sands or grass may cause fire. Such high impedance faults (HIFs) are not detectable by conventional relays [3,4,5,6,7,8]. A review of many detection methods of HIFs has been addressed in [4]. Detection of HIF events was achieved using frequency and wavelet transform techniques [5,6,7]. Many of these methods do not report their first detection delay of the event. However, a delay detection of 1 min and 1 s is reported in [5] and [8], respectively. Most HIF detection methods are not suitable to detect fast and self-clearing events such as incipient faults (IFs) or circuit breaker (CB) restrikes since these methods are depending on continuous arcing phenomena.
The insulation degradation of an underground cable will result in IFs that last from ¼ to 4 cycles and are self-cleared before the operation of protective devices. This type of fault is addressed in [9,10]. The detection of an IF is based on time or frequency analyses or both [10,11,12,13,14]. Such techniques can detect low impedance IFs but they are not suitable for HIF detection. For instance, the method addressed in [10] can detect high impedance IFs if their superimposed amplitude is higher than 60% of the pre-fault current peak, however, as it was detailed in [14], it is still unable to detect a 30 Ω fault or higher, which is typical for HIFs.
Opening of a CB associated with capacitor banks can cause a restrike that may last for a ¼ cycle due to the voltage exceeding the withstand limits of the CB, therefore, possibly causing more restrikes and leading to re-energization of the bank and unsafe operation. The restrike current can reach up to ten times the rated current of the bank [15,16]. This current can be clearly seen at the substation level in the shape of spikes. Different detection algorithms based on time domain and wavelet transform are discussed in [17,18]. However, these algorithms are applied locally at each CB near capacitor banks making them unsuitable to monitor multiple CBs at once.
The major issue of the previously mentioned techniques is that none can detect all the aforementioned events, which leads utilities to increase expenses to install different equipment to apply predictive maintenance. A recent technique that can detect both HIFs and IFs but not the CB restrikes is presented in [19]. This method, however, uses both the voltage and current measurements to estimate the arc parameters associated with such faults. It also requires a high-fidelity hardware with a minimum of 5 kHz sampling rate for capturing the measured signals.
Wavelet-based detection algorithms can use different time-frequency windows to detect disturbances in a certain time interval [20]. Therefore, based on the wavelet theory and decision tree (DT) analysis, a new method is proposed in this paper. First, only the current signals at the substation are processed using the complex Morlet wavelet (CMW) to detect the harmonics presence due to transient events [21]. Then, based on the characteristics and signatures of permanent faults, HIFs, IFs, un-cleared and self-cleared CB restrikes due to capacitor bank de-energization and normal operations (capacitor energization and load switching), a classification method is applied using DT. The contributions of the paper are summarized as follows:
- An online wavelet DT algorithm is developed to detect IFs, HIFs, and CB restrikes and other normal operating transients.
- The proposed algorithm improves both the detection speed and the classification time, both of which are necessary for fast action in the case of HIFs.
- The algorithm uses a low sampling rate of 24 samples/cycle for current signals, unlike previous work and, therefore, it is not hardware demanding [2].
The proposed algorithm was heavily tested on the IEEE 13- and IEEE 34-bus test feeders using MATLAB/SIMULINK (2013a, MathWorks, Inc., Natick, MA, USA). The test parameters included fault type, resistance, distance and location, etc. The paper is divided as follows: the system modeling is described in Section 2. The proposed technique of the detection process as well as the classification algorithm using the wavelet and DT are explained in detail in Section 3. In Section 4, the results of detection and classification are discussed. Finally, a conclusion is presented in Section 5.
2. System Modeling
The following sections describe the models and parameters used to simulate the waveforms produced by the abnormal events.
2.1. High Impedance Fault (HIF) Modeling
HIF has a nonlinear behavior due to the established arc including an asymmetric behavior between the positive and negative cycles. Furthermore, the arc and fault current is different at different ground surfaces. Therefore, a detailed model to represent this behavior is required.
A review of many HIF models was presented in [22]. In this paper, the modeling of HIF was based on the source-diode-resistance model described in [8]. It was adopted because the model’s harmonic components are in agreement with actual HIF tests and reported in [23]. The HIF model parameters for both test feeders had uniform random variation and shown in Table 1.
2.2. Circuit Breaker (CB) Modeling
The CB model includes four stages as described in [24]. The four stages of operation are: closed contacts, arc burning, arc extinguishing, and open contacts. During the burning stage, after opening the contacts of the breaker, an arc is formed between the contacts allowing the current to flow until the current reaches the chopping current value [25]. This will lead to a high transient recovery voltage across the breaker that might pass the dielectric withstand limit of the breaker causing a restrike. This current contains high frequencies components [26]. Moreover, the arc extinguishing stage was modeled using a series connection of the Cassie and Mayr arc models [26]. The Cassie model describes the arc during high currents while Mayr model describes the arc at low current near the zero crossing [24]. The CB parameters for the test feeders were set as shown in Table 2.
2.3. Incipient Fault (IF) Modeling
During an IF event in underground cables, an arc is formed due to electrical discharge caused by a partial failure in the insulation which causes the voltage waveform to resemble a distorted square wave [9]. The Casey and Mayr arc models are used which provide a good representation of the arc ignition and extinguishing stages.
3. Design of Detection and Classification
3.1. Complex Morlet Wavelet (CMW)
One of the commonly used transforms to extract features from a given signal, , is the continuous wavelet transform (CWT), defined as the complex convolution of the signal and the wavelet at each scale [20]:
where and are the scaling and translation (time-shift) parameters, respectively. The is the mother wavelet function. The scaling parameter, , is used to dilate or compress the mother wavelet to obtain the low or high frequency coefficients, respectively. The translation parameter, , is used to obtain the time information [20]. Therefore, any abrupt change in the signal can be located in both the time and the frequency domains.
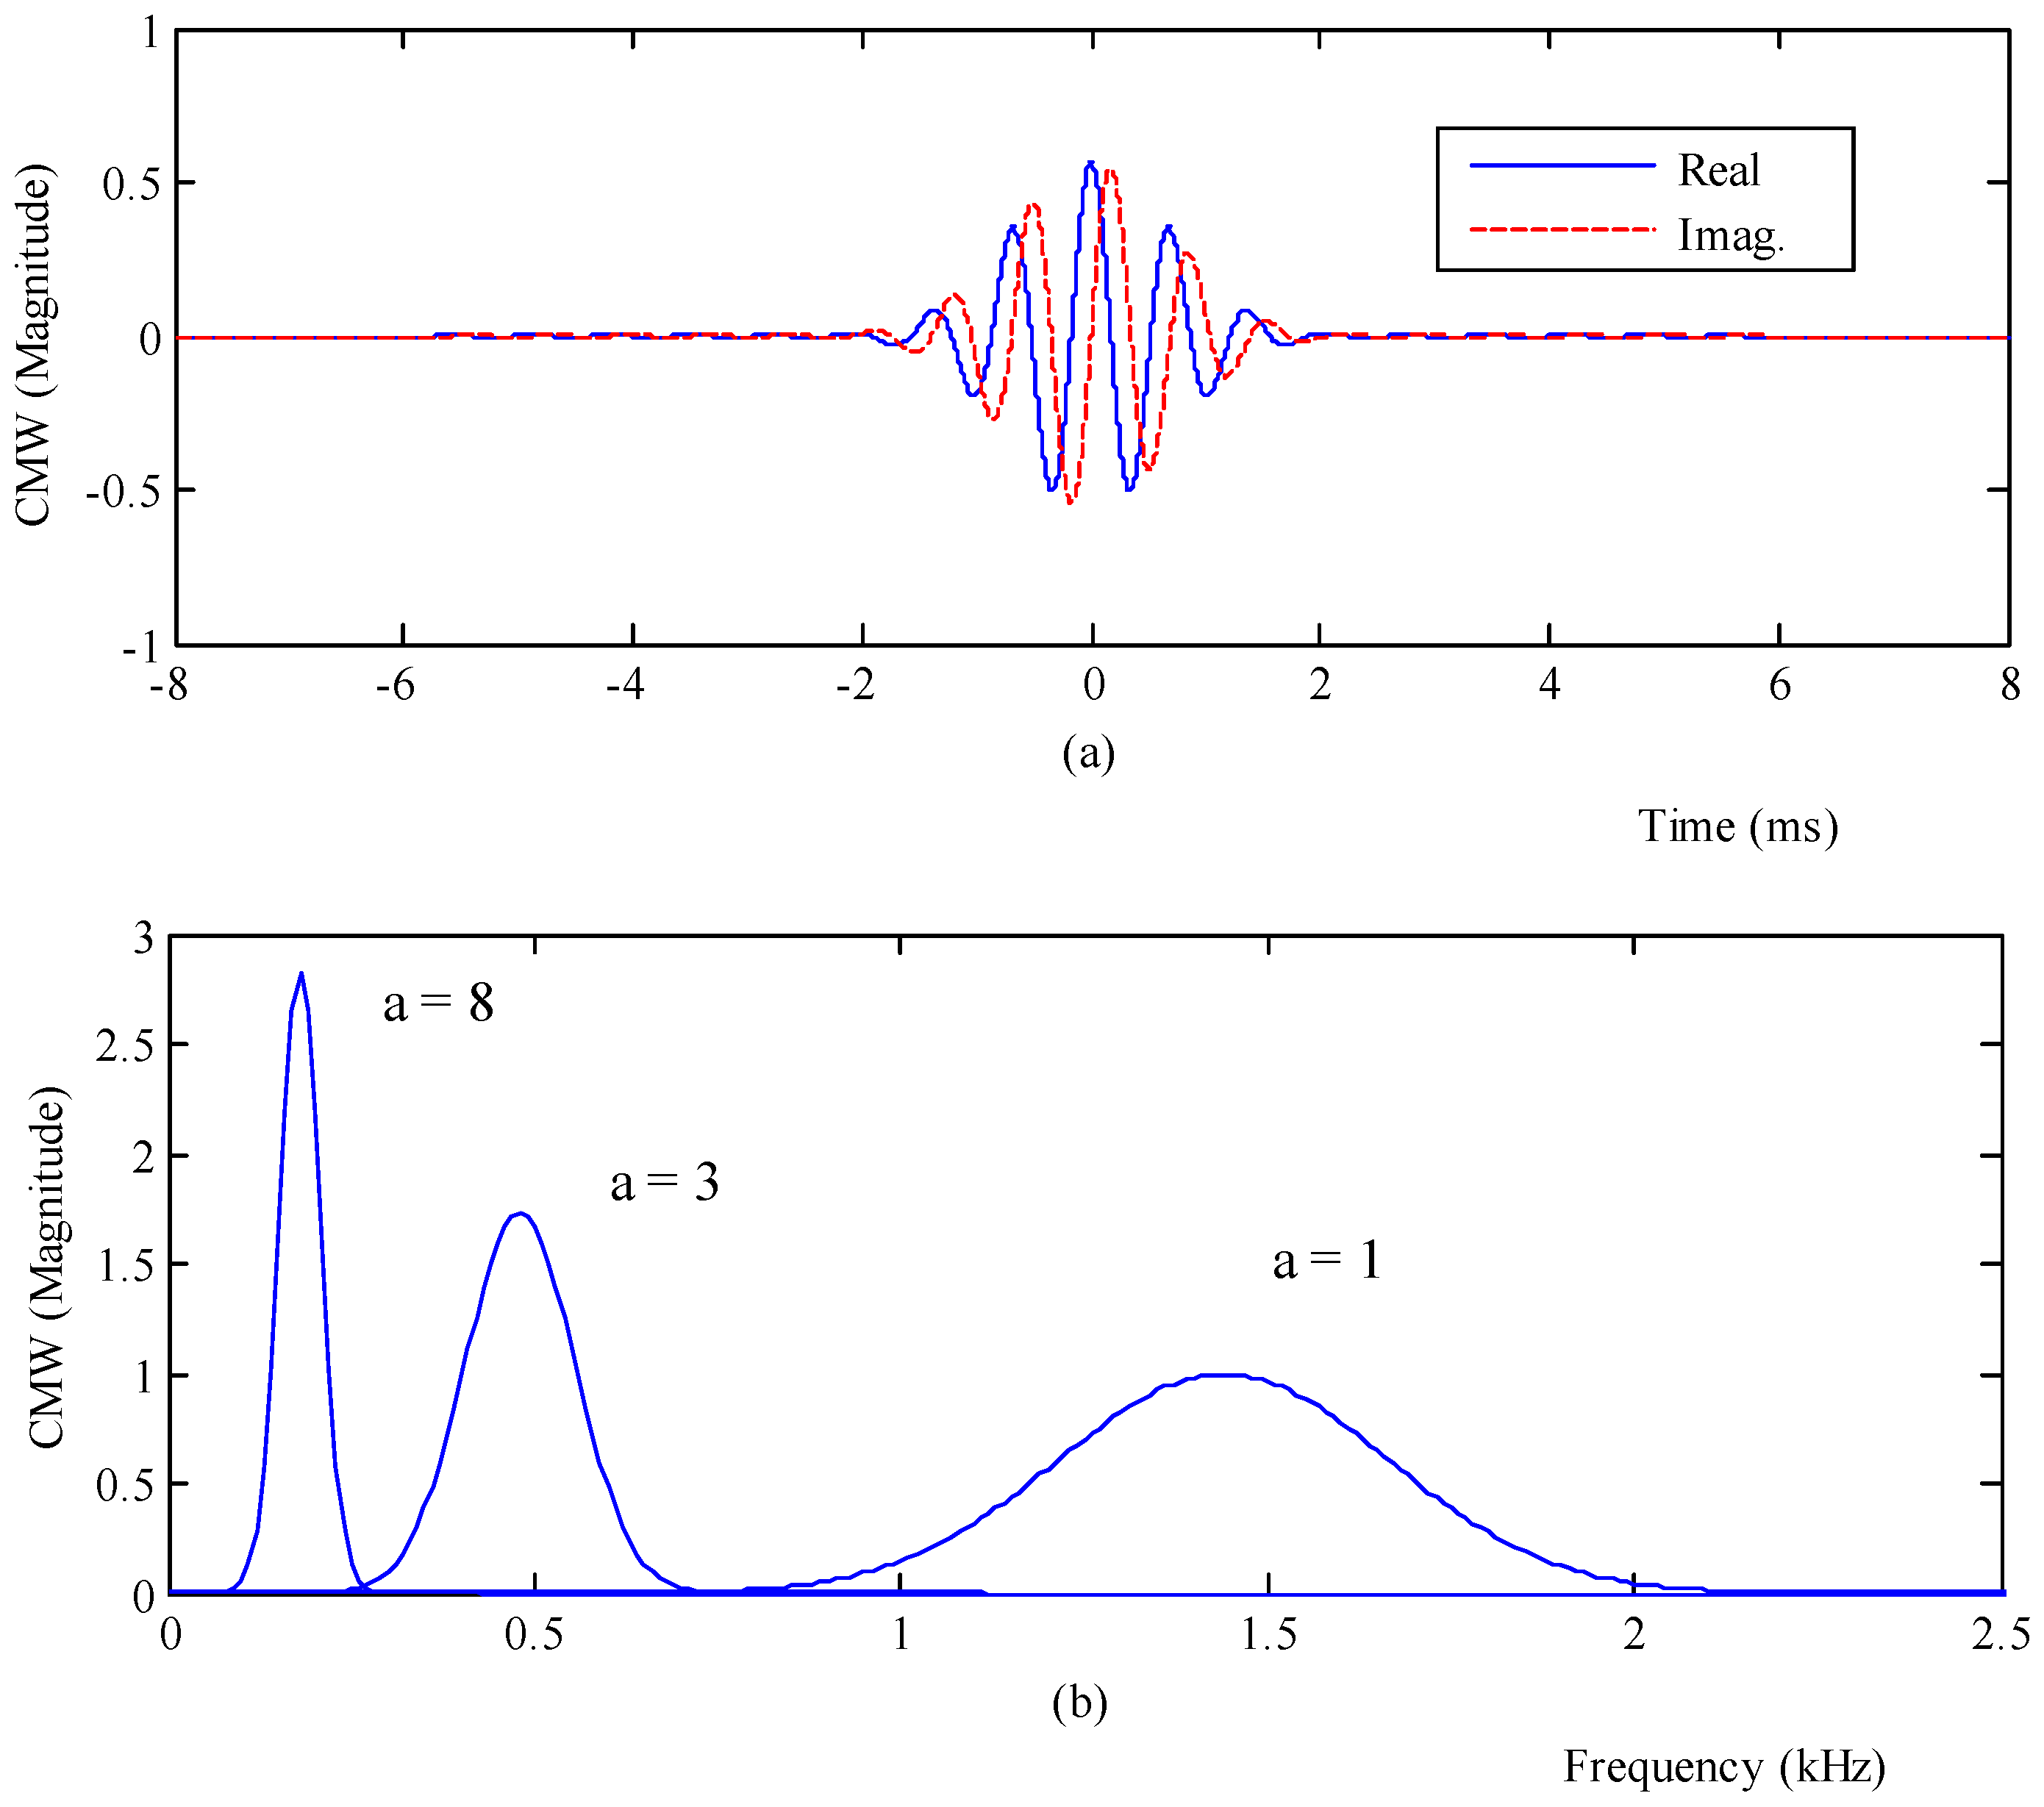
The mother wavelet used here is the CMW represented by a modulated Gaussian function [27], shown in Figure 3a, and given by:
where is a fixed value used as the base of the wavelet center frequency, and and are the bandwidth and the center frequencies of the wavelet, respectively. This particular wavelet is convenient for harmonic analysis due to its smoothness and, moreover, it can localize in time any sudden changes to the signal [20]. Adjusting determines the center frequency of a bandpass filter for the signal. A filter bank of CMW generated at different scale, , values is shown in Figure 3b.
3.2. Detection Process
To be able to detect abnormal events at different load levels, the neutral current at the substation is the only signal needed for detection purposes. This enables the detection process to sense small changes in the feeder current (e.g., during a HIF). If the magnitude of the wavelet transform coefficients exceeds a specific threshold, a transient is detected. The neutral current is sampled at a low sampling frequency of 24 samples/cycle of a 60 Hz system.
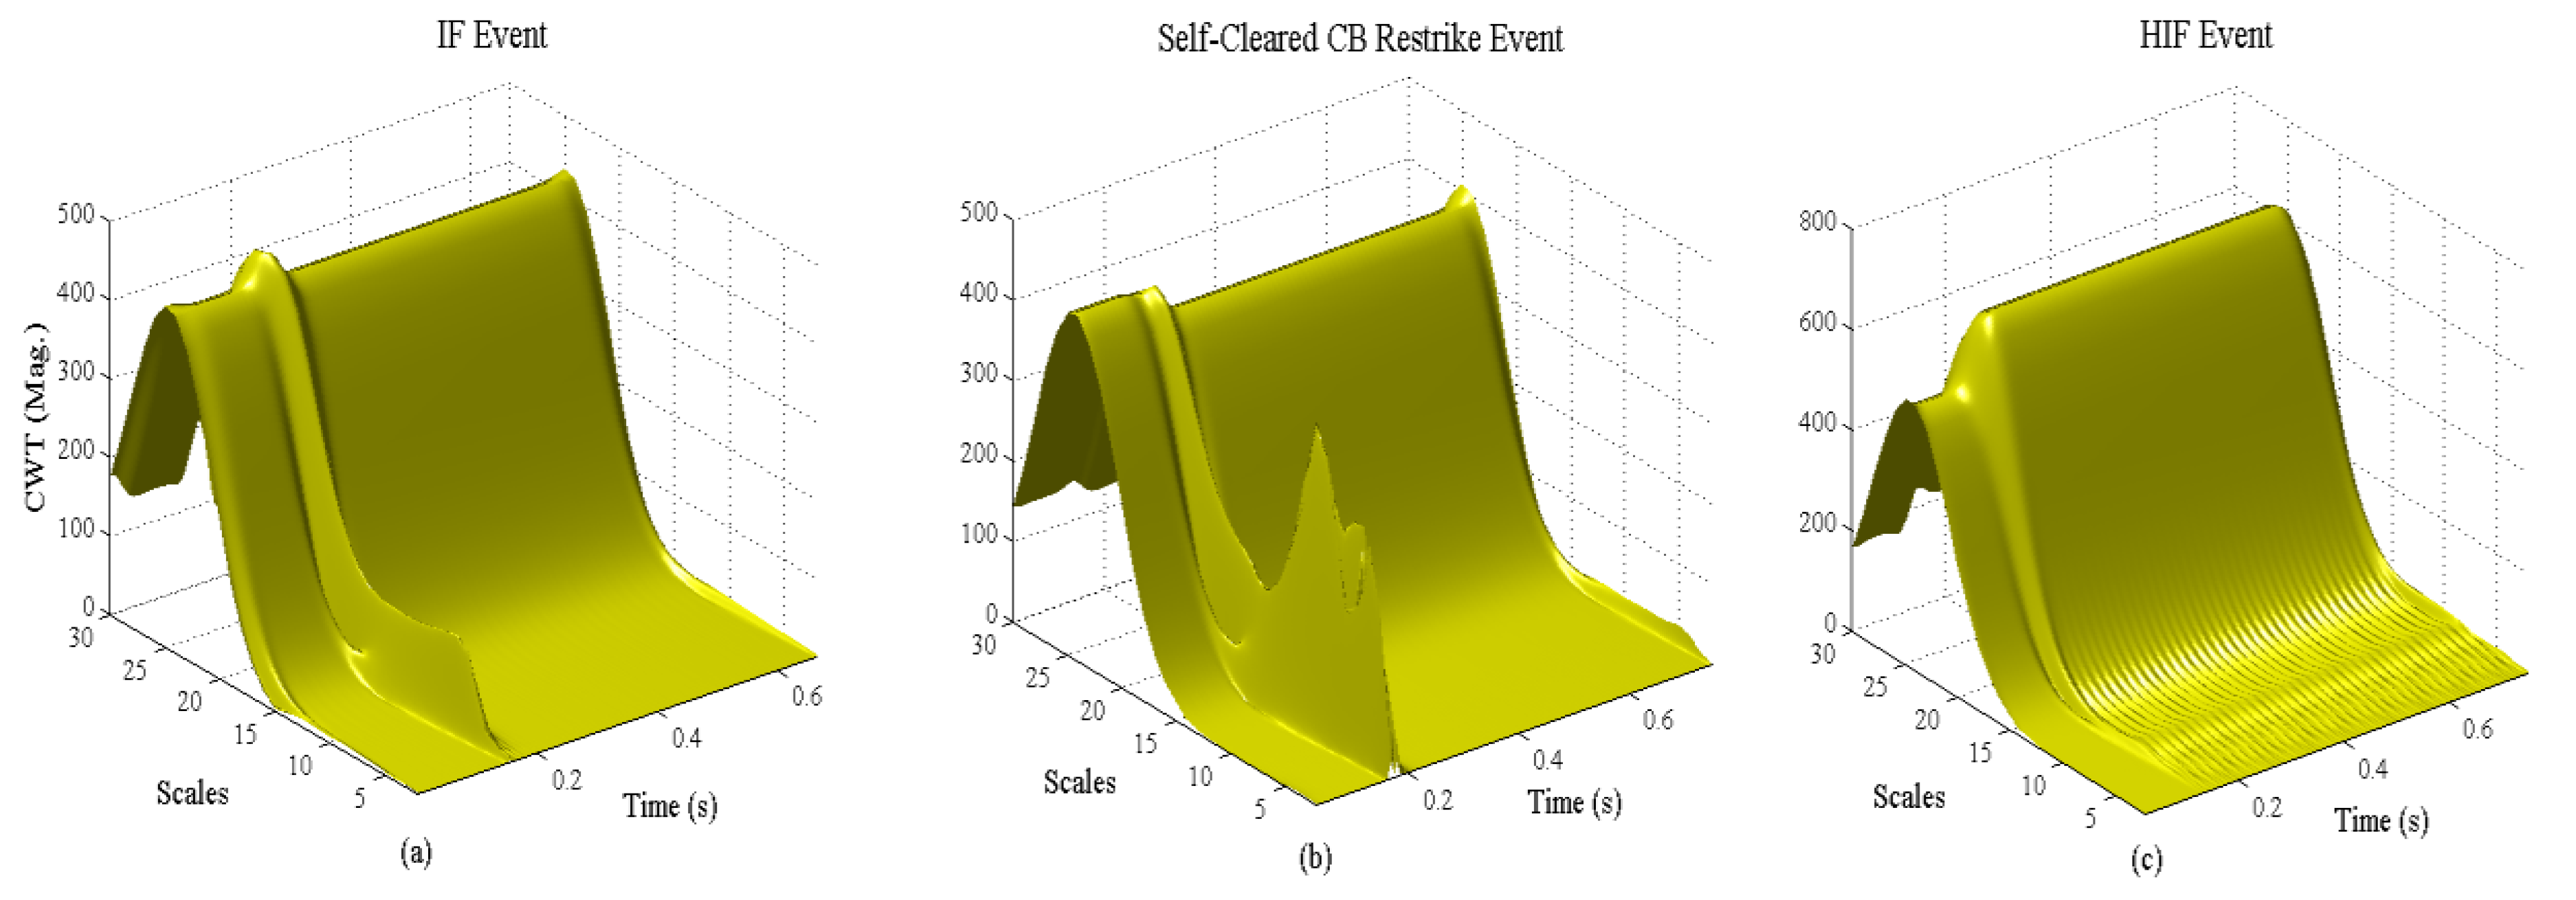
To identify the scale parameters, all types of events are tested and a few are shown in Figure 4. All events are seen to excite the 24th scale the most, which represents the power frequency (e.g., 1440 Hz/24 = 60 Hz). However, as it is seen in Figure 4, this scale is not well localized in time and, therefore, distinguishing the inception time becomes more ambiguous. Furthermore, the data length must be increased to overcome the edge effects. On the contrary, low scales such as the 8 and 4.8 scales that represent the 3rd and 5th harmonics, respectively, which are also excited by all events, are more time localized (as seen in Figure 4), hence, they will require fewer data for detection. The 8th scale is more suitable as it is excited more in case of HIF events due to the high presence of the 3rd harmonic. Hence, only this scale was used for detection of all events in order to keep the number of scales minimal.
The detection process uses a sliding window of two-cycles to overcome the edge effects. Every two-cycles, the samples of the neutral current are normalized to the absolute maximum peak in that window. Normalizing the samples in every window allows for an appropriate threshold to be set for detection in order to acquire robustness with respect to load changes. In this paper, the detection threshold, , of the wavelet coefficient is set to 0.02. This value was chosen to reduce any noise interference after mixing the signal with a zero-mean white-noise of 60 dB level. If the threshold is exceeded, a transient is detected.
To compute the CWT from Equation (1), the convolution in time domain can be expressed as a multiplication in the frequency domain for faster calculation using the fast Fourier transform (FFT) of CMW [20,27]. This technique becomes important in practical implementations of the proposed method due to the large amount of data in the processing. The FFT of the CMW is given by:
where and are set to 2 and 1, respectively. Subsequently, the FFT of the neutral current signal is computed and multiplied by Equation (3) to obtain the CWT in the frequency domain. Then, the inverse FFT is applied to obtain the CWT in the time domain, as in Equation (1). Finally, the detection process is applied according to the flowchart illustrated in Figure 5.
An example of the detection process (using only the 8th scale) is illustrated in Figure 6. In Figure 6a, the neutral current is shown with a multi-cycle IF event started at 86.81 ms. A two-cycle sliding window is applied as shown in Figure 6b,d,f. Then, the CWT is applied to every normalized two-cycle window as shown in Figure 6c,e,g. In Figure 6c, the threshold detection is applied to the two-cycle window and no event is detected. This should be compared to Figure 6e results, where the CWT coefficients clearly exceed the threshold indicating that an event is located within this and the upcoming windows. Finally, detection of the event is localized at the maximum peak magnitude of CWT in the next window as shown in Figure 6g at 87.5 ms, resulting in a 0.69 ms detection delay.
3.3. Data Length and Implementation
The edge effects (also known as boundary effects) that arise from the wavelet analysis of a finite signal has been discussed in depth in [20]. The reason of these effects is that the data window may be less than the wavelet window, causing the wavelet coefficients to be compromised. These edge effects increase proportionally with respect to the scaling parameter . Several techniques have been proposed to reduce such effects by different padding methods (zero, value, decay, etc.) [20]. The length extension padding addressed in [28] is adopted in this paper. Therefore, when the 8th scale is used, the data length equals 48 samples per signal.
3.4. Classification Algorithm Using a Decision Tree (DT)
The classification algorithm uses a DT that utilizes the neutral current, the three phase currents and the supervisory control and data acquisition (SCADA) information. The main signatures of the aforementioned events can be distinguished as continuous arcing events (C.A.E.), non-continuous arcing events (N.C.A.E.) and normal operations events (N.Op.). The C.A.E. include permanent faults, HIFs and failed CB during capacitor de-energization. The N.C.A.E. include the IFs and self-cleared CB restrikes during capacitor de-energization, while the N.Op. include capacitor energization and load switching. The current signals are used to classify the detected events into general classes of C.A.E., N.C.A.E. and N.Op. The SCADA information is applied with the DT general classification to precisely identify the type of the event from the above classes. The required four inputs for the DT general classification are:
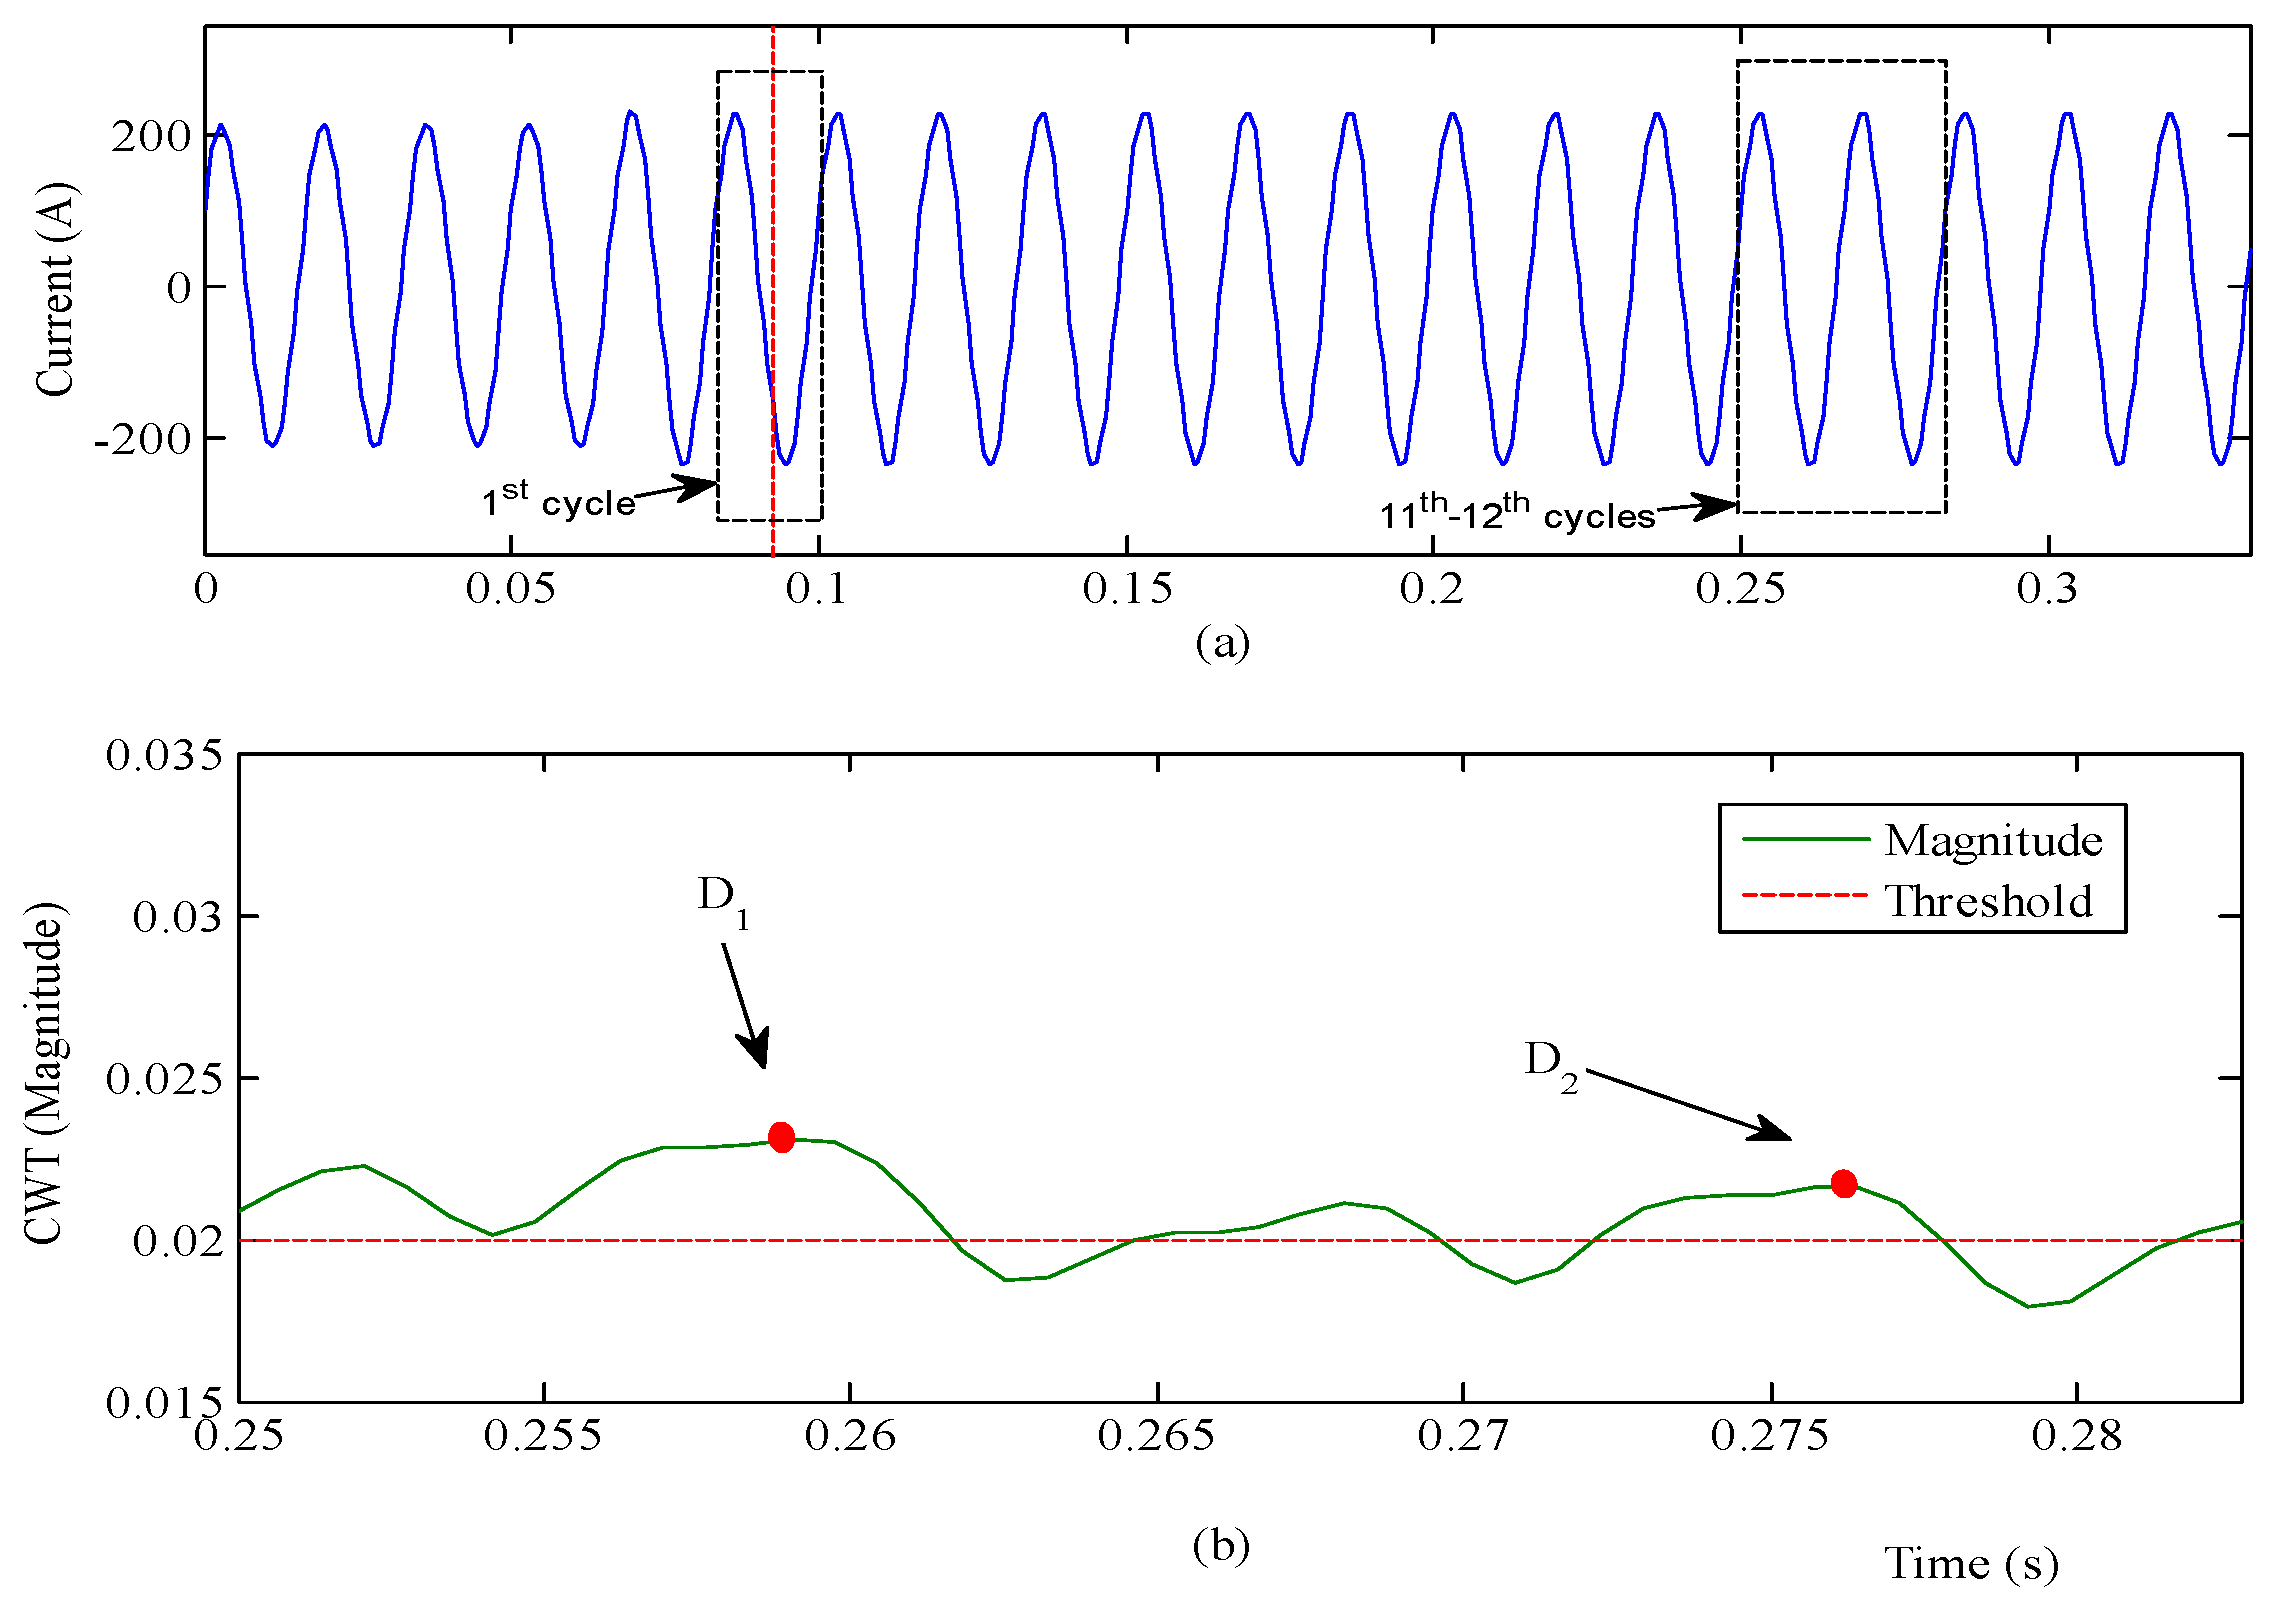
- The peak magnitudes of the CWT of the neutral current in the upcoming 11th and 12th cycle windows, starting from the detected cycle, are used as inputs and , respectively.
- The root-mean-square (RMS) of the phase-current of the upcoming 12th cycle is used as input :
- The absolute maximum peak of the phase current reached near the detection time is used as input .
The inputs, and , are used to confirm the C.A.E. and minimize false detection due to noise disturbance. Furthermore, to distinguish between C.A.E. and multi-cycle IF, and are used at later cycles to allow the transient to decay. To illustrate the DT general classification process, different events are shown in Figure 7, Figure 8, Figure 9, Figure 10, Figure 11 and Figure 12 for the IEEE 13-bus test feeder.
3.4.1. Continuous Arcing Events (C.A.E.)
A HIF event of 15 A is detected and classified as shown in Figure 7. First, after processing the neutral current (with an unbalanced loading of 150 A) at the substation, the event is detected at 92.36 ms, after a 25.69 ms detection delay from the inception time, as shown in Figure 7a. The detection process discussed in Section 3.2 is applied to the upcoming 11th and 12th windows as in Figure 7a. The CWT peak magnitudes of the 11th and 12th cycles (inputs and respectively) exceeded the threshold indicating an arcing still occurring in the feeder as in Figure 7b. The arcing phenomena can also be seen in Figure 4c. In this figure, the advantage of the 8th over the 24th scale is shown: the graph of the 8th scale shows the 3rd harmonic current present almost every half cycle, which is a prominent characteristic of a C.A.E; this harmonic is absent in the 24th scale graph. Similarly, the same classification method is applied for permanent faults (Figure 8) and for failed CB opening operations during de-energization of a bank. Based on the above analysis, inputs and are the only required inputs in the DT to classify an C.A.E event.
3.4.2. Non-Continuous Arcing Events (N.C.A.E.)
A. IF Events
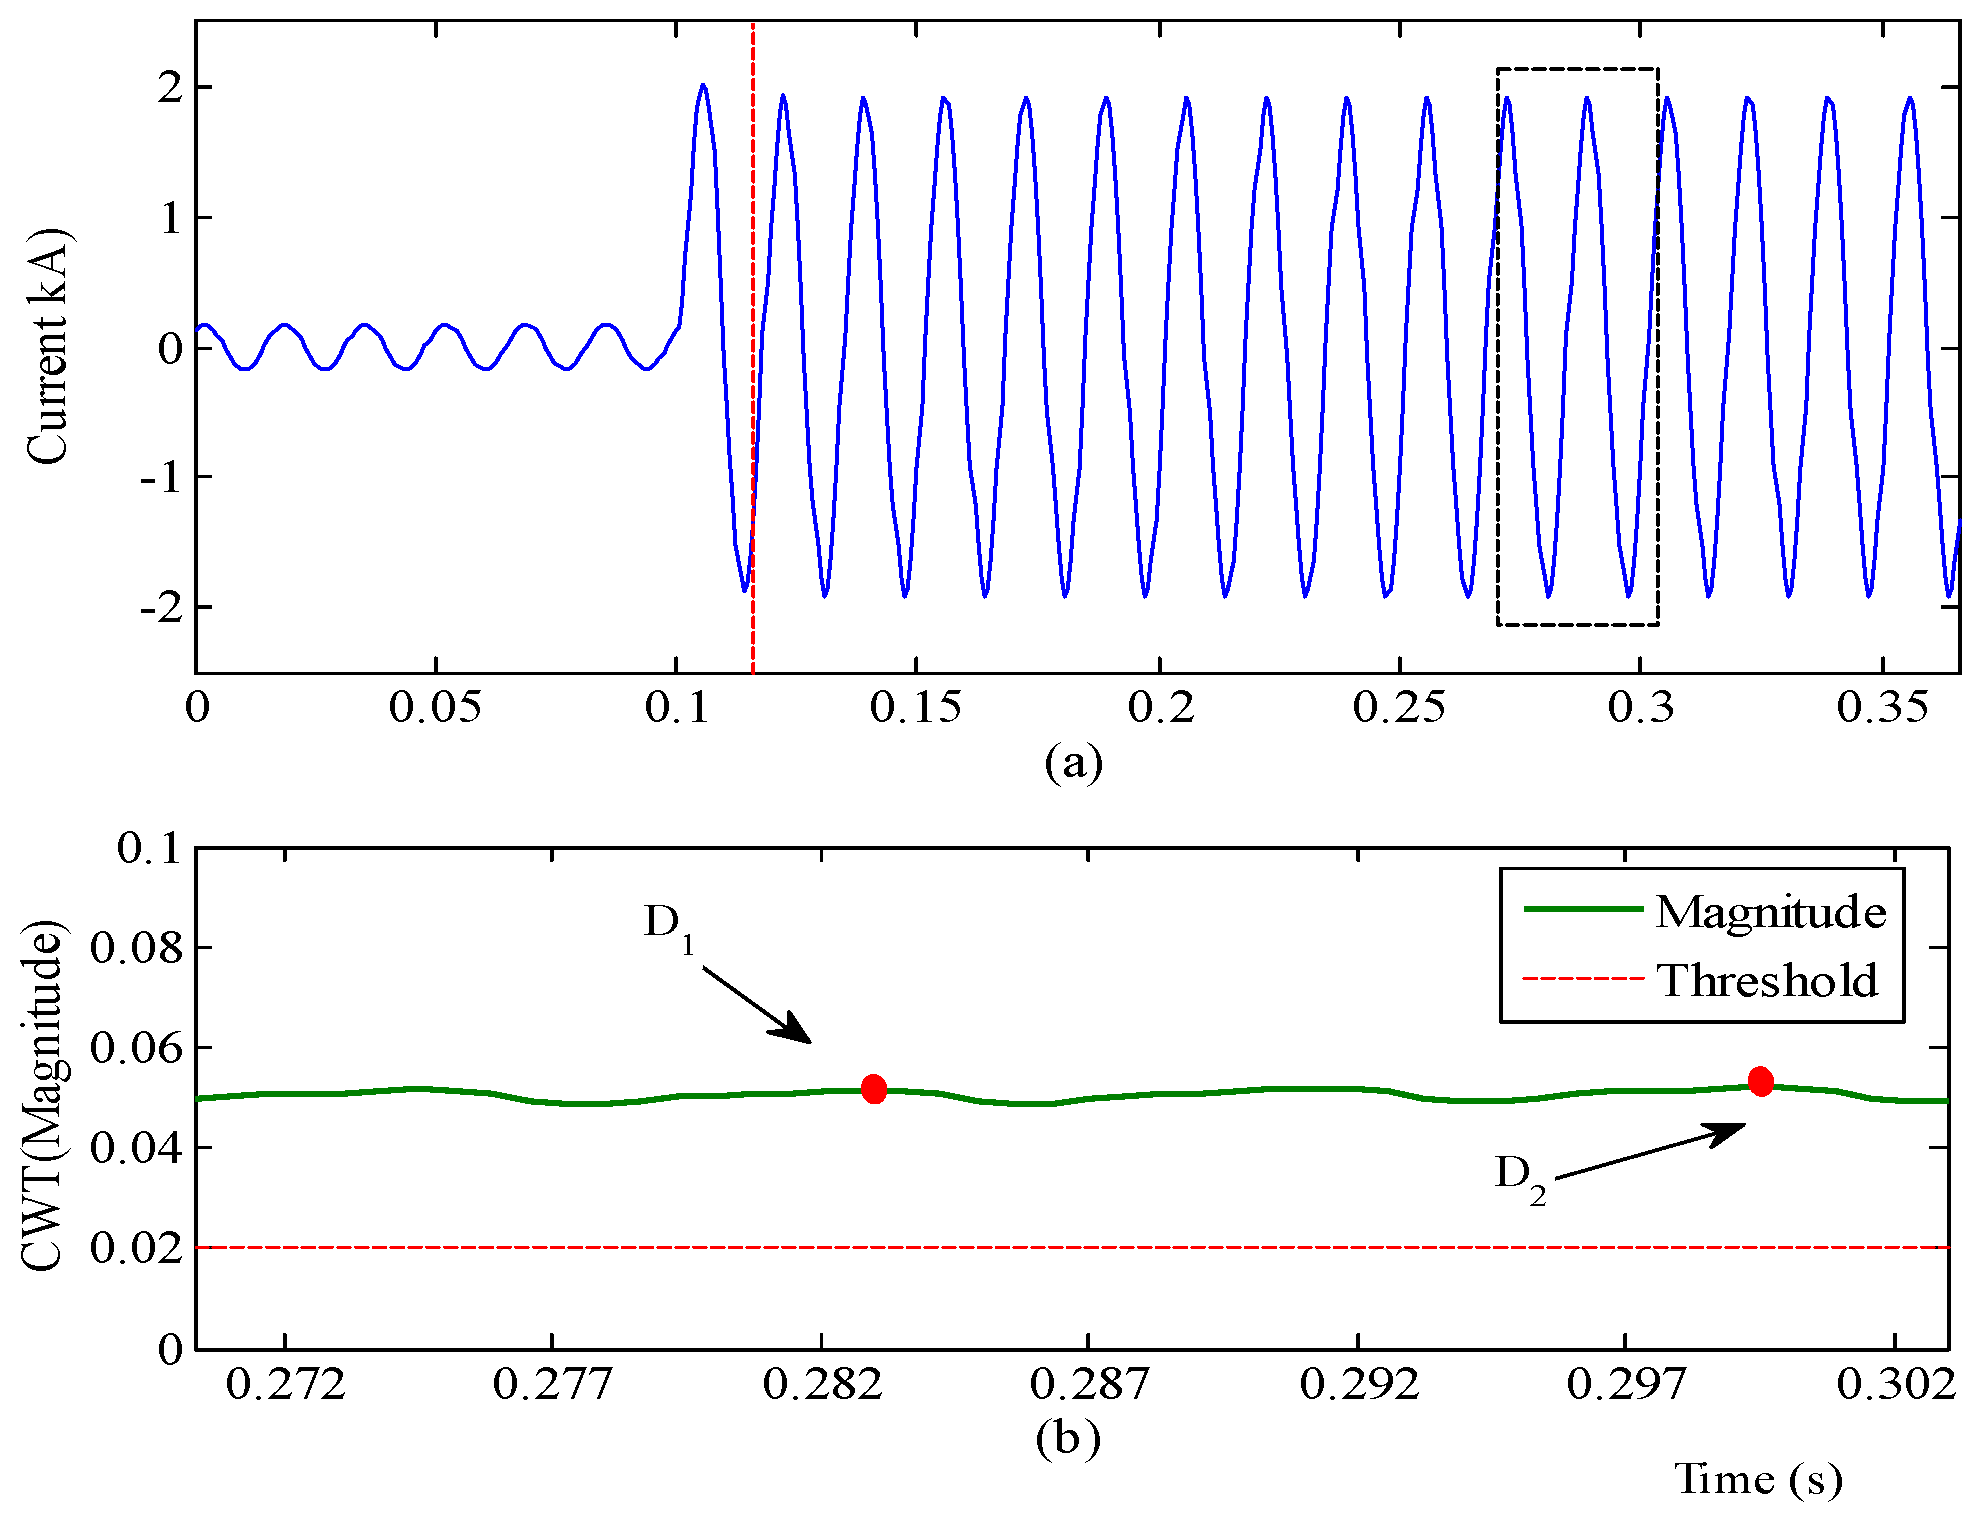
In addition to inputs and related to C.A.E events, is also used for the classification of IF events. However, the values of and are expected to be less than the threshold, due to the self-clearing behavior of IFs. This is demonstrated in Figure 9c. However, the phase-current RMS of the 12th cycle () will be similar as the pre-transient and within the RMS thresholds as shown in Figure 9b. Therefore, only three inputs , and are required to classify an IF event.
B. Self-cleared CB Restrikes (RCB) Events
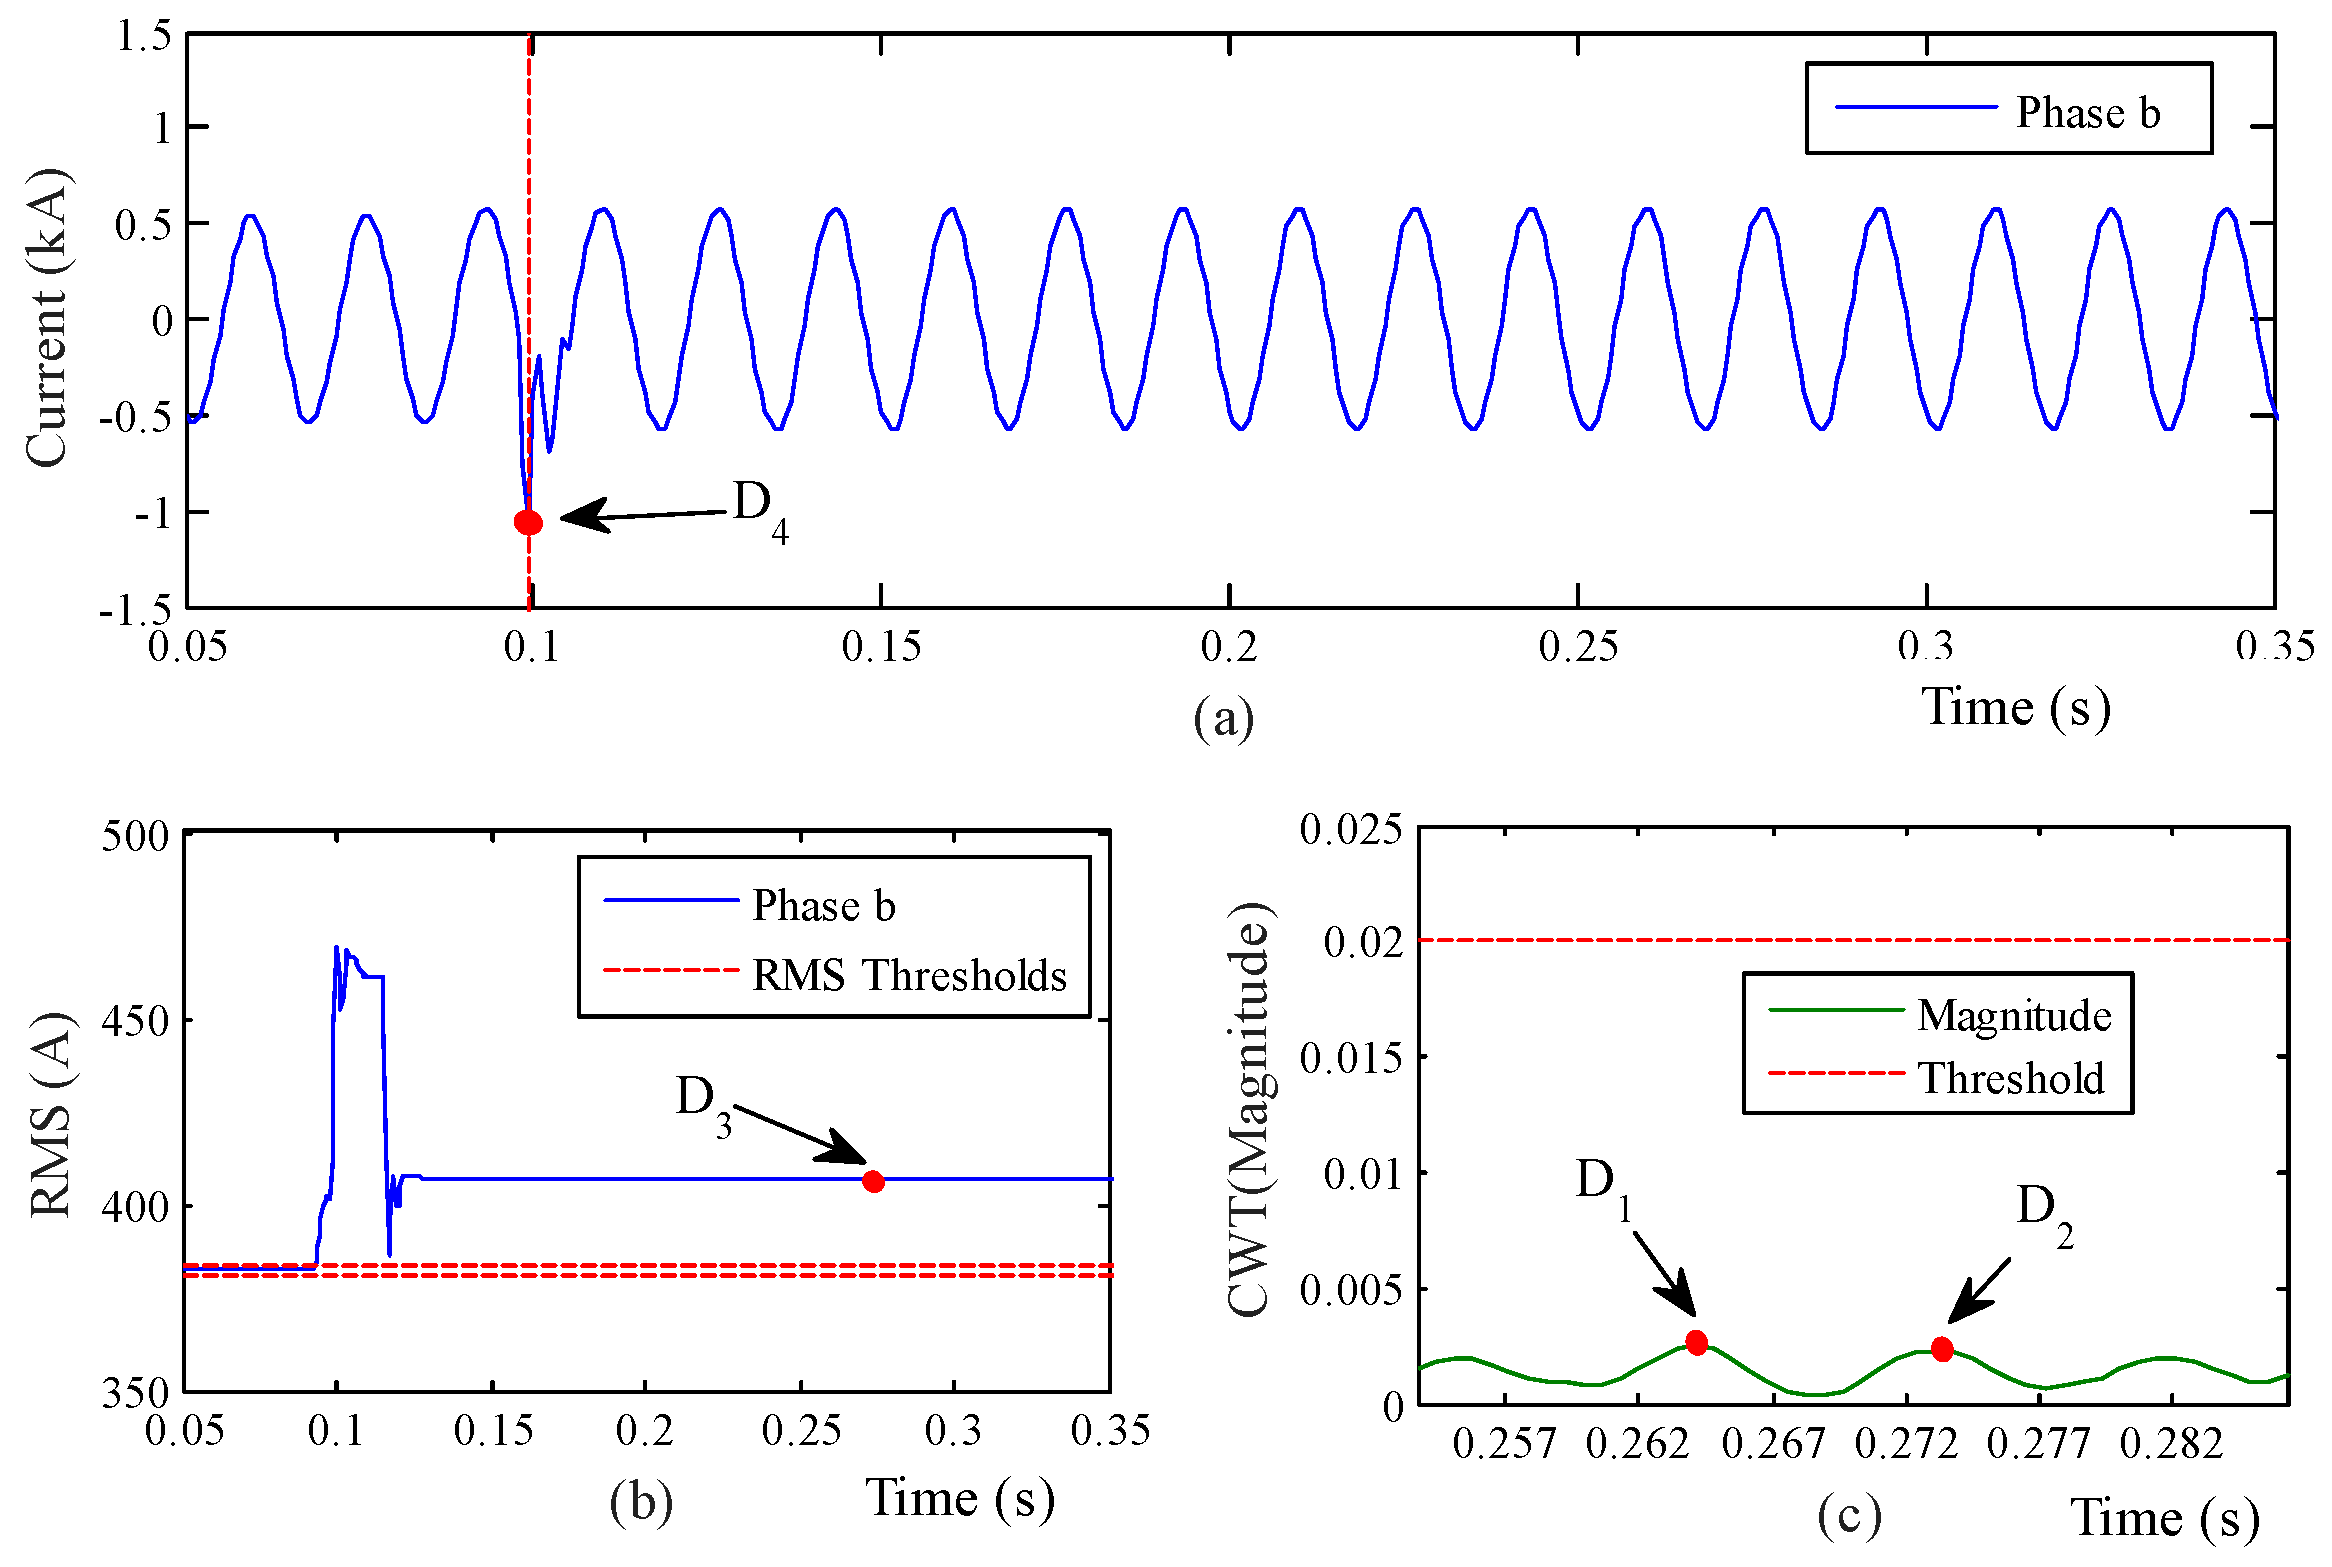
The classification process of these events is demonstrated in Figure 10. Inputs , and behave similar to the case of an IF event, where and are below the threshold, , as seen in Figure 10c. The event is detected at 99.31 ms, where , shown in Figure 10b, is higher than the maximum RMS threshold. Also, with reference to Figure 10a, the absolute maximum amplitude of the phase current reached near the detection time is recorded (input ). Input is compared to the peak amplitude of the 12th cycle ().
3.4.3. Normal Operation Events (N.Op.)
A. Sadden Current Decrease at the Substation due to Normal Switching Events
This event can be the result of load disconnection or capacitor bank energization, both of which are normal operating events (N.O.P). The required inputs of this category are the same as IF events, where and are below the threshold, . However, will be below the minimum RMS threshold shown in Figure 11b.
B. Sudden Current Increase from Load Energization
The goal of the this classification is to distinguish load energization from other causes of sadden current increase. Load energization requires the same four inputs, , as the RCB events. Specifically, for a load energization event, and are below the threshold, , as in Figure 12c. Input is higher than the maximum RMS threshold, as in Figure 12b. Finally, the absolute maximum amplitude reached of the phase currents near the detection time () is less than the threshold, , as shown in Figure 12a.
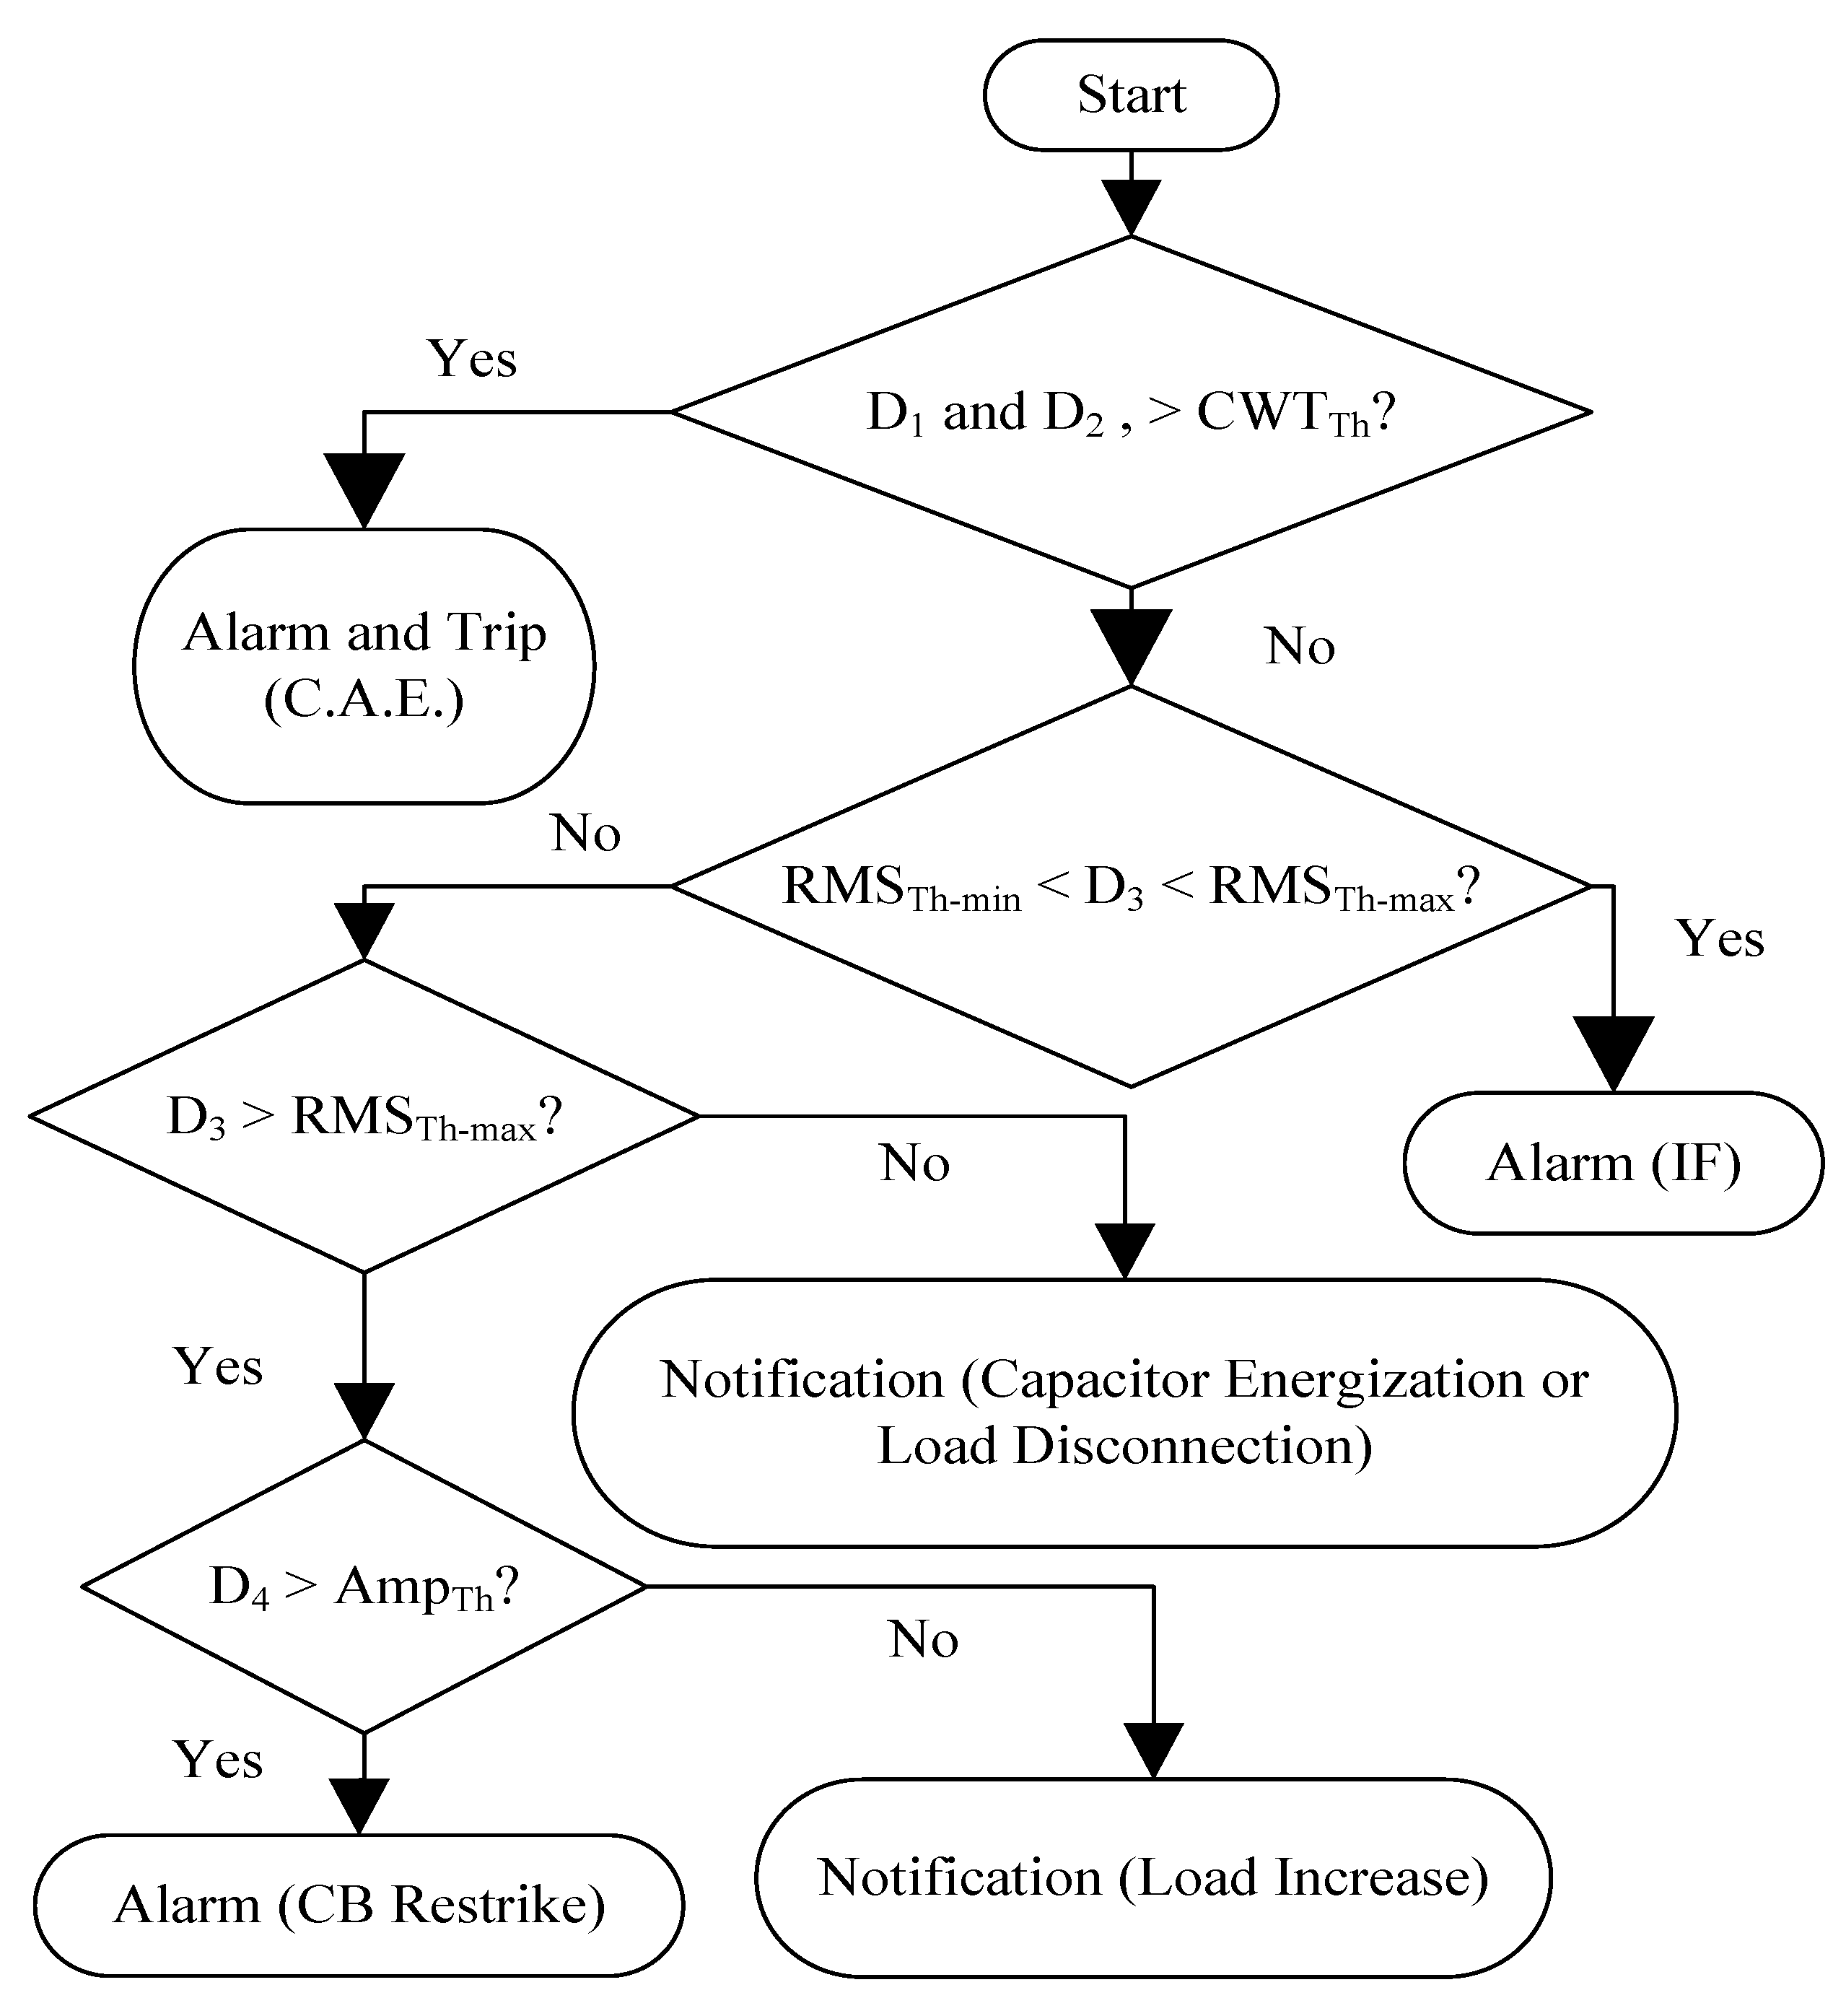
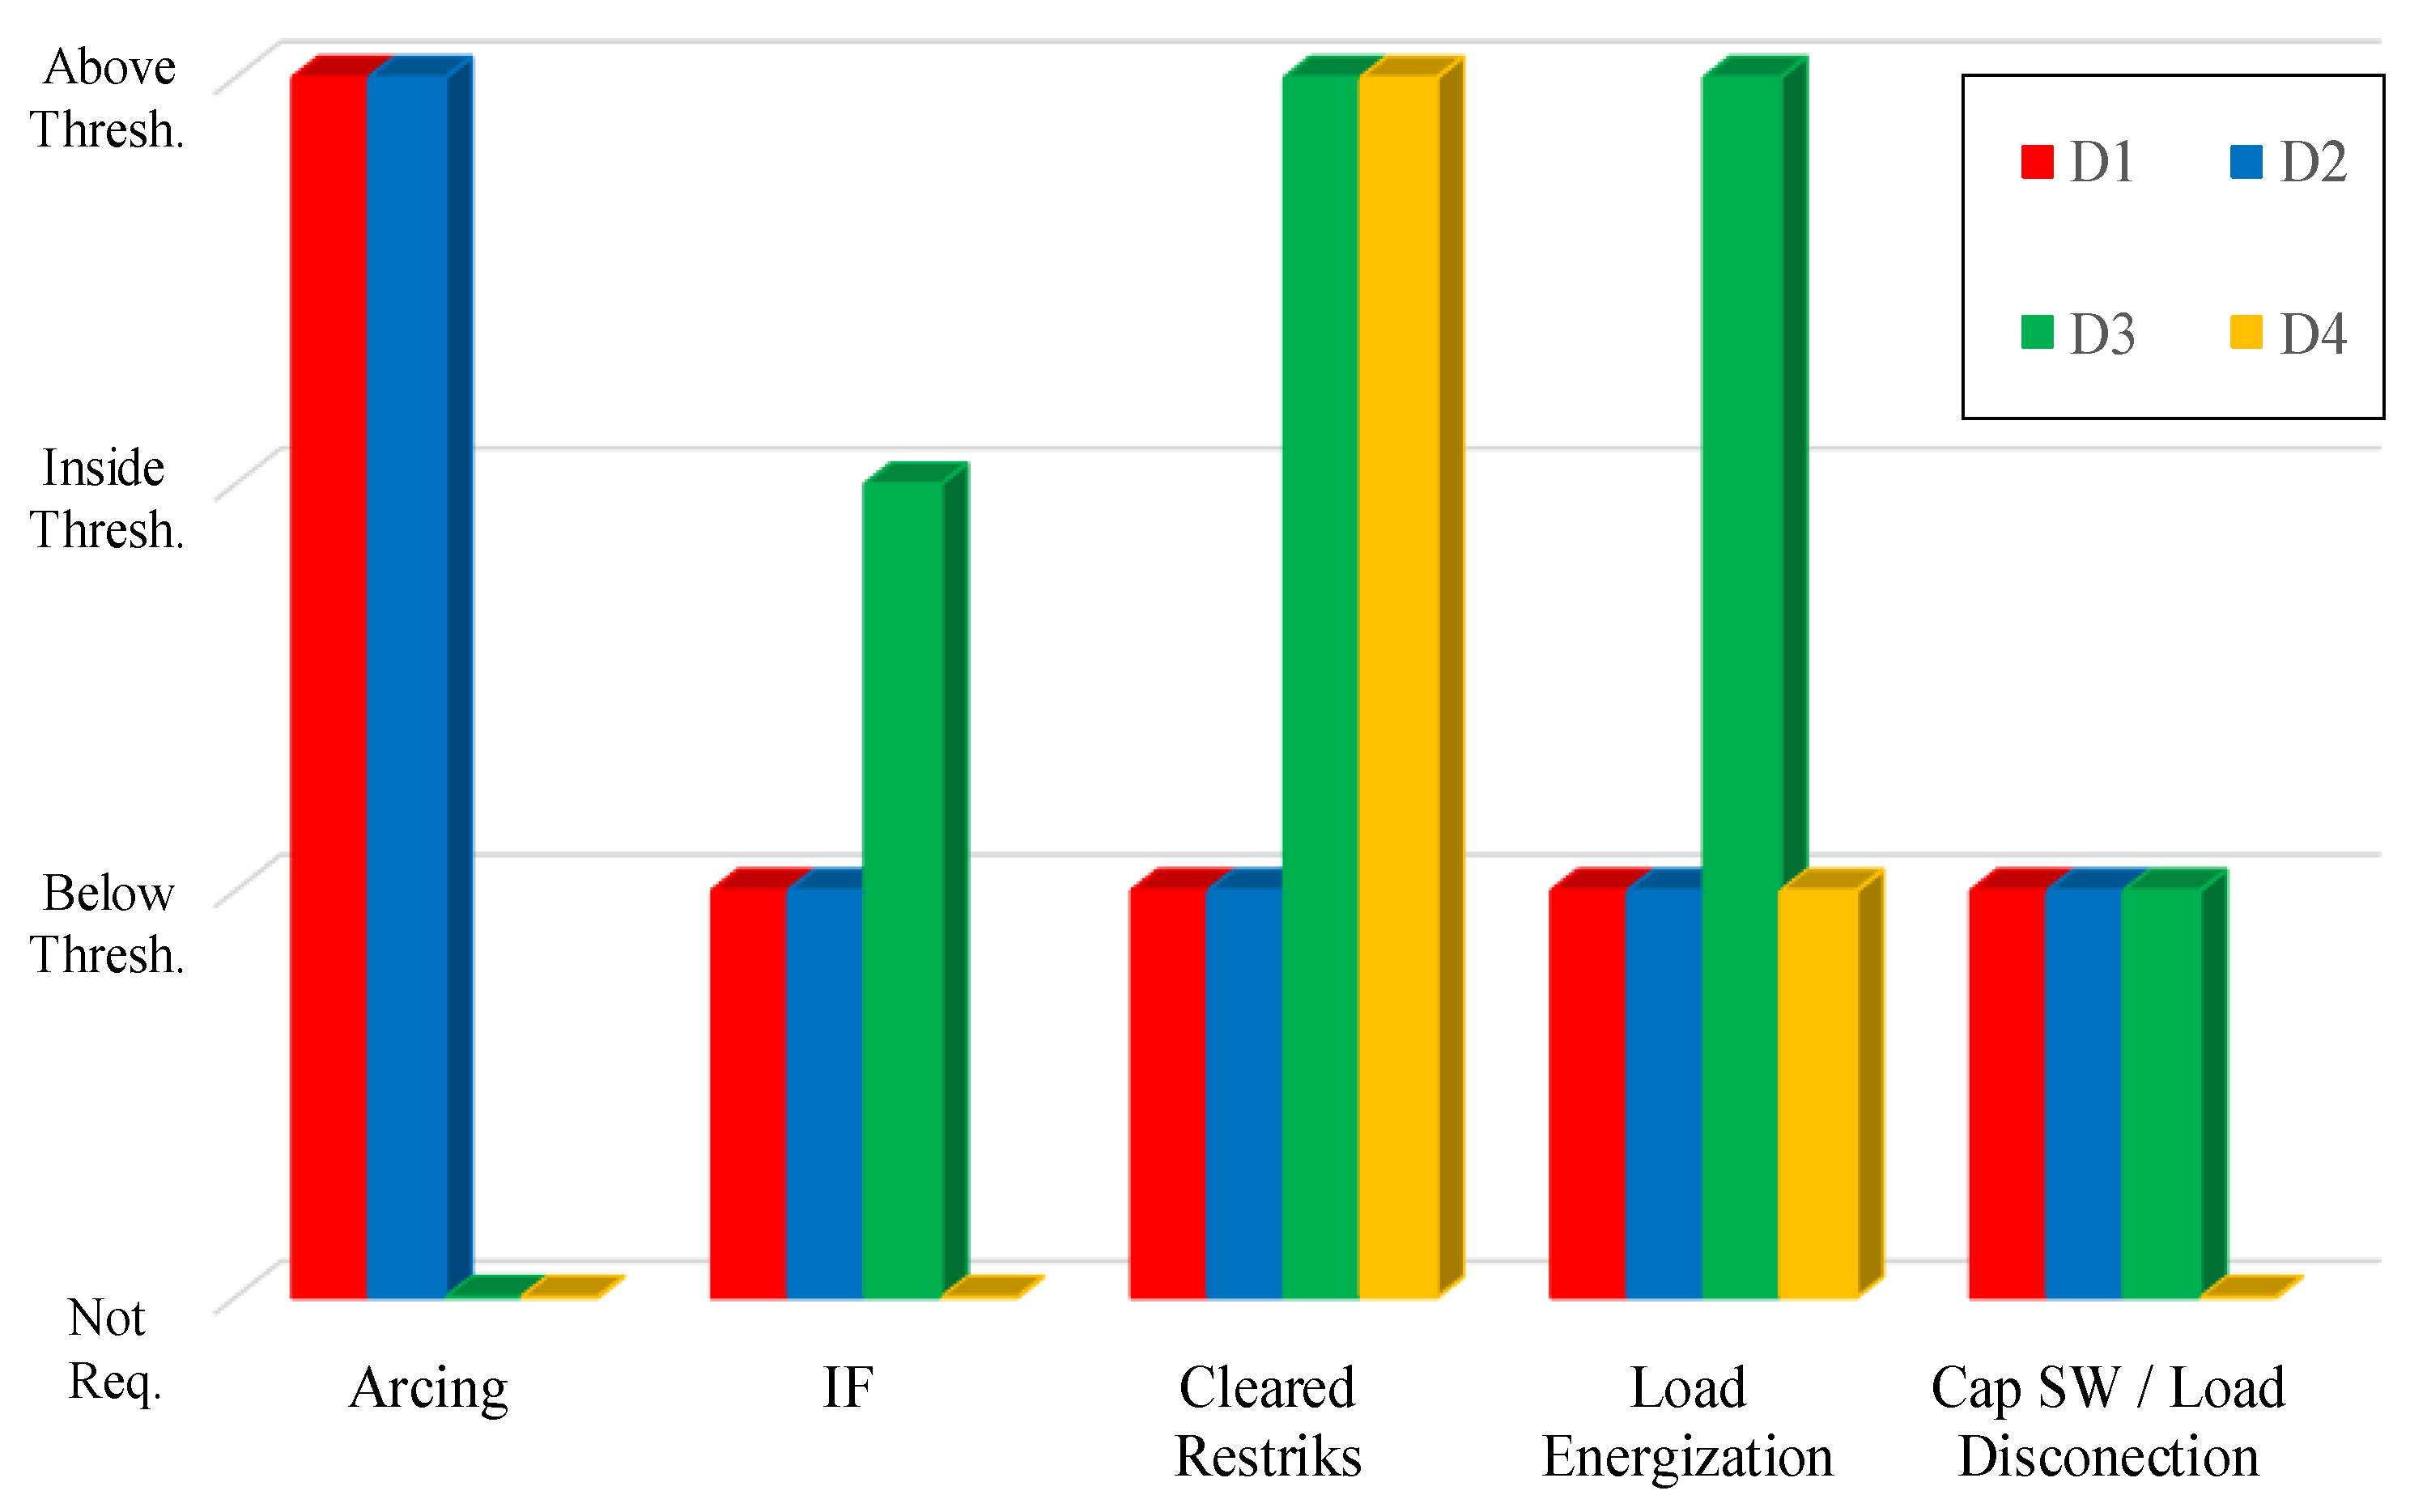
Figure 13 shows the relation between detected events and the DT inputs along with their respective thresholds. All C.A.E. are similar to each other and the action that must be taken is to trip the feeder. If there is a need to distinguish between a failing CB due to de-energization of a bank, a permanent fault or a HIF, a simple information from SCADA can be incorporated to the DT general classification which informs whether a bank de-energization took place to readily identify the issue. The permanent faults will trip the feeder automatically without the need of a tripping command from the DT, thus allowing the HIFs to be identified. Similar information can be incorporated to distinguish between a capacitor energization and load disconnection to distinguish if a bank energization is applied. Table 4 shows all events that can be identified precisely with the help of SCADA information.
The thresholds that are set in the DT algorithm were based on an intensive testing for different system configurations, load changes, fault distances, fault resistance values, inception time, etc. Based on testing results, the of and are set to 0.02 for both test feeders.
Furthermore, based on the 60 dB white noise level, the threshold of was set at ±0.4% of the pre-transient RMS, as shown in Figure 9b. Additionally, the threshold of was set to be 50% higher than the 12th cycle peak. However, this threshold can be changed (e.g., to 40%) to allow for an early warning or can be set in field during bank de-energization.
A DT flowchart is depicted in Figure 14. All events are distinguished clearly from one another. Thus, every event has its own action and notification messages allowing a very low rate of misclassification for all detected events.
4. Simulation and Discussion
The proposed method was tested on the IEEE 13- and IEEE 34-bus test feeders, described in [29]. These feeders were chosen due to the high unbalanced loading, and the large size of the network, respectively. Each feeder was modeled as a resistance-inductance-capacitance (RLC) network using MATLAB/SIMULINK (2013a, MathWorks, Inc., Natick, MA, USA). Considering many scenarios, the case studies included the following conditions and parameters on both test feeders when applicable:
- Testing for all events at a single moment in time (permanent fault, HIF, IF, CB Restrikes, etc.),
- The same values for the thresholds are used for both test feeders,
- Changing HIF currents, from 15 to 75 A [3],
- Testing single and multi-phase events (permanent fault, HIF, restrikes),
- Fault types, balanced and unbalanced, grounded and ungrounded (permeant fault),
- Fault distance, location and inception angle (0°–360°)
- Changing fault resistance in IFs (zero to 130 Ω), (applicable for IEEE 13-Bus test feeder only),
- Unbalanced/balanced loading system,
- Noise levels to current waveforms set to SNR = 60 dB.
4.1. IEEE 13-Bus Test Feeder
The system was tested at different loading scenarios where the worst case was when the neutral-current RMS in normal steady state operation was around 150 A. The simulated events on this feeder are summarized in Table 5. All major events (permanent fault, HIF, IF and restrikes) are detected and classified correctly. This is due the fact that these events are producing a high 3rd harmonic component and consequently affecting the magnitude of CWT and the 8th scale. Other events were also detected and classified correctly. It should be mentioned that permanent, HIFs, and failed CB are considered as C.A.E. and the DT classify them as such. However, the previously discussed logic can help to overcome the issue.
Though, there are some undetected events in load energization and capacitor energization, these are due to a small change in the current and happened near the zero crossing of the neutral current where the harmonic presence is insignificant. Nonetheless, they can be detected using the RMS current but they are considered as N.Op., and will not have a negative effect on the system to require a detection.
4.2. IEEE 34-Bus Test Feeder
Unlike the previous case, this system is a long feeder consisting of overhead lines only and lightly loaded. The IF events are not simulated since they occur mainly in defected underground cables. The simulated events on this feeder are shown in Table 5. All major events (permanent fault, HIF, and restrikes) are detected and classified correctly. Furthermore, all N.Op. events are detected and classified correctly. This was due to the small neutral current at the substation unlike the previous case.
It must be mentioned that the limitation of the method basically lies on the detection capabilities where any event that represents below (10–12%) of RMS of the processed neutral current was undetected. The detection delay was between (0.69–45 ms) and a final decision was made around 200 ms after detection. Finally, a comparison between the developed method and some references shows the different advantages of the method in Table 6.
5. Conclusions
A new method was proposed to detect the many events in radial distribution feeders using the wavelet-DT technique for detection and classification. The only required measurements are the three phase current signals. The current of the neutral can be obtained by summing the latter. Using only the current of the neutral, the arcing events caused by HIFs and permanent faults as well as failed CB de-energization can be detected and classified. However, incorporating the phase currents will allow for other events to be classified. The SCADA information is not a necessity but helps to identify some of the events effortlessly.
This method has the following advantages: (a) an ability to detect major events with less computation; (b) it uses only current measurements; (c) it has a fast decision of around 245 ms; (d) an ability to detect very high impedance Ifs; (e) a detection of CB restrikes at the substation level; and (f) it does not require a large hardware to implement.
Acknowledgments
The work in this paper was supported by the Power Research Program at SIUC that is funded by the Ameren Corporation USA.
Author Contributions
Mishari Metab Almalki put forward the research ideas behind this paper, developed the algorithm and performed the simulations; Constantine J. Hatziadoniu analyzed the results; both authors contributed to the writing and editing of this manuscript.
Conflicts of Interest
The authors declare no conflict of interest.
References
- Kazemi, S.; Lehtonen, M.; Fotuhi-Firuzabad, M. Impacts of Fault Diagnosis Schemes on Distribution System Reliability. IEEE Trans. Smart Grid 2012, 3, 720–727. [Google Scholar] [CrossRef]
- Russell, B.D.; Benner, C.L. Intelligent Systems for Improved Reliability and Failure Diagnosis in Distribution Systems. IEEE Trans. Smart Grid 2010, 1, 48–56. [Google Scholar] [CrossRef]
- Aucoin, B.M.; Jones, R.H. High impedance fault detection implementation issues. IEEE Trans. Power Deliv. 1996, 11, 139–148. [Google Scholar] [CrossRef]
- Sedighizadeh, M.; Rezazadeh, A.; Elkalashy, N.I. Approaches in High Impedance fault detection-A Chronological Review. Adv. Electr. Comput. Eng. 2010, 10, 114–128. [Google Scholar] [CrossRef]
- Benner, C.L.; Russell, B.D. Practical high-impedance fault detection on distribution feeders. IEEE Trans. Ind. Appl. 1997, 33, 635–640. [Google Scholar] [CrossRef]
- Santos, W.C.; Lopes, F.V.; Brito, N.S.D.; Souza, B.A. High-Impedance Fault Identification on Distribution Networks. IEEE Trans. Power Deliv. 2017, 32, 23–32. [Google Scholar] [CrossRef]
- Michalik, M.; Rebizant, W.; Lukowicz, M.; Lee, S.J.; Kang, S.H. High-impedance fault detection in distribution networks with use of wavelet-based algorithm. IEEE Trans. Power Deliv. 2006, 21, 1793–1802. [Google Scholar] [CrossRef]
- Gautam, S.; Brahma, S.M. Detection of High Impedance Fault in Power Distribution Systems Using Mathematical Morphology. IEEE Trans. Power Syst. 2013, 28, 1226–1234. [Google Scholar] [CrossRef]
- Kulkarni, S.; Santoso, S.; Short, T.A. Incipient Fault Location Algorithm for Underground Cables. IEEE Trans. Smart Grid 2014, 5, 1165–1174. [Google Scholar] [CrossRef]
- Sidhu, T.S.; Xu, Z. Detection of Incipient Faults in Distribution Underground Cables. IEEE Trans. Power Deliv. 2010, 25, 1363–1371. [Google Scholar] [CrossRef]
- Zhang, W.; Xiao, X.; Zhou, K.; Xu, W.; Jing, Y. Multicycle Incipient Fault Detection and Location for Medium Voltage Underground Cable. IEEE Trans. Power Deliv. 2017, 32, 1450–1459. [Google Scholar] [CrossRef]
- Ghanbari, T. Kalman filter based incipient fault detection method for underground cables. IET Gener. Transm. Distrib. 2015, 9, 1988–1997. [Google Scholar] [CrossRef]
- Kasztenny, B.; Voloh, I.; Jones, C.G.; Baroudi, G. Detection of Incipient Faults in Underground Medium Voltage Cables. In Proceedings of the 61st Annual Conference for Protective Relay Engineers, College Station, TX, USA, 1–3 April 2008. [Google Scholar]
- Xu, Z. Fault Location and Incipient Fault Detection in Distribution Cables. Ph.D. Thesis, The University of Western Ontario, London, ON, Canada, 2011. [Google Scholar]
- IEEE. IEEE Guide for the Application of Shunt Power Capacitors; IEEE Std 1036-2010 (Revision of IEEE Std 1036-1992); IEEE: Piscataway Township, NJ, USA, 2011; pp. 1–88. [Google Scholar]
- Almalki, M.M.; Chehardeh, M.I.; Hatziadoniu, C.J. Capacitor Bank Switching Transient Analysis Using Frequency Dependent Network Equivalents. In Proceedings of the North American Power Symposium (NAPS), Charlotte, NC, USA, 4–6 October 2015. [Google Scholar]
- Kasztenny, B.; Voloh, I.; Depew, A.; Wolete, J.; Pickett, B.; Baker, A.; Signo-Diaz, M.; Schaefer, J.; Meinardi, J. Re-strike and Breaker Failure Conditions for Circuit Breakers Connecting Capacitor Banks. In Proceedings of the 61st Annual Conference for Protective Relay Engineers, College Station, TX, USA, 1–3 April 2008. [Google Scholar]
- Kam, S.C.; Nielsen, S.; Ledwich, G. A Circuit-Breaker Restrike Diagnostic Algorithm Using ATP and Wavelet Transforms. In Proceedings of the 21st Australasian Universities Power Engineering Conference (AUPEC), Brisbane, QLD, Australia, 25–28 September 2011. [Google Scholar]
- Zhang, W.; Jing, Y.; Xiao, X. Model-Based General Arcing Fault Detection in Medium-Voltage Distribution Lines. IEEE Trans. Power Deliv. 2016, 31, 2231–2241. [Google Scholar] [CrossRef]
- Addison, P.S. The Illustrated Wavelet Transform Handbook: Introductory Theory and Applications in Science, Engineering, Medicine and Finance, 2nd ed.; CRC Press: Boca Raton, FL, USA, 2017; pp. 7–91. ISBN 978-1-48-225132-6. [Google Scholar]
- Tse, N.C.; Lai, L.L. Wavelet-based algorithm for signal analysis. EURASIP J. Appl. Signal Process. 2007, 169. [Google Scholar] [CrossRef]
- Zamanan, N.; Sykulski, J. The Evolution of High Impedance Fault Modeling. In Proceedings of the 16th International Conference on Harmonics and Quality of Power (ICHQP), Bucharest, Romania, 25–28 May 2014. [Google Scholar]
- Sultan, A.F.; Swift, G.W.; Fedirchuk, D.J. Detecting arcing downed-wires using fault current flicker and half-cycle asymmetry. IEEE Trans. Power Deliv. 1994, 9, 461–470. [Google Scholar] [CrossRef]
- Bizjak, G.; Zunko, P.; Povh, D. Combined model of SF6 circuit breaker for use in digital simulation programs. IEEE Trans. Power Deliv. 2004, 19, 174–180. [Google Scholar] [CrossRef]
- Leung, S.Y.; Snider, L.A.; Wong, C.S. SF6 Generator Circuit Breaker Modeling. In Proceedings of the International Conference on Power Systems Transients (IPST), Montreal, QC, Canada, 19–23 June 2005. [Google Scholar]
- Habedank, U.; Knobloch, H. Zero-crossing measurements as a tool in the development of high-voltage circuit breakers. IEE Proc. Sci. Meas. Technol. 2001, 148, 268–272. [Google Scholar] [CrossRef]
- Teolis, A. Computational Signal Processing with Wavelets; Birkhäuser: Boston, MA, USA, 1998; pp. 59–84. ISBN 0-8176-3909-8. [Google Scholar]
- Kijewski, T.; Kareem, A. On the presence of end effects and their melioration in wavelet-based analysis. J. Sound Vib. 2002, 256, 980–988. [Google Scholar] [CrossRef]
- Distribution Test Feeders. Available online: http://ewh.ieee.org/soc/pes/dsacom/testfeeders/index.html (accessed on 4 February 2018).
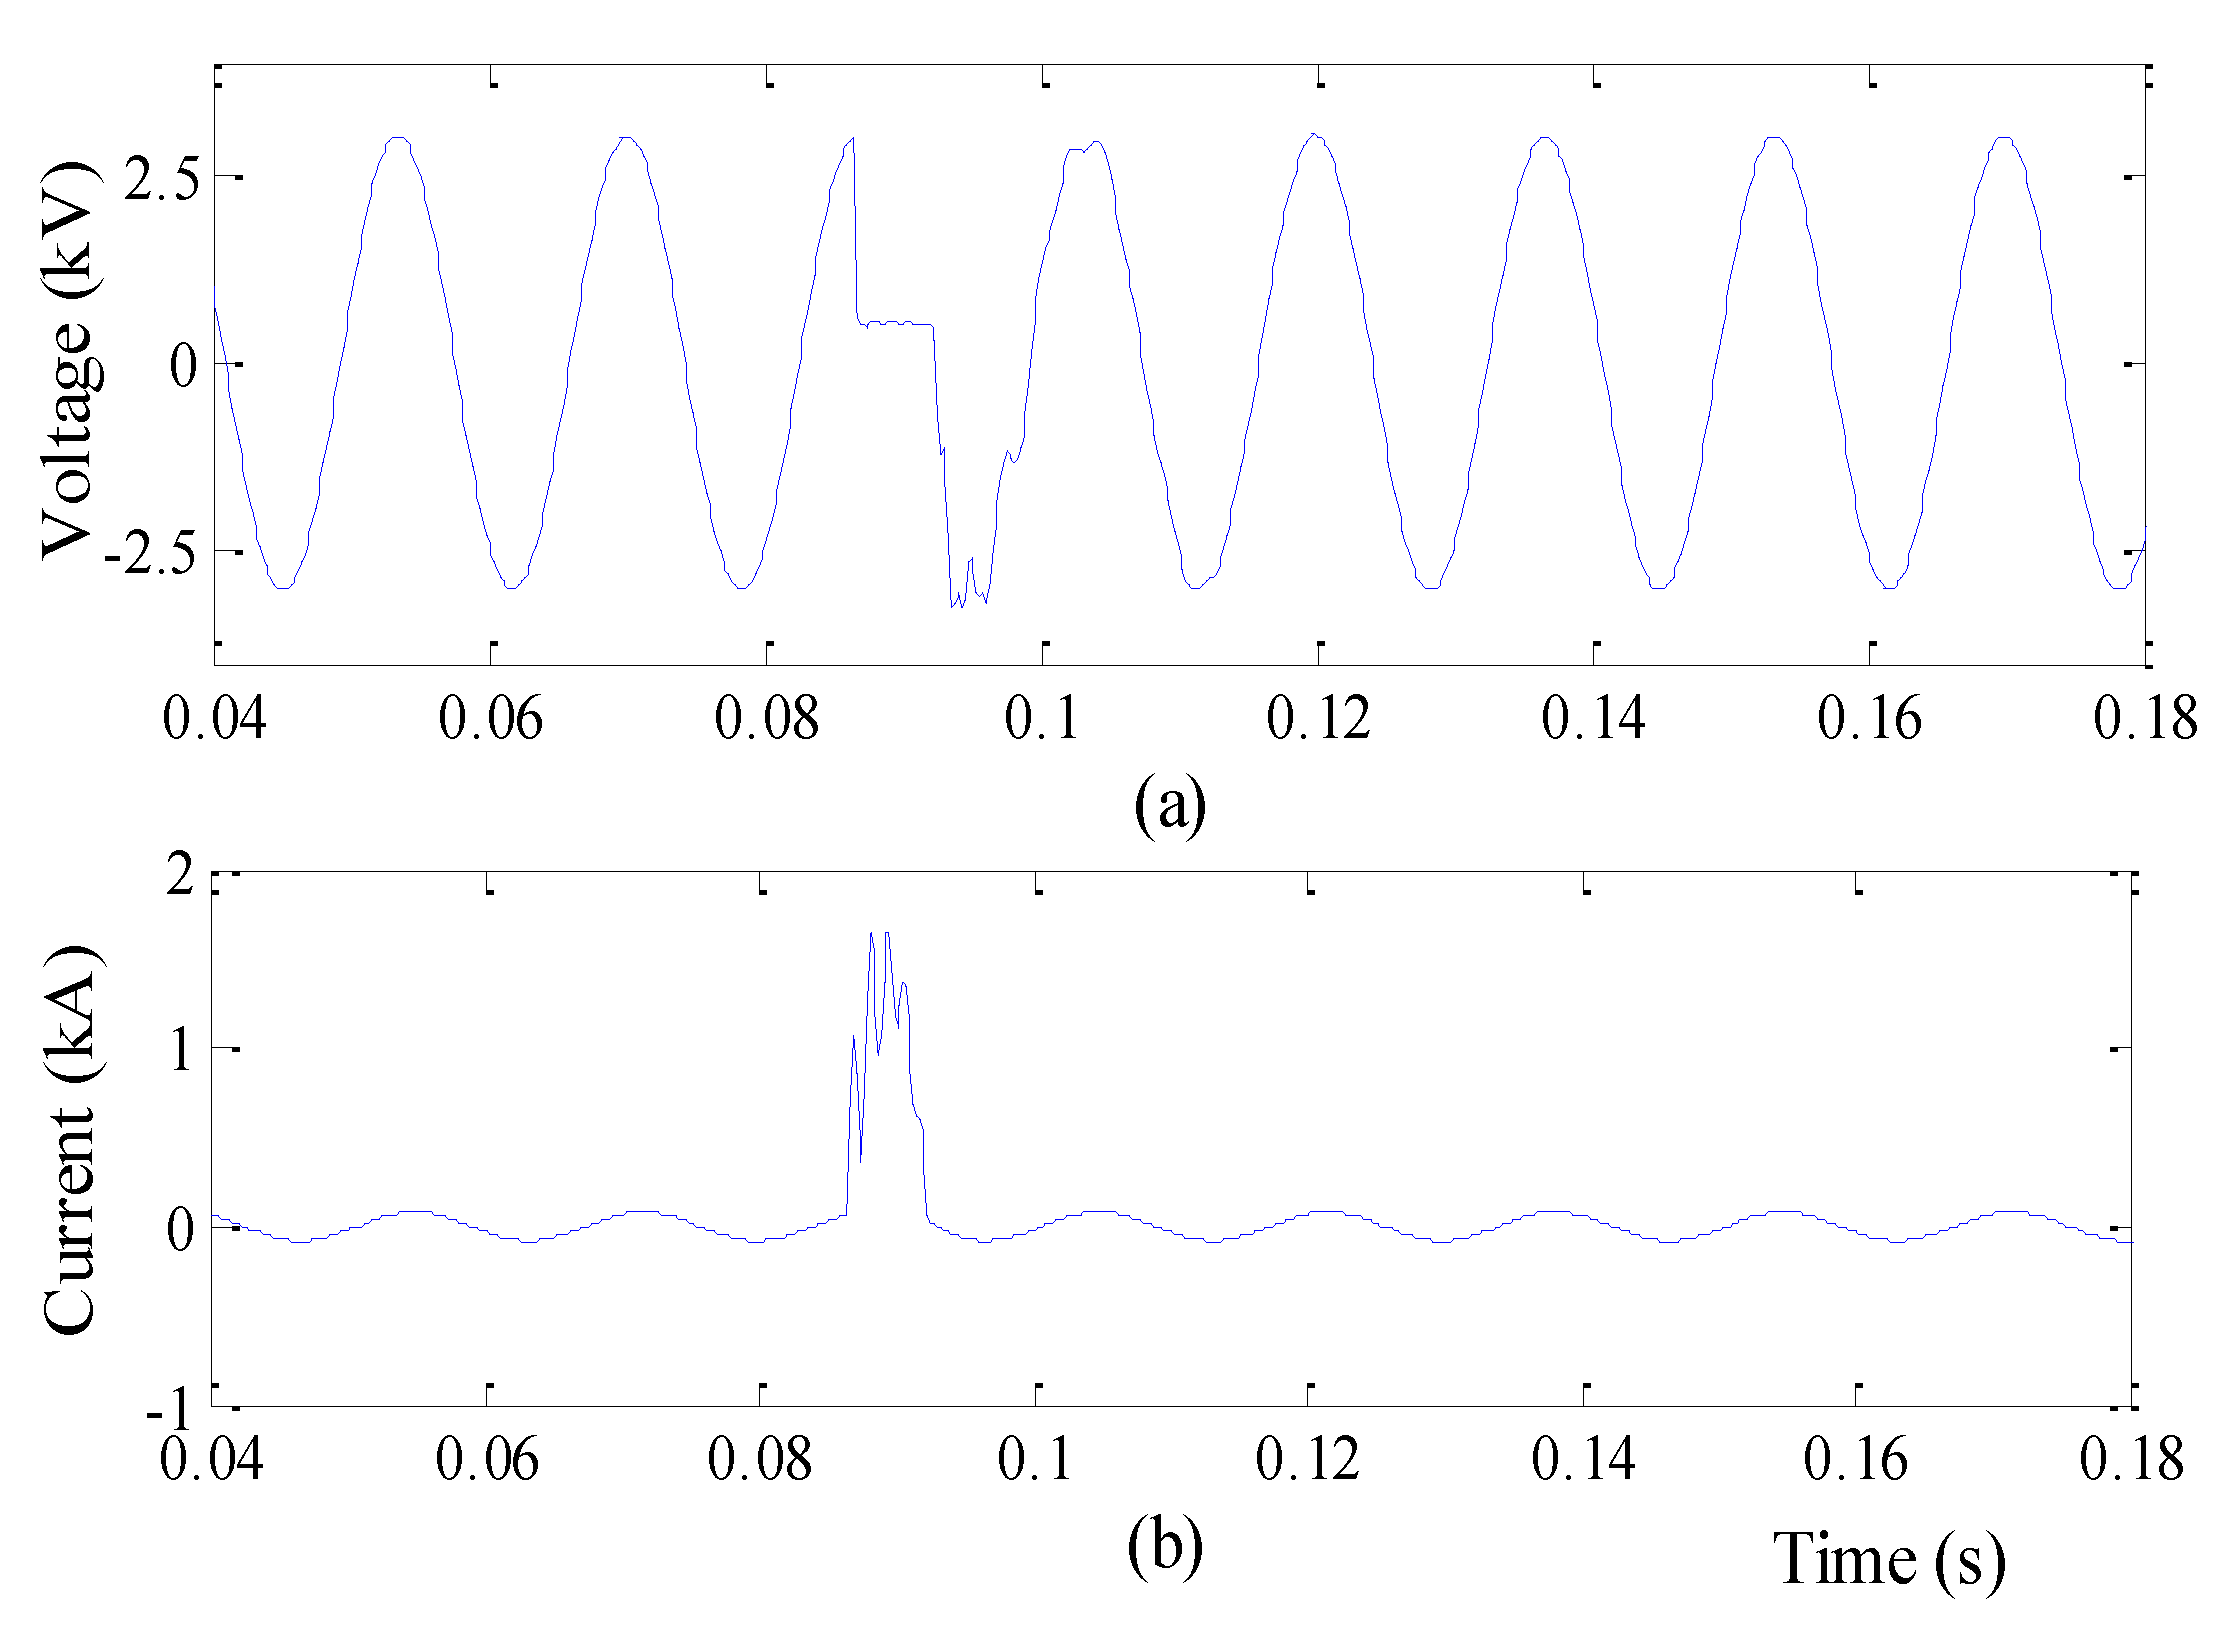
Figure 1.
Sub-cycle incipient fault (IF) event at fault location: (a) voltage; (b) current.

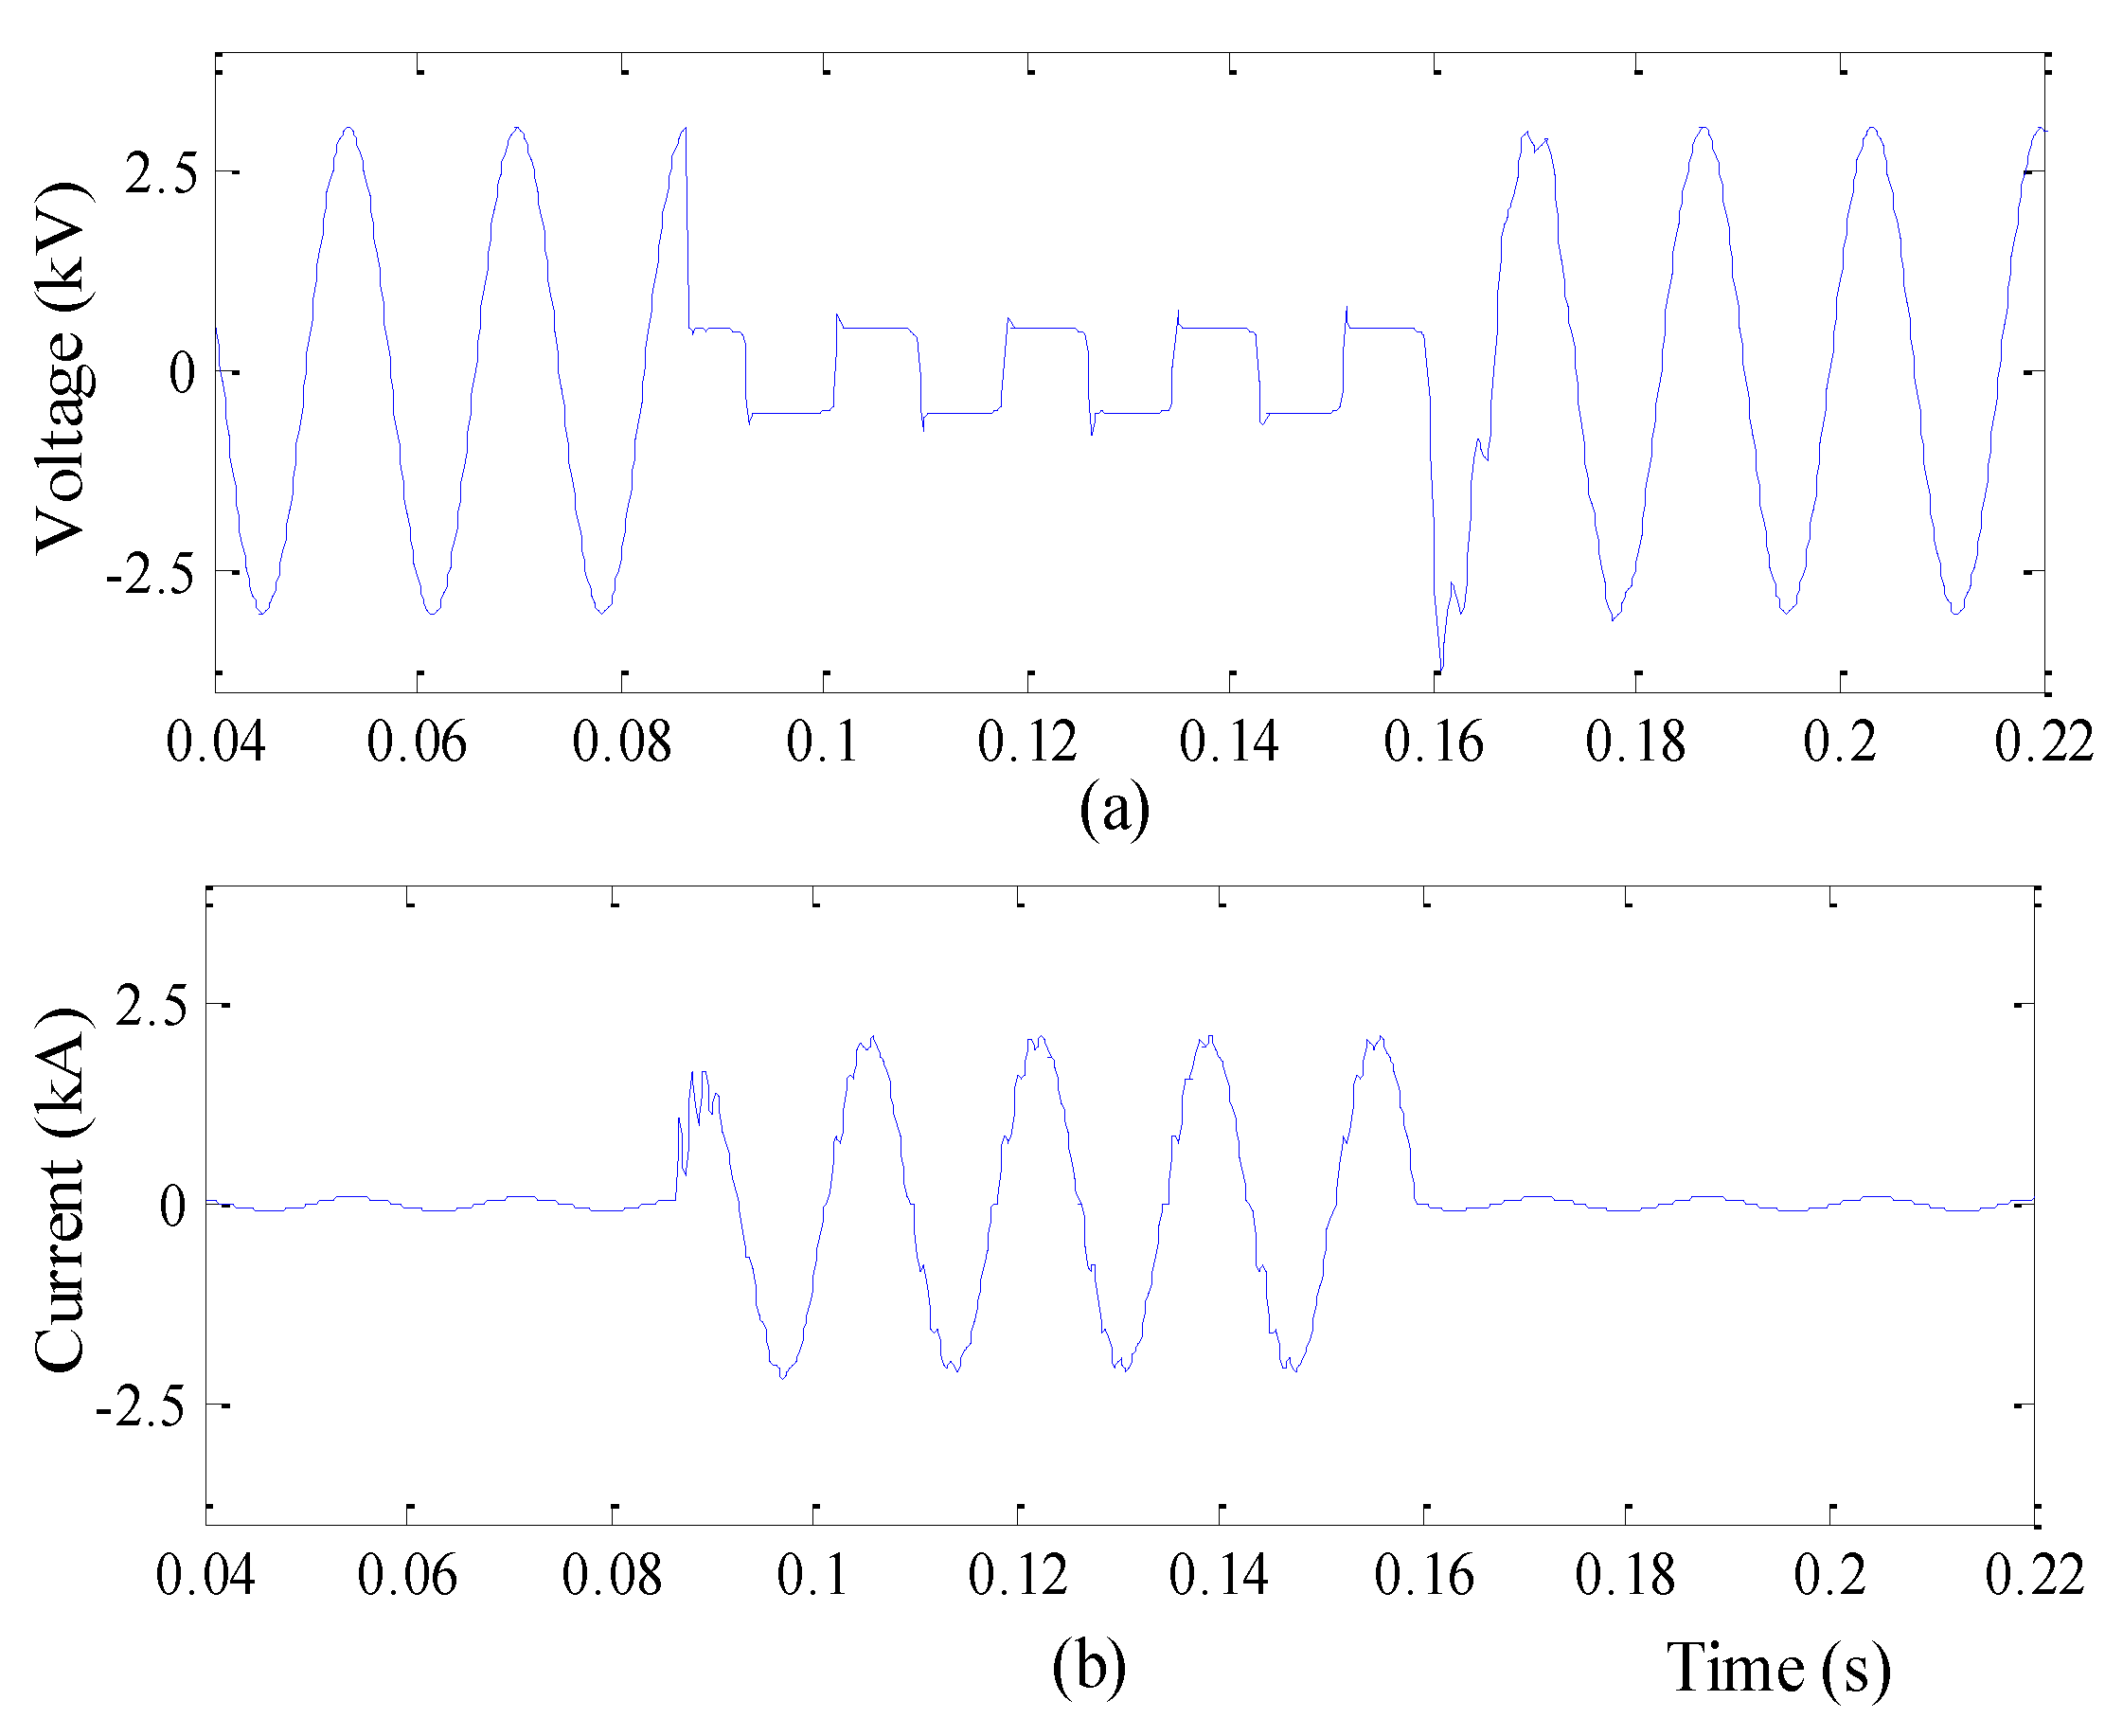
Figure 2.
Multi-cycle incipient fault (IF) event at fault location: (a) voltage; (b) current.

Figure 3.
The complex Moret wavelet (CMW) in (a) time domain () and (b) CMW at different scales.

Figure 4.
Different events show their effects on scales and time, (a) Incipient fault (IF); (b) Circuit breaker (CB) restrike during bank de-energization; (c) High impedance fault (HIF).
Figure 4.
Different events show their effects on scales and time, (a) Incipient fault (IF); (b) Circuit breaker (CB) restrike during bank de-energization; (c) High impedance fault (HIF).

Figure 5.
Flowchart of detection process. FFT: fast Fourier transform; CWT: continuous wavelet transform; DT: decision tree.
Figure 5.
Flowchart of detection process. FFT: fast Fourier transform; CWT: continuous wavelet transform; DT: decision tree.
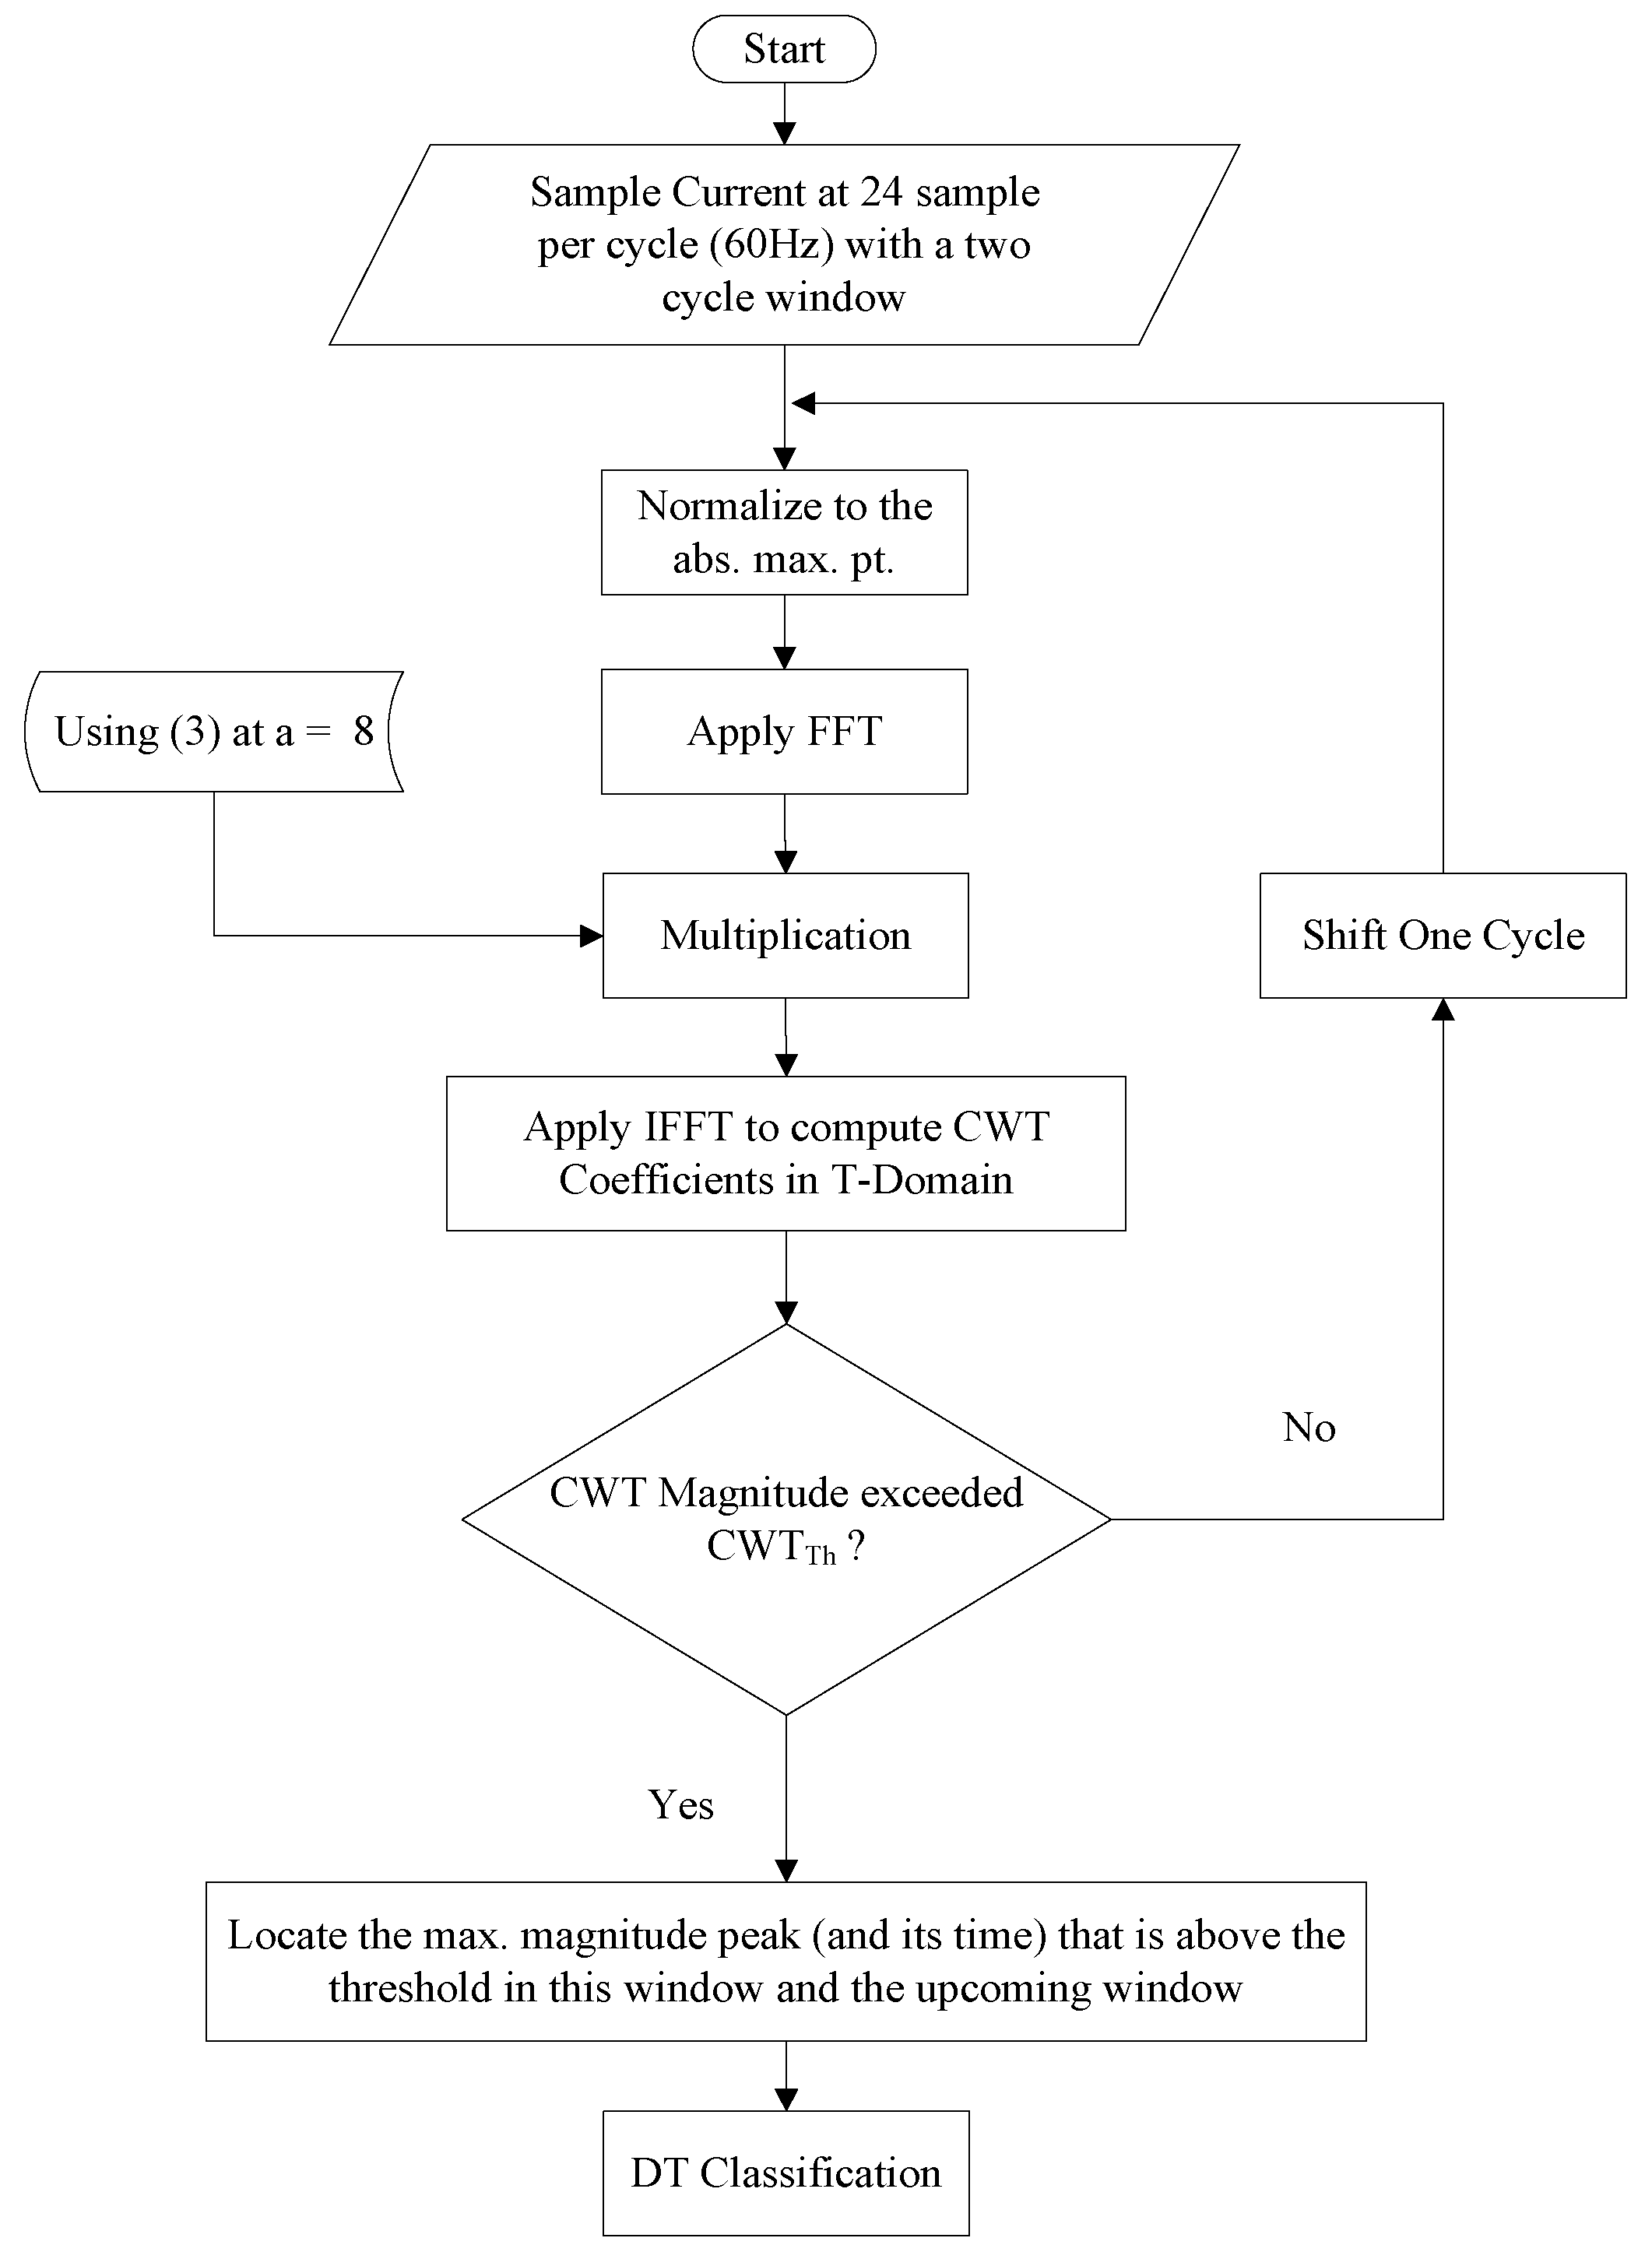
Figure 6.
Two-cycle window detection process, (a) ; (b) normalized 2nd–3rd cycles; (c) CWT of (b); (d) normalized 5th–6th cycles; (e) CWT of (d); (f) normalized 6th–7th cycles; (g) CWT of (f).
Figure 6.
Two-cycle window detection process, (a) ; (b) normalized 2nd–3rd cycles; (c) CWT of (b); (d) normalized 5th–6th cycles; (e) CWT of (d); (f) normalized 6th–7th cycles; (g) CWT of (f).
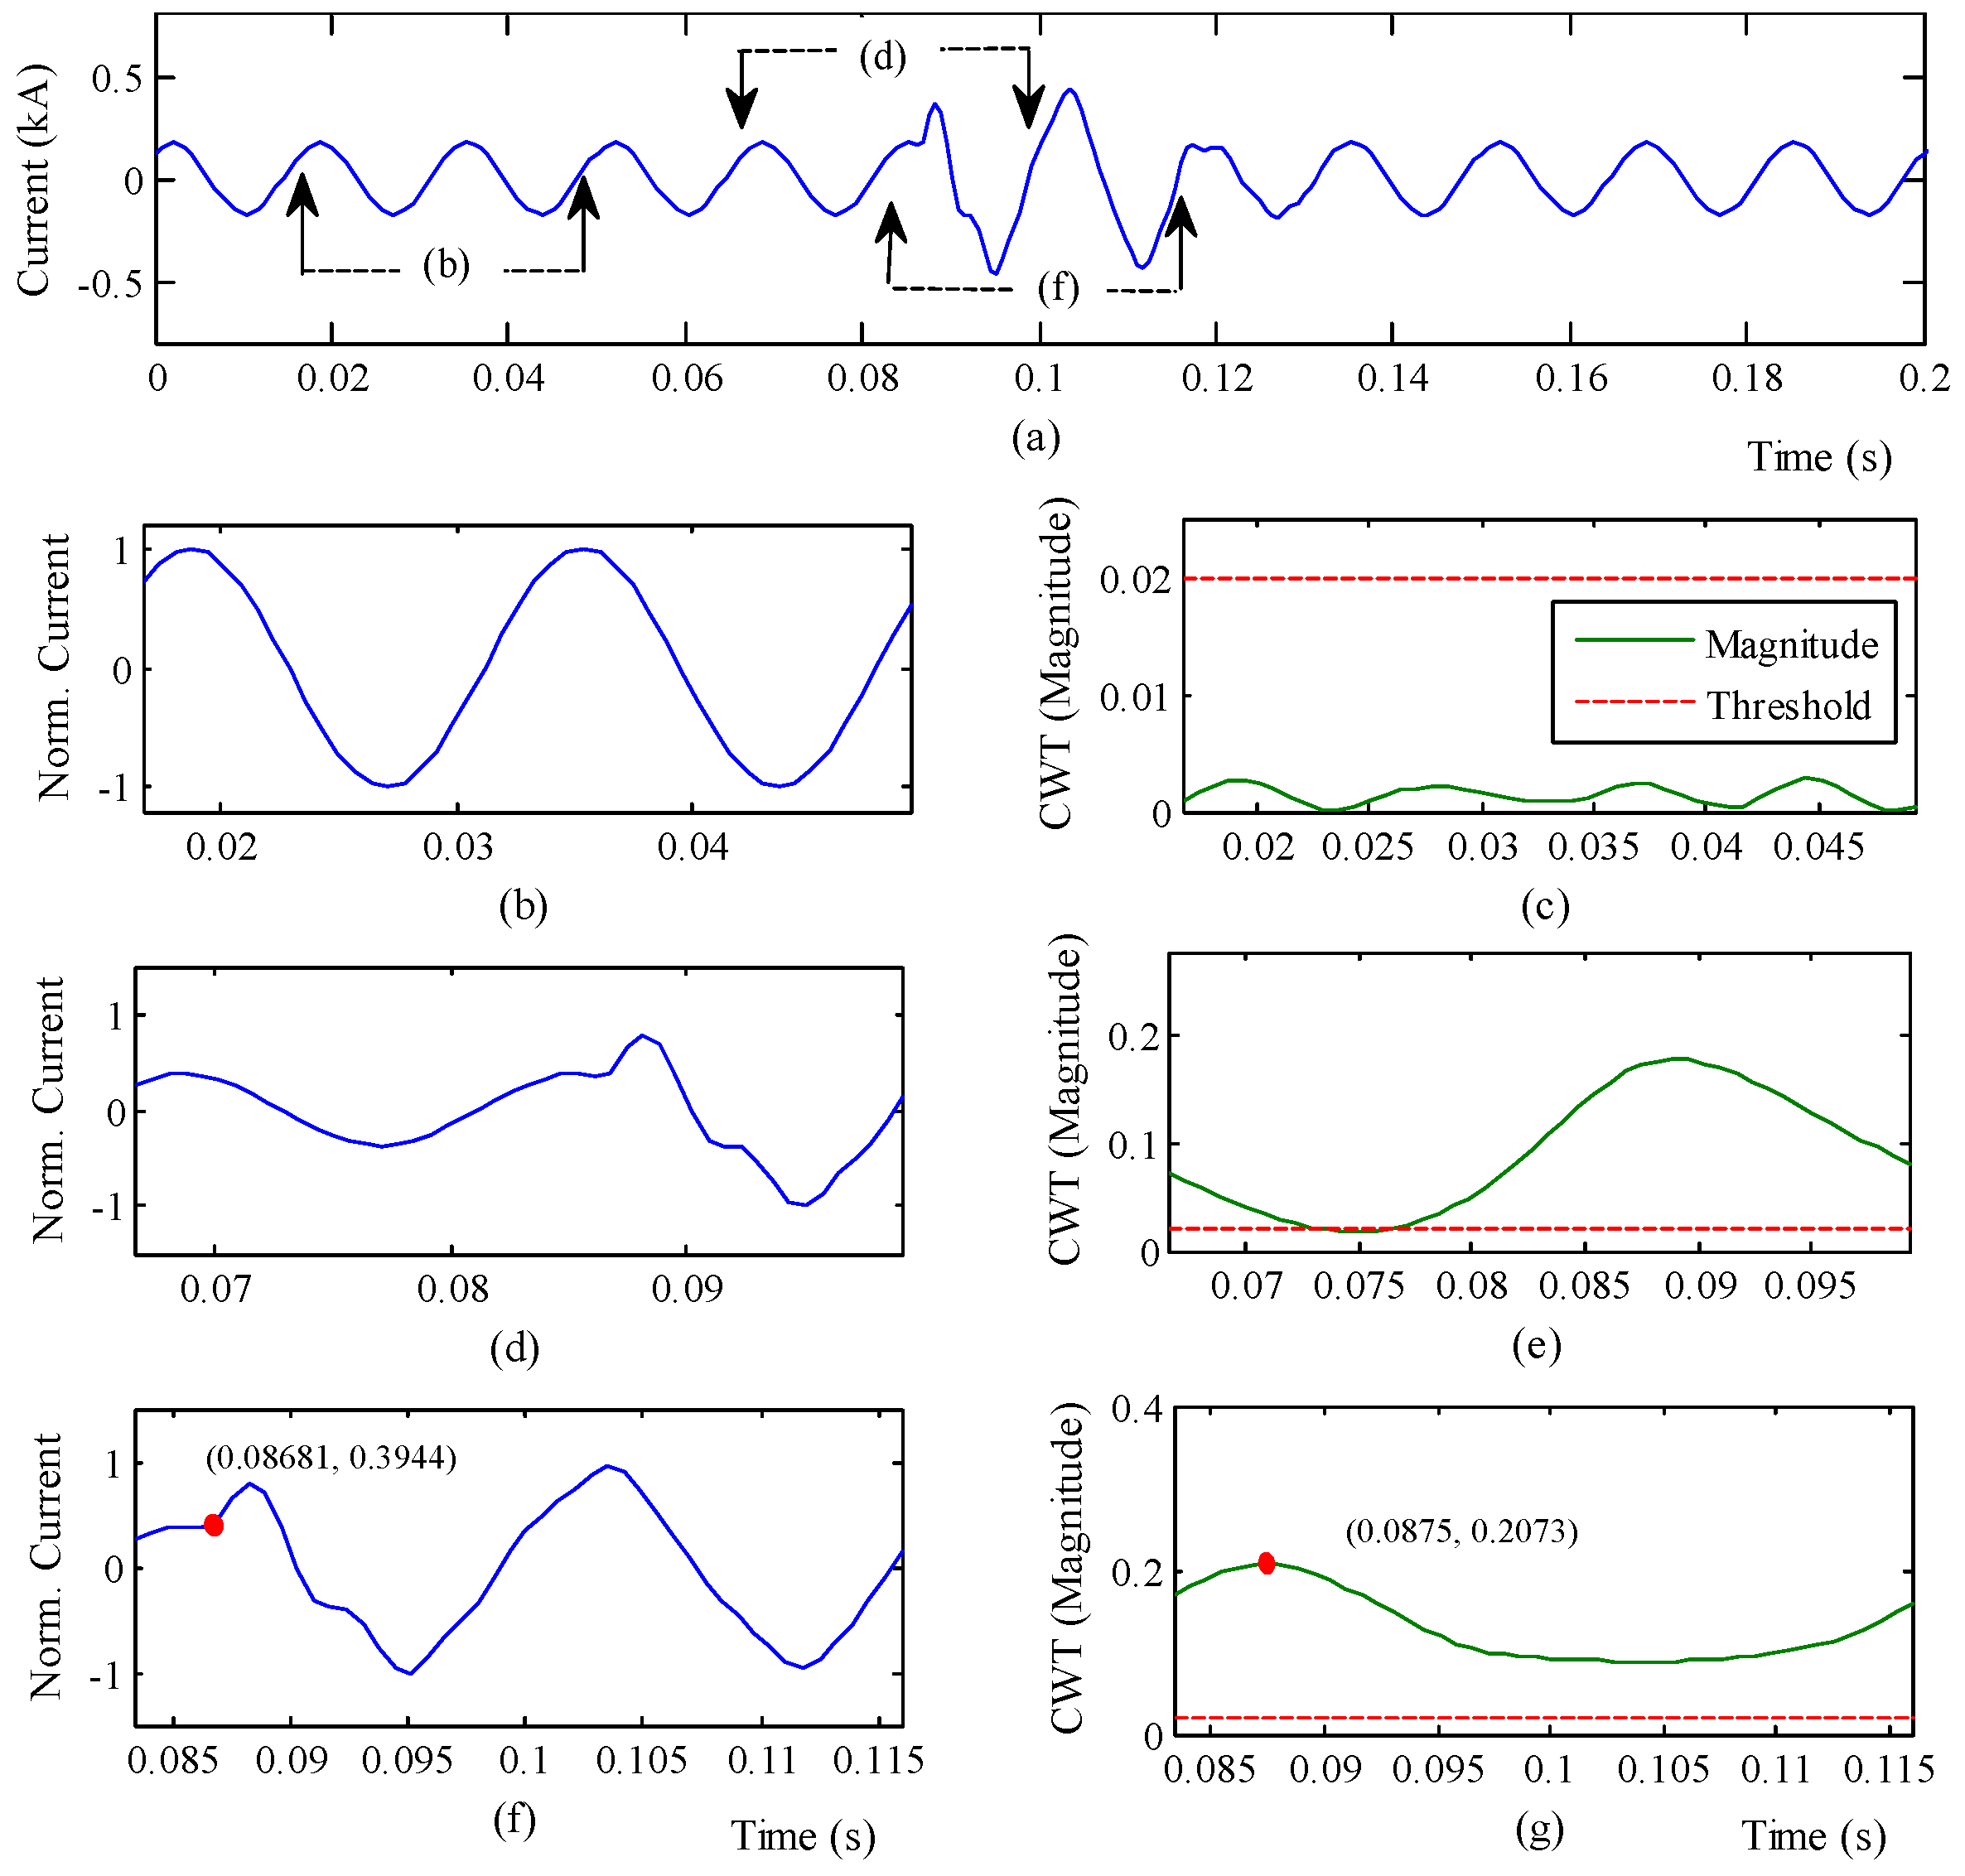
Figure 7.
HIF event in (13-Bus) is detected and classified, (a) ; (b) and of the normalized in the 11th–12th cycles.
Figure 7.
HIF event in (13-Bus) is detected and classified, (a) ; (b) and of the normalized in the 11th–12th cycles.

Figure 8.
Permanent Fault event in (13-Bus) is detected and classified, (a) ; (b) and of the normalized in the 11th–12th cycles.
Figure 8.
Permanent Fault event in (13-Bus) is detected and classified, (a) ; (b) and of the normalized in the 11th–12th cycles.

Figure 9.
Sub-cycle IF event (130 Ω) in (13-Bus) is detected and classified, (a) ; (b) ; (c) and of the normalized in the 11th–12th cycles.
Figure 9.
Sub-cycle IF event (130 Ω) in (13-Bus) is detected and classified, (a) ; (b) ; (c) and of the normalized in the 11th–12th cycles.
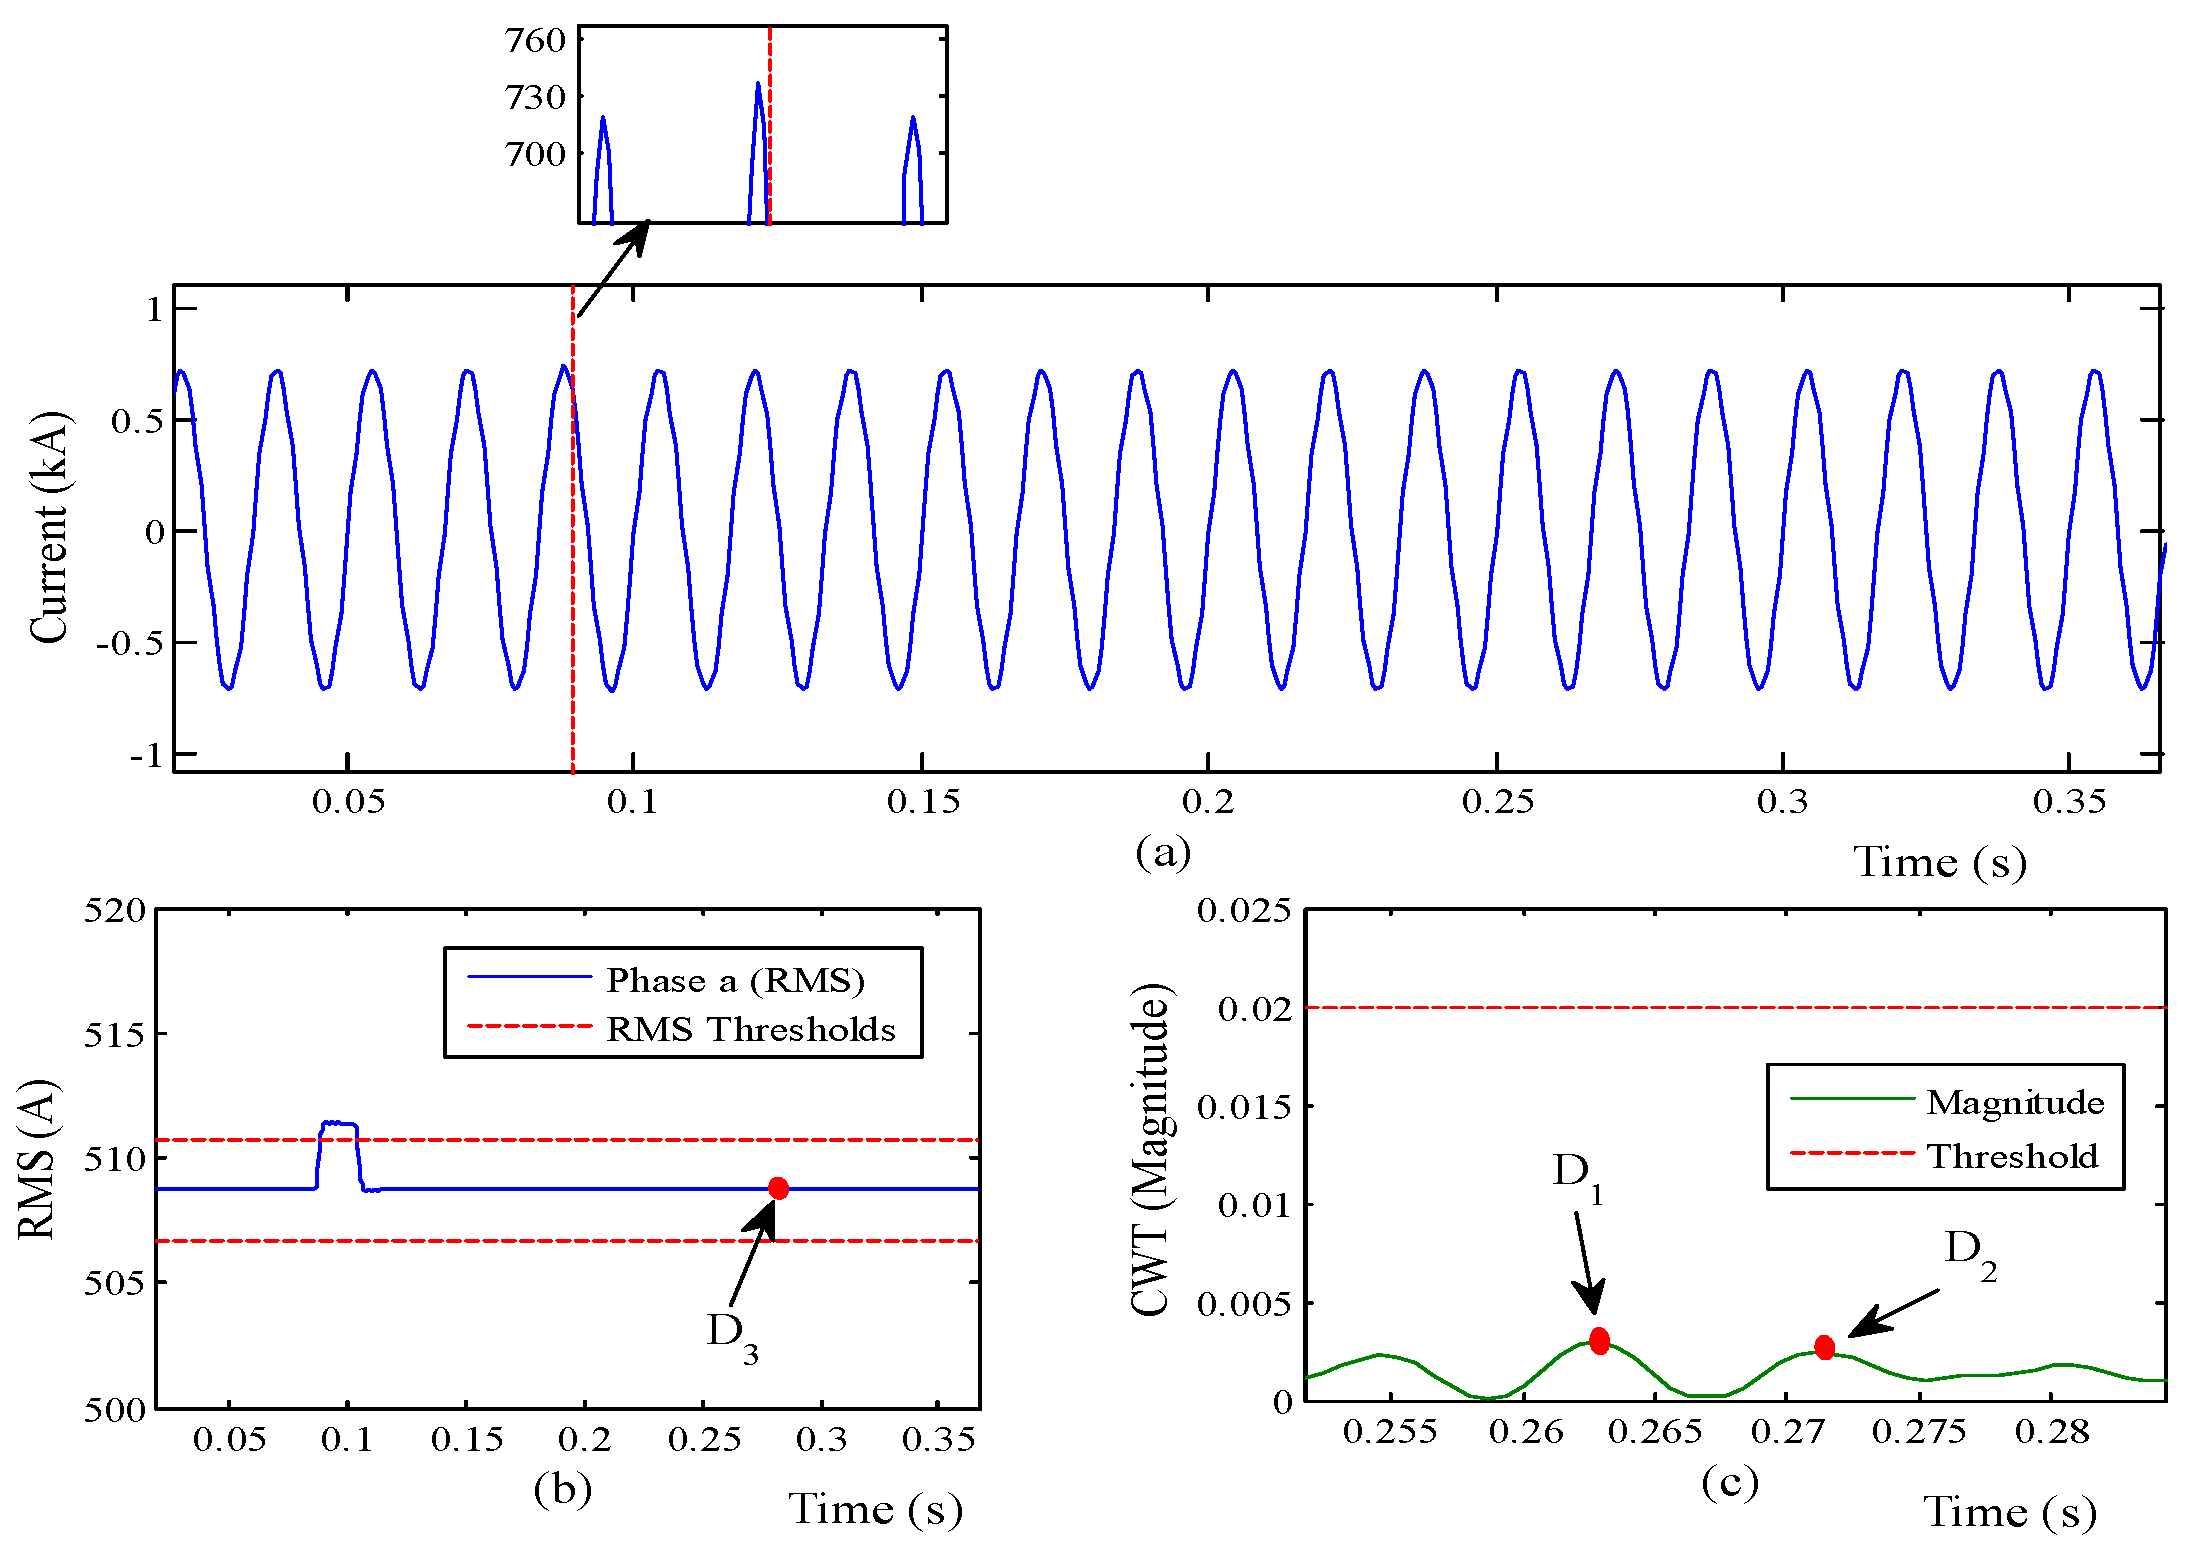
Figure 10.
Self-cleared CB restrike in (13-Bus) is detected and classified, (a) and ; (b) ; (c) and of the normalized in the 11th–12th cycles.
Figure 10.
Self-cleared CB restrike in (13-Bus) is detected and classified, (a) and ; (b) ; (c) and of the normalized in the 11th–12th cycles.

Figure 11.
Capacitor bank energization event in (13-Bus) is detected and classified, (a) ; (b) ; (c) of the normalized in the 11th–12th cycles.
Figure 11.
Capacitor bank energization event in (13-Bus) is detected and classified, (a) ; (b) ; (c) of the normalized in the 11th–12th cycles.
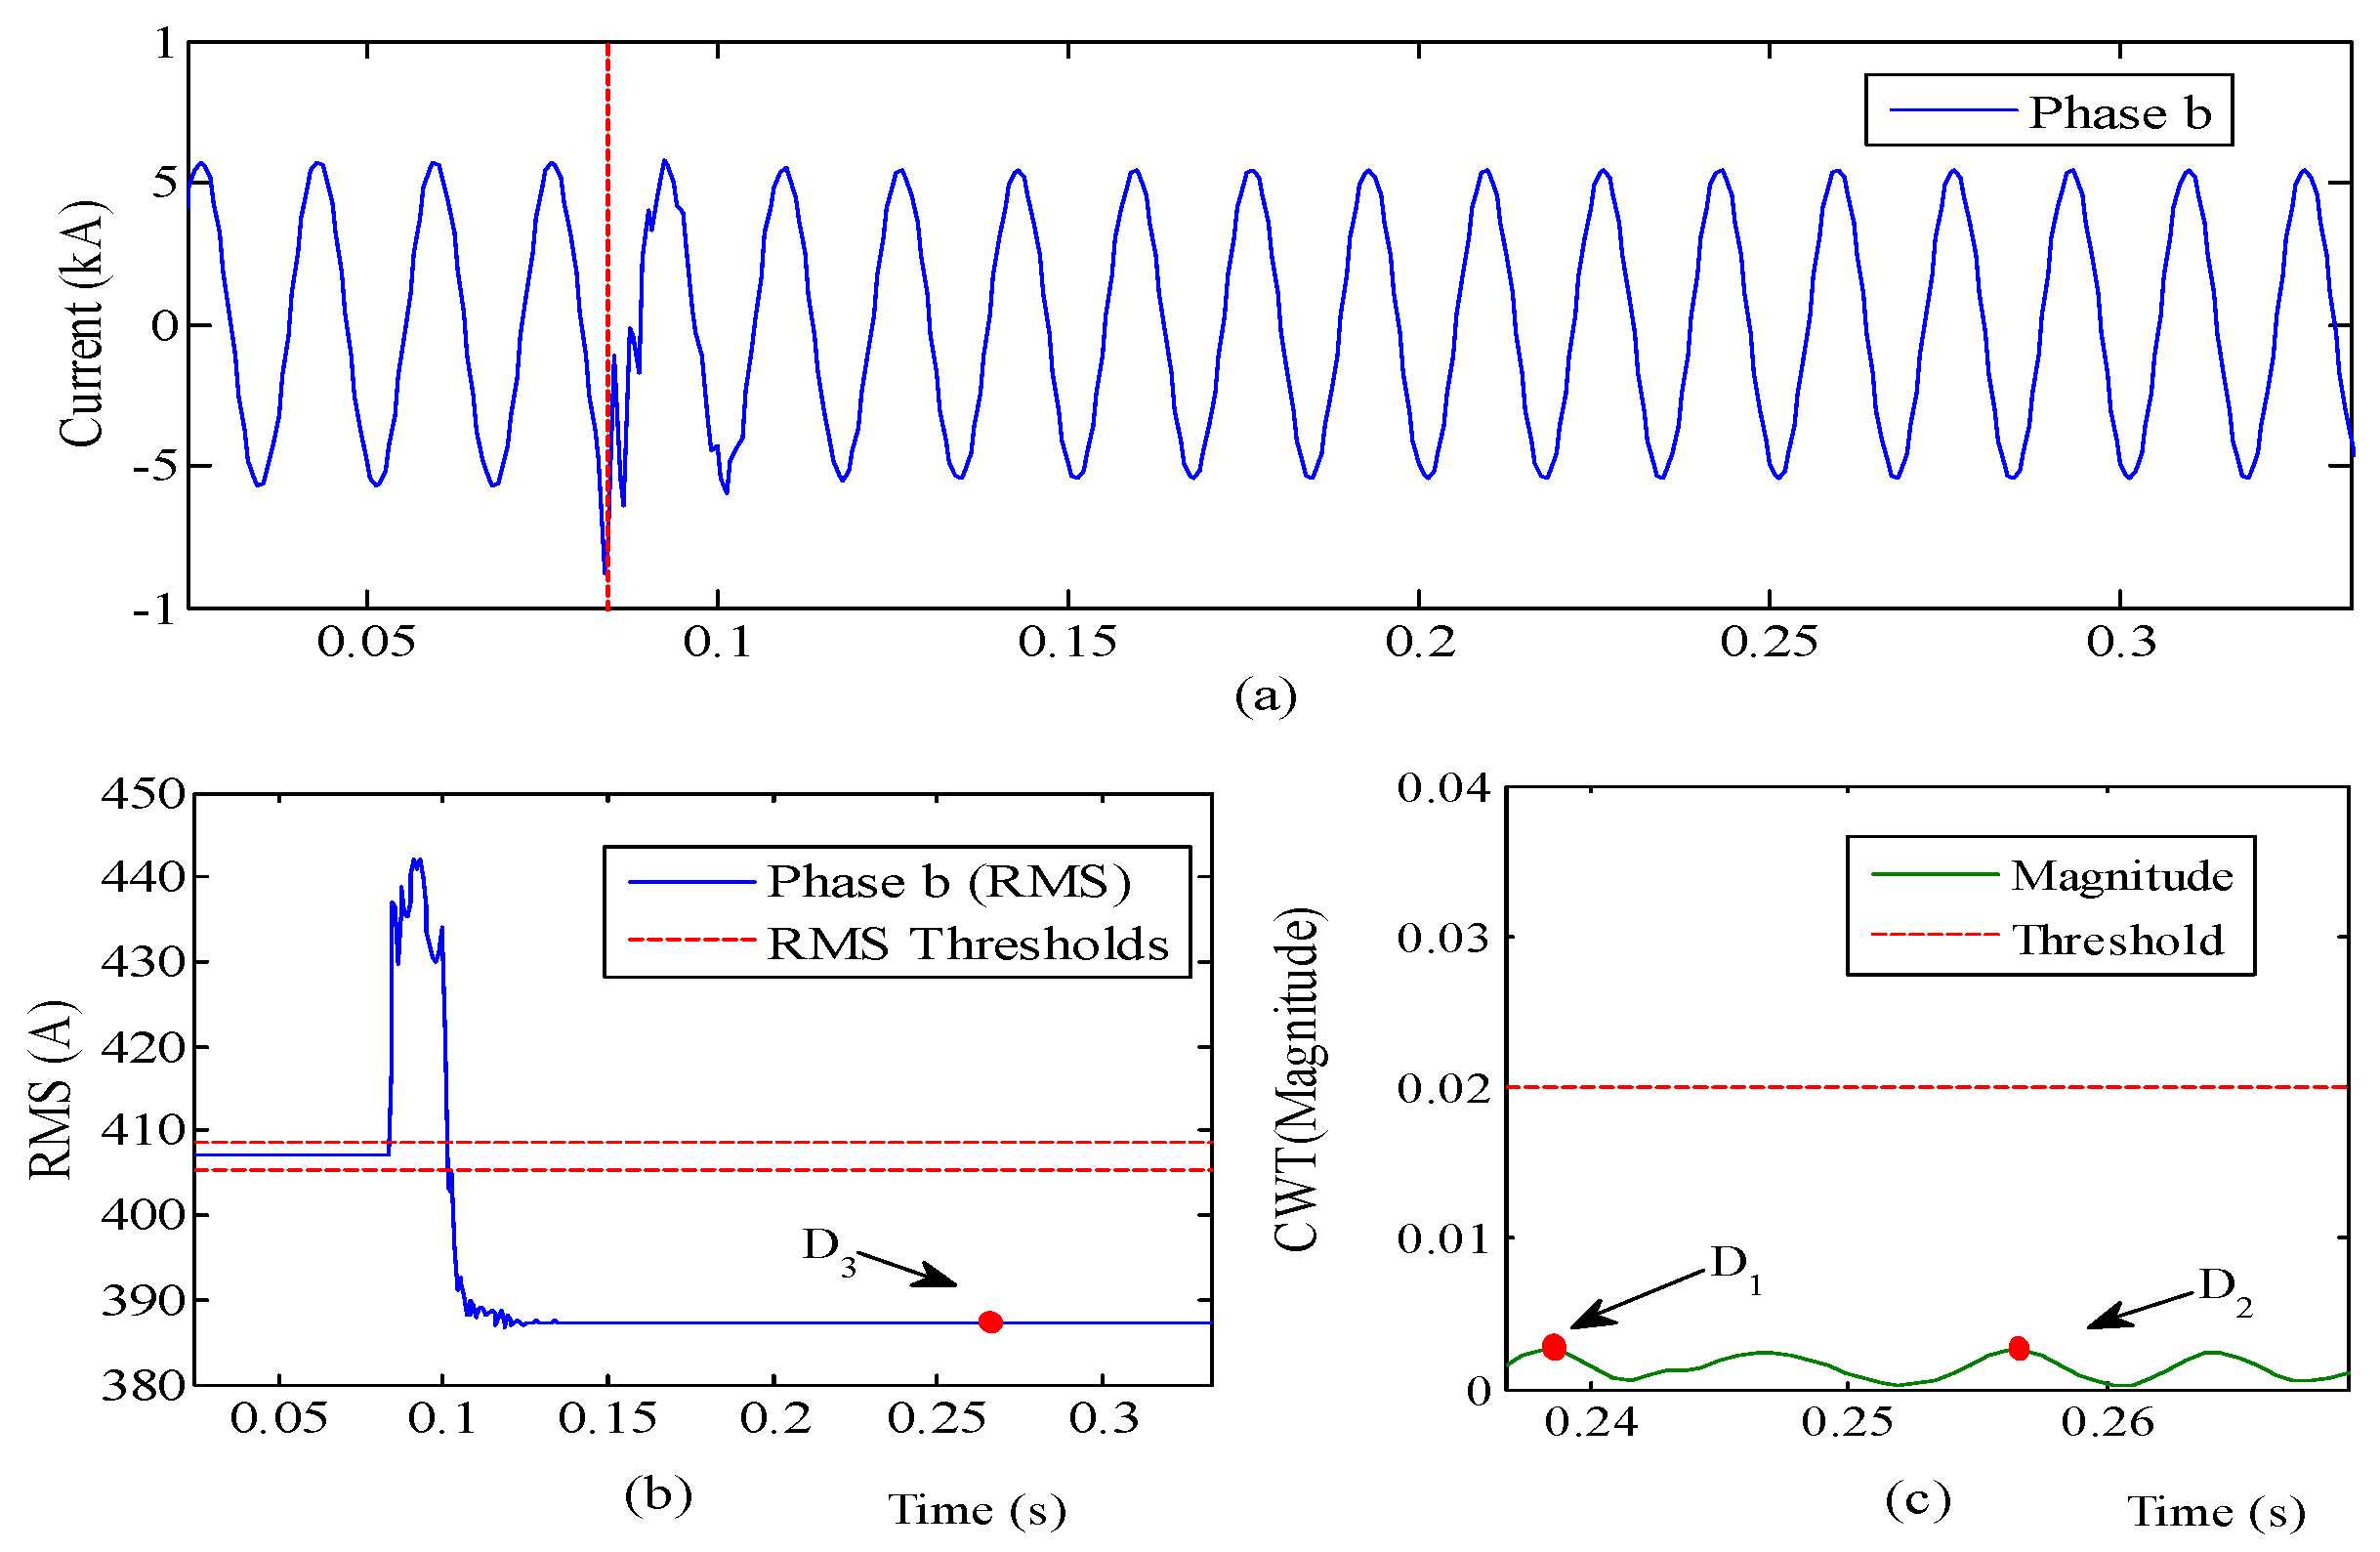
Figure 12.
Load energization in (13-Bus) is detected and classified, (a) ; (b) ; (c) of the normalized in the 11th–12th cycles.
Figure 12.
Load energization in (13-Bus) is detected and classified, (a) ; (b) ; (c) of the normalized in the 11th–12th cycles.
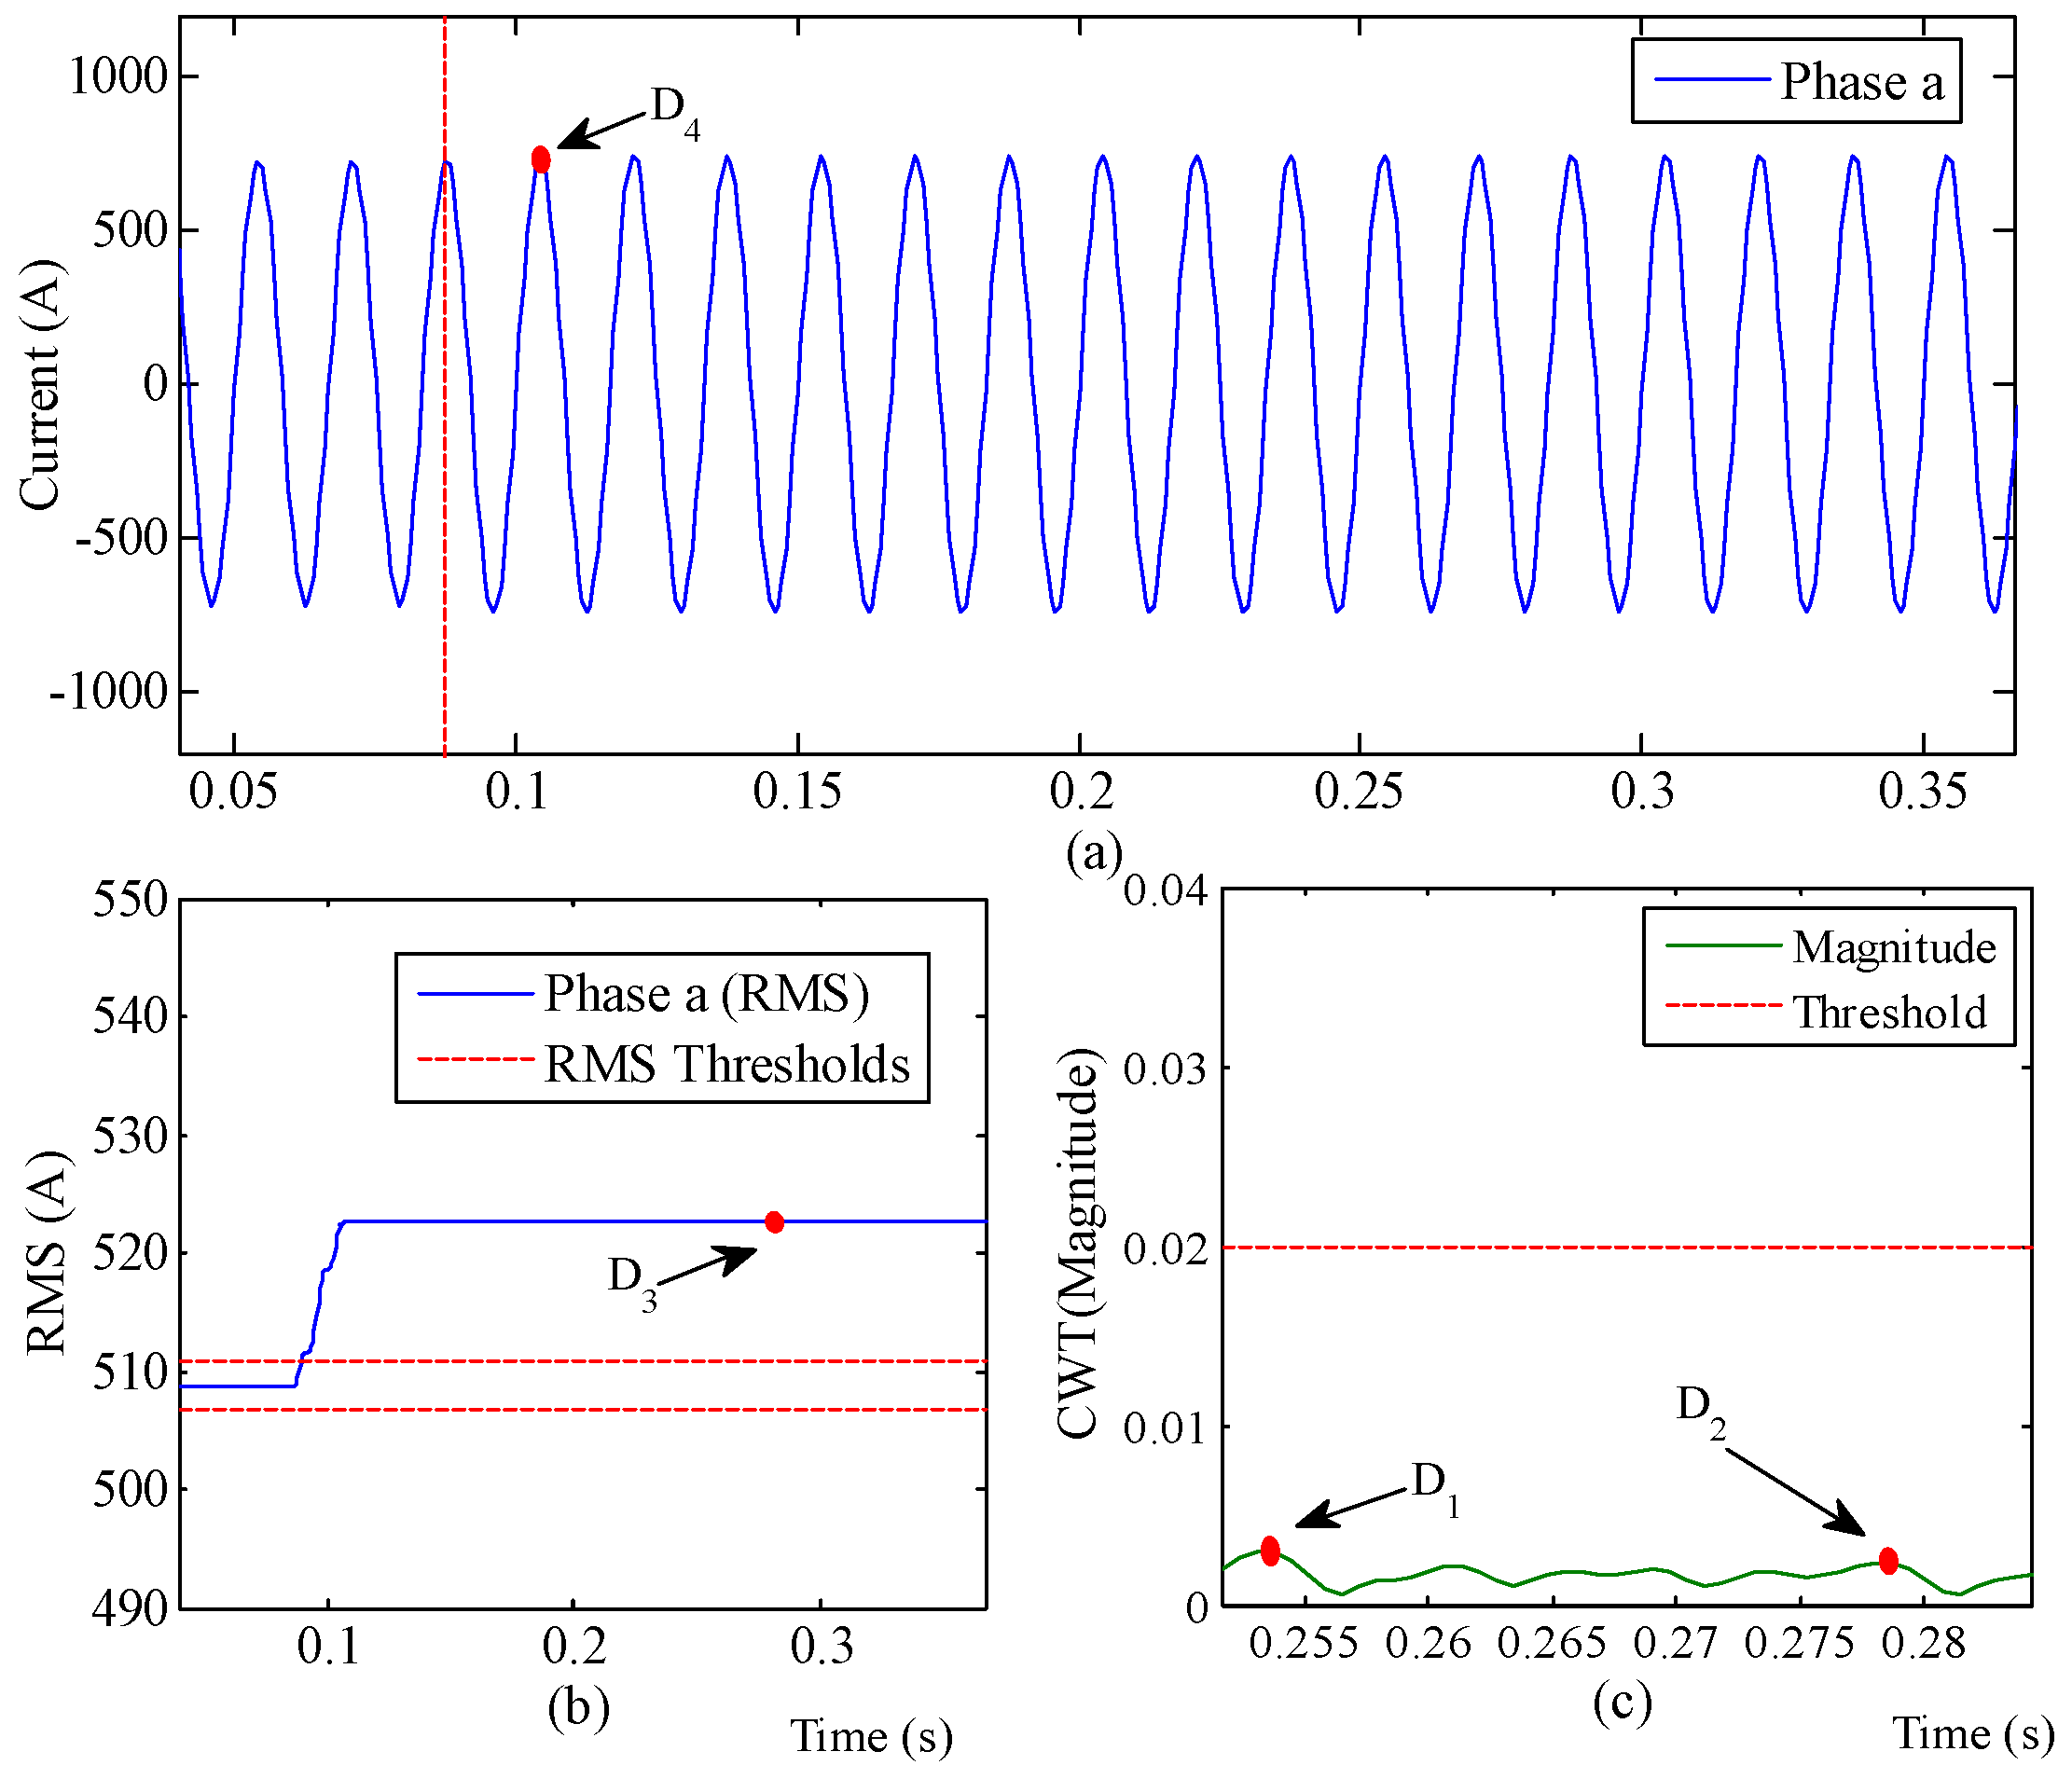
Figure 13.
All Events in relation to DT inputs and their values to their respective thresholds.

Figure 14.
Decision-Tree classification process flowchart.

Table 1.
High impedance fault (HIF) model parameters.
| Model Parameters | IEEE 13-Bus Feeder | IEEE 34-Bus Feeder |
|---|---|---|
Table 2.
Circuit breaker (CB) parameters.
| CB Parameters | IEEE 13-Bus Feeder at Bus 675 (Phase b) | IEEE 34-Bus Feeder at Bus 848 (Phase b) |
|---|---|---|
| Conductance (Opening Stage) | 10 MS | 10 MS |
| Conductance (Closing Stage) | 18.5 µS | 6.4 µS |
| Cassie Voltage () | 0.5 kV | 5 kV |
| Cassie Time Constant () | 44 µs | 80 µs |
| Mayr Cooling Power () | 500 W | 5 kW |
| Mayr Time Constant () | 2.2 µs | 10 µs |
Table 3.
Incipient fault (IF) Model Parameters.
| IFs Parameters | Value |
|---|---|
| Cassie Voltage () | 0.5 kV |
| Cassie Time Constant () | 44 µs |
| Mayr Cooling Power () | 500 W |
| Mayr Time Constant () | 0.3 µs |
| Fault Resistance | 0–130 Ω |
Table 4.
The required values for all DT inputs with SCADA communication to identify the issue.
| DT Output | DT Classification Inputs Values | SCADA Information | |||
|---|---|---|---|---|---|
| Permanent Fault | NR | NR | CB Tripped Automatically | ||
| HIF | NR | NR | NR | ||
| Failed CB During Bank De-energization | NR | NR | CB of Capacitor Bank Opened | ||
| IF (sub/multi-cycles) | NR | NR | |||
| Cleared CB Restrikes During De-energization | NR | ||||
| Load Energization | NR | ||||
| Load Disconnection | NR | NR | |||
| Capacitor Bank Energization | NR | CB of Capacitor Bank Closed | |||
NR: Not Required, , .
Table 5.
Simulation Results.
| Event’s Name | Cases Run | Detected Events | Classified Events | |||
|---|---|---|---|---|---|---|
| 13-Bus | 34-Bus | 13-Bus | 34-Bus | 13-Bus | 34-Bus | |
| Permanent Fault | 100 | 20 | 100 | 20 | 100 | 20 |
| HIF | 200 | 40 | 200 | 40 | 200 | 40 |
| Failed CB during bank de-energization | 100 | 20 | 100 | 20 | 100 | 20 |
| IF (sub/multi-cycles) | 70 | -- | 70 | -- | 70 | -- |
| Cleared Restrikes | 50 | 20 | 50 | 20 | 50 | 20 |
| Load Energization | 100 | 40 | 90 | 40 | 90 | 40 |
| Load Disconnection | 100 | 40 | 100 | 40 | 100 | 40 |
| Capacitor Energization | 50 | 20 | 49 | 20 | 49 | 20 |
Table 6.
Comparison between different methods and their advantages.
| Methods | Required Measurements | Detected Abnormal Events | Sampling Frequency (kHz) | Time for Final Decision |
|---|---|---|---|---|
| Reference [10] | I | IFs | 3.84 | ≈4–6 cycles |
| Reference [5] | I | HIFs | - | ≈1 min |
| Reference [8] | I, or V & I | HIFs | 3.84 | ≈1 s |
| Reference [7] | V & I | HIFs | 5 | - |
| Reference [19] | V & I | IFs, HIFs | 5–10 | ½–2 cycles |
| Proposed Method | I | IFs, HIFs, RCBs | 1.44 | ≈12–15 cycles |
© 2018 by the authors. Licensee MDPI, Basel, Switzerland. This article is an open access article distributed under the terms and conditions of the Creative Commons Attribution (CC BY) license (http://creativecommons.org/licenses/by/4.0/).
Share and Cite
MDPI and ACS Style
Almalki, M.M.; Hatziadoniu, C.J. Classification of Many Abnormal Events in Radial Distribution Feeders Using the Complex Morlet Wavelet and Decision Trees. Energies 2018, 11, 546. https://doi.org/10.3390/en11030546
AMA Style
Almalki MM, Hatziadoniu CJ. Classification of Many Abnormal Events in Radial Distribution Feeders Using the Complex Morlet Wavelet and Decision Trees. Energies. 2018; 11(3):546. https://doi.org/10.3390/en11030546
Chicago/Turabian StyleAlmalki, Mishari Metab, and Constantine J. Hatziadoniu. 2018. "Classification of Many Abnormal Events in Radial Distribution Feeders Using the Complex Morlet Wavelet and Decision Trees" Energies 11, no. 3: 546. https://doi.org/10.3390/en11030546
Note that from the first issue of 2016, this journal uses article numbers instead of page numbers. See further details here.