Investigation on the Potential of High Efficiency for Internal Combustion Engines


State Key Laboratory of Engines, Tianjin University, Tianjin 300072, China
*
Author to whom correspondence should be addressed.
Energies 2018, 11(3), 513; https://doi.org/10.3390/en11030513
Submission received: 23 January 2018
/
Revised: 20 February 2018
/
Accepted: 24 February 2018
/
Published: 27 February 2018
(This article belongs to the Special Issue Recent Advances in Internal Combustion Engines Operation and Emissions)
Abstract
:The current brake thermal efficiency of advanced internal combustion engines is limited to 50%, and how to further improve the efficiency is a challenge. In this study, a theoretical investigation on engine thermal efficiency was carried out using one-dimension simulations based on the first law of thermodynamics. The energy balance was evaluated by varying parameters such as compression ratio (CR); heat transfer coefficient; intake charge properties; and combustion phasing etc.—their influences on the efficiency limits were demonstrated. Results show that for a given heat transfer coefficient, an optimal CR exists to obtain the peak efficiency. The optimal CR decreases with the increase of heat transfer coefficient, and high CR with a low heat-transfer coefficient can achieve a significantly high efficiency. A higher density and specific heat ratio of intake charge, as well as a shorter combustion duration with a proper CA50 (crank angle at 50% of total heat release), can increase efficiency significantly. Methanol shows an excellent ability in decreasing the peak in-cylinder temperature; and the peak indicated efficiency is relatively higher than other tested fuels. The displacement has few effects on the indicated efficiency, while it shows a strong effect on the energy distribution between heat transfer and exhaust energy. All these strategies with high CR result in high in-cylinder pressure and temperature; which means a breakthrough of material is needed in the future.
1. Introduction
Due to widespread application of vehicles, transportation accounts for around 28% of global energy demands throughout the world [1], and 27.6% of greenhouse gas emissions [2]. In addition, the vehicle stock of the world is still growing, especially in developing countries. The energy consumption of internal combustion engines has caused a substantial negative impact on the ecological environment and energy security. Moreover, the ever-increasing energy demands, coupled with their detrimental environmental effects, have guided research to seek alternative fuels for gradually substituting conventional ones [3,4,5,6,7,8,9,10,11]. However, it should be noted that improving engine efficiency is the primary option to reduce energy consumption and greenhouse gas emissions simultaneously.
Improving efficiency has long been an objective of engine researchers. After centuries of development, the efficiency of engines has been improved significantly. Current production spark-ignition engines are working with brake thermal efficiency (BTE) about 30–36% [12], compression-ignition engines have long been recognized as one of the most efficient power unit, the current BTE of diesel engines can achieve to 40–47% [12]. Recently, many countries have imposed fuel economy standards to cope with the energy security and CO2 emissions. According to the fuel economy technology roadmap of road vehicles issued by the International Energy Agency, the roadmap will cut the average fuel consumption of road vehicles by 30% to 50% by 2030 [13]. The trend of future standards is increasing stringency. European’s standards for passenger cars will reach 95 g CO2/100 km by 2020 [14]. The goal of China is to have the national average fuel consumption at about 117 g CO2/100 km by 2020 according to GB (mandatory standards in China) 27999-2014 in China, reducing the average fuel economy of new vehicles by nearly 30% compared to 2013. The targets of US corporate average fuel economy standards are 109 g per 100 km in 2025 for cars and light trucks [15]. However, these targets are great challenges, according to Environmental Protection Agency (EPA). For all of the fuel economy estimates for all models with an EPA rating in 2012, there are only 9.3% of the total 1041 surveyed vehicles in the market getting over 30 mile per gallon (mpg); among the most popular cars, there are only 11.9% getting more than 30 mpg [16].
In order to cope with upcoming strict fuel economy standards, more fuel-efficient vehicles should be developed. Engine improvement provides the most direct and effective ways to reduce fuel consumption, because the engine losses account for about 67–72% of input energy for a typical light-duty vehicle, while the engine losses will rise to 74–75% in the city area [17]. How to improve today’s internal combustion engines to be more efficient and fulfill the future standards will be a massive challenge. So, it is quite necessary to assess the pathways to maximize engine efficiency, and estimate the potential of efficiency limits for internal combustion engines.
According to the heat balance analysis with the first law of thermodynamics, work output, heat transfer losses, and exhaust energy are three main approaches available for fuel energy. In order to increase the work output, the appropriate method is to translate the heat transfer losses or exhaust energy into useful work. Different from closed-Carnot cycle, the real engine is an open-cycle system involves chemical reactions and a gas exchange process; it exchanges heat and work with surrounding environment. The heat transfer is not thermodynamically required, so the open-cycle system of engines has the potential of producing more useful work than the Carnot cycle.
Since the 1980s, low heat rejection (LHR) engines with thermal barrier coatings were investigated widely. The results showed that through the insulation of the cylinder walls, the heat transfer and the combustion irreversibility were decreased, which resulted in the improvement of indicated efficiency and the increase of exhaust availability. Primus et al. [18] demonstrated a 42% reduction in the heat transfer losses in a low heat rejection engine. Meantime, the reduced heat transfer losses resulted in a 3.7% increase in the indicated work and also a 49% increase in the exhaust availability. Taymaz et al. [19,20] compared the heat losses at different engine loads and speeds with and without ceramic-coated diesel engine, a reduction in fuel consumption and an increase in exhaust energy was found in a ceramic-coated engine, similar results were also obtained in thermal barrier coating low heat rejection diesel engines [21,22]. Referring to the ideal engine cycles, the thermal efficiency is affected by compression ratio significantly. Increasing the compression ratio can improve the engine efficiency theoretically [23]. Edson [24] made a theoretical analysis of the ideal adiabatic Otto cycle engine; the results showed that the engine thermal efficiency continued to increase with compression ratio at least up to 300:1 for all tested fuels including isooctane, benzene, ethyl alcohol, and nitro methane—the achievable brake thermal efficiencies typically lied between 70% and 80% depended on the compression ratio. Similar results have also been demonstrated by Edwards et al. [25], in a free-piston research device demonstrated the feasibility of achieving simple-cycle engine efficiencies approaching 60%, by using extremely high compression ratios, up to 60–100. Wang et al. [26] found that there were optimal compression ratios for the optimal performance of an Otto heat engine. Payri et al. [27] evaluated the effects of coolant temperatures, intake air temperatures and start of injection (SOI) on energy balance in a direct injection diesel engine, they found that the variation of the coolant temperature had an almost negligible effect on engine efficiency while cooling intake air yielded in an improvement of 1% due to the reduction of the chamber heat transfer, and the variation of SOI showed the greatest influence on engine efficiency. Abedin et al. [28] reviewed the effects of alternative fuels and the engine variables on energy balance. The results showed that different fuels had a great effect on the heat losses: the cooling losses were much lower in low heat rejection engines for all fuels, and a higher inlet density decreased the exhaust heat losses whilst the coolant heat losses and the useful work were increased.
In summary, the goal of the study is how to obtain the extreme efficiency for future engines. Therefore, it is necessary to explore the potential approaches for improving efficiency based on various methods. General performance computations were carried out with a single-cylinder engine model; the first law of thermodynamics was utilized to analyze the distribution of fuel energy entering the cylinder. Some related strategies are considered, including compression ratio, heat transfer coefficient, equivalence ratios, intake compositions, alternative fuels, combustion phasing and displacement volume. It should be noted that the simulations are based on a set of assumptions and approximations without considering some engine characteristics, for example, combustion stability, cycle-to-cycle variations; knock and some other abnormal combustion phenomena are not included here. In addition, exhaust emissions are not in consideration, because the focus is just to detect and describe the thermodynamics characteristics rather than understand the details of combustion. Finally, some potential pathways to improve engine efficiency were proposed.
2. System Description and Thermodynamic Model
Simulations have been carried out using one-dimensional engine simulation software of GT-POWER (Version of 7.4, Gamma Technologies, Westmont, IL, USA) which is based on one-dimensional gas dynamics, representing the flow and heat transfer in pipes and other components of engine systems. A model of the engine has been built within GT-POWER, and the engine model is developed corresponding to a single-cylinder diesel engine. Submodels for flow in intake/exhaust system, fuel injection, fuel vaporization and combustion, cylinder heat transfer, etc. are combined with a thermodynamic analysis of the engine to yield instantaneous in-cylinder parameters and overall engine performances.
The in-cylinder heat transfer applied in the engine model is basically the model of Woschni GT [23], which is recommended when measured swirl data is not available. The heat transfer losses consist of convection and radiation. In order to compare the effects of heat transfer coefficient, convection multiplier (Mc) and radiation multiplier (Mr) of cylinder have been varied. A hybrid method transition from linear to quadratic is used for the convection temperature evaluation, which is the recommended method. In order to match experimental pressure data, the stock convection multiplier (Mc) is calibrated to 1.2 and radiation multiplier (Mr) is set to the recommended value of 1.0. Reducing the convection multiplier and radiation multiplier can reduce the heat transfer coefficient. As for the adiabatic condition, both of the multipliers are set to 0. In this study, Mc = 0.2 is used to represent the LHR engine.
For combustion simulation, a user-imposed combustion profile is applied and the combustion profile is acquired from the experimental data of a single-cylinder diesel engine, which is also used to calibrate the model. Then, the profile is normalized to the fraction of burned fuel before being applied, and the start of combustion in crank-angle degrees is defined directly. The recommended option of “two-temp” is applied, which indicates that temperature and composition will be independently calculated for the burned and unburned gases in the cylinder chamber. The default combustion duration from 10–90% heat release is a 27-degree crank angle—the combustion duration can be adjusted through the definition of the parameter “crank angle array multiplier”.
In this model, the energy distribution is presented in the form of heat transfer losses, exhaust losses and net indicated useful work. The heat transfer losses consist of both energy transferred from gases to combustion chamber walls and the cylinder portion of the total friction losses. The exhaust losses consist of energy enthalpy difference between exhaust gases and ambient, and energy in exhaust gases because of incomplete combustion has also included in the exhaust losses even though the combustion efficiency is higher than 99.5%. The gross indicated useful work is calculated by gross indicated mean effective pressure, without the pumping losses.
3. Engine and Operating Conditions
To model the cylinder geometry, bore, stroke, connecting rod length, wrist pin to crank offset, compression ratio, and top dead center clearance height are inputted into the program. The specifications of the engine are shown in Table 1. It is a four-stroke, turbocharged, water-coolant diesel engine and the single-cylinder displacement volume is 1.08 L. The original engine is based on a six-cylinder diesel engine manufactured by Yuchai Machinery (Yulin, China) and the engine is mainly used in medium-size trucks and buses with the length of 8.5–10.5 m. The schematic diagram of GT-POWER model is showed in Figure 1 and the valve lift both intake and exhaust is presented in Figure 2. In this study, all simulations are carried out at the speed of 1500 r/min and the maximum engine torque can be achieved under this engine speed. The total input energy of injected fuel per cycle is equivalent to 80 mg diesel, which corresponds to about 75% of the maximum engine load. Therefore, the selected engine speed and load is frequently used operating conditions and generally the engine has the lowest fuel consumption in and around this operating case. For studies of the compression ratio, heat transfer coefficient, intake charge properties and fuel properties, the crank angle of 50% heat released (CA50) of 10 °CA ATDC (After Top Dead Center) and combustion duration from 10–90% heat release of 27 °CA are selected for simulations.
Considering the effects of combustion phasing on engine efficiency, a range of CA50 and combustion duration has also been changed. The inlet pressure is set to absolute pressure in the environment to simulate the turbocharger, and the exhaust pressure is regulated approximate to the inlet pressure. In addition, it should be noted that for the higher compression ratio, peak cylinder pressures and maximum in-cylinder temperature may be quite high, the structure and the part of the engine may be damaged, because they cannot withstand the environment with so high pressure and temperature. However, many studies have used high compression ratios in experimental or theoretical studies, such as Edson [24] and Edwards et al. [25,29,30] are mentioned in the introduction. In addition, Eilts et al. [31] made a theoretical study on a passenger car engine with brake mean effective pressure (BMEP) up to 80 bar, the peak cylinder pressures up to 750–800 bar or more, thermal load and mechanical load increased significantly. If a major breakthrough will be achieved in design and materials of engines in the future, the bottleneck of high compression ratio will be broken. Therefore, the maximum compression ratio of 100 for this study is not unrealistic. The simulations are based on a set of assumptions and approximations without considering some engine characteristics, for example, combustion stability, cycle-to-cycle variations, knock and some other abnormal combustion phenomena are not included here. In addition, exhaust emissions are not in consideration, because the focus is just to detect and describe the thermodynamics characteristics rather than understand the details of combustion. Of course, some intensified combustion processes are the big challenge for some conditions assumed in the current work, but this aspect is beyond the scope of this study.
4. Results and discussion
4.1. The Effects of Heat Transfer Coefficient and Compression Ratio
Figure 3 shows the changes of energy distribution with the change of convection multiplier under the original compression ratio of 16. The intake pressure is controlled at 1.3 bar to obtain stoichiometric ratio in the cylinder. Firstly, the effects of different equivalent ratios on the energy distribution have been investigated in Section 4.2. Therefore, stoichiometric ratio as one of the in-cylinder combustion operating conditions has been studied in this section. Secondly, the peak in-cylinder temperature of stoichiometric ratio is the highest, which is beneficial to explore the effect of heat transfer on energy distribution. With the decrease of heat transfer coefficient, heat transfer losses reduce, however only one thirds of the saved heat transfer loss is converted to useful work while others are lost in the exhaust energy, which makes a sharp increase in exhaust gas temperature. Compared to the stock heat transfer coefficient with convection multiplier Mc = 1.2 and radiation multiplier Mr = 1.0, the peak indicated efficiency under the adiabatic condition with Mc = 0 and Mr = 0 is increased to 47.87% from 39.73%, the exhaust energy is increased to 52.1%. As shown in Figure 4, an increase of 90 K in the exhaust temperature is observed, the gains of indicated thermal efficiency from the heat transfer losses are not sufficient as expected even under adiabatic condition. Nearly 50% of the fuel energy is lost in the exhaust. Meanwhile, the maximum in-cylinder temperature significantly increases with the decrease of heat transfer coefficient and the peak in-cylinder temperature is increased to above 2400 K. However, it should also be noted that the increased exhaust energy may be used in the system of waste heat recovery and improve the total efficiency of the engine, but this is beyond the scope of this study.
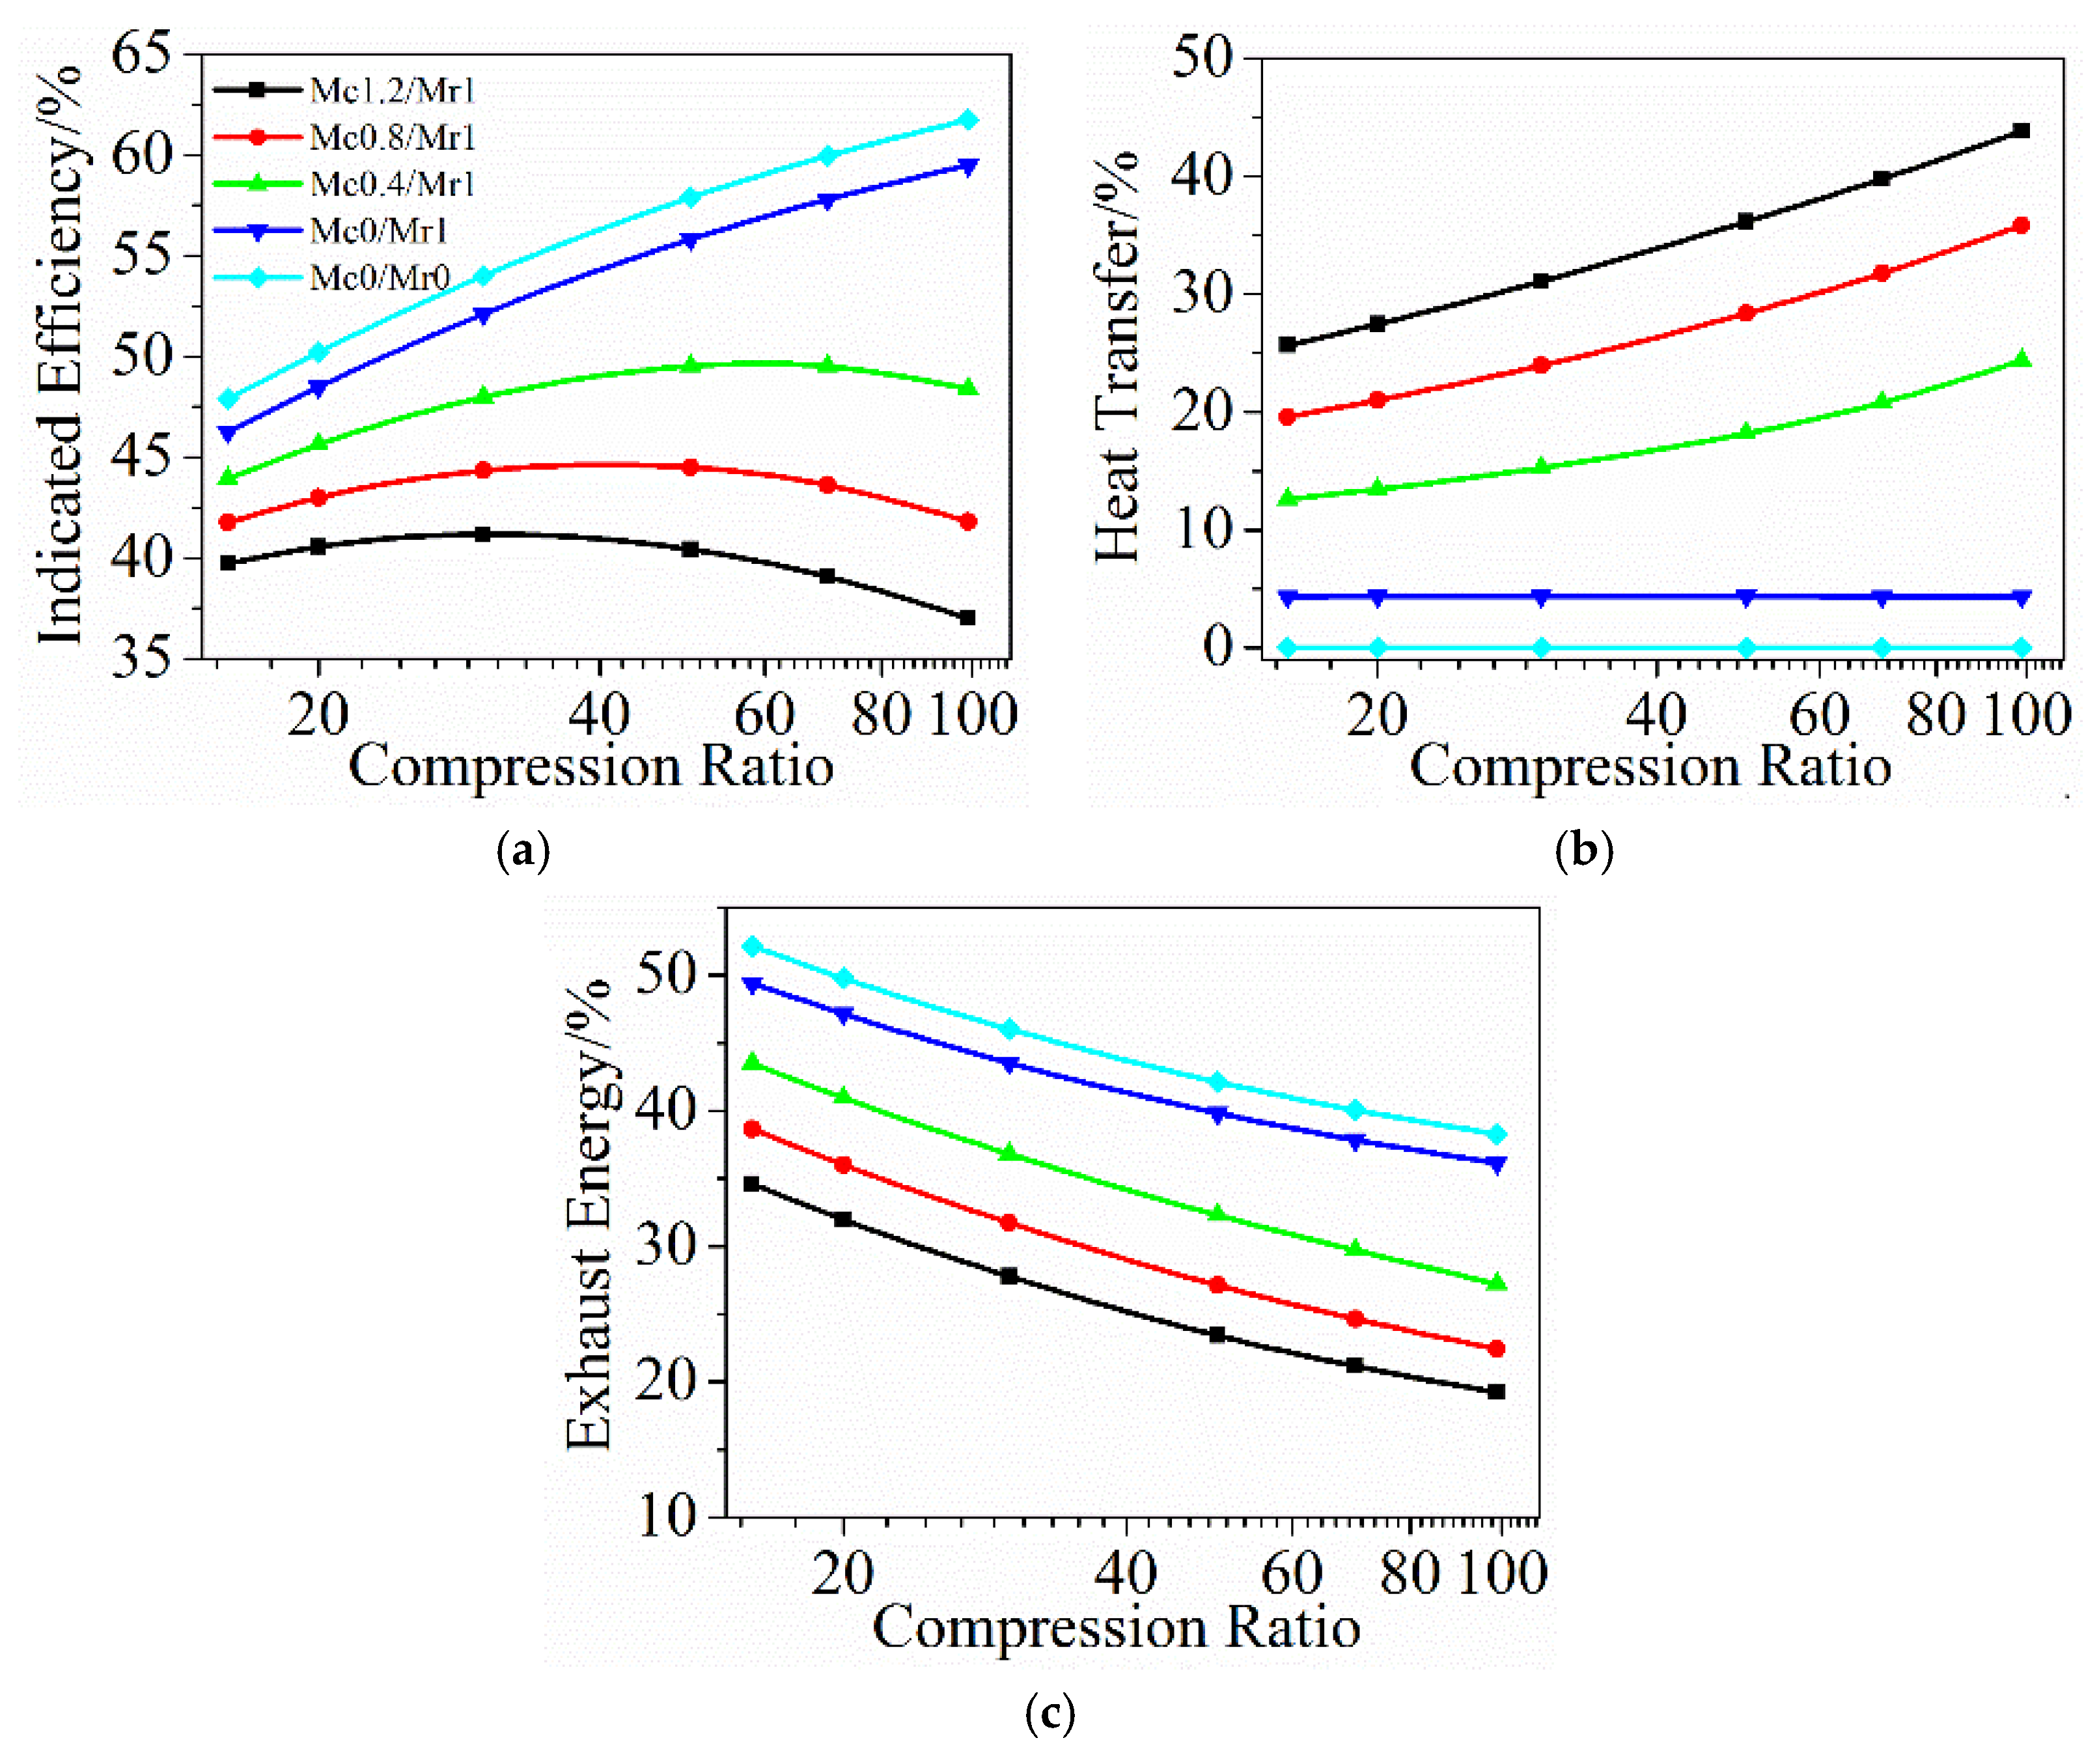
Figure 5 shows the energy distribution with the change of compression ratio under different heat transfer coefficients. Increasing compression ratio can reduce the exhaust energy, however it also leads to the increase of the heat transfer losses due to a sharp rise in the peak in-cylinder temperature as the cylinder is not heat insulation. Actually, heat transfer is inevitable, so too a high compression ratio results in a reduction of the indicated efficiency. A heat transfer coefficient determines the optimal compression ratio, as can be seen in Figure 5, an optimal compression ratio exists for a given heat transfer coefficient. With the decrease of the heat transfer coefficient, the corresponding optimal compression ratio increases. The peak indicated efficiency is improved significantly with the decrease of heat transfer coefficient at the optimization of compression ratios. For the normal heat transfer coefficient (Mc = 1.2, Mr = 1), a peak indicated efficiency of 41.7% is achieved at the compression ratio of 30, while for the reduced heat transfer coefficient (Mc = 0.4, Mr = 1), the peak indicated efficiency is increased to 49% at the compression ratio of 50. Under the adiabatic condition, the indicated efficiency is improved with the increase of compression ratio and a peak-indicated efficiency of more than 60% can be obtained.
4.2. The Effects of Equivalence Ratios
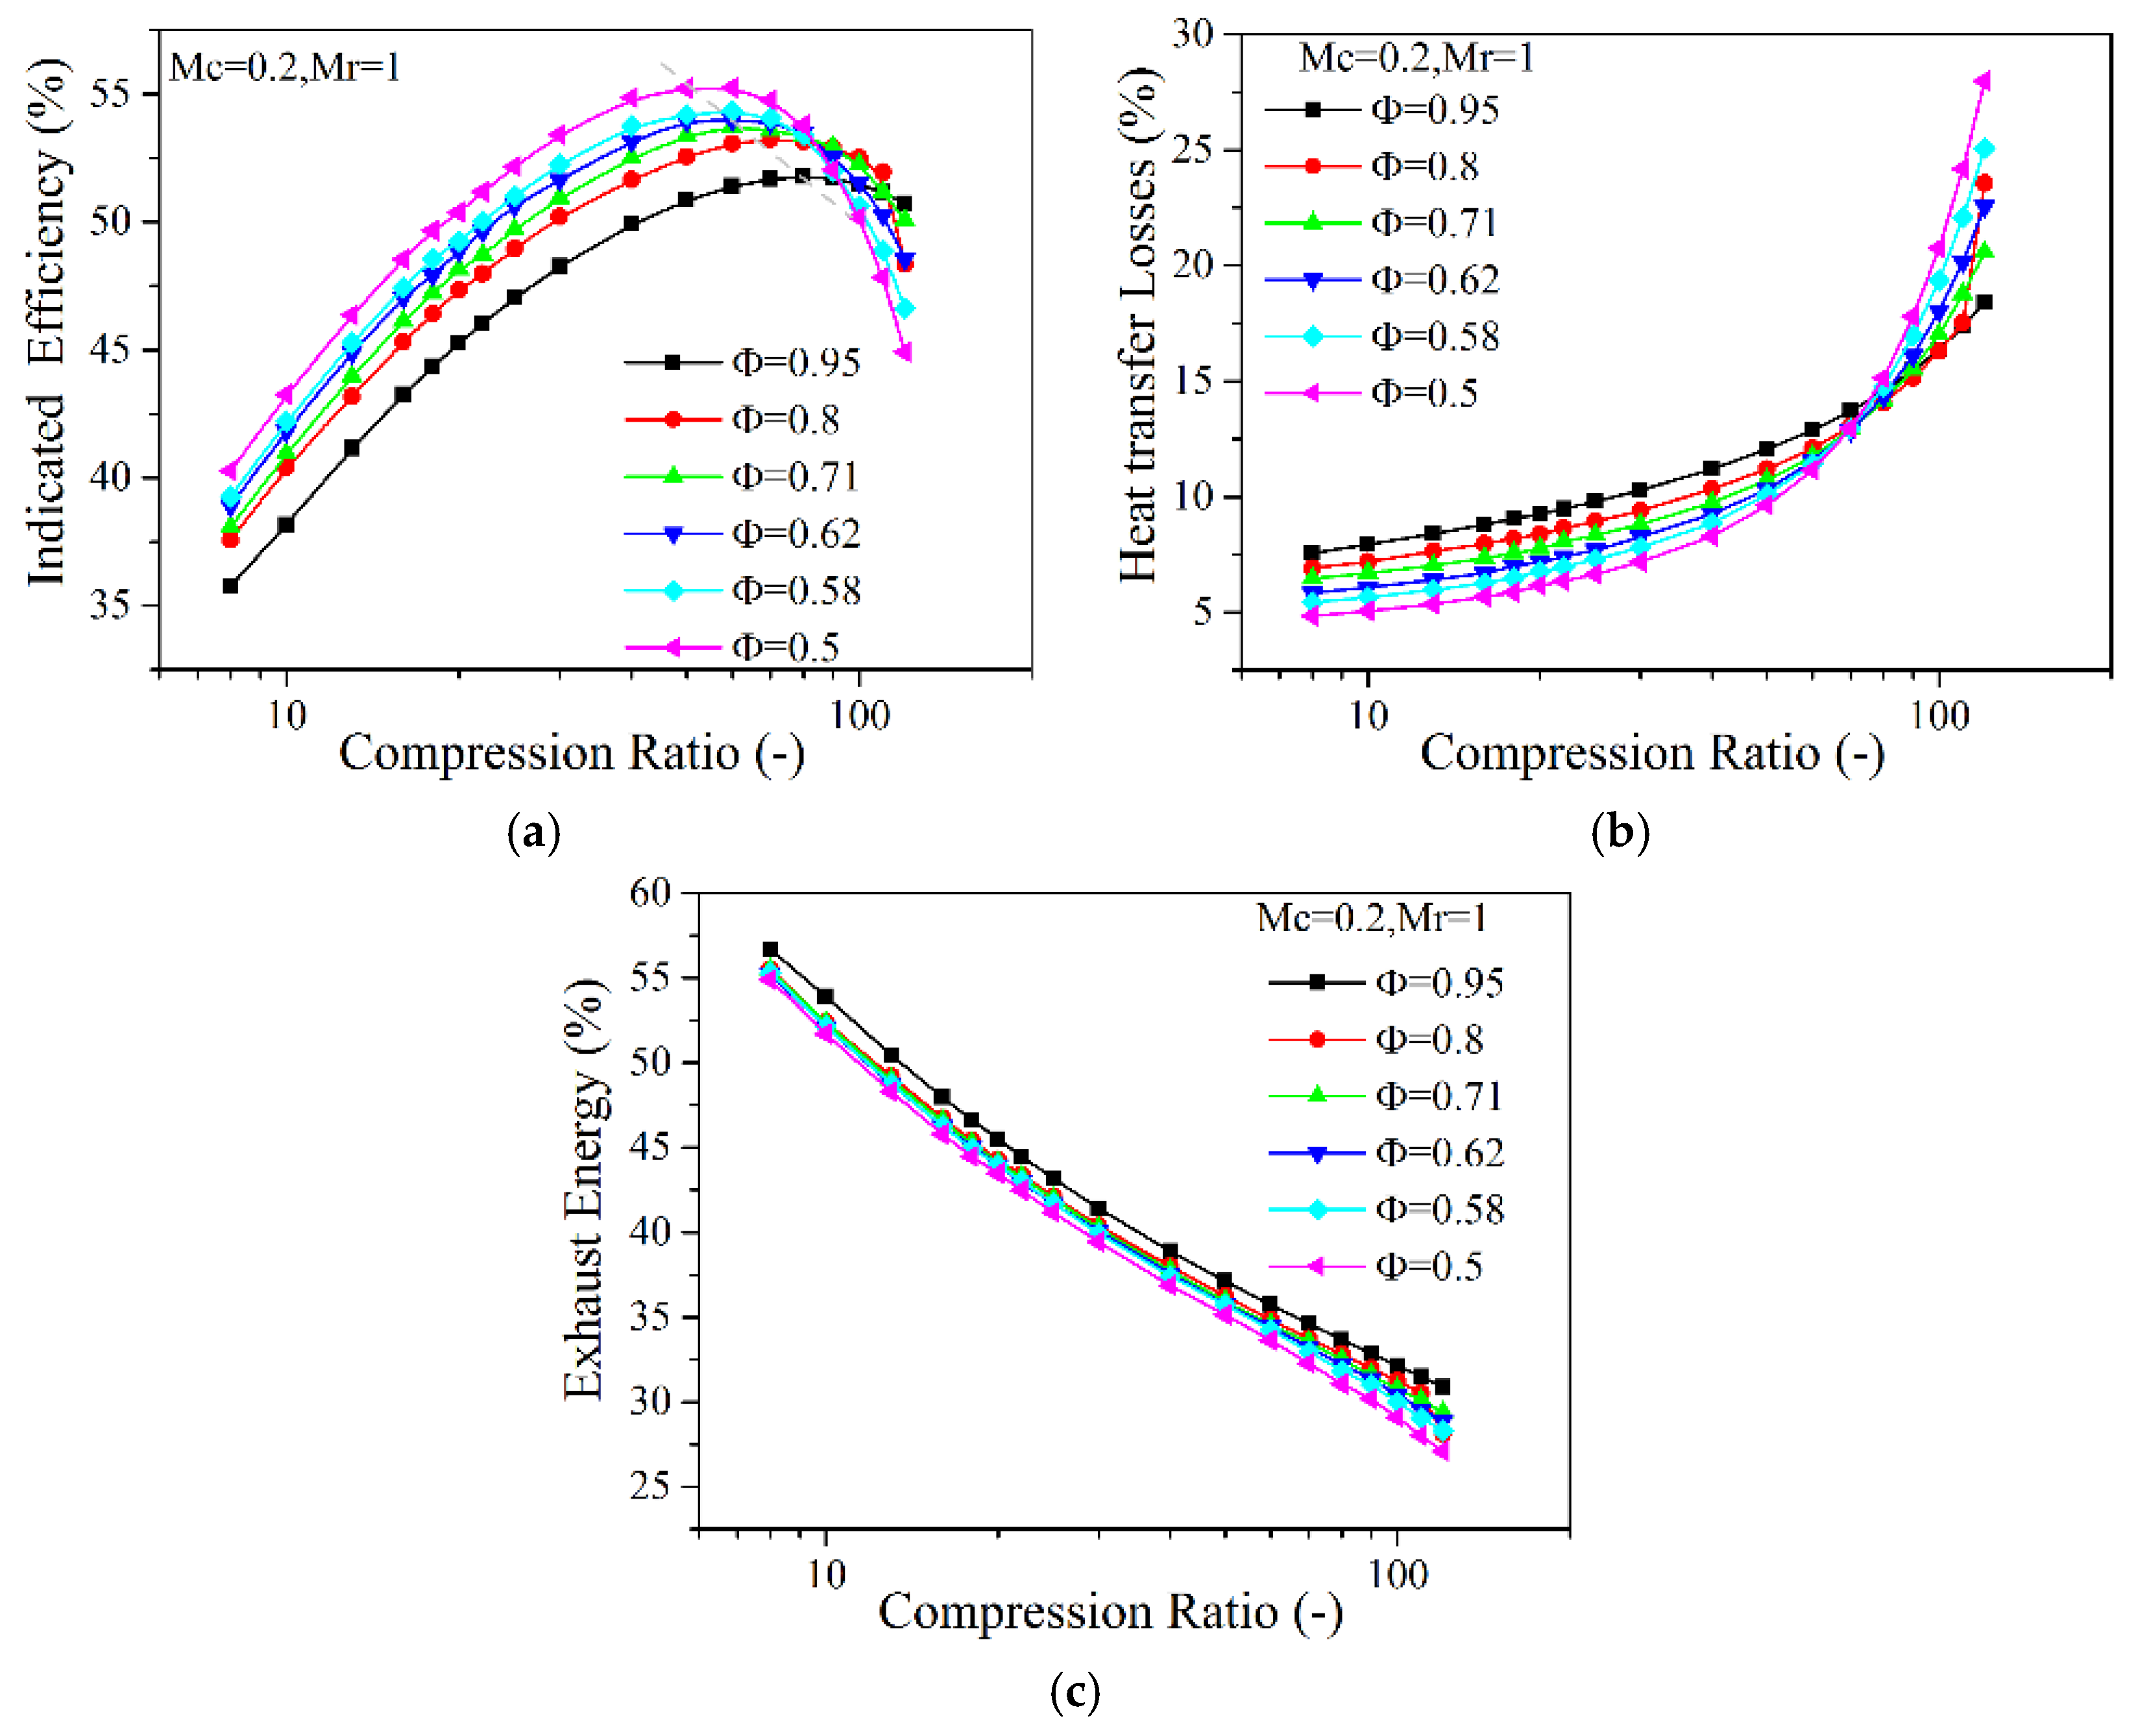
Figure 6 shows the energy distribution as a function of compression ratio for lean combustion as the equivalence ratios are from 0.95 to 0.5, and equivalence ratios are modulated by increase of intake pressures. For the LHR engine (Mc = 0.2, Mr = 1), there is about 80% reduction in the in-cylinder heat transfer coefficient. The trends at lean equivalence ratios agree with stoichiometric condition as shown in Figure 5. For different equivalence ratios, the corresponding compression ratio to achieve peak indicated efficiency is varied. On the one hand, with the decrease of equivalence ratio, the exhaust energy is a little lower and the heat transfer is also relatively reduced at lower compression ratios. On the other hand, with the increase of compression ratios, the heat transfer of leaner charge increases faster and the corresponding compression ratio to achieve peak efficiency is reduced. The lean combustion can achieve higher engine efficiency than that of stoichiometric condition. This is because the lean charge has higher specific heat ratios and lower in-cylinder temperature relative to stoichiometric mixtures as shown in Figure 7, which leads to an improvement in indicated efficiency. Meantime, Figure 7 also shows that the peak in-cylinder temperature is mainly affected by equivalence ratios, while the compression ratio has little effect on the peak in-cylinder temperature. Much leaner combustion can suppress the peak in-cylinder temperature effectively, but the leaner mixture also results in higher in-cylinder pressures due to the higher intake pressures. At equivalence ratio of 0.5, a peak indicated efficiency of 55.3% can be achieved.
4.3. The Effects of Intake Charge Composition
Generally, the intake working fluid is only standard air for diesel engines. Air is composed primarily of diatomic gases, about 78% of N2, 21% of O2, 0.93% of inert gases by volume fraction. Many studies have shown that the intake working fluid properties—such as constant-pressure specific heat Cp, specific heat ratio γ (γ = Cp/Cv) and thermal conductivity of the gases—have a great effect on the indicated efficiency [32]. The triatomic gases have a higher specific heat, which is known to be utilized to suppress the in-cylinder temperature such as exhaust gas recirculation. However the γ of triatomic gases is relatively lower than standard air.
4.3.1. Intake N2 Replacement by Argon
Higher specific-heat ratio γ can produce high peak cylinder pressures under the adiabatic compression condition, thus more energy can be obtained during the expansion phase of the engine cycle. Considering the equation of ideal engine cycle [23]:
A relatively high specific-heat ratio γ of the intake fluids can improve the indicated efficiency theoretically. Under standard state, the monatomic gas of argon, has a high specific-heat ratio γ of about 1.66, which is considerably higher than the specific heat ratio of about 1.4 for standard air. With the increase of argon percentage in the intake charge, the γ of intake fluids will be increased. However, monatomic gases also provide a low specific heat that will lead to higher in-cylinder temperature which is undesired without insulation [33]. Higher in-cylinder temperature will result in the increase of heat transfer and thermal load of engines. Therefore, effects of intake fluid γ on the energy distribution, in-cylinder pressure and temperature are explored at the conditions of adiabatic and low heat transfer separately.
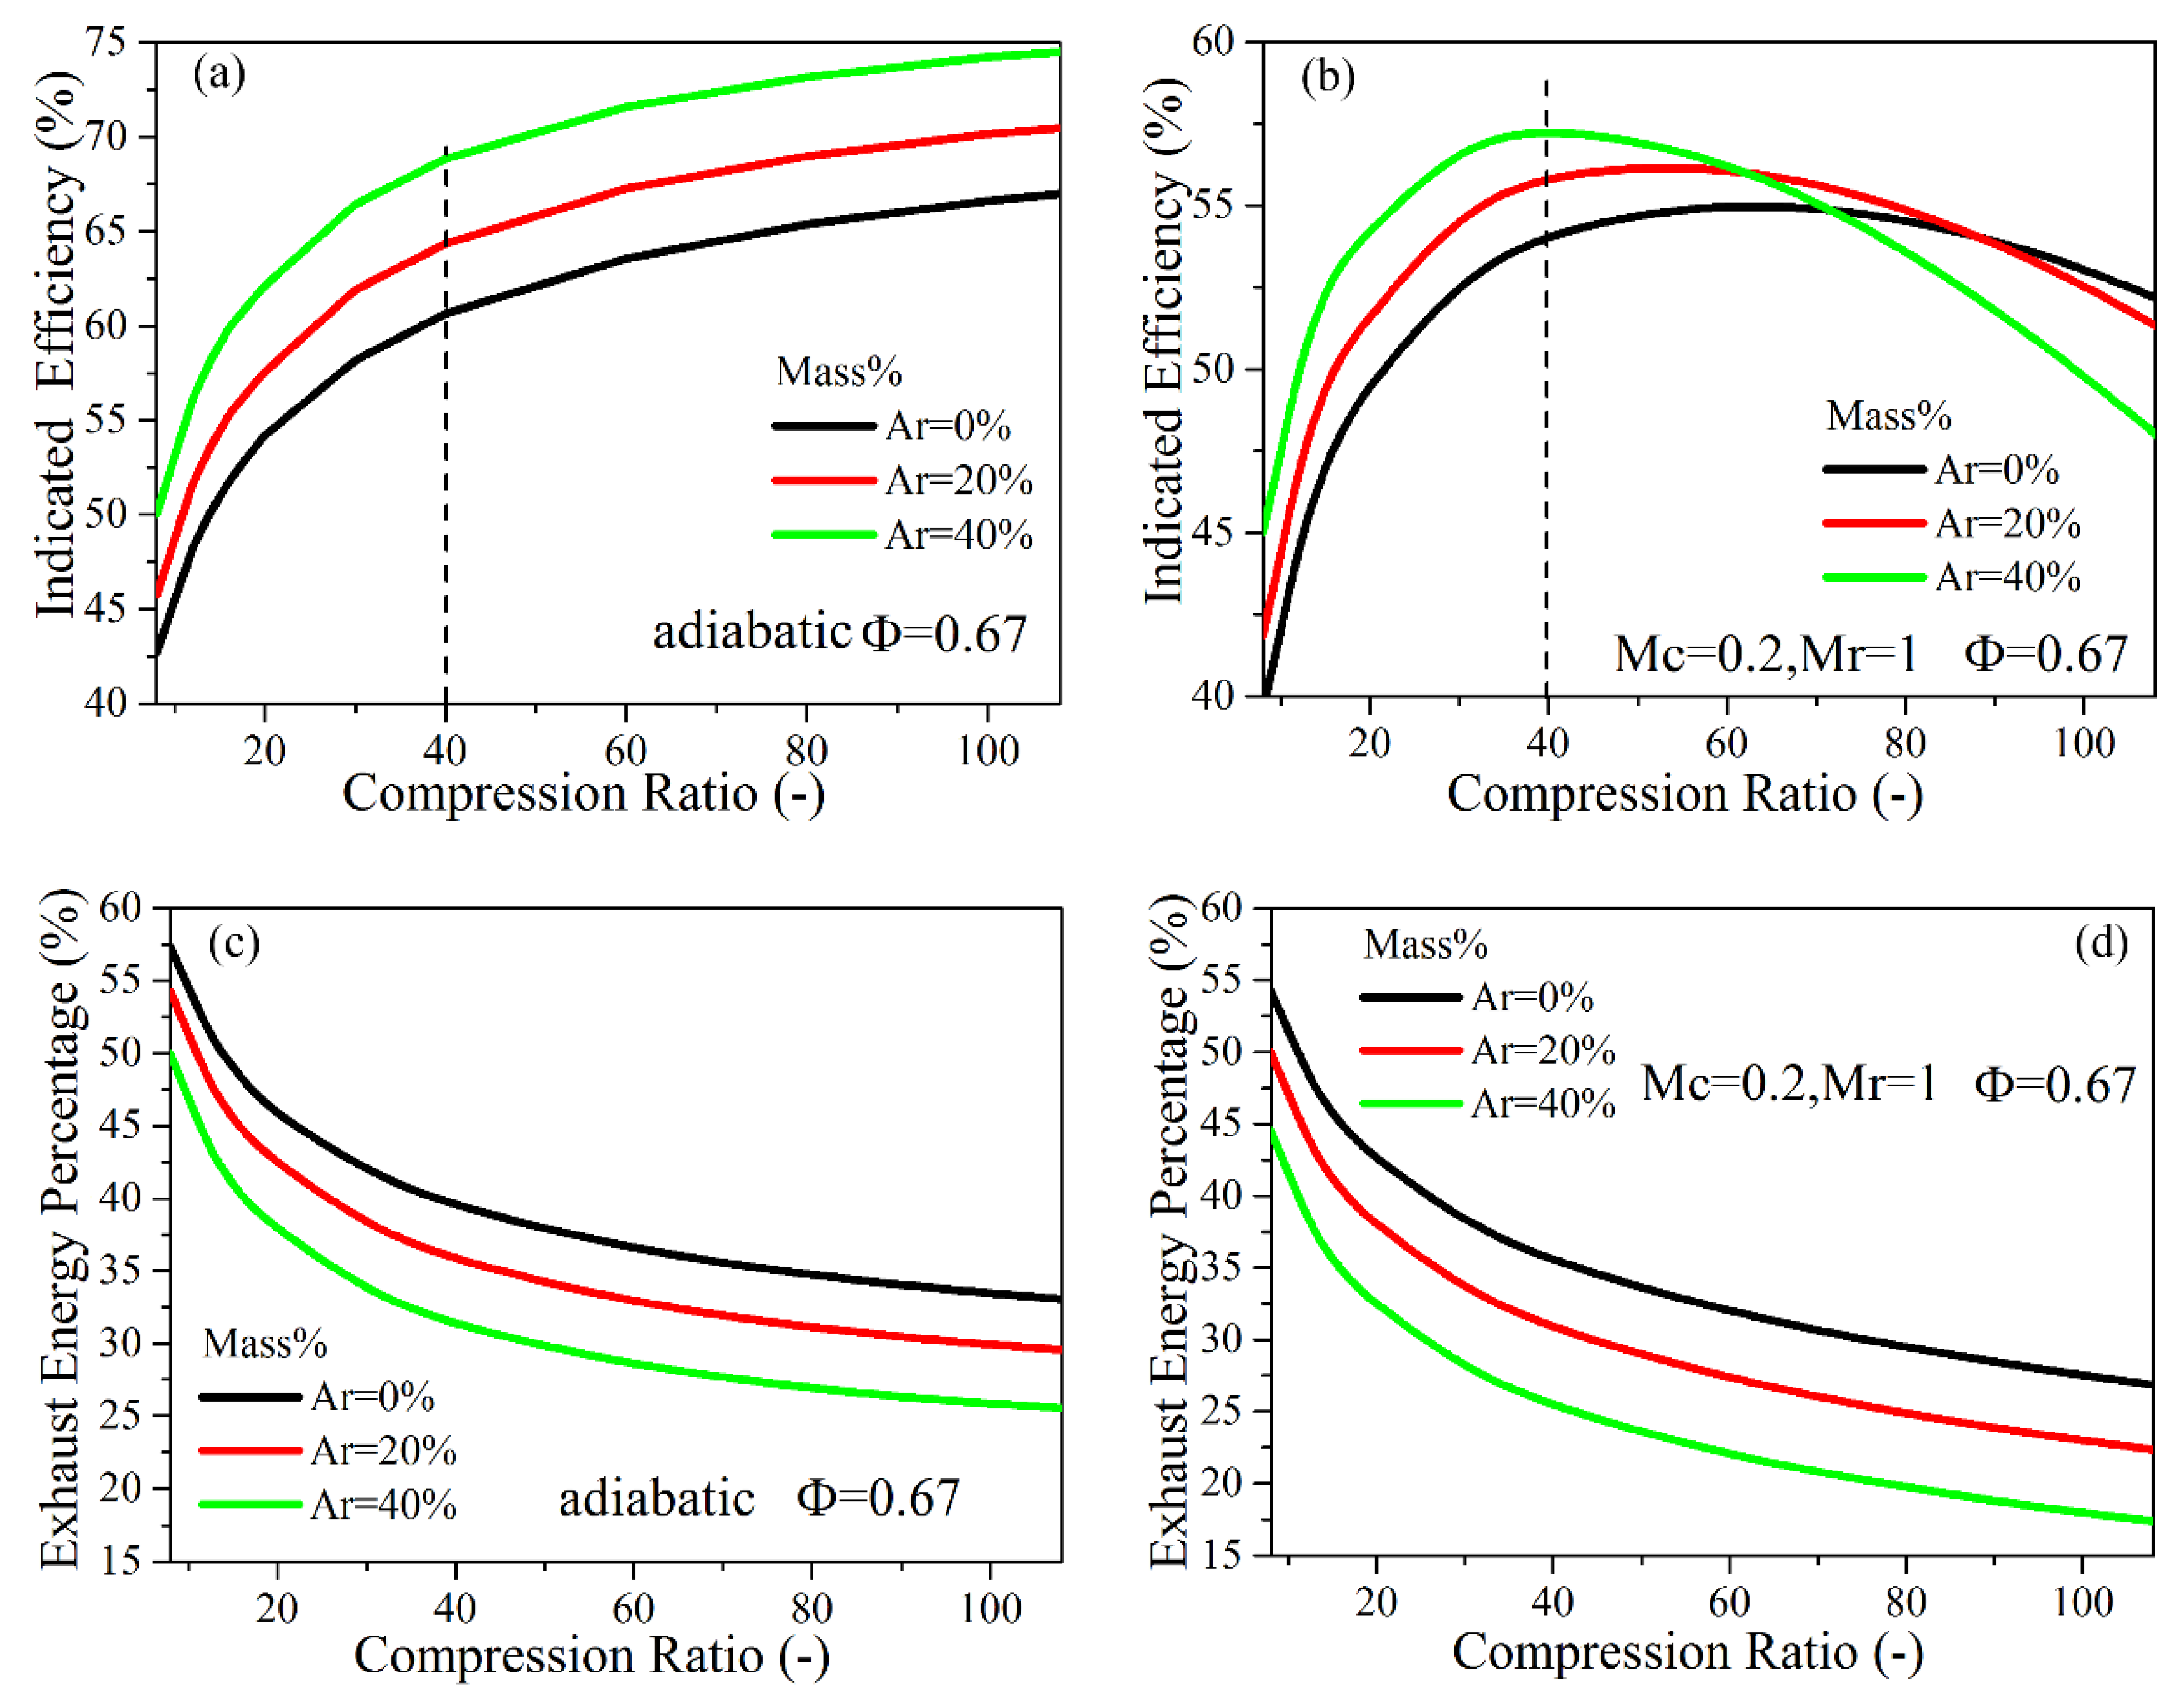
Figure 8 shows the indicated efficiency and exhaust energy for different intake argon percentage in the function of compression ratio, the mass percentage of intake O2 is kept constant to 23% and intake pressure is varied to control the equivalence ratio equal to 0.67 (calculated by all the oxygen in the cylinder). The assumed adiabatic cases without heat transfer and low heat transfer cases are compared. Under the adiabatic condition, the indicated efficiency shows a significant improvement with the increase of intake argon percentage, and the exhaust energy is reduced as shown in Figure 8c or Figure 8d. The indicated efficiency approaching 75% is obtained with 40% intake argon percentage by using extremely high compression ratio of 100:1, which shows an nearly 10% improvement compared with standard air without argon in the intake fluids. When there exists heat transfer, even if it is fairly low compared to the normal heat transfer coefficient, the peak indicated efficiency is significantly lower than the adiabatic condition. The indicated efficiency increases initially, then drops when the compression ratio exceeds 40. Furthermore, with the increase of intake argon percentage, the drop of indicated efficiency is found to be more sensitive to the compression ratio. That is mainly caused by the sharp increase of heat transfer. The peak indicated efficiency can reach 57% with 40% argon and 40:1 compression ratio at a low heat transfer condition. At the same compression ratio and argon percentage with adiabatic condition, the peak indicated efficiency is achieved to 69%.
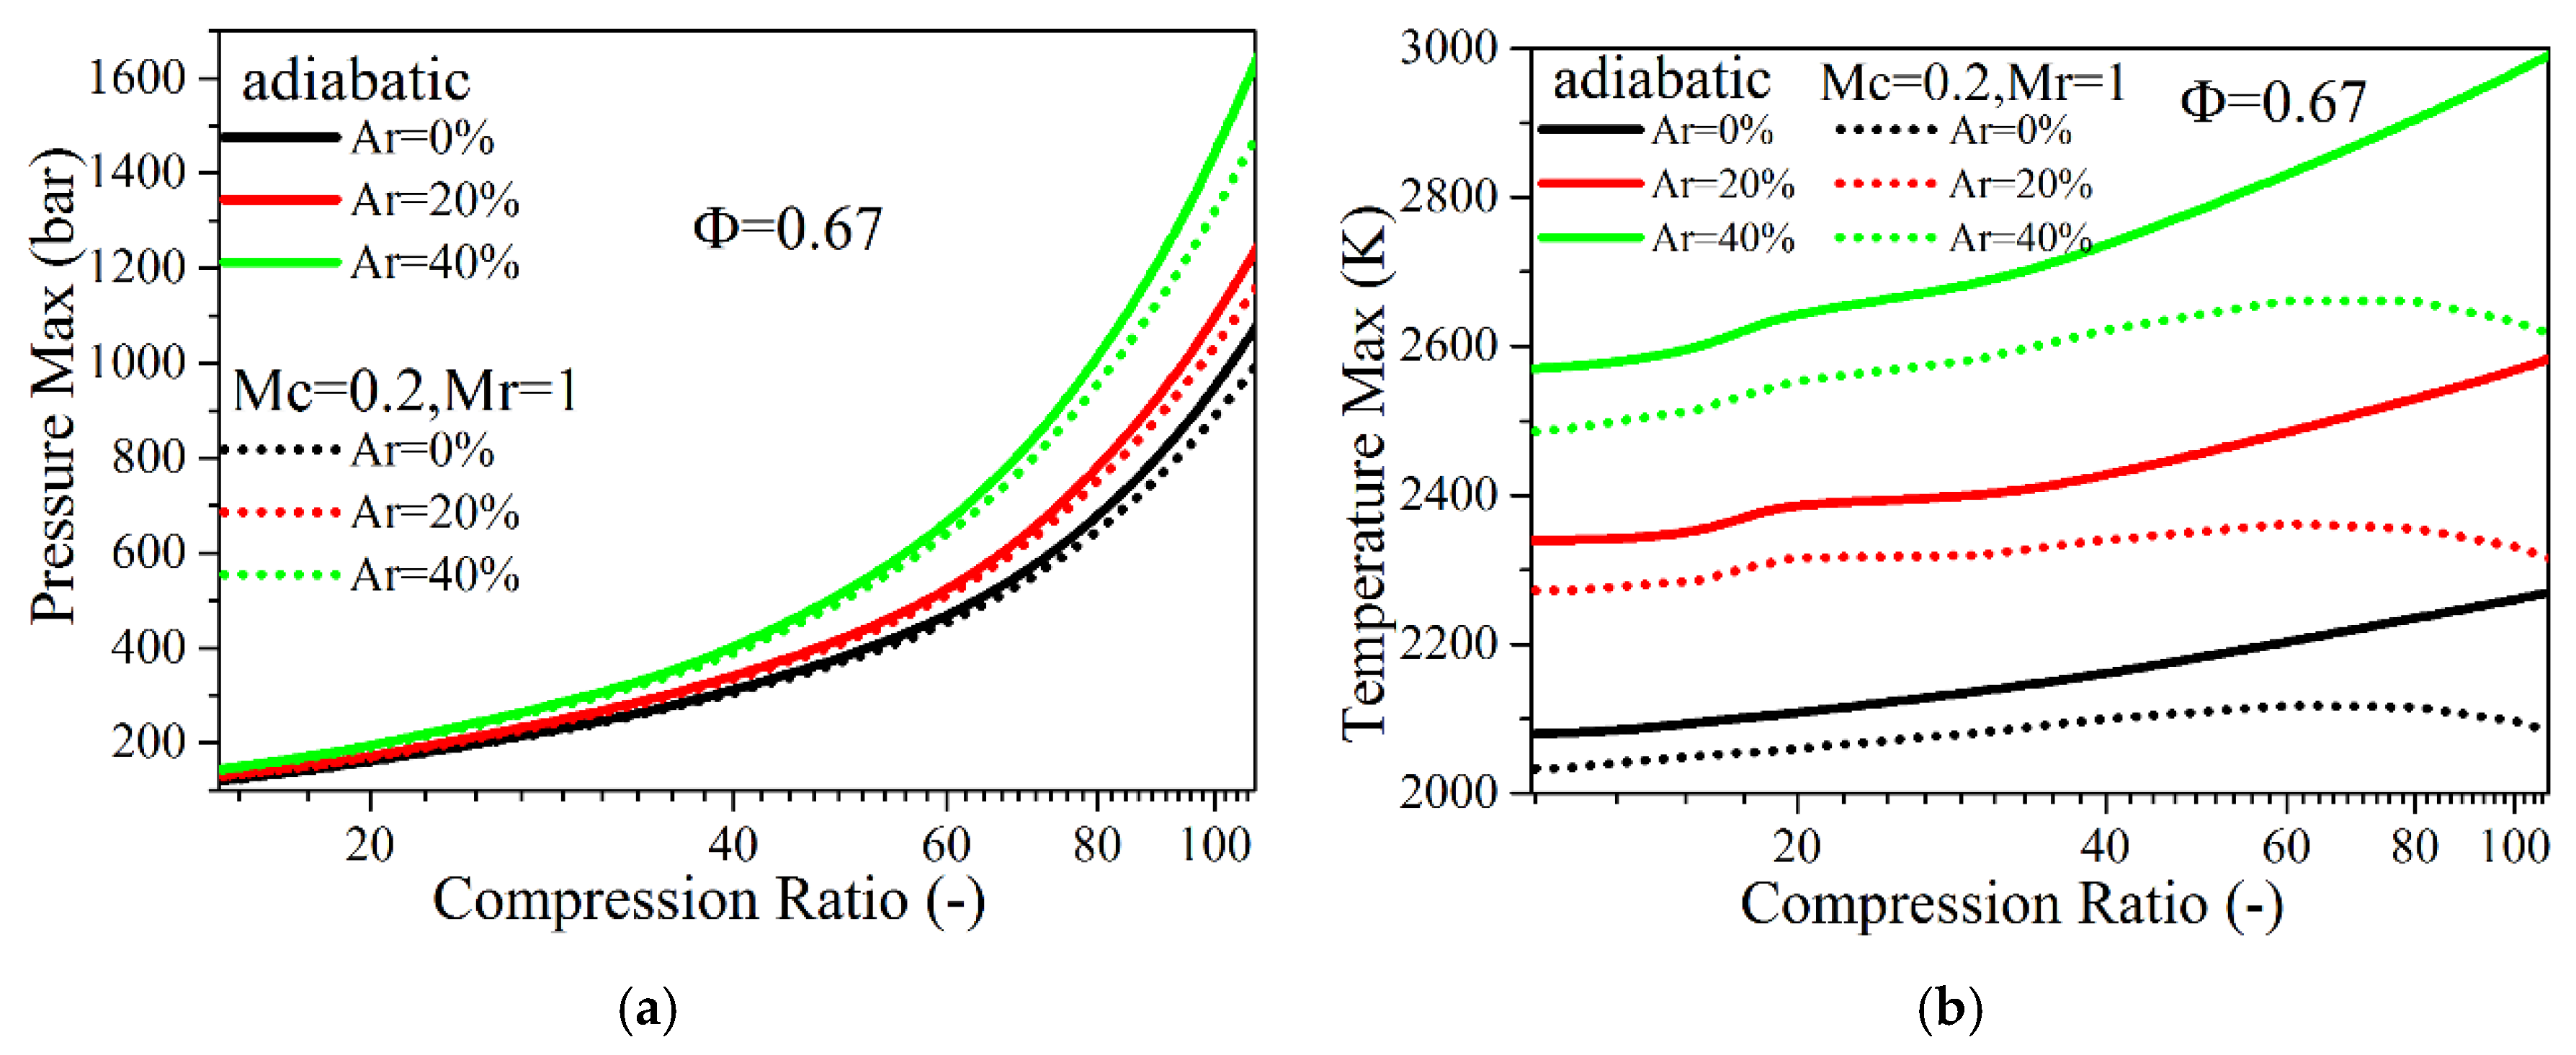
The effects of intake argon percentage on the maximum in-cylinder pressure and temperature are showed in Figure 9. Increasing the intake argon percentage can produce high peak cylinder pressures, especially the pressure enhancement becomes more obvious when the compression ratio exceeds 40. Meanwhile, the heat transfer coefficient has little effect on the in-cylinder pressure. At the compression ratio of 40:1, the maximum in-cylinder pressure of 40% argon is controlled in 400 bar, while the maximum in-cylinder pressure is about 300 bar for the standard air. So when the engine mechanical load is in considered, a relatively low compression ratio with a higher inert gases ratio is favored.
As can be seen from Figure 9, there is a significant increase in the peak in-cylinder temperature with the increase of intake argon percentage, especially under adiabatic compression, the peak in-cylinder temperature is more than 2600 K at the compression ratio of 20. For the Carnot cycle, it is well-known that a higher temperature results in higher efficiency because the Carnot cycle is based on heat engine concepts. For an internal combustion engine, however, it is not a heat engine in practice. The heat transfer is inevitable and a high in-cylinder temperature will result in the increase of heat transfer losses, thus lower thermal energy converts to useful work. Furthermore, higher in-cylinder temperature will result in more severe challenges to the engines with high thermal tolerance and durability. Besides advanced materials, some solutions should be taken to suppress the peak in-cylinder temperature in order to release the thermal load.
4.3.2. Intake N2 Replacement by CO2
Compared with monatomic gases, CO2 is characterized by a high specific heat, which is beneficial for controlling in-cylinder temperature. However, its specific heat ratio γ is lower. Meanwhile, CO2 is also an important composition in exhaust gas recirculation. Figure 10 and Figure 11 show the energy distribution, the maximum in-cylinder pressure and peak in-cylinder temperature at different CO2 percentages in the intake gas. For the calculations, N2 is replaced by CO2, the mass percentage of O2 in the intake gas is fixed at 23%, and the fuel–air equivalence ratio is kept constant to 0.57. At the same time, a low heat-transfer coefficient (Mc = 0.2, Mr = 1) is defined to represent a LHR engine.
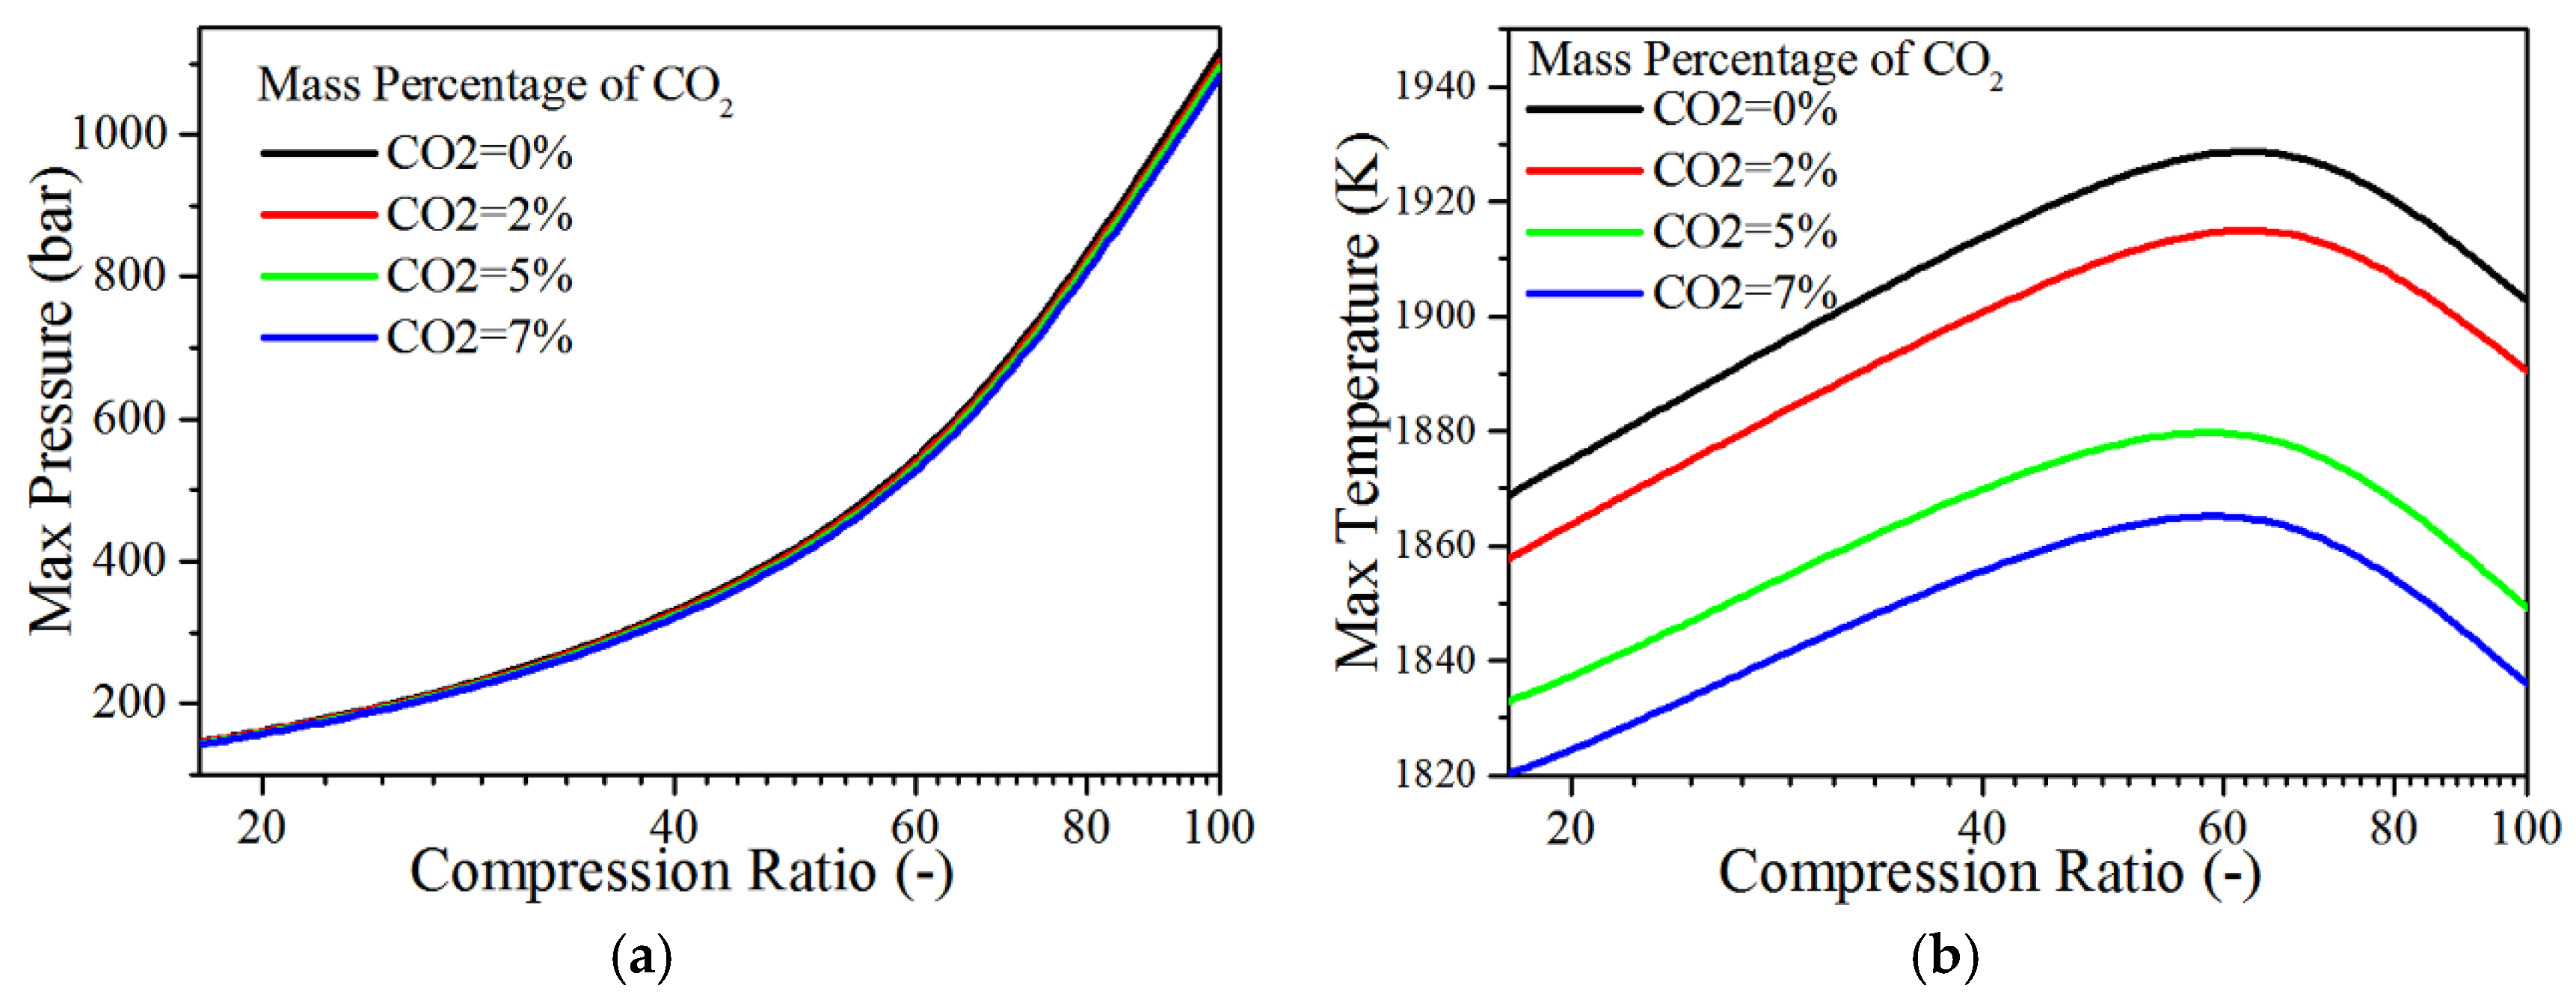
As can be seen in Figure 10, for a different CO2 mass percentage, it shows a similar energy distribution current in the function of compression ratio. With the increase of compression ratio, the exhaust energy decreases, and heat transfer losses increase rapidly. The peak indicated efficiency of different intake CO2 mass percentage is achieved at compression ratio about 60:1. For a certain compression ratio, a higher CO2 replacement can depress the peak in-cylinder temperature significantly due to higher specific heat of CO2, as shown in Figure 11, thus reducing the in-cylinder heat transfer losses. However, the depressed in-cylinder temperature may be at a disadvantage on energy extraction during the expansion phase of the engine cycles, which means that more energy is translated into exhaust. On the whole, there is a slight reduction in the indicated efficiency with the increase of intake CO2. A peak indicated efficiency of 56% is achieved at 60:1 compression ratio without intake CO2 replacement. As for the 7% intake CO2, the peak indicated efficiency is about 55.5% with a significantly reduced in-cylinder temperature. The intake composition of CO2 has few effects on the maximum in-cylinder pressure, which is mainly dominated by compression ratio.
4.4. The Effects of Fuels Properties
Different fuel properties have a significant impact on the process of the mixture preparation and combustion, thus thermodynamical process and peak indicated efficiency are analyzed for different fuel properties. Methanol, isooctane and hydrogen are compared with diesel fuel in this section. For all tested fuels, the total energy entering the cylinder per cycle is kept equivalent to 80 mg diesel fuel (3424 J/cycle); the corresponding mass flow rate is shown in Table 2. In the simulations, the intake pressure for all cases is kept constant at 2.0 bar. The low heat transfer condition with Mc = 0.2 and Mr = 1 is utilized for all tested fuels.
Figure 12 and Figure 13 show the energy distribution, the maximum in-cylinder pressure and temperature using different fuels in the function of compression ratio at low heat transfer coefficient condition. As shown in Figure 12, all fuels show a similar trend that with the increase of compression ratio, the indicated efficiency increases initially and then declines as the compression ratio above 60:1, and the exhaust energy decreases with the increase of compression ratio. Compared with other fuels, methanol shows higher indicated efficiency and lower exhaust energy, and the improvement is much more significant with the increase of compression ratio. This improvement is mainly derived from the reduction of heat transfer losses, as shown in Figure 13, the maximum in-cylinder temperature of methanol is significantly lower than that of other fuels. Hydrogen also achieves a slightly higher indicated efficiency while the isooctane is almost the same with diesel. However, as shown in Figure 12, the indicated efficiency is mainly governed by compression ratio. For example, the peak indicated efficiency of methanol is 58.6% at the corresponding compression ratio of 60:1, only shows 3% improvement compared to diesel or isooctane. However, compared to the improvement in indicated efficiency, the methanol suppresses the in-cylinder temperature even more significant, as shown in Figure 13. On the one hand, the low heating value of methanol is the lowest, and thus the mass flow rate of methanol is increased to 162.2 mg per cycle from 80 mg. On the other hand, the latent heat of vaporization is 2.6 times higher than diesel at the same fuel mass. For these two reasons, when methanol is injected into the cylinder, more than 5 times the latent heat of vaporization per cycle results in a reduction of 150 to 200 K on average of the maximum in-cylinder temperature. Even at a compression ratio of 100:1, the peak in-cylinder temperature is limited in 2000 K, which is favored to reduce heat transfer losses and alleviate thermal load.
4.5. The Effects of Combustion Phasing
Combustion phasing including CA50 and combustion duration, has a significant effect on the energy distribution. In the adiabatic condition, a combustion phasing with a short combustion duration and CA50 close to the top dead center will be beneficial for the improvement of indicated efficiency theoretically. However, once an engine has heat transfer, the excessively intensified combustion process (with a quite short combustion duration) will result in the increase of peak in-cylinder temperature and pressure. As a consequence, the heat transfer losses will be increased, especially when the CA50 is too advanced before the top dead center, which is a disadvantage on the improvement of efficiency. On the contrary, a poor combustion phasing with a retarded CA50 and relatively long combustion duration, the heat transfer will be decreased. However, when combustion occurs at larger volumes, the energy extraction during the expansion phase of the engine cycle is also deteriorated due to the decline in the degree of constant volume, and the exhaust energy will be increased. What is more, incomplete combustion will contribute significantly to the losses with a too-delayed and slow combustion.
Figure 14 shows the effects of CA50 and combustion duration on the performance at different compression ratios with a low heat transfer coefficient (Mc = 0.2). The mass rate of fuel injection is 80 mg diesel fuel per cycle, the fuel–air equivalence ratio is kept constant to 0.57. The results show that the indicated efficiency is determined by combustion duration and CA50 together, a short and intensified combustion is advantageous to increase the indicated efficiency. For a given combustion duration, there exists an optimal CA50 range to achieve peak indicated efficiency, about 3 to 10 °CA ATDC. In this range, the combustion duration demonstrates a strong effect on the indicated efficiency. Too early or late CA50 will lead to the deterioration of the indicated efficiency, as shown in Figure 14a, especially when CA50 is before the optimal CA50 range, the indicated efficiency decreases rapidly with the advancement of CA50. Figure 14b shows the effects of CA50 and combustion duration on heat transfer losses, it shows that heat transfer increases significantly with the advancement of CA50. At an early CA50 range, the heat transfer is mainly dominated by CA50. Too early CA50 results in the increase of the in-cylinder temperature and thus the heat transfer is increased. At late CA50 range, heat transfer losses are reduced due to the decreased in-cylinder temperature, the short combustion duration can improve indicated efficiency due to the improvement on the degree of constant volume. The exhaust energy at late CA50 range is also strongly affected by CA50, the delay of CA50 results in the significant increase of exhaust energy. A shorter combustion duration can decrease the exhaust energy.
Figure 15 shows the effects of CA50 and combustion duration on the maximum in-cylinder pressure and temperature. As shown in Figure 15a, combustion duration has no significant effects on the maximum in-cylinder pressure and the in-cylinder pressure is manly dominated by CA50. The maximum in-cylinder pressure increases with the advancement of CA50 when the CA50 is before 10 °CA ATDC. As CA50 is retarded after 10 °CA ATDC, the maximum in-cylinder pressure remains unchanged with the delay of CA50. As shown in Figure 15b, the maximum in-cylinder temperature is controlled by CA50 and combustion duration together. A late CA50 and long combustion duration can suppress the maximum in-cylinder temperature effectively.
4.6. The Effects of Single-Cylinder Displacement
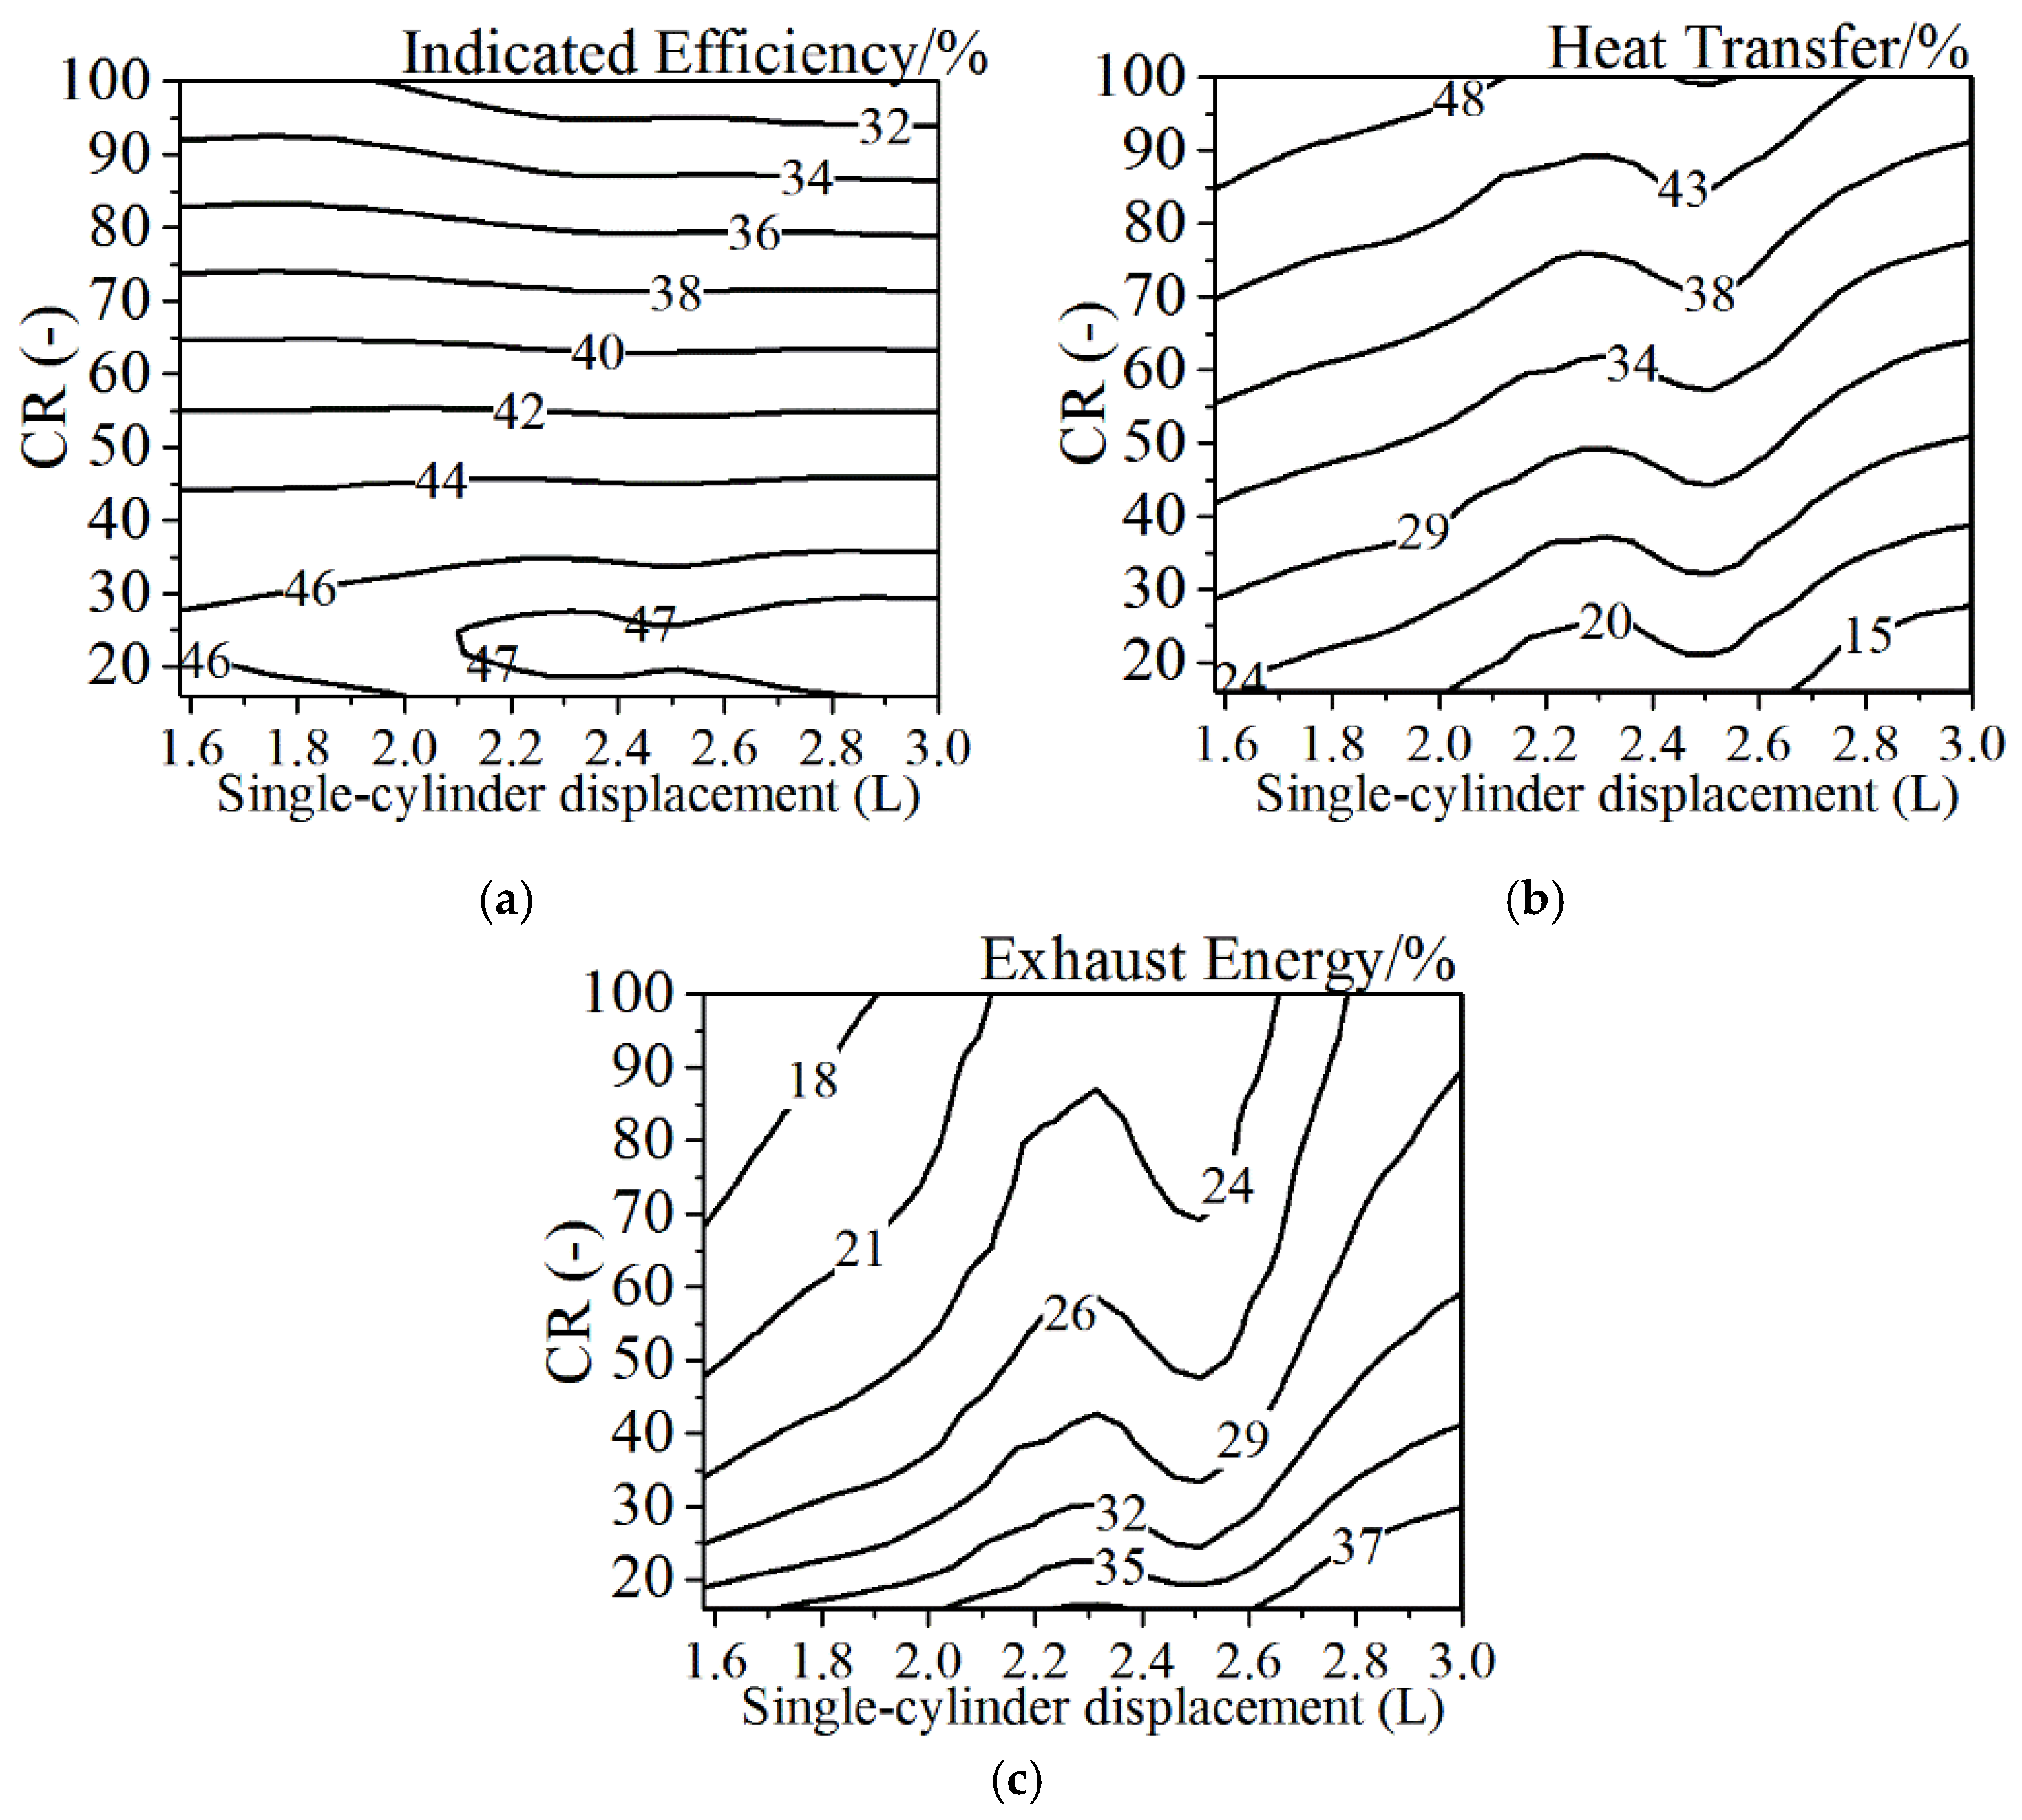
Figure 16 shows the energy distribution as function of single-cylinder displacement and compression ratio with a low convection multiplier (Mc = 0.2), the intake pressure is controlled at 2.0 bar. At a given compression ratio, the increased single-cylinder displacement means that it has the same stroke but larger bore. The results show that the indicated efficiency is mainly dominated by the compression ratio at a low heat-transfer condition. The optimal compression ratio is about 50:1 and too high of a compression ratio will result in a decrease in the indicated efficiency mainly due to the sharp increase of heat transfer losses, even though the exhaust energy is decreased. At the same time, there is only a little improvement on indicated efficiency with the increase of the single-cylinder displacement. Different from the indicated efficiency, both the compression ratio and single-cylinder displacement have large effects on the heat transfer losses. The reason is that more intake air is introduced with the increase of single-cylinder displacement, which will suppress the in-cylinder temperature. On the other hand, a heat transfer surface with a high temperature also decreased, thus resulting in reduced heat transfer losses.
Figure 17 shows the energy distribution as a function of single-cylinder displacement and compression ratio with a stock heat transfer coefficient (Mc = 1.2), the intake pressure is also controlled at 2.0 bar. Similar to the low heat-transfer conditions, the indicated efficiency is mainly dominated by the compression ratio, however the optimal compression ratio and peak indicated efficiency is reduced at the large heat transfer condition. Compared with the low heat-transfer condition, a larger single-cylinder displacement reduces the heat transfer losses more significantly due to the increase of heat transfer coefficient. Therefore, under the normal heat transfer condition, the larger single-cylinder displacement combined with the lower compression ratio is better to improve the thermal efficiency.
5. Conclusions
The first law of thermodynamics is used to theoretically investigate pathways in order to maximize engine efficiency for potential development on future engines. Some related strategies are considered in this study, including compression ratio, heat transfer coefficient, equivalence ratios, intake compositions, alternative fuels, combustion phasing and displacement volume. The main conclusions can be drawn as shown in the following.
- At the normal compression ratio, with the decrease of heat transfer coefficient, heat transfer losses are reduced. However, the majority of saved energies are lost in the exhaust instead of useful work. If the compression ratio continues to increase, indicated efficiency does not always increase. Instead, the heat transfer coefficient determines optimal compression ratio. As the heat transfer coefficient decreases, the corresponding optimal compression ratio increases to obtain higher indicated efficiency. For the normal heat transfer coefficient (Mc = 1.2, Mr = 1), the peak indicated efficiency is achieved at a compression ratio of 30, which means that the indicated efficiency cannot be improved even if the compression ratio is increased to ultra-high compression ratio without changing the heat transfer coefficient.
- A lean combustion can decrease the heat transfer losses and exhaust energy, and the peak in-cylinder temperature is also suppressed effectively. For different equivalence ratios, the corresponding compression ratio to achieve peak indicated efficiency is varied. As the compression ratio is from 20 to 40, the lean mixtures will be favorable for higher indicated efficiency.
- If argon is used to replace N2, at the compression ratio of 20–40, a higher indicated thermal efficiency will be achieved with increasing intake argon percentage in either adiabatic or low heat transfer conditions. At the ultra-high compression ratio (40–100) with a low heat-transfer condition and the increase of the intake argon ratio, the indicated efficiency does not show a positive effect, and the maximum cylinder pressure increased more significantly. If CO2 is used to replace N2, the indicated efficiency decreases slightly with the increase of the intake CO2 ratio when the compression ratio is lower than 60, and the temperature in the cylinder with higher intake CO2 ratio decreases significantly at the compression ratio of 20–100.
- Methanol shows an excellent ability in decreasing the peak in-cylinder temperature, and the peak indicated efficiency is relatively higher than other tested fuels at the compression ratio of 10–120.
- A sharp and intensified combustion phasing is beneficial for the improvement of the indicated efficiency—there exists an optimal CA50 for the given heat transfer coefficient. The single-cylinder displacement has a much stronger effect on the heat transfer losses and exhaust energy compared to the effect on the indicated efficiency. Under the normal heat transfer condition, the larger single-cylinder displacement combined with the lower compression ratio is better to improve the thermal efficiency.
Acknowledgments
The authors would like to acknowledge the financial supports provided by the National Key Research and Development Program of China (Grant No. 2017YFC0806302) and the National Natural Science Foundation of China (Grant No. 91541111).
Author Contributions
All authors have worked on this manuscript together and all authors have read and approved the final manuscript. Haifeng Liu, Laihui Tong and Zunqing Zheng planned the research work, and checked the calculated results. Laihui Tong simulated all the cases. Haifeng Liu, Junsheng Ma, Laihui Tong and Guixiang Ma analyzed the data. Haifeng Liu, Junsheng Ma and Laihui Tong wrote the paper. Zunqing Zheng helped to check the English. Zunqing Zheng and Mingfa Yao provided support and gave useful suggestions during the whole work.
Conflicts of Interest
The authors declare no conflicts of interest.
References
- Ribeiro, S.K.; Figueroa, M.J.; Creutzig, F.; Dubeux, C.; Hupe, J.; Kobayashi, S. Energy end-use: Transport. FEBS Lett. 2012, 565, 101–105. [Google Scholar]
- Davis, S.C. Transportation Energy Data Book: Edition 23; National Technical Information Servic: Springfield, VA, USA, 2003. [Google Scholar]
- Song, H.; Quinton, K.; Peng, Z.; Zhao, H.; Ladommatos, N. Effects of oxygen content of fuels on combustion and emissions of diesel engines. Energies 2016, 9, 28. [Google Scholar] [CrossRef]
- Bezergianni, S.; Dimitriadis, A.; Faussone, G.C.; Karonis, D.; Sciubba, E. Alternative diesel from waste plastics. Energies 2017, 10, 1750. [Google Scholar] [CrossRef]
- Feng, L.; Du, B.; Tian, J.; Long, W.; Tang, B. Combustion performance and emission characteristics of a diesel engine using a water-emulsified heavy fuel oil and light diesel blend. Energies 2015, 8, 13628–13640. [Google Scholar] [CrossRef]
- Han, D.; Duan, Y.; Wang, C.; Lin, H.; Huang, Z.; Wooldridge, M.S. Experimental study of the two-stage injection process of fatty acid esters on a common rail injection system. Fuel 2016, 163, 214–222. [Google Scholar] [CrossRef]
- Han, D.; Zhai, J.; Duan, Y.; Ju, D.; Lin, H.; Huang, Z. Macroscopic and microscopic spray characteristics of fatty acid esters on a common rail injection system. Fuel 2017, 203, 370–379. [Google Scholar] [CrossRef]
- Han, D.; Li, K.; Duan, Y.; Lin, H.; Huang, Z. Numerical study on fuel physical effects on the split injection processes on a common rail injection system. Energy Convers. Manag. 2017, 134, 47–58. [Google Scholar] [CrossRef]
- Qasim, M.; Ansari, T.M.; Hussain, M.; Sciubba, E. Combustion, performance, and emission evaluation of a diesel engine with biodiesel like fuel blends derived from a mixture of pakistani waste canola and waste transformer oils. Energies 2017, 10, 1023. [Google Scholar] [CrossRef]
- Azami, M.H.; Savill, M. Pulse detonation assessment for alternative fuels. Energies 2017, 10, 369. [Google Scholar] [CrossRef]
- Papagiannakis, R.G.; Rakopoulos, D.C.; Rakopoulos, C.D. Theoretical study of the effects of spark timing on the performance and emissions of a light-duty spark ignited engine running under either gasoline or ethanol or butanol fuel operating modes. Energies 2017, 10, 1198. [Google Scholar] [CrossRef]
- Boretti, A.A. Energy recovery in passenger cars. J. Energy Resour. Technol. 2012, 134, 022203. [Google Scholar] [CrossRef]
- Ryan, L.B.; Cuenot, F.; Fulton, L. Technology Roadmap: Fuel Economy of Road Vehicles; Techinical Report; International Energy Agency (IEA): Paris, France, 2012. [Google Scholar]
- Ntziachristos, L.; Mellios, G.; Samaras, Z. What is the real-world CO2 reduction benefit of the 95 g/km passenger car average emission target to be reached by 2020? Procedia Soc. Behav. Sci. 2012, 48, 2048–2057. [Google Scholar] [CrossRef]
- US Environmental Protection Agency (EPA); National Highway Traffic Safety Administration (NHTSA). Finalize Historic National Program to Reduce Greenhouse Gases and Improve Fuel Economy for Cars and Trucks; US Environmental Protection Agency Regulatory Announcement: Washington, DC, USA, 2011.
- Gillis, J.; Cooper, M. On the Road to 54 Mpg: A Progress Report on Achievability; Technical Report; Consumer Federation of America: Washington, DC, USA, 2013. [Google Scholar]
- DOE. Fuel Economy: Where the Energy Goes. 2012. Available online: www.fueleconomy.gov/feg/atv.shtml (accessed on 12 November 2017).
- Primus, R.J.; Hoag, K.L.; Flynn, P.F.; Brands, M.C. An Appraisal of Advanced Engine Concepts Using Second Law Analysis Techniques; Technical Report; International Energy Agency (IEA): Paris, France, 1984. [Google Scholar]
- Taymaz, I.; Cakir, K.; Gur, M.; Mimaroglu, A. Experimental investigation of heat losses in a ceramic coated diesel engine. Surf. Coat. Technol. 2003, 169, 168–170. [Google Scholar] [CrossRef]
- Taymaz, I. An experimental study of energy balance in low heat rejection diesel engine. Energy 2006, 31, 364–371. [Google Scholar] [CrossRef]
- Parlak, A. The effect of heat transfer on performance of the diesel cycle and exergy of the exhaust gas stream in a lhr diesel engine at the optimum injection timing. Energy Convers. Manag. 2005, 46, 167–179. [Google Scholar] [CrossRef]
- Parlak, A.; Yasar, H.; Eldogan, O. The effect of thermal barrier coating on a turbo-charged diesel engine performance and exergy potential of the exhaust gas. Energy Convers. Manag. 2005, 46, 489–499. [Google Scholar] [CrossRef]
- Heywood, J. Internal Combustion Engine Fundamentals; McGraw-Hill: New York, NY, USA, 1988. [Google Scholar]
- Edson, M.H. The influence of compression ratio and dissociation on ideal otto cycle engine thermal efficiency. In Digital Calculations of Engine Cycles; Elsevier: Amsterdam, The Netherlands, 1964; pp. 49–64. Available online: https://www.sciencedirect.com/science/article/pii/B9780080111049500077 (accessed on 12 November 2017).
- Edwards, C.F.; Miller, S.L.; Teh, K.Y. Thermodynamic requirements for maximum internal combustion engine cycle efficiency. Part 2: Work extraction and reactant preparation strategies. Int. J. Engine Res. 2008, 9, 467–481. [Google Scholar]
- Wang, H.; Liu, S.; He, J. Performance analysis and parametric optimum criteria of a quantum otto heat engine with heat transfer effects. Appl. Therm. Eng. 2009, 29, 706–711. [Google Scholar] [CrossRef]
- Payri, F.; Olmeda, P.; Martín, J.; Carreño, R. Experimental analysis of the global energy balance in a di diesel engine. Appl. Therm. Eng. 2015, 89, 545–557. [Google Scholar] [CrossRef]
- Abedin, M.J.; Masjuki, H.H.; Kalam, M.A.; Sanjid, A.; Rahman, S.M.A.; Masum, B.M. Energy balance of internal combustion engines using alternative fuels. Renew. Sustain. Energy Rev. 2013, 26, 20–33. [Google Scholar] [CrossRef]
- Svrcek, M.N.; Miller, S.L.; Edwards, C.F. Diesel spray behavior at compression ratios up to 100:1. At. Sprays 2010, 20, 453–465. [Google Scholar] [CrossRef]
- Teh, K.Y.; Miller, S.L.; Edwards, C.F. Thermodynamic requirements for maximum internal combustion engine cycle efficiency. Part 1: Optimal combustion strategy. Int. J. Engine Res. 2008, 9, 449–465. [Google Scholar] [CrossRef]
- Eilts, P.; Stoeber-Schmidt, C.P. Investigation of Extreme Mean Effective and Maximum Cylinder Pressures in a Passenger Car Diesel Engine; Technical Report; International Energy Agency (IEA): Paris, France, 2013. [Google Scholar]
- Laumann, E.A.; Reynolds, R.K. Hydrogen-Fueled Engine. U.S. Patent 4,112,875, 12 September 1978. [Google Scholar]
- Kuroki, R.; Kato, A.; Kamiyama, E.; Sawada, D. Study of High Efficiency Zero-Emission Argon Circulated Hydrogen Engine; Technical Report; International Energy Agency (IEA): Paris, France, 2010. [Google Scholar]
Figure 1.
Schematic diagram of GT-POWER model.
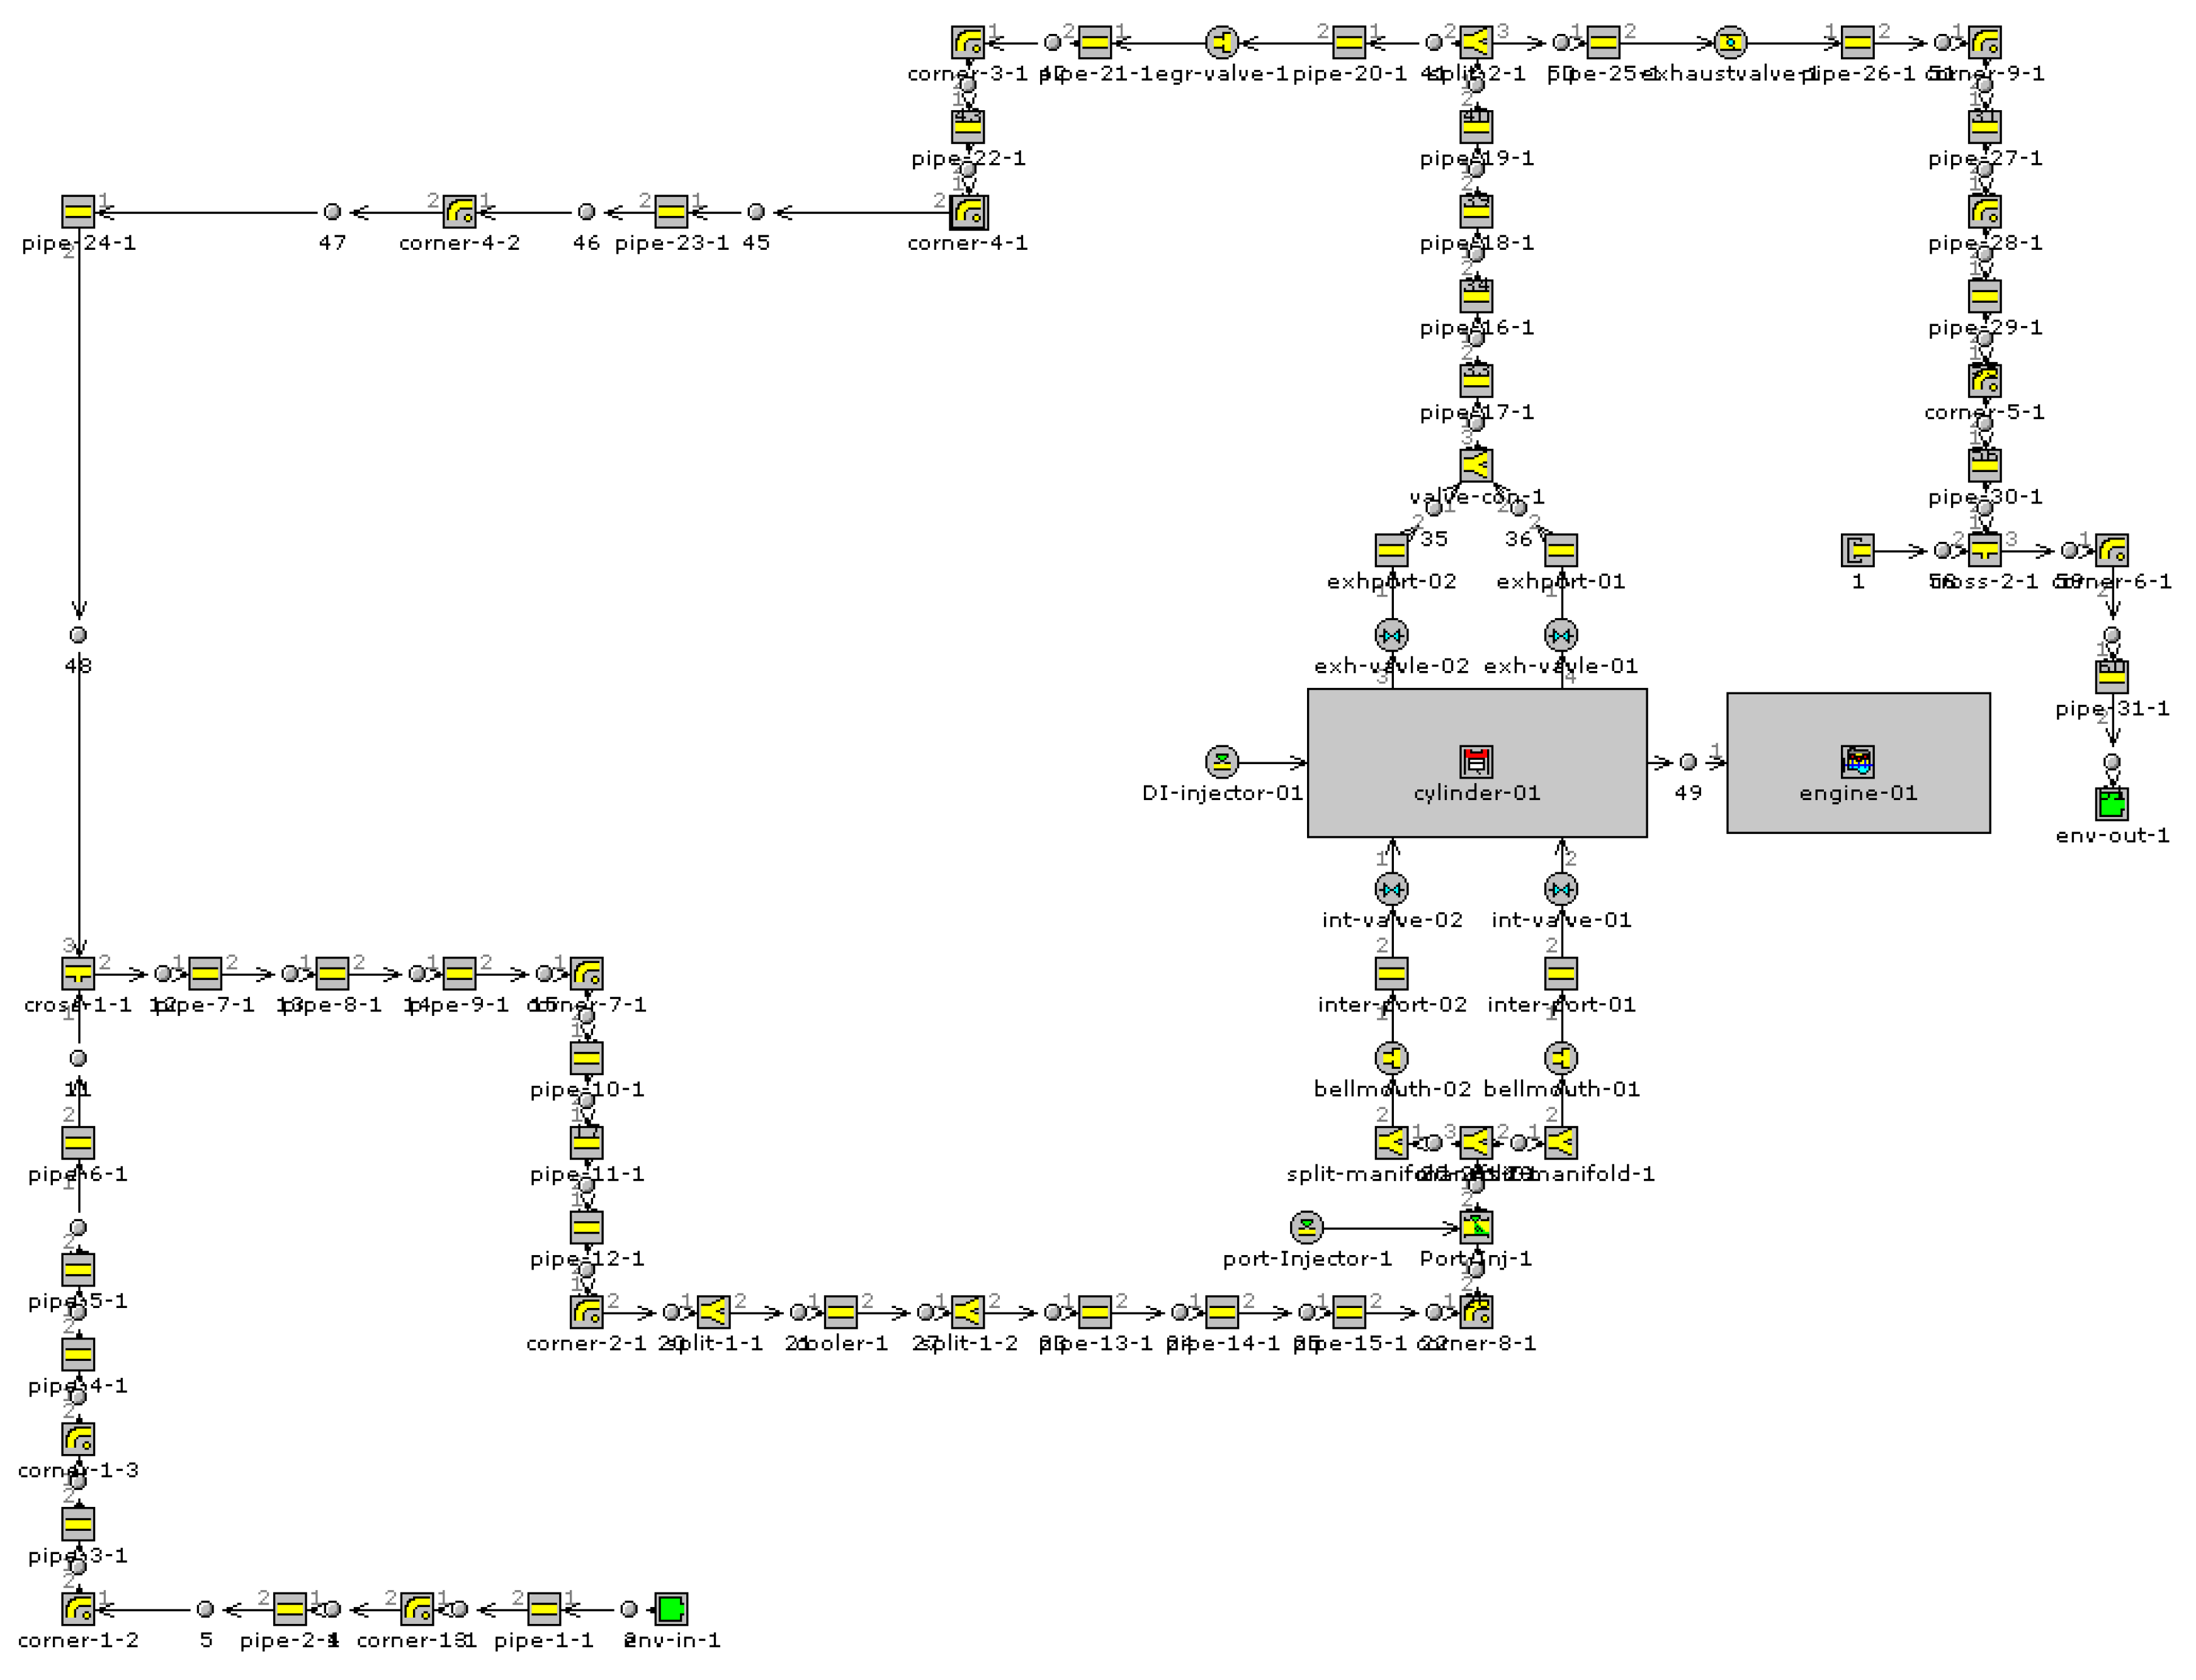
Figure 2.
Exhaust and intake valve lift.
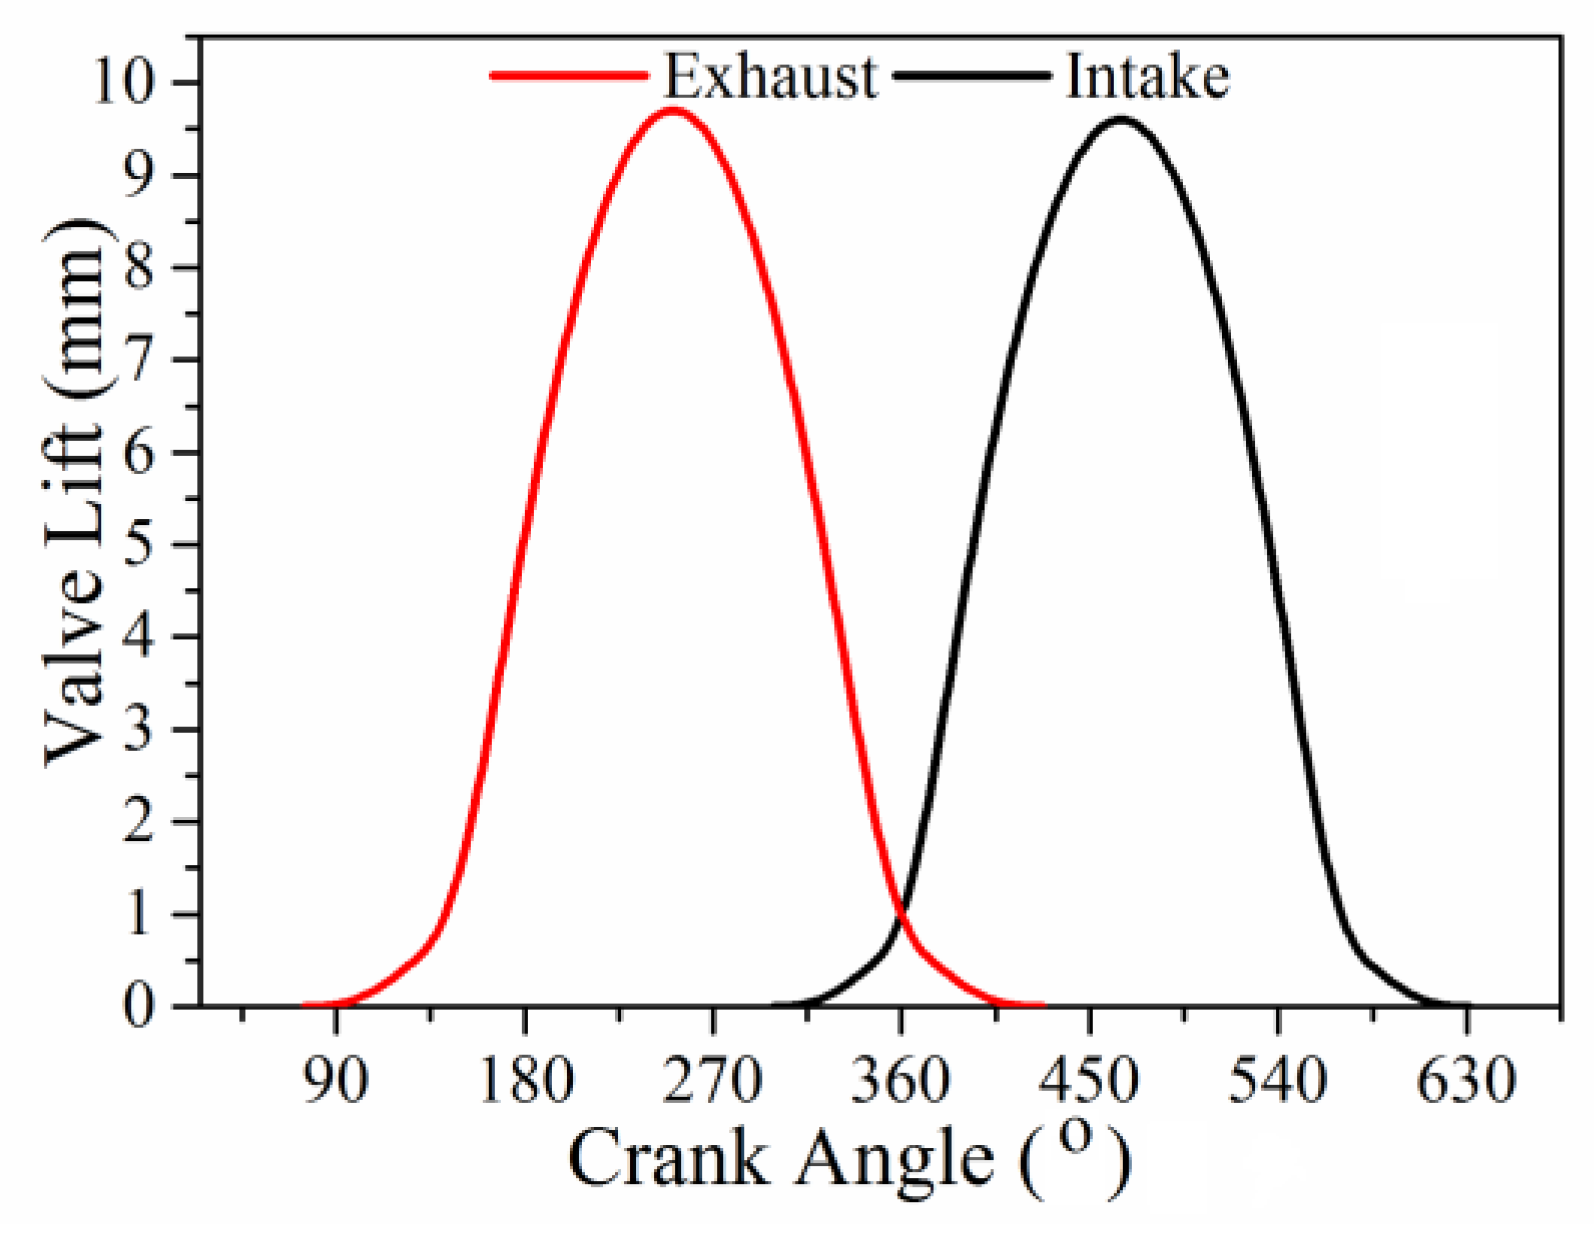
Figure 3.
Distribution of fuel energy with the change of convection multiplier under the original compression ratio.
Figure 3.
Distribution of fuel energy with the change of convection multiplier under the original compression ratio.
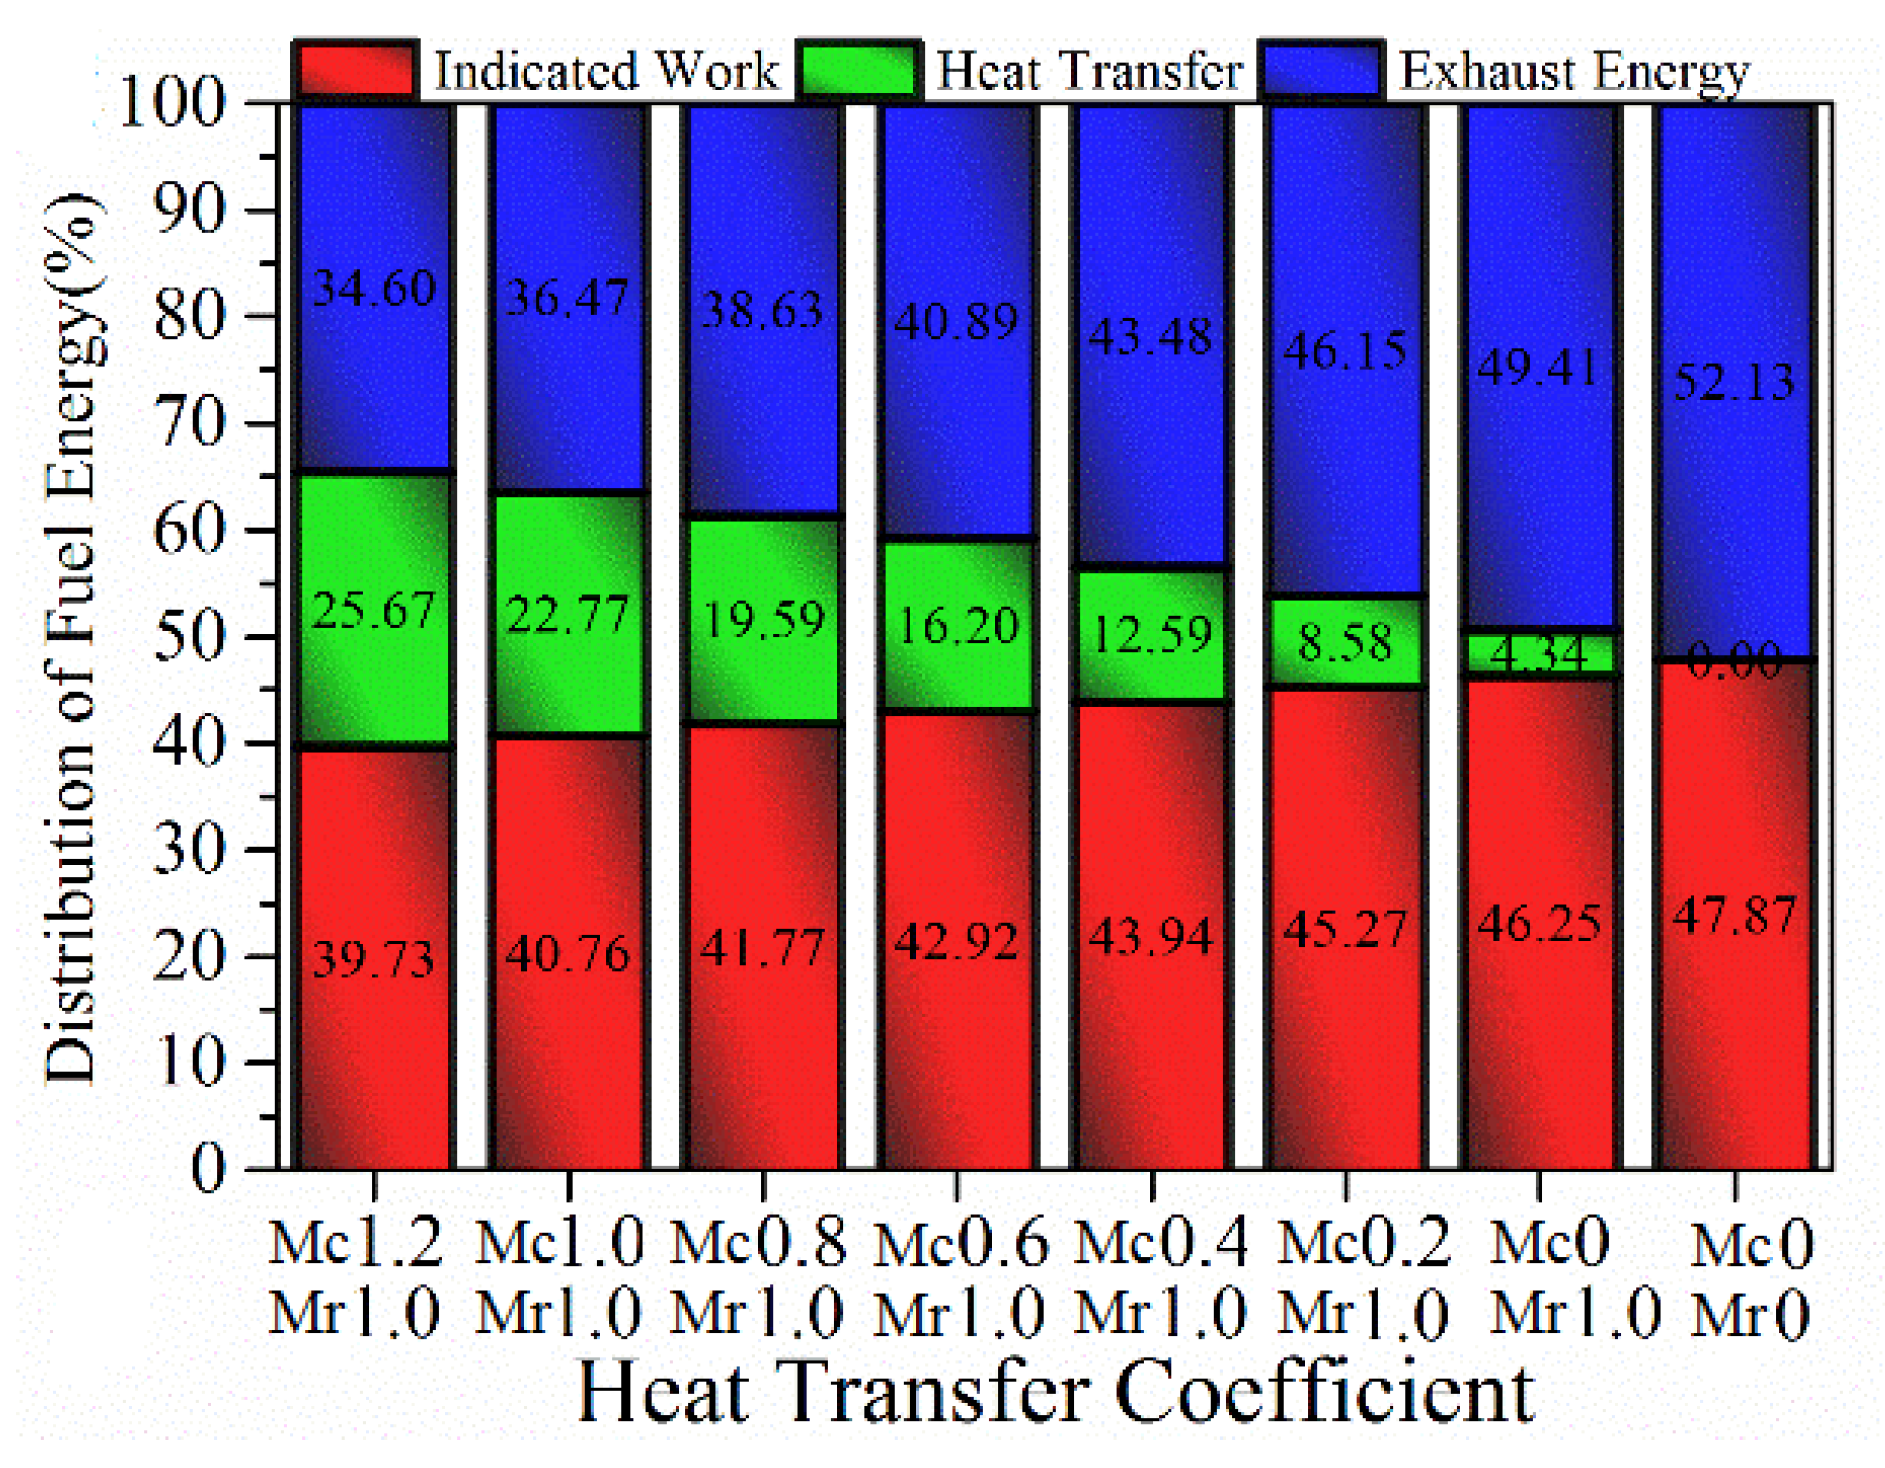
Figure 4.
Maximum in-cylinder temperature and exhaust temperature as a function of heat transfer coefficient.
Figure 4.
Maximum in-cylinder temperature and exhaust temperature as a function of heat transfer coefficient.
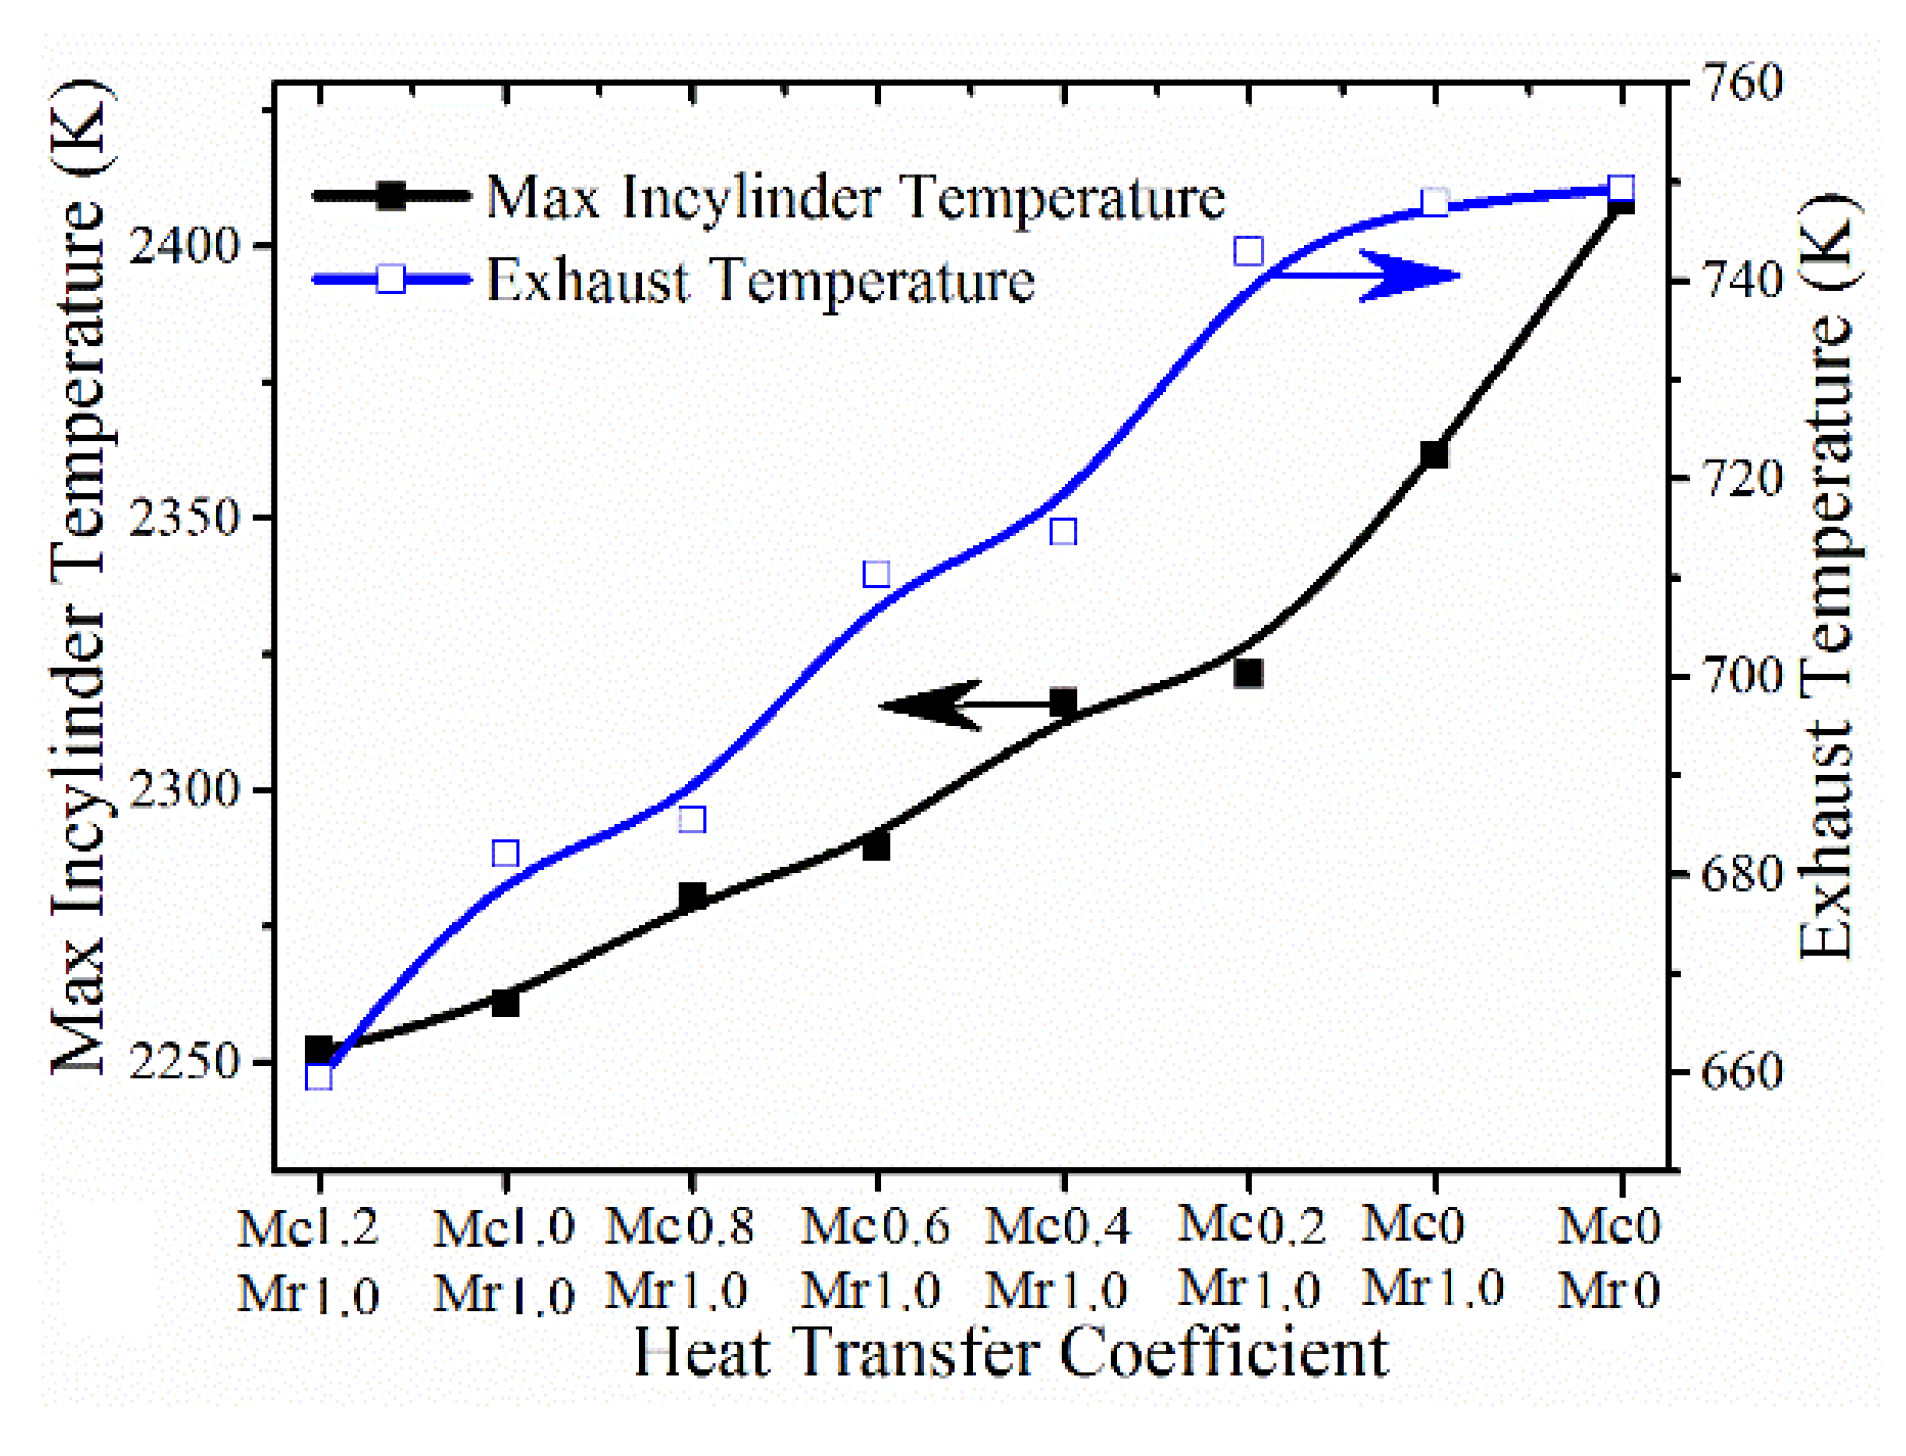
Figure 5.
Distribution of fuel energy under different heat transfer coefficients as a function of compression ratio. (a) Indicated efficiency; (b) heat transfer; (c) exhaust energy.
Figure 5.
Distribution of fuel energy under different heat transfer coefficients as a function of compression ratio. (a) Indicated efficiency; (b) heat transfer; (c) exhaust energy.

Figure 6.
Energy distribution as a function of compression ratio for lean combustion. (a) Indicated efficiency; (b) heat transfer; (c) exhaust energy.
Figure 6.
Energy distribution as a function of compression ratio for lean combustion. (a) Indicated efficiency; (b) heat transfer; (c) exhaust energy.

Figure 7.
The influence of equivalence ratio on maximum in-cylinder pressure and temperature.
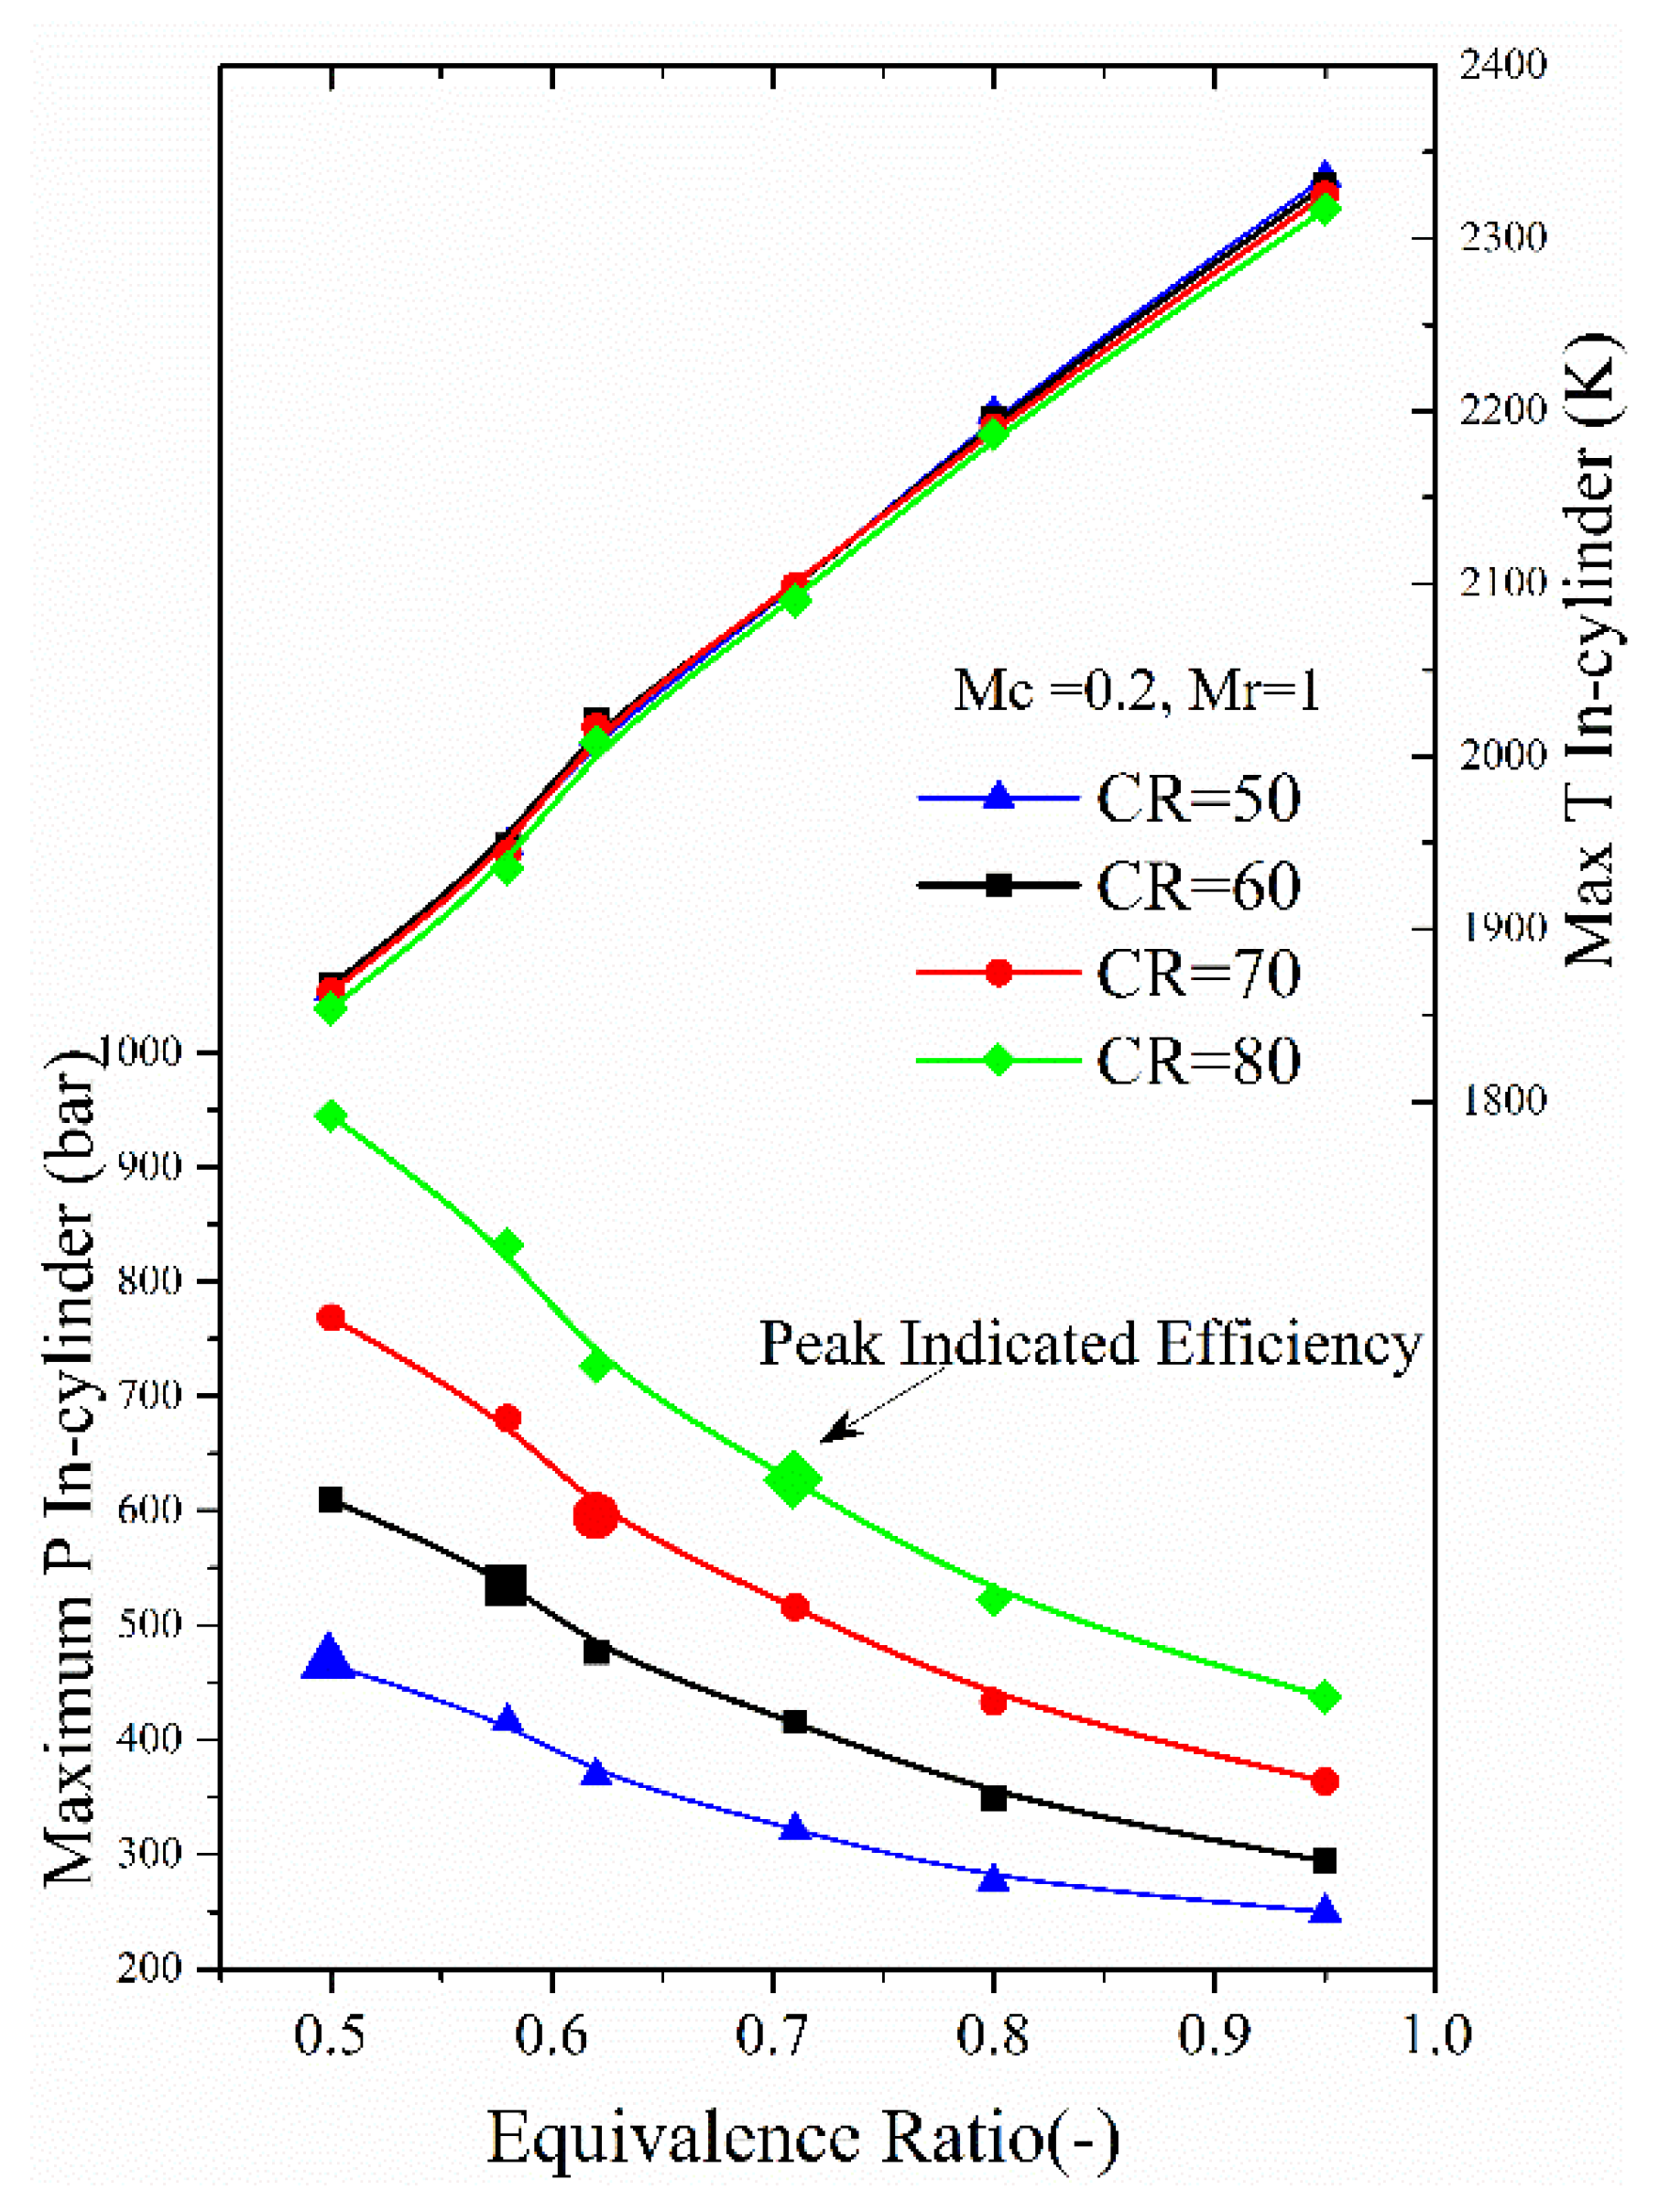
Figure 8.
Indicated efficiency and exhaust energy for different argon percentage with the change of compression ratio. (a) Indicated efficiency at adiabatic condition; (b) indicated efficiency at low heat transfer condition; (c) exhaust energy at the adiabatic condition; (d) exhaust energy at low heat transfer condition.

Figure 9.
Maximum in-cylinder pressure and temperature for different argon percentage with the change of compression ratio. (a) Pressure; (b) temperature.
Figure 9.
Maximum in-cylinder pressure and temperature for different argon percentage with the change of compression ratio. (a) Pressure; (b) temperature.

Figure 10.
Energy distribution as a function of compression ratio for intake N2 replace by CO2 at reduced heat transfer coefficient (Mc = 0.2, Mr = 1). (a) Indicated efficiency; (b) heat transfer; (c) exhaust energy.
Figure 10.
Energy distribution as a function of compression ratio for intake N2 replace by CO2 at reduced heat transfer coefficient (Mc = 0.2, Mr = 1). (a) Indicated efficiency; (b) heat transfer; (c) exhaust energy.
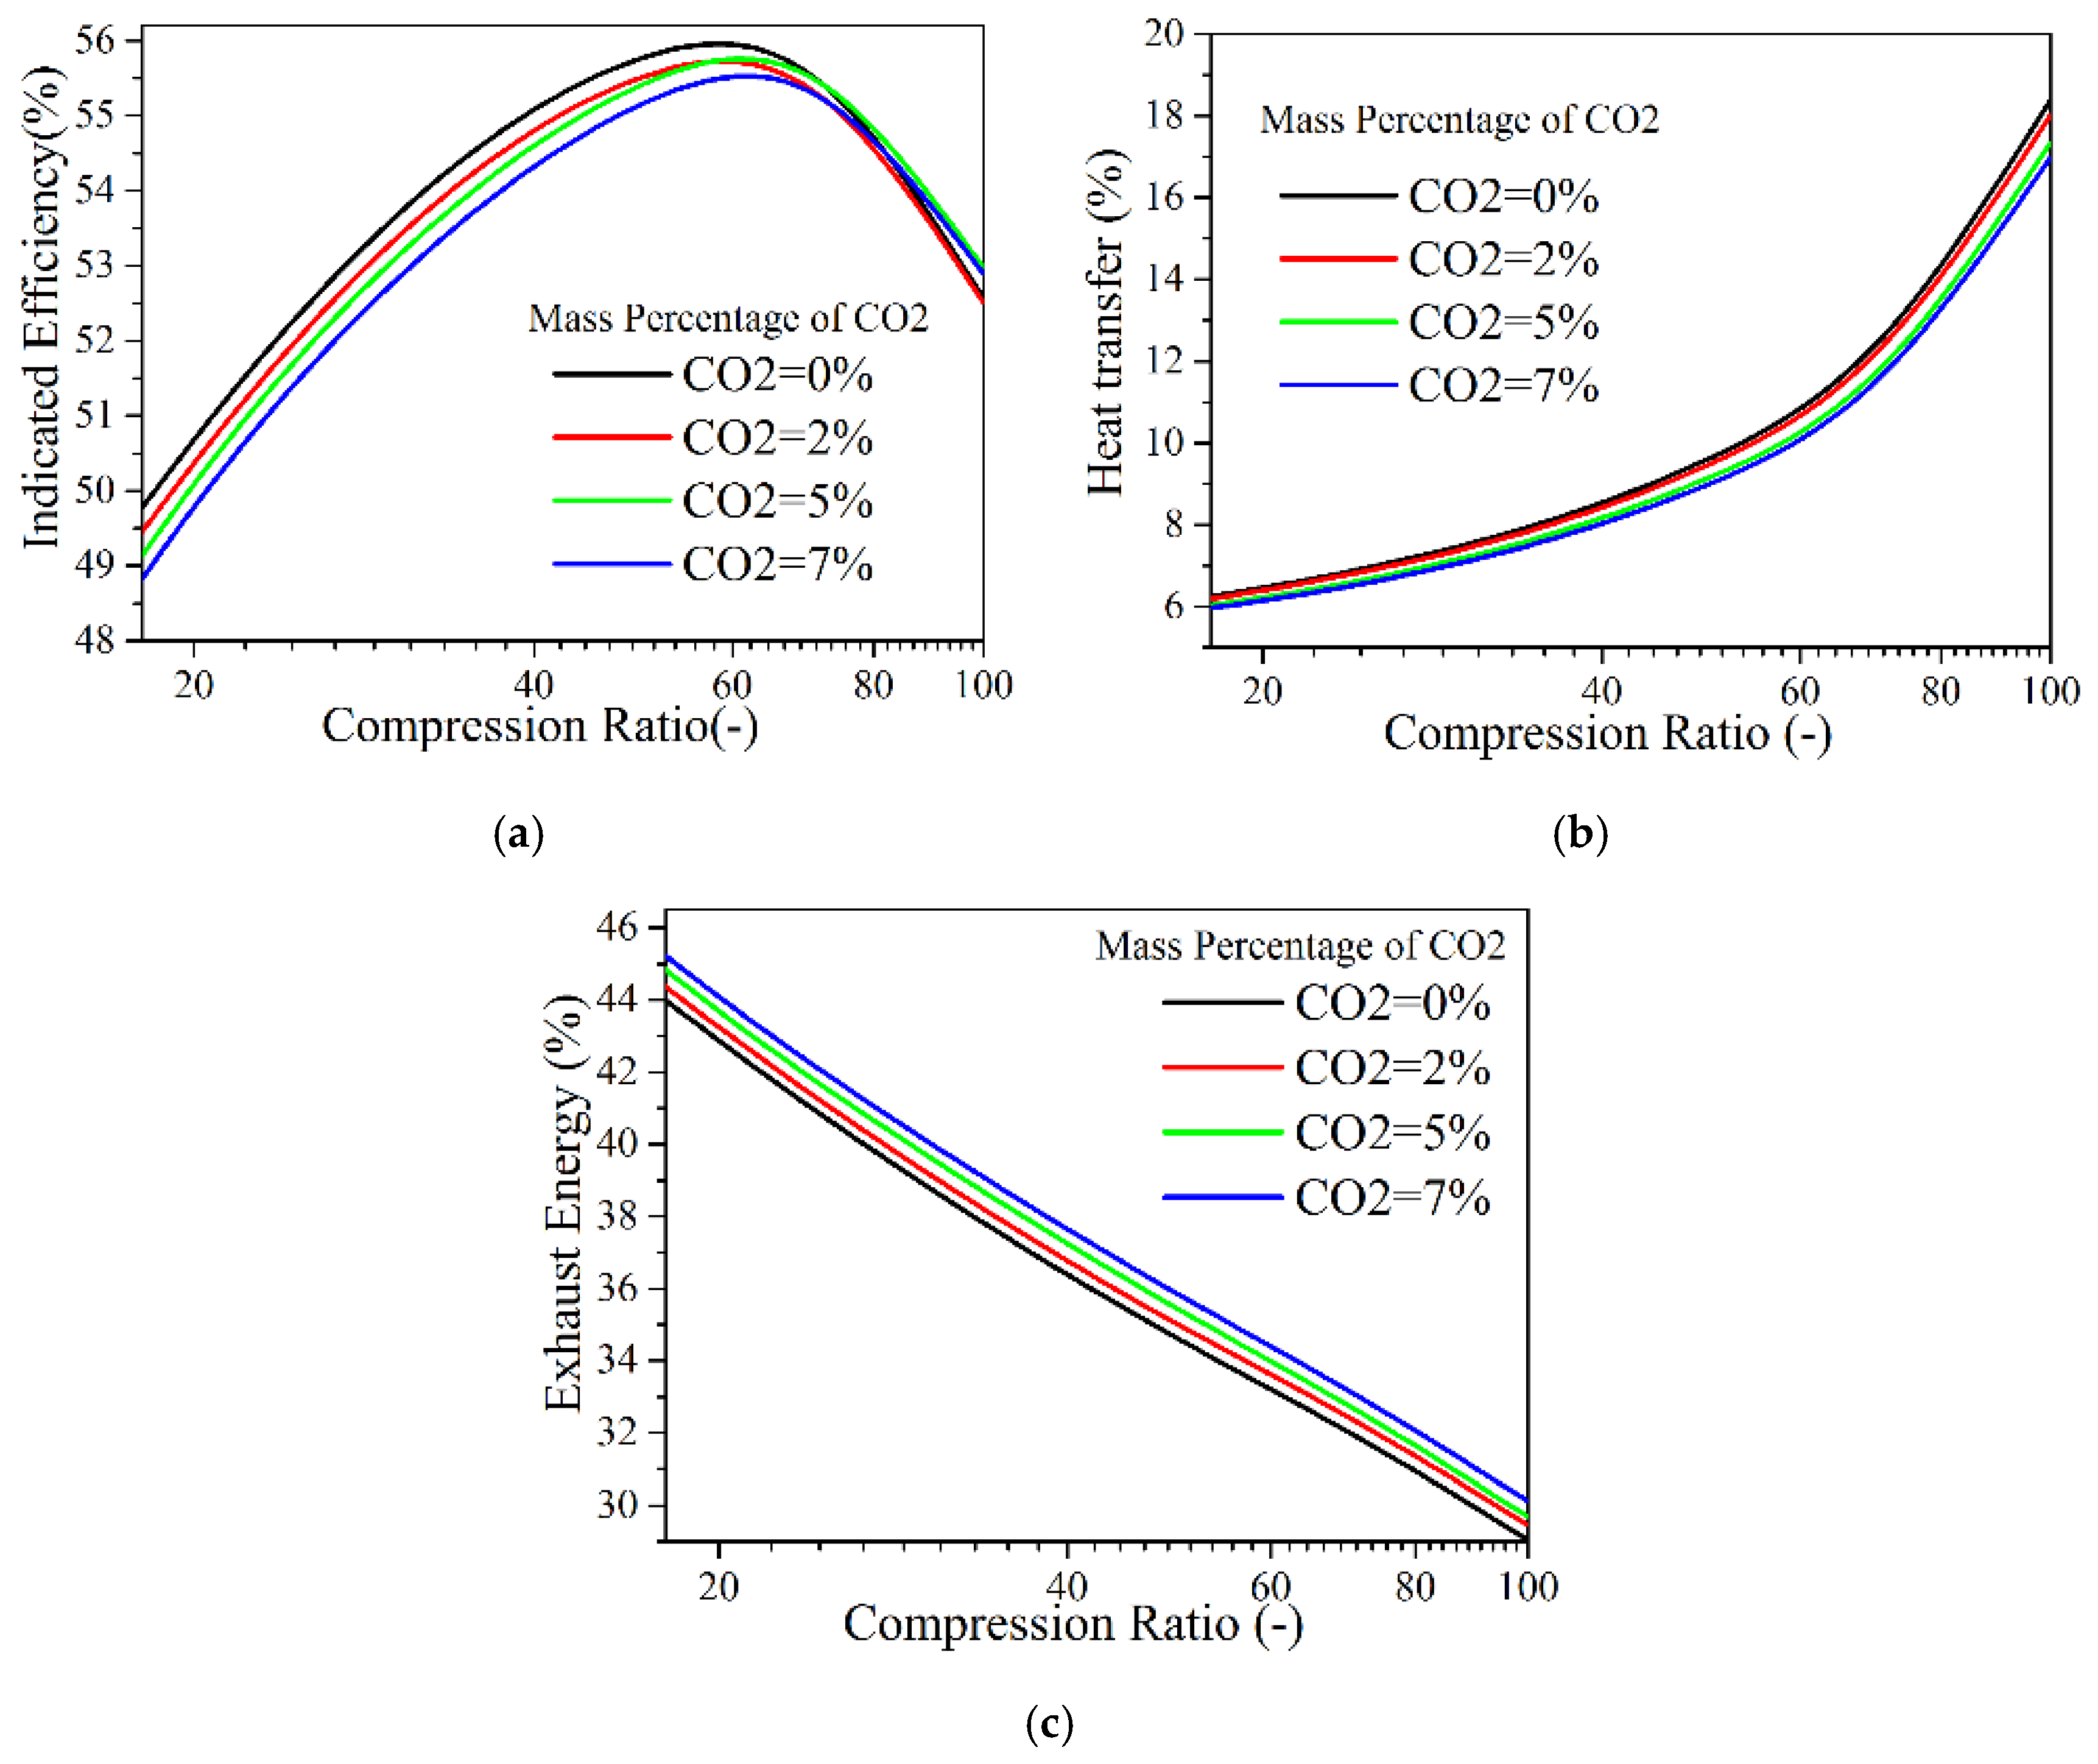
Figure 11.
The effect of intake N2 replace by CO2 on peak in-cylinder pressure and temperature at reduced heat transfer coefficient (Mc = 0.2, Mr = 1). (a) Pressure; (b) temperature.
Figure 11.
The effect of intake N2 replace by CO2 on peak in-cylinder pressure and temperature at reduced heat transfer coefficient (Mc = 0.2, Mr = 1). (a) Pressure; (b) temperature.

Figure 12.
Energy distribution as a function of compression ratio for different fuels at a low heat-transfer coefficient. (a) Indicated efficiency; (b) exhaust energy.
Figure 12.
Energy distribution as a function of compression ratio for different fuels at a low heat-transfer coefficient. (a) Indicated efficiency; (b) exhaust energy.
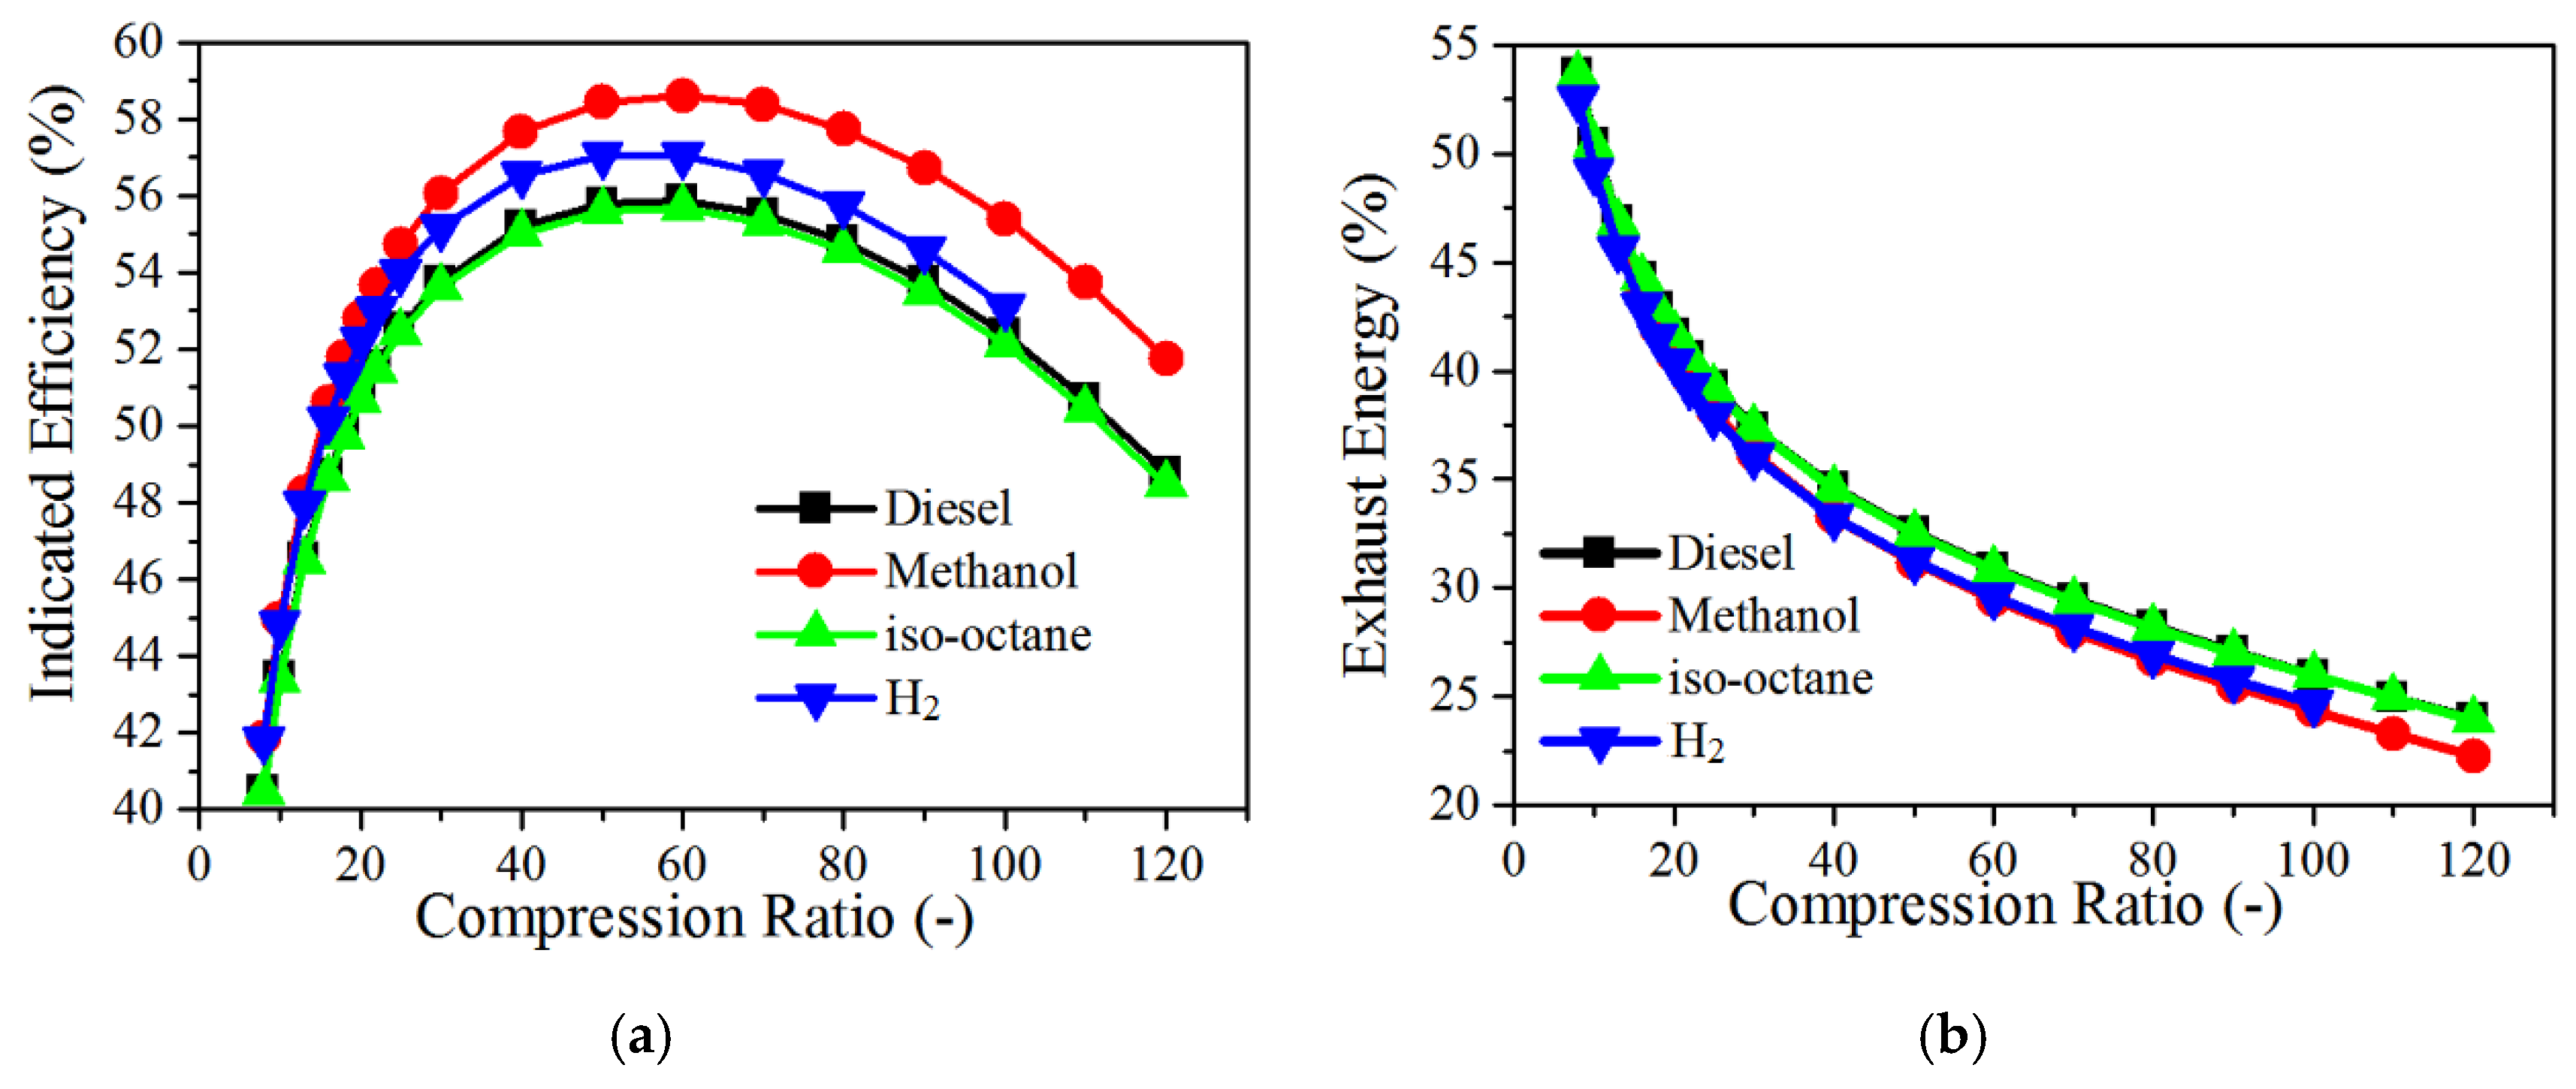
Figure 13.
Maximum in-cylinder pressure and temperature for different fuels at a low heat-transfer coefficient. (a) Pressure; (b) temperature.
Figure 13.
Maximum in-cylinder pressure and temperature for different fuels at a low heat-transfer coefficient. (a) Pressure; (b) temperature.

Figure 14.
Effects of CA50 and combustion duration on energy distribution. (a) Indicated efficiency; (b) heat transfer; (c) exhaust energy.
Figure 14.
Effects of CA50 and combustion duration on energy distribution. (a) Indicated efficiency; (b) heat transfer; (c) exhaust energy.
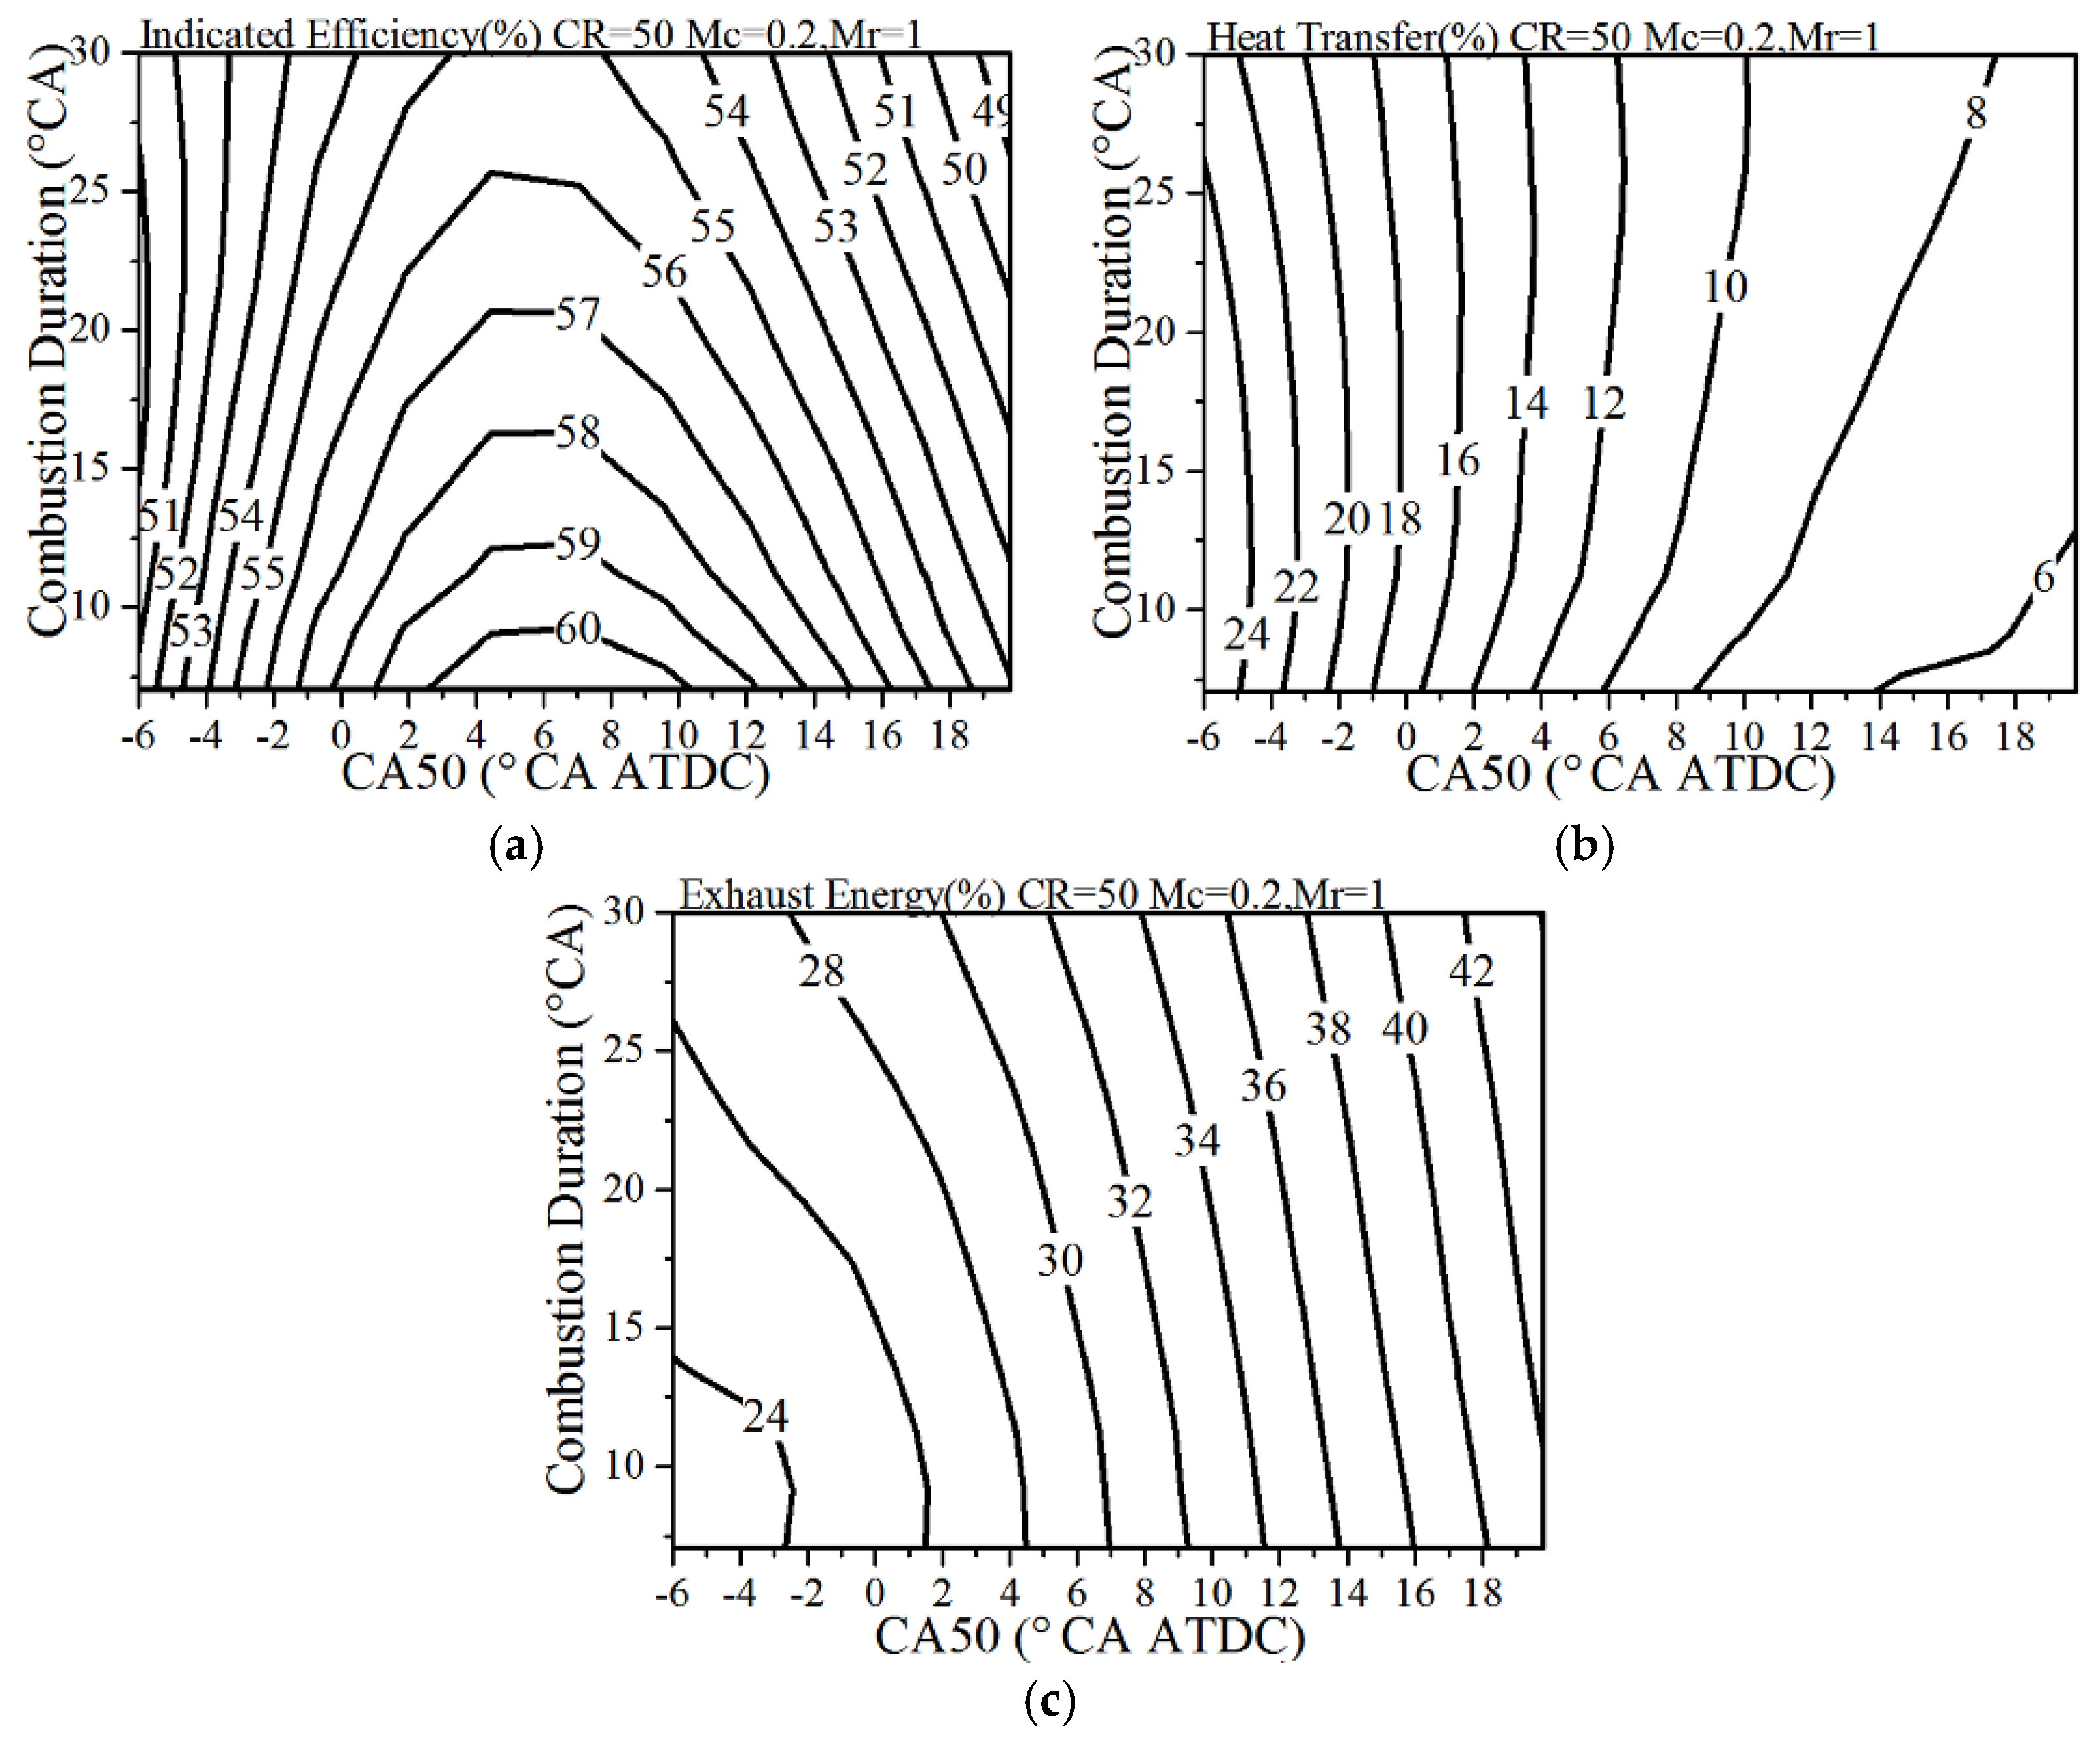
Figure 15.
Effects of CA50 and combustion duration on maximum in-cylinder pressure and temperature. (a) Pressure; (b) temperature.
Figure 15.
Effects of CA50 and combustion duration on maximum in-cylinder pressure and temperature. (a) Pressure; (b) temperature.
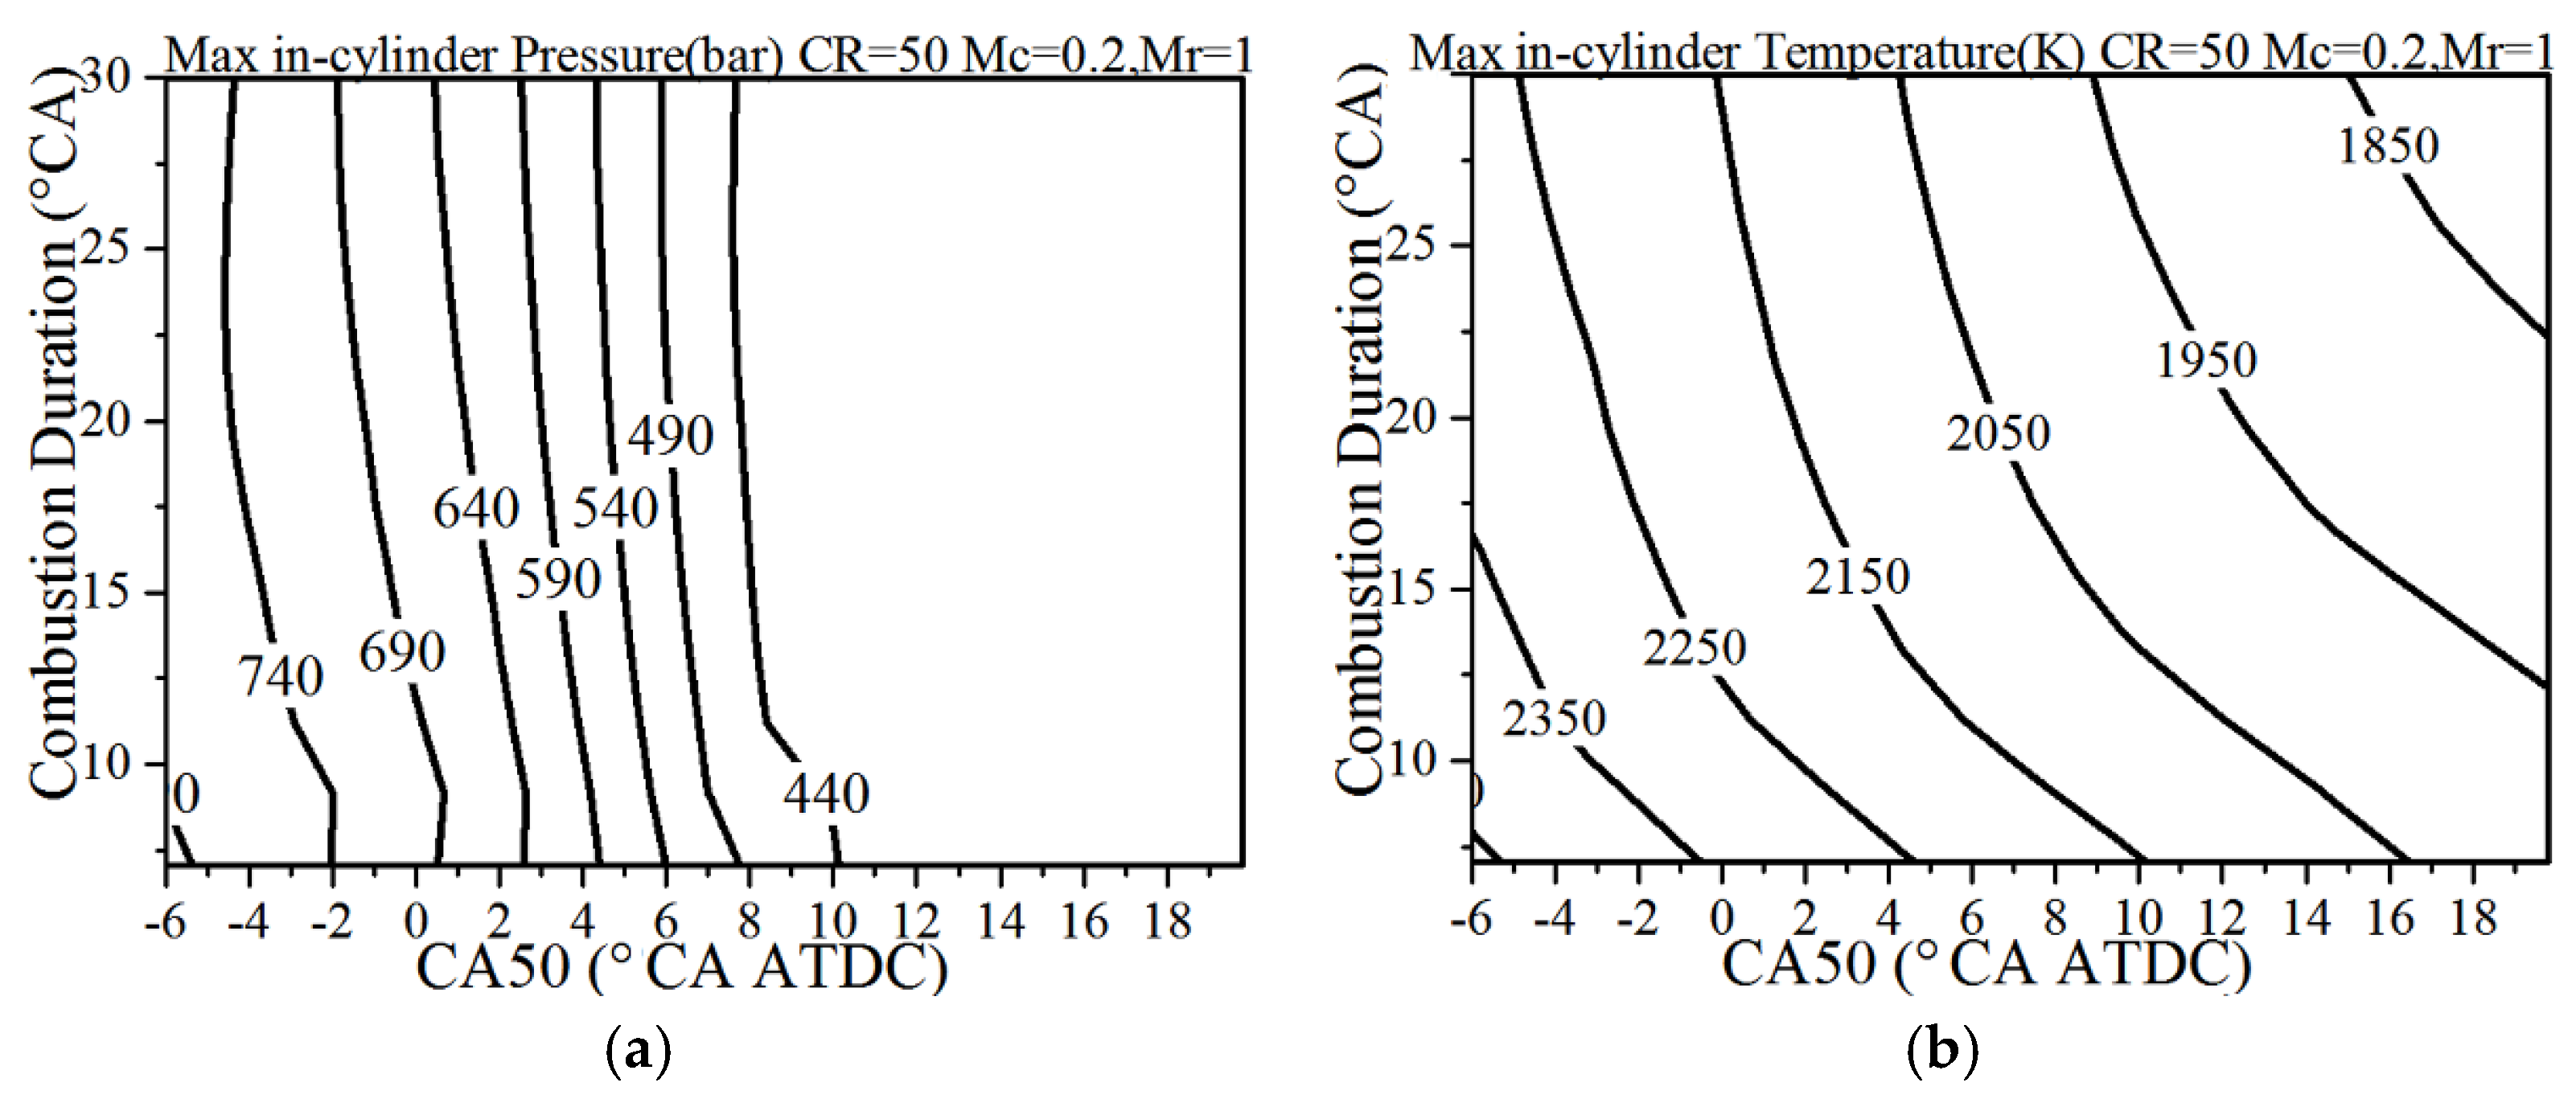
Figure 16.
Energy distribution as function of single-cylinder displacement and compression ratio with convection multiplier Mc = 0.2. (a) Indicated efficiency; (b) heat transfer; (c) exhaust energy.
Figure 16.
Energy distribution as function of single-cylinder displacement and compression ratio with convection multiplier Mc = 0.2. (a) Indicated efficiency; (b) heat transfer; (c) exhaust energy.

Figure 17.
Energy distribution as function of single-cylinder displacement and compression ratio with convection multiplier Mc = 1.2. (a) Indicated efficiency; (b) heat transfer; (c) exhaust energy.
Figure 17.
Energy distribution as function of single-cylinder displacement and compression ratio with convection multiplier Mc = 1.2. (a) Indicated efficiency; (b) heat transfer; (c) exhaust energy.

Table 1.
Engine specifications.
| Parameters | Value |
|---|---|
| Engine Type | Single cylinder 4-stroke, turbocharged, water coolant |
| Displacement | 1.08 L |
| Bore × stroke | 105 × 125 mm |
| Connecting road length | 210 mm |
| Number of valve | 4 |
| Original compression ratio | 16:1 |
| Wrist-pin-to-crank offset | 0 mm |
| TDC (Top Dead Center) clearance height | 1.2 mm |
| Fuel injection system | Common rail |
Table 2.
Comparison of selected fuels properties and corresponding mass flow rate of fuels.
| Fuel Species | Lower Heating Value (kJ/kg) | Latent Heat of Vaporization (kJ/kg) | Stoichiometric Air/Fuel Ratio | Mass Flow Rate of Fuel (mg/cycle) |
|---|---|---|---|---|
| Diesel | 42,800 | 301 | 14.3 | 80 |
| Methanol | 21,110 | 1109 | 6.47 | 162.2 |
| Isooctane | 44,344 | 510 | 15.2 | 78 |
| Hydrogen | 119,940 | - | 34.3 | 23.94 |
© 2018 by the authors. Licensee MDPI, Basel, Switzerland. This article is an open access article distributed under the terms and conditions of the Creative Commons Attribution (CC BY) license (http://creativecommons.org/licenses/by/4.0/).
Share and Cite
MDPI and ACS Style
Liu, H.; Ma, J.; Tong, L.; Ma, G.; Zheng, Z.; Yao, M. Investigation on the Potential of High Efficiency for Internal Combustion Engines. Energies 2018, 11, 513. https://doi.org/10.3390/en11030513
AMA Style
Liu H, Ma J, Tong L, Ma G, Zheng Z, Yao M. Investigation on the Potential of High Efficiency for Internal Combustion Engines. Energies. 2018; 11(3):513. https://doi.org/10.3390/en11030513
Chicago/Turabian StyleLiu, Haifeng, Junsheng Ma, Laihui Tong, Guixiang Ma, Zunqing Zheng, and Mingfa Yao. 2018. "Investigation on the Potential of High Efficiency for Internal Combustion Engines" Energies 11, no. 3: 513. https://doi.org/10.3390/en11030513
Note that from the first issue of 2016, this journal uses article numbers instead of page numbers. See further details here.