Experimental and Numerical Vibrational Analysis of a Horizontal-Axis Micro-Wind Turbine
by
 and
and
Francesco Castellani
*, 
Davide Astolfi
, 
Matteo Becchetti
,
Francesco Berno
,
Filippo Cianetti
and
Alessandro Cetrini
Department of Engineering, University of Perugia, Via G. Duranti 93, 06125 Perugia, Italy
*
Author to whom correspondence should be addressed.
Energies 2018, 11(2), 456; https://doi.org/10.3390/en11020456
Submission received: 18 December 2017
/
Revised: 2 February 2018
/
Accepted: 19 February 2018
/
Published: 22 February 2018
(This article belongs to the Special Issue Wind Turbine Loads and Wind Plant Performance)
Abstract
:Micro-wind turbines are energy conversion technologies strongly affected by fatigue, as a result of their size and the variability of loads, induced by the unsteady wind conditions, and modulated by a very high rotational speed. This work is devoted to the experimental and numerical characterization of the aeroelastic behavior of a test-case horizontal-axis wind turbine (HAWT) with a 2 m rotor diameter and a maximum power production of 3 kW. The experimental studies have been conducted at the wind tunnel of the University of Perugia and consisted of accelerometer measurements at the tower and the tail fin. The numerical setup was the Fatigue, Aerodynamics, Structures, and Turbulence (FAST) code for aeroelastic simulations, which was fed as input with the same wind conditions employed in the wind tunnel tests. The experimental and numerical analyses were coupled with the perspective of establishing a reciprocal feedback, and this has been accomplished. On one hand, the numerical model is important for interpreting the measured spectrum of tower oscillations and, for example, inspires the detection of a mass unbalance at the blades. On the other hand, the measurements inspire the question of how to interpret the interaction between the blades and the tower. The experimental spectrum of tail fin vibrations indicates that secondary elements, in terms of weight, can also transmit to the tower, giving meaningful contributions to the vibration spectra. Therefore, an integrated numerical and experimental approach is not only valuable but is also unavoidable, to fully characterize the dynamics of small wind-energy conversion systems.
1. Introduction
Micro-wind turbine technology stands at the crossroad of diverging demands. Small wind turbines should be sufficiently simple, in order to be used by people without technical expertise [1], and therefore their control system should be smart. Their design [2,3,4] and control [5,6] should be sufficiently advanced, in order to obtain a certain degree of efficiency in converting and exploiting wind kinetic energy, thus counteracting a certain prejudice that micro-wind turbine technology performs poorly [7]. Further challenges are dictated by the ambition of employing micro-wind turbines in urban environments: in this context, the demand of mitigating noise and vibration is evidently more pressing, and, at the same time, the environment is complex and turbulent [8,9,10,11,12,13]. The strongly varying loads to which a micro-wind turbine can be subjected in an urban environment [14] can cause heavy stresses on all the components, with large noise [15,16,17,18] and vibrations and risks of damage and breakage of the device [19]. Further, the use of micro-wind turbines in urban environments, where the average wind intensity is commonly quite low and the turbulence structure might be complex, requires the optimization of the design of the blades [4] and of the performances near the start-up. In [20], for example, the effect of turbulence on an airfoil developed in a laboratory for a HAWT has been studied: the aerodynamic force characteristics of the HAWT airfoil are estimated in the case of different turbulence intensities generated by static turbulence grids. In light of these issues relating aerodynamics, vibration and noise, wind turbine operation and the comprehension and characterization of the dynamical behavior of small wind turbines is necessary for the perspective of the widespread diffusion of this kind of technology. Small wind turbines are somehow the mechanical devices that are mostly affected by strong fatigue due to the variability of loads that are modulated by very high rotational speeds. The vibration spectra depend on aerodynamic loads, structure elasticity and electromechanical coupling, and therefore aeroelasticity is the unavoidable point of view for fully comprehending this. For example, in [21], a methodology is developed for the aerostructural design of small wind turbine blades, including the consideration of the need of fast starting. In [22], aeroelastic simulations of a small 5 kW Aerogenesis wind turbine are compared against operational measurements and a simplified load equation: it arises that loads calculated from simplified load equations are overpredicted, while the occurrence of damage cycles per minute is underpredicted. In [23], a numerical optimization and design study is performed for a guyed mast structure intended for supporting a 3 kW small wind turbine. The method is based on genetic algorithms, coupled with aero–servo–elastic–numerical simulations and pre/post-processor scripts leading to the optimal solution. In [24], an aeroelastic model of a permanent-magnet direct-drive 10 kW wind turbine is presented and validated by comparing the power curves found through simulation with field test data. In [25], an aeroelastic method is developed for full-scale wind turbines, and the influences of aeroelasticity on both the aerodynamic and the structural performances are highlighted. For a review about recent developments in aeroelastic modeling for full-scale wind turbines, see [26].
The test case of the present work is a HAWT with a 2 m rotor diameter. The prototype has been adjusted at the University of Perugia for scientific purposes, and the design has been optimized through numerical modeling and wind tunnel testing in order to conjugate good efficiency, particularly for moderate wind intensity, and reliability [4]. The setup for this work was mainly three bladed, but the five-blade setup was also employed because, by changing the number of blades, it is possible to highlight phenomena related to the periodicity of the motion. In this work, the approach was experimental as well as numerical. The experimental studies were conducted at the R. Balli wind tunnel (www.windtunnel.unipg.it) at the University of Perugia and were based on vibration measurement, high-resolution rotor speed measurements and load control. Accelerometers were placed on the tower, the generator and the tail fin of the wind turbine. In virtue of the complex interplay of factors above depicted, it was difficult to interpret the measured vibration spectra. For this reason, a numerical simulation of the system was performed: the aeroelastic FAST code [27] has been used. The feedback between simulation and experiment was reciprocal: the simulation allowed us to interpret the measured vibration spectra; on the other hand, the measurements allowed us to understand and tune some subtle aspects of the simulation environment, for example, in the way one accounts for the interplay between the tower and the blades. The structure of the paper is therefore the following: Section 2 is devoted to a brief description of the facilities (HAWT, wind tunnel, ans aeroelastic code). In Section 3, the results are summarized. The conclusions and some further directions are indicated in Section 4.
2. The Facilities and the Methods
2.1. The Wind Turbine
The test-case HAWT wass the three-bladed version, at the disposal of the University of Perugia for scientific purposes, of a commercial HAWT designed at the University of Perugia for being employed in rural/urban applications. The rotor diameter is 2 m, and the maximum producible power is 3 kW. It has a fixed pitch with variable rotational speed, from 200 to 800 rpm. The blades are made of a glass-fiber-reinforced polymer, and the design has been optimized for structural and performance issues [4]. This supports the use of the wind turbine also in turbulent environments but, on the other hand, calls for the control of vibration and noise. The wind turbine has full electric load control, and the yawing is provided by the tail fin. For this study, it was controlled using a power curve extracted from previous wind tunnel experiments at steady state. The wind turbine is presented in Figure 1.
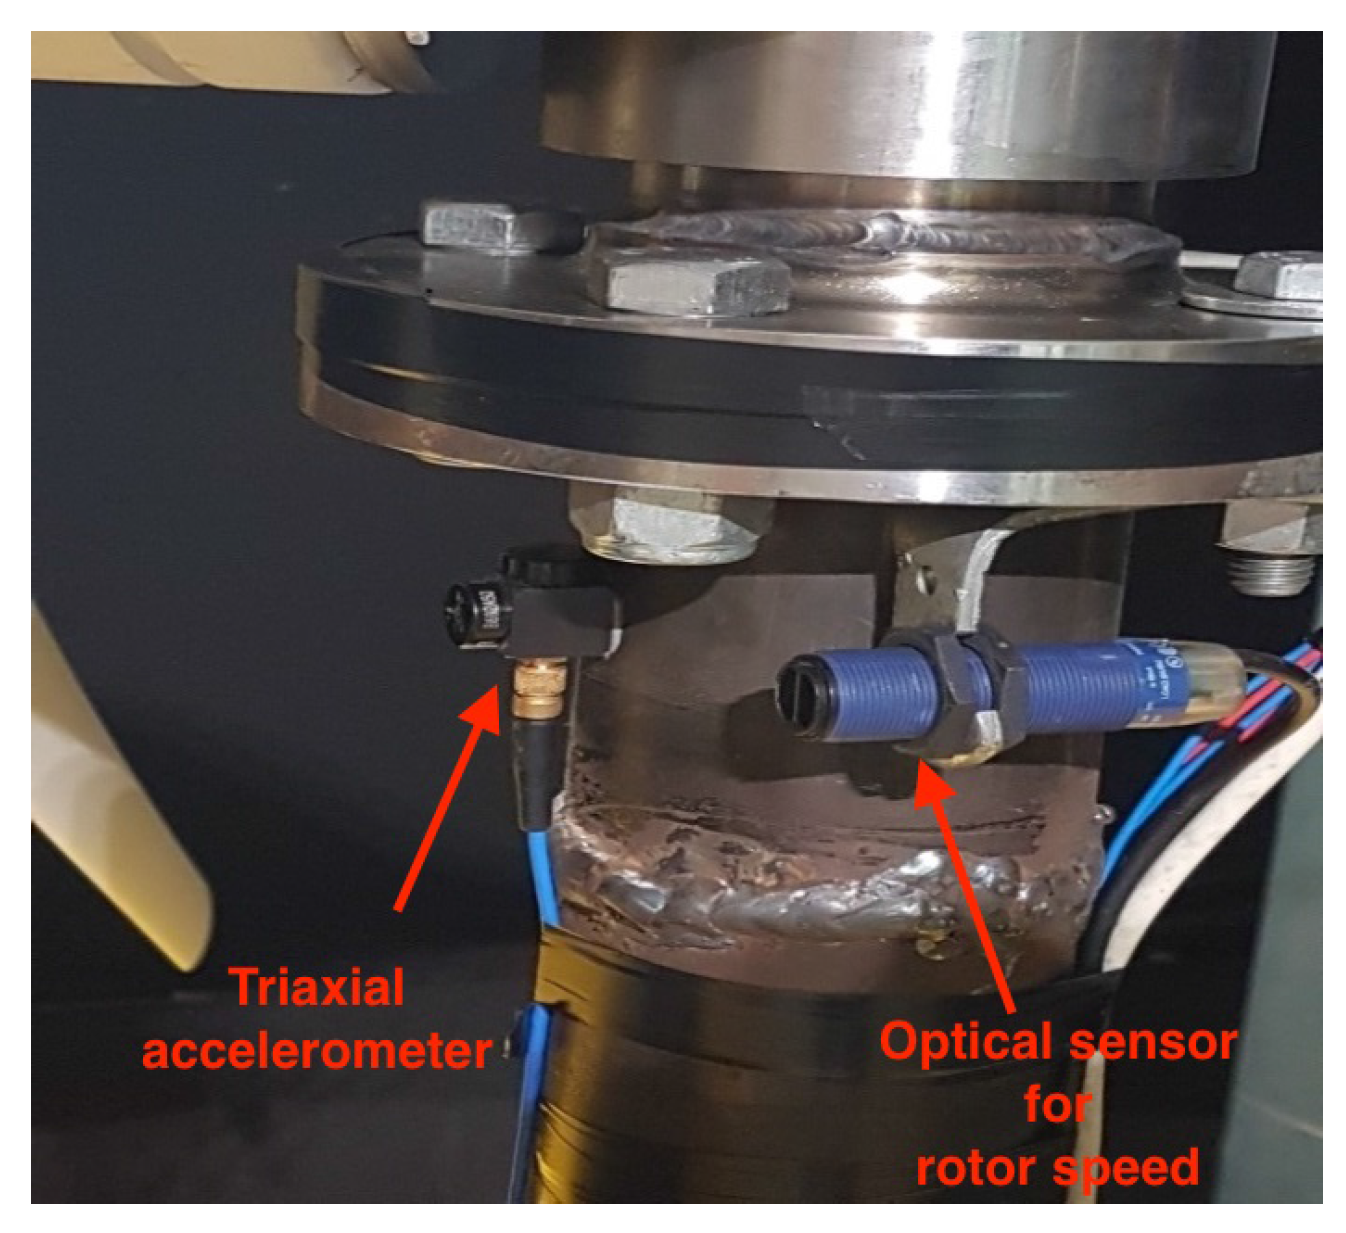
The wind turbine is instrumented with accelerometers on the tower, the generator and the tail fin. In Figure 2, the layout of the sensor arrangement is shown.
The wind turbine is subjected to the complex combination of elastic and aerodynamic effects. In fact, there is not only the interaction between the static pressure of air and the blades (it can be treated as a cantilever beam under a distributed load), but there are also dynamic effects, such as the vibrations induced by the turbulence or the base excitation transmitted by the tower to the blade root. When the blade vibrates, it changes its relative speed with respect to the wind (particularly in the flapwise direction): this produces a change of the angle of attack and thus produces a variable lift during the rotation. Unfortunately, in the experimental tests conducted for this work, it was not possible to investigate this, because of the lack of instrumentation to acquire the signal from the blades while they were rotating. As a further development of the study, it is planned to include this kind of measurement in the future experiments, in order to fully understand how this effect transmits through the structure and how the vibrational spectra can be fully interpreted. From this point of view, another limitation comes from the material used for the blades (glass-fiber-reinforced polymer), typically characterized by large deflection, which cannot be addressed in linear elasticity theory.
2.2. The Wind Tunnel
The experimental studies were conducted at the R. Balli wind tunnel at the University of Perugia. It used a closed-loop configuration (see Figure 3), driven by a 375 kW electric motor. The air was accelerated up to a maximum speed of 47 m/s. The inlet section of the open test chamber had 5 m2 of area, and the recovery section was 7 m2. Two Pitot tubes and a cup anemometer measured the wind speed blowing on the test section, and a control station in the testing room measured the real-time static air pressure, temperature and relative humidity. It was possible to generate wind time histories that were variable in time, because the wind tunnel is controlled through an inverter. This feature was crucial for the purposes of this work.
2.3. The FAST Code
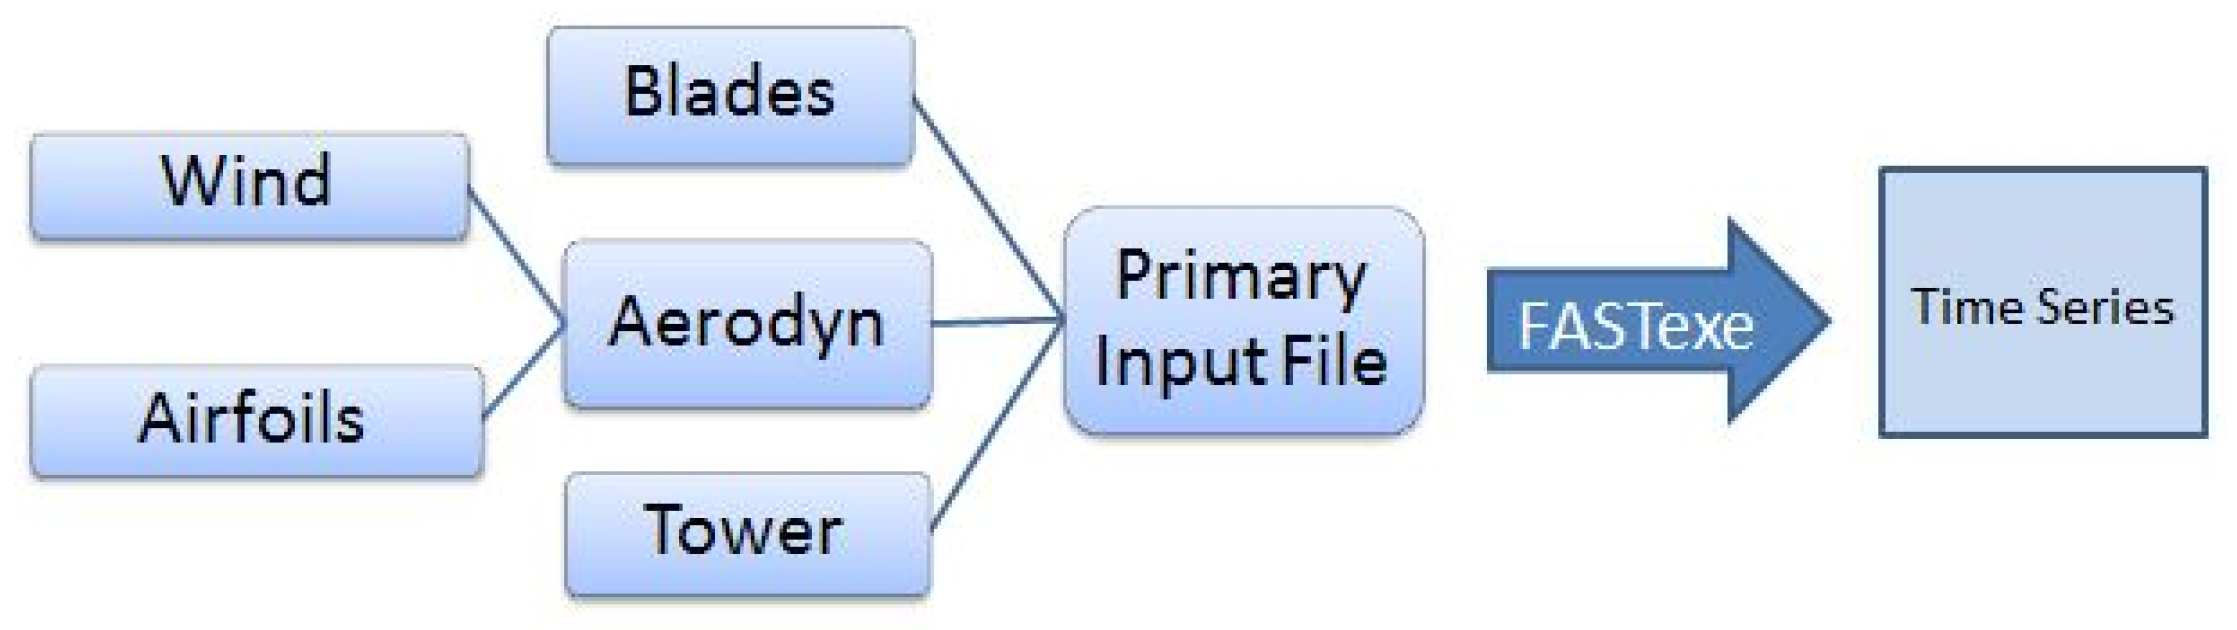
The FAST code has been developed at the National Renewable Energy Laboratory (NREL) of the U.S. government [27]. FAST combines multibody and modal approaches for the dynamical study of the equations of motion, defining at each time-step the state of the mechanical system. It uses, through a primary input file, all the information about the mechanical components of a wind turbine to simulate the dynamics of the structure, as the flowchart in Figure 4 shows. As part of the input data file, FAST needs the dimensions and the elastic parameters to simulate the wind turbine dynamics. Part of this work has been done using version 7 of FAST, and part has been done by upgrading to version 8: this latter version is capable of accounting for the interaction between the blades and the tower. The flowchart in Figure 4 refers to the v7 version of Fast.
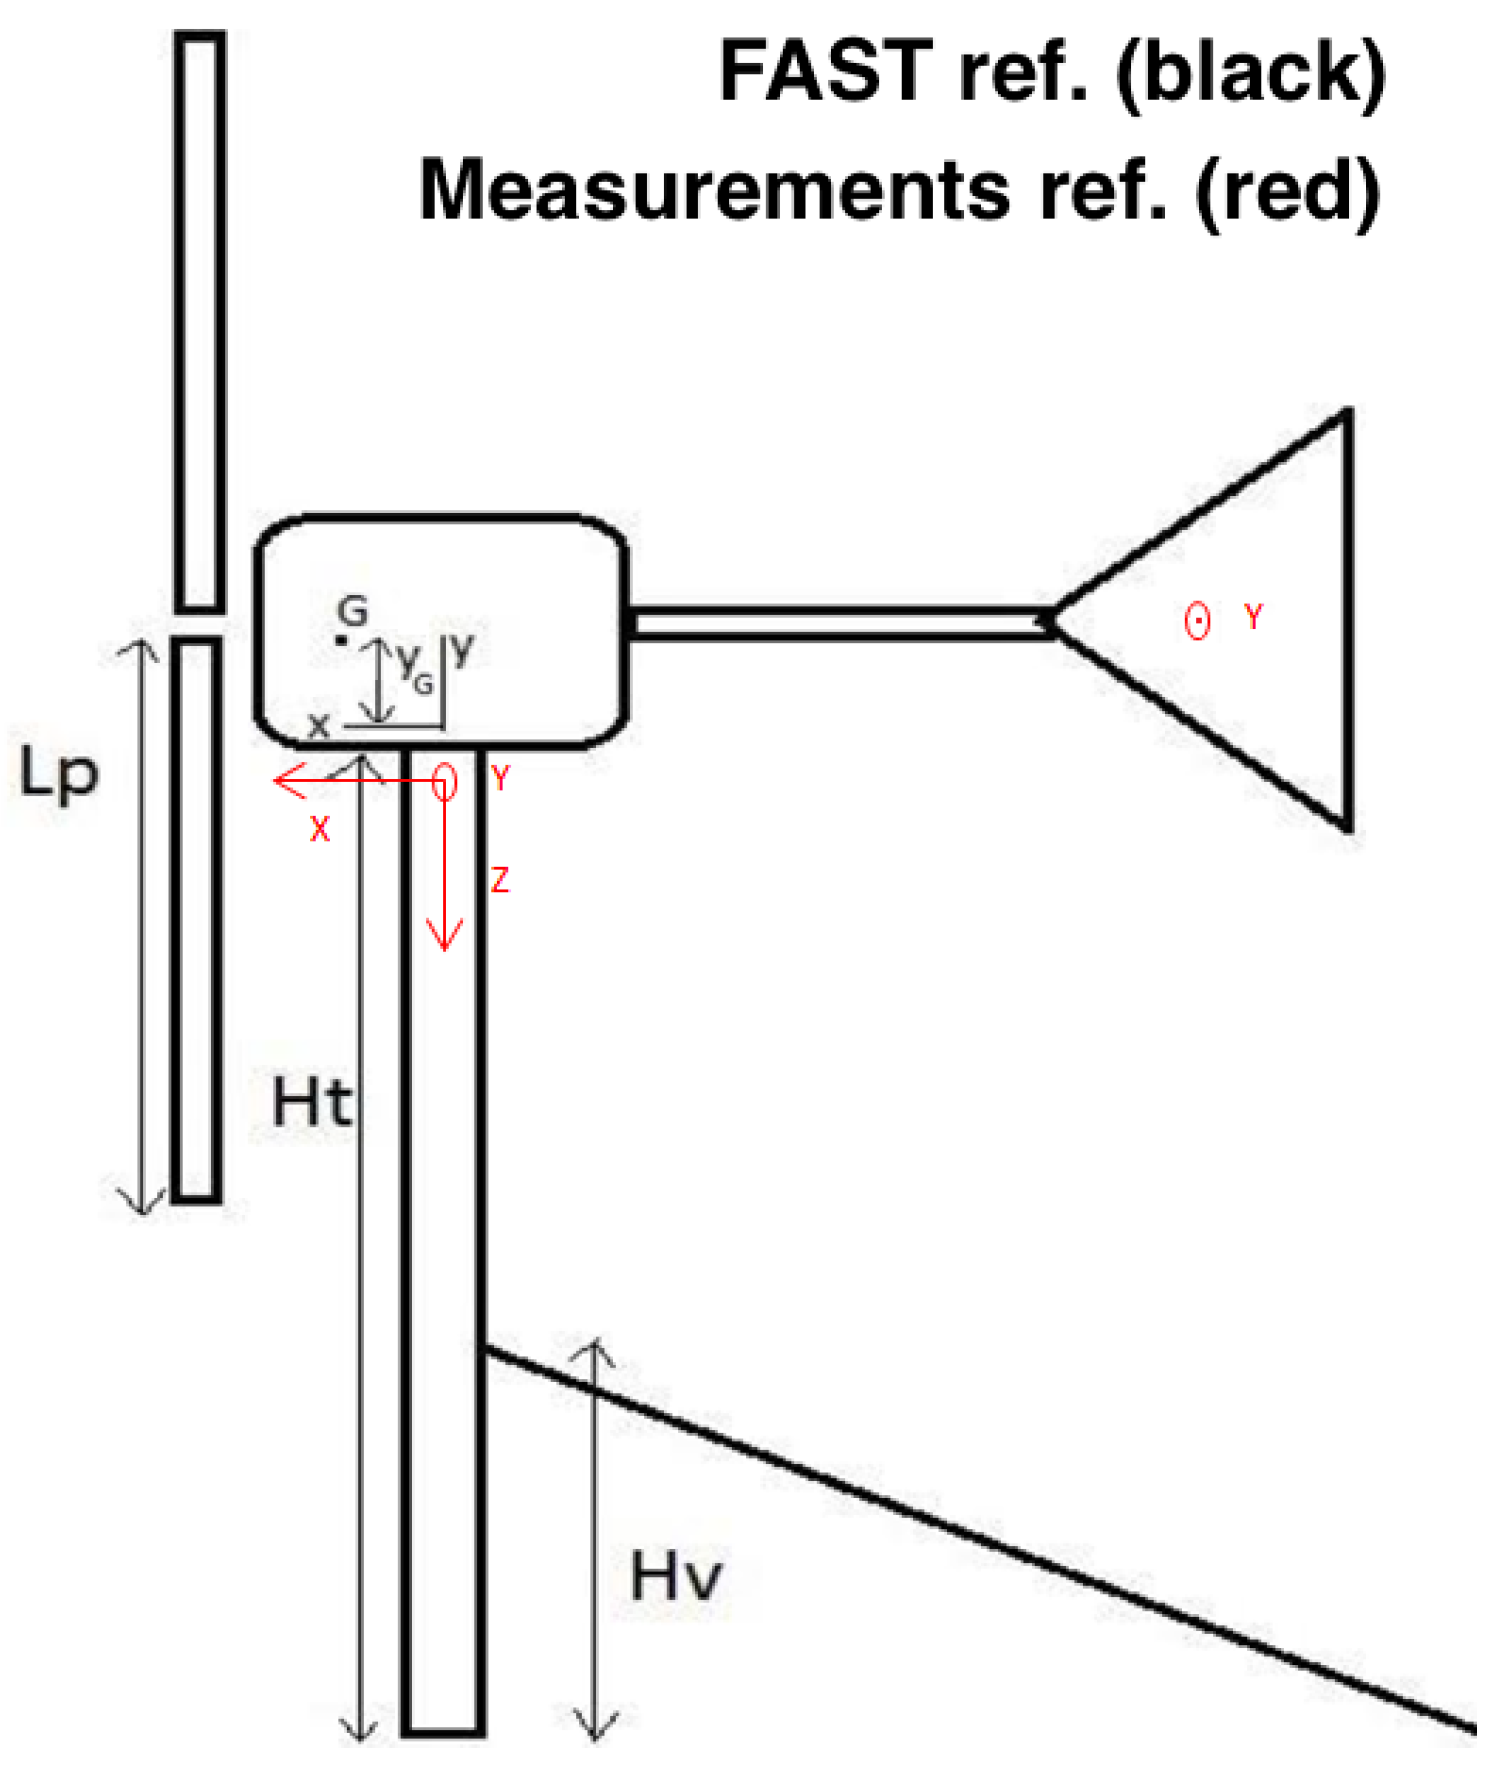
In Figure 5, the references for the FAST simulations are reported. Contextually, the reference system for the accelerometer measurements is reported in red: X is the flow direction, Y is the orthogonal direction in the horizontal plane, and Z is the vertical direction. Finally, the dimensions of the system in Figure 5 are reported in Table 1.
It is difficult to estimate the deflection of the blades for this kind of wind turbine, because of the wide range of working conditions to which they are submitted: essentially, the centrifugal force changes the stiffness of the blade. In Figure 6, an evaluation of the first resonant frequency as a function of the rotational speed, in both flapwise and edgewise directions, is reported.
The frequency has been calculated using the QBlade software, which has been used as pre-processor of FAST to estimate structural and aerodynamic properties of the blades. It arises that the results from the FAST simulations were not sensibly affected by the variation in the stiffness. This comes from the fact that FAST has been conceived for large wind turbine technology usually operating at a constant rotational speed. Instead, the simulations were very sensitive to the variation in the blade density, provoking a mass unbalance of the rotor.
2.4. The Methods
Two types of tests under unsteady wind conditions were considered: using a ramp and harmonically oscillating. The same time series could be fed as input to the FAST simulation environment. Most of the experimental tests were conducted using the ramp wind time series, because it explores monotonically all the rotational speeds and therefore provides a very clearly understandable framework: all the results reported in this work, except where otherwise explicitly declared, refer to a ramp time series increasing from 6 to 11 m/s with a 1 m/s increase over about 14 s. Some wind tunnel tests were also performed using an oscillatory wind time series: the wind intensity oscillated between 6.3 and 8.5 m/s, with a period of 14 s. This time series was selected because it is still a simple model, but it captures more realistically some features of the atmospheric turbulence. In fact, as is shown in the next section, the vibration scenario changes considerably from one case to the other. For both kinds of time series, as a result of the unsteady wind conditions, the signal post-processing cannot be based on time or frequency: a ciclostationary approach [28,29] and order analysis are needed.
Regarding the tail fin of the wind turbine, a purely experimental vibration analysis has been conducted because FAST cannot faithfully simulate its dynamics: it has been conceived for full-scale wind turbines, for which this phenomenon is usually not relevant.
The situation is more interesting regarding tower vibrations, because a comparison between simulation and measurements can be performed. The natural frequencies of the structure were measured using a hammer as the excitation, with the turbine stopped, and were used to compute the modal shapes needed as input for the FAST simulations. A subtle point regards the fact that FAST was originally developed for large wind turbines, for which the interplay between the blades and the tower can usually be disregarded. This is not the case for micro-wind turbines: the “blade-passing phenomenon” [30] arises. It is particularly relevant at high revolutions per minute, when the flexibility of the blade pushes the distance to the tower to the minimum. This effect is due to the passage of the blade near the tower, and it is present in both downwind turbines and upwind turbines: it is caused by the modified flow conditions at the tower that act as a dam with respect to the flow. In fact, this phenomenon is also known as a tower dam [31]. In the case of downwind turbines, the tower creates a real shadow area, and therefore the velocity of the fluid upstream from the turbine is consistently diminished when the blade passes near the tower. For these reasons, even if the considered turbine configuration is upwind, the numerical setup has to be carefully fine tuned regarding the damping ratio and tower shadow coefficient, in order to account for the blade passing interferences induced by the very small blade–tower gap and to reproduce in the numerical spectrum the frequency content of the multiples of the rotational speed.
3. Results
3.1. Tower Vibrations
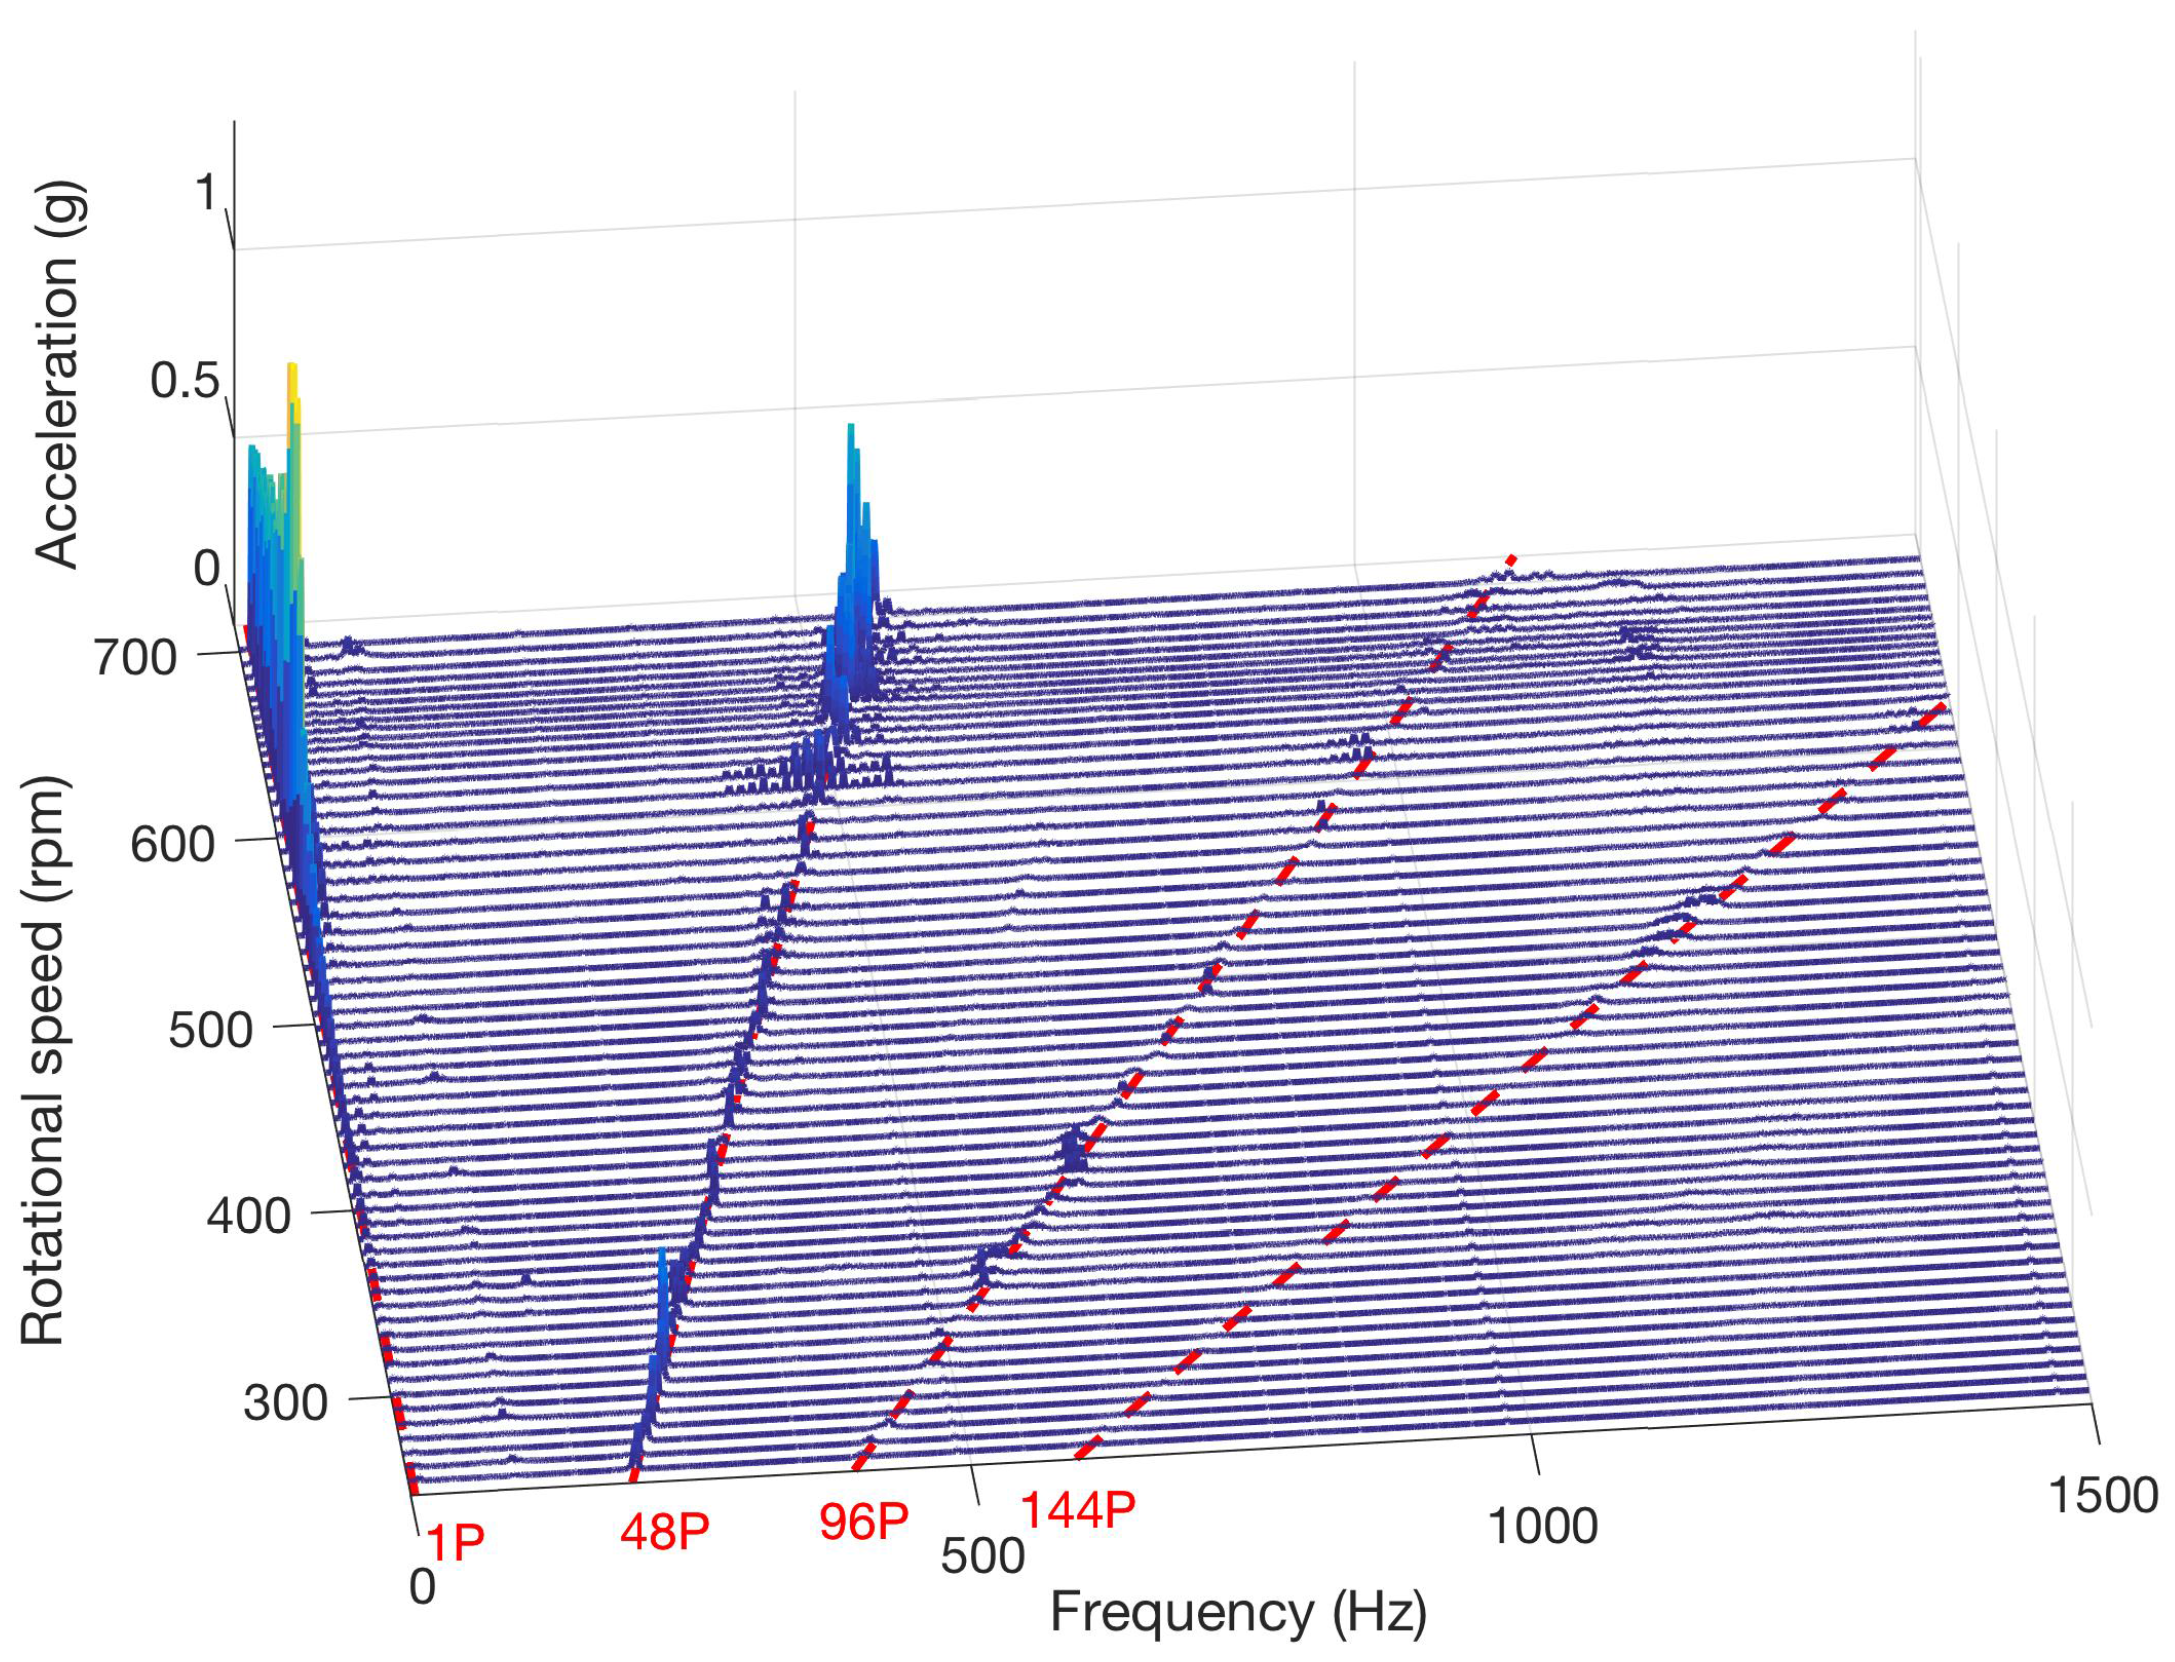
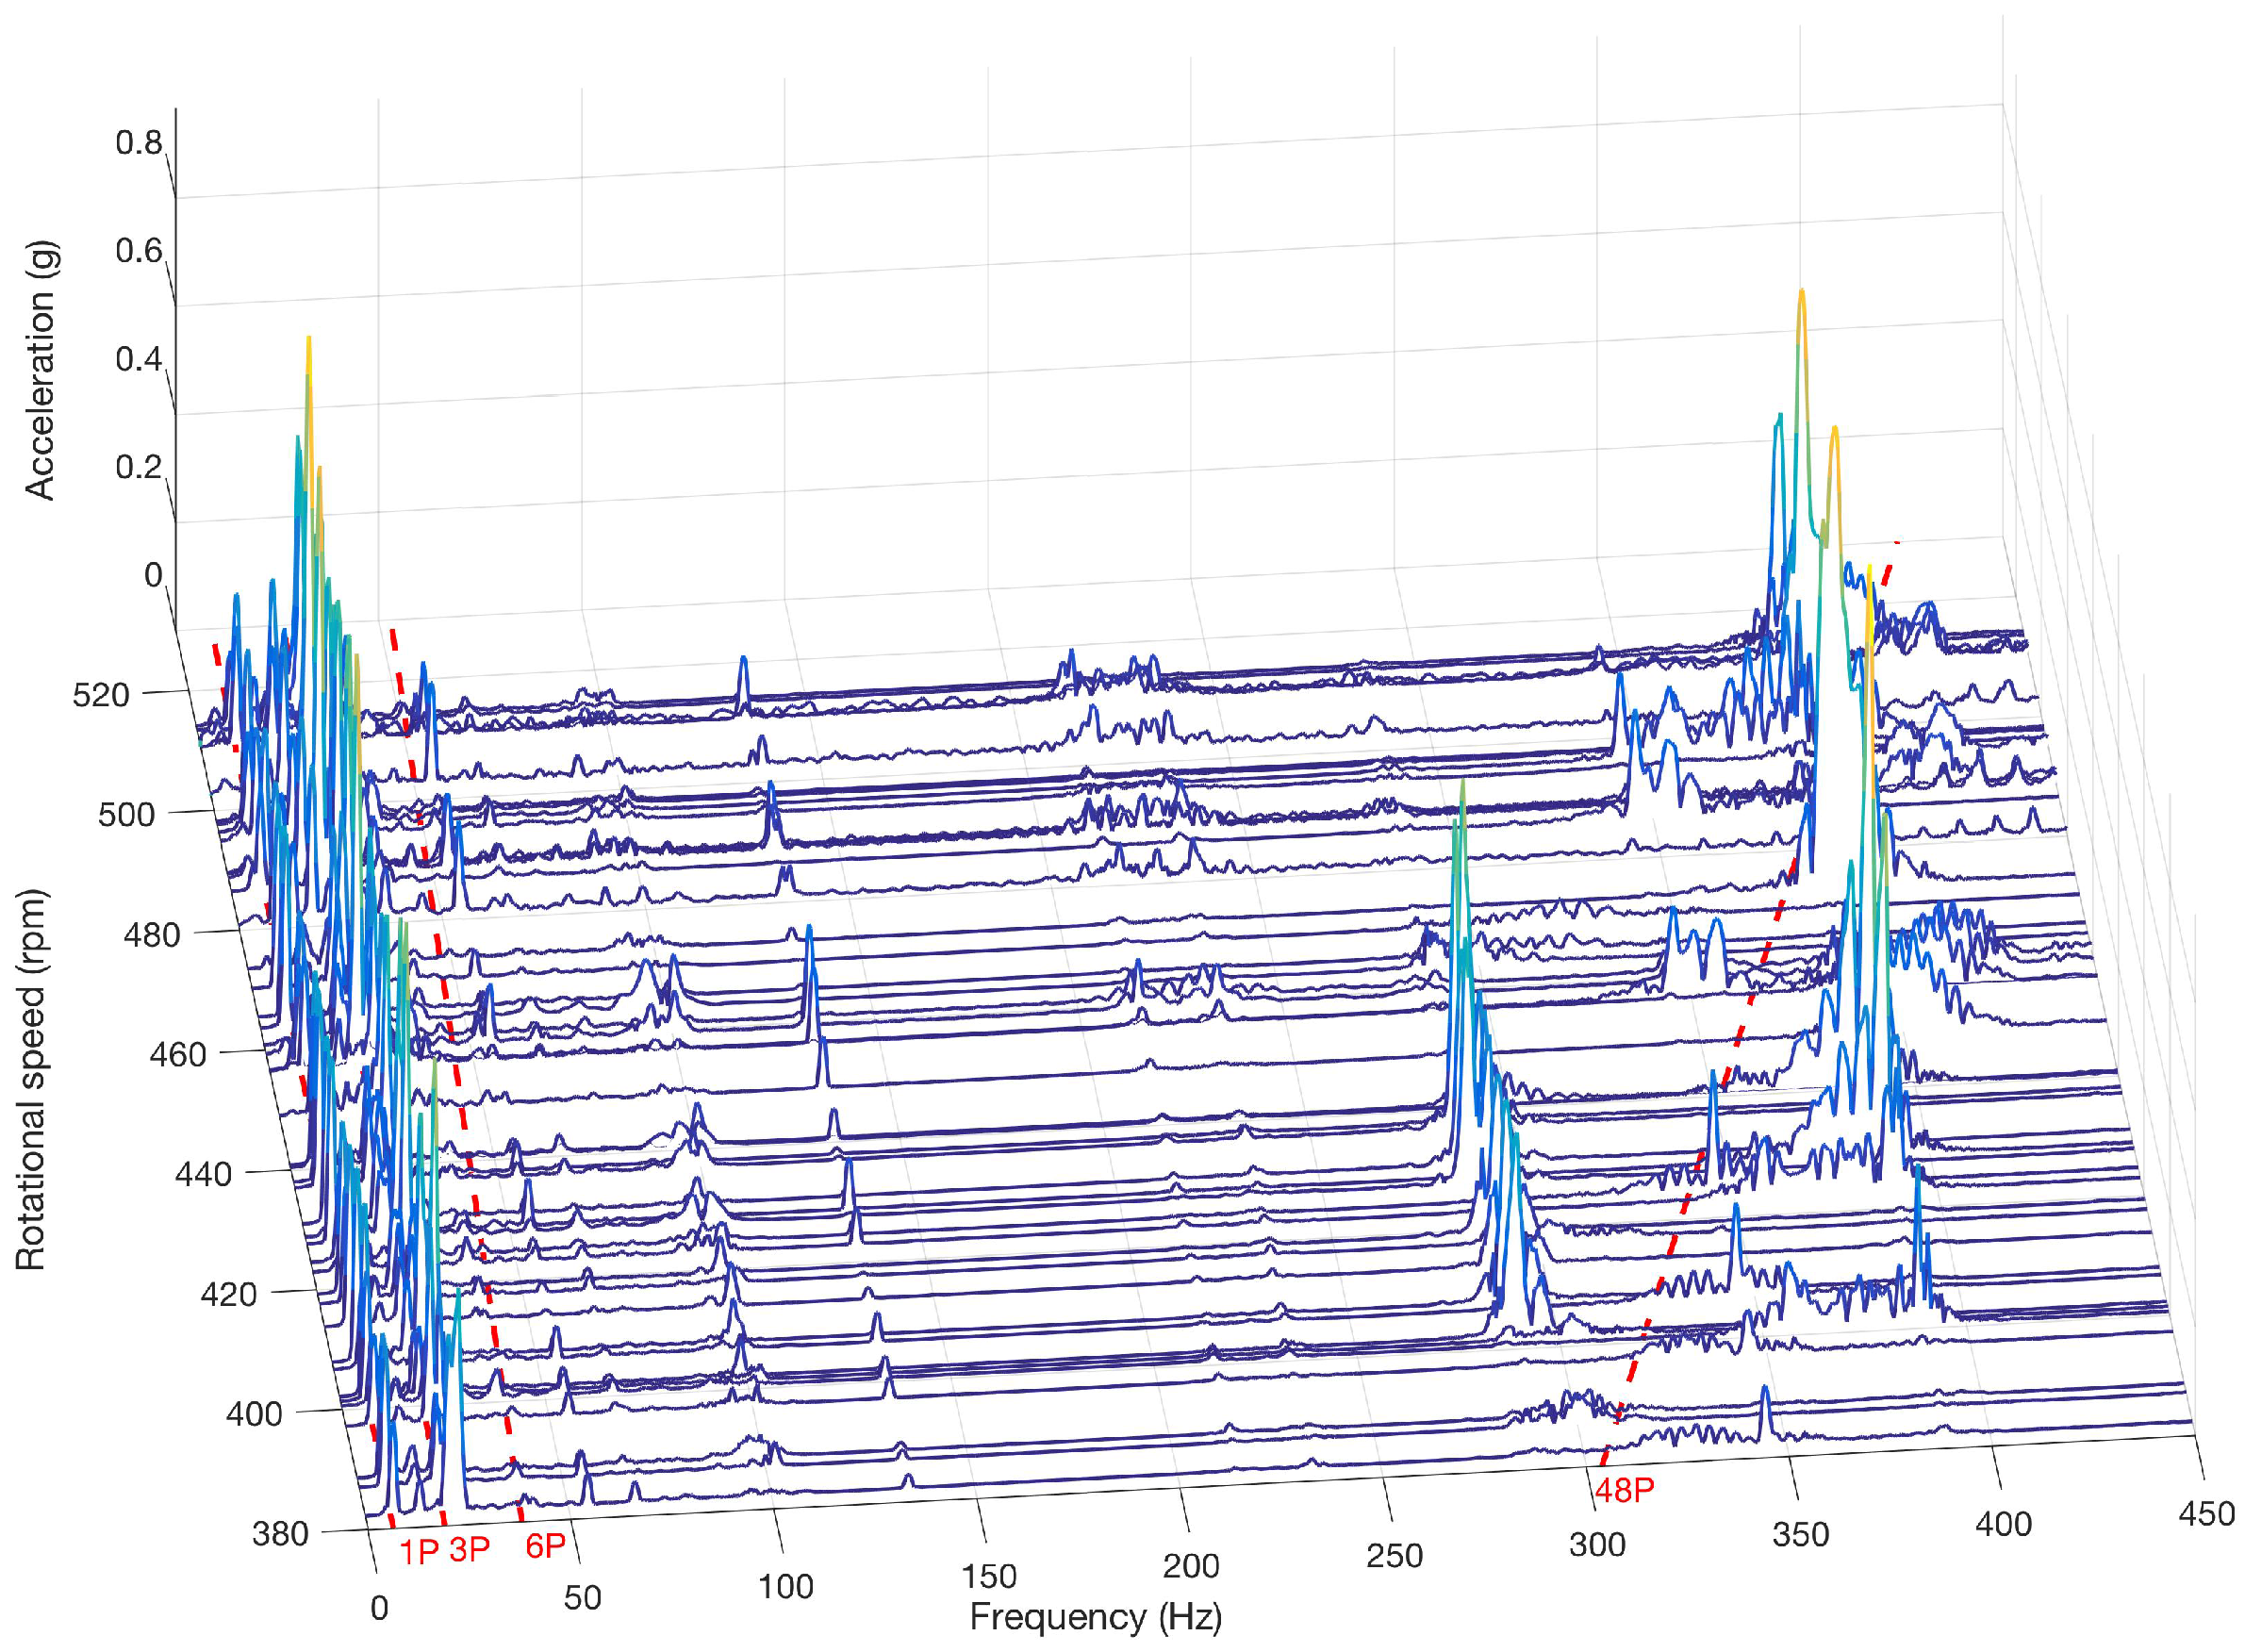
In Figure 7, the waterfall of the experimental Y direction oscillations of the tower is reported. In order to interpret it, it is necessary to recall what the main loads transmitted to the tower are and what their frequency content is. If the rotor is unbalanced, it has an uneven mass distribution: this can be modeled as the presence of a mass unbalance at a given distance e with respect to the center of the rotor. The mass gives rise to a moment (variable in time) with respect to the rotational axis and to a centrifugal force having components in the rotor plane and also resulting in bending and torque on the tower. These loads due to imbalance have a frequency component equal to the rotor rpm (1P). Regarding the aerodynamic loads, they can be grouped into static loads, cyclical loads and random loads. The first are due to constant wind conditions and cause constant structural deflections. Random loads are those induced by the turbulence and must be carefully inspected in order to prevent fatigue breaking. Cyclical loads are observable in the rotary (blade) reference system and in the fixed reference system of the tower. In the former reference system, they are harmonic multiples of the rotor angular velocity: 1P, 2P, 3P and so on. In the latter, because of the presence of three blades, they are multiples of 3 times the rotor angular velocity. The presence of the 1P frequency in Figure 7 can be interpreted as being due to the unbalance of the rotor, and, by comparing against numerical simulation later on, it shall be shown that this is indeed the case.
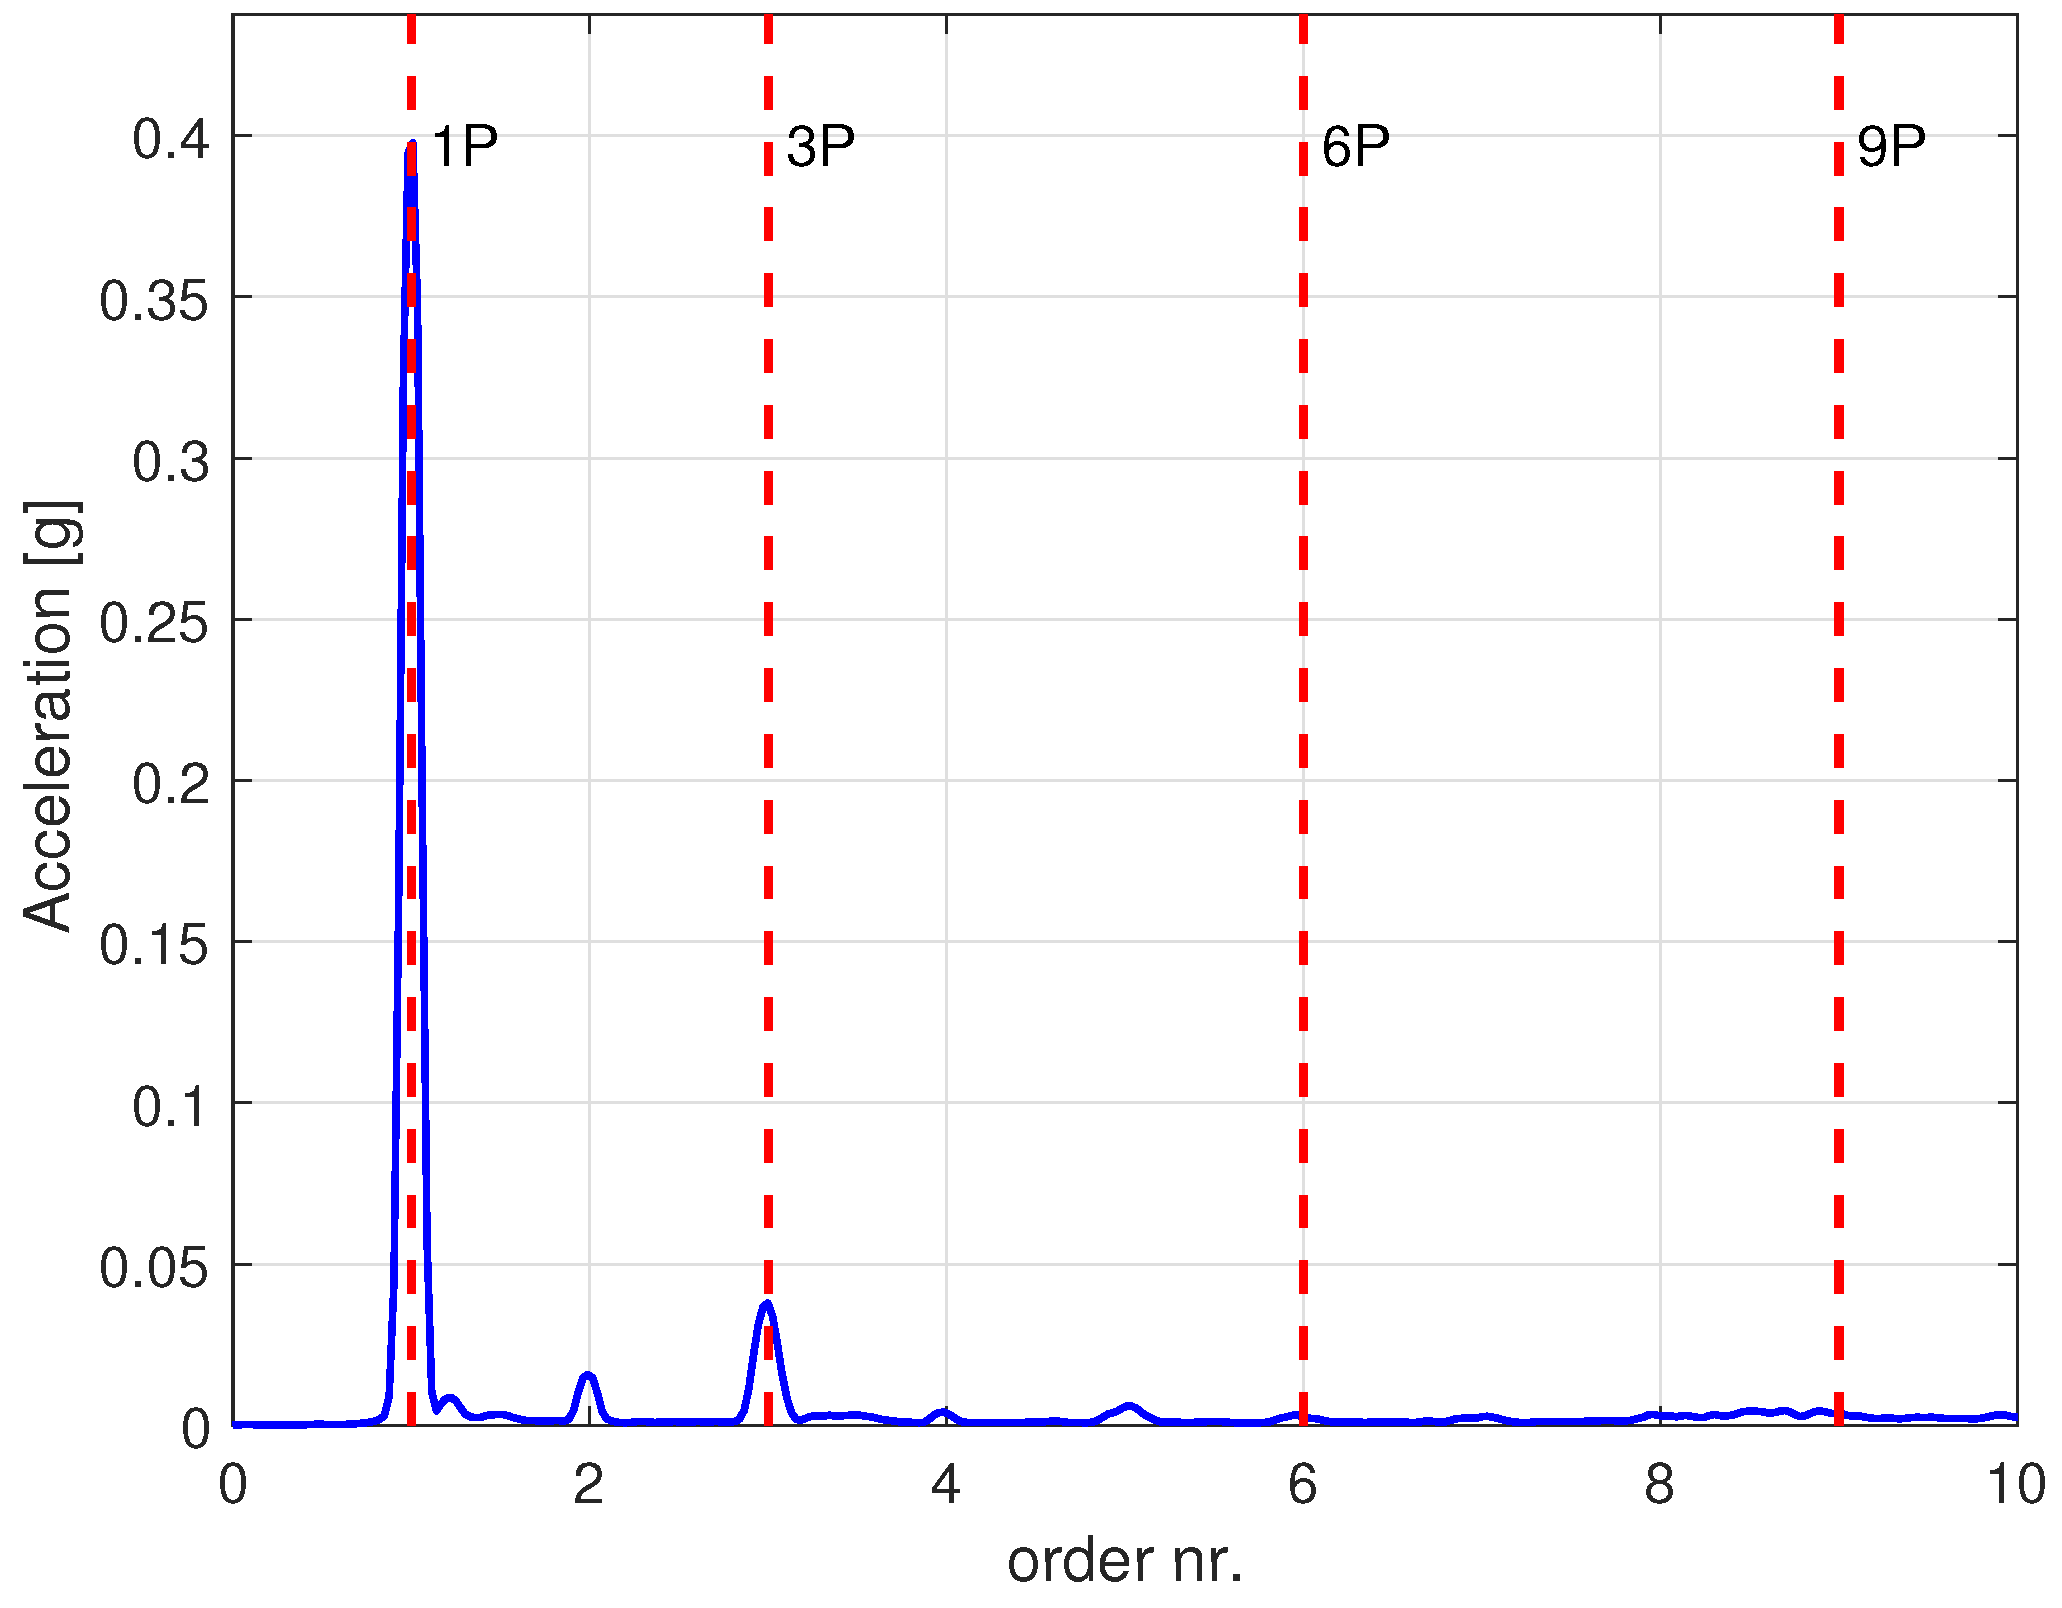
The order spectrum, that is, the order number/acceleration plot (Figure 8 and Figure 9), confirms this picture and further highlights, for example, the presence of the 48P frequency peak.
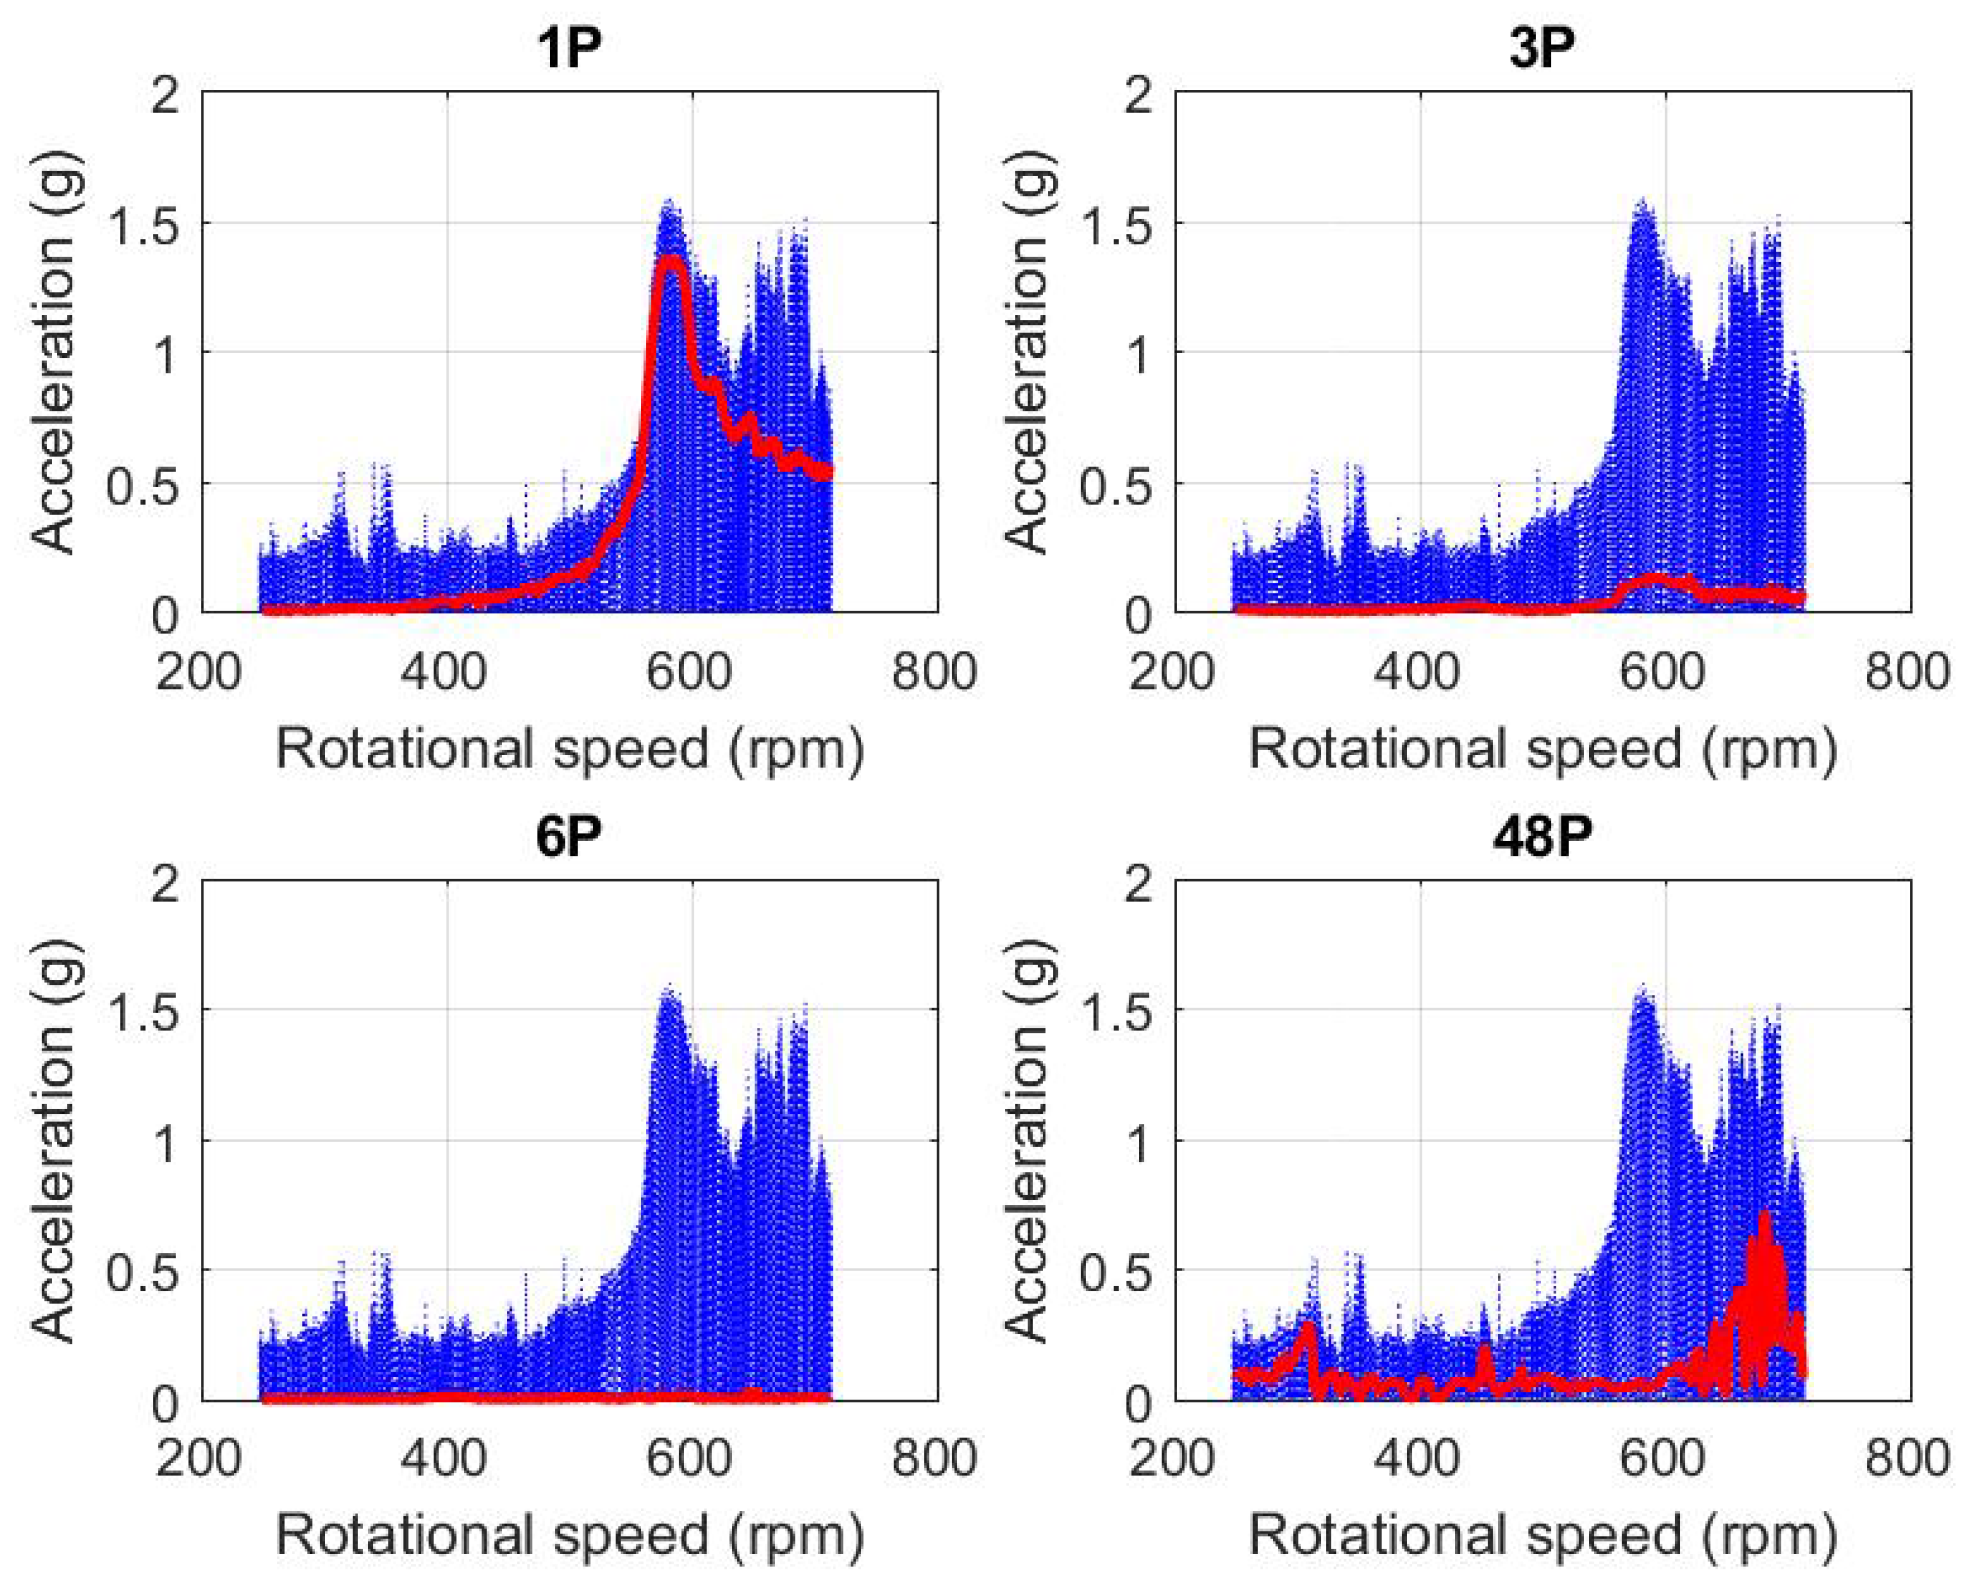
In order to make a comparison between the contributions of the single vibration orders, one can imagine intersecting the waterfall plot with a plane parallel to the vertical axis passing along the lines indicating the 1P rotations, 3P rotations, and so on. In this way, one obtains revolution per minute/amplitude curves, such as those in Figure 10.
From Figure 10, it arises that the main contribution to the vibration amplitude is given by the 1P frequency, and the peak around 600 rpm is due to resonance with the natural frequency in the latitudinal direction (9.58 Hz). At a rotational speed in the order of 600 rpm, the 1P and 48P frequencies are relevant, and, as can be understood from the following discussion, this can be interpreted as the coupling of aerodynamic, aeroelastic and electromechanical effects. Nevertheless, at this high rotational speed, the complexity of the scenario is exacerbated by the fact that the hypothesis of linear behavior is no longer verified, particularly when approaching the natural frequencies of the structure.
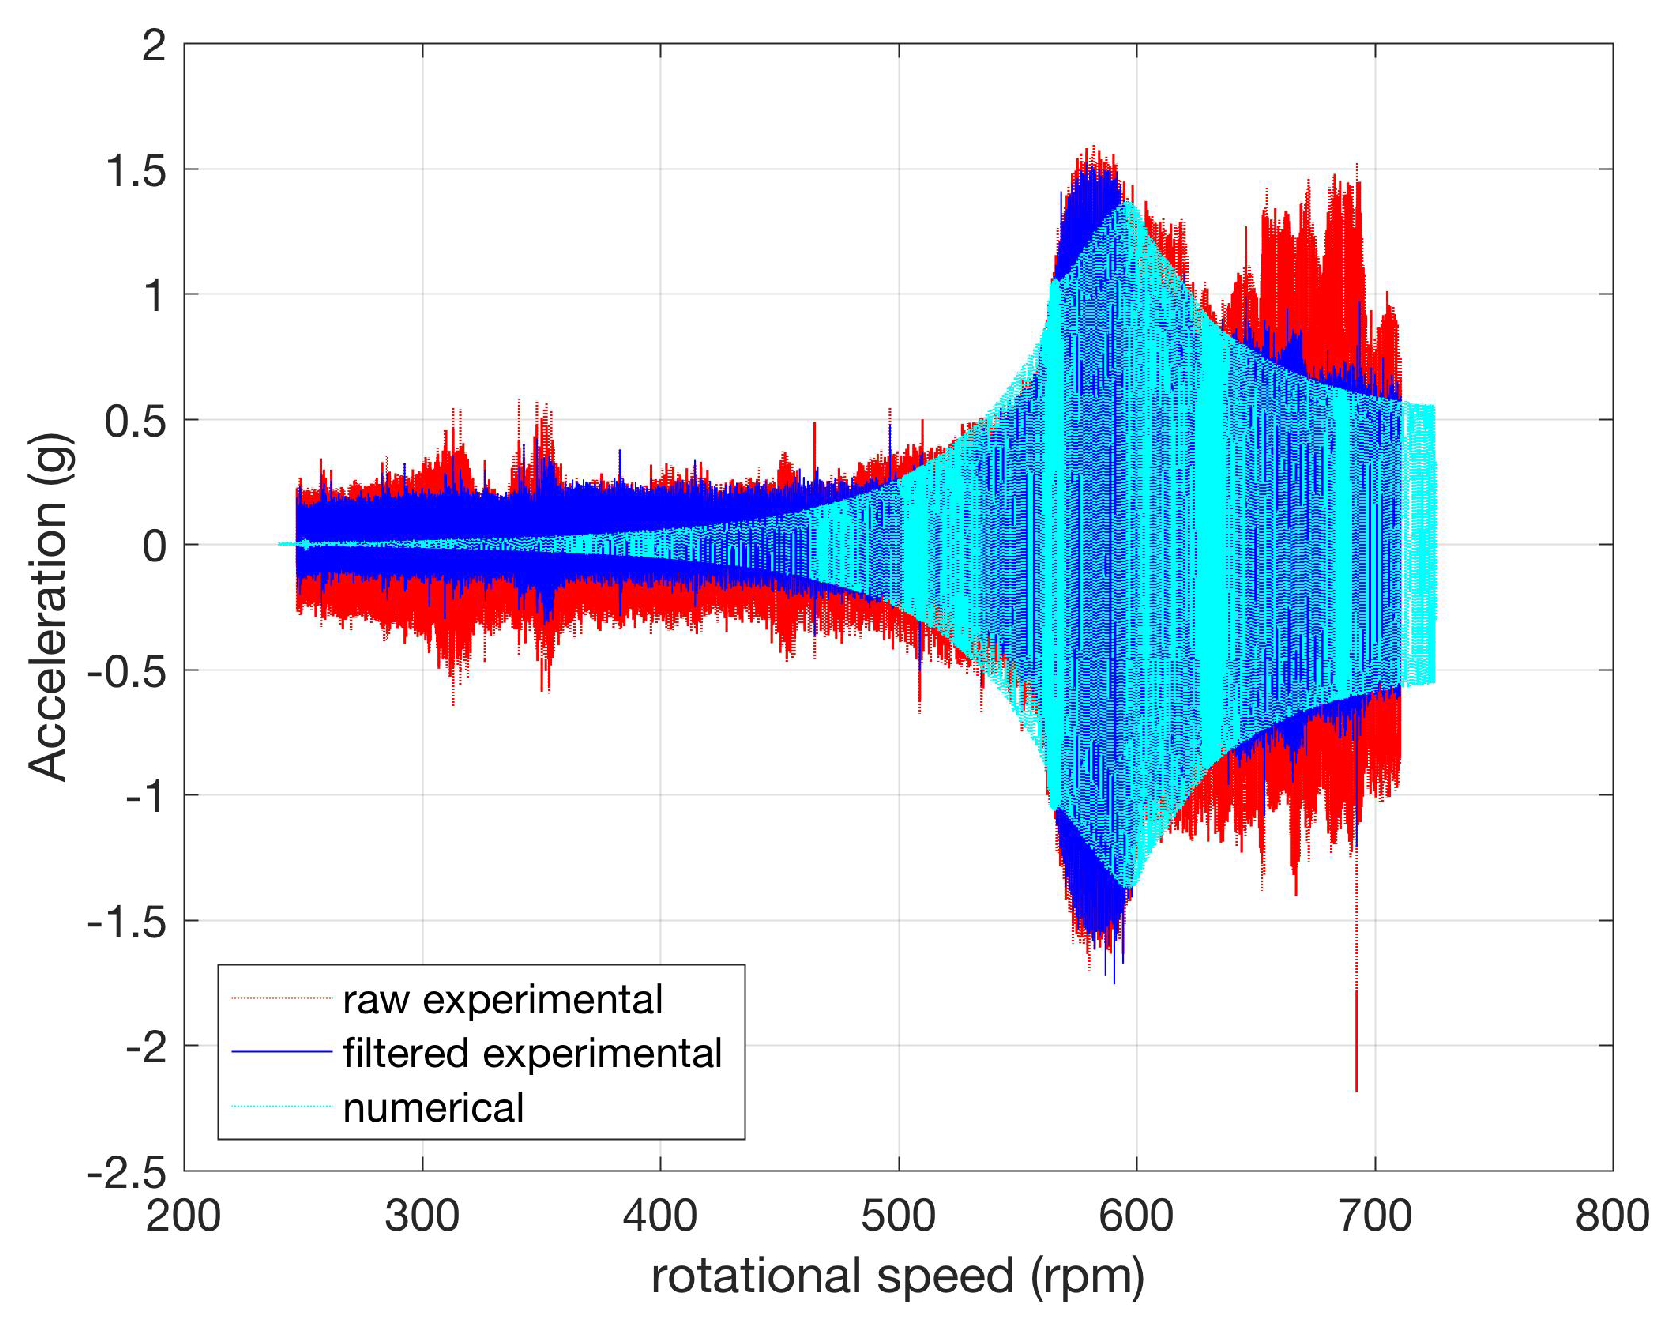
Figure 9 and Figure 10 highlight the very important contribution of the 48P frequency to the vibration spectrum. It cannot be ascribed to the interaction between the blades and the tower because, as arises from Figure 8 and Figure 9, this kind of contribution becomes almost negligible starting as early as from the 6P frequency. The explanation of this harmonic contribution to the spectrum is the electromechanical coupling: the synchronous generator of the wind turbine has 8 polar pairs, that is, 16 poles. The stator has 3 phases, and therefore 48 was obtained. The fact that the coupling is purely electromechanical and is not related to the periodicity of the blade rotation was crosschecked with a test using the five-bladed version of the test-case HAWT. It indeed arose that this kind of harmonic frequency remains unchanged when switching from three to five blades. Further, the 48P peak is not very sharp: in fact, it is quite smeared along an interval. This can be explained by considering the role of the control system regulating the angular speed through the regulation of the electrical load. The generator, further, has its own mechanical properties, and the interaction with the structure is reciprocal: not only does the rotor transmit vibration to the tower, but the other way round also applies, and this acts as a forcing on the rotor that, being immersed in a magnetic field, consequently causes vibration. With the data at our disposal, the physics of the generator could not be fully simulated using FAST v8, and therefore, in order to compare measurements against simulations, a post-processing has been applied to the experimental measurements. The signal was divided into portions of 0.5 s each, and it is reasonable to assume that during each of them, the signal was stationary: therefore one could apply a band-stop filter and block the 48P and its harmonics. The FAST settings were also adjusted, in order to compare against the measurements: FAST v8 allows us to take into account the interplay between blades and tower. A subtle point regards the mismatch between the real structure and the idealized structure that is possible to be simulated using FAST. For this work, the tuning was performed as follows: the model was the vertical beam fixed at the ground, and the parameters for stiffness and modal damping were adjusted. Doing this, one could adjust the resonance frequency and the vibration amplitude.
In Figure 11 and Figure 12, the raw experimental data and the post-processed experimental data (48P and its harmonics are band-stopped) are compared against the FAST simulation: Figure 11 refers to the time series; Figure 12 refers to the revolutions per minute/acceleration plot. It arises that, particularly at high rotational speeds, the filtered experimental data fit better with the simulations.
Adjustment of the tower modeling was necessary to improve the reliability of the simulation. The coefficients were tuned in order to match the peak amplitude and the decreasing trend above the critical speed (according to the filtered signal shown in Figure 11 and Figure 12). Therefore, in this case, the experimental measurements inspired the setting and the interpretation of the numerical setup. On the other hand, the numerical model can be very fruitful for interpreting the 1P peak in the experimental spectrum due to the mass imbalance of the rotor. Figure 13 shows the order spectrum from the FAST numerical model, under the assumption of a balanced rotor. Figure 14 shows the order spectrum from FAST, under the assumption of rotor unbalance due to a 4% of the mass of a blade, as resulted from precision experimental measurements. The appearance of the 1P frequency in Figure 14 is clear.
The effect of mass unbalance can be analyzed by referring to a simple model of an unbalanced point mass at distance e from the center of mass. This hypothesis leads to the following equation of motion:
where Hz (as comes from the experimental measurements) and e is the eccentricity, measured as 3 mm.
The damping ratio can be computed from the solution to the homogeneous equation, that can be posed in the form:
The damping ratio was estimated from experimental measurements as follows: a hammer test was performed and the envelope of the acceleration time series was computed. Subsequently, the envelope of the experimental response has been fitted to an exponential function as in Equation (2): this allowed to estimate as 0.056.
The non-dimensional acceleration amplitude is
where . This theoretical model, fed with the parameters of the system that have been experimentally measured as explained above, is compared against the experimental measurements. In Figure 15, the predictions for vibration amplitude from the mass unbalance model and the measurements are reported as a function of . In Figure 16, the same comparison is made after having band-pass filtered the experimental data around the 1P frequency. It arises that the simple numerical model of Equation (1) is indeed capable of explaining the behavior of the experimental measurements. When , the model loses its capability of predicting the peak amplitude, but this is expected because the linearity assumptions collapse.
In any case, it is interesting that it has been possible to understand with very good approximation the experimental spectrum of tower vibrations: the presence of the 1P frequency and its importance is explained by the mass unbalance model of Equation (1) that has been reproduced by the simulations; the presence of the aerodynamic peaks was reproduced with the simulations; the electromechanical coupling producing the 48P peak could not be faithfully represented by this kind of simulation. Even when filtering out the 48P frequency from the experimental signals, some discrepancies still arose, particularly regarding a high rotational speed: this was likely due to aeroelastic effects, resonances and interactions of the tower with secondary elements in terms of overall weight. The following subsection, regarding tail fin vibrations, provides some hints that this is indeed the case.
3.2. Tail Fin Vibrations
Regarding the tail fin vibrations, waterfall and order analyses of the experimental measurements have been conducted. The results are collected in Figure 17 and Figure 18.
The order map (Figure 18) of the acceleration measurements in the Y direction reveals a complex vibrational scenario with many interactions with the natural frequencies of the flexible structure of the tail fin. Additionally, large vibrations arise in the Y direction in the very high frequency range (up to the 48th order and higher) as a result of electromechanical couplings. Comparing against the waterfall plot of Figure 7, the interpretation is confirmed, according to which the vibration of the tail fin also induces vibrations on the tower. In fact, where these lines cross a rotational mode (as happens at the 48th order of rotation), the level of acceleration grows up to excite the tail fin. This supports that, for this kind of small HAWT, secondary elements in terms of overall weight (such as the tail fin) can also give meaningful structural excitations, inducing severe loads in some operational conditions. This phenomenon is well intelligible experimentally, but it is very difficult to model using the aeroelastic code.
Finally, in Figure 19 and Figure 20, some results are reported of the tests with the turbine subjected respectively to the ramp and to the oscillatory wind time series. In both cases, the waterfall plot of the tail fin vibrations in the Y direction is reported.
It arose that, in the ramp case, the 1P, aeroelastic and electromechanical peaks are clearly distinguishable. In the oscillatory wind time series, the 1P peak remains fairly in phase and is distinguishable. The aeroelastic peaks are smeared out, and the behavior around the 48P electromechanical peaks is particularly noisy. This comparison is instructive for understanding that, in real turbulent environments, the sharp aeroelastic behavior patterns that arise under very controlled regimes are likely destroyed.
4. Conclusions
This work has been devoted to the experimental and numerical analyses of a micro-HAWT with a 2 m diameter and 3 kW of maximum power production. The design of the prototype has been developed at the University of Perugia. The objective of the work was the comprehension of the tower and tail fin vibration spectra of the test-case HAWT in operation. Micro-wind turbines in general are a very challenging testing ground for this kind of study: they are mechanical devices very affected by strong fatigue, as a result of the variability of loads that are modulated by a very high rotational speed (the present HAWT reaches 800 rpm). The experimental analysis was based on wind tunnel testing (at the R. Balli wind tunnel at the University of Perugia), and it consisted of vibration measurements through accelerometers on the tower and the tail fin under controlled wind time series. Of particular interest is the wind ramp test, because it spanned the entire rotational speed range of the HAWT. The same wind time series as in the experimental campaign were fed as input to the FAST code for aeroelastic simulation. The interplay of aerodynamic loads and structure elasticity in fact invoked aeroelasticity as the unavoidable framework for comprehending the dynamics of the test-case HAWT. In this work, experimental and numerical analyses have been coupled with the perspective of establishing a reciprocal feedback, and this has been accomplished. On the one hand, the numerical model is important for interpreting the measured spectrum of tower oscillations; on the other hand, the measurements dictate how to comprehend and tune some subtle features of the model: the aeroelastic FAST code, employed in this work, has been developed for full-scale wind turbines and must therefore be carefully tuned when simulating the dynamics of small devices. Summarizing, the numerical simulations have been fundamental in order to understand the source of the 48P peak in the experimental spectrum: the electromechanical coupling. Further, the presence of a sharp 1P peak in the experimental tower vibration was identified, as a result of the numerical simulations, as being due to a mass unbalance of the rotor. A simple model of a point mass unbalance at a distance e from the center, where and e were experimentally measured, fairly explained the behavior of the acceleration as a function of the rotational speed. The comparison of experimental tower vibrations against the simulation also allowed us to set the limit of the capability of the aeroelastic modeling to capture the detail of the fins in the interactions of the different parts of the structure for such a small HAWT. In fact, in Section 3.2, it is shown that the vibration of the tail fin also induces vibrations on the tower, and therefore, for such small devices, secondary elements (from the point of view of mass) can result in considerable vibration amplitudes under certain operational conditions. These kind of contributions can be highlighted experimentally, but it is difficult to model them numerically: on the other hand, however, the knowledge of the numerical model and its limits is useful because it helps to identify, by exclusion, the possible contributions due to the excitation of the natural frequencies of secondary elements such as the tail fin. Summarizing, therefore, the present work has supported the picture according to which an integrated numerical and experimental approach is not valuable but is somehow unavoidable to characterize the dynamics of a small HAWT. Further directions of this work include an analysis (numerical as well as experimental) specifically devoted to blade loads. On the experimental side, it would also be interesting to use unsteady (sinusoidal) winds with different frequencies (using the wind tunnel fan control and/or oscillating blades). The overall future perspective, in the framework of the Smart Optimized Fault Tolerant Wind Turbines (SOFTWIND) research project, is the testing and validating of control strategies in terms of efficiency in responding to variable speed and capability to relieve dynamic loads. It would also be interesting to extend the proposed approach to vertical axis wind turbines: some results have been collected, for example, in [32], where a wide experimental investigation on the aerodynamics of a vertical-axis wind turbine has been conducted and considerably different aerodynamic behavior with respect to HAWTs has been highlighted (the tip aerodynamic phenomenon), and in [33], where the reliability of a simulation tool (capable of computing the unsteady rotational motion and the associated tower oscillations of a variable-speed vertical axis wind turbine immersed in coherent turbulent wind) has been assessed.
Acknowledgments
This research activity was partially supported by the Italian PRIN funding source (Research Projects of National Interest—Progetti di Ricerca di Interesse Nazionale) through a financed project entitled SOFTWIND (Smart Optimized Fault Tolerant Wind Turbines).
Author Contributions
Francesco Castellani conceived the research and performed the signal processing; Davide Astolfi supervised the model validation and wrote the paper; Matteo Becchetti performed the experimental analysis; Francesco Berno analysed vibrational data, performed aeroelastic modelling and wrote the paper; Filippo Cianetti conceived the research; Alessandro Cetrini performed aeroelastic modelling.
Conflicts of Interest
These authors contributed equally to this work.
References
- Sauter, R.; Watson, J. Strategies for the deployment of micro-generation: Implications for social acceptance. Energy Policy 2007, 35, 2770–2779. [Google Scholar] [CrossRef]
- Xie, W.; Zeng, P.; Lei, L. Wind tunnel experiments for innovative pitch regulated blade of horizontal axis wind turbine. Energy 2015, 91, 1070–1080. [Google Scholar] [CrossRef]
- Bai, C.J.; Chen, P.W.; Wang, W.C. Aerodynamic design and analysis of a 10 kW horizontal-axis wind turbine for Tainan, Taiwan. Clean Technol. Environ. Policy 2016, 18, 1151–1166. [Google Scholar] [CrossRef]
- Scappatici, L.; Bartolini, N.; Castellani, F.; Astolfi, D.; Garinei, A.; Pennicchi, M. Optimizing the design of horizontal-axis small wind turbines: From the laboratory to market. J. Wind Eng. Ind. Aerodyn. 2016, 154, 58–68. [Google Scholar] [CrossRef]
- Lanzafame, R.; Messina, M. Power curve control in micro wind turbine design. Energy 2010, 35, 556–561. [Google Scholar] [CrossRef]
- Lumbreras, C.; Guerrero, J.M.; García, P.; Briz, F.; Reigosa, D.D. Control of a small wind turbine in the high wind speed region. IEEE Trans. Power Electron. 2016, 31, 6980–6991. [Google Scholar] [CrossRef]
- James, P.; Sissons, M.; Bradford, J.; Myers, L.; Bahaj, A.; Anwar, A.; Green, S. Implications of the UK field trial of building mounted horizontal axis micro-wind turbines. Energy Policy 2010, 38, 6130–6144. [Google Scholar] [CrossRef]
- Dayan, E. Wind energy in buildings: Power generation from wind in the urban environment—Where it is needed most. Refocus 2006, 7, 33–38. [Google Scholar] [CrossRef]
- Li, D.; Wang, S.; Yuan, P. A review of micro wind turbines in the built environment. In Proceedings of the Power and Energy Engineering Conference (APPEEC), 2010 Asia-Pacific, Chengdu, China, 28–31 March 2010; pp. 1–4. [Google Scholar]
- Sunderland, K.; Woolmington, T.; Blackledge, J.; Conlon, M. Small wind turbines in turbulent (urban) environments: A consideration of normal and Weibull distributions for power prediction. J. Wind Eng. Ind. Aerodyn. 2013, 121, 70–81. [Google Scholar] [CrossRef]
- Toja-Silva, F.; Colmenar-Santos, A.; Castro-Gil, M. Urban wind energy exploitation systems: Behaviour under multidirectional flow conditions—Opportunities and challenges. Renew. Sustain. Energy Rev. 2013, 24, 364–378. [Google Scholar] [CrossRef]
- Lubitz, W.D. Impact of ambient turbulence on performance of a small wind turbine. Renew. Energy 2014, 61, 69–73. [Google Scholar] [CrossRef]
- Pagnini, L.C.; Burlando, M.; Repetto, M.P. Experimental power curve of small-size wind turbines in turbulent urban environment. Appl. Energy 2015, 154, 112–121. [Google Scholar] [CrossRef]
- Alpman, E. Aerodynamic performance of small-scale horizontal axis wind turbines under two different extreme wind conditions. J. Therm. Eng. 2015, 1, 420–432. [Google Scholar] [CrossRef]
- Joosse, P.; Blanch, M.; Dutton, A.; Kouroussis, D.; Philippidis, T.; Vionis, P. Acoustic emission monitoring of small wind turbine blades. J. Sol. Energy Eng. 2002, 124, 446–454. [Google Scholar] [CrossRef]
- Mollasalehi, E.; Sun, Q.; Wood, D. Contribution of small wind turbine structural vibration to noise emission. Energies 2013, 6, 3669–3691. [Google Scholar] [CrossRef]
- Taylor, J.; Eastwick, C.; Lawrence, C.; Wilson, R. Noise levels and noise perception from small and micro wind turbines. Renew. Energy 2013, 55, 120–127. [Google Scholar] [CrossRef]
- Lee, S.; Lee, S. Numerical and experimental study of aerodynamic noise by a small wind turbine. Renew. Energy 2014, 65, 108–112. [Google Scholar] [CrossRef]
- Tabrizi, A.B.; Whale, J.; Lyons, T.; Urmee, T. Performance and safety of rooftop wind turbines: Use of CFD to gain insight into inflow conditions. Renew. Energy 2014, 67, 242–251. [Google Scholar] [CrossRef]
- Li, Q.; Kamada, Y.; Maeda, T.; Nishida, Y. Experimental investigations of boundary layer impact on the airfoil aerodynamic forces of Horizontal Axis Wind Turbine in turbulent inflows. Energy 2017, 135, 799–810. [Google Scholar] [CrossRef]
- Pourrajabian, A.; Afshar, P.A.N.; Ahmadizadeh, M.; Wood, D. Aero-structural design and optimization of a small wind turbine blade. Renew. Energy 2016, 87, 837–848. [Google Scholar] [CrossRef]
- Evans, S.; Bradney, D.; Clausen, P. Aeroelastic measurements and simulations of a small wind turbine operating in the built environment. J. Phys. Conf. Ser. 2016, 753. [Google Scholar] [CrossRef]
- Bukala, J.; Małachowski, J.; Szafranski, T. Numerical optimization and design study of small wind turbine mast structure. In Proceedings of the IECON 2016—42nd Annual Conference of the IEEE Industrial Electronics Society, Florence, Italy, 23–26 October 2016; pp. 5562–5567. [Google Scholar]
- Ochs, D.S.; Miller, R.D.; White, W.N. Simulation of electromechanical interactions of permanent-magnet direct-drive wind turbines using the fast aeroelastic simulator. IEEE Trans. Sustain. Energy 2014, 5, 2–9. [Google Scholar] [CrossRef]
- Tang, D.; Bao, S.; Luo, L.; Mao, J.; Lv, B.; Guo, H. Study on the aeroelastic responses of a wind turbine using a coupled multibody-FVW method. Energy 2017, 141, 2300–2313. [Google Scholar] [CrossRef]
- Wang, L.; Liu, X.; Kolios, A. State of the art in the aeroelasticity of wind turbine blades: Aeroelastic modelling. Renew. Sustain. Energy Rev. 2016, 64, 195–210. [Google Scholar] [CrossRef]
- Jonkman, J.M.; Buhl Jr, M.L. User’s Guide—Updated August 2005; Technical report; National Renewable Energy Laboratory (NREL): Golden, CO, USA, 2005.
- Antoni, J. Cyclostationarity by examples. Mech. Syst. Signal Process. 2009, 23, 987–1036. [Google Scholar] [CrossRef]
- Elia, G.; Cocconcelli, M.; Mucchi, E.; Dalpiaz, G. Combining blind separation and cyclostationary techniques for monitoring distributed wear in gearbox rolling bearings. Proc. Inst. Mech. Eng. Part C J. Mech. Eng. Sci. 2017, 231, 1113–1128. [Google Scholar] [CrossRef]
- Dolan, D.S.; Lehn, P.W. Simulation model of wind turbine 3p torque oscillations due to wind shear and tower shadow. IEEE Trans. Energy Convers. 2006, 21, 717–724. [Google Scholar] [CrossRef]
- Hau, E. Wind Turbines: Fundamentals, Technologies, Application, Economics; Springer Science & Business Media: Berlin/Heidelberg, Germany, 2013. [Google Scholar]
- Battisti, L.; Zanne, L.; Dell’Anna, S.; Dossena, V.; Persico, G.; Paradiso, B. Aerodynamic measurements on a vertical axis wind turbine in a large scale wind tunnel. J. Energy Resour. Technol. 2011, 133, 031201. [Google Scholar] [CrossRef]
- Battisti, L.; Benini, E.; Brighenti, A.; Soraperra, G.; Castelli, M.R. Simulating the dynamic behavior of a vertical axis wind turbine operating in unsteady conditions. J. Phys. Conf. Ser. 2016, 753. [Google Scholar] [CrossRef]
Figure 1.
The front view of the wind turbine in the wind tunnel with the recovery test section (2.7 m × 2.7 m) on the background.
Figure 1.
The front view of the wind turbine in the wind tunnel with the recovery test section (2.7 m × 2.7 m) on the background.
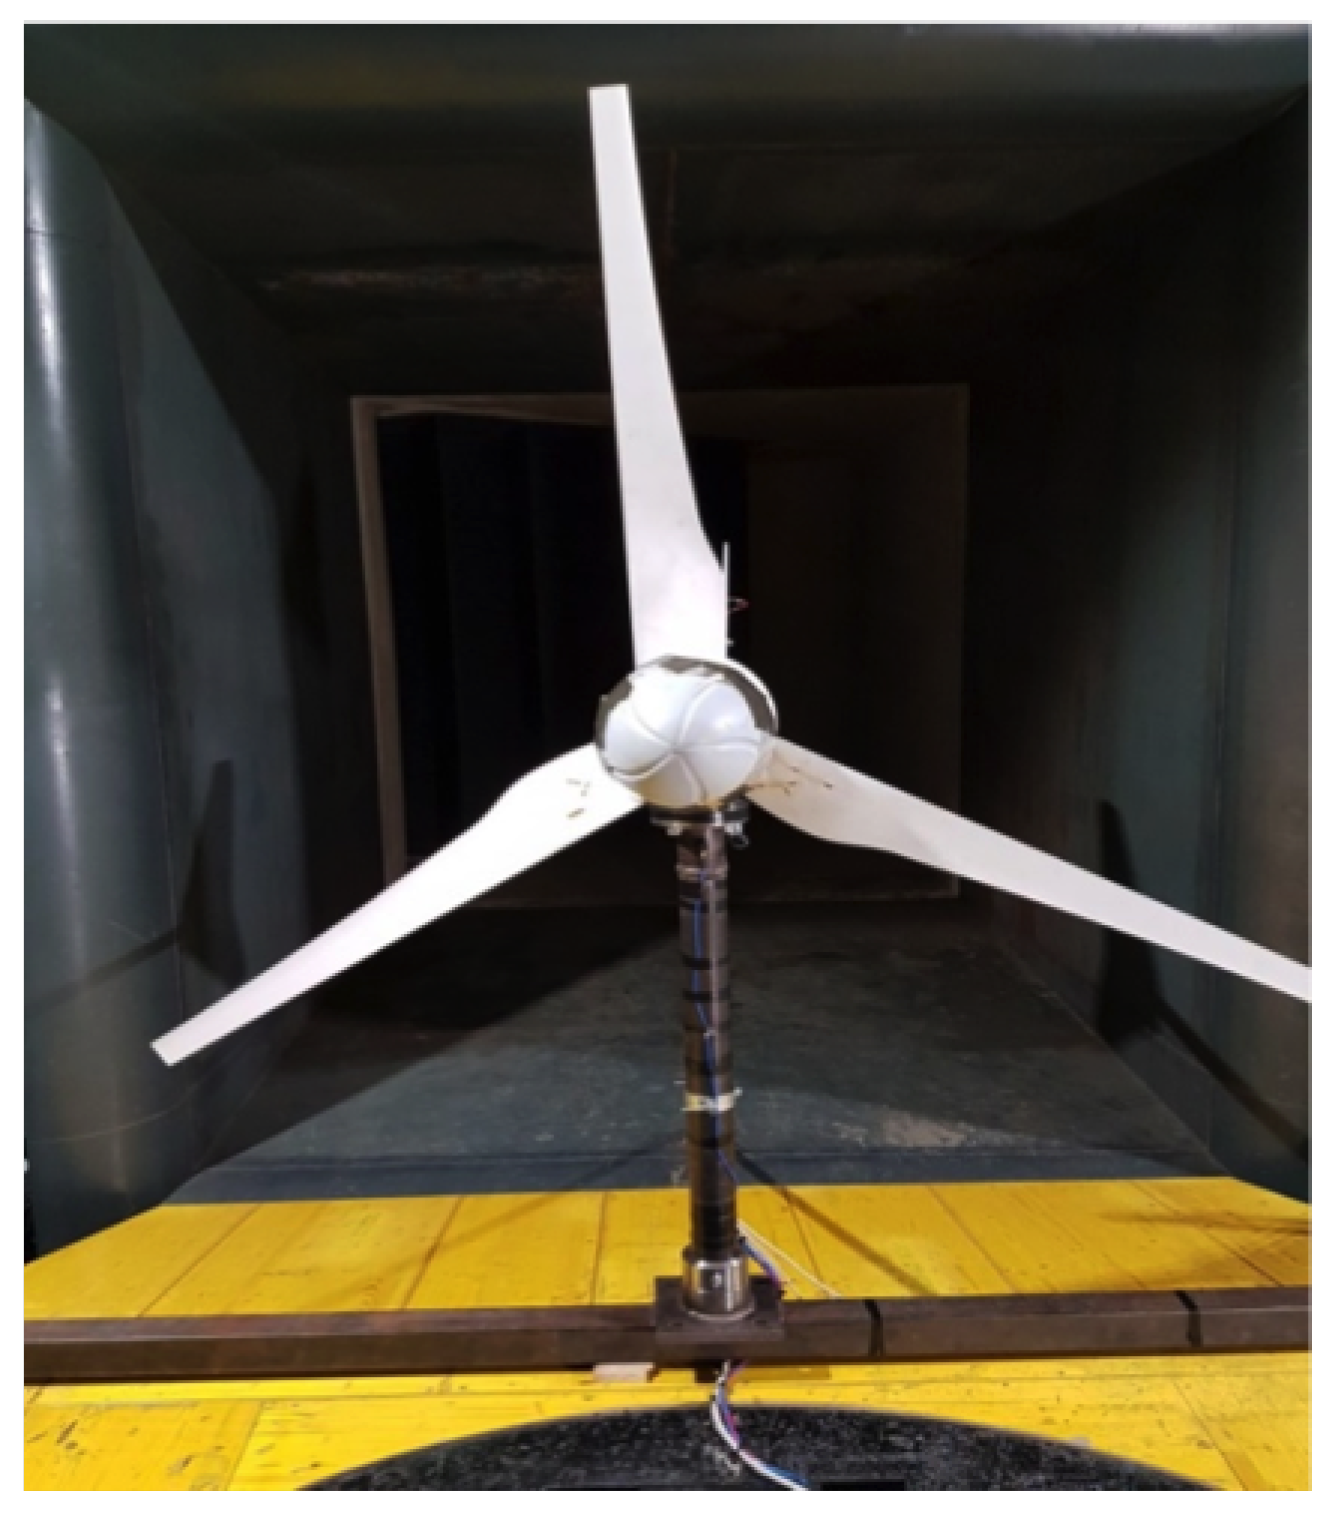
Figure 2.
The layout of the sensor arrangement.

Figure 3.
The wind tunnel.
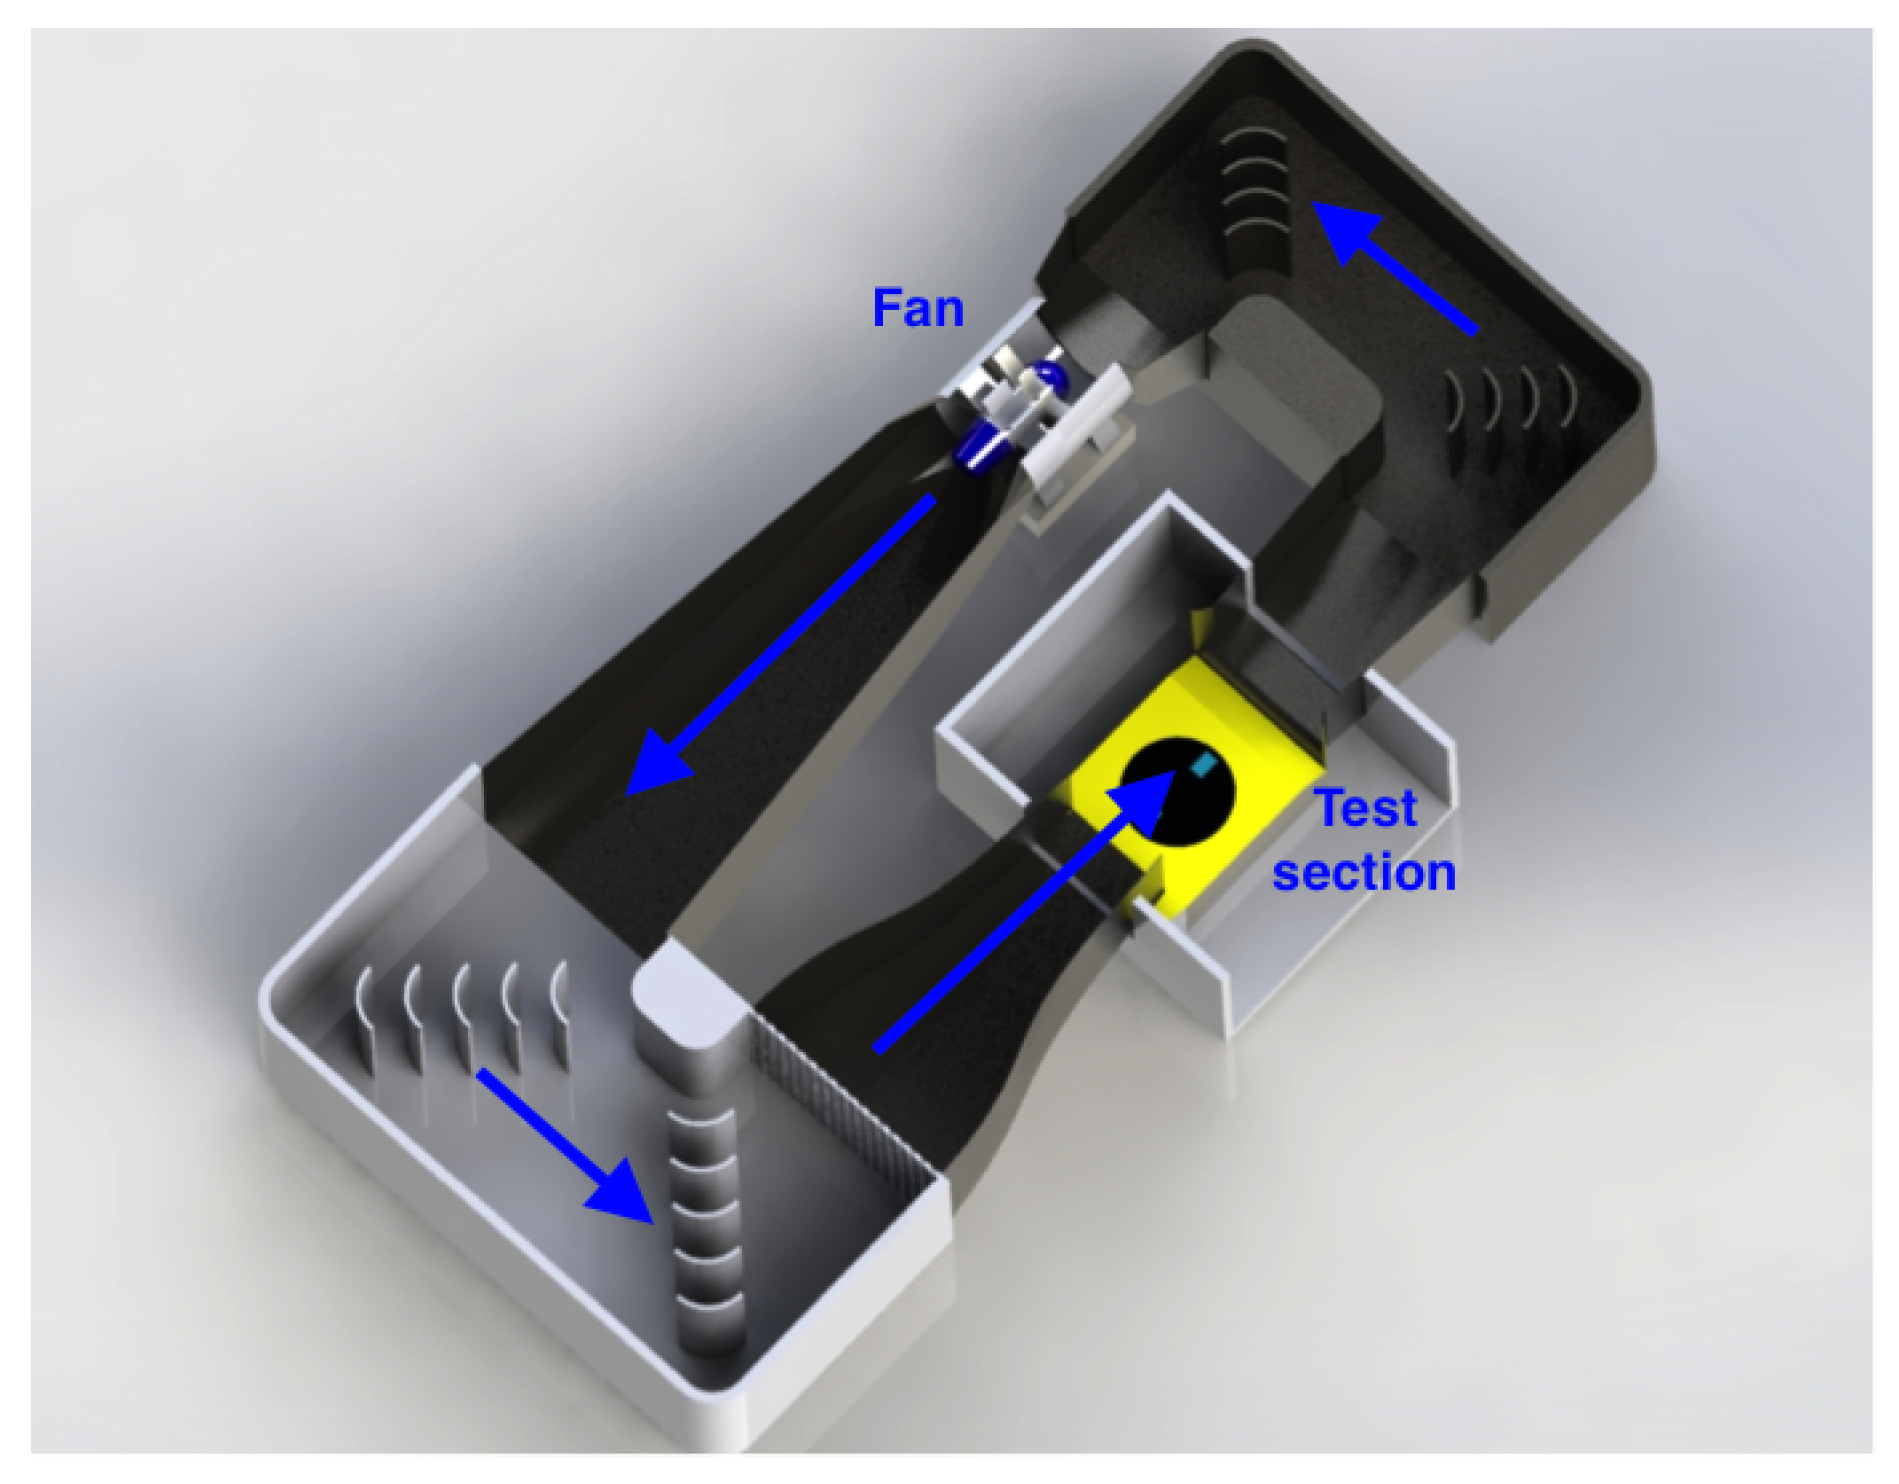
Figure 4.
Flowchart for a FAST (Fatigue, Aerodynamics, Structures, and Turbulence) v7 simulation.

Figure 5.
Reference axes for FAST tower references (black), and reference axes for accelerometer measurements (red). The figure is not drawn to scale.
Figure 5.
Reference axes for FAST tower references (black), and reference axes for accelerometer measurements (red). The figure is not drawn to scale.

Figure 6.
Simulation of the first resonant frequency of the blades as a function of the rotational speed.
Figure 6.
Simulation of the first resonant frequency of the blades as a function of the rotational speed.
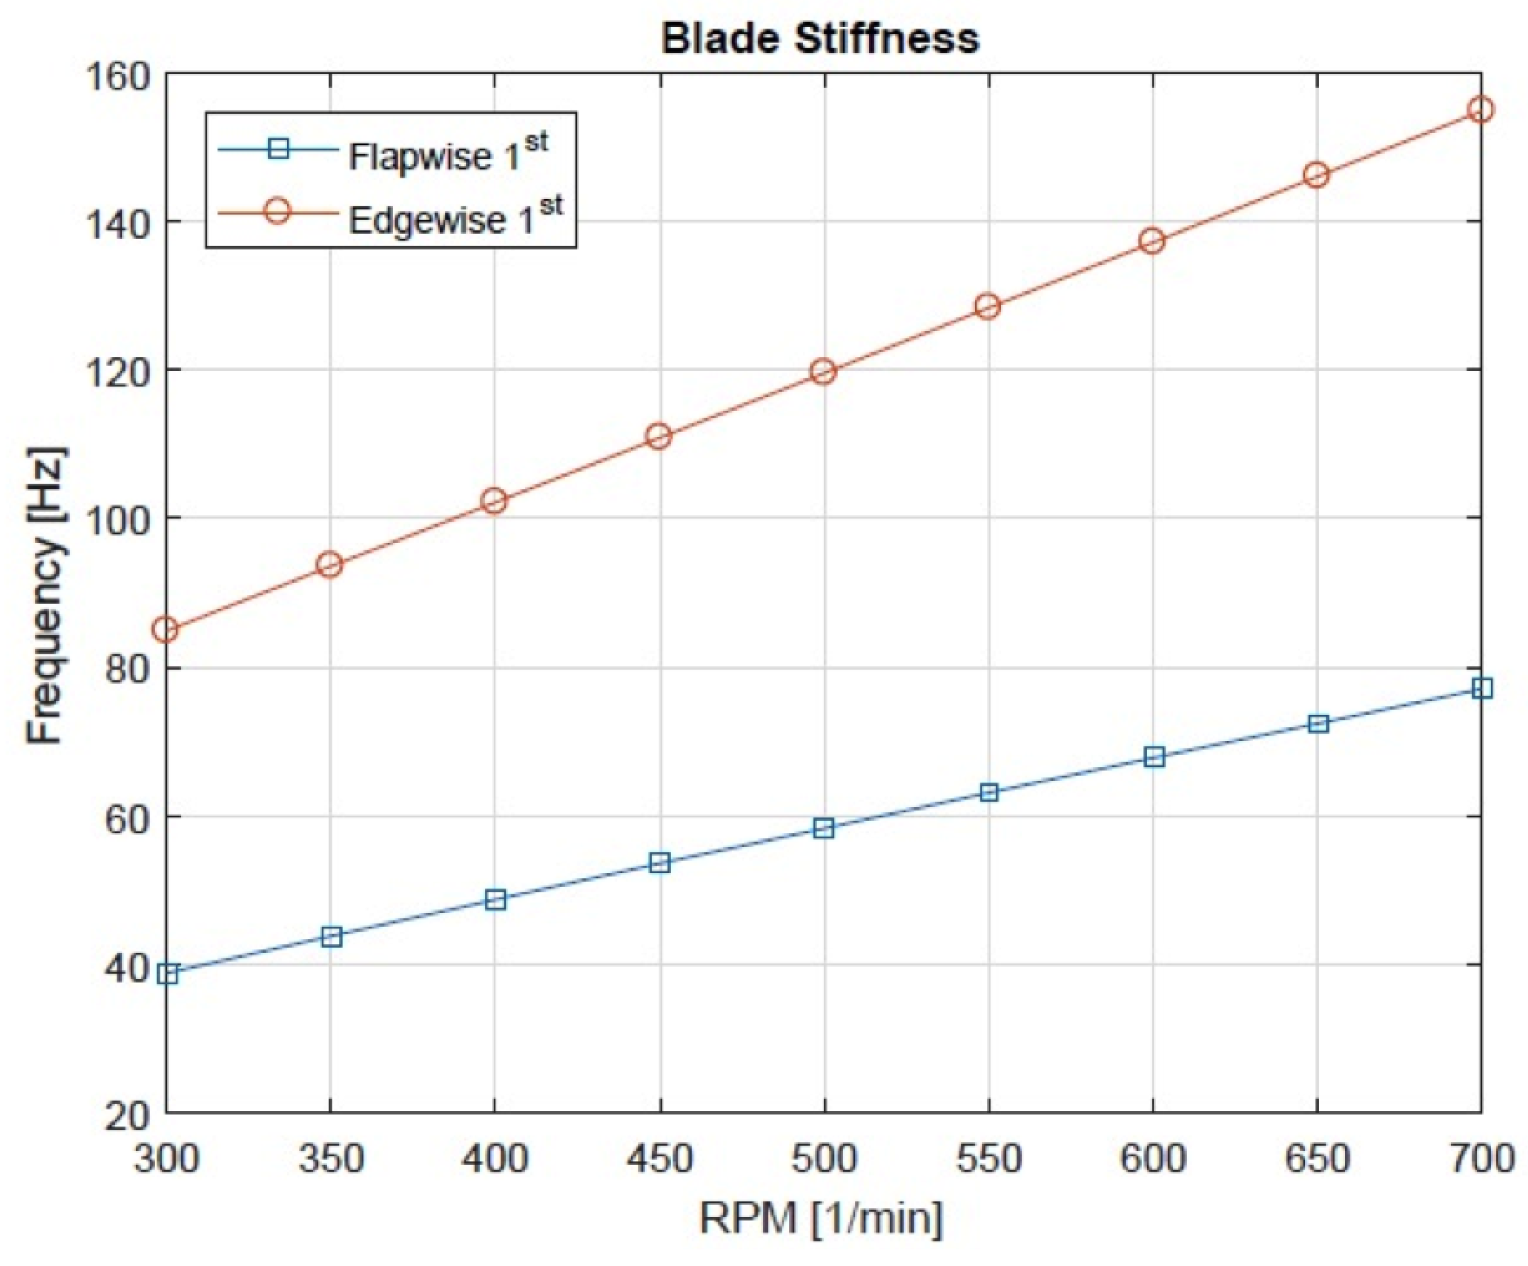
Figure 7.
Waterfall of Y direction tower vibrations from wind tunnel measurements.

Figure 8.
Order spectrum of the experimental Y direction tower oscillations.

Figure 9.
Order spectrum of the experimental Y direction tower oscillations.
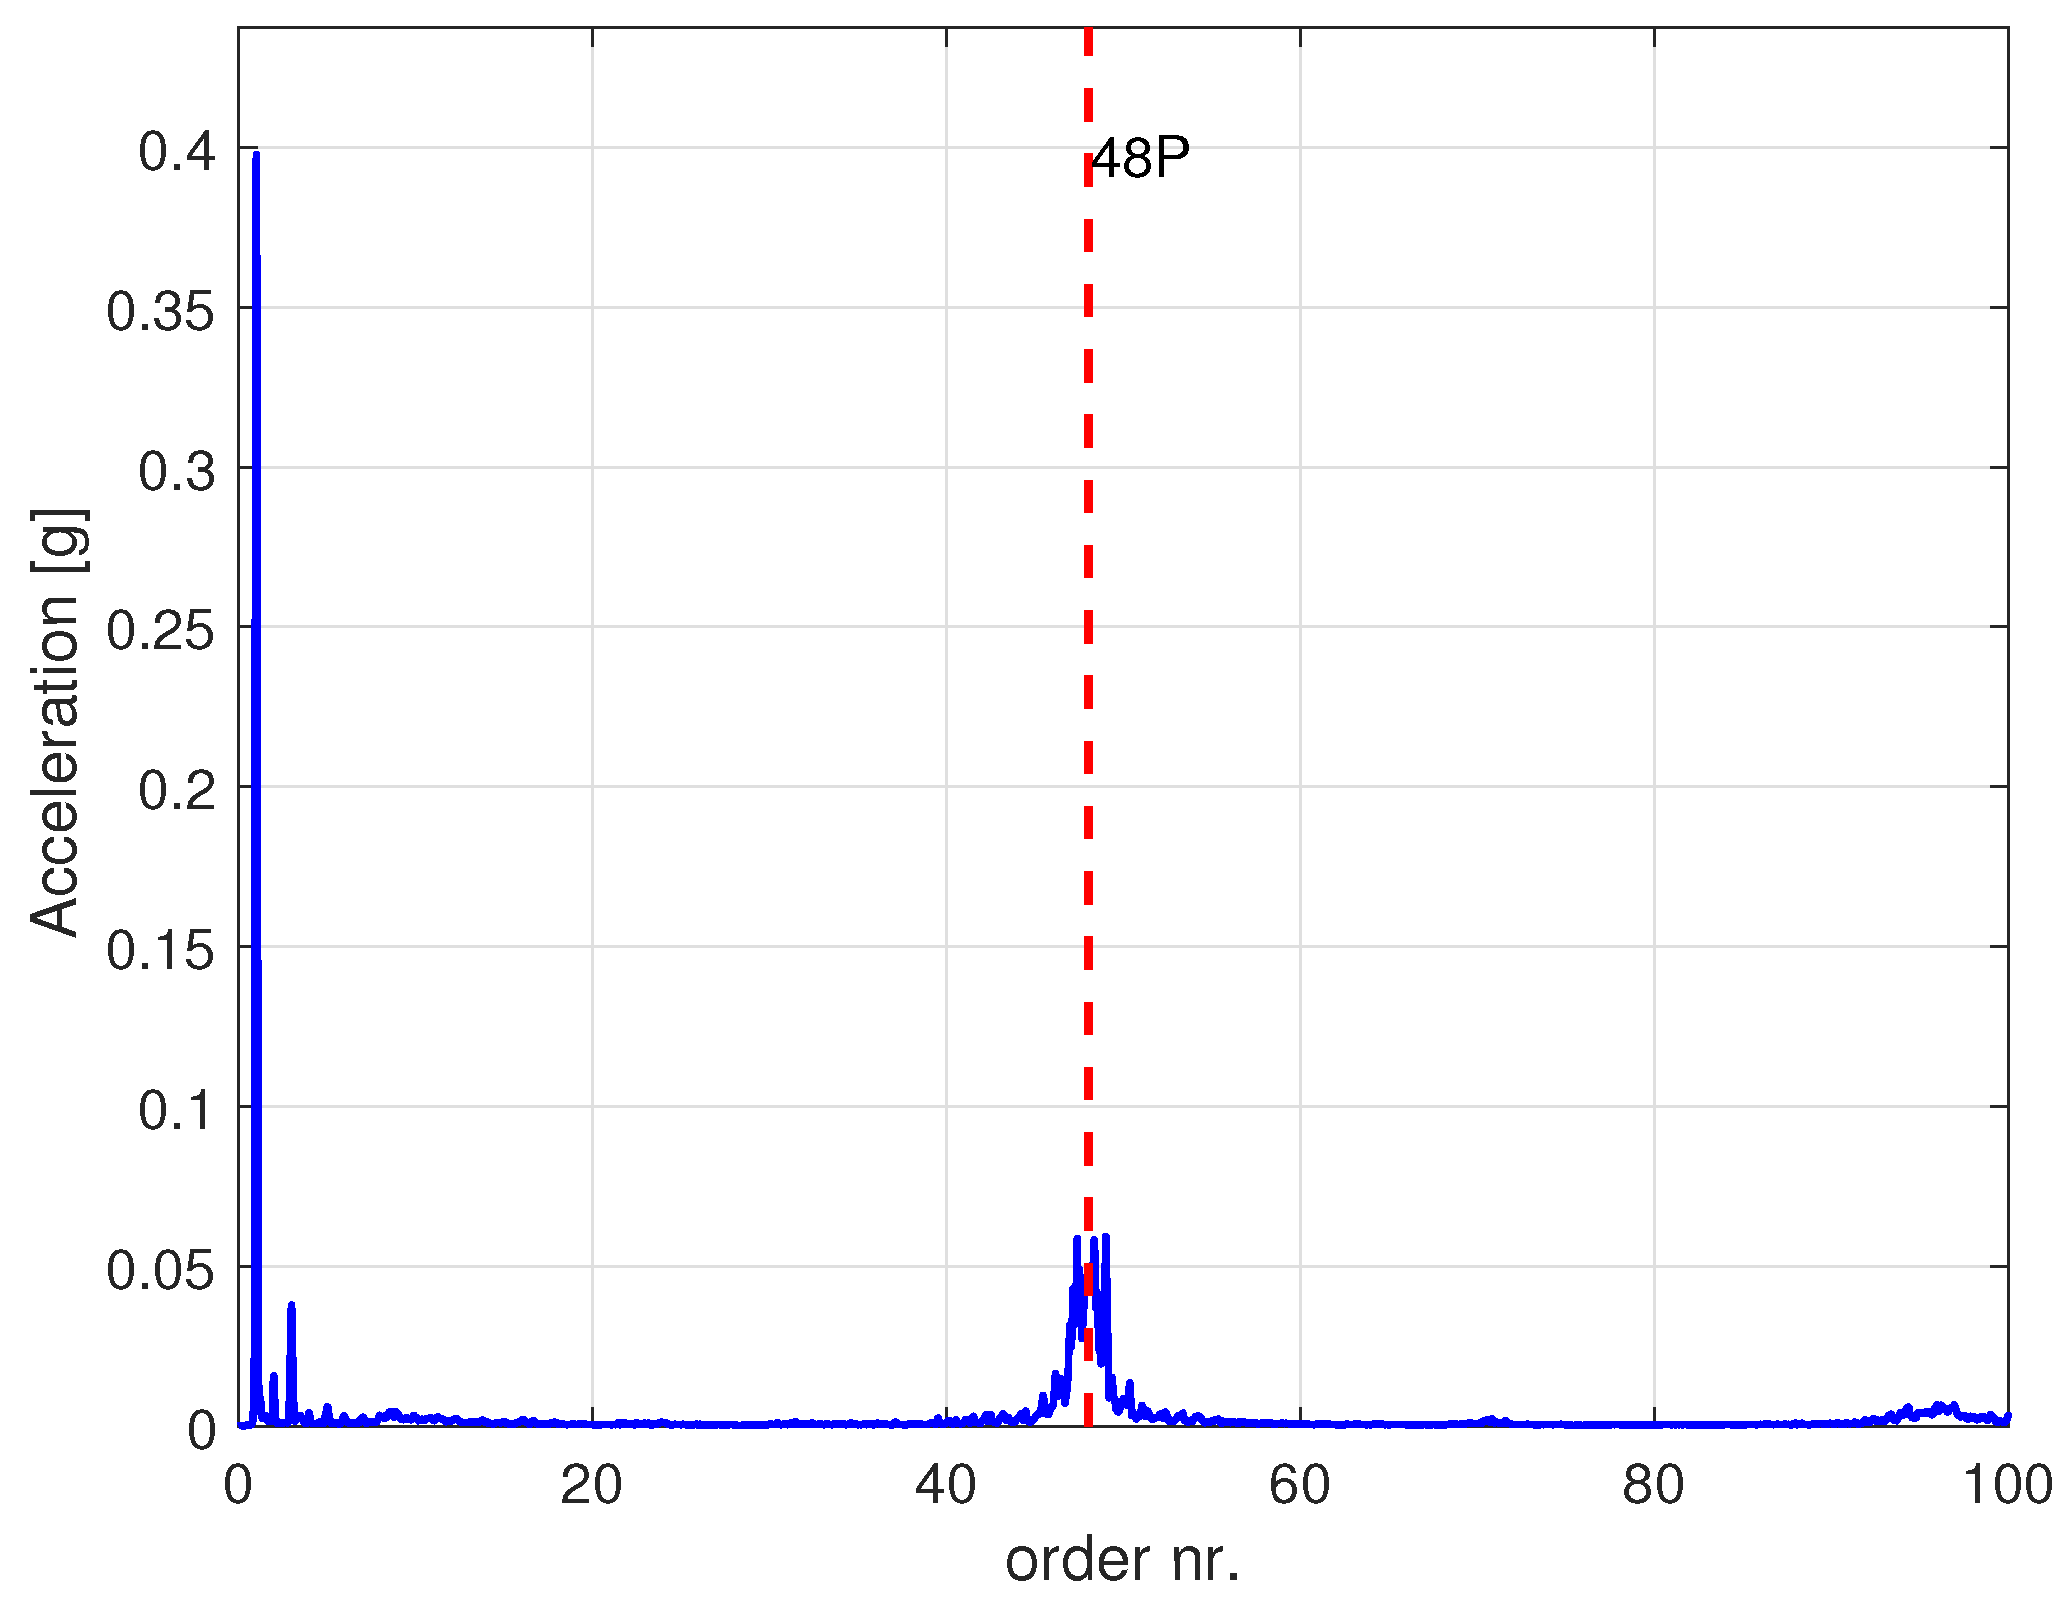
Figure 10.
Revolution per minute/acceleration plot for the individual Y direction tower harmonics.

Figure 11.
Comparison of raw experimental data (red) against filtered experimental data (blue) and simulated data (light blue): time series.
Figure 11.
Comparison of raw experimental data (red) against filtered experimental data (blue) and simulated data (light blue): time series.
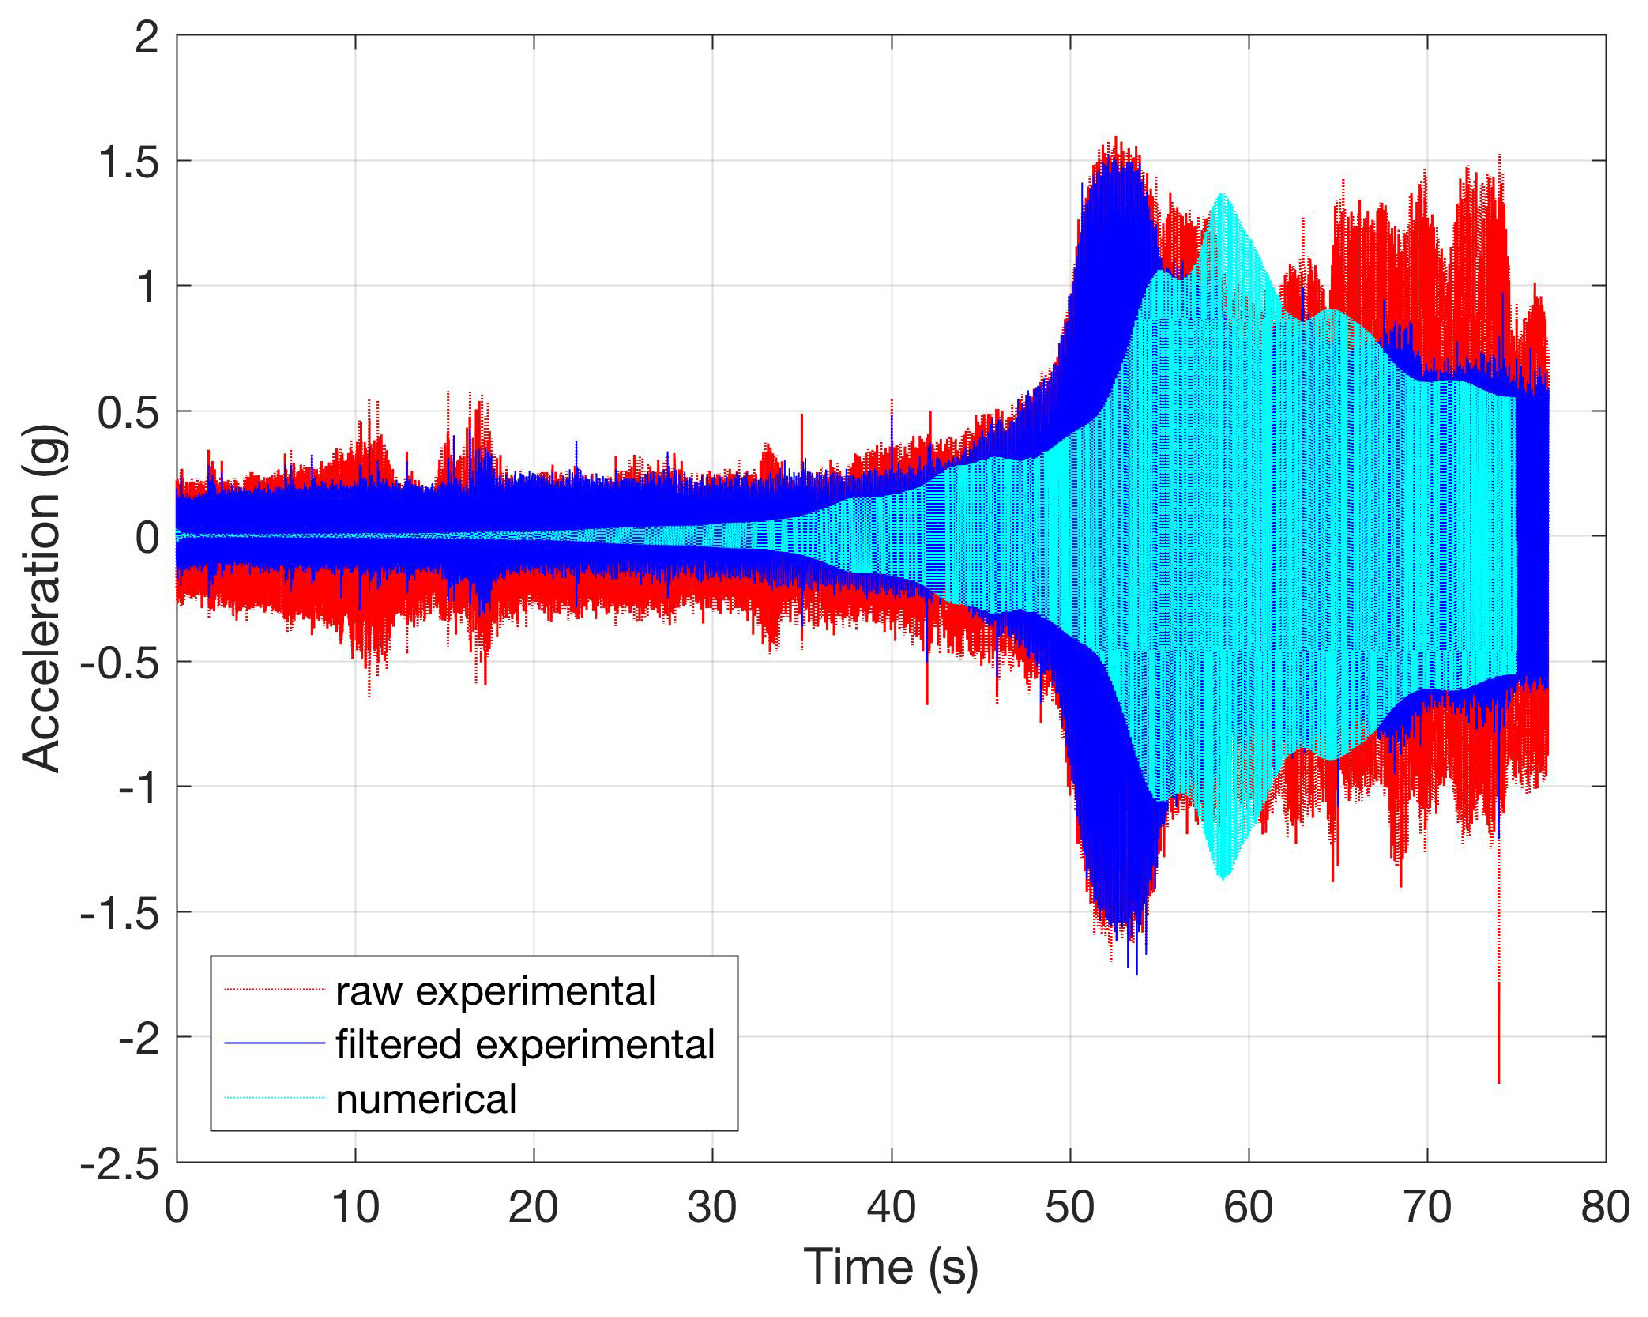
Figure 12.
Comparison of raw experimental data (red) against filtered experimental data (blue) and simulated data (light blue): revolutions per minute/acceleration.
Figure 12.
Comparison of raw experimental data (red) against filtered experimental data (blue) and simulated data (light blue): revolutions per minute/acceleration.

Figure 13.
Order spectrum for Y direction tower vibrations from the FAST model: rotor balanced.
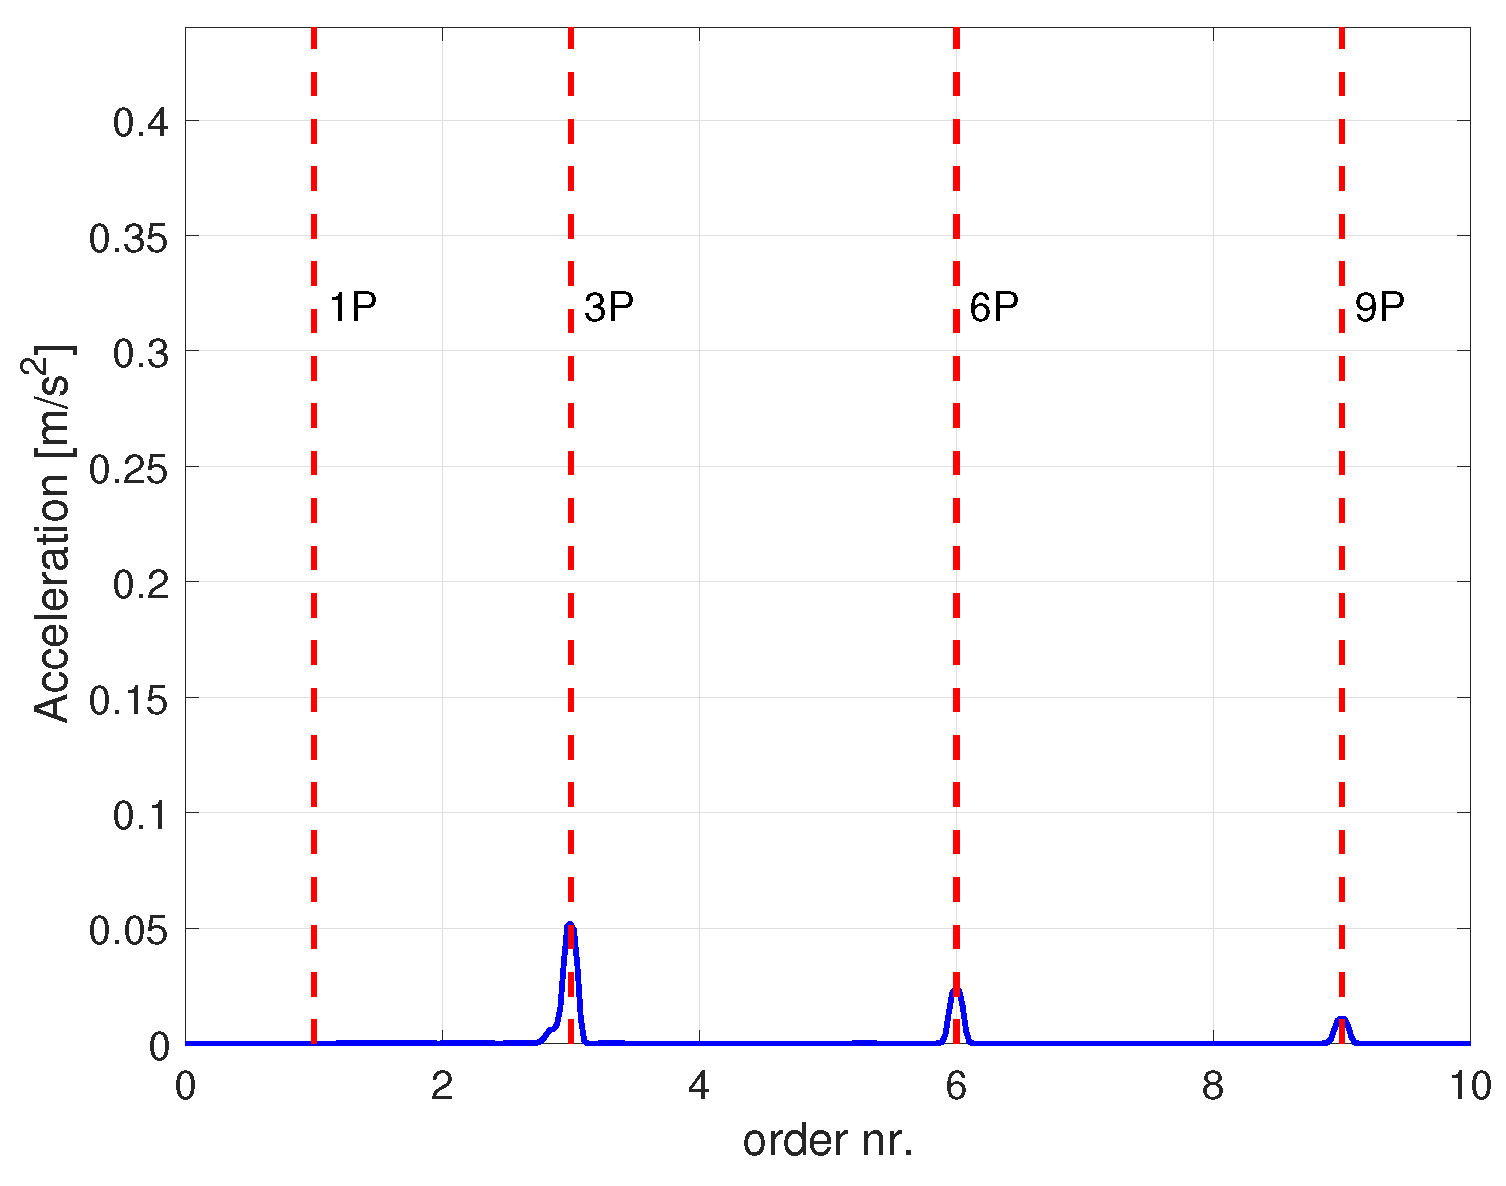
Figure 14.
Order spectrum for Y direction tower vibrations from the FAST model: rotor unbalanced.
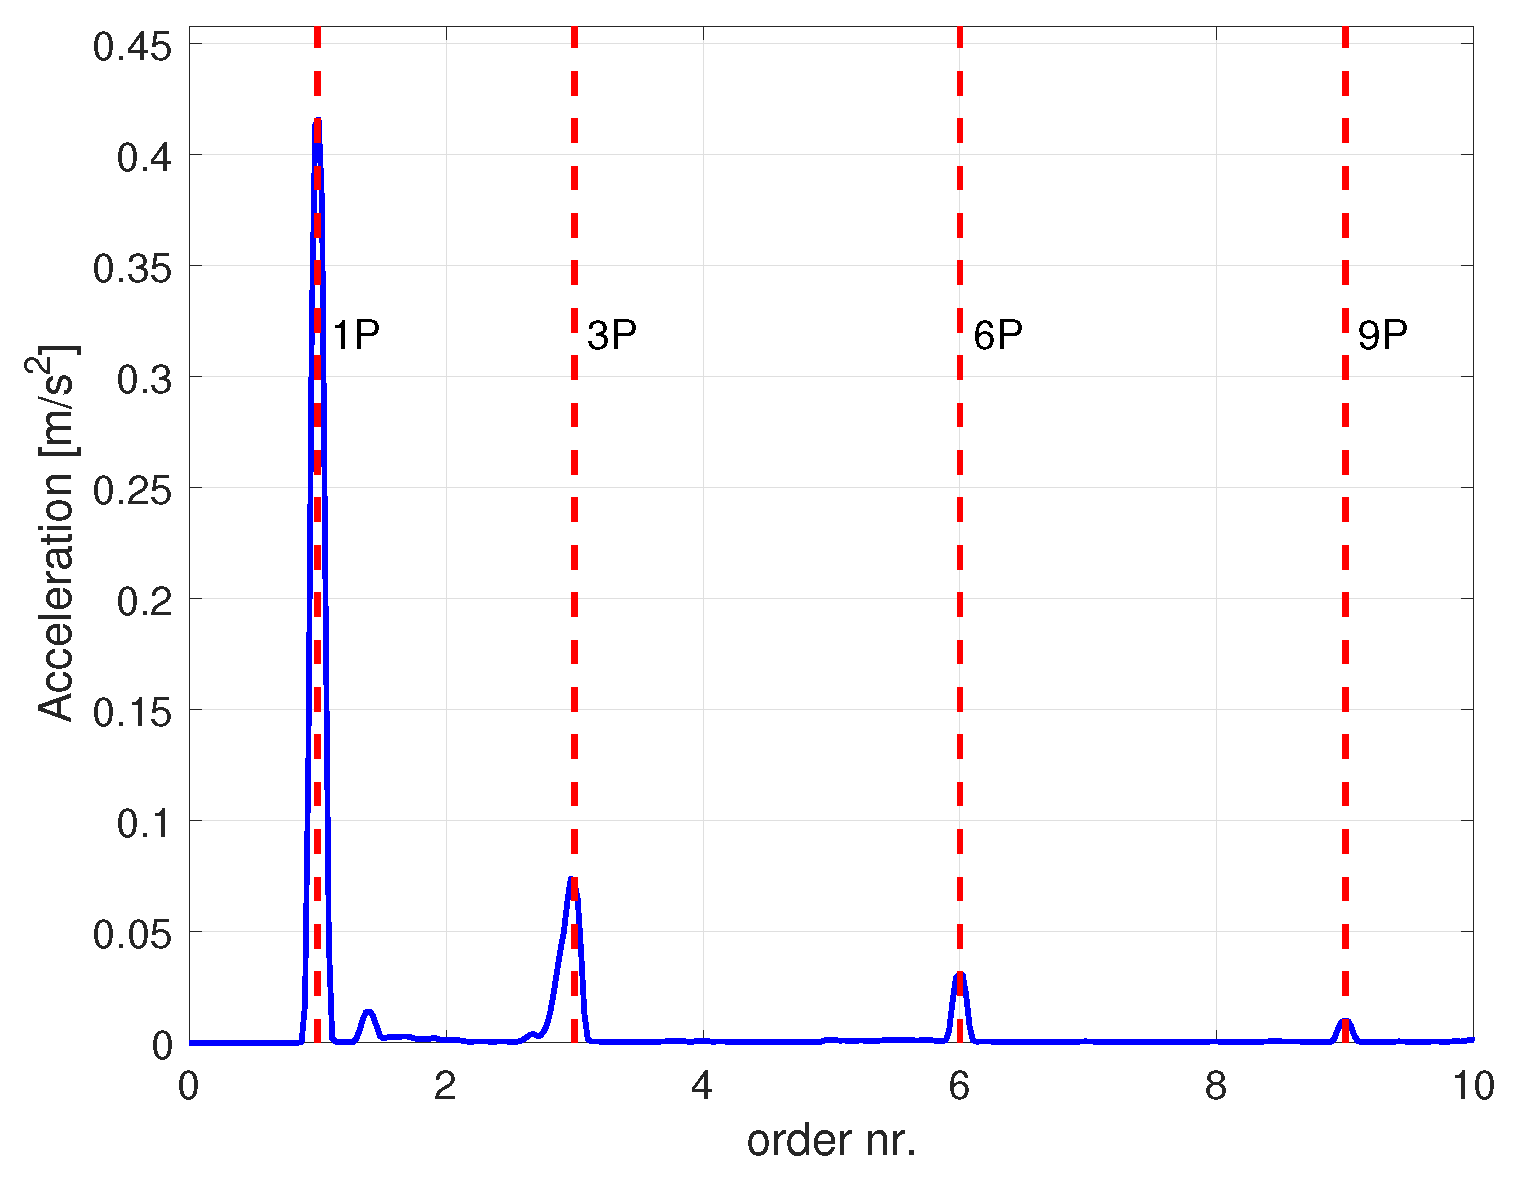
Figure 15.
Comparison of measured acceleration on tower in Y direction against the amplitude of acceleration predicted by the mass unbalance model.
Figure 15.
Comparison of measured acceleration on tower in Y direction against the amplitude of acceleration predicted by the mass unbalance model.

Figure 16.
Comparison of measured acceleration on tower in Y direction, band-passed around the 1P frequency, against the amplitude of the acceleration predicted by the unbalanced mass model.
Figure 16.
Comparison of measured acceleration on tower in Y direction, band-passed around the 1P frequency, against the amplitude of the acceleration predicted by the unbalanced mass model.
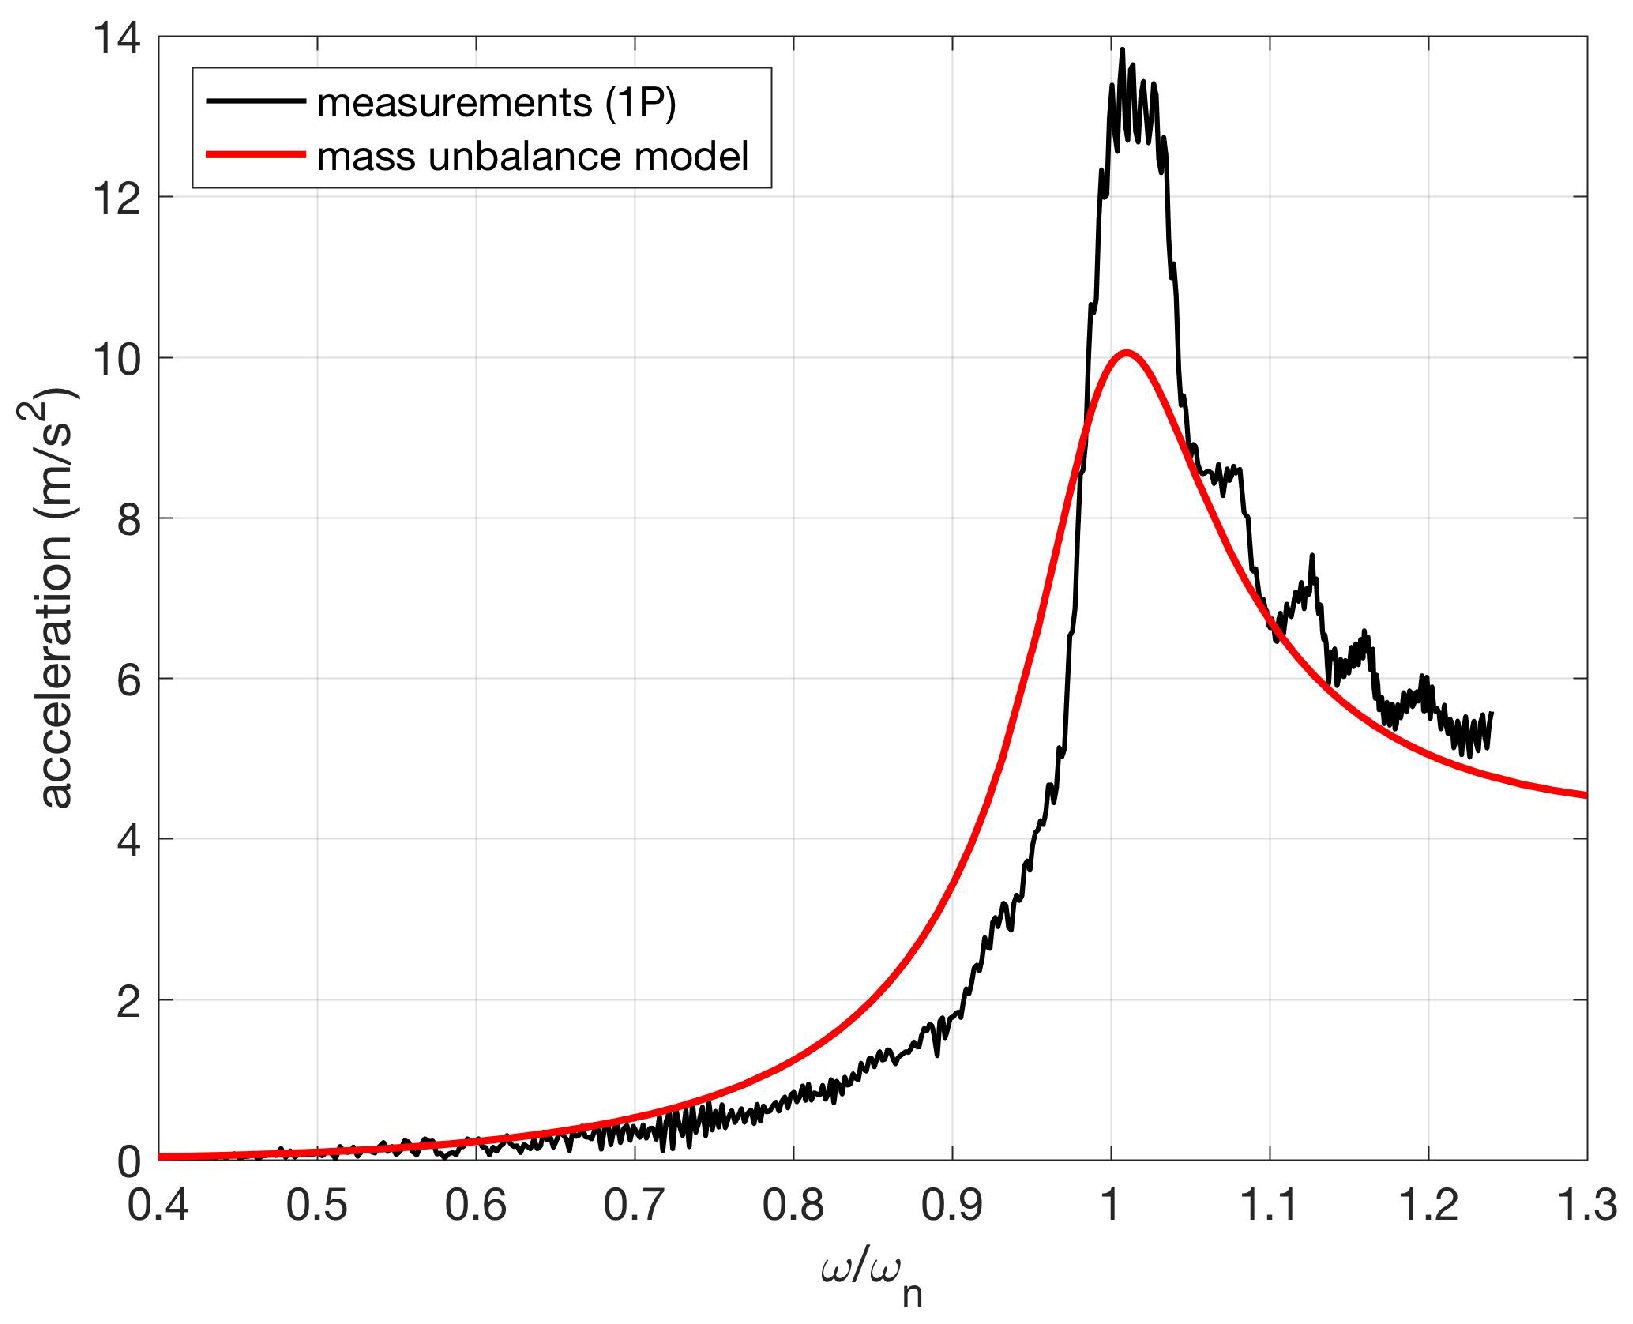
Figure 17.
Waterfall of vibration of the tail fin in the Y direction.
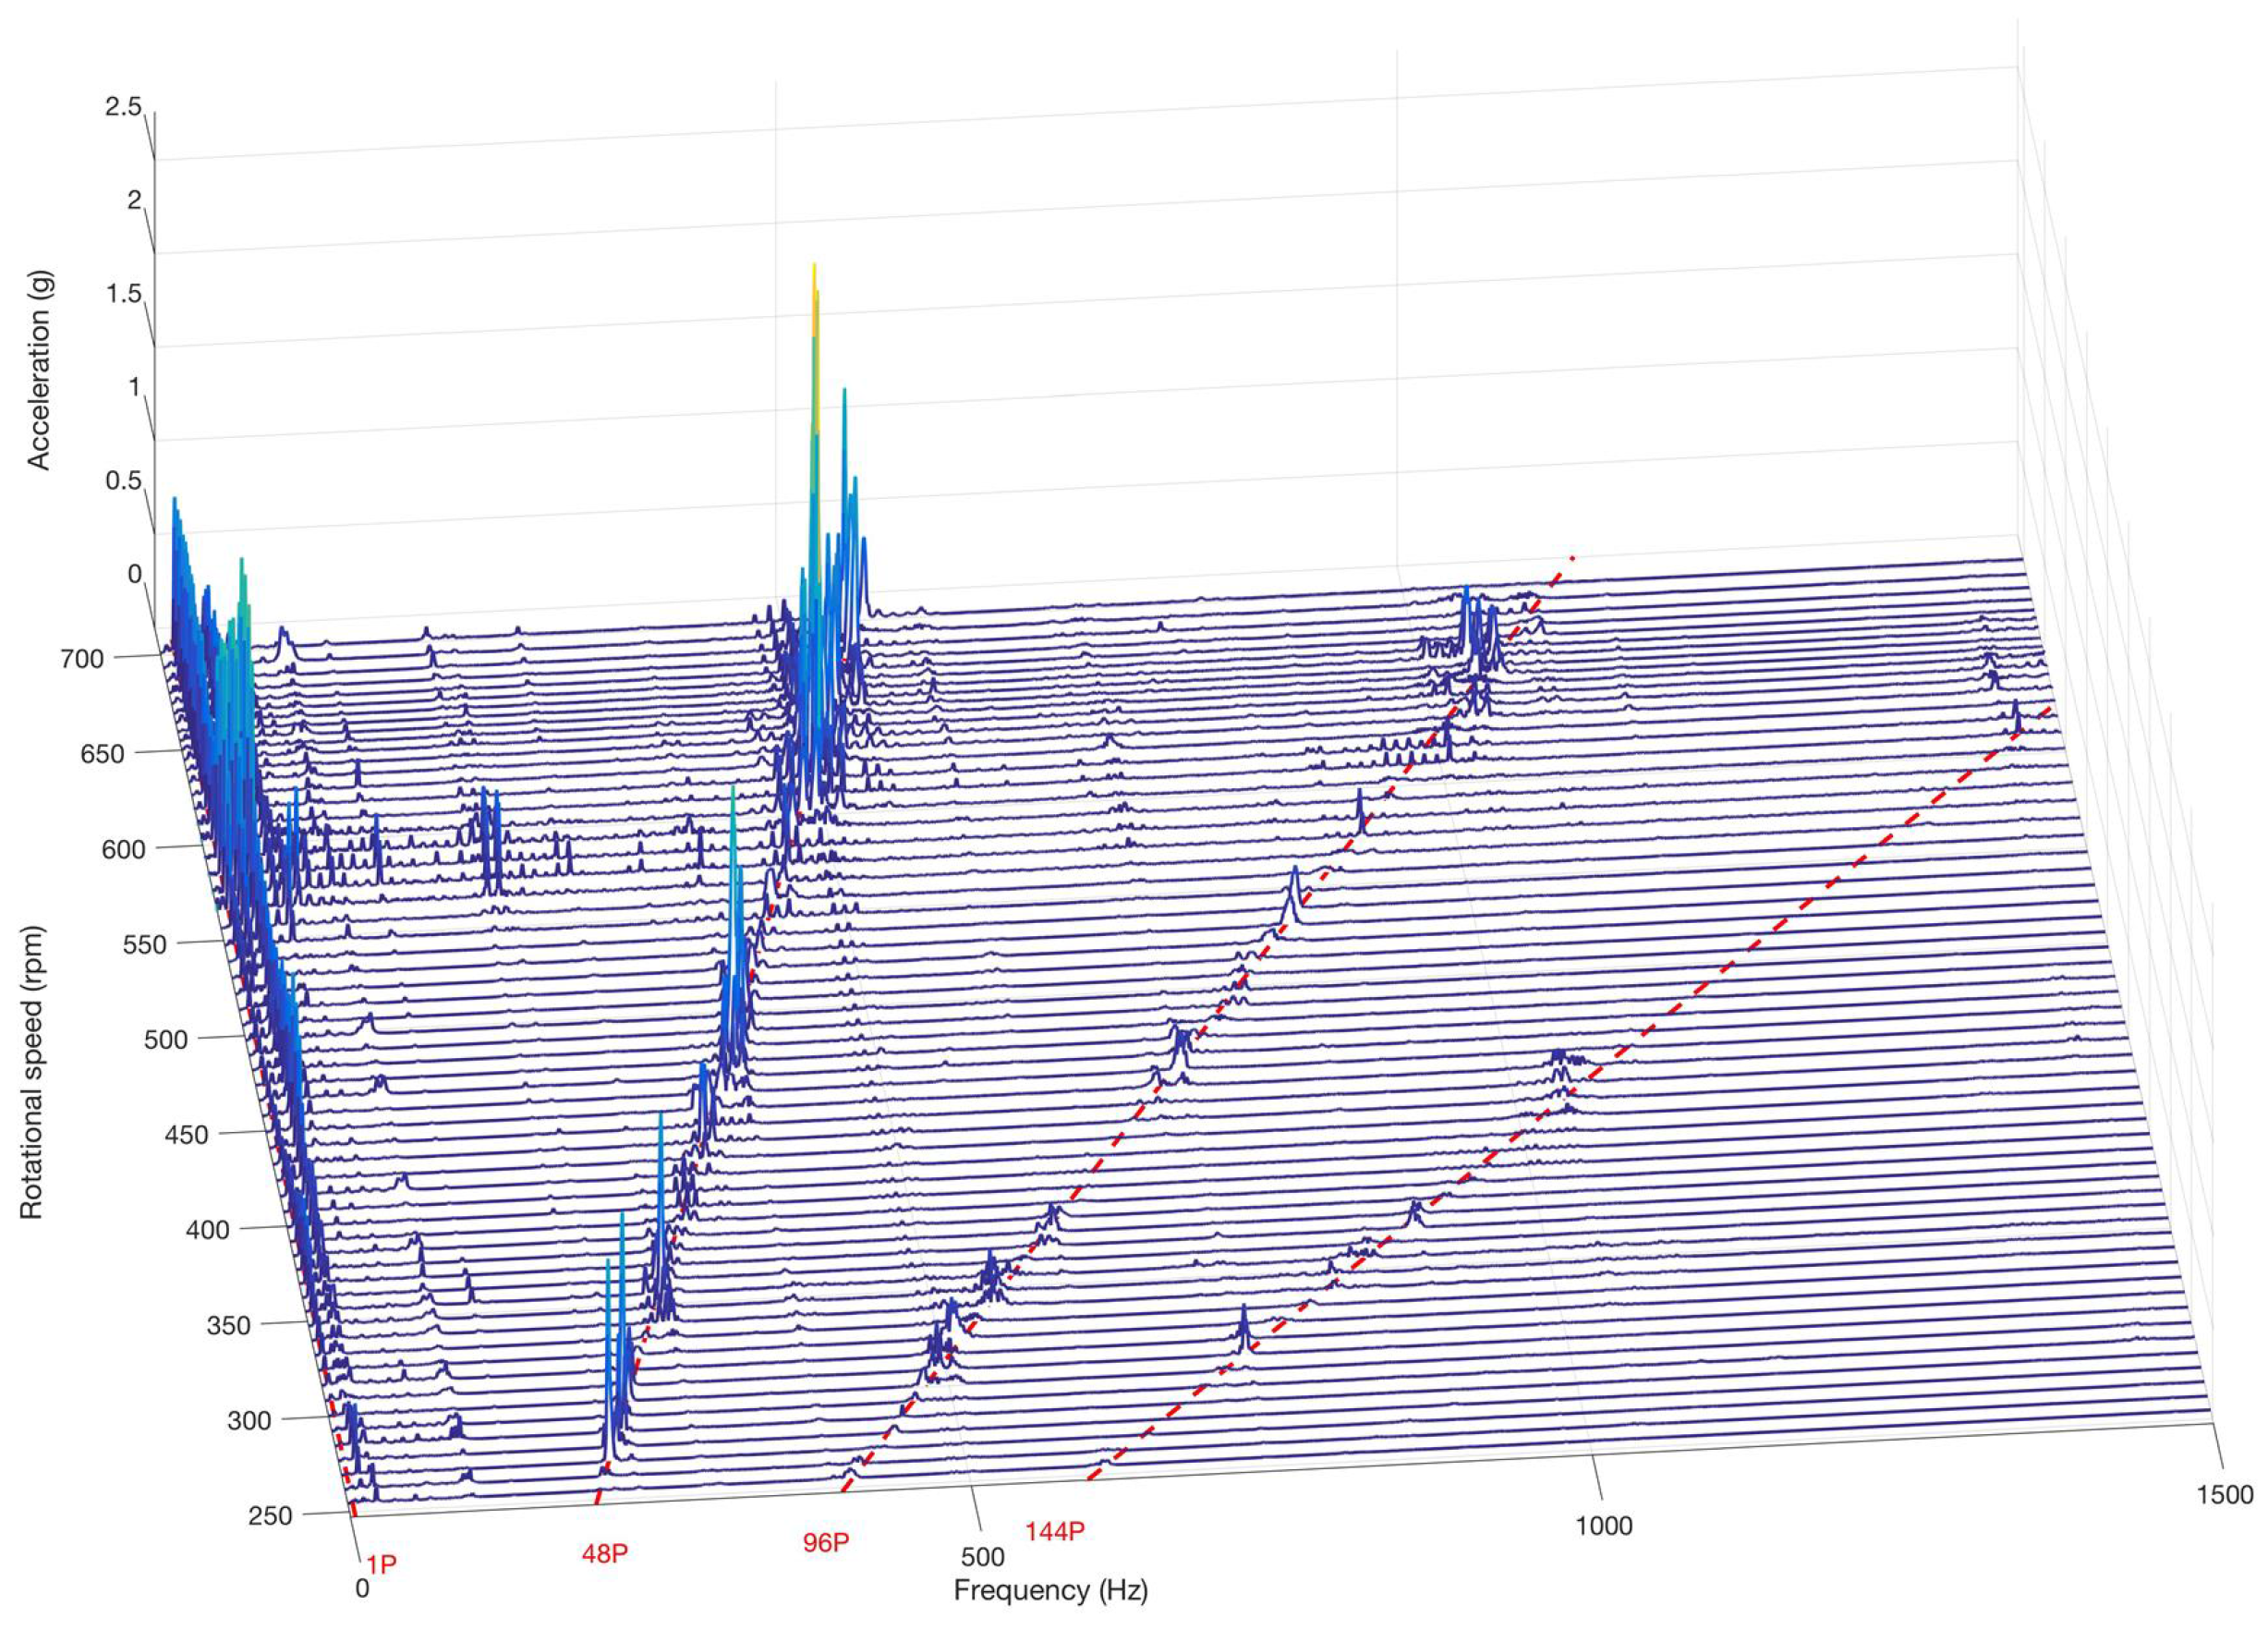
Figure 18.
Order of vibration of the tail fin in the Y direction.
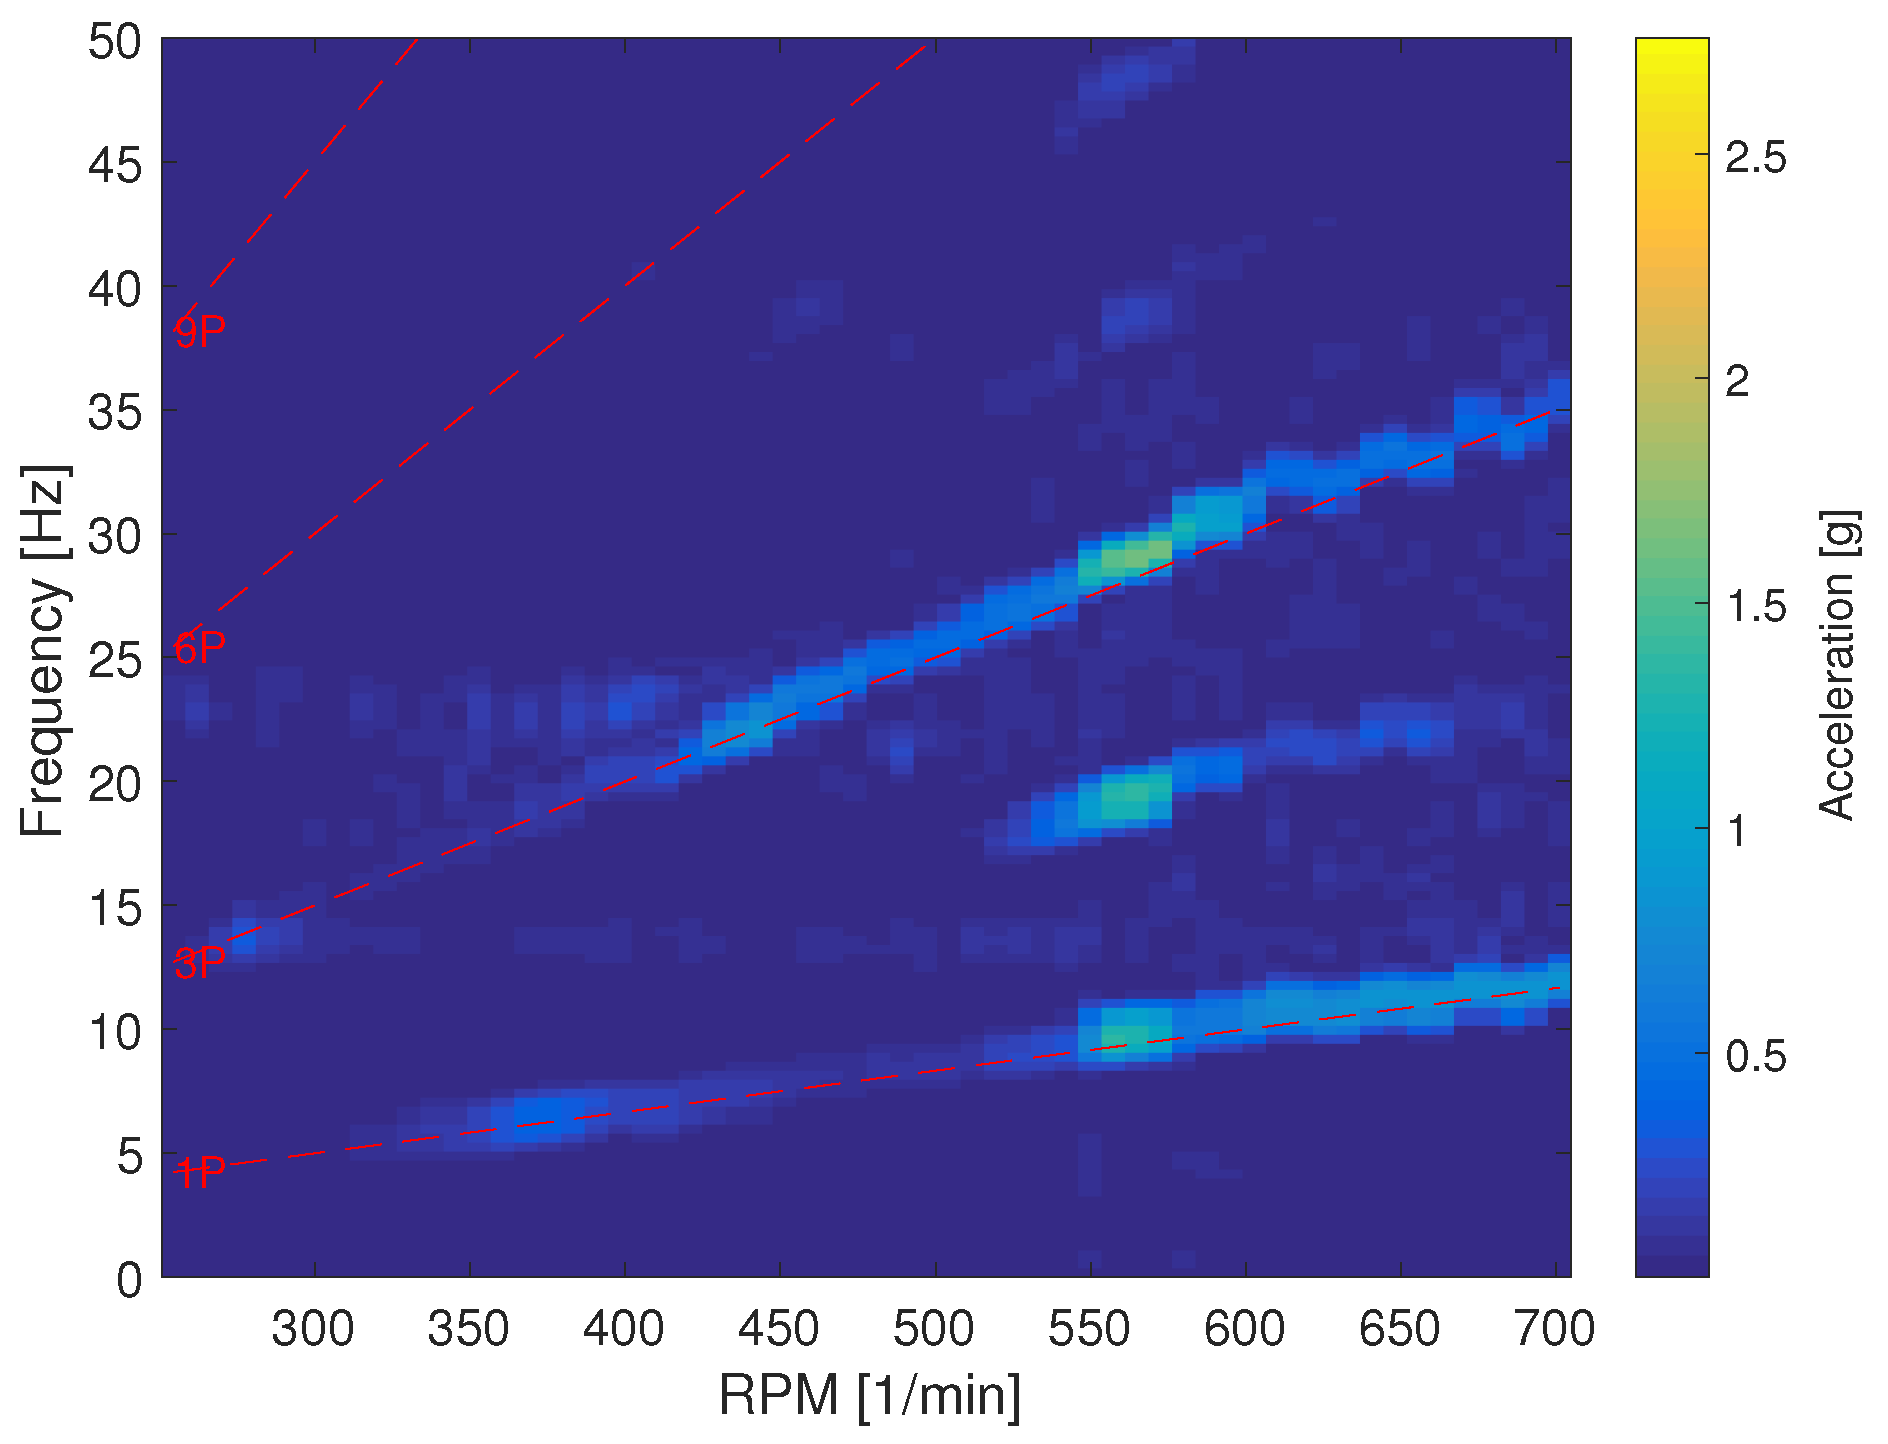
Figure 19.
Waterfall of vibration of the tail fin in the Y direction under the ramp wind time series.
Figure 19.
Waterfall of vibration of the tail fin in the Y direction under the ramp wind time series.
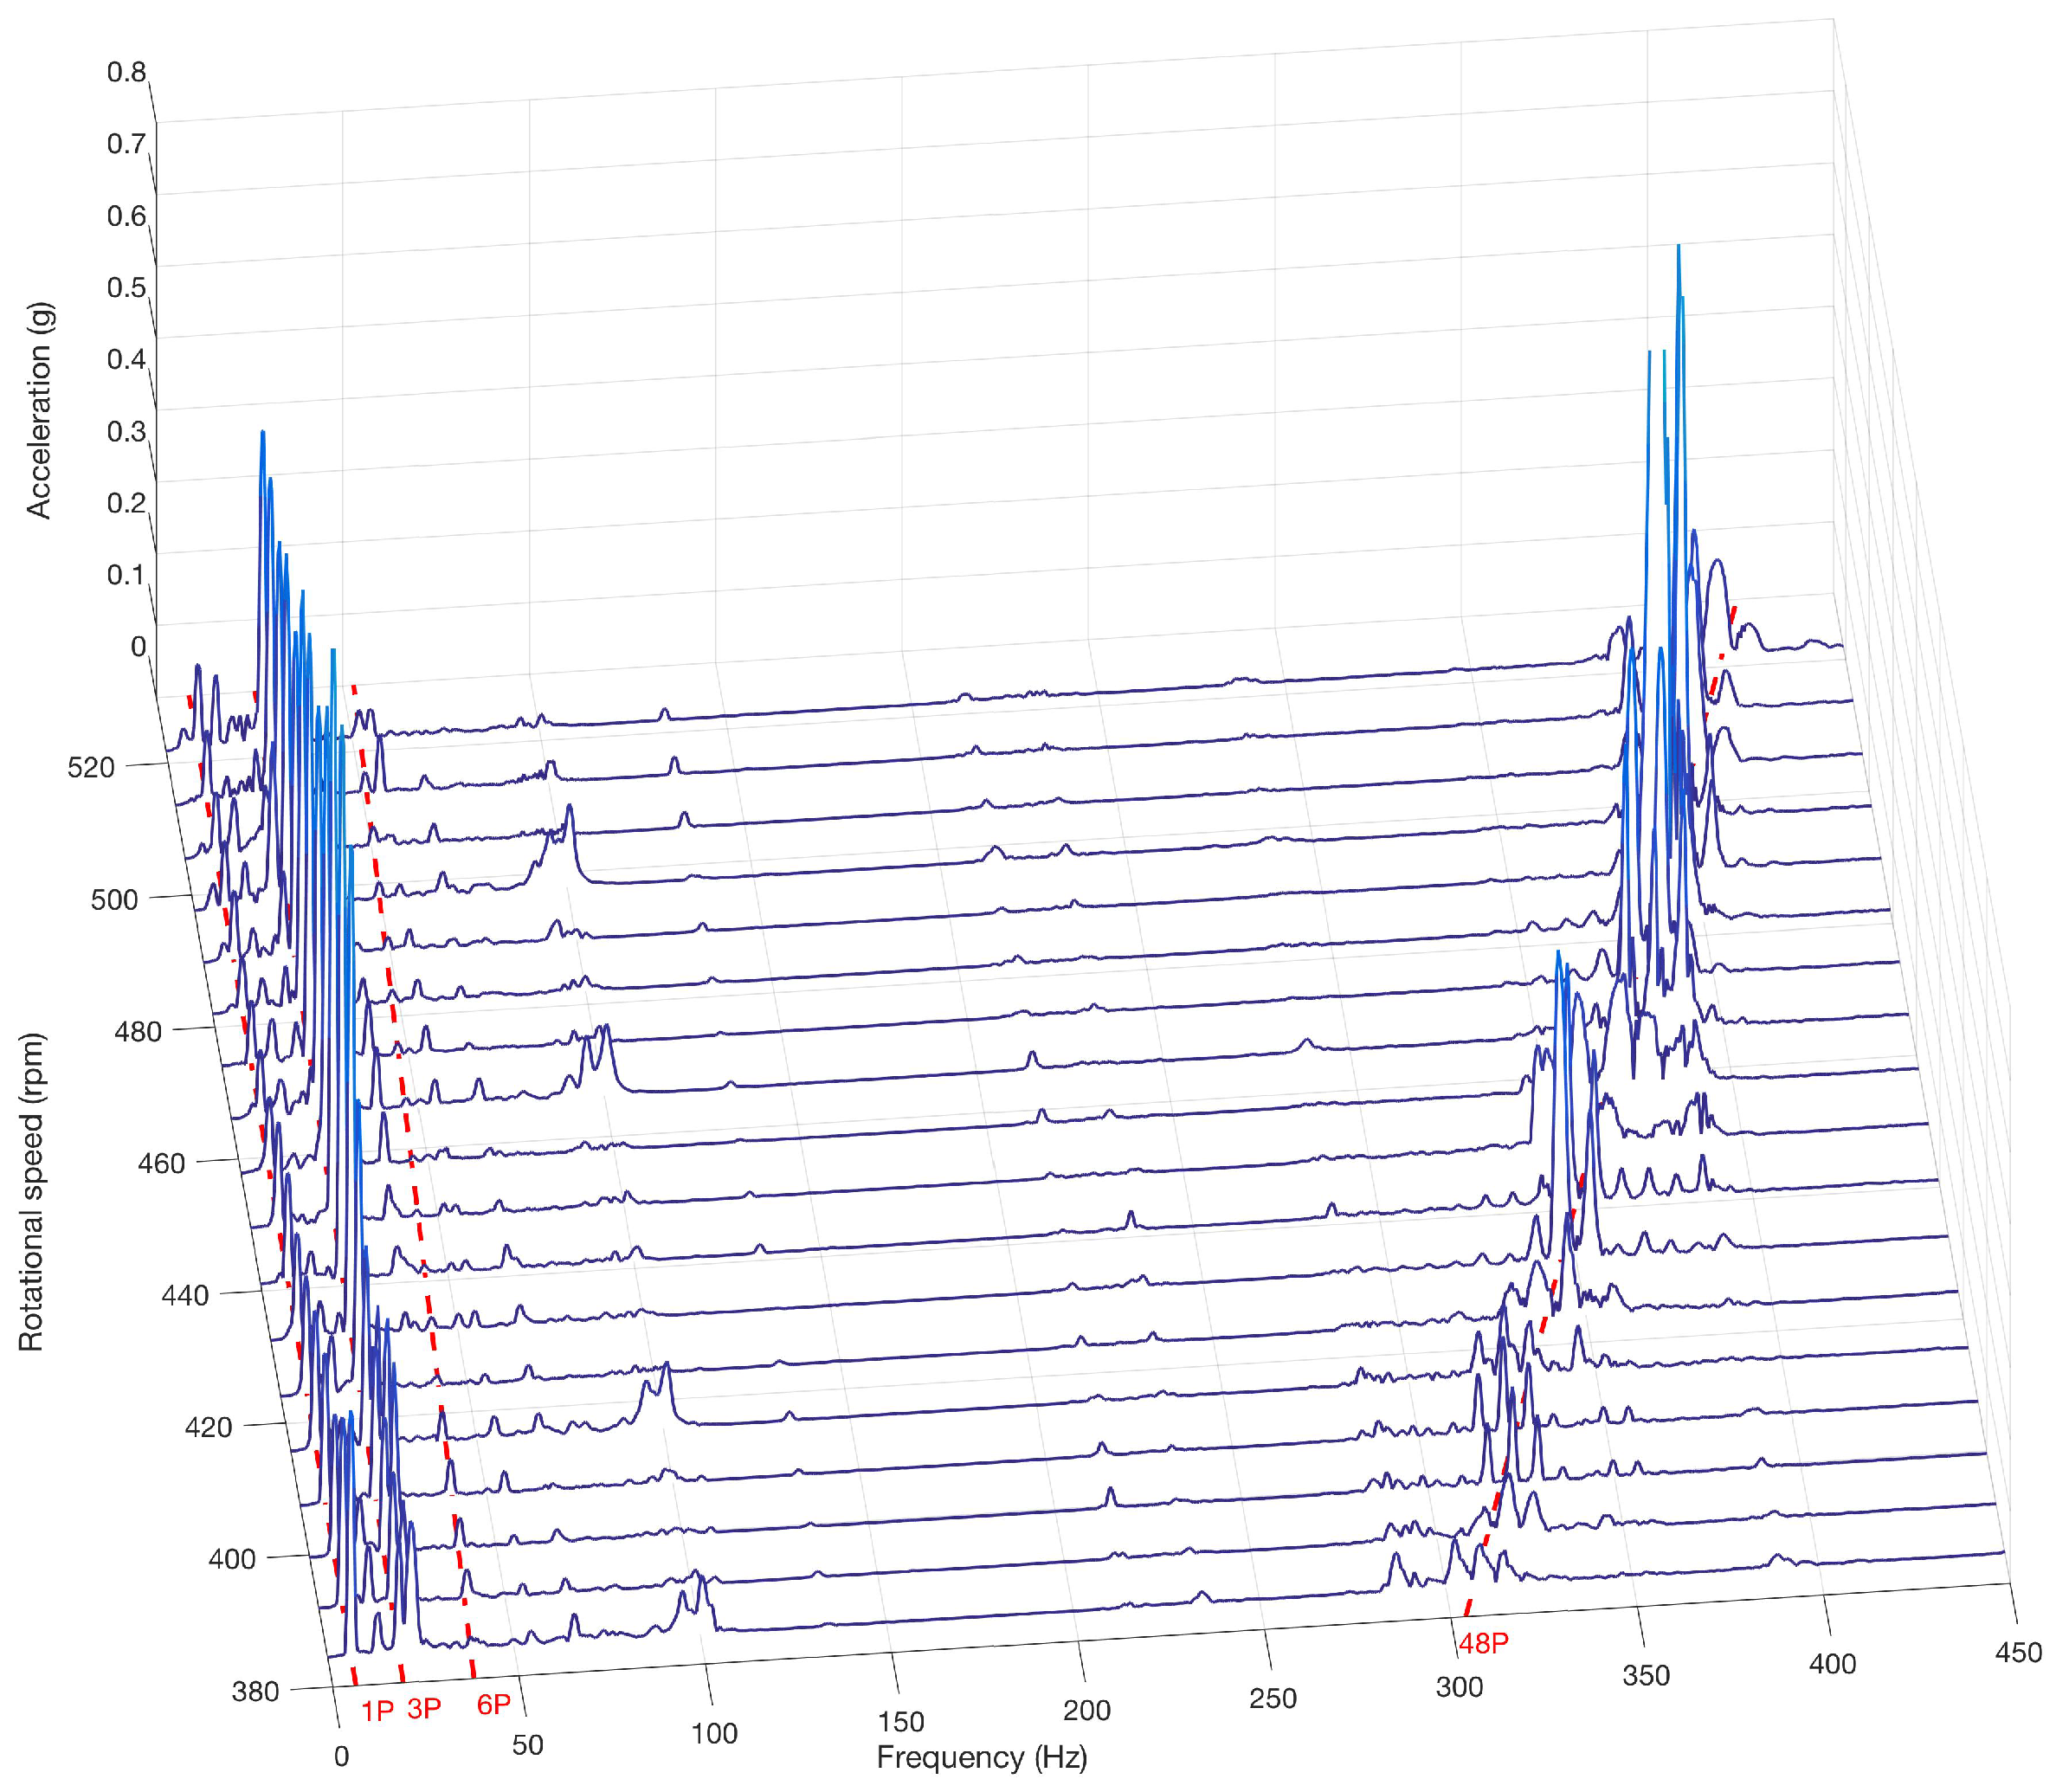
Figure 20.
Waterfall of vibration of the tail fin in the Y direction under the oscillatory wind time series.
Figure 20.
Waterfall of vibration of the tail fin in the Y direction under the oscillatory wind time series.


Table 1.
Dimensions of the system, according to Figure 5.
Table 1.
Dimensions of the system, according to Figure 5.
| Quantity | Dimensions (m) |
|---|---|
| 1.00 | |
| 0.98 | |
| 0.55 | |
| 0.13 | |
| 0.20 |
© 2018 by the authors. Licensee MDPI, Basel, Switzerland. This article is an open access article distributed under the terms and conditions of the Creative Commons Attribution (CC BY) license (http://creativecommons.org/licenses/by/4.0/).
Share and Cite
MDPI and ACS Style
Castellani, F.; Astolfi, D.; Becchetti, M.; Berno, F.; Cianetti, F.; Cetrini, A. Experimental and Numerical Vibrational Analysis of a Horizontal-Axis Micro-Wind Turbine. Energies 2018, 11, 456. https://doi.org/10.3390/en11020456
AMA Style
Castellani F, Astolfi D, Becchetti M, Berno F, Cianetti F, Cetrini A. Experimental and Numerical Vibrational Analysis of a Horizontal-Axis Micro-Wind Turbine. Energies. 2018; 11(2):456. https://doi.org/10.3390/en11020456
Chicago/Turabian StyleCastellani, Francesco, Davide Astolfi, Matteo Becchetti, Francesco Berno, Filippo Cianetti, and Alessandro Cetrini. 2018. "Experimental and Numerical Vibrational Analysis of a Horizontal-Axis Micro-Wind Turbine" Energies 11, no. 2: 456. https://doi.org/10.3390/en11020456
Note that from the first issue of 2016, this journal uses article numbers instead of page numbers. See further details here.