1. Introduction
The potential risk of the energy crisis and global warming are driving the integration and the utilization of new types of energy [
1,
2]. Photovoltaic (PV) generation and electric vehicles (EVs) have spread rapidly because they are expected to help address the aforementioned risks. However, the intermittency of the PV output could cause a large fluctuation of the voltage, especially in the distribution grid [
3,
4,
5]. Therefore, as PV generation spreads in the grid, the power grid is more likely to require reinforcement [
6,
7] and reduced efficiency of conventional power generation sources such as thermal power units. On the other hand, as EVs spread in the grid, the randomness and the intermittency of the EV charging load could also cause large fluctuations of the voltage in the distribution grid. In addition, the large scale integration of EV charging loads will change the shape of the daily load curve in the distribution grid, which may lead to large impacts on the distribution grid operation [
8,
9]. Reinforcement of the distribution grid could be a solid way to resolve the aforementioned technical issues, but any countermeasures could require the restructuring of the distribution grid as well as the installation of additional equipment, which requires huge work and investment. If the PV output could be used for charging the EV batteries, the above technical issues might be partially resolved [
10,
11] and EV owners might also eventually be able to charge their EV batteries without constraints.
The concept of the PV/solar powered charging station has been proposed before. In [
12], an optimal charging strategy in the PV powered charging station for EVs in the urban areas was designed. Reference [
13] introduced methods for designing a solar powered EV charging station considering restrictions in the placement and the orientation of the entire facility. Reference [
14] proposed a PV powered charging station architecture using a combination of the Z-source boost converter and developed s battery charging strategy with a bi-directional Pulse Width Modulation (PWM) inverter-rectifier based on the Vehicle to Grid (V2G) concept in smart grids. A comprehensive concept of the solar powered charging station for EVs—the infrastructures, the urban air quality, the economics and the sustainable development, etc.—was illustrated in [
15].
The operation and planning of EV charging stations have also been studied around the world [
16,
17,
18,
19]. With the consideration of PV generation, the operation and planning of EV charging stations has also changed. Reference [
20] proposed a scenario optimization-based algorithm to allocate the charging stations for plug-in EVs in a commercial area, aiming at increasing the PV panels as well as decreasing the side effects of EV charging loads. Reference [
21] proposed an autonomous energy management strategy for the solid state transformers in PV-assisted charging stations. The utilization of PV systems for EV charging was analyzed and the capacity and the performance of the supportive storage devices evaluated in a statistical manner using long period observations in [
22].
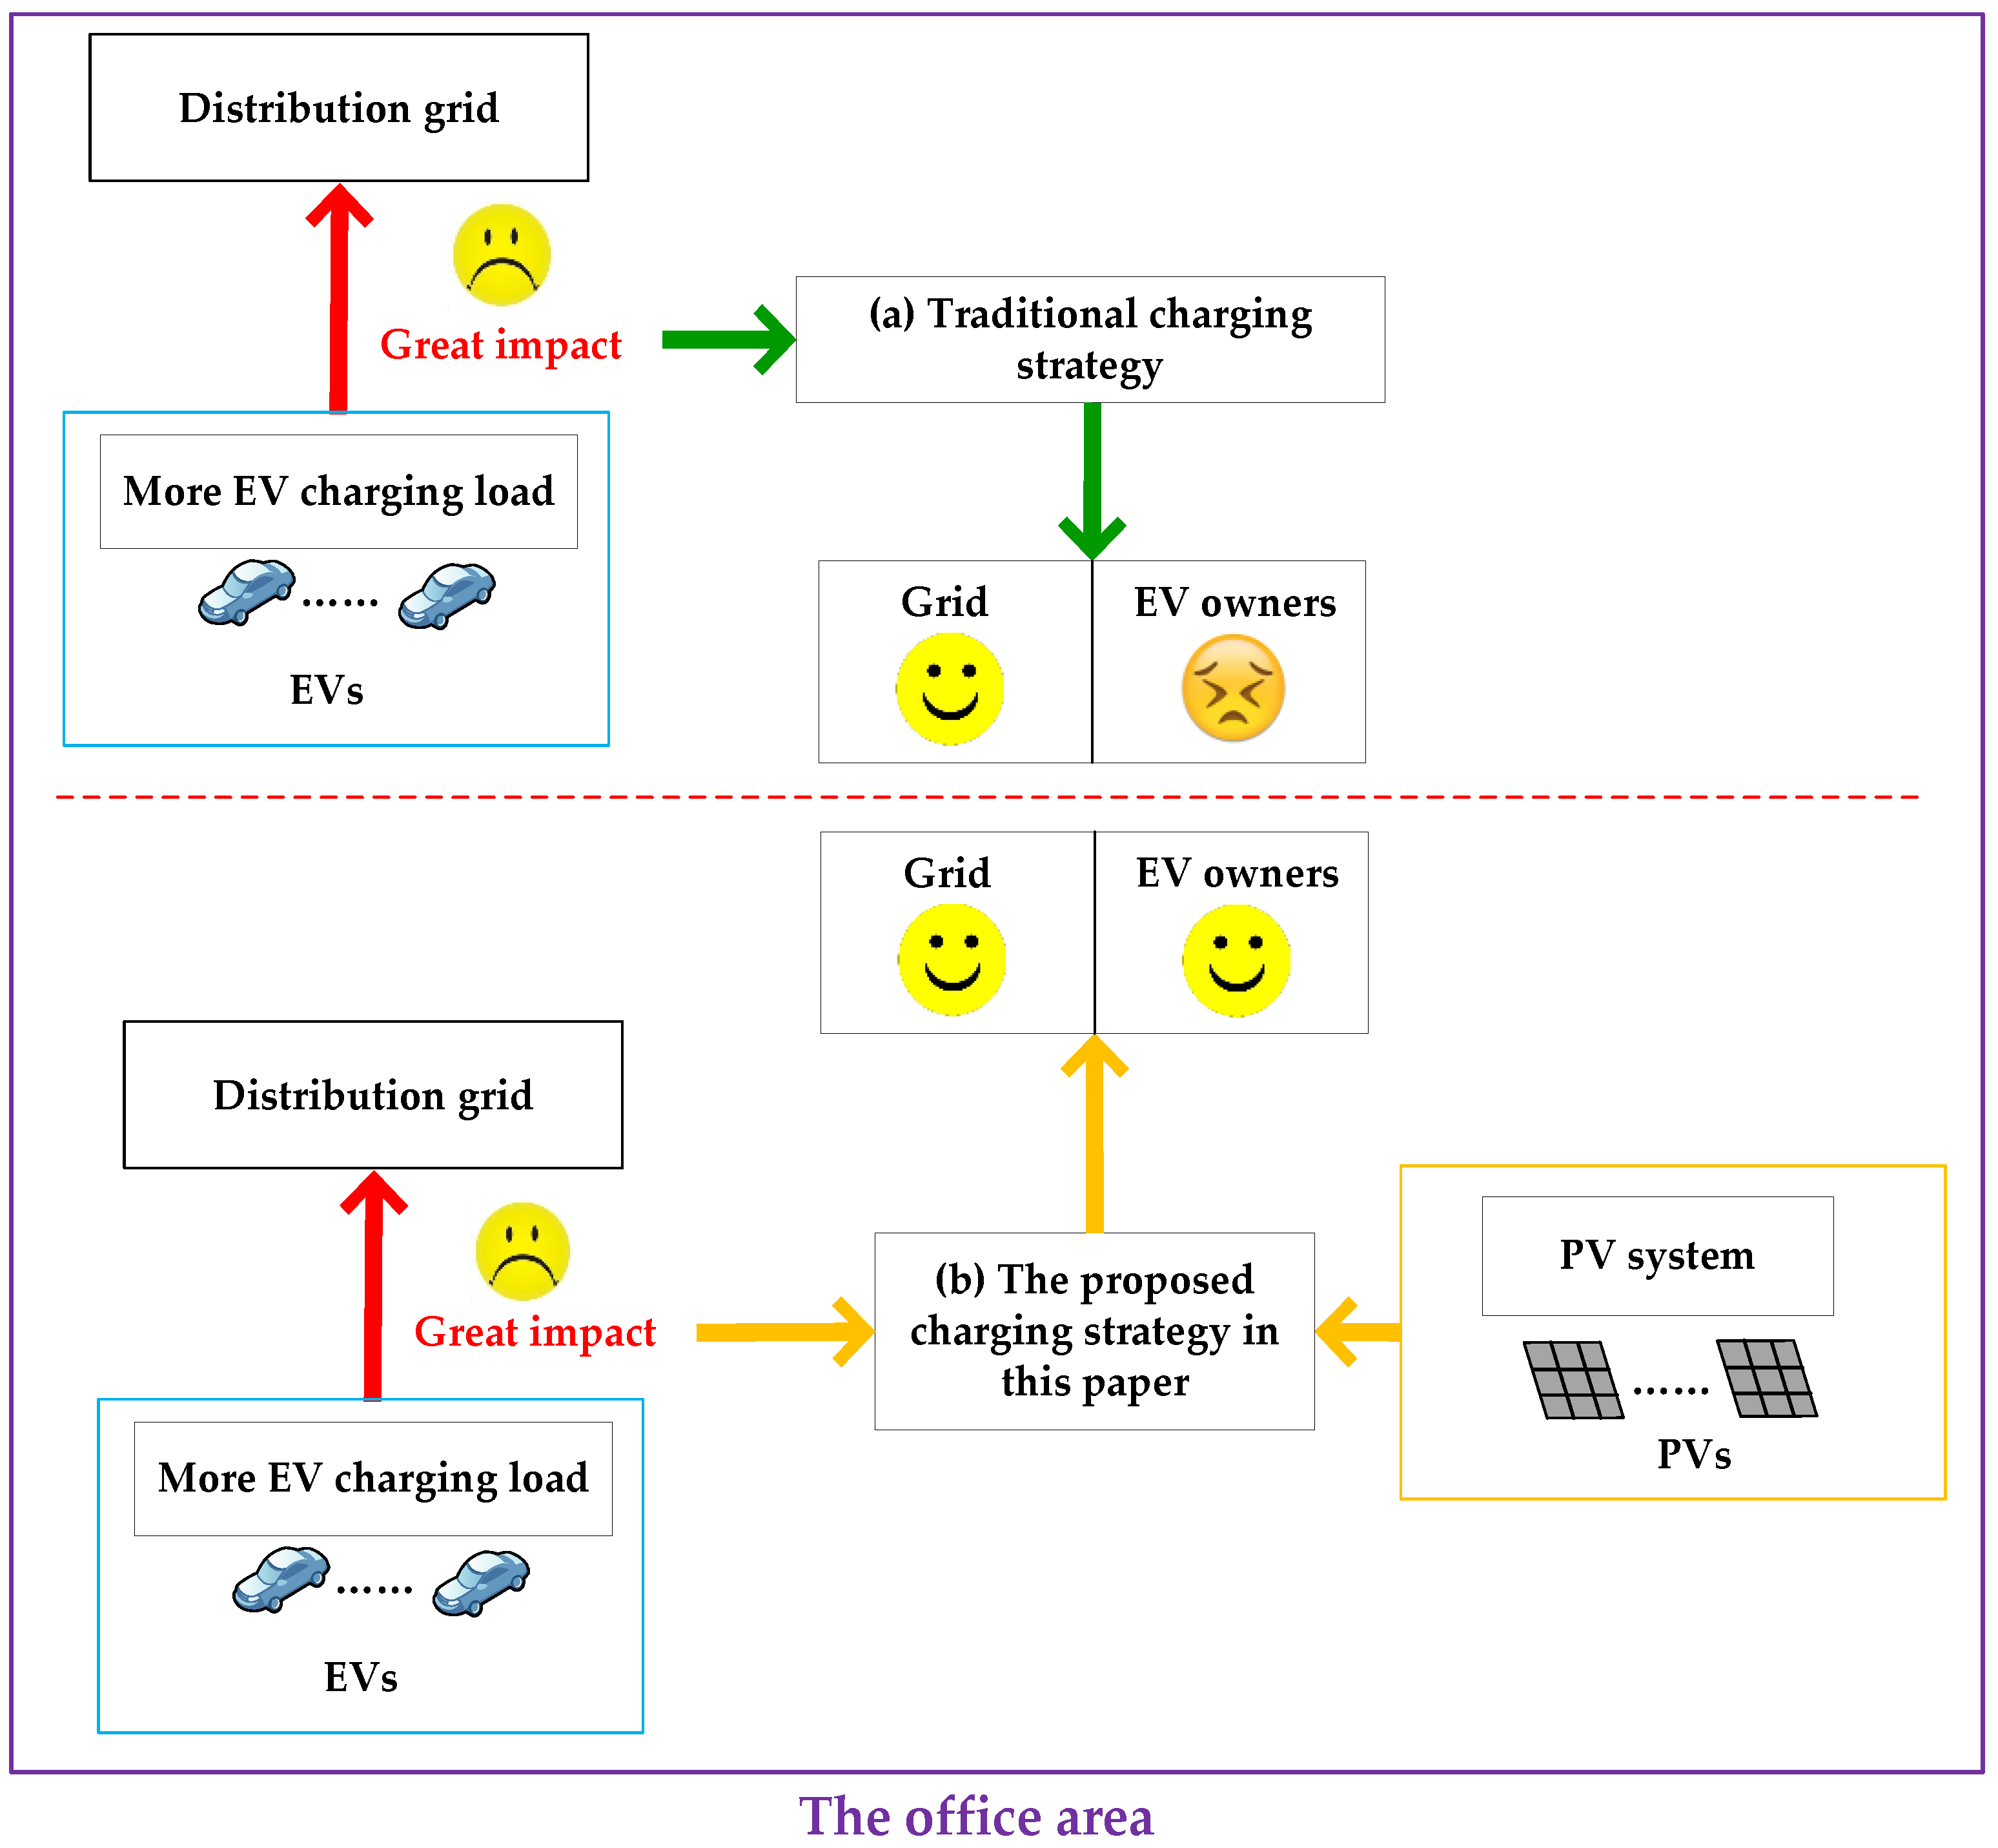
However, previous studies on PV powered charging stations mainly focus on the distribution grid side, which is more likely to disallow EV owners’ unconstrained charging behavior and to result in inconveniences to the EV owners in the case of EV charging. In fact, PVs in the PV powered charging station can be treated as “a special source of compensation” for the unconstrained EV charging load. In addition, there may be no need to add any other new equipment which will increase the investment cost.
Similarly, PVs at the workplace in major Chinese cities could have the capability to compensate the EV charging load regardless of the way EV batteries are charged. In light of this point, an EV owner-friendly charging strategy using PVs is proposed in order to let more EV owners charge their EV batteries without any constraints and to alleviate the negative impact of the EV charging load on the grid.
Firstly, a model of the unconstrained EV charging load and characteristics of the PV output under different weather conditions are analyzed. Then, the number of EVs with unconstrained EV charging, which maximizes the overlapping area between the PV output curve and the load curve of the unconstrained EV charging is derived. Hereinafter this number is called “quantity bound”.
If the actual number of EVs at the workplace is smaller than the aforementioned quantity bound, all the EV owners can charge their EV batteries without any constraints. If the actual number of EVs at the workplace is larger than the aforementioned quantity bound, a portion of the EV owners have to charge their EV batteries only from the grid. In such a case, the line loss becomes the optimization objective and the charging state of this part of EVs is regulated within the parking duration and the charging demand.
Finally, a case study is performed to verify the performance of the proposed EV owner-friendly charging strategy. The economic advantage of selling the PV production to EV owners instead of the office load users is also discussed in the case study.
2. Problem Formulation
The large amount of the EV charging load will have a significant impact on the distribution grid operation. In order to mitigate this impact, some countermeasures such as increases in the transformer capacity need to be implemented. This, however, requires a large investment.
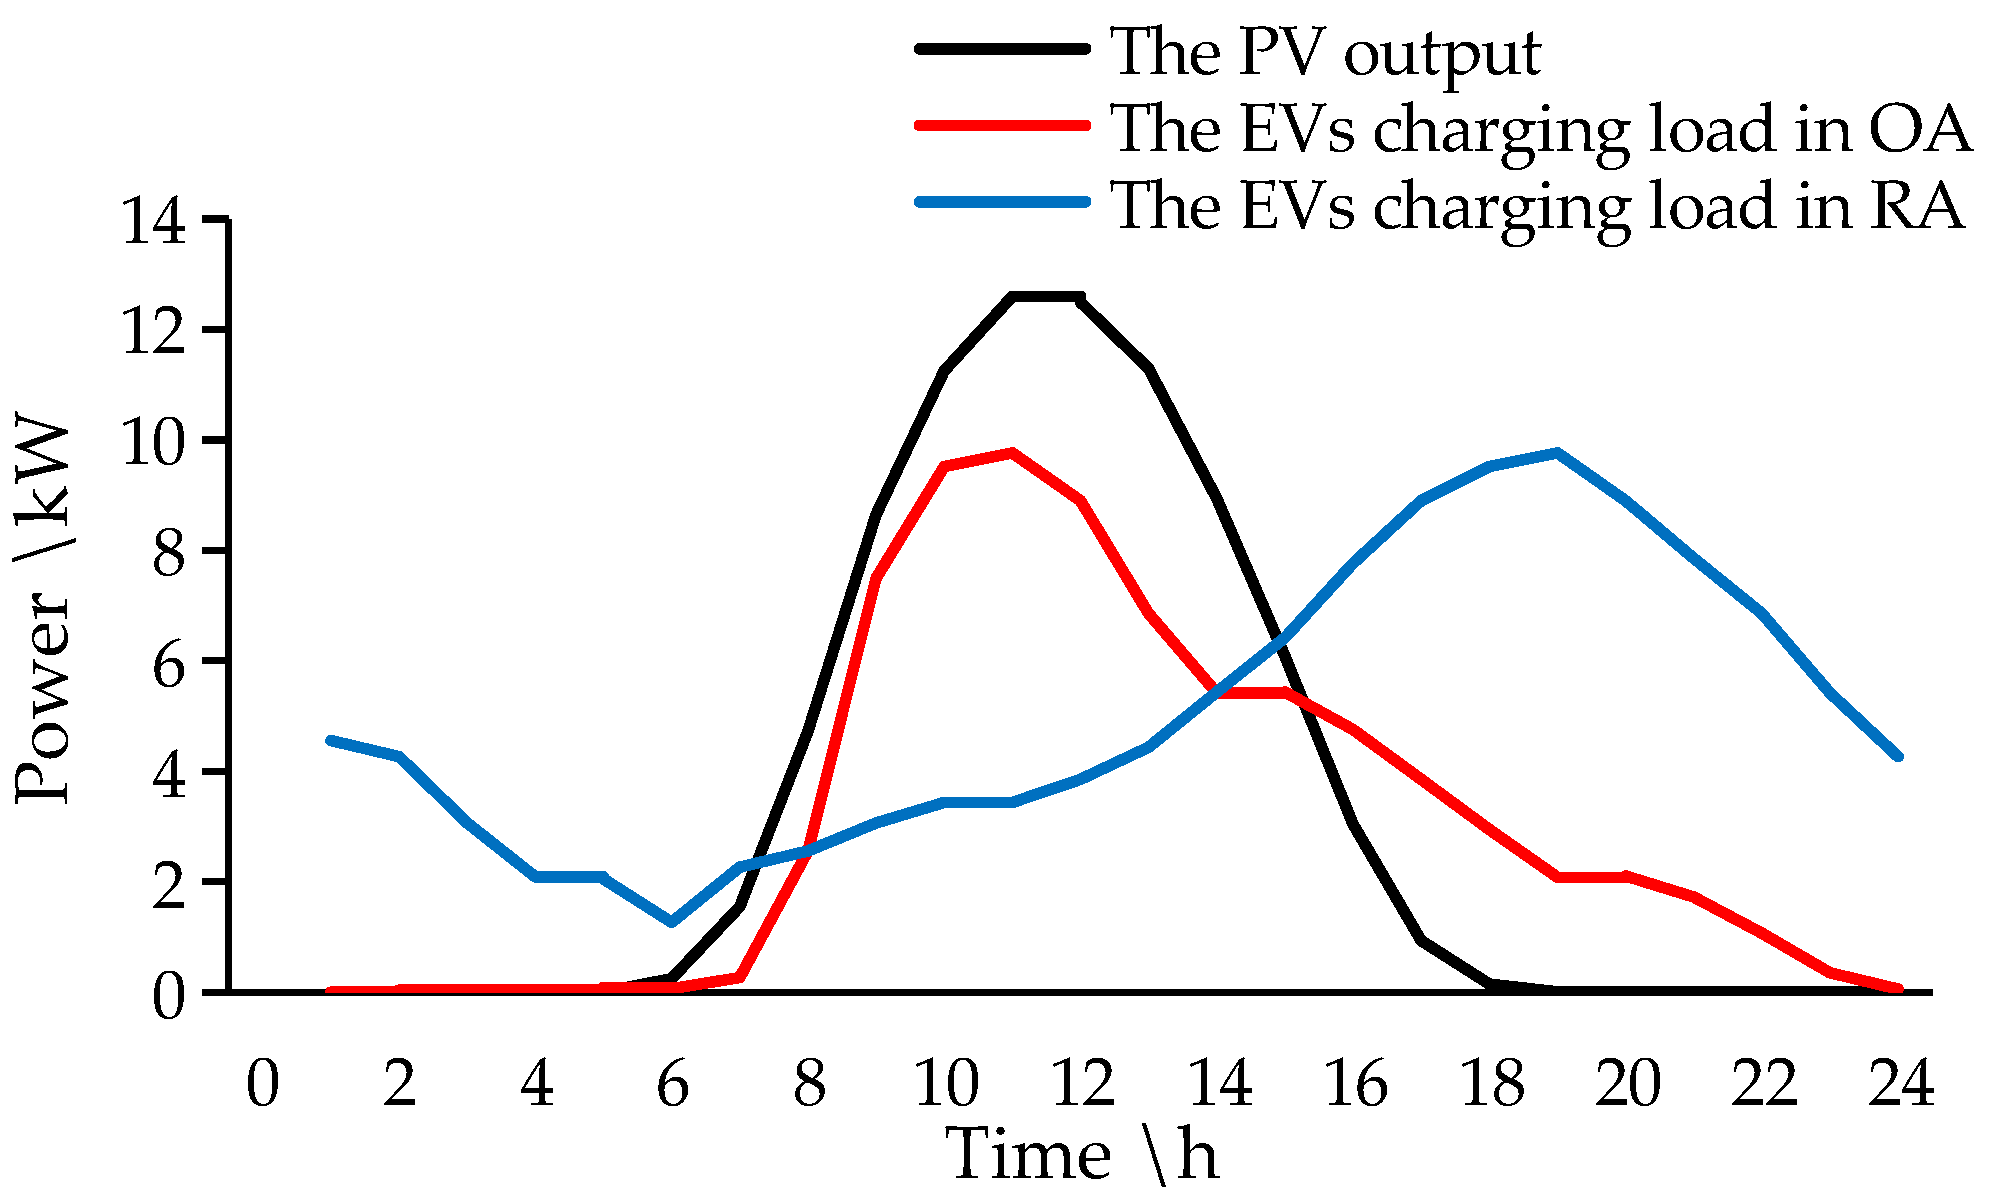
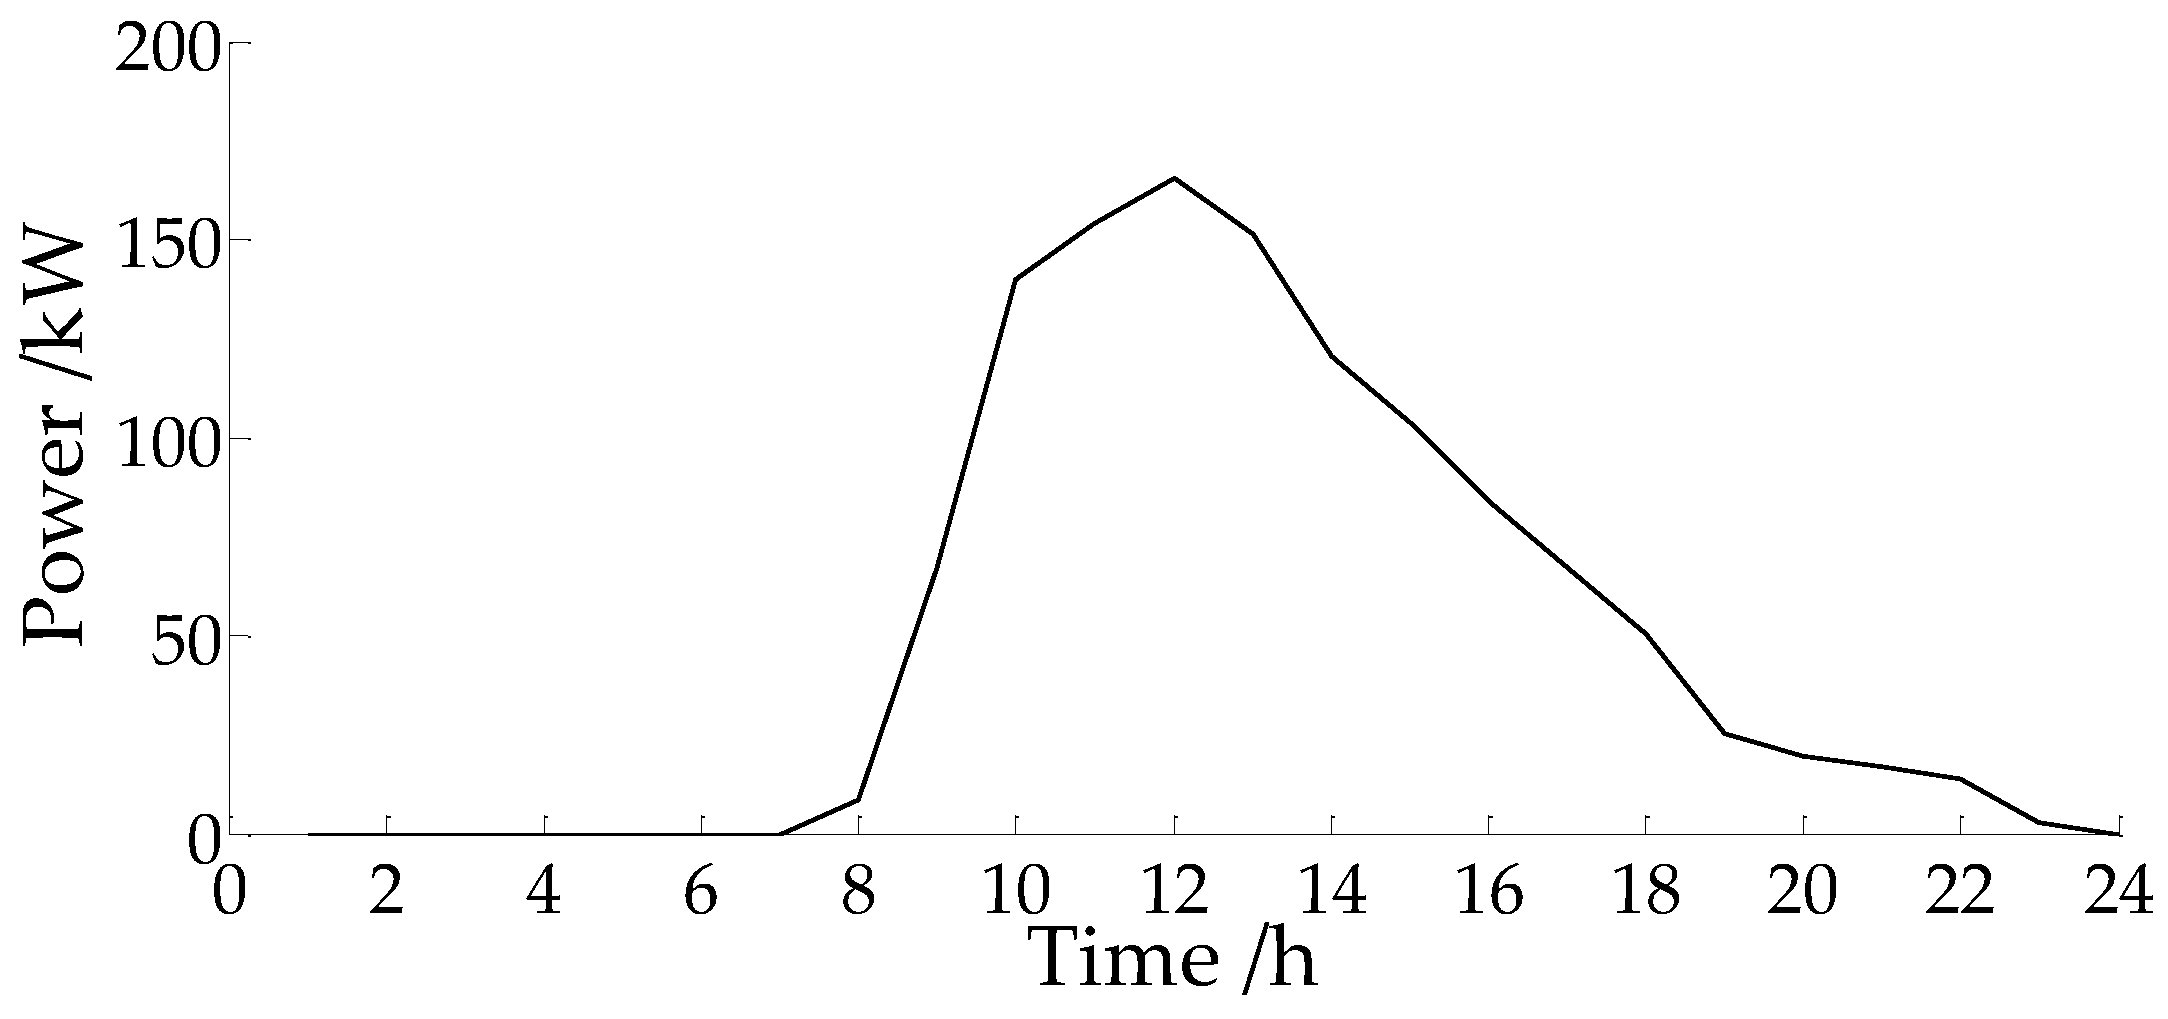
The largest PV output is observed at noon due to the fact the strongest solar radiation occurs at this time of day [
22], and the daily load curve of the EV charging load also varies from one region to another. For example, the EV charging loads in residential areas (RAs) are mainly distributed in the afternoon and evening range [
23]. On the other hand, because the working hours of EV owners are typically from 7:00 to 18:00, the daily load curve of EV charging loads in office areas (OAs) is concentrated during the daytime [
24]. Schematic diagrams of the PV output and the EV charging load in different areas are shown in
Figure 1.
EVs have been actively used mainly in the urban areas in China. In major Chinese cities, private parking space is quite limited due to the high population density [
25]. Therefore, most EV owners have to charge their EV batteries at their workplace during their working hours [
25].
As shown in
Figure 1, both the peak of the daily EV charging load at the workplace and the peak of the PV output are all observed at around noon. Therefore, the PV output could have the ability to compensate the EV charging load at the workplace.
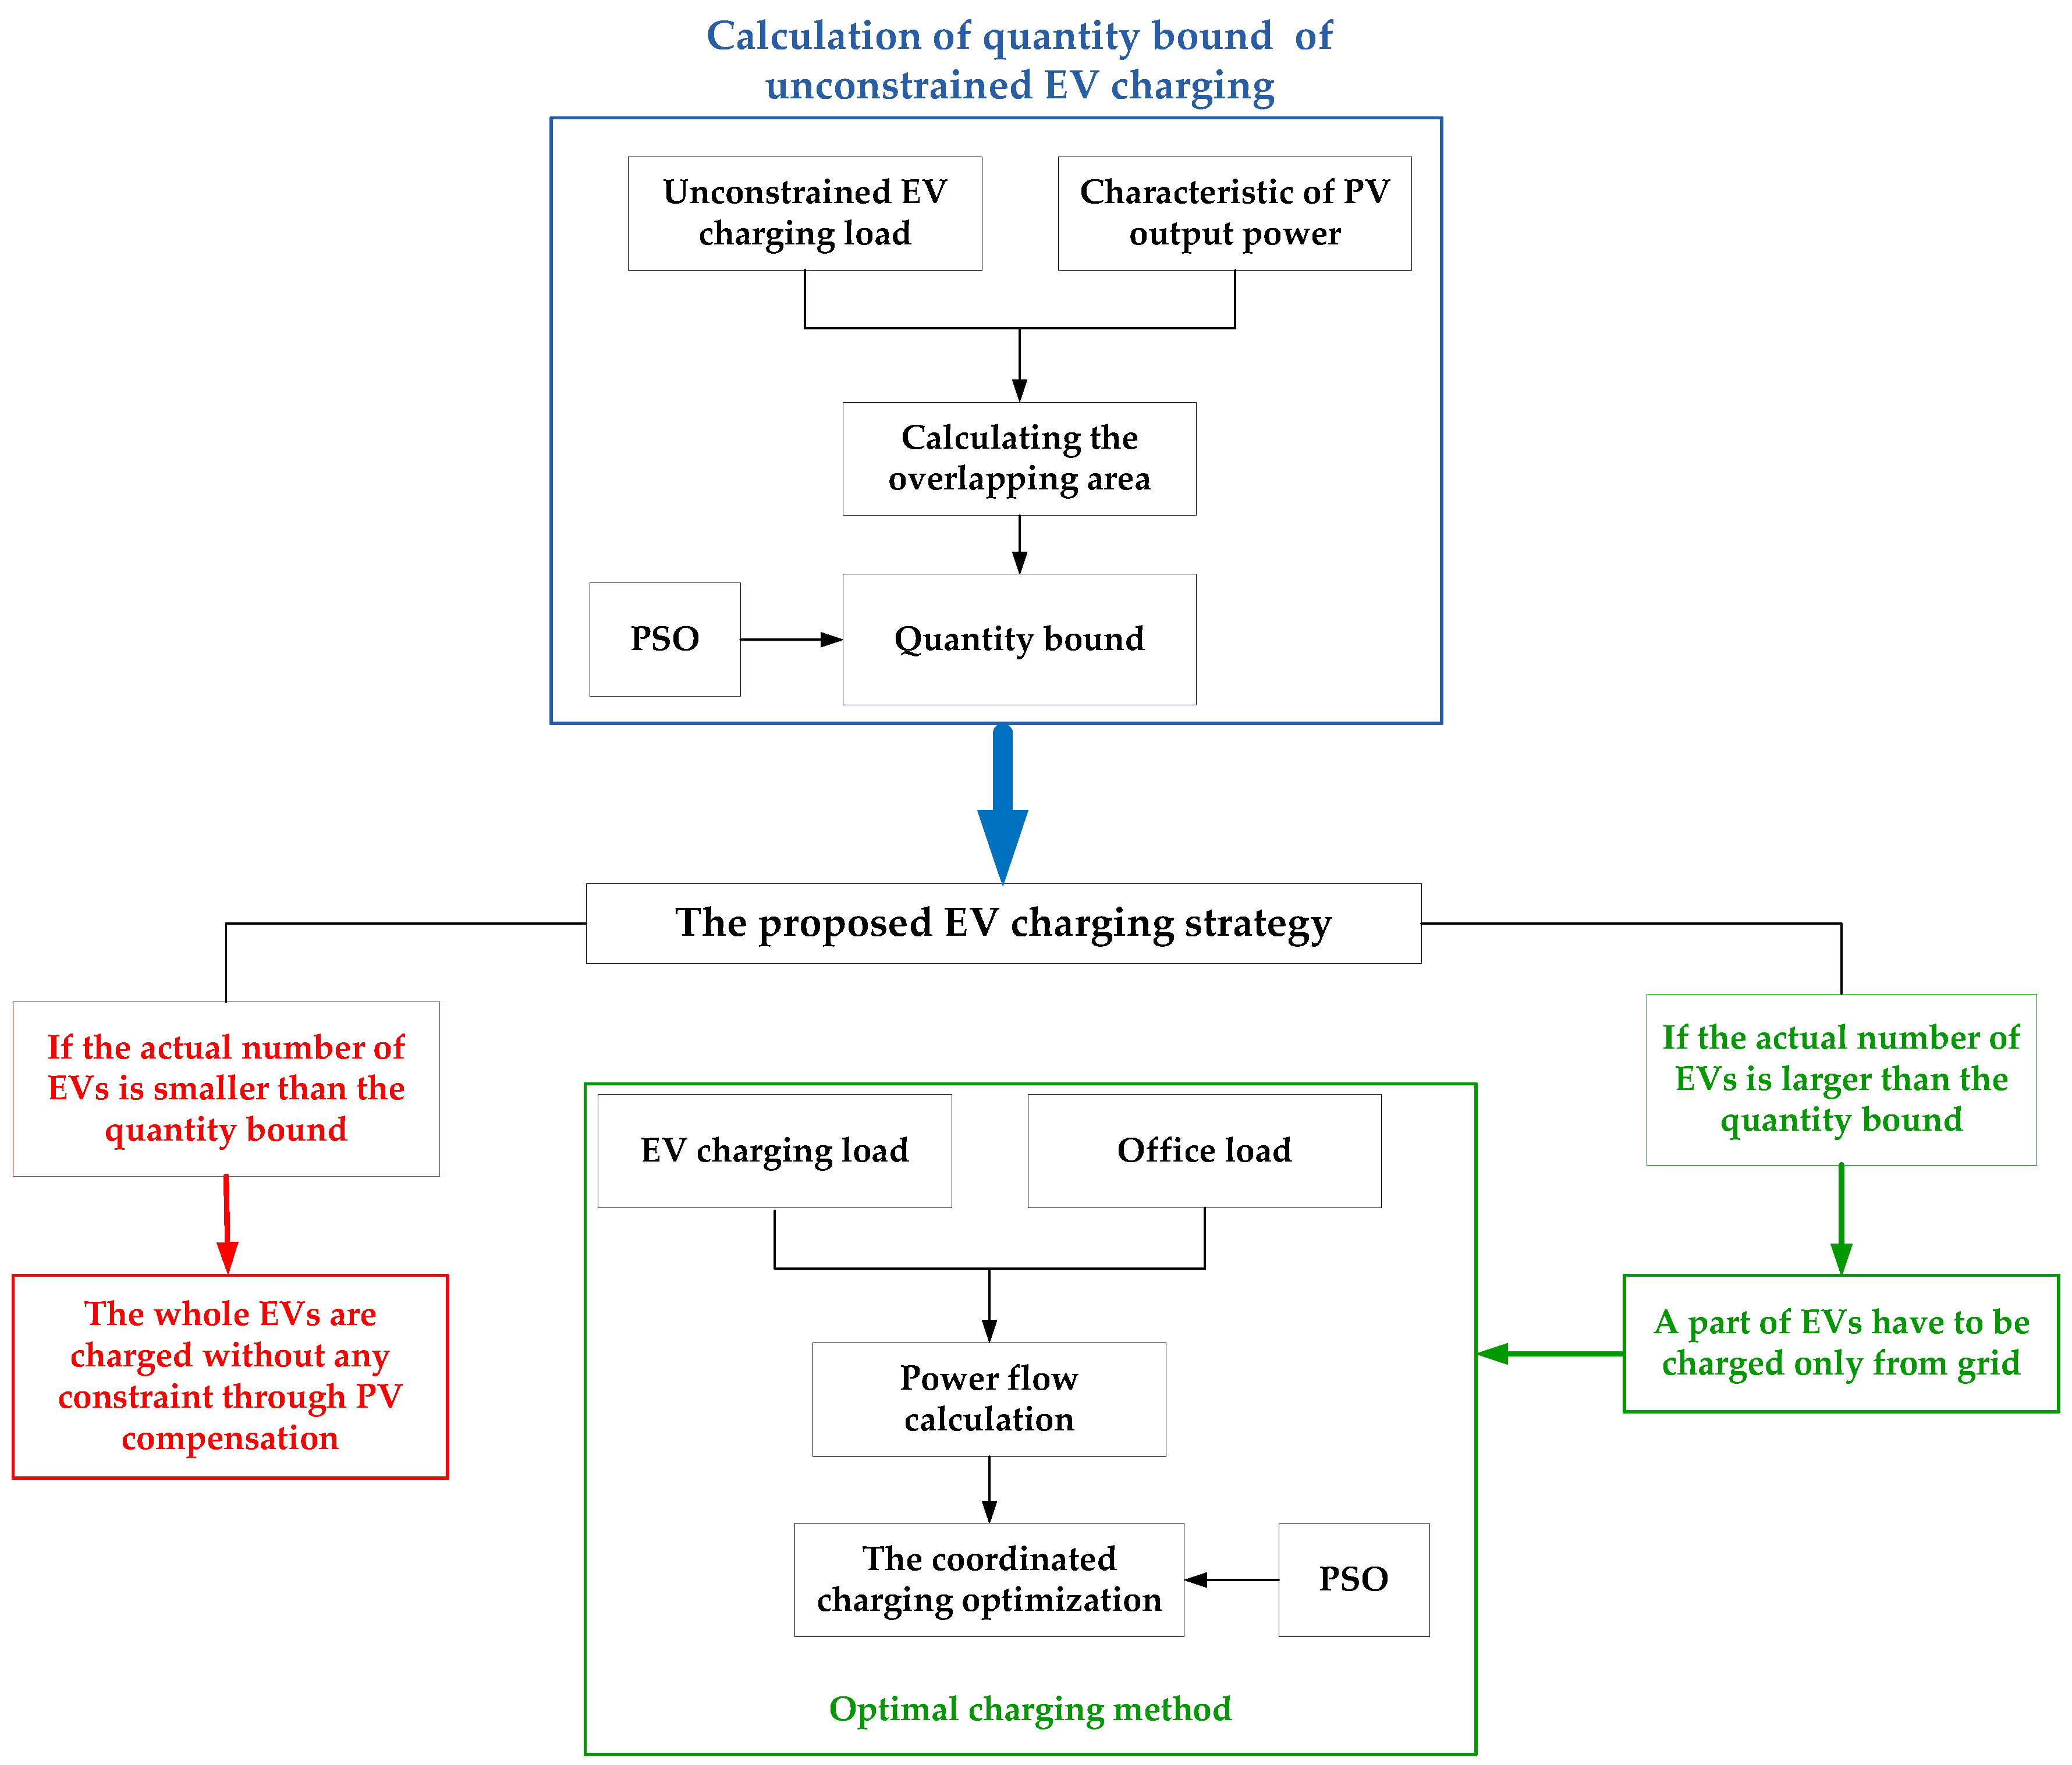
In order to let more EV owners charge their EVs without any constraints and alleviate the negative impact of the EV charging load on the grid using PVs, an EV owner-friendly charging strategy is developed. The general idea of this strategy is shown in
Figure 2.
Compared to the proposed EV owner-friendly charging strategy, the traditional charging strategy lets more EV owners participate in the charging optimization regulation. In fact, PVs can be used to compensate a certain amount of the unconstrained EV charging load at the workplace. Therefore, the quantity bound of the unconstrained EV charging using PVs is derived. In this paper, the aforementioned quantity bound is firstly discussed in the proposed charging strategy.
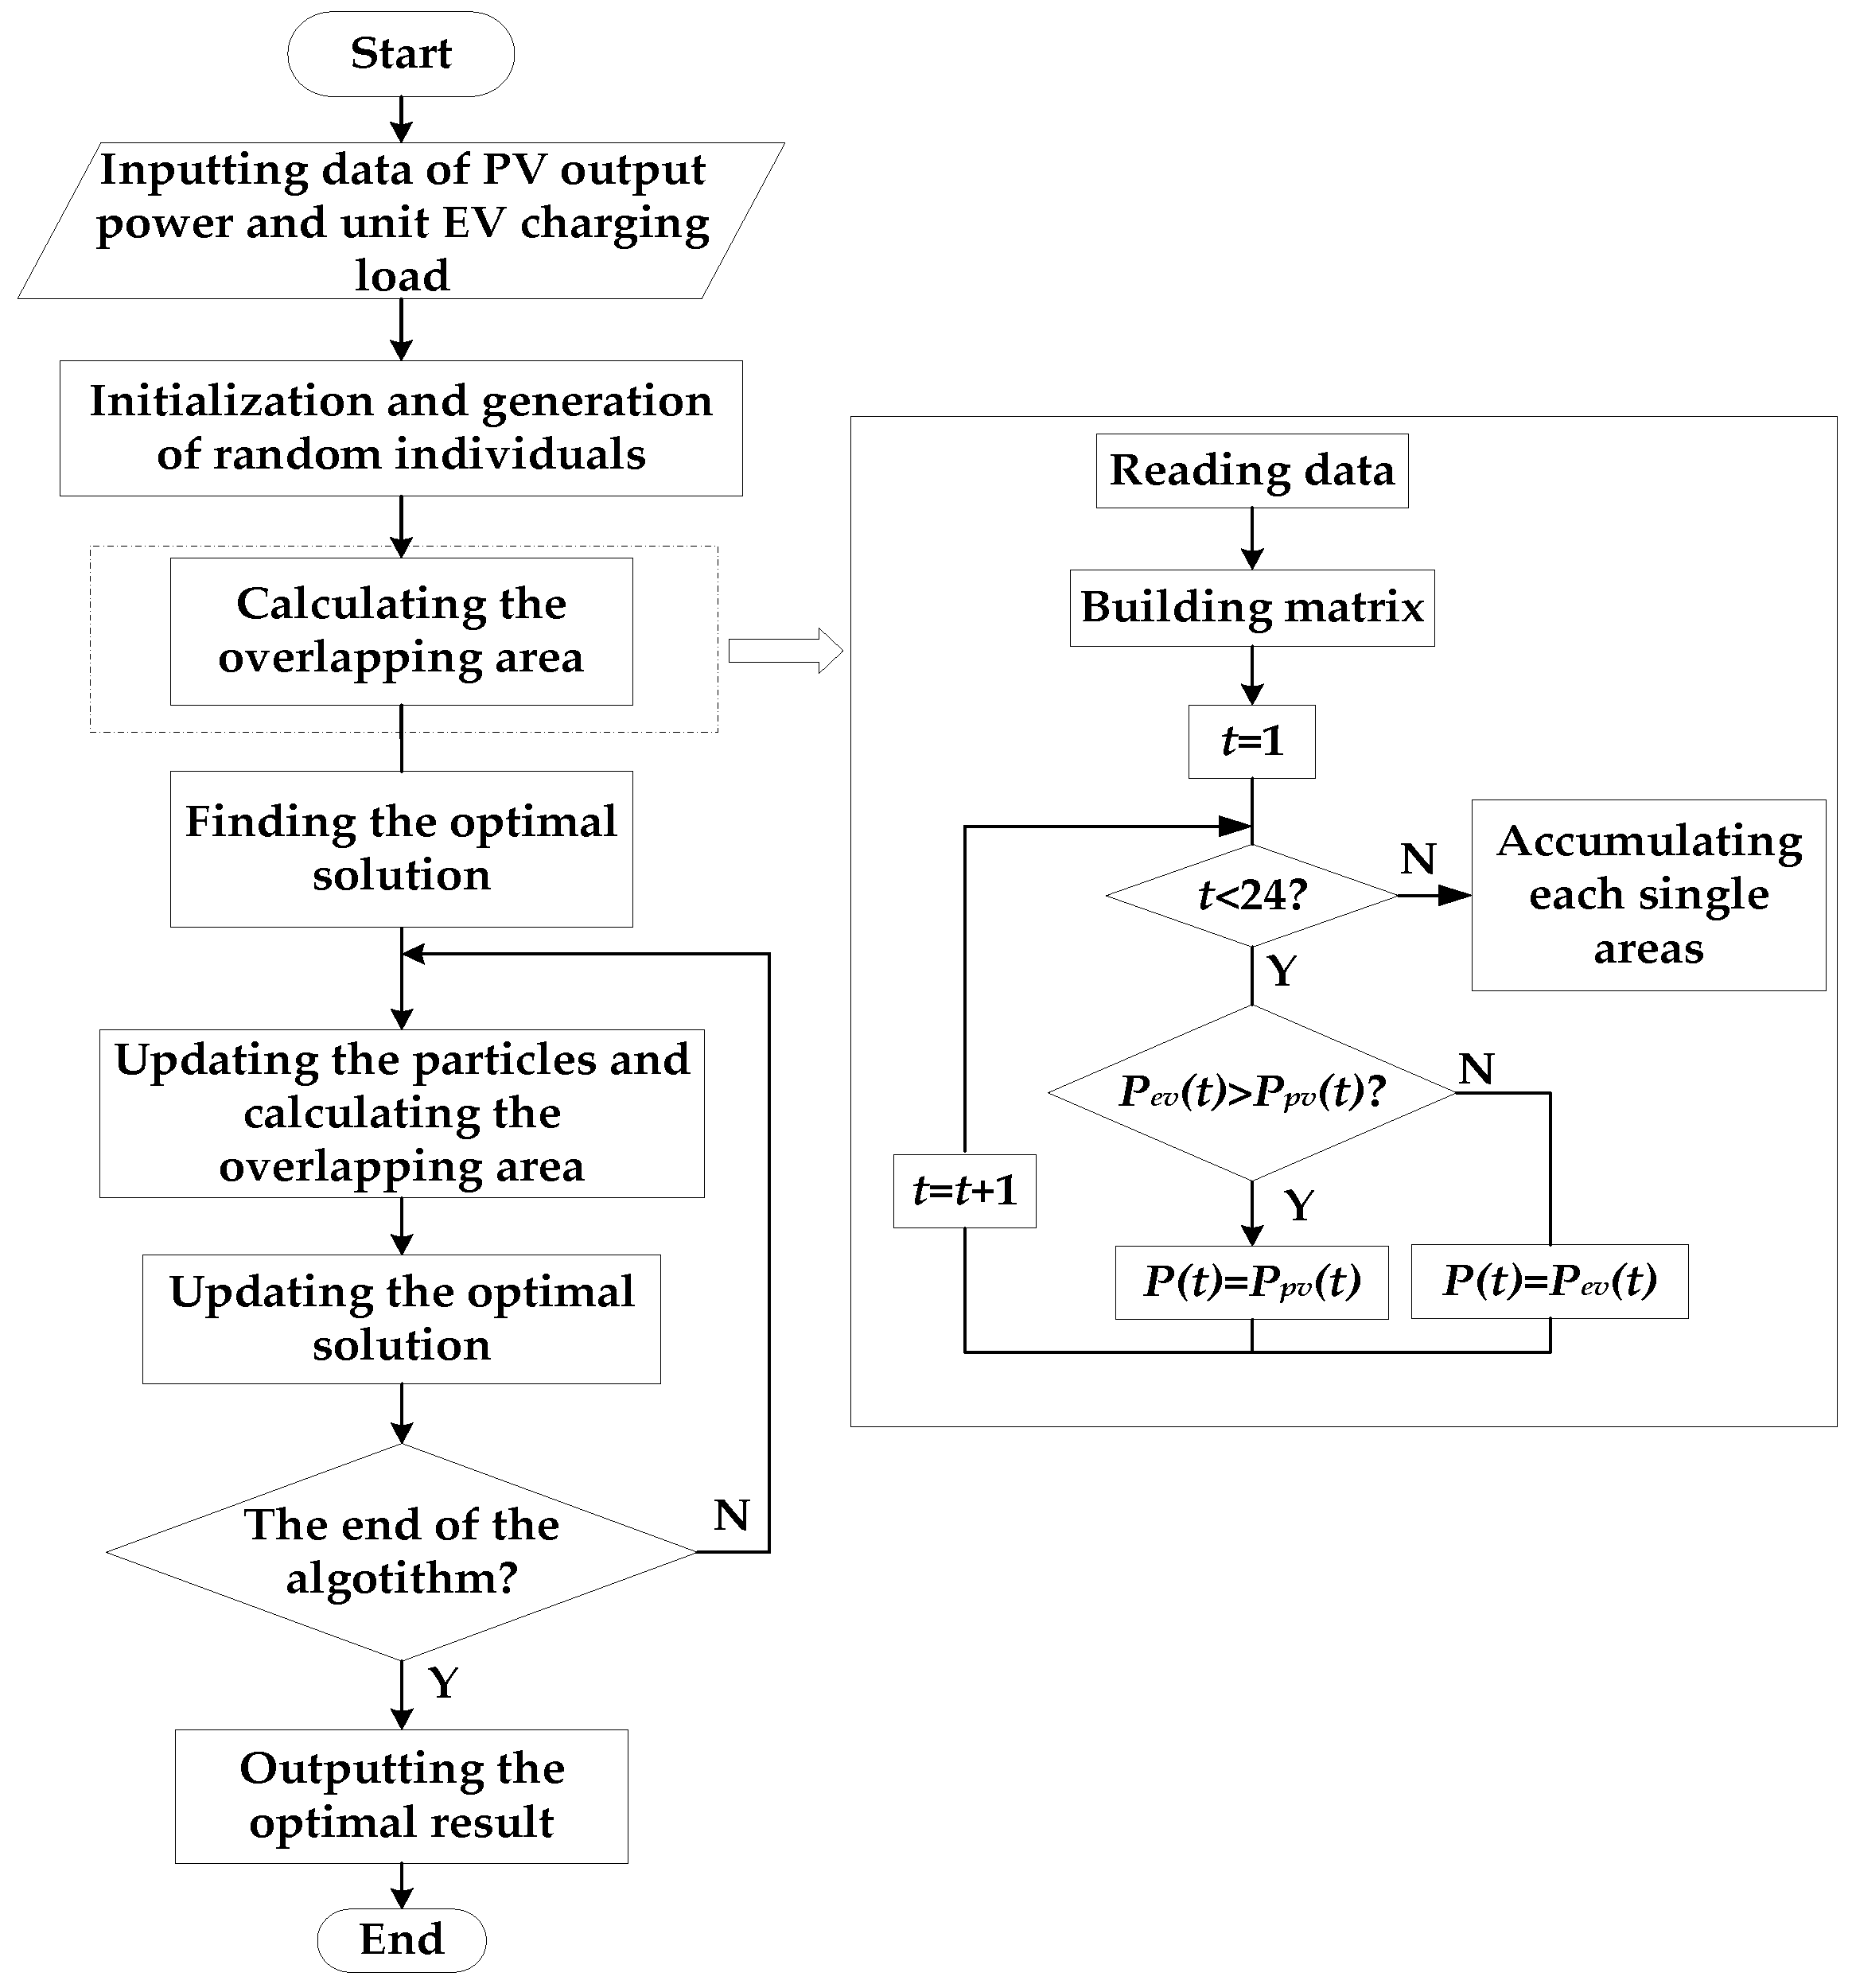
The outline of the proposed EV charging strategy is shown in
Figure 3. The Particle Swarm Optimization (PSO) algorithm [
26,
27] is used for the optimization problems as shown in
Figure 3. The advantages of the PSO algorithm are summarized as follows:
In general, the derived solution can avoid to be stuck in the local minimum solution using the wider searching space compared to other optimization algorithms.
The gradient of the performance function is not used in the PSO algorithm compared to the representative approaches such as the Trust Region Algorithm and the Quasi-Newton Methods. Therefore, the derivation of the differential/derivative value of the performance function is not needed. That means, the PSO algorithm can perform well to obtain the optimal solution, even if the performance function is indifferentiable.
The PSO algorithm has no cross or mutation operations compared to some other optimization algorithms, such as the GA and Immune Algorithm. That means, less parameters are used in the PSO algorithm, which may reduce the risk of non-convergence.
On the other hand, a typical disadvantage of the PSO algorithm is that the particle swarm may fail to obtain the optimum solution due to random nature of the initial values. This issue can be resolved through adjusting the parameters, such as the accelerating factors. Based on the above observation, the PSO algorithm is selected in this proposed strategy.
Firstly, the quantity bound, i.e., the number of EVs with the unconstrained EV charging using PVs, which maximizes the overlapping area between the load curve of the unconstrained EV charging and the PV output curve is derived. The details are discussed in
Section 4.
If the actual number of EVs at the workplace is smaller than the aforementioned quantity bound, all the EVs can be charged without any constraints. If the actual EVs quantity is larger than the aforementioned quantity bound, a part of the EVs have to be charged only from the grid, and the optimal charging method is developed for this part of EVs without being charged by PVs. In this method, the charging state of EVs at each moment is optimized to minimize the line loss. It is noted that the “EV quantity” in this paper denotes the number of EVs with charging demand at the workplace per day. In this paper, the EV charging power (the unit of which is “kW”) is mainly discussed.
The increasing amount of the EV charging load may lead to more significant issues, such as more significant voltage fluctuation, the increase in the peak-to-peak of the daily load curve and the increase in the line losses.
Among the above issues, the minimization of the line loss is the key for the distribution grid operation. First, the optimization of the line loss is expected to depress the peak of the daily load curve. In other words, the minimization of the line loss contributes to reduce the peak-to-peak of the daily load curve, which also reduces the voltage fluctuation.
Additionally, the excessive line loss may bring the serious heat problem of conductors and windings of the electrical equipment. If the temperature exceeds the threshold value which is regulated in the standard, local faults in the distribution grid could occur. Besides, if the heat caused by the line loss becomes serious, the operation capacity and the transfer capacity of the distribution grid might have to be reduced. Therefore, the line loss is chosen as the optimization objective in this paper.
It is noted that only EVs the parking duration of which is longer than the expected charging duration may be regulated through the optimal charging regulation. The details are discussed in
Section 5.
The benefit of the proposed EV owner-friendly charging strategy using PVs is to alleviate the negative impact of the EV charging load on the distribution grid operation and let more EV owners to charge their EVs without any constraints.
If the PV output curve is nearly the same as the curve of the EV charging load, then other energy storage batteries other than EVs are not generally required, which can save additional investment. The PV output is transferred to the EV batteries, and there may be a small amount of positive/negative surplus electric energy transferred to the grid. For this situation, the PV output can effectively compensate the EV charging load.
3. Distribution Grid and Related Model
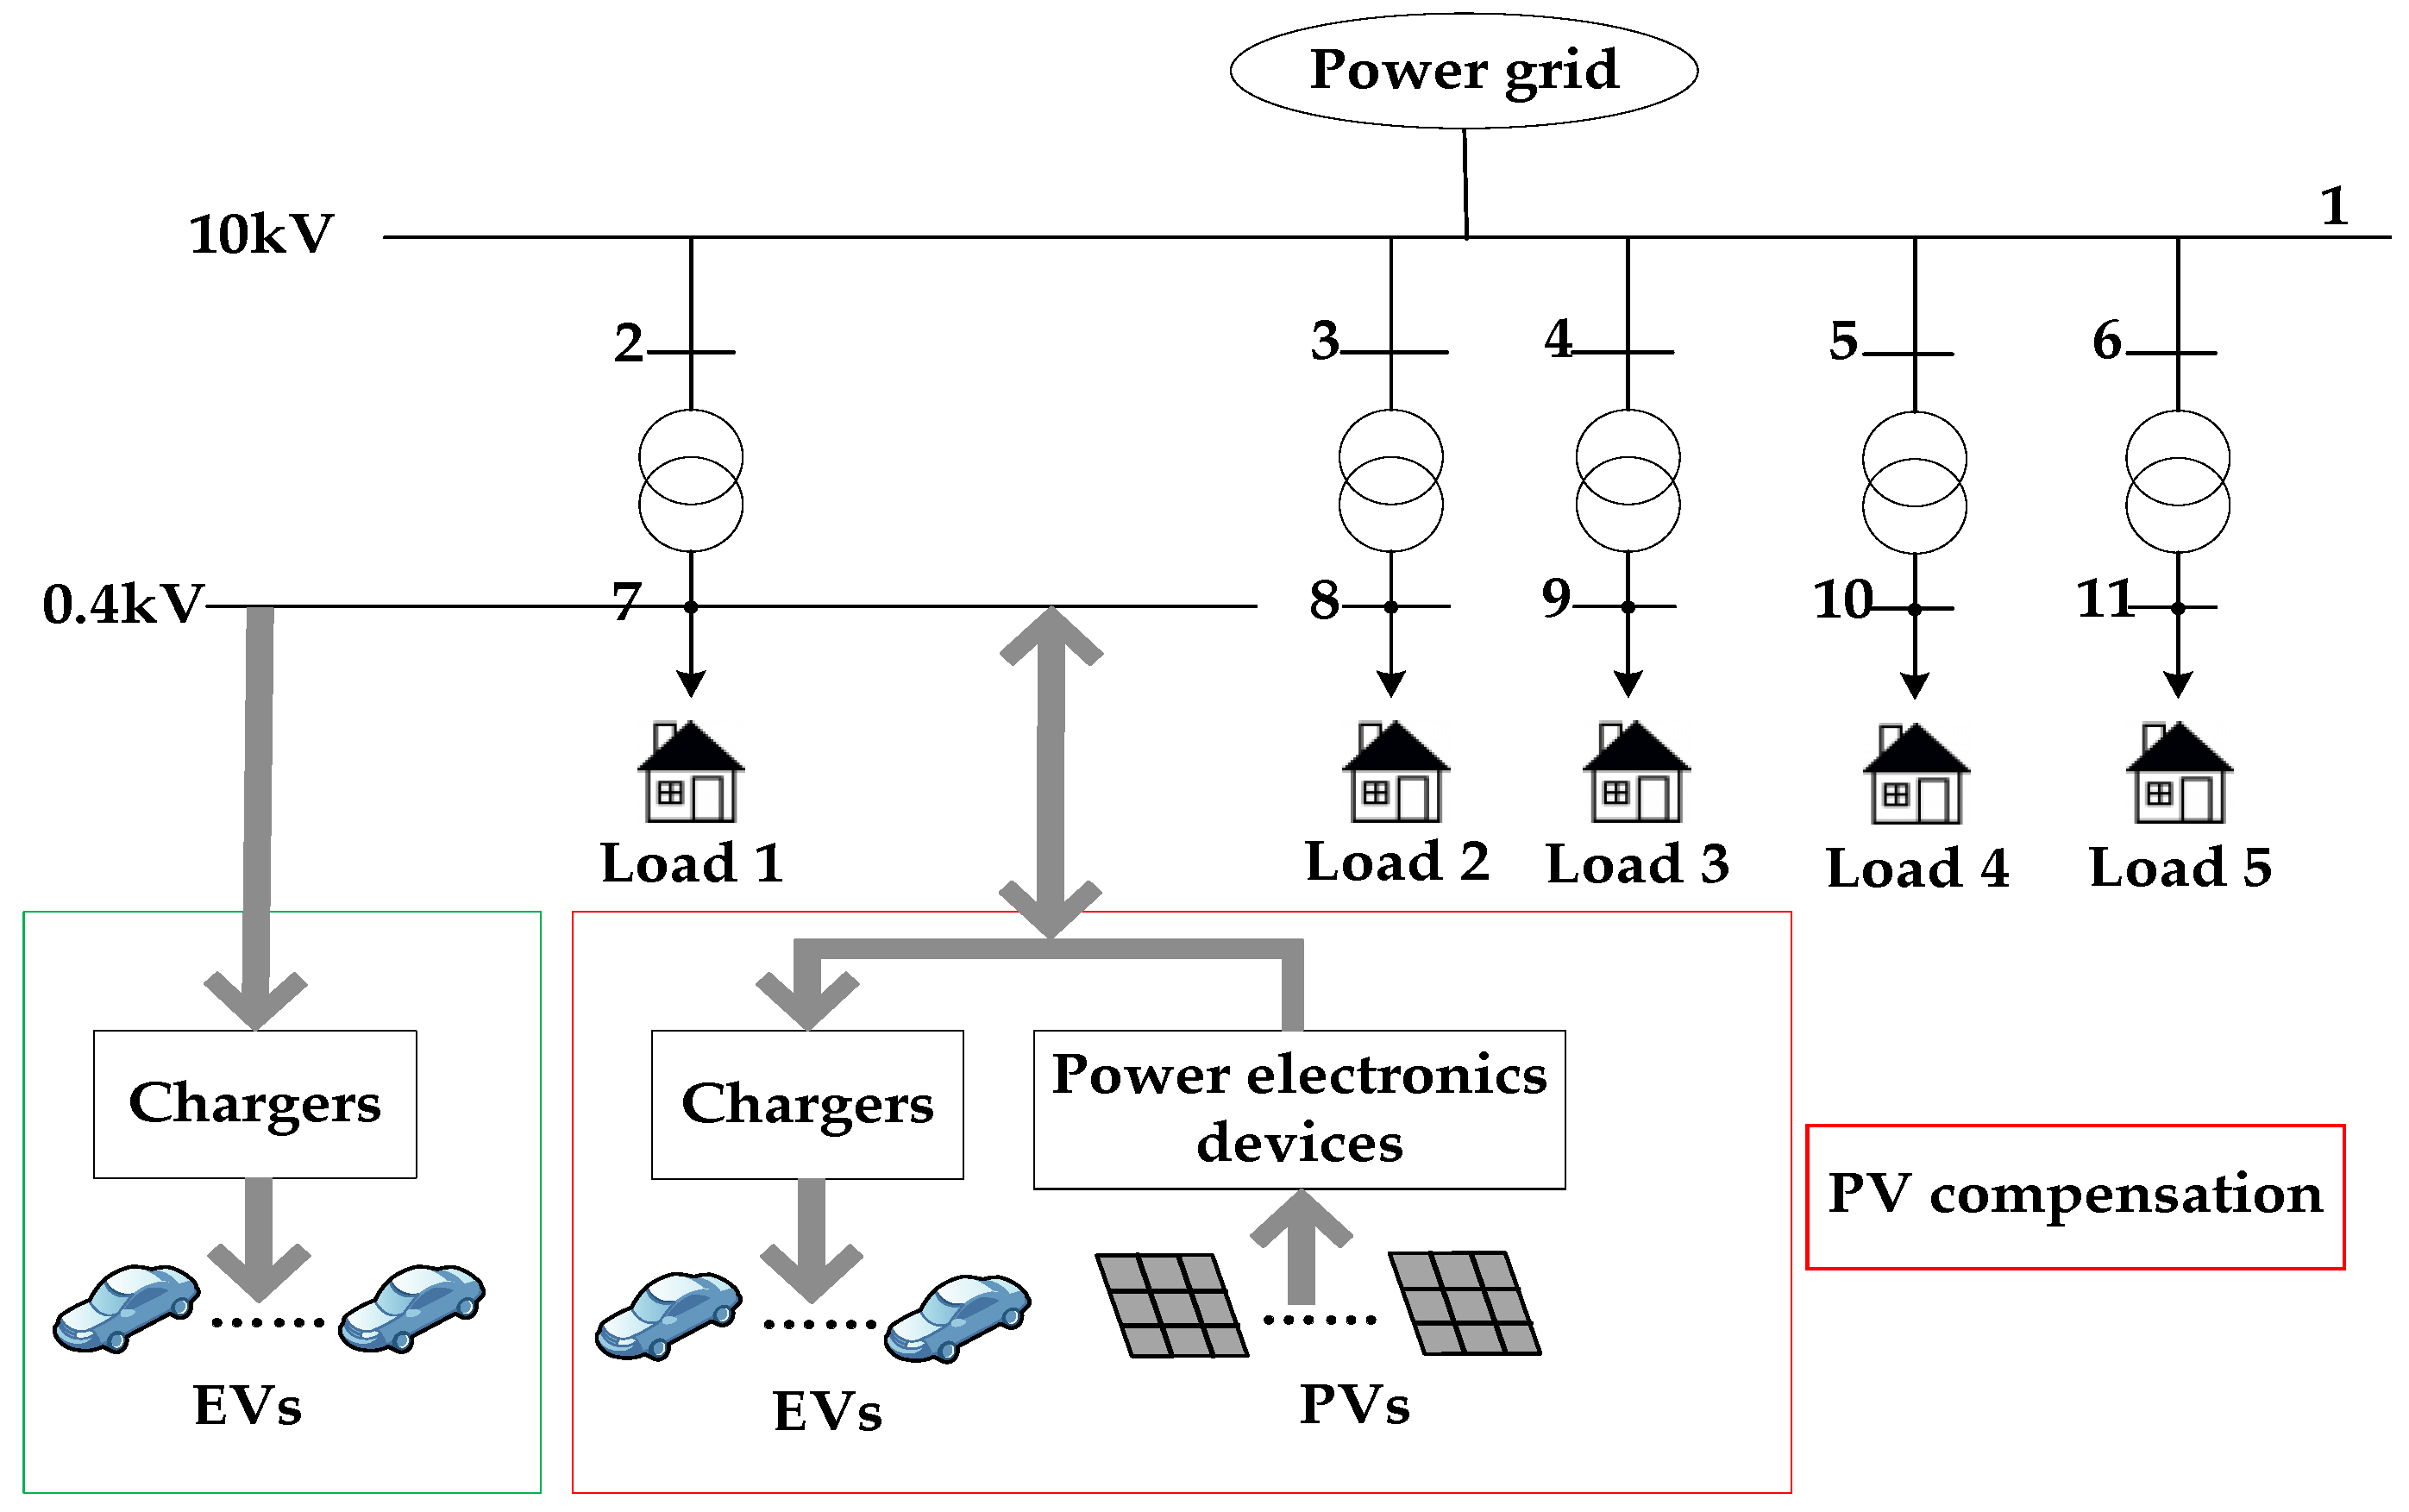
3.1. Distribution Grid Structure
With the development of the corresponding technologies, more EVs and PVs are likely to be integrated into the grid.
Figure 4 shows the structure of the distribution grid with EVs and PVs at the workplace in Beijing. It can be seen that the number of nodes is 11 and the number of branches is 10. The parameters are shown in
Table A1 in
Appendix A.
When the PV output is not enough to fully compensate the EV charging load, the grid provides the deficiency of the electric energy to the EV batteries. On the other hand, when the PV output exceeds the EV charging load, the surplus electric energy is fed into the grid.
3.2. The Model of Unconstrained EV Charging Load
At present, the National Household Travel Survey (NHTS) [
28] is widely used to describe EV owners’ charging behavior in many studies [
29,
30,
31,
32]. However, the provided EV drivers’ travel behavior is different from that observed in major Chinese cities [
25].
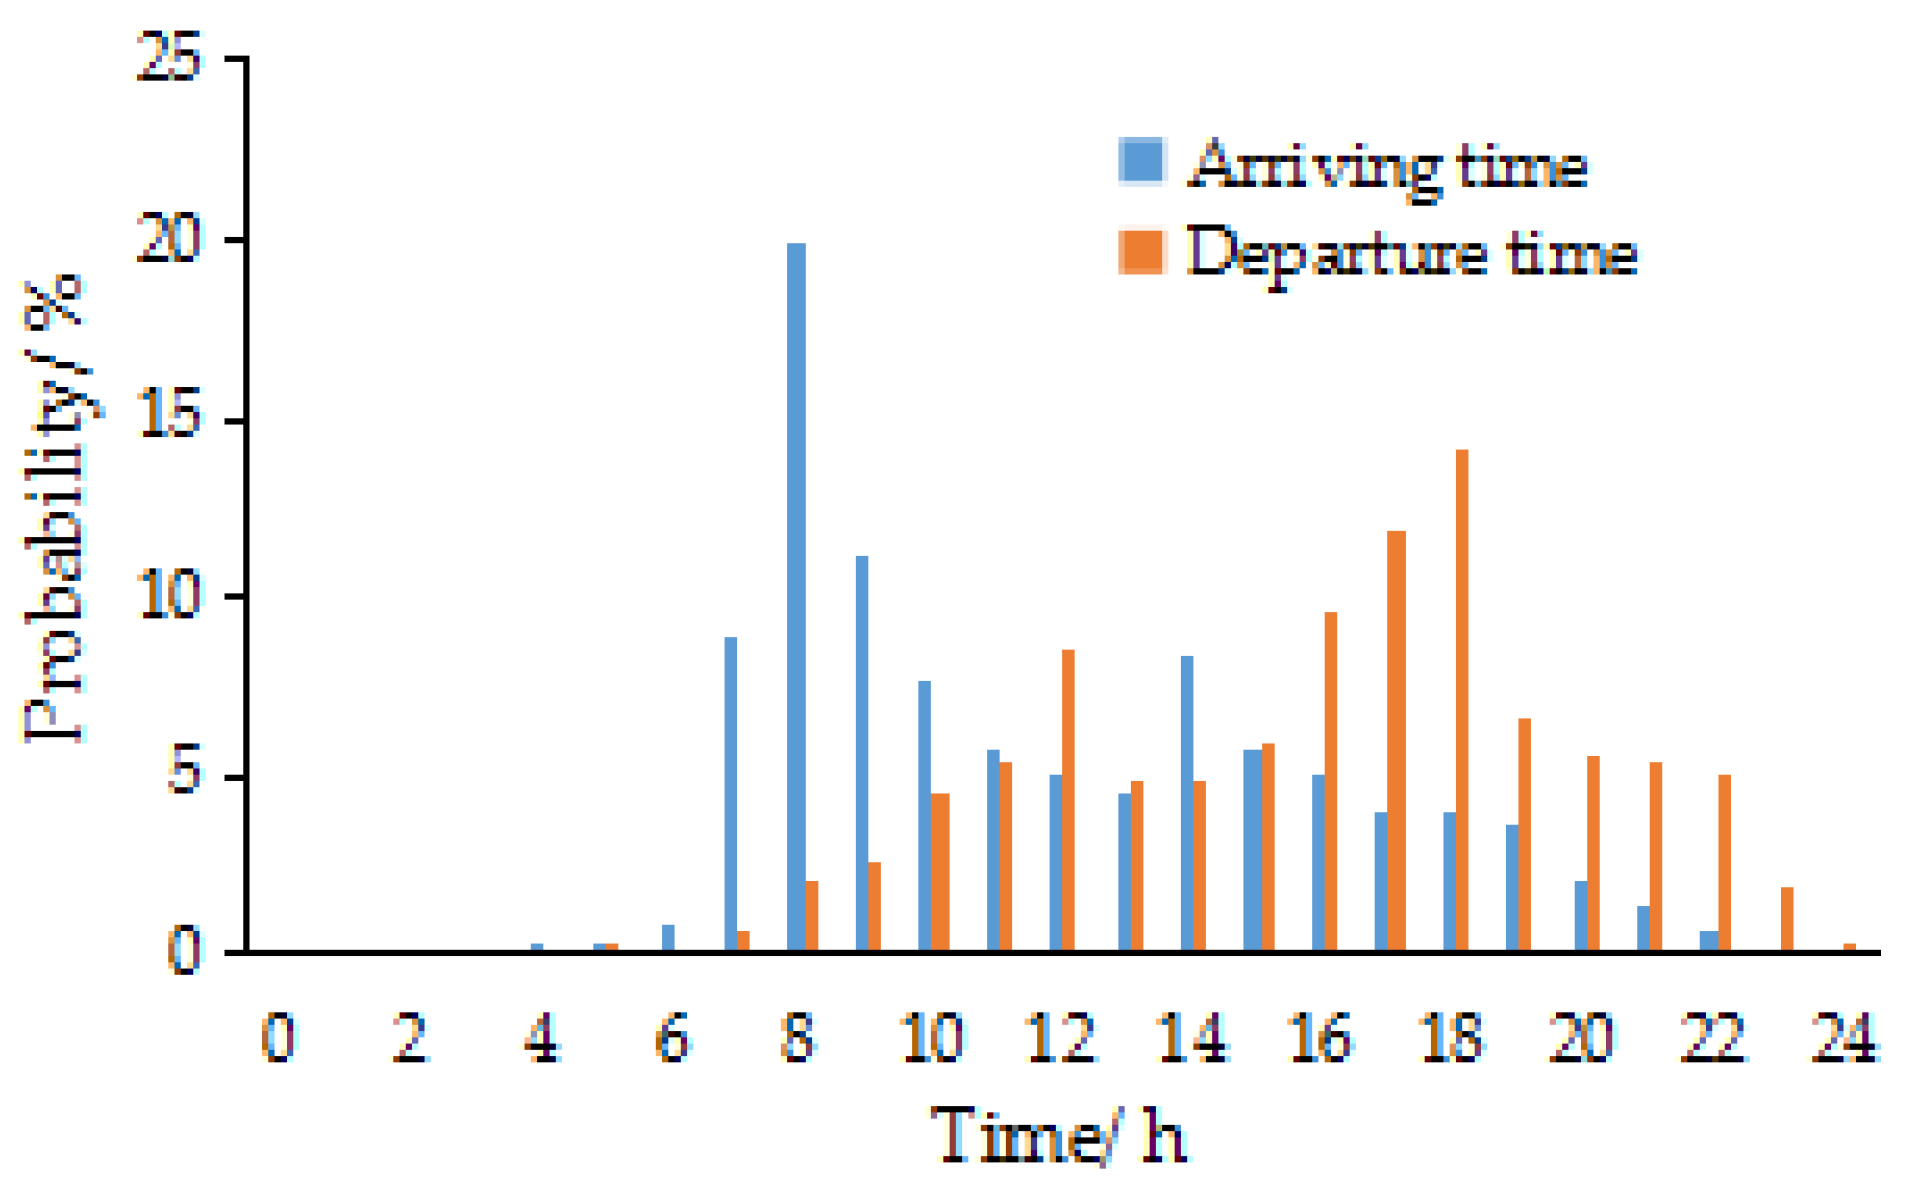
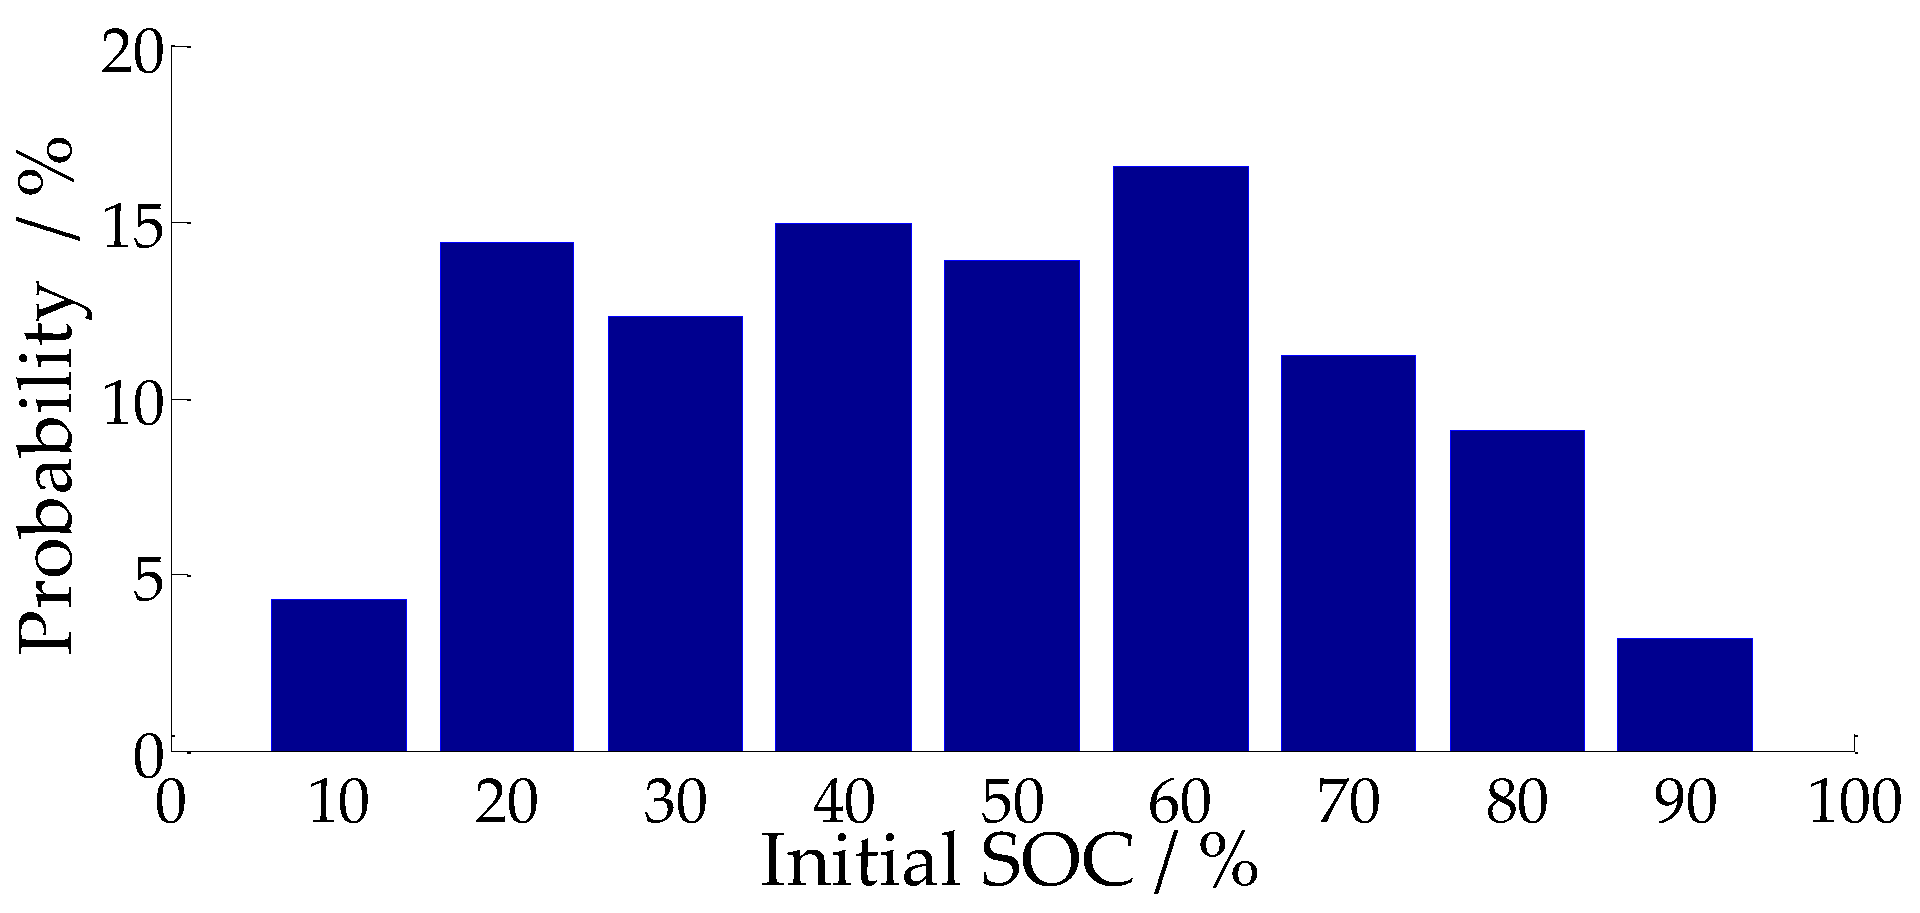
The probability distribution of the arrival time, the departure time and the initial state of charge (SOC) are acquired through analyzing the real measured driving data at the workplace in Beijing. The probability distribution of three data are shown in
Figure 5 and
Figure 6.
The following assumptions are introduced:
- (1)
The charging power of the EV battery is assumed to be constant.
- (2)
The arrival time is assumed to be the same as the starting time of the unconstrained EV charging.
The actual EV charging duration is determined by the parking duration and the initial SOC, which can be shown as Equations (1)–(3):
where
Ta denotes the actual EV charging duration,
Ts denotes the parking duration,
Tn denotes the required EV charging duration from the initial SOC to the required SOC,
Te and
Tl denote the arrival time and the departure time, respectively,
SOC0 denotes the initial SOC,
SOCr denotes the required SOC,
Qb denotes the capacity of the EV battery,
Pc denotes the EV charging power.
The following data are referenced from the E150 EV specification. The capacity of the EV battery is 25.6 kWh. The EV charging power is about 2.8 kW. The required EV charging duration from SOC = 0 to SOC = 1 is about nine hours.
Based on the probability distributions in
Figure 5 and
Figure 6, the random sampling method is applied to analyze the proportion of EV owners the parking duration of which is longer than the required EV charging duration (i.e., EV owners who have the ability to participate in the optimal charging regulation). The result shows that 54.5% of the EV owners at the workplace should charge their EV batteries in line with the optimal charging regulation, which may be inconvenient for those EV owners.
The unconstrained EV charging load under the large number of random samplings can be calculated through Equation (4). Then, the actual unconstrained EV charging load can be obtained through scaling.
where
PEV,t denotes the unconstrained EV charging load under the large amount of random samplings (
N random samplings) at
t moment,
Pi denotes the EV charging power of
i-th EV,
Si,t denotes the charging state of
i-th EV at
t moment.
Si,t = 1 denotes that the
i-th EV is being charged at
t moment,
Si,t = 0 denotes that the
i-th EV is not being charged at
t moment.
Figure 7 shows the calculation result of the daily load curve of the unconstrained EV charging (an example of 100 EVs throughout a day). As seen from
Figure 7, the peak of the unconstrained EV charging load is concentrated between 9:00 and 13:00.
3.3. The Characteristics of the PV Output
The PV is located at an urban workplace in Beijing. The historical weather forecast information is obtained from a public weather forecast website [
33]. Based on the actual measured data, the capacity of the PV is 150 kW. The type of the solar panel is the BTS-M185.
PV generation arrays in major Chinese cities are mainly placed on the roof of buildings at the workplace. Reference [
34] assumed that every 10 m
2 of the area on the roof can be used to install a PV system with a capacity of 1 kW. Therefore, the needed 150 kW PV system would cover an area of about 1500 m
2. It should be noted that the 1500 m
2 here denotes the actual area covered by the PV system. Based on the measured data, the area of the roof at this workplace is around 2200 m
2, which means, the area utilization for the PV is around 68%. There is still 32% of the area on the roof left for the Heating, Ventilation and Air Conditioning (HVAC) equipment and the aisleway for the technical personnel.
PV output curves can be categorized into three types according to the type of weather: sunny day, cloudy day and rainy day. Based on the historical weather forecast and the real historical data of the solar radiation in Beijing, these three types (
Figure 8b) can be described as follows:
- (1)
Type 1: “Sunny day”. In this type, the average value of the solar radiation peaks is around 640 W/m2, and the range of the solar radiation peaks is larger than 550 W/m2.
- (2)
Type 2: “Cloudy day”. In this type, the average value of the solar radiation peaks is around 460 W/m2, and the range of the solar radiation peaks is from 430 W/m2 to 550 W/m2.
- (3)
Type 3: “Rainy day”. In this type, the average value of the solar radiation peaks is around 405 W/m2, and the range of the solar radiation peaks is lower than 430 W/m2.
The quantity bound of the unconstrained EV charging using PVs is directly related to the characteristic/shape of the PV output curve and the EV owners’ charging behavior. However, the daily PV output curve varies almost every day.
In order to show the “relative average level” of the maximum numbers of the unconstrained EV charging using PVs for different weather types throughout a year, the average values of the PV output under each weather type are considered.
Based on the real historical data of the PV output at the workplace in Beijing, the average values of the daily PV output curve under each weather type are calculated.
Figure 8a shows the curves of the average PV output under various weather types at the workplace.
The proportion of the sunny, cloudy and rainy days were 49.1%, 26.3% and 24.6%, respectively based on the statistics of the weather in one year.
4. Quantity Bound of Unconstrained EV Charging Using PVs
In this section, the quantity bound of the unconstrained EV charging using PVs is analyzed. The area-calculation-based Particle Swarm Optimization (PSO) algorithm is used to calculate the optimal quantity bound of the unconstrained EV charging through maximizing the overlapping area between the PV output curve and the load curve of the unconstrained EV charging. If the actual number of EVs is smaller than the aforementioned quantity bound, the PV compensation enables all the EV owners to charge their EV batteries without any constraints.
4.1. Variable, Objective and Constraint
The number of EVs with the unconstrained EV charging is treated as the optimization variable. The optimization objective is to maximize the overlapping area between the PV output curve and the load curve of the unconstrained EV charging, which is shown in Equation (5):
where
Q denotes the overlapping area,
CEV denotes the load curve of the unconstrained EV charging, and
CPV denotes the PV output curve.
It is noted that the abovementioned “to maximize the overlapping area” is equivalent to a way to let more EV owners charge their EV batteries without any constraints. Therefore, “the starting time of the EV charging” is not treated as the variable here.
The constraint is represented in the form that the peak of the unconstrained EV charging load is not larger than that of the PV output as shown in Equation (6):
where
PPV-peak denotes the peak of the PV output,
PEV-peak denotes the peak of the unconstrained EV charging load.
As discussed in
Section 3.3, the characteristics/shapes of the PV output curve are different depending on the weather types. Therefore, the optimization results for each weather type are also different. In order to provide a reference to the planning of the EV charging poles, the weighted quantity bound of the unconstrained EV charging is calculated as shown in Equation (7):
where
Nev denotes the weighted quantity bound of the unconstrained EV charging,
Nev-s denotes the optimal quantity bound of the unconstrained EV charging in the sunny day,
η1 denotes the fraction of the sunny day,
Nev-c denotes the optimal quantity bound of the unconstrained EV charging in the cloudy day,
η2 denotes the fraction of the cloudy day,
Nev-r denotes the optimal quantity bound of the unconstrained EV charging in the rainy day,
η3 denotes the fraction of the rainy day.
4.2. The Area-Calculation-Based PSO Algorithm
The area-calculation-based PSO algorithm is applied in this Section. Both specific processes and the area calculation method are shown in
Figure 9. The total area is accumulated from the several single areas at each time interval. The area-calculation is embedded in the PSO algorithm.
There are several important parameters in the PSO algorithm: two learning factors (c1 and c2), the inertia factor (w), the population quantity (N), the maximum number of iterations (MaxDT), the position (xi) and the velocity (vi) of each particle. In this paper, c1 = 1.4962, c2 = 1.4692, w = 0.7298, N = 10, and MaxDT = 50. The variables, xi and vi are randomly generated. The particles here refer to the number of the EVs the battery of which can be charged without any constraint using PVs throughout a day.
5. The Optimal Charging Method
As discussed in
Section 2, the PV supply may not have the ability to compensate the whole unconstrained EV charging load if the actual number of EVs is larger than the quantity bound mentioned in
Section 4. Therefore, a part of the EV batteries might need to be charged only from the grid. In this Section, an optimal charging method is proposed for EVs which exceed the quantity bound mentioned in
Section 4.
5.1. Variables, Objective and Constraints
The optimization variables are the charging state of EVs at each moment. The definition of the charging state (
Si,t) has been discussed in
Section 3.2. “The starting time of the EV charging” is optimized through the regulation of the charging state.
The optimization objective is the minimization of the line loss. The equation is shown in Equation (8):
where the
Ploss denotes the total line loss of the distribution network in one day,
Pl,t denotes the line loss of the
l-th branch at
t moment,
lm denotes the total number of the branches in the network.
The constraints are as follows:
- (1)
The SOC constraint is shown in Equation (9):
where
SOCmax denotes the upper limit of the SOC,
SOCmin denotes the lower limit of the SOC.
- (2)
The constraint of the EV charging duration is represented in the form that the accumulation of the charging state of
i-th EV is equal to its total required charging duration as shown in Equation (10):
where
Ti denotes the total required charging duration of
i-th EV.
- (3)
The nodal voltage constraint is shown in Equation (11):
where
Vn denotes the voltage of
n-th node,
Vn,min denotes the lower limit of the voltage of
n-th node,
Vn,max denotes the upper limit of the voltage of
n-th node,
nm denotes the number of nodes.
After setting the constraints (1) and (2), the EV owners’ travel behavior in the area will not be impacted at all.
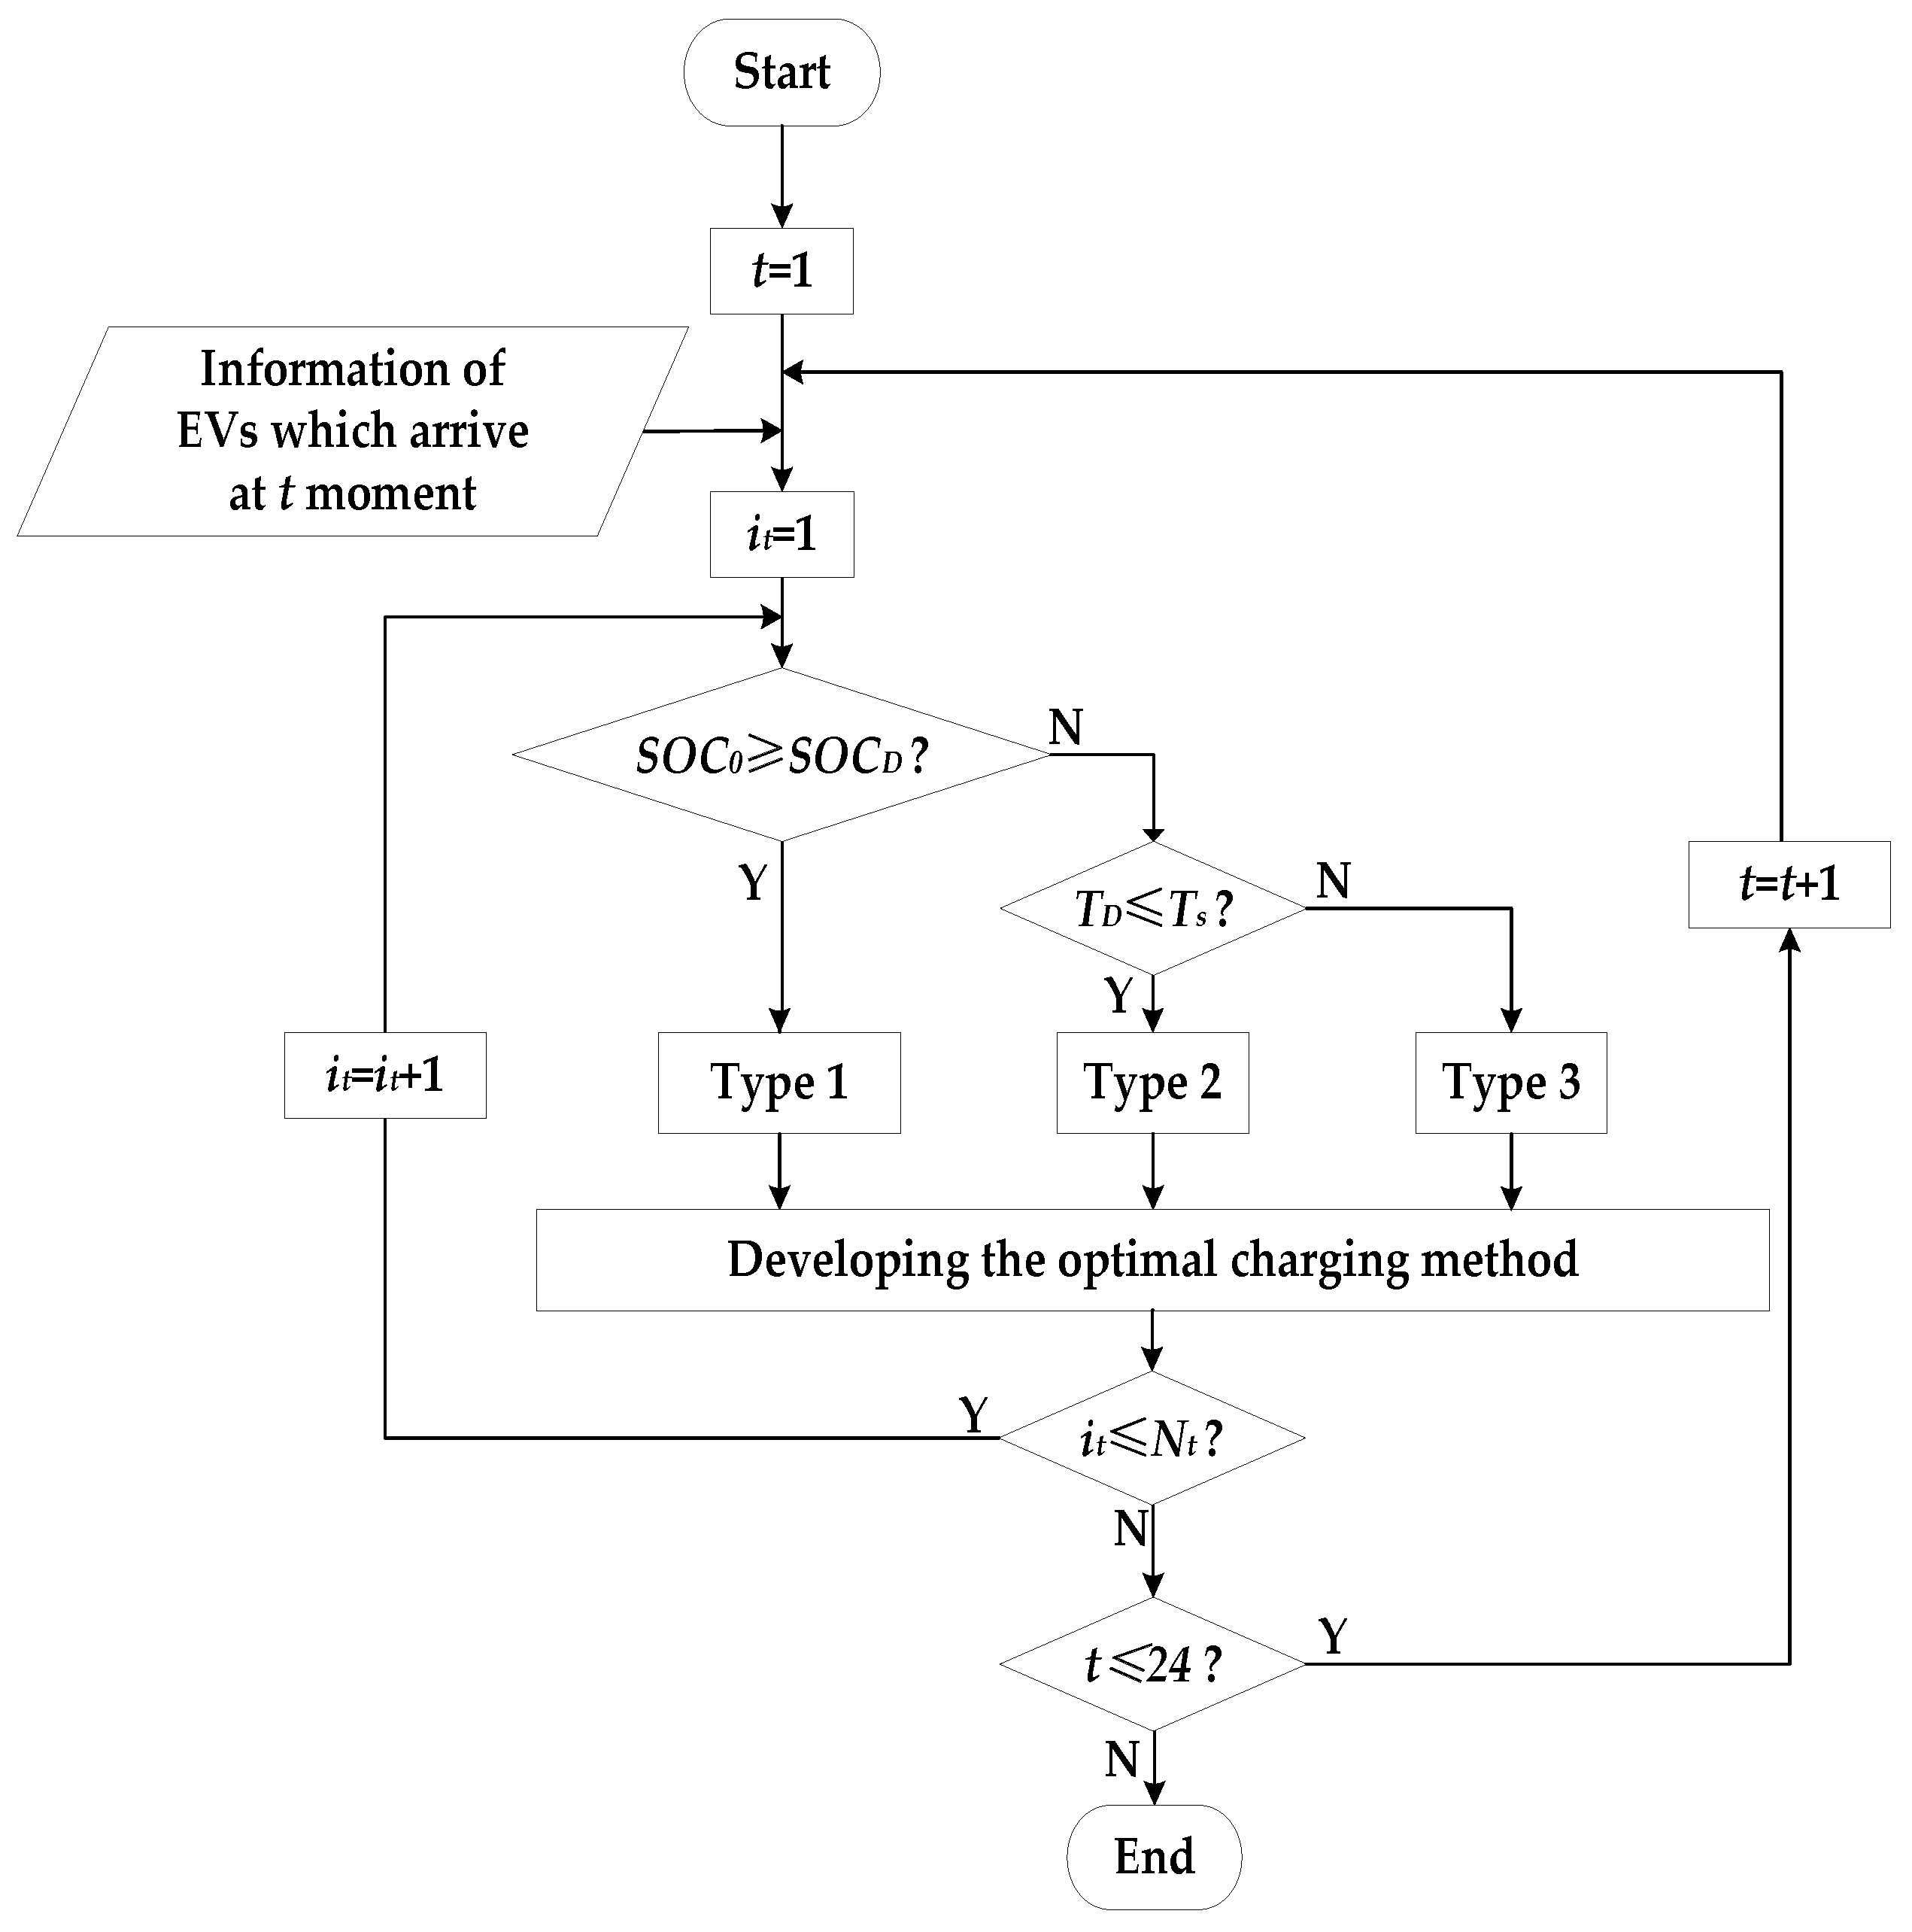
5.2. The Development of the Optimal Charging Method
The flow chart of the proposed optimal charging method is shown in
Figure 10, where
Nt denotes the number of EVs which arrive at moment
t,
SOCD denotes the EV owners’ rigid demand for the SOC,
SOC0 denotes the initial SOC,
TD denotes the charging duration from
SOC0 to
SOCD,
Ts denotes the parking duration.
The EV owners’ rigid demand for the SOC (
SOCD) refers to the amount of SOC that the EV owners must consume during the next trip. In the case study, the rigid demand of each EV is assumed to be fixed. The average commuting distance of the residents in Beijing is 40 km. The battery capacity of the E150 EV is 25.6 kWh, therefore, 30% of the SOC is required for the 40 km of travel. In addition, in order to extend the life of EV batteries, the SOC should not be less than 20% [
35]. Given the traffic congestion, a 10% SOC margin is necessary, so the
SOCD is set to 60%.
Firstly, the charging information which contains the number of EVs, the arrival time, the departure time and the initial SOC at t moment is retrieved.
Then, EVs are categorized into three types according to the charging information. The detailed categorization is shown below:
- Type 1:
The initial SOC has met the rigid demand (SOCD). Therefore, the charging state of EV batteries of this type can be immediately controlled.
- Type 2:
The initial SOC does not meet the rigid demand, but the parking duration is enough to finish charging the EV battery. Therefore, EV batteries of this type should be charged to the rigid demand (SOCD) firstly, and then the charging state during the remaining charging duration is controlled.
- Type 3:
The initial SOC does not meet the rigid demand and the parking duration is not enough to finish charging the EV battery. Therefore, EV batteries of this type have no ability to participate in the charging optimization regulation, and have to be charged without any constraint.
Finally, the optimal programming for the three types is developed according to the above procedure. The charging state of EVs of Type 1 and Type 2 is controlled.
Based on the flow chart shown in
Figure 10, the PSO algorithm is used to obtain values of variables. After optimization at each moment, a couple of pieces of charging information are updated. If there is no arrival of new EVs in the area at next moment, the programming is the same with that of the previous moment. If there are arrival of new EVs at next moment, the above procedure is applied again to develop the programming for these new EVs and the programming of the previous EVs does not change.
6. Case Study and Discussion
As discussed in
Section 3.3, the capacity of PVs is 150 kW and the characteristics/shape of the PV output is different under each weather type. Based on the methods in
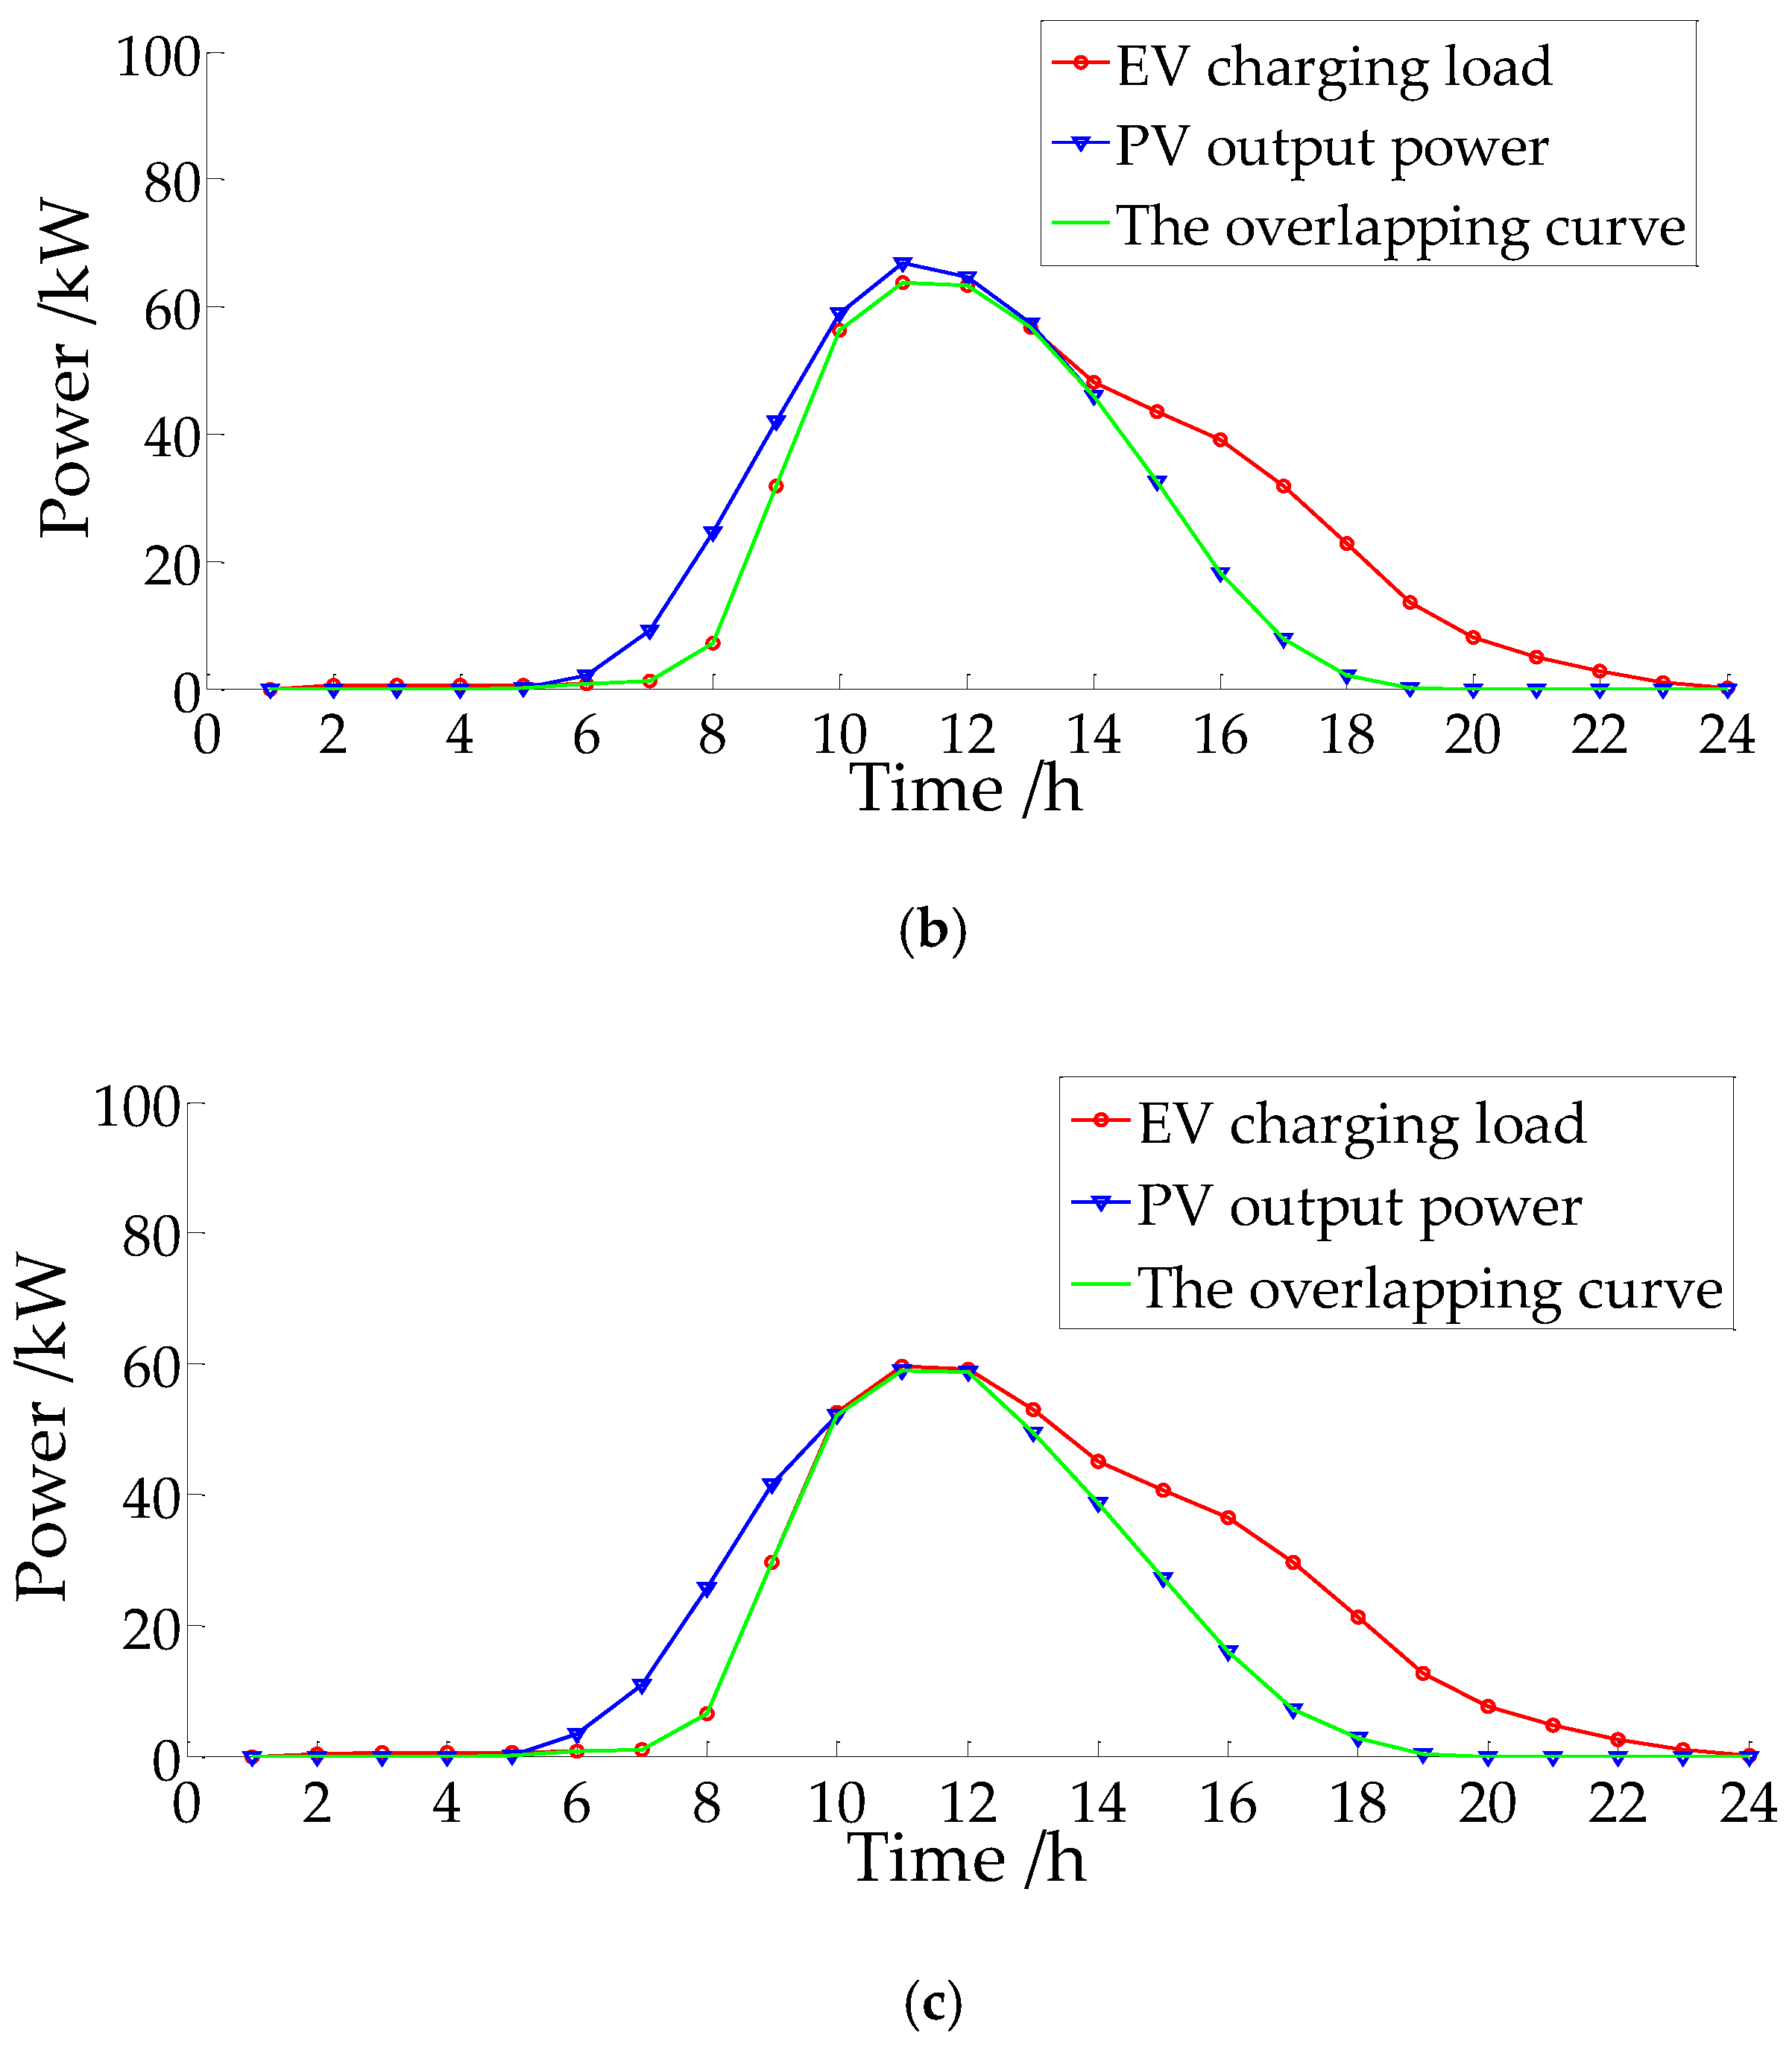
Section 4, the area-calculation-based PSO algorithm is used to obtain the optimal quantity bounds of the unconstrained EV charging using PVs for different weather types. The results are shown in
Table 1 and
Figure 11.
The quantity bounds of the unconstrained EV charging are different due to the different PV output curves for each weather type. Therefore, a weighted quantity bound of the unconstrained EV charging is important for the planning of the charging poles.
As can be seen in
Table 1, the number of EVs that can be compensated by PVs throughout one day is different under each weather type. As discussed in
Section 4.1, in order to obtain the weighted quantity bound of the unconstrained EV charging, the weight factors and the quantity bound of each weather type are considered as shown in Equation (7). The calculation result from Equation (7) shows that the 150 kW PV in this workplace can compensate the unconstrained EV charging load which results from 52 EVs.
It is noted that the “52 EVs” here denotes the weighted quantity of the EVs that can be compensated by PVs throughout a day, which means that the “52 EVs” are not charged at the same time/timing. Using the random sampling method mentioned in
Section 3.2, the peak number of the 52 individuals’ unconstrained EV charging is obtained, which is 28 EVs. This result shows that there may be 28 EVs charged at the same time/timing. This peak value can provide a reference for the planning of the EV charging poles.
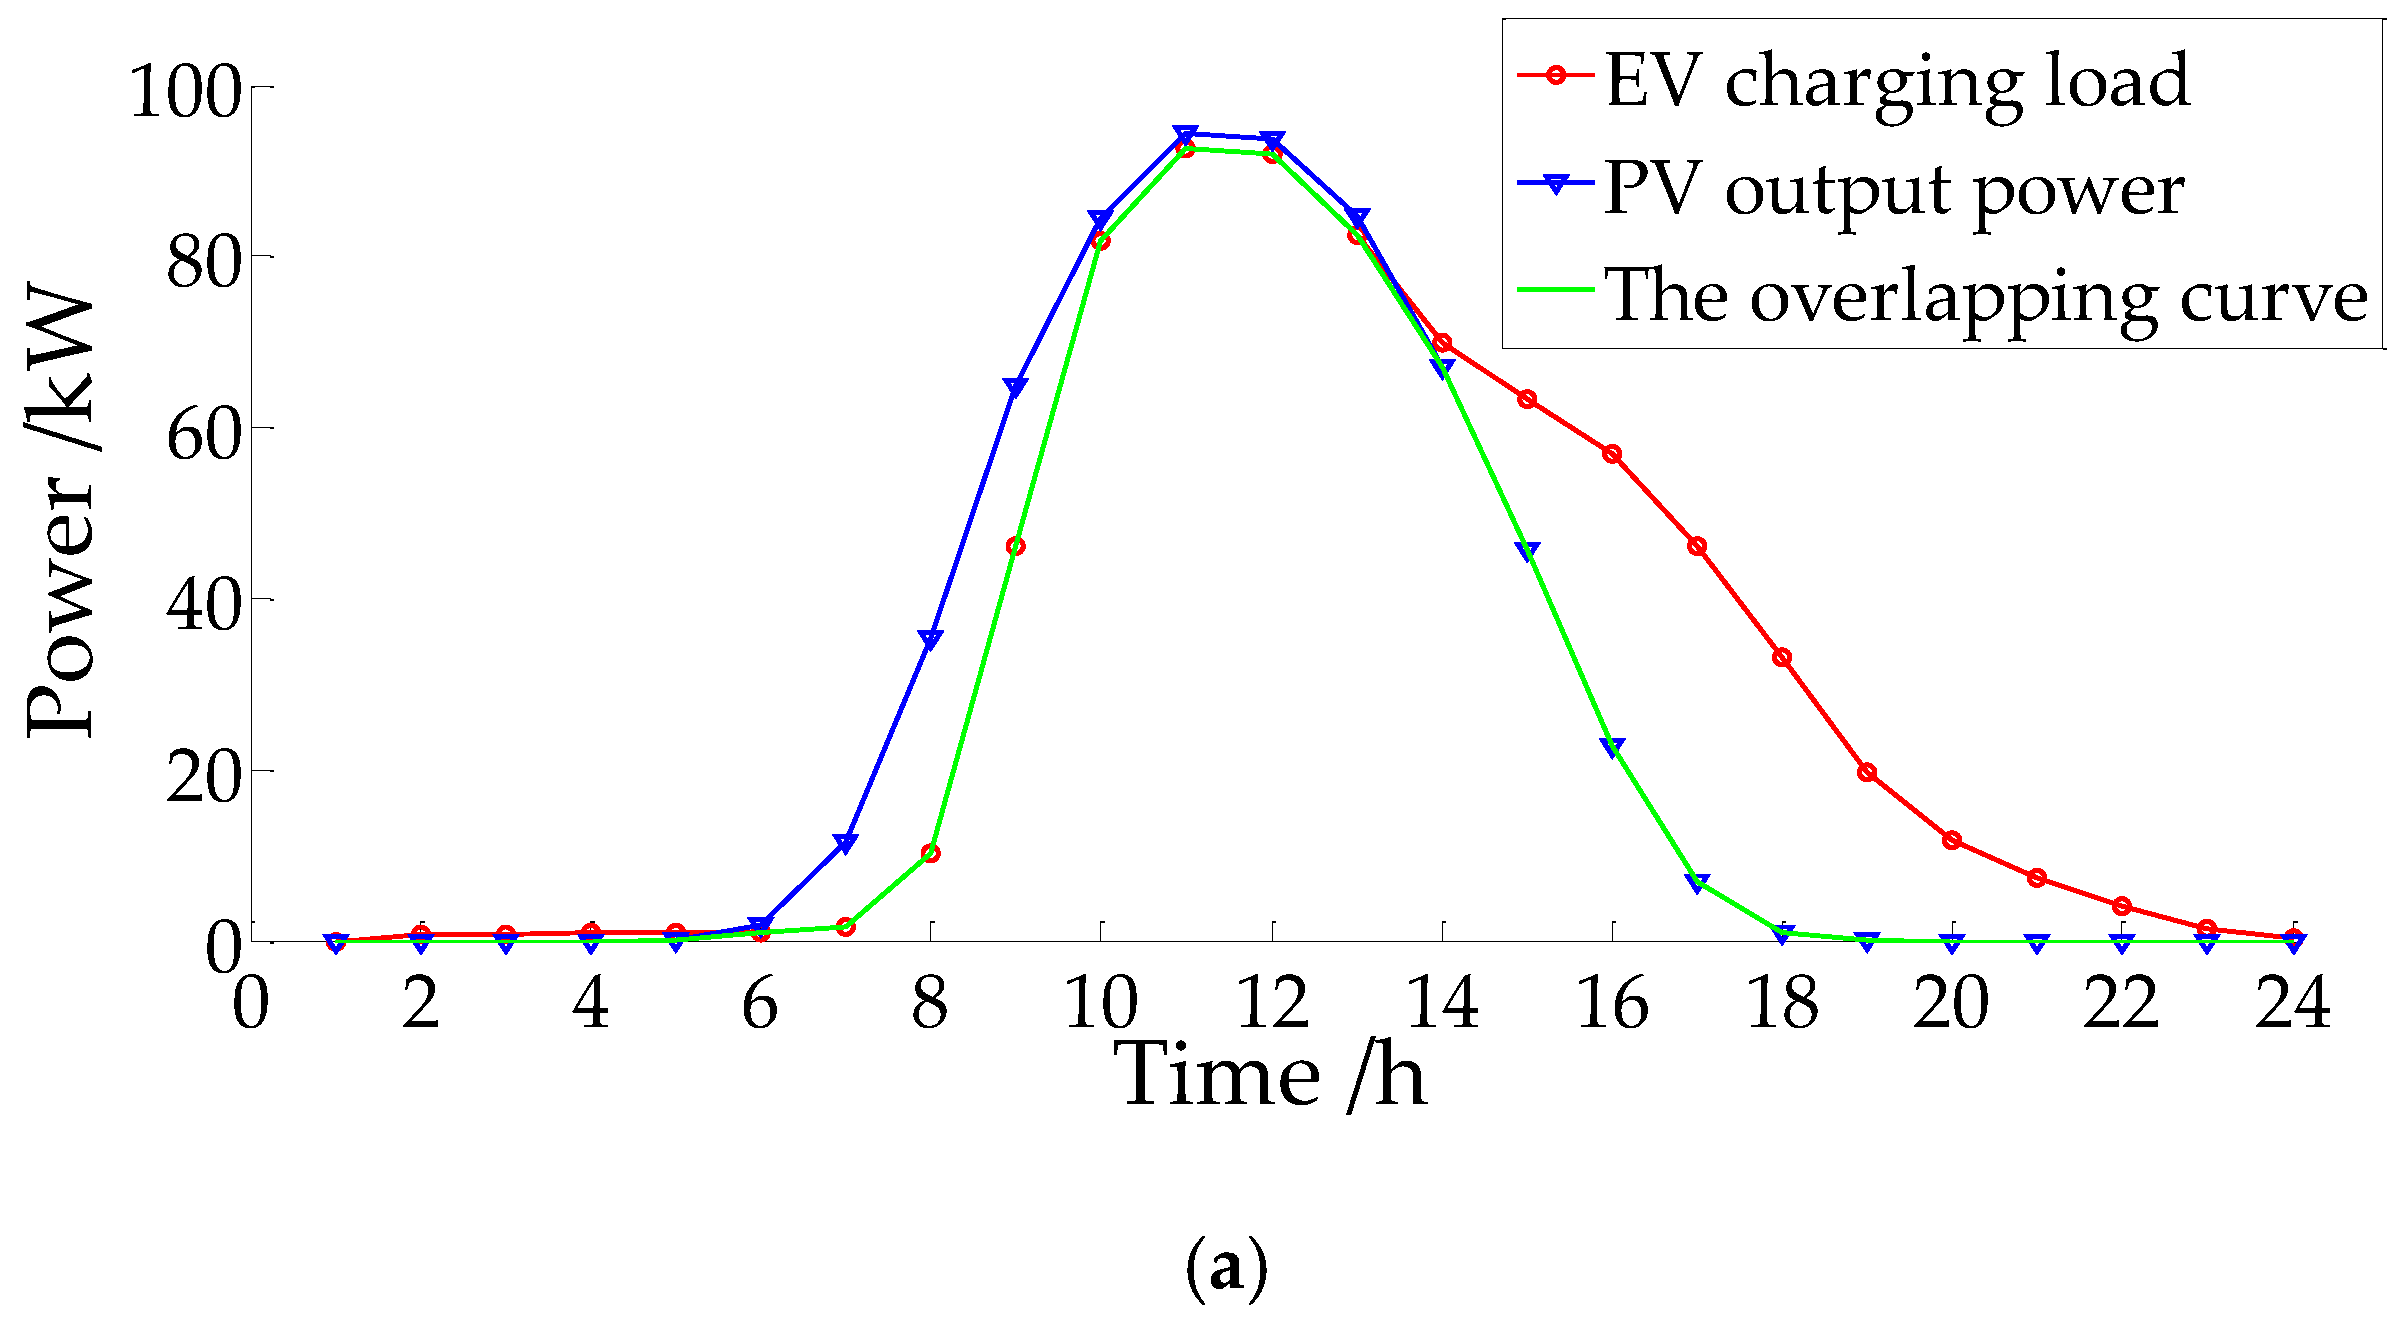
When the quantity bound is 52, the PV utilization for EV charging in each weather type is shown in
Table 2. The total electric energy of the PV in
Table 2 is calculated from the area between the “blue curves” in
Figure 11a,b,c and the horizontal axis, respectively. The electric energy provided by the PV for the EV charging comes from 52 EVs, which is calculated from the overlapping area between the “blue curves” in
Figure 11a,b,c and the unconstrained EV charging load curve from 52 EVs, respectively. It is obvious that the average PV utilization for the EV charging is more than 85% in one year at the workplace.
As discussed in
Section 5, if the actual number of EVs is larger than the aforementioned quantity bound, a portion of EV batteries might need to be charged only from the grid. In the simulation of the optimal charging method, different weather types are considered.
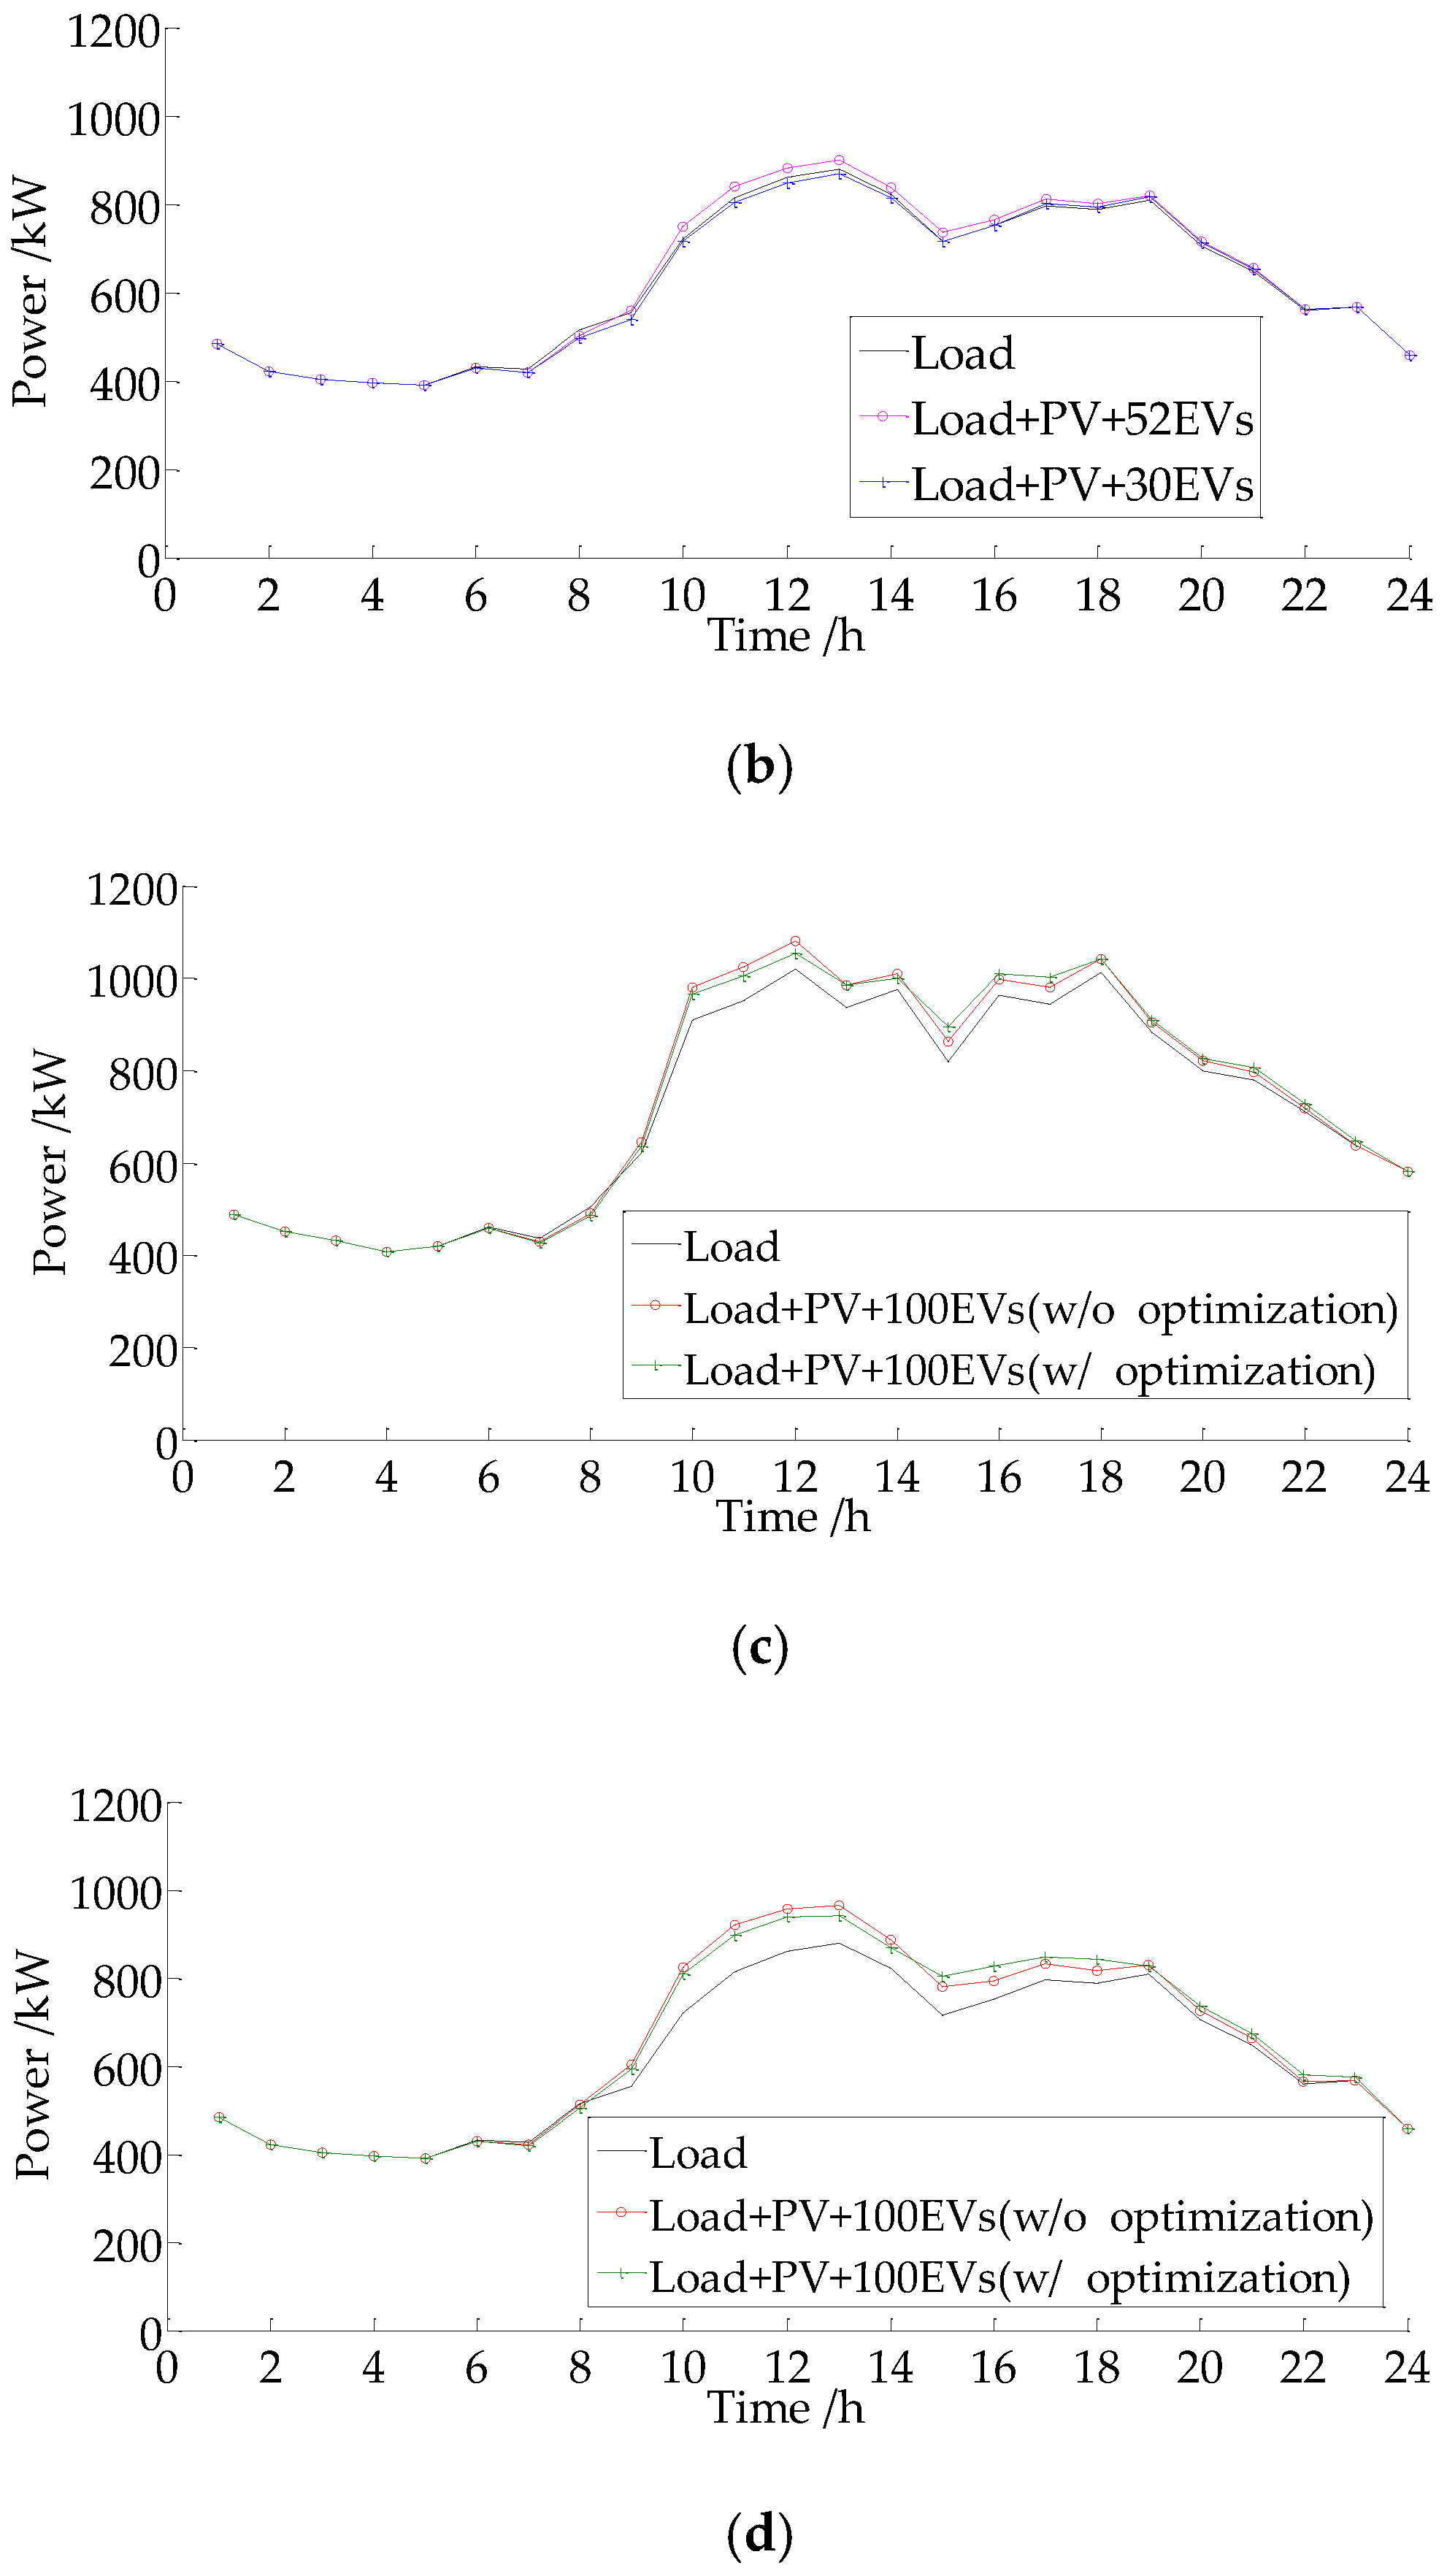
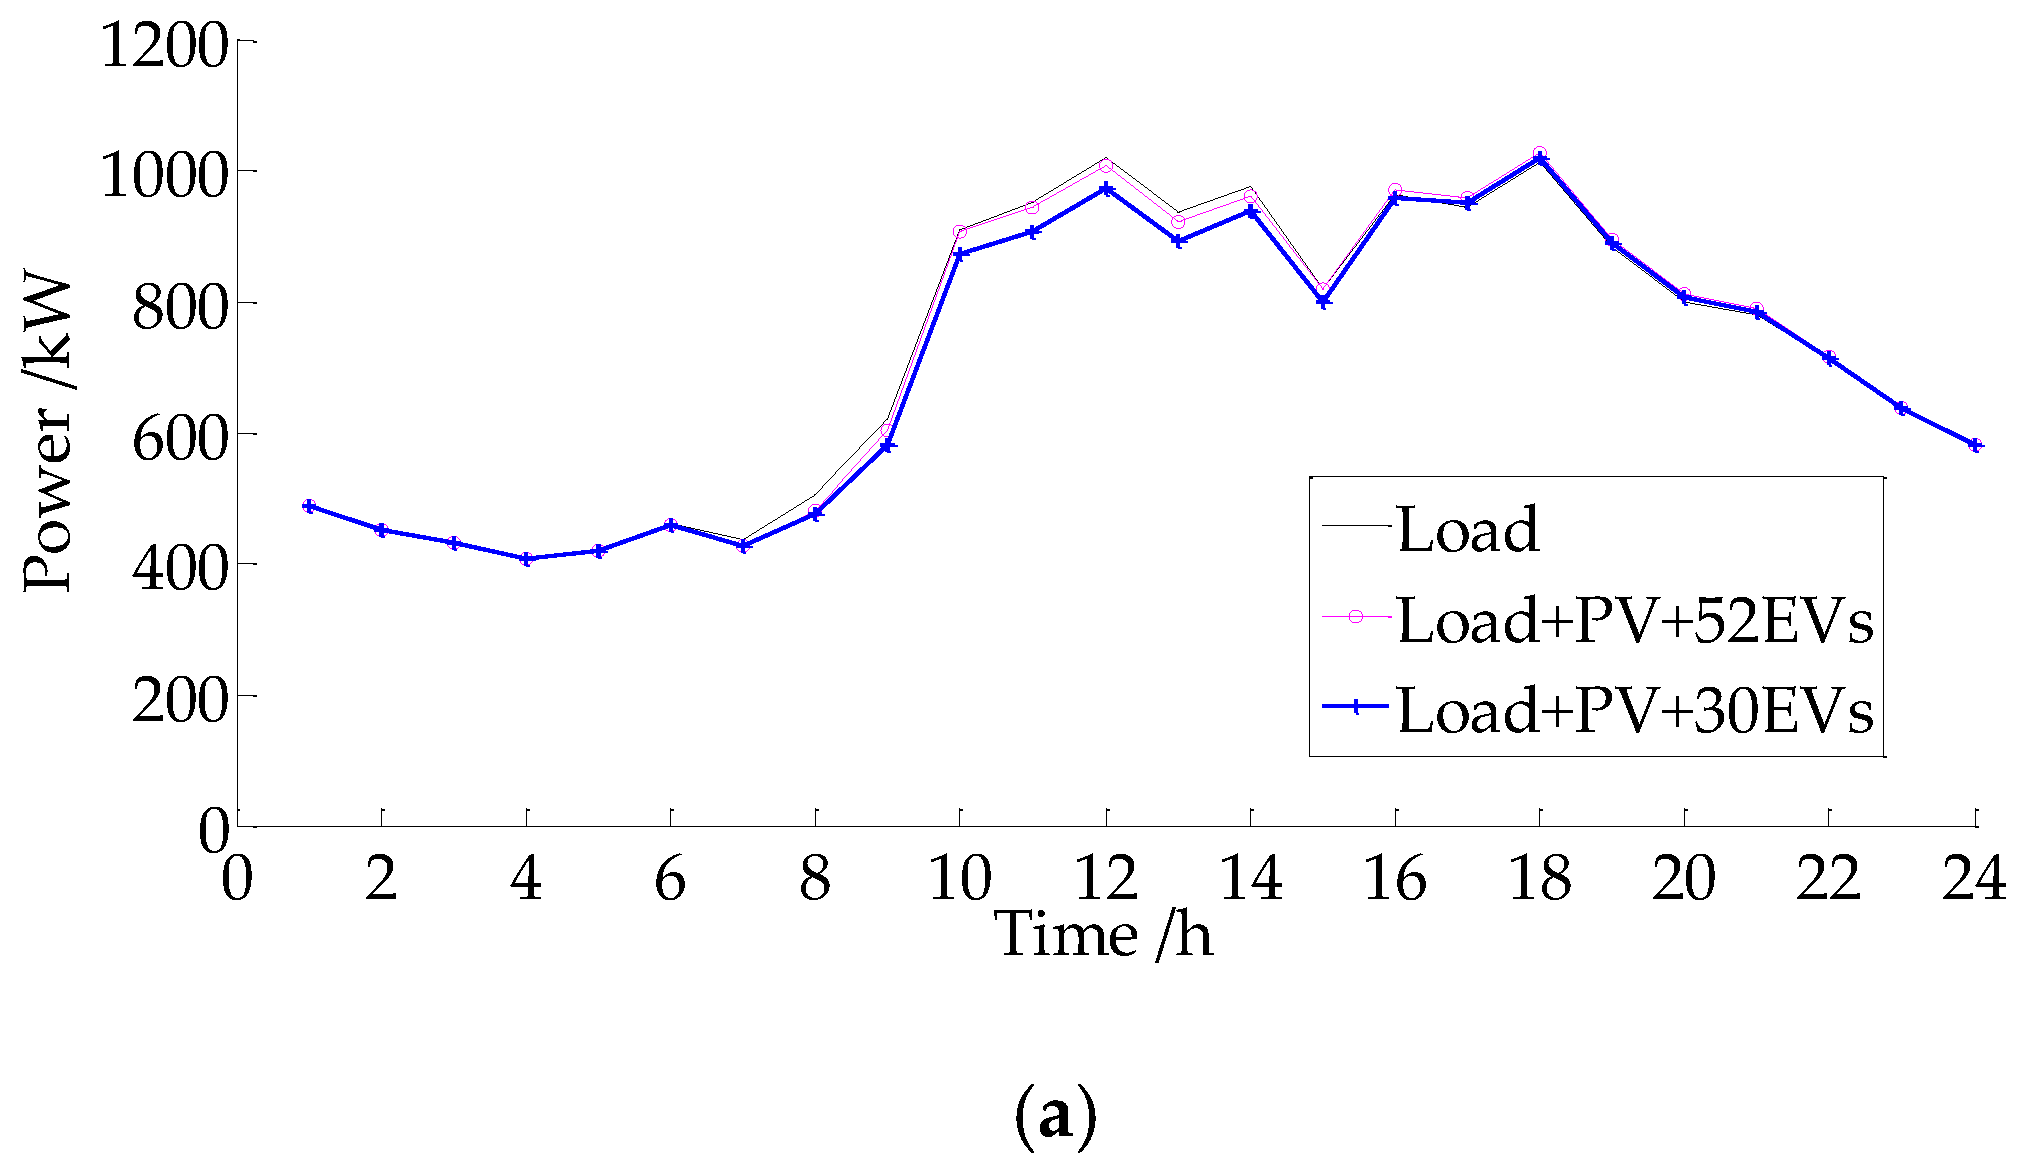
The simulation results on the sunny day with 30 or 52 EVs are shown individually in
Figure 12a. The symbol “Load” in
Figure 12 denotes the basic load. The basic load is defined as the load of the workplace without the EV charging load and the PV output. As can be seen from this figure, when the actual number of EVs is 52 or 30, the daily net load curve is lower than the basic load curve between 09:00 and 14:00 but at different levels. That is because the PV can compensate the whole unconstrained EV charging load and there is still a surplus PV output which can be consumed by the office load.
The simulation results on the rainy day with 30 or 52 EVs are shown in
Figure 12b, respectively. It can be seen that the result with 30 EVs is quite similar to that of the sunny day. When the actual number of EVs is 52, the daily net load curve is a little higher than the basic load curve, which is the worst situation for the proposed strategy. However, the proportion of the rainy days is only 24.6% throughout a year, which has very limited impact on the overall implementation.
The simulation results on the sunny day with 100 EVs are shown in
Figure 12c. When the actual number of EVs is 100, the peak of the daily net load curve with the optimization is lower than that without the optimization between 10:00 and 13:00. The result of the 100 EVs shows that the proposed charging strategy is beneficial to alleviate the negative impact of the EV charging load on the characteristic of the original load curve.
The simulation results on the rainy day with 100 EVs are shown in
Figure 12d, which are quite similar to that of the sunny day.
Figure 12 shows that the proposed EV charging strategy in this paper has a potential to deliver great performance for different weather conditions at the workplace.
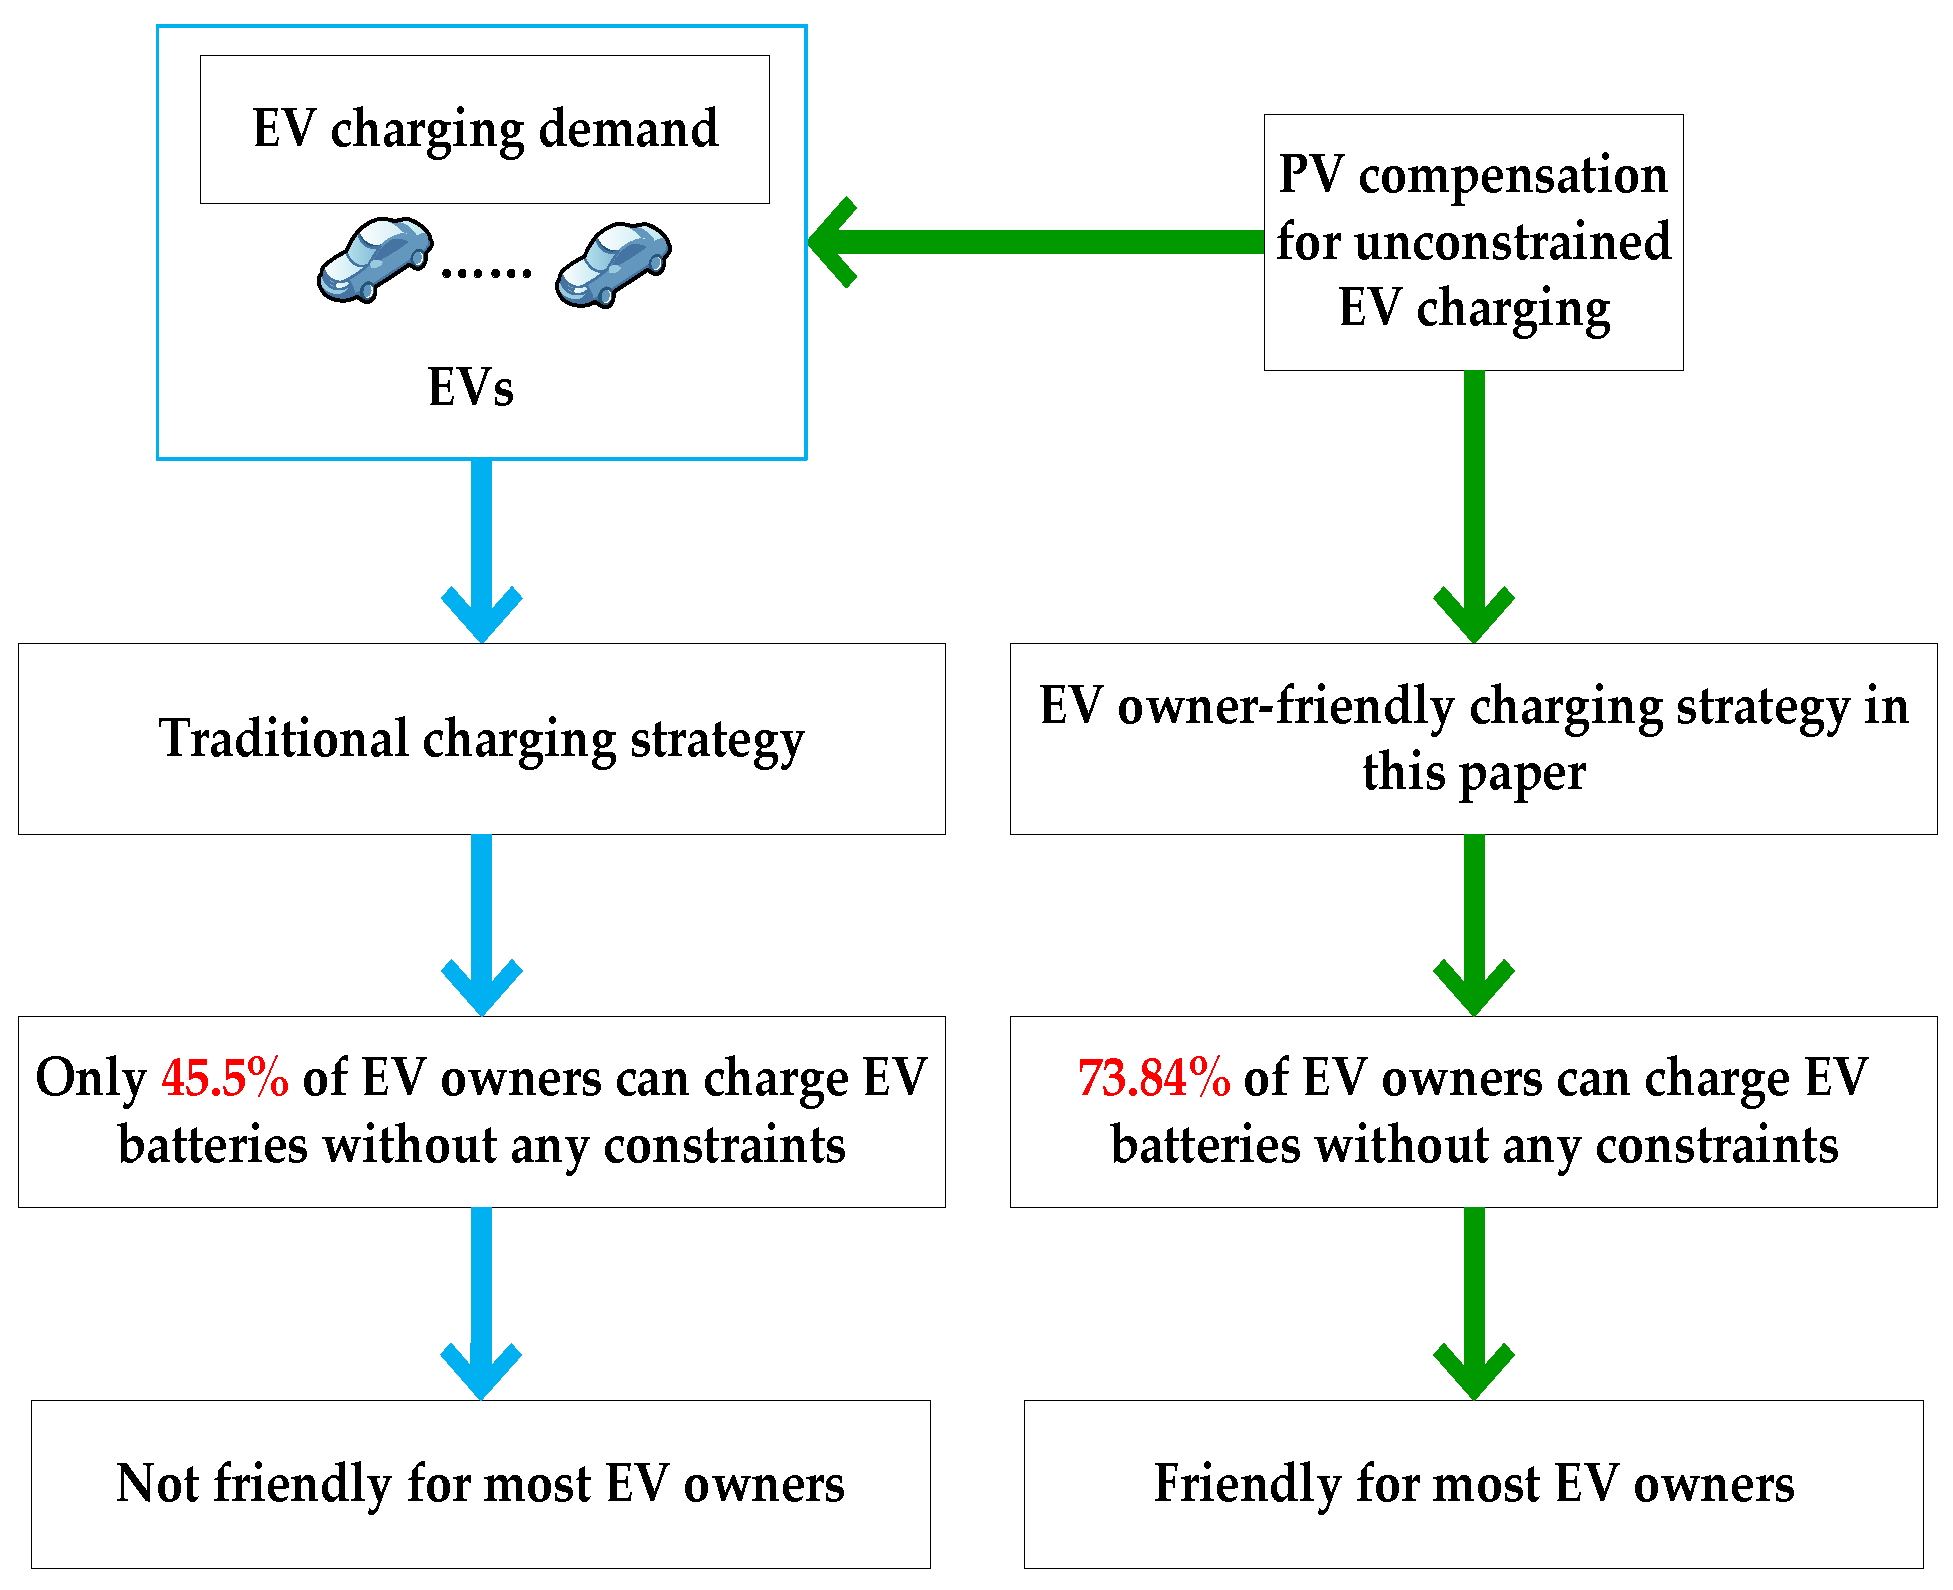
As discussed in
Section 3.2, in order to meet the grid optimization, 54.5% of EV owners have to participate in the traditional charging optimization regulation if there is no PV system integration at the workplace. In case of 100 EVs and 150 kW PV system as an example, the quantity bound of the unconstrained EV charging is 52, which means that this PV system can compensate more than 50% of the EV owners to charge their EVs without any constraints. The remaining EV owners have to charge their EV batteries only from the grid (i.e., without the support from PVs) and 54.5% of this part of the EV owners should participate in the optimal charging regulation. From the above analysis results, it can be seen that 73.84% of the EV owners can charge their EV batteries without any constraints through the proposed strategy in this paper. The details are shown in
Figure 13.
From the PV owner’s point of view, the PV generation may be sold to the conventional electricity users as “the office load consumption” or the EV owners as “the EV charging load consumption”. Therefore, it is important to analyze the economic advantage for the PV owners to sell the PV generation to EV owners as the EV charging consumption.
The PV on-grid price is set to 1 CNY/ kWh [
36]. The time of use (TOU) price for the general industry in Beijing is shown as follows [
37]:
- (1)
Price during the peak period (10:00–15:00, 18:00–21:00): 1.322 CNY/kWh
- (2)
Price during the medium period (7:00–10:00, 15:00–18:00, 21:00–23:00): 0.832 CNY/kWh
- (3)
Price during the valley period (23:00–7:00): 0.369 CNY/kWh
According to [
37], the upper limit of charging service fees per kilowatt hour is equal to 15% of the highest retail price per liter of No. 92 gasoline. The reference price for No. 92 gasoline is 5.96 CNY/L. Therefore, the charging service fee is set to 0.894 CNY/kWh.
Based on the above hypothesis, the simulation results of the economic comparison on the PV owners are shown in
Table 3. As can be seen from the figures in
Table 3, the PV owner can gain about 300–500 CNY more per day if they sell the PV generation to EV owners as the EV charging load consumption.
7. Conclusions
In order to let more EV owners charge their EV batteries at the workplace without any constraints and to alleviate the negative impact of the EV charging load on the distribution grid operation, an EV owner-friendly charging strategy using PVs is put forward.
Firstly, the maximum number of EVs with unconstrained EV charging using PVs (which is defined as quantity bound) is analyzed. The maximization of the overlapping area between the load curve of the unconstrained EV charging and the PV output curve is formulated as an optimization problem. Then, the area-calculation-based PSO algorithm is applied to derive the value of the optimized variable.
If the actual number of EVs is smaller than the aforementioned quantity bound, all the EV batteries can be charged without any constraint with the use of the PV compensation/support. On the other hand, if the actual number of EVs is larger than the aforementioned quantity bound, a portion of EVs need to be charged only from the grid, i.e., without PV support, and the minimization of the line loss is represented as the objective function to regulate the charging state of this portion of EVs.
Finally, a case study was performed and it shows that the proposed EV owner-friendly charging strategy could make full use of the PV output to compensate more unconstrained EV charging load. Thanks to PVs, the fraction of the EV owners who could charge their EV batteries without any constraints increased from 45.5% to 73.84%. In other words, the proposed strategy successfully increased the number of EV owners who eliminated the EV charging constraints, i.e., the EV owners’ inconvenience is minimized. Through the optimization for the charging state, the peak-to peak of the daily net load curve could be decreased if the actual number of EVs was larger than the aforementioned quantity bound. That means, the proposed strategy could minimize the negative impact of the EV charging load on the distribution grid operation.
Selling the PV generation to EV owners instead of office load users was also studied and discussed from the economic benefit perspective. The simulation results showed that the PV owner could earn 300–500 CNY more per day, which showed that the proposed strategy was also beneficial to PV owners.
Almost all of the low voltage distribution grids in China are radial network structures. Therefore, the proposed charging strategy has a great potential to be widely applied to resolve the EV charging related issues at the workplace in Chinese cities with PV integration. The proposed strategy is expected to be generalized to cope with the large integration of EVs in other countries which employ a wide variety of grid codes, which is one of the important future works.
In this paper, the shape of the PV output curve was nearly the same as the shape of the load curve of the EV charging load and the constraints on the grid were not violated. However, in other situations, there can be a serious mismatch between those shapes of the PV output curve and the load curve of the EV charging load. In such a case, some of the constraints of the distribution grid operation are likely to be violated and the additional energy storage batteries will be needed eventually. The above situations will be studied in the future work.
Limited to the amount of data, only one year of the PV output data and the solar radiation data were used and analyzed in this paper. More accumulated historical data from over one year will be collected and analyzed to enhance the contribution of the PV for further integration of EVs.

 ,
, 