CAES Systems Integrated into a Gas-Steam Combined Plant: Design Point Performance Assessment †

Department of Engineering, ROMA TRE University, via della Vasca Navale 79, 00146 Rome, Italy
†
The present work is an extension of the paper “Performance Assessment of a CAES System integrated into a Gas-Steam Combined Plant” presented to ICEER 2017 Conference, 17–20 July, Porto, Portugal, and published in Energy Procedia.
Energies 2018, 11(2), 415; https://doi.org/10.3390/en11020415
Submission received: 31 October 2017
/
Revised: 22 January 2018
/
Accepted: 6 February 2018
/
Published: 11 February 2018
(This article belongs to the Special Issue Selected Papers from ICEER 2017: 2017 the 4th International Conference on Energy and Environment Research)
Abstract
:In the present paper, the performance of an energy storage concept based on the integration of a compressed air energy storage (CAES) system into a Gas-Steam combined cycle (GSCC) plant is investigated. CAES systems featured by different design specifications have been coupled with a commercially available small size GSCC plant. Storage efficiencies up to 65% have been evaluated for CAES design power output ranging from 5 to 10 MW. A techno-economic analysis aimed at assessing plant performance and investment costs has been performed. Despite the relatively high investment costs and the storage efficiency being less than those featuring alternative storage approaches, the proposed system may be considered of interest due to the long-life duration and the established technologies available for the key plant components.
1. Introduction
The share of renewable energy in the electric system has greatly increased worldwide in the last decade. Such a growth is mainly related to the increasing utilization of wind and solar energy sources, with hydraulic energy almost completely exploited in many countries. The use of renewable energy sources (RES) contributes significantly to the reduction of CO2 emission and to the sustainability of the overall energy system. On the other hand, the intermittency and the uncertainty in forecasting RES availability bring serious issues in the management of electric grids. The production from RES (especially from wind and sun) is inherently independent from the electric request and, therefore, to fulfil safely the load demand along the time, the production from thermo-electric and hydro plants has to be scheduled accordingly. The intermittency and the uncertainty in predicting the RES availability with a sufficient level of accuracy over time force the electric grid operators to rearrange the unit commitment by putting in operation (or switching off) other generators or by deploying the available spinning reserve. Such actions entail additional costs, which are ultimately passed on to the end consumer.
Electric energy storage (EES) can contribute to mitigating the above issues and, consequently, to further promoting the market penetration of RES. EES systems can generate additional electricity when RES availability is insufficient to meet the forecast production level or store electricity in case of an excess of availability.
Such an application calls for EES featured by suitably long charging–discharging phase durations (hours) and by an adequate storage capacity. The most suited technologies to accomplish such a task are pumped hydro storage (PHS), battery energy storage (BES) and compressed air energy storage (CAES). A comprehensive review about the state-of-the-art of the above technologies is given in [1].
The CAES basic principle of operation is rather simple. Electricity is absorbed from the grid during low demand periods to power a compressor which fills with air a storage tank. During high electricity demand periods, the compressed air is taken from the reservoir and expanded in an air turbine to produce electric power. On the basis of such a concept, a variety of solutions have been proposed and investigated over time. Such solutions can be classified into three main categories: diabatic CAES (D-CAES), adiabatic CAES (A-CAES) and isothermal CAES (I-CAES).
In D-CAES, an external heat source (usually a fuel) is utilized to heat the compressed air before the expansion. Existing CAES plants (Huntdorf and McIntosh plants) fall into this category. During the discharge phase, the air taken from the reservoir enters a combustion chamber fed with natural gas. The combustion gas is expanded in a high-pressure turbine, reheated in a secondary combustion chamber, expanded in a low pressure turbine and finally discharged into the atmosphere. A multistage intercooled/aftercooled compression process is adopted to reduce the compression work and to keep the air temperature within the operational limits featuring the industrial compressor stages [2].
In a scenario geared towards a progressive de-carbonization of the electric systems, the use of fossil fuels to support an ESS may be deemed inappropriate. Therefore, to achieve an emission-free, pure storage technology, the adiabatic CAES concept (A-CAES) has been proposed. In such a concept, the heat absorbed by the intercoolers during the compression phase is stored in a thermal energy storage (TES) system and utilized during the discharge phase to heat the pressurized air. A-CAES systems can be classified into high temperature (400–800 °C) [3,4] and low temperature (80–200 °C) systems [5]. High temperature systems call for innovative compressors capable of operating at very high discharge temperatures. Besides this, the development of high temperature and pressure TES still requires considerable technological and economic efforts [5]. Low temperature A-CAES systems are not affected by the above issues. However, the huge number of compression and expansion stages needed to reach a satisfactory performance level represents a major drawback [6]. Such complex compression and expansion trains eventually entail relevant investment costs and complications in controlling plant operation.
Finally, the recently proposed isothermal CAES (I-CAES) approach removes the need for TES. Quasi-isothermal compression and expansion are accomplished by exchanging heat with the surrounding environment by using heat transfer surfaces or a liquid medium in direct contact with the air. Solutions based on the adoption of liquid pistons appear too slow for industrial uses [7,8]. Concepts based on the addition of a liquid to absorb, store and release the heat to accomplish near isothermal compression and expansion processes are not yet mature for industrial applications [8].
Many countries are pursuing as a final goal a “decarbonized” electric system. Nevertheless, the traditional fossil fueled plants will still play a key role in the next decades. Taking the above into consideration, the possibility of using such plants to improve grid storage capabilities can represent an attractive option.
In the past decade, Nakhamkin introduced the so-called second-generation diabatic CAES concept [9]. Basically, second-generation diabatic CAES plants (D-CAES2) integrate the air compression and storage system with a commercially available gas turbine (GT). According to such a concept, a GT power augmentation is achieved by injecting the stored air downstream of the GT compressor. Improvements can be attained by pre-heating the stored air by using the GT exhaust and expanding the heated air in a topping turbine prior to the injection in the GT combustion chamber. Such systems have the potential to bring relatively low investment costs, good storage efficiency, high availability and reliability levels, and a good response to quick load change requests [9]. Such a concept has been further investigated by the author [10,11]. The performance of a small-size CAES plant coupled with a 4600 kW Mercury recuperated GT has been evaluated during the overall operational cycle (charging, storage and discharging phases). A 30% maximum extra power delivery (some 1500 kW) in respect to the nominal design GT output power has been assessed with a satisfactory storage efficiency values around 70%.
As previously discussed, a drawback of D-CAES2 is the need for an additional amount of fuel to heat the stored air mass flow rate injected downstream of the GT compressor. To overcome or reduce such a downside, alternative concepts integrating D-CAES systems into fossil fueled energy systems have been recently investigated by various authors.
As an example, Li et al. [12] proposed the integration of a D-CAES system into a diesel engine to produce electricity for off-grid applications. During the CAES discharge phase, the compressed air is heated by using the otherwise wasted thermal energy content of the diesel engine exhaust gases. The same concept has been taken up in [13]. In order to further improve the overall system performance, the engine exhaust gas, after being used to preheat the compressed air before expansion, is supplied to an ammonia-water absorption refrigeration system. Moreover, during the charging phase, the heat removed by the intercoolers is used to satisfy thermal needs.
Chen et al. [14] take as a starting point the fact that about 50% of energy used in Chinese industry is rejected into the environment, mostly in form of low-grade heat available at temperatures lower than 200 °C. They concluded that such a low-grade heat can be regarded as a free heat source to feed CAES systems. The resulting D-CAES storage efficiency level is not completely satisfactory, due to the low expanding air temperature that can be achieved by using the low-grade waste heat. Significant improvements are attained by reducing the compression work during the charging phase. Such a reduction is achieved by lowering the temperature of the air entering the compression stages by means of a vapor compression chiller driven by electric power absorbed from the grid.
Safaei et al. [15] carried out a techno-economic analysis of a D-CAES integrated into a complex system constituted by a wind farm, GT-based power plants and a district heating network fed by fossil-fueled large-size boilers. They introduced the concept of distributed CAES, where the air compression stations are distributed near the district heating facilities. The heat absorbed during the intercooled compression is used to feed the district heating network, thereby reducing or negating the fuel consumption of the boilers. The economic result of the distributed CAES is compared with the traditional diabatic one. They concluded that, under specific conditions related to the fuel price and to the level of the emission tax, the distributed CAES shows a better economic performance.
Meng et al. [16] investigated the integration of a D-CAES system with an organic rankine cycle (ORC) to recover the waste heat from intercoolers in the charging process and from the exhaust air in the discharging process. The additional ORC electricity generation, obtained without using additional fuel, leads to a storage efficiency improvement of about 6%.
In the aim of achieving a fuel free energy storage system, the author proposed a novel concept integrating a D-CAES into a Gas-Steam combined cycle (GSCC) plant [17].
In a GSCC, the otherwise wasted thermal content of GT exhaust gas is used to generate steam in a heat recovery steam generator (HRSG). Steam is expanded in a steam turbine (ST) to produce power in addition to that produced by the GT without using supplementary fuel. At the present time, such plants allow the large scale conversion of the fuel energy into electricity in the most efficient way. In GSCC plants, the electricity production per kilogram of exhaust gas fed to HRSG ranges from 100 to 250 kJ/kg, depending on the gas temperature and on the steam section arrangement (dual or triple pressure steam production, steam reheating and so on) [18]. Higher values are typical of large size plants based on advanced heavy duty GTs. Such GTs are featured by high exhaust gas temperatures (about 600 °C), which allow the production of high temperature/high pressure steam. In order to maximize the conversion efficiency, such plants are equipped with rather complex steam sections where superheated steam is produced at high, medium and low pressure. Small/medium-size GSCC plants (i.e., 50–200 MW) are featured by a lower electricity production per kilogram of exhaust gas (100–180 kJ/kg). Usually, small/medium size GSCC plants are arranged with a dual pressure HRSG and no steam reheating before the expansion in the low pressure ST.
The here proposed integrated plant concept stems from the following considerations. In a D-CAES, the compressed air is heated before the expansion in order to increase the output power. The idea is to take a fraction of the GT exhaust gas flow rate fed to HRSG to heat the stored compressed air: if the electricity produced per kilogram of GT exhaust gas is higher than that obtained during normal GSCC operation, such an electricity surplus can be deemed as being achieved without using additional fuel.
The plant reference layout is given in Figure 1. During the charging phase, a certain amount of electric power is absorbed from the grid to drive an electric motor M connected to a multi-stage intercooled/aftercooled compressor. As the charging phase takes place, both valves V1 and V2 are closed. Therefore, the compressed air is stored into the reservoir while all the GT exhaust gas flow
During the discharge phase, conversely, both valves V1 and V2 are opened. As a result, a fraction of GT exhaust gas is diverted to the air heater (AH) to heat the stored compressed air prior to its expansion in an air turbine (AT). The integrated system can give rise to a surplus of power production in respect to that produced by the sole GSCC plant, provided that a sufficient amount of air is fed to the AT at an appropriate level of pressure and temperature. Preliminary investigation addressed to CAES systems integrated into medium/small-size GSCC have shown that the CAES production per kilogram of GT exhaust gas, by varying the expanding air pressure in the range 60–100 bar, is 3–4 times greater than that actually achieved by using the kilogram of gas for steam production in the HRSG.
Such an augmentation can give rise to an electricity surplus production with respect to normal GSCC operation in the order of 300–350 kJ per kilogram of exhaust gas without any additional use of fuel. As a result, the storage system can be regarded as a “fuel free” one as BES, PHS or adiabatic CAES.
In order to explore the practical feasibility of the proposed system, a techno-economic analysis aimed at assessing plant performance and investment costs has been carried out [17]. Results have shown that, despite the relatively high investment costs and the storage efficiency being less than those featuring alternative storage approaches, the proposed system may be considered of interest due to the long life duration and to the proven technologies available for the key plant components.
It has to be pointed out that such a preliminary investigation was addressed to a first assessment of the potentialities of the proposed concept. As reported in [17], evaluations had been performed by adopting conservative assumptions and, for sake of simplification, by neglecting some aspects related to GSCC plant operations expected to give a positive contribution to the performance of the whole integrated system.
A more accurate and realistic performance assessment has been discussed in a paper [19] presented at the 4th International Conference on Energy and Environmental Research (ICEER 2017): taking as reference a commercially available GSCC plant, various design options featured by different CAES power outputs are analyzed and evaluated taking the above aspects into consideration. In the present work, which is an extension of the ICEER 2017 conference paper, further CAES design options are analyzed and discussed.
2. Technical Considerations
In the previously cited author’s paper [17], the integrated system storage efficiency was evaluated according to the following formula:
where is the electric production attained by expanding the stored air, the loss of electric production from GSCC due to the lowering of the gas mass flow rate entering the HRSG and the electricity absorbed from the grid during the charging phase to compress the mass of air fed to the gas expander.
The term can be expressed as
where represents the mass of gas taken to feed the air heater and which, therefore, does not contribute to the steam generation in the HRSG and the electricity generated per kilogram of gas in the GSCC steam section at reference (design) condition. Nevertheless, the storage efficiency given by Equation (1) takes no account of two significant aspects characterizing the part load behavior of the GSCC steam section:
- the HRSG performance improvement occurring when the gas mass flow rate is reduced and GT exhaust temperature is kept at reference design value;
- the lowering of the steam condensing pressure.
The first outcome stems from the fact that when the gas mass flow rate reduces, the steam production is reduced too. As a consequence, the ratio between the actual heat transfer surface and gas (or steam) mass flow rate increases. Conversely, the mass flow reduction on both sides leads to a decrease of the overall heat transfer coefficient. If the gas flow rate reduction is not too high, the first effect prevails on the second one and the ratio between steam production and gas mass flow rate shows an increasingly trend. The heat transfer enhancement leads to a reduction of the HRSG exhaust temperature and, consequently, to an improved HRSG effectiveness defined as:
being the gas mass flow rate entering the HRSG, the gas specific heat, and the gas inlet and outlet temperatures respectively and, finally, the ambient temperature.
Such a situation is typically encountered in GSCC plant part load operations when the power output is reduced by closing the compressor variable inlet guide vanes (VIGVs) and variable stator vanes (VSVs): the GT exhaust flow decreases linearly with the GT power output while the turbine exhaust temperature is kept constant at its design value [20]. The resulting part load HRSG performance is analyzed and widely discussed in [21,22].
The second aspect under consideration is related to the condenser heat duty reduction occurring when the GSCC steam section operates at part load. If the coolant mass flow is kept constant at its design value, condensing temperature and pressure decrease with decreasing the steam mass flow rate entering the condenser. Such a pressure reduction can bring to small but not negligible specific work improvements. In fact, due to really high steam specific volume at the last turbine stage exit (around 25 kg/m3), a condensing pressure drop of 1 kPa leads to a work augmentation of about 25 kJ per kilogram of steam. Taking into account that typical values for steam specific work are within the range of 1000 to 1500 kJ/kg [18], improvements ranging from 1.5 to 2.5% can be achieved.
To take into account benefits arising from the previously discussed aspects, the actual electricity surplus generated during the discharge phase is evaluated as follows:
where is the electric production from the stored air, is the electricity actually produced by the GSCC steam section fed with a reduced gas mass flow and the electric production at reference design condition (i.e., when the CAES plant is not in operation). Equation (4) can be rewritten as
where is the mass of gas fed to the HRSG and the steam section electric production per kilogram of gas. Superscript “*” designates the reference design condition. Taking into consideration that during CAES operations (Figure 1), Equation (5) can be rearranged as follows:
The last term represents the loss of electric production already defined in Equation (2) and the positive term in square brackets accounts for the increase in electricity production due to steam section improved part load operations. Thus, a formulation that best expresses the storage efficiency of the integrated system has been introduced:
3. Plant Description and Modelling
According to [23], CAES might be efficiently and profitably used for off-grid and self-consumption applications, and for the provision of ancillary services on the lower grid levels. Such applications call for a small or medium size storage plant suitably distributed on the electric network. Therefore, storage systems capable to absorb and release power in the range of 5–15 MW integrated in small-medium size GSCC will be addressed. Finally, to avoid any restriction to the plant location related to the availability of natural reservoirs, artificial air tanks are taken into consideration.
In the following sub-sections, the main technical features of the proposed system and the adopted modelling approach to analyze the behavior of the various units constituting the whole plant (i.e., GSCC, CAES compression and storage system, CAES expansion system) are described in detail.
3.1. Gas-Steam Combined Cycle
A commercially available small-size GSCC plant based on a SGT-800 Siemens GT coupled with a dual pressure HRSG manufactured by Bertsch [24] has been taken as reference. On the basis of available manufacturer information, an equivalent sizing of the steam section has been performed to evaluate data required to carry out the part load analysis. Main steam section design features [18,24] are given in Table 1.
The steam section part load model has been set up according to [25,26,27]. Heat transfer devices (HRSG tube bundles and condenser) have been modeled adopting the ε-NTU approach. The steam turbine has been modeled by scaling suitable efficiency curves on the basis of reference design data and by adopting a modified Stodola ellipse law [28]. The expected GSCC steam section performance enhancement previously discussed has been evaluated. The steam section part load behavior has been analyzed by reducing the gas mass flow entering the HRSG.
Figure 2b gives the actual steam section power output in comparison with that calculated by assuming , i.e., neglecting the steam section off-design operation improvements. The distance between curves at the same abscissa gives a measure of the term in square brackets in Equation (6). It can be noticed that, by reducing the gas mass flow entering the HRSG, such a difference can represent a significant percentage of the actual power output. As an example, when decreases from 80 to 60% in respect to the reference nominal value , an almost constant difference between the actual steam section power output and the power evaluated by assuming the design value is observed. The difference is around 1 MW, accounting therefore for roughly 6–7% of . Such value is expected to give a noticeable contribution to the actual electricity surplus generated during the discharge phase and, consequently, to the storage efficiency defined according to Equation (7).
3.2. CAES Compression and Storage System
As previously stated, systems featured by a power capacity ranging from 5 to 15 MW equipped with a man-made air reservoir will be addressed. Therefore, the expected operating conditions (in terms of volumetric mass flows and pressure ratios) have led to the selection of a multistage centrifugal compressor, according to common engineering practice. The compression train is constituted by four intercooled stages followed by an aftercooler to reduce the density of the compressed air entering the reservoir. Among the various options available to arrange the storage system reported in [29,30], the solution based on the utilization of large diameter steel pipe connected by manifolds has been selected. As stated in [30,31], such a solution represents the most cost effective choice for storage pressure up to 150 bar. In order to evaluate the electricity absorbed along the charging phase, a simplified analytical model of the compression and storage system has been set up.
During the charging phase, the pressure ratio varies along the time depending on the amount of air inside the reservoir. In case of full charge, the pressure ratio ranges from to , being and the initial minimum and final maximum pressure inside the reservoir respectively, and the ambient pressure. The electricity absorbed during the charging phase has been evaluated according to the following assumptions:
- Air is considered a perfect gas;
- Full charge operations;
- Ambient air temperature and pressure set at 20 °C and 100 kPa, respectively;
- Constant compression stage polytropic efficiency . Such a value is assumed equal for all the stages;
- Temperature of air exiting the intercoolers and the aftercooler set at 45 °C;
- Overall pressure ratio equally shared among the compression stages according to:where is the stage pressure ratio at instant t and N the number of stages constituting the compression train;
- Constant air temperature inside the reservoir ( = 30 °C), according to [10];
- Mechanical and electrical losses evaluated by introducing an electric-mechanic efficiency = 0.97.
At the generic instant of the charging phase, when the pressure inside the reservoir is , the compression work required to introduce one kilogram of air into the storage tank can be expressed as
where is the air constant and ε the isentropic exponent. The first term on the right side accounts for the work absorbed by the first compression stage, which operates on air at ambient temperature . The second term expresses the work done by the following stages, where air enters at temperature , according to assumption (5). represents the stage pressure ratio: according to assumption (6), at each instant all stages operate at the same pressure ratio and, therefore, Equation (9) can be re-written as follows:
At the generic instant , the work required to introduce into the reservoir the mass during the time period is
According to assumptions (1) and (7), can be expressed in term of the pressure ratio increment related to the time period by applying the equation of state for perfect gases:
where is the volume of the storage tank. The work absorbed during the charging phase can be evaluated by substituting given by Equation (12) into Equation (11):
and integrating from to :
The overall mass introduced into the reservoir during the charging phase is calculated by applying the equation of state of perfect gases, under the assumption that the temperature inside the reservoir is constant:
where and are the air mass inside the reservoir at the end and at the begin of the charge, respectively.
Finally, the electricity required to store the unit of mass of air is evaluated by diving by ():
Results achieved by varying both and are reported in Figure 3a. For a given storage pressure, the electricity absorbed per kilogram of stored air decreases by reducing the pressure at the beginning of the charging phase. Moreover, according to Equation (15), the lower is, the lower the volume required to store a given amount of air is. The above considerations would lead to the adoption of low values for . On the other hand, as discussed later in Section 3.3, the reduction of the pressure at the beginning of the charging phase implies a decrease of the CAES electric production . Therefore, an analysis aimed at defining the most effective design conditions will be carried out.
3.3. CAES Expansion System
During the CAES discharge phase, a fraction of the GT exhaust mass flow rate is fed to the air heater (AH) to heat the stored compressed air prior to its admission to the air turbine (AT).
The AT is supposed controlled in constant pressure mode, i.e., the inlet pressure is kept constant during discharge operations. This means that the discharge phase ends when the pressure inside the air reservoir reaches a value somewhat higher than the AT inlet pressure. The difference is related to the pressure drop across the AH. Neglecting such a pressure drop (which accounts for some 1–2% of the pressure inside the storage vessel), it is assumed that the AT inlet pressure set point equals the stored air pressure at the end of the discharge phase, i.e., the minimum pressure inside the reservoir:
Therefore, for given AT inlet temperature and mass flow rate, CAES output power increases by increasing . Since the pressure inside the reservoir decreases as the discharge phase proceeds, the air is throttled before entering the expander to adjust the inlet pressure at the rated value. The higher the difference between storage pressure and AT inlet pressure, the higher the throttling loss is. The throttling loss assumes its maximum value at the beginning of the discharge phase and progressively reduces as the pressure inside the reservoir decreases. More efficient operations can be achieved by reducing the air throttling by controlling the AT in sliding pressure mode. On the other hand, such an improvement is expected to bring to higher investment costs and to a more difficult management of the power production. As a consequence, in both existing CAES plants (Huntdorf plant in Germany and McIntosh plant in Alabama), a constant pressure control mode has been preferred [2,23].
The air temperature level achievable at AT inlet is related to the GT exhaust gas temperature and to the hot side temperature approach assumed in designing the AH. Typical values of such a temperature approach are in the range 30–60 °C. Therefore, according to Table 1 data, an AT inlet temperatures around 500 °C can be attained.
Moreover, on the basis of previous technical and economic evaluations carried out in [19], suitable AT inlet pressure ranges from 60 to100 bar. Such air inlet conditions are a common feature of industrial steam turbines. Therefore, the AT can be designed according to the steam turbine engineering practice [32]. The same technology developed for HRSGs commonly used in GSCC plants can be used to arrange the AH. The only difference is that in the present application pressurized air replaces the water/steam as tube side fluid.
As an important consequence in terms of technical and economic feasibility, the CAES expansion system key components can be manufactured by adopting proven and reliable technologies.
Expansion system design point performance is evaluated for given AT inlet pressure and temperature. Heat transferred to the air and output power are calculated according to the following assumptions:
- Temperature difference between gas and air at AH hot side equal to 50 °C (resulting in an AT inlet temperature of 495 °C);
- AH gas exhaust temperature equal to 100 °C;
- AT polytropic efficiency equal to 0.85;
- Mechanical–electrical efficiency equal to 0.95.
4. Integrated Plant Performance Analysis
In order to assess the integrated plant performance at design point, analyses have been carried out by varying relevant design quantities such as , and the gas mass flow rate derived to fed the AH .
At first, CAES systems featured by different design values of have been taken into consideration. In each case, a storage pressure of 100 bar has been assumed while the pressure at the end of the discharge phase is fixed at 60 bar. According to Equation (16), an electric absorption of 578 kJ per kilogram of stored air is required to accomplish the charging phase.
Results achieved by varying from 13 to about 52 kg/s (corresponding to ranging from 90 to 60%) are shown in Figure 3b. The AT electric power output varies linearly with , as a consequence of assumptions reported in Section 3.3. The net power production —defined according to Equation (4)—ranges from 5 to about 18 MW. Storage efficiency—valuated according to Equation (7)—decreases by increasing the CAES size, i.e., the GT exhaust gas mass flow rate. Values higher than 60% are achieved for values ranging from 5 to 10 MW.
Equation (1) gives a constant storage efficiency value of 0.56, irrespective of the size of the system. It has to be pointed out that the use of Equation (1) leads to a noticeable 10% underestimation in respect to the actual performance of the integrated system. Such a performance reassessment reinforces the conclusions drawn in [19] about the potential of the proposed system to emerge as an economically viable storage alternative.
Plant design point performance has been investigated by varying both the storage pressure and the pressure at the beginning of the charging phase . In carrying out the analysis, design gas mass flow rate has been kept constant at 25.6 kg/s, corresponding to a 80% reduction. Section 3.3 assumptions lead to an air mass flow rate fed to the AT exactly equal to On the basis of Figure 2b data, an 80% reduction leads to an actual steam power production of some 17.8 MW.
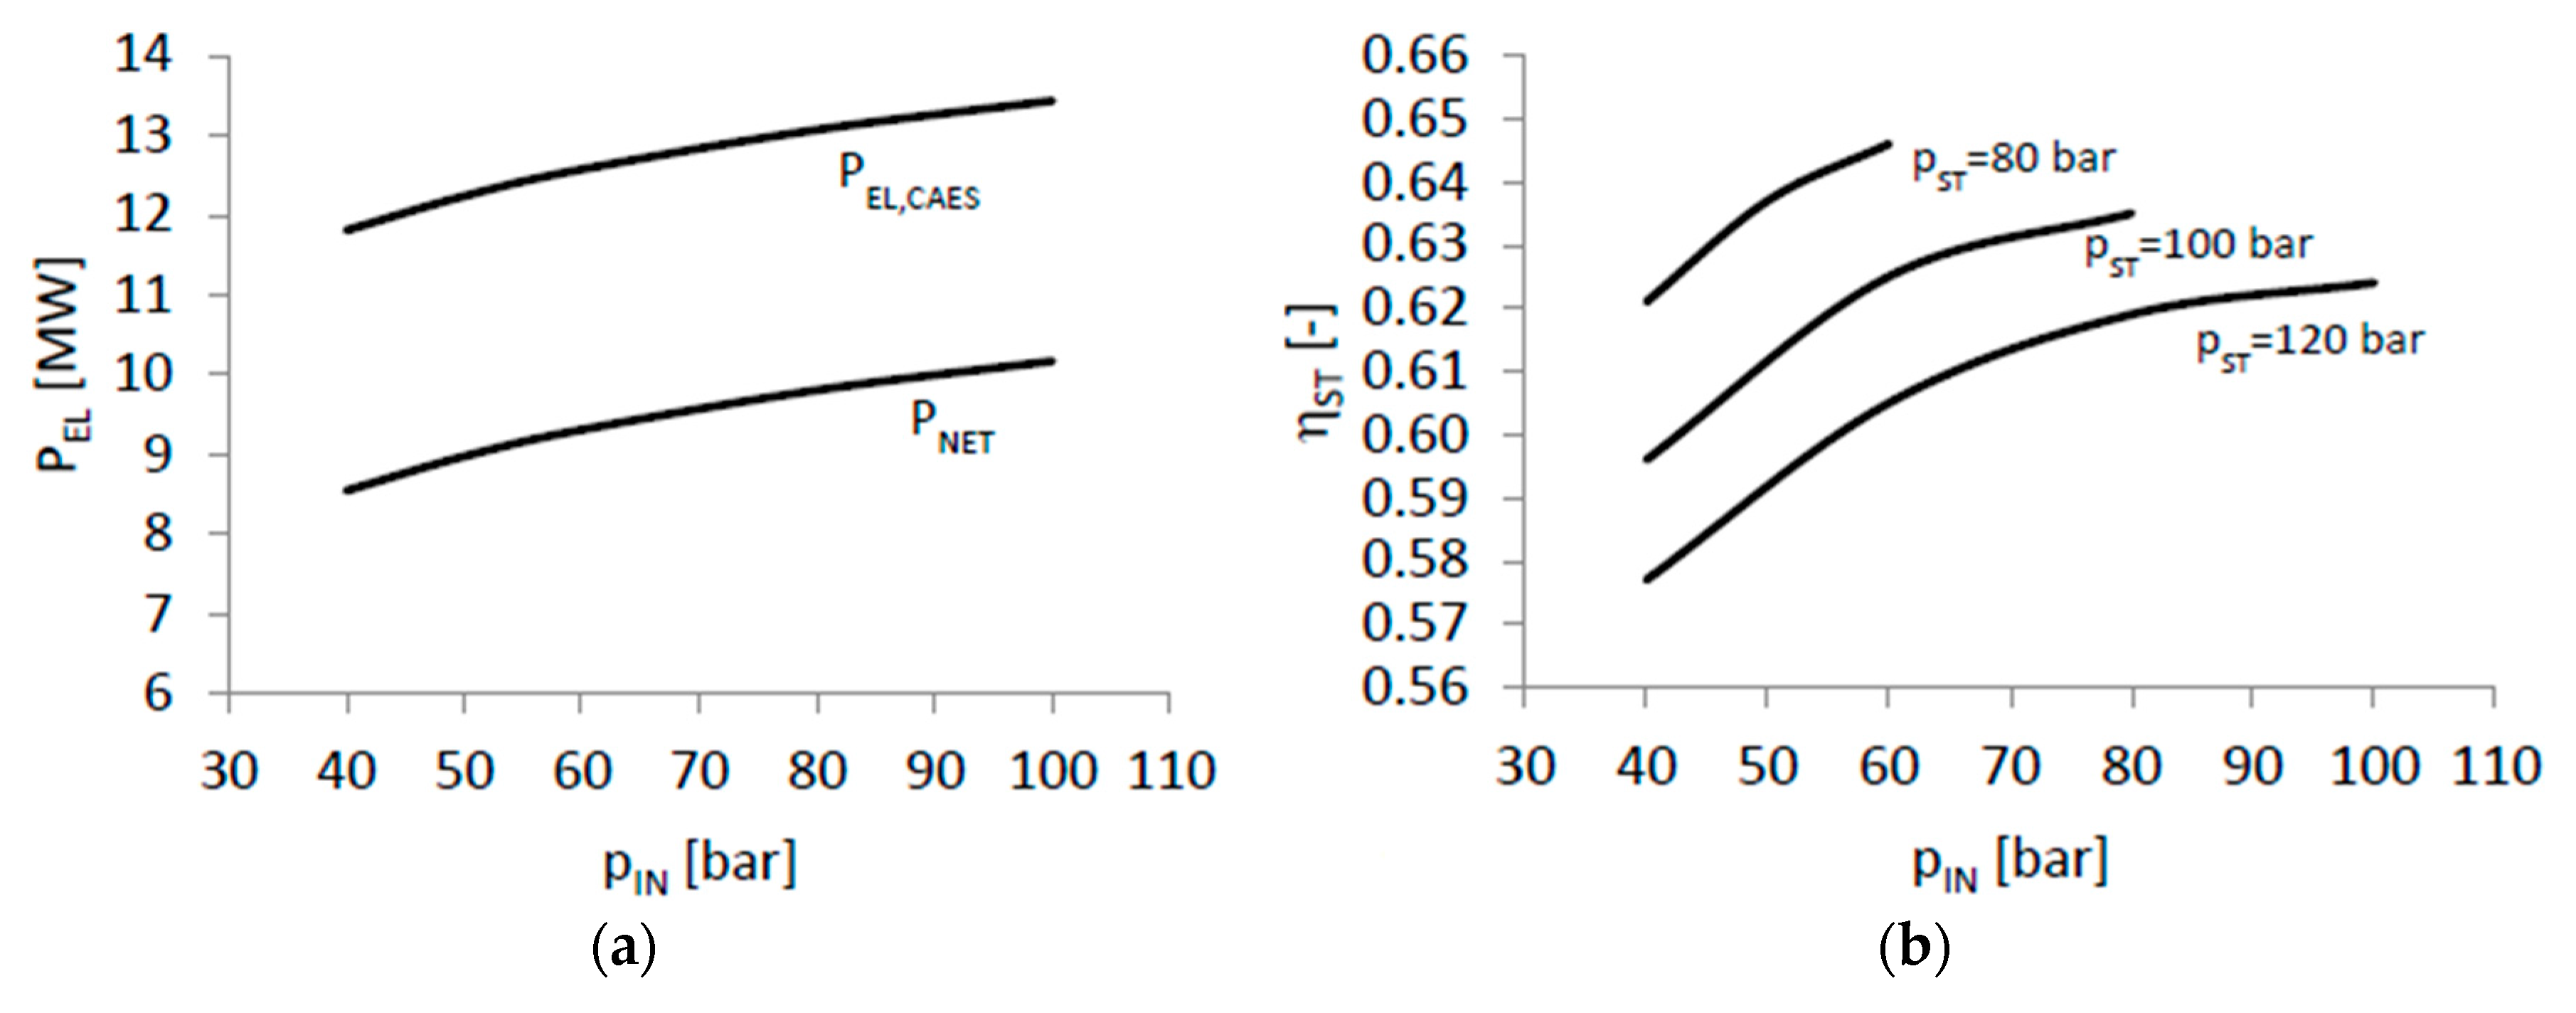
The power delivered by the AT does not depend on . Figure 4a shows both the power output actually produced by the AT and the CAES net power output as a function of . It can be observed that by increasing from 40 to 100 bar, shows an increase from 8.5 to some 10 MW.
Results concerning the storage efficiency are given in Figure 4b. It can be noticed that the higher the storage pressure is, the lower the storage efficiency is. By assuming equal to 80 bar, the storage efficiency ranges from 62 to some 65%.
For a given storage pressure, increases with increasing . Recalling the comments provided at the end of Section 3.2, the adoption of high values leads to large storage volumes. Such a consequence is of key importance, since the artificial storage system constitutes the major investment cost item, as reported in [19].
Finally, it can be noticed that by increasing , storage efficiency curves tend to assume a flat trend. On the basis of the above consideration, the adoption of design values not particularly high may be beneficial in terms of plant costs.
All the above aspects, and their consequences in terms of storage efficiency and plant cost, are investigated in the next section.
5. Case Study
A techno-economic analysis aimed at estimating the CAES plant cost has been carried out. Taking as a reference the GSCC plant introduced in Section 3.1, three different CAES design options have been investigated under the following design assumptions:
- Storage pressure: 100 bar;
- Net power production: 6000 kW;
- Discharge phase duration: 3 h at the maximum rated power;
- Charge phase duration at constant power: 5 h.
The three design options are featured by different values of the pressure at the beginning of the charging phase : 40, 60 and 80 bar respectively. By assuming the discharge phase occurring at maximum rated power, an electric production of 18,000 kWh is expected.Main CAES plant design data are reported in Table 2. All the CAES plants under consideration operate with the same AT inlet temperature (495 °C). As a consequence of Section 3.3 assumptions, the heating of the air mass flow rate fed to the AT requires exactly the same amount of GT exhaust mass flow rate. Since the AT specific work increases by increasing = , the higher is, the lower the air mass flow rate required to produce the rated power is, and, consequently, the lower the GT exhaust mass flow rate fed to the AH is. As reported in Table 2, by increasing from 40 to 80 bar, an almost constant AT power output (around 8000 kW) is requested to achieve the rated net power output, while both the GT exhaust and the air mass flow rates decrease significantly (from 18.1 to 15.8 kg/s). The mass of stored air can be evaluated by multiplying the design AT air mass flow rate by the duration of the discharge phase. Therefore, by increasing , lower amounts of stored air are required to match the design targets.
The storage volume is calculated according to the following equation:
It strongly depends on the difference between maximum and minimum pressure inside the reservoir. Therefore, even though high design values imply the storage of lesser amounts of air, the storage volumes show significant increases.
On the basis of Table 2 data, values of 60 and 80 bar leads to a storage volume 40 % and 160% larger than the storage volume evaluated for = 40 bar.
Once the mass of stored air is defined, the electricity absorbed during the charging phase can be evaluated according to Figure 3a data. Finally, the compressor train rated power is established by dividing by the duration of the charging phase. It can be noticed as the storage efficiency increases by increasing , as reported in Figure 4a.
Table 2 data are used to estimate the investment costs of the main plant items.
It can be noticed that the major difference among the design options under consideration concerns the storage volume requirement. Additional data necessary to estimate the artificial storage cost have been found by applying a sizing procedure based on an ANSI standard. Main sizing assumptions and results are given in Table 3. Pipe sections of 30” OD and 12 m length, made of ANSI b.125.1 carbon steel, have been selected to arrange the reservoir. The sizing procedure led to a tube wall thickness of about 40 mm. As a result, 5300, 7200 and 13,700 ton (metric) of steel are required in case of equal to 40, 60 and 80 bar respectively.
The last line of Table 3 gives the tube’s overall length. It can be noticed that length figures are in the order of thousands of meters. The storage reservoir can be assembled by connecting pipe runs in a parallel arrangement obtained by welding ten 12 m pipe sections. A distance between pipe runs of 1.2 m (about twice the tube OD) is considered adequate to accomplish operations required to build, maintain and inspect the reservoir. With reference to the = 40 bar case, a land surface of 120 × 80 m is required, corresponding to a football field (soccer for US and Canadian Readers). By assuming = 60 bar and = 80 bar, the required land surface increases by a factor of 1.4 and 2.6, respectively. Significant land savings can be achieved by adopting alternative (and slightly more expensive) arrangements. As an example, the tube runs can be stacked by using suitable supports, as reported in [33].
The artificial storage system investment cost has been evaluated taking the following items into consideration:
- Steel pipe purchase cost, assumed equal to 800 €/ton (metric) on the basis of vendor information;
- Welding cost, evaluated according to [34]. The storage system base cost has been calculated by adding the welding cost to the steel pipe purchase cost;
- Installation costs (support and base structure, hoisting, testing and labor) evaluated by applying a factor equal to1.5 to the base cost [31].
The overall investment cost (given in 2016 €) is estimated by adding indirect costs (20% of the direct cost) [31] and shipping costs, assumed equal to 30% of the steel pipe purchase cost on the basis of vendors information.
The compressor train is constituted by four centrifugal stages. The compressor packaged system cost has been evaluated according to [35]. The compressor base cost (including auxiliary equipment such as filtering system and heat transfer devices for intercooling and after-cooling) is given as a function of the power delivered to the compressed air (gas horsepower). Direct costs (foundations, piping, instruments, electric equipment, painting, insulation and labor) and indirect costs (engineering, contractor’s fee, etc.) are evaluated by applying suitable factors equal to 1.64 and 1.35 [35]. Finally, the overall cost is obtained by adding the cost of the electric motor, given as a function of the brake horsepower. In the proposed layout, compression and expansion trains are connected by a synchronous electric machine operating as motor during the charging phase and as generator during discharge. Costs are given in 2001 USD.
The air heater (AH) technology is the same for HRSGs commonly used in GSCC plants, the sole difference being the tube side fluid (pressurized air instead of water/steam). Hence, to determine the AH investment cost, the approach proposed by Foster–Pegg in 1989 [36] suitably modified by the author [37] has been adopted. The base cost (given in 2004 thousands of €) is expressed as the sum of three terms accounting for (i) the heat transfer surface area, (ii) the devices required for the proper air management (valves, headers, etc.), (iii) the enclosure, insulation and stack. To estimate the AH installed cost, a cumulative additional cost factor equal to 1.5 accounting for direct and indirect installation cost has been adopted on the basis of vendor information.
The air turbine (AT) is assumed derivate from a steam turbine, according to what reported in [2,23]. Therefore, the AT investment cost has been estimated by adopting a correlation developed for steam turbines given in [38]. Such a correlation provides the turbine base cost (in 1994 USD) as a function of the rated power, the inlet temperature and the efficiency. An installation factor of 1.25 has been assumed.
The investment cost of the main plant components is reported in Table 4. All costs have been updated by using the Marshall & Swift index and converted into 2016 €.
As expected, in all cases, the artificial storage system represents the main cost item. Moreover, such a cost increases significantly by increasing , while the other cost items do not show relevant changes. Such an increase greatly influences the overall plant cost: with reference to Table 4 data, the overall plant cost evaluated by assuming = 80 bar is roughly doubled in respect to that estimated for = 40 bar. Therefore, the choice of high values—which involves benefits in term of storage efficiency—leads to high and hardly bearable plant costs. In fact, in a context like the present one featured by low electricity prices, high plant costs are unlikely to be compensated by the reduced operational costs stemming from the adoption of high efficiency solutions.
Finally, a qualitative comparison with battery energy storage (BES) systems is attempted on the basis of cost information provided in [39]. The = 40 bar CAES system performance is compared with Na-S battery and Li-ion battery storage systems characterized by the same power and storage capacity. As reported in Table 5, the CAES cost is approximately twice the cost estimated for the Na-S batteries and significantly lower than that of LI-ion based storage system.
However, it has to be pointed out that CAES life duration is considerably longer than those commonly estimated for BES systems taken into consideration (15 years for both Na-S and Li-ion batteries [39]).
Such a high life duration is expected to bring to a significantly lower levelized cost of storage (LCOS), as reported in [40]. Moreover, other CAES features which positively affect the life cycle analysis are related to the absence of emissions during operations and to the easy plant dismantling at the end of the useful life. In this respect, the CAES storage system salvage value is estimated (on the basis of prices provided by the steel recycle manufacturers) as some 25% of the steel pipe purchase cost, as reported in [31].
Moreover, BES technologies (including those presently commercially available) show some drawbacks and need further R&D efforts to improve relevant aspects related to emissions, loss of performance, dismantling and so on. Instead, the key components of the proposed CAES concept (compression train, artificial reservoir, air heater and air turbine) are based on proven and consolidated technologies.
6. Conclusions
On the basis of promising preliminary results presented in [17], the performance of an energy storage system integrating a CAES into a GSCC has been further investigated. CAES performance has been evaluated taking the integrated system behavior into consideration by introducing a more consistent formulation for the storage efficiency.
CAES systems featured by different design specifications have been coupled with a commercially available small-size GSCC plant. On the basis of analyses carried out by varying the key design parameters, satisfactory storage efficiency values ranging from 58 to 65% have been found.
A techno-economic analysis showed that the plant investment cost is greatly influenced by the cost of the artificial storage, which increases significantly with increasing the difference between the storage pressure and the pressure at the beginning of the charging phase . Therefore, for a given , the choice of high values—which involves benefits in term of storage efficiency—leads to unreasonable plant costs.
Finally, a comparison with battery energy storage (BES) systems has been carried out in terms of costs, duration and technological maturity. CAES-relevant features (long-life duration and established technologies available for key plant components) confirm the great potential of the proposed system to emerge as an economically viable energy storage alternative.
Further investigations will be addressed to the techno-economic optimization of the plant layout and to the part load performance assessment.
Acknowledgments
The work is an extended version of the paper presented at the 4th International Conference on Energy and Environment Research (ICEER 2017) held in Porto, Portugal and published in Energy Procedia [19]. The author gratefully acknowledges University of “ROMA TRE” for the support.
Conflicts of Interest
The author declares no conflict of interest.
References
- Akinyele, D.O.; Rayudu, R.K. Review of energy storage technologies for sustainable power networks. Sustain. Energy Technol. Assess. 2014, 8, 74–91. [Google Scholar] [CrossRef]
- Crotogino, F.; Mohmeyer, K.U.; Sharf, R. Huntorf CAES: More than 20 Years of Successful Operation. In Proceedings of the Spring 2001 Meeting, Orlando, FL, USA, 15–18 April 2001. [Google Scholar]
- Bullough, C.; Gatzen, C.; Jakiel, C.; Koller, M.; Nowi, A.; Zunft, S. Advanced Adiabatic Compressed Air Storage for the Integration of Wind Energy. In Proceedings of the European Wind Energy Conference EWEC 2004, London, UK, 22–25 November 2004. [Google Scholar]
- Hartmann, N.; Vohringer, O.; Kruck, C.; Eltrop, L. Simulation and analysis of different adiabatic Compressed Air Storage plant configurations. Appl. Energy 2012, 93, 541–548. [Google Scholar] [CrossRef]
- Wolf, D.; Budt, M. LTA-CAES—A low-temperature approach to Adiabatic Compressed Air Energy Storage. Appl. Energy 2014, 125, 158–164. [Google Scholar] [CrossRef]
- Buffa, F.; Kemble, S.; Manfrida, G.; Milazzo, A. Exergy and Exergoeconomic Model of a Ground-Based CAES Plant for Peak-Load Energy Production. Energies 2013, 6, 1050–1067. [Google Scholar] [CrossRef]
- Kim, Y.M.; Lee, J.H.; Kim, S.J.; Favrat, D. Potential and Evolution of Compressed Air Energy Storage: Energy and Exergy Analyses. Entropy 2012, 14, 1501–1521. [Google Scholar] [CrossRef]
- Barbour, E.; Mignard, D.; Ding, Y.; Li, Y. Adiabatic Compressed Air Energy Storage with packed bed Thermal Energy Storage. Appl. Energy 2015, 155, 804–815. [Google Scholar] [CrossRef]
- Nakhamkin, M.; Chiruvolu, M.; Patel, M.; Byrd, S.; Schainker, R. Second Generation of CAES Technology-Performance, Economics, Renewable Load Management, Green Energy. In Proceedings of the POWER-GEN International, Las Vegas, NV, USA, 8–10 December 2009. [Google Scholar]
- Salvini, C. Performance Analysis of Small Size Compressed Air Energy Storage Systems for Power Augmentation: Air Injection and Air Injection/Expander Schemes. Heat Transf. Eng. 2017, 39, 304–319. [Google Scholar] [CrossRef]
- Salvini, C. Techno-Economic Analysis of Small Size Second Generation CAES System. Energy Procedia 2015, 82, 782–788. [Google Scholar] [CrossRef]
- Li, Y.; Sciacovelli, A.; Peng, X.; Radcliffe, J.; Ding, Y. Integrating Compressed Air Energy Storage with a Diesel Engine for Electricity Generation in Isolated Areas. Appl. Energy 2016, 171, 26–36. [Google Scholar] [CrossRef]
- Yao, E.; Wang, H.; Wang, L.; Xi, G.; Marechal, F. Multi-Objective Optimization and Exergoeconomic Analysis of a Combined Cooling. Heating and Power Based Compressed Air Energy System. Energy Convers. Manag. 2017, 138, 199–209. [Google Scholar] [CrossRef]
- Chen, L.-X.; Hu, P.; Sheng, C.-C.; Xie, M.-N. A Novel Compressed Air Energy Storage (CAES) System Combined with Pre-Cooler and Using Low Grade Waste Heat as Heat Source. Energy 2017, 131, 259–266. [Google Scholar] [CrossRef]
- Safaei, H.; Keith, D.W.; Hugo, R.J. Compressed Air Energy Storage (CAES) with Compressor Distributed at Heat Loads to Enable Waste Heat Utilization. Appl. Energy 2017, 103, 165–179. [Google Scholar] [CrossRef]
- Meng, H.; Wang, M.; Aneke, M.; Luo, X.; Olumayegun, O. Technical Performance Analysis and Economic Evaluation of a Compressed Air Energy Storage Integrated with an Organic Rankine Cycle. Fuel 2018, 211, 318–330. [Google Scholar] [CrossRef]
- Salvini, C. Techno-Economic Analysis of CAES Systems Integrated into Gas-Steam Combined Plants. Energy Procedia 2016, 101, 870–877. [Google Scholar] [CrossRef]
- Lozza, G. Turbine A Gas e Cicli Combinati, 3rd ed.; Esculapio: Bologna, Italy, 2016. [Google Scholar]
- Salvini, C. Performance Assessment of a CAES System integrated into a Gas-Steam Combined Plant. Energy Procedia 2017, 136, 264–269. [Google Scholar] [CrossRef]
- Jansen, M.; Shulenberg, T.; Waldinger, D. Shop Test Results of the 64.3 Gas Turbine. J. Eng. Gas Turbine Power 1992, 114, 676–681. [Google Scholar] [CrossRef]
- Kim, T.S. Comparative Analysis on the Part Load Performance of Combined Cycle Plants Considering Design Performance and Power Control Strategy. Energy 2001, 29, 71–85. [Google Scholar] [CrossRef]
- Gomes, C.M.; Gallo, W.L.R. Load Control and Part Load Performance of a Combined Cycle Operating in Cogeneration Conditions. In Proceedings of the 17th International Congress of Mechanical Engineering, Sao Paulo, Brazil, 10–14 November 2003. [Google Scholar]
- Budt, M.; Wolf, D.; Span, R.; Yan, J. A review on compressed air energy storage: Basic principles. Past milestones and recent developments. Appl. Energy 2016, 170, 250–268. [Google Scholar] [CrossRef]
- KVA Bern Forsthaus Combined Cycle Reference Sheet. Available online: https://assets.impalacms.com/s17.impalacms.com/internal/assets/1803/original/reference-sheet_gka_bern.pdf (accessed on 6 February 2018).
- Cerri, G.; Mazzoni, S.; Salvini, C. Steam Cycle Simulator for CHP Plants. In Proceedings of the ASME Turbo Expo 2013, San Antonio, TX, USA, 3–7 June 2013. [Google Scholar]
- Cerri, G.; Borghetti, S.; Salvini, C. Models for Simulation and Diagnosis of Energy Plant Components. In Proceedings of the 2006 ASME Power Conference, Atlanta, GA, USA, 2–4 May 2006. [Google Scholar]
- Cerri, G.; Gazzino, M.; Botta, F.; Salvini, C. Production Planning with Hot Section Life Prediction for Optimum Gas Turbine Management. Int. J. Gas Turbine Propuls. Power Syst. 2008, 2, 9–16. [Google Scholar]
- Hooke, D.H. On Prediction of Off-Design Multistage Turbine Pressures by Stodola’s Ellipse. J. Eng. Gas Turbines Power 1985, 107, 596–606. [Google Scholar]
- Sayer, J.; Pemberton, D.; Jewitt, J.; Pletka, R.; Fishbach, M.; Meyer, T.; Ward, M.; Bjorge, B.; Hargreaves, D.; Jordan, G. Mini-Compressed Air Energy Storage for Transmission and Congestion Relief and Wind Shaping Application; Final Report, Nyserda Report 08-5; Nyserda: Albany, NY, USA, July 2008.
- Pedrick, J.; Marean, J.B. Compressed Air Energy Storage Engineering and Economic Study; Final Report, Nyserda Report 10-09; New York State Electric and Gas (NYSeg): Binghamton, NY, USA, December 2009. [Google Scholar]
- Liu, J.; Zhang, X.; Xu, Y.; Chen, Z.; Chen, H.; Tan, C. Economic Analysis of using Above Ground Gas Storage Device for Compressed Air Storage System. J. Therm. Sci. 2014, 23, 535–543. [Google Scholar] [CrossRef]
- Huntorf Air Storage Gas Turbine Power Plant. Available online: www.solarplan.org/Research/BBC_Huntorf_engl.pdf (accessed on 30 October 2017).
- Electric Power Research Institute. Compressed Air Energy Storage Scoping Study for California; CEC-500-2008-069; Electric Power Research Institute: Palo Alto, CA, USA, November 2008. [Google Scholar]
- Lincoln Electric. Welding Pressure Pipelines & Piping Systems—Procedures and Techniques. Available online: http://www.lincolnelectric.com/assets/global/Products/Consumable_PipelinerConsumables-Pipeliner-PipelinerLH-D90/c2420.pdf (accessed on 6 February 2018).
- Douglas, L.E. Industrial Chemical Process Design; McGraw-Hill: New York, NY, USA, 2002; pp. 326–334. [Google Scholar]
- Foster-Pegg, R.W. Capital Cost of Gas-Turbine Heat Recovery Boilers. Chem. Eng. 1986, 93, 73–78. [Google Scholar]
- Salvini, C.; Giovannelli, A.; Varano, M. Economic Analysis of Small Size Gas Turbine Based CHP Plants in the Present Italian Context. Int. J. Heat Technol. 2016, 34, S443–S450. [Google Scholar] [CrossRef]
- Uhlenbruck, S.; Lucas, K. Exergoeconomically-aided evolution strategy applied to a combined cycle power plant. Int. J. Therm. Sci. 2004, 43, 289–296. [Google Scholar] [CrossRef]
- Abbas, A.A.; Huff, G.; Currier, A.B.; Kaun, B.C.; Rastler, D.M.; Chen, S.B.; Cotter, A.L.; Bradshaw, D.T.; Gauntlett, W.D. DOE/EPRI Electricity Storage Handbook in Collaboration with NRECA; Sandia National Laboratories Albuquerque: Albuquerque, NM, USA, 2015. [Google Scholar]
- Electric Power Research Institute. Electricity Energy Storage Technology Options: A White Paper Primer on Applications, Costs, and Benefits; Report No. 1020676; Electric Power Research Institute: Palo Alto, CA, USA, December 2010. [Google Scholar]
Figure 1.
Reference plant scheme. Legend: GT: gas turbine; HRSG: heat recovery steam generator; M: electric motor; ST: storage tank; AH: air heater; AT: air turbine; : gas mass flow rate entering the HRSG during Gas-Steam combined cycle (GSCC) normal operation; : gas mass flow rate entering the HRSG during the compressed air energy storage (CAES) discharge phase; : gas mass flow rate entering the AH during the CAES discharge phase.
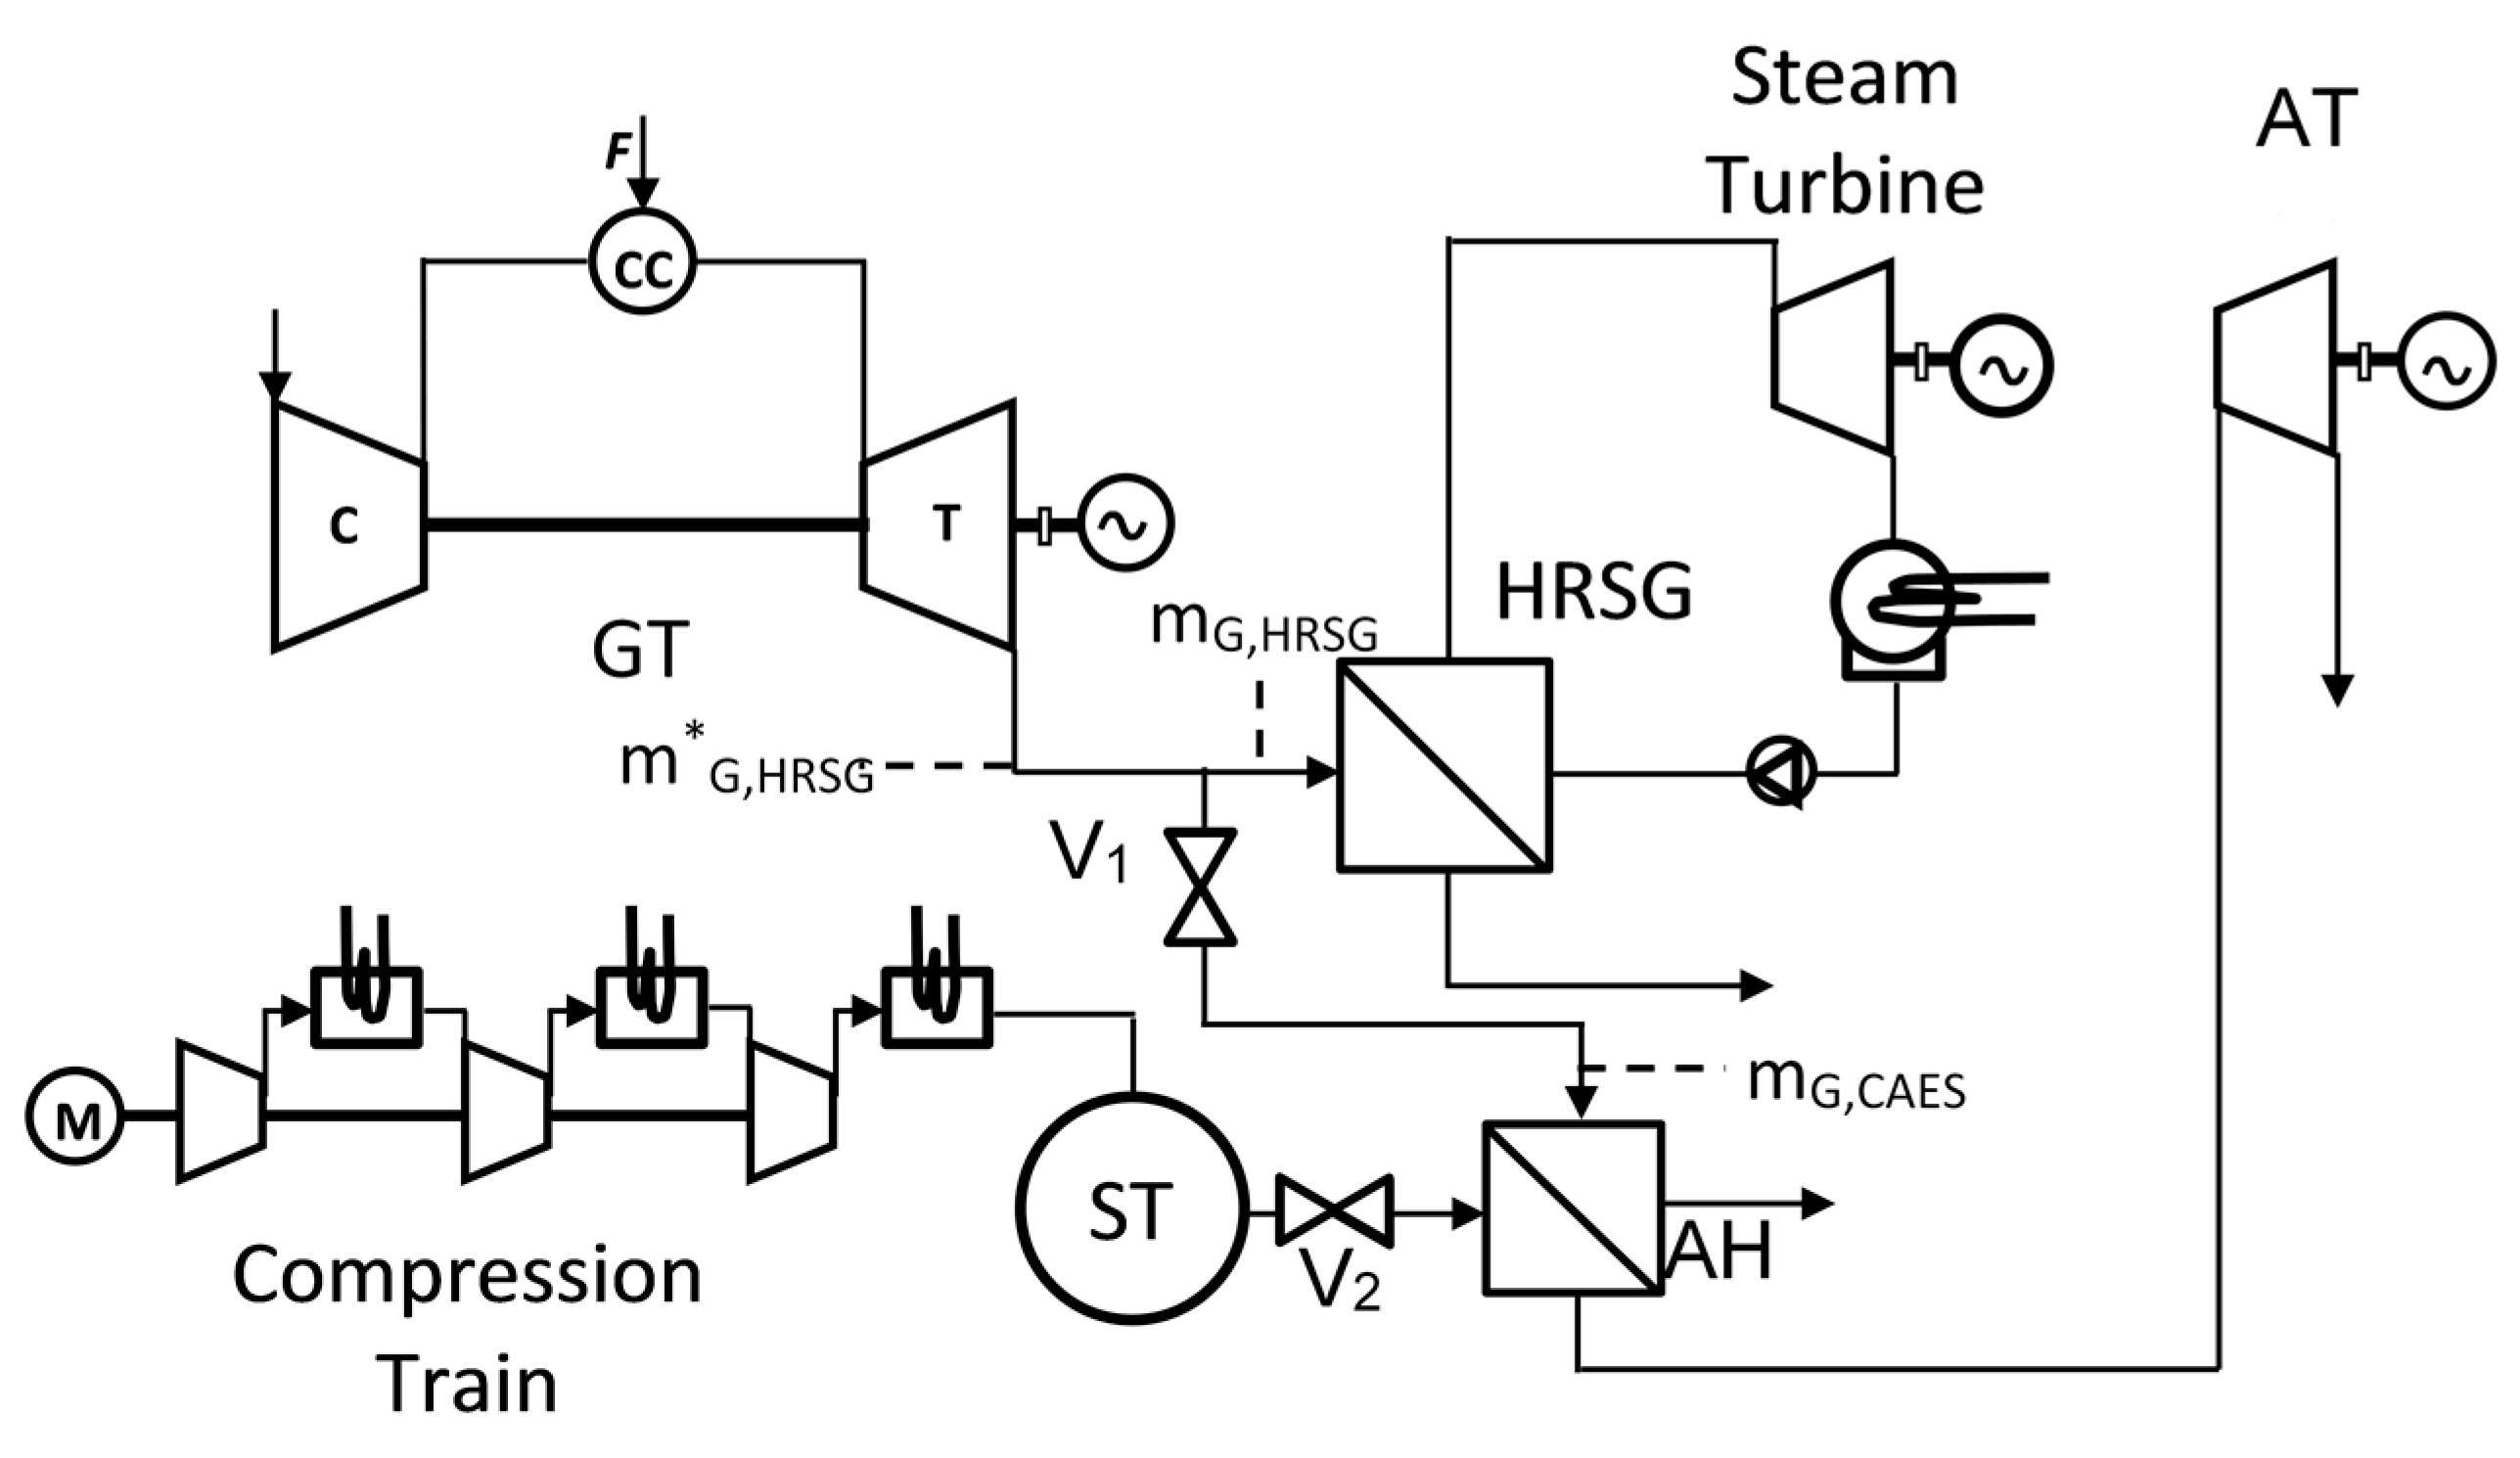
Figure 2.
(a) HRSG effectiveness, electricity production per kilogram of gas and condensing pressure by varying the mass of gas entering the HRSG; (b) GSCC steam section power output.
Figure 2.
(a) HRSG effectiveness, electricity production per kilogram of gas and condensing pressure by varying the mass of gas entering the HRSG; (b) GSCC steam section power output.
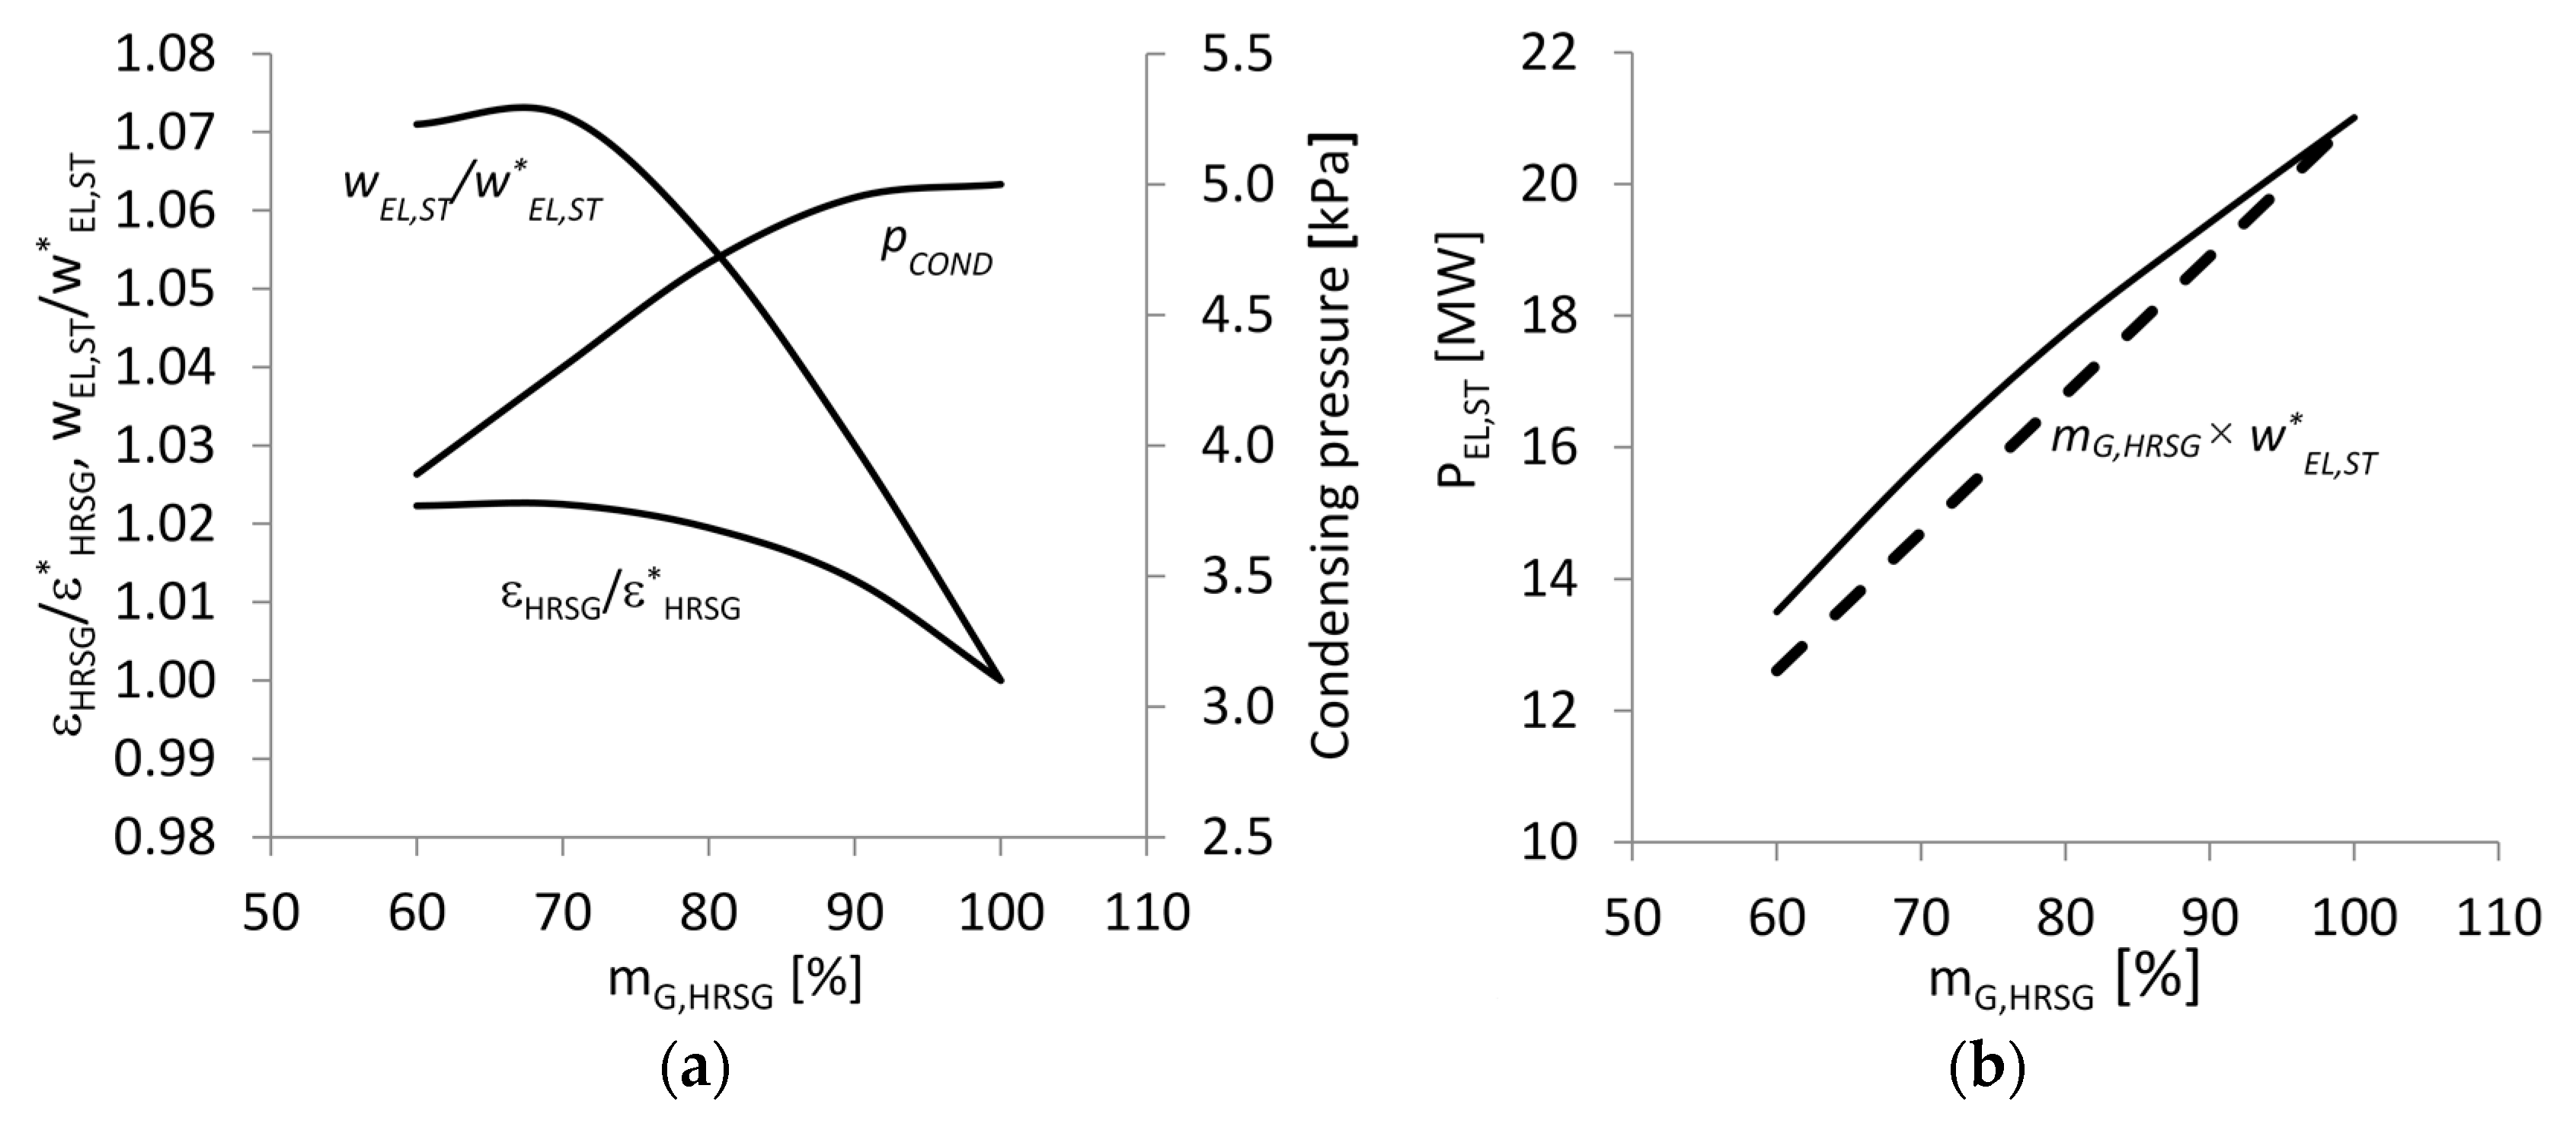
Figure 3.
(a) Electricity absorbed per unit of mass during the charging phase; (b) CAES design point performance by varying the gas mass flow rate (pST = 100 bar, pIN = 60 bar).
Figure 3.
(a) Electricity absorbed per unit of mass during the charging phase; (b) CAES design point performance by varying the gas mass flow rate (pST = 100 bar, pIN = 60 bar).
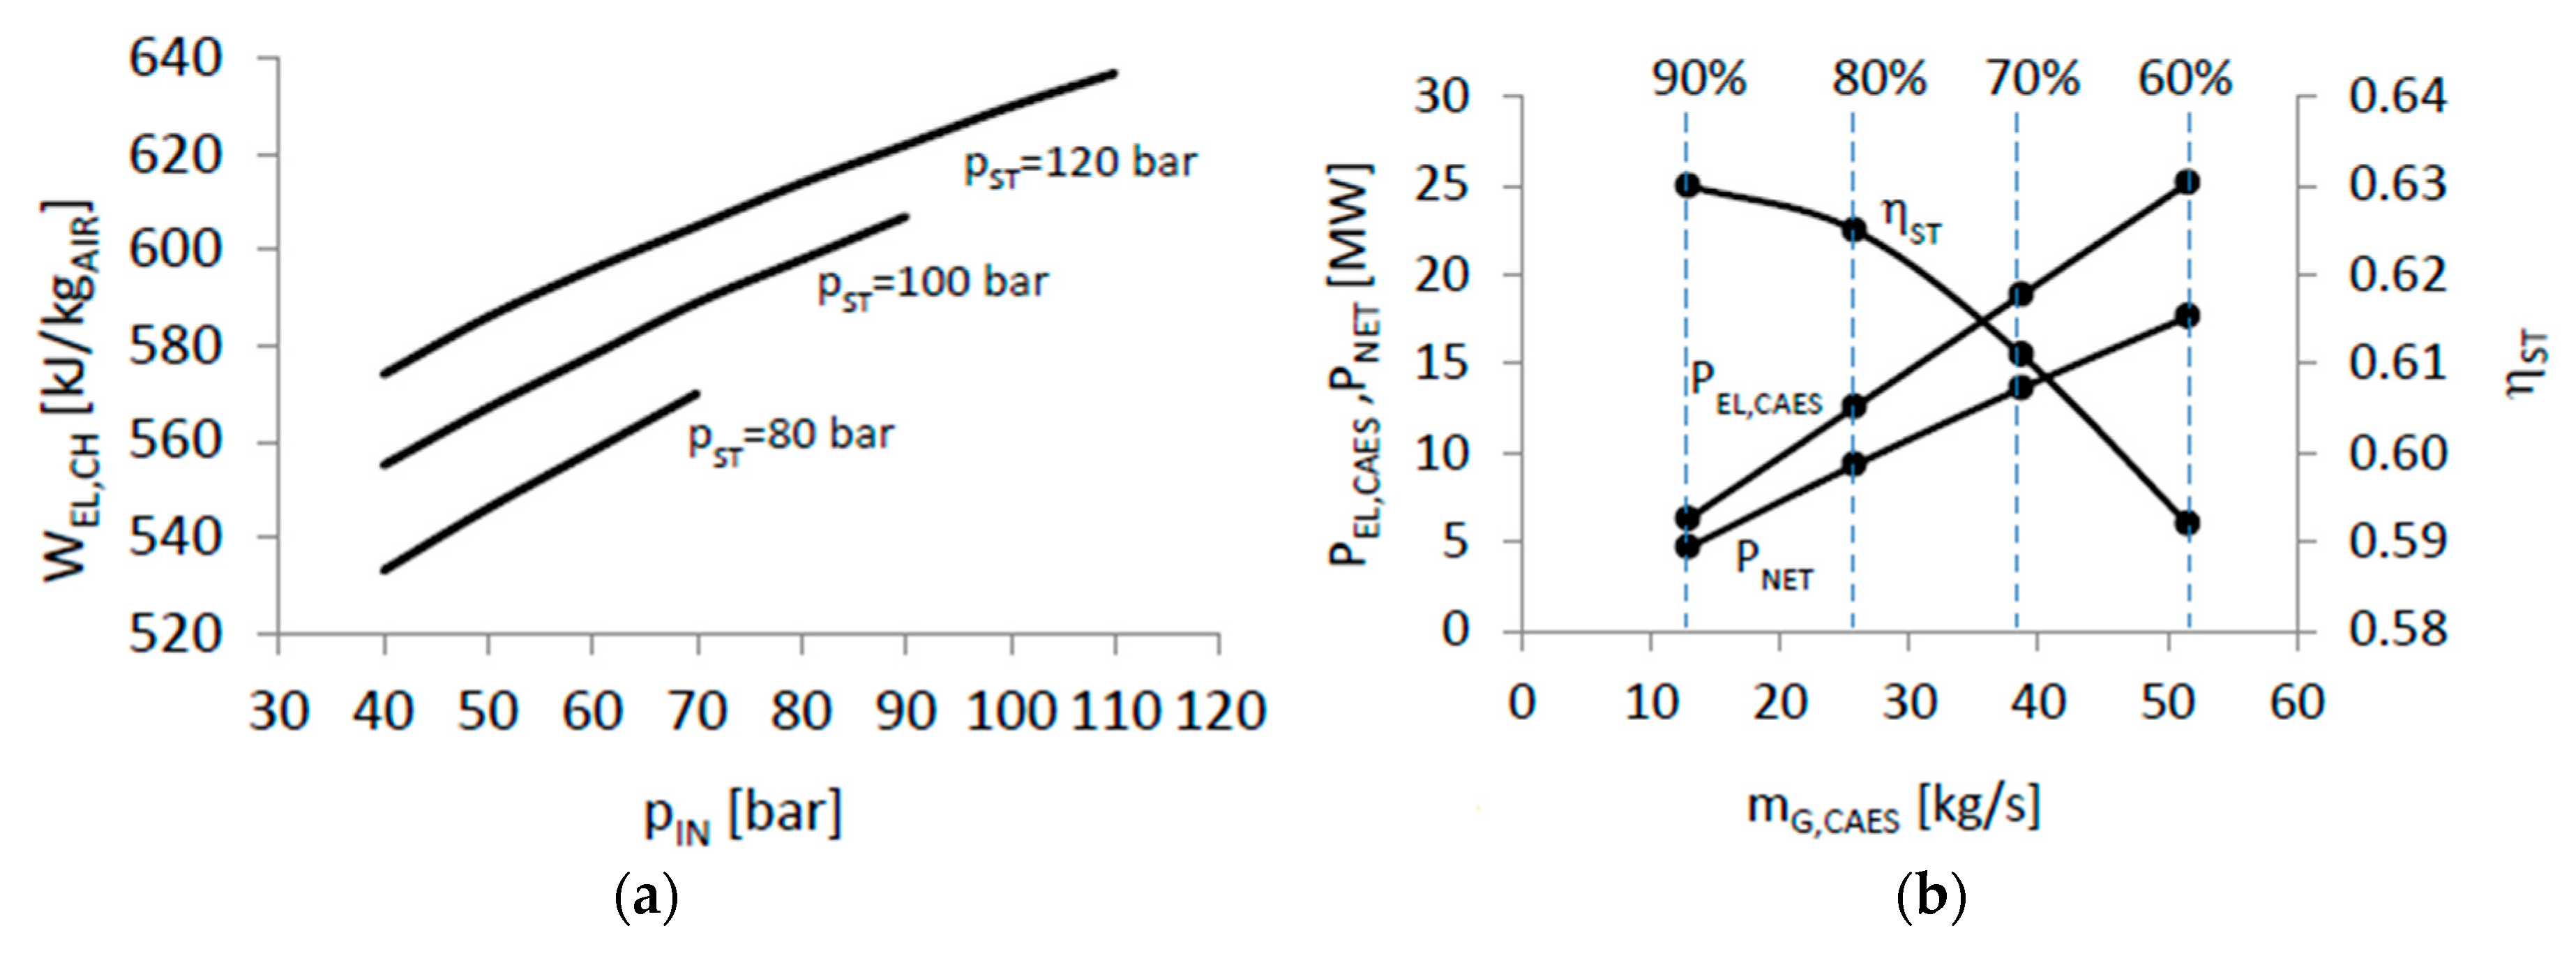
Figure 4.
(a) Power output actually produced by the AT and CAES net power output . versus pressure at the beginning of the charging phase ( = 25.6 kg/s); (b) CAES storage efficiency as a function of the pressure at the beginning of the charging phase and the storage pressure.
Figure 4.
(a) Power output actually produced by the AT and CAES net power output . versus pressure at the beginning of the charging phase ( = 25.6 kg/s); (b) CAES storage efficiency as a function of the pressure at the beginning of the charging phase and the storage pressure.


Table 1.
GSCC steam section main data (design conditions).
| Gas mass flow entering the HRSG (mG,HRSG) | 129 kg/s | Steam condensing pressure (pCOND) | 5 kPa |
| Gas Temperature at HRSG inlet (TET) | 545 °C | Steam condensing temperature (TCOND) | 32.9 °C |
| Gas Temperature at HRSG exit (TGOUT) | 91 °C | Condensing water mass flow (mW,COND) | 1075 kg/s |
| HRSG effectiveness (εHRSG) | 0.86 | Condensing water temperature (TW,COND) | 20 °C |
| HP steam pressure (pHP) | 60 bar | Electric production per kg of gas (wEL,SP) | 163 kJ/kg |
| Superheated HP steam temperature (TSH,HP) | 485 °C | Electric production per kg of steam (wEL,STEAM) | 980 kJ/kg |
| HP steam mass flow (mHP) | 17.0 kg/s | Steam Section power production (PEL,STEAM) | 21 MW |
| LP steam pressure (pHP) | 3.6 bar | Steam section efficiency (ηSTEAM) | 0.315 |
Table 2.
Main CAES plants design data (pST = 100 bar).
| Pressure at air turbine inlet pIN,AT = pIN (bar) | 40 | 60 | 80 |
| Net electric power output during discharge PNET (kW) | 6000 | 6000 | 6000 |
| Electricity production during discharge WNET (kWh) | 18,000 | 18,000 | 18,000 |
| Air Turbine power output PEL,CAES (kW) | 8270 | 8080 | 7970 |
| GT exhaust gas mass flow to the air heater mG,CAES (kg/s) | 18.1 | 16.6 | 15.8 |
| Air mass flow rate to the air turbine mA,CAES (kg/s) | 18.1 | 16.6 | 15.8 |
| Mass of stored air mCH (metric ton) | 196 | 180 | 170 |
| Storage volume V (m3) | 2850 | 3900 | 7400 |
| Electricity absorbed per unit of mass during charging wEL,CH (kJ/kgAIR) | 555 | 578 | 598 |
| Electricity absorption during the charging phase WEL,CH (kWh) | 30,150 | 28,830 | 28,320 |
| Electric Power absorbed during the charging phase PEL,CH (kW) | 6000 | 5800 | 5600 |
| Storage efficiency ηST = WNET/WEL,CH (%) | 59.7 | 62.4 | 63.5 |
Table 3.
Artificial storage tank sizing results (pST = 100 bar).
| Pressure at air turbine inlet pIN,AT = pIN (bar) | 40 | 60 | 80 |
| Storage volume V (m3) | 2850 | 3900 | 7400 |
| Tube OD (inches) | 30 | 30 | 30 |
| Tube wall thickness (mm) | 40 | 40 | 40 |
| Weight (metric ton) | 5300 | 7200 | 13,700 |
| Tube overall length (m) | 7700 | 10,500 | 20,000 |
Table 4.
CAES plant cost (pST = 100 bar).
| Pressure at air turbine inlet pIN,AT = pIN (bar) | 40 | 60 | 80 |
| Storage tank (k€) | 9690 | 13,260 | 25,160 |
| Compression train 1 (k€) | 4140 | 4060 | 3950 |
| Air heater (k€) | 1060 | 1000 | 950 |
| Air turbine (k€) | 2870 | 2830 | 2800 |
| Overall plant cost (k€) | 17,760 | 21,150 | 32,860 |
| Cost per installed kilowatt (€/kW) | 2960 | 3525 | 5477 |
| Cost per installed kilowatt-hour (€/kWh) | 987 | 1175 | 1825 |
1 Includes the reversible electric machine.
Table 5.
Cost comparison among energy storage technologies.
| Energy Storage System | CAES | Na-S Battery | Li-ion Battery |
|---|---|---|---|
| Life duration (year) | 30 1 | 15 1 | 15 1 |
| Overall plant cost (k€) | 17,760 | 8490 | 28,110 |
| Cost per installed kilowatt (€/kW) | 2960 | 1415 | 4685 |
| Cost per installed kilowatt-hour (€/kWh) | 987 | 471 | 1560 |
1 Evaluated by assuming 365 cycles per year.
© 2018 by the author. Licensee MDPI, Basel, Switzerland. This article is an open access article distributed under the terms and conditions of the Creative Commons Attribution (CC BY) license (http://creativecommons.org/licenses/by/4.0/).
Share and Cite
MDPI and ACS Style
Salvini, C. CAES Systems Integrated into a Gas-Steam Combined Plant: Design Point Performance Assessment. Energies 2018, 11, 415. https://doi.org/10.3390/en11020415
AMA Style
Salvini C. CAES Systems Integrated into a Gas-Steam Combined Plant: Design Point Performance Assessment. Energies. 2018; 11(2):415. https://doi.org/10.3390/en11020415
Chicago/Turabian StyleSalvini, Coriolano. 2018. "CAES Systems Integrated into a Gas-Steam Combined Plant: Design Point Performance Assessment" Energies 11, no. 2: 415. https://doi.org/10.3390/en11020415
Note that from the first issue of 2016, this journal uses article numbers instead of page numbers. See further details here.