A Wavelet-Based Optimization Method for Biofuel Production
by
 , , and
Maurizio Carlini
1 ,
,
Sonia Castellucci
1,*,
Guomin Sun
2,
Jinsong Leng
2,
Carlo Cattani
1 and
Alessandro Cardarelli
1 1
Engineering School, DEIM, University of Tuscia, 01100 Viterbo, Italy
2
School of Mathematical Sciences, University of Electronic Science and Technology of China, Chengdu 611731, China
*
Author to whom correspondence should be addressed.
Energies 2018, 11(2), 377; https://doi.org/10.3390/en11020377
Submission received: 13 December 2017
/
Revised: 25 January 2018
/
Accepted: 26 January 2018
/
Published: 6 February 2018
(This article belongs to the Section L: Energy Sources)
Abstract
:On a global scale many countries are still heavily dependent on crude oil to produce energy and fuel for transport, with a resulting increase of atmospheric pollution. A possible solution to obviate this problem is to find eco-sustainable energy sources. A potential choice could be the use of biodiesel as fuel. The work presented aims to characterise the transesterification reaction of waste peanut frying oil using colour analysis and wavelet analysis. The biodiesel production, with the complete absence of mucilages, was evaluated through a suitable set of energy wavelet coefficients and scalograms. The physical characteristics of the biodiesel are influenced by mucilages. In particular the viscosity, that is a fundamental parameter for the correct use of the biodiesel, might be compromised. The presence of contaminants in the samples can often be missed by visual analysis. The low and high frequency wavelet analysis, by investigating the energy change of wavelet coefficient, provided a valid characterisation of the quality of the samples, related to the absence of mucilages, which is consistent with the experimental results. The proposed method of this work represents a preliminary analysis, before the subsequent chemical physical analysis, that can be develop during the production phases of the biodiesel in order to optimise the process, avoiding the presence of impurities in suspension in the final product.
1. Introduction
In the last years, awareness about energetic and environmental problems has encouraged many researchers to investigate the possibility of using alternative fuels instead of petrol and its derivatives [1]. Biofuels derived from biomass, such as bioethanol [2], biodiesel and biomethane, are a viable alternative. Biofuels are mostly derived from edible oils, nonedible oils, fats, waste cooking oil, and algae [3,4]. These biofuels have environmental benefits, they are economically competitive and they are producible in large quantities without reducing food supplies because they are generated from a biological feed stocks [5,6]. Among them, biodiesel seems an excellent substitute for fossil diesel without engine modification [7]. Biodiesel, mostly produced from the transesterification reaction of different vegetable oils (peanut, soybean, rapeseed, sunflower), shows a substantial reduction in emissions of carbon dioxide, sulphur oxides, particulate matter and unburned hydrocarbons [7,8]. Compared to fossil diesel, the greater concentration of oxygen (10–11%) [1,9] in biodiesel allows for better combustion, reducing the emissions of carbon monoxide (CO) produced by incomplete combustion (under oxygen deficiency conditions).
The main disadvantage of biodiesel production from these feedstocks is its higher price [7]. The use of exhausted oil [10,11] to produce biodiesel is an effective way to reduce the raw material cost [12]. Indeed, the price of waste cooking oil is lower than that of the virgin oil [13]. Since the quality of biodiesel is directly related to the quality of the raw oil [14], it is important to use a wasted oil with a high ratio of saturated/unsaturated fatty acids because the resistance of oil to oxidation, for example during frying, decreases as the saturated/unsaturated acids ratio decreases [15]. Indeed, during heating [16] of vegetable oils for frying purposes, thermal, oxidative, or hydrolytic reactions can cause chemical changes [17]. This changes induced in the frying fat are influenced by oil’s fatty acid composition. The saturated/unsaturated acids ratio influences the oxidation stage. During the process of oxidation, the extraction of one or more hydrogen atoms from fatty acids produces free radicals. During the transesterification reaction, speeded up by basic catalysts (NaOH, KOH) or acid catalysts (H2SO4) [8,18], it is necessary that the amount of free fatty acids is low as possible to avoid base-acid reactions that can cause soap formation [19], reducing the reaction yield.
The most recommended vegetable oil for frying is peanut oil. Indeed, it has a high saturated/unsaturated acids ratio [20,21]. The work presented aims to identify the characteristics of the transesterification reaction of waste peanut frying oil, performed with methanol (CH3OH) as a reagent and sodium hydroxide (NaOH) as a catalyst, using colour analysis and wavelet analysis. Wavelet analysis is the most suitable method to emphasize singularities which are locally distributed. In particular we will use the wavelet coefficients energy (and scalogram) to characterize the transesterification reaction. In detail, the analysis of the images has allowed us to verify the presence of impurities in the biodiesel produced. The reaction of transesterification, as shown in Equation (1), is reversible, and thus is performed in excess of alcohol to force the equilibrium to the product side [15].
This reaction produces two distinct phases: a light phase at the top, composed by methyl-esters and possible excess reaction products (methanol, unreacted esters) and a heavy phase at the bottom, composed by glycerol. The biodiesel produced is subjected to a washing process with deionized water [22]. This process is performed in order to remove all the water-soluble impurities, such as soap, pastes, mucilages, excess reagents and glycerol that was not completely removed from the light phase. The washes are repeated until purified biodiesel is obtained and the water, used for washing, becomes clear. Finally, the biodiesel viscosity is checked. The physical characteristics are compared with the standards values of the regulation UNI EN 14214 [23].
The optical evaluation of the products obtained, both from the transesterification reaction and from the biodiesel washing process, is the first approach used during the experimental campaigns.
Concerning the transesterification reaction, a visual analysis of the colour allows one to keep the correct progress of the reaction under control with an assigned temperature and catalyst percentage. As regards the washing phase, the colour analysis allows one to detect the presence of impurities, usually mucilages, in the final product which compromise its viscosity [24].
All the stages of the biodiesel production (the separation of methyl esters from glycerol and the light phase washing process) were photographed and all the images were analysed using colour analysis. Then, the wavelet analysis provided all the testing results. The wavelet scalogram at low and high frequency, by investigating the energy change of wavelet coefficients, provides detailed information about the transesterification reaction progress and the subsequent washing process. Indeed, the study of the scalogram allows one to identify the correct progression of the separation between biodiesel and glycerol and the presence of mucilages in the washed biodiesel.
2. Materials and Methods
2.1. Waste Frying Peanuts Oil
The Waste Peanut Oil (WPO), used for the transesterification reaction, was collected from households in Viterbo, Lazio, Italy, and kept at room temperature. The transesterification reactions have been conducted in the CIRDER- Interdepartmental Center for Research and Dissemination of Renewable Energies- laboratory, at the Engineering School, DEIM, University of Tuscia (Viterbo, Italy). This oil was analysed according to the standard test methods to define its chemical and physical proprieties [25]. The following analyses were conducted:
- ✓
- Ultimate analysis (C, H, N contents): as specified by EN 15104:2011 [26].
- ✓
- Moisture content: as specified by EN 14774-1:2009 [27].
- ✓
- High and Low Heating Value (HHV and LHV): as specified by EN 14918:2009 [28].
- ✓
- Density: as specified by EN ISO 12185:1996 [29].
- ✓
- Viscosity: as specified by EN ISO 3104:2000 [30].
2.2. Transesterification Reaction
A 1000 mL glass beaker (VWRI213-1128, VWR International Srl,, Milan, Italy) was used as a reactor, and a magnetic stirrer/heater (VWR ALU HOTPLT STIR 230V), equipped with a Pt100 thermocouple provided the mixing and temperature control. The digitally controlled magnetic heater allows one to regulate the temperature of the reaction solution where the Pt100 is inserted, the speed of the stirrer used for solution blending and shows the elapsed time. To increase the matter exchange and to increase the speed of transport [31], the waste peanut frying oil was stirred at 340 rpm. After the oil was heated up to the established reaction temperature, previously mixed methanol and sodium hydroxide (NaOH) in micro bead form (TECHNICAL VWR), were added. The experimental plan involved three levels of the NaOH (0.25, 0.5, 0.75% w/wWCO), four temperature levels (70, 80, 90 and 110 °C) and the molar alcohol/oil ratio was 6:1. The time for all reactions was 60 min because after one hour the total energy supplied to the catalyst was enough to activate all its active sites [32].
After this time, the products of reaction were left to decant for two hours and then the methyl esters were manually separated from glycerol. The Raw Methyl-Esters (RME) were filtered with a 45 µm sieve. The RME quality was analysed in the laboratory, showing that its viscosity did not comply with the limits imposed by the regulations. In order to remove all the residues in the RME, it was subjected to a washing process with deionized water.
For the washing process, the RME were preheated up to 60 °C and then 200 mL of distilled water was added for 5 min. This process was repeated many times, reducing each time the water added, until the water became clear. After this process, the biodiesel obtained showed no unwanted impurities. After being weighed for product yield calculation with Equation (2), the final product was photographed and subjected to the colour and wavelet analysis:
2.3. Wavelet Coefficients Space
In order to analyse the differences between chemical reactions and their corresponding colours, a method that singles out the differences between images is proposed. One of the most powerful methods for image analysis is the wavelet approach. In particular, it will be shown that at the low (wavelet) energy level which correspond to our visual perception of the colours there are very little differences, while at the high (wavelet) energy level there are many significant differences, even when comparing quite similar colours. In particular, we will show that the pattern of the high energy distribution corresponding to the optimal chemical reaction shows some peculiar details which characterize such a reaction. For this reason, we believe that wavelet analysis can help to classify chemical reactions.
Wavelet analysis deals with expanding signals into a sequence by the inner product between the signal and basic functions just like Fourier analysis [33]. Unlike the trigonometric polynomials of the Fourier transform, basis functions of wavelet are generated in the form of scaling and shifting some fixed functions, which called the mother wavelet ϕ(x). The function ϕ(x) needs to be localised both in time and frequency, and satisfy the following conditions:
and:
where is the Fourier transform of ϕ(x). Equation (3) implies a finite energy of the function ϕ(x) and Equation (4) is the admissibility condition, to ensure the reconstruction. The scaling and shifting of φ(x) is defined as:
where ϕj,l(x) is the j-th scale and l-th translation of j(x), and j is the wavelet scale, l is the translation parameter, and a(∈R) is the normalization parameter.
According to the structure of the wavelet system defined in Equation (5), the wavelet multiresolution analysis (MRA), proposed by Mallat [34], provides an approach for a multilevel wavelet transform. To construct the MRA system, another wavelet basic function is introduced, the scaling function ϕ(x), given as:
and MRA system requires that {ϕ(x − l), l ∈ R} forms a subspace of L2(R) where L2(R) is the square integrable function set defined in R. Also the set {ϕ(x − l) ∪ ϕ(2jx − l), j ∈ Z+, l ∈ R} forms a basis function of L2(R) due to the definition of MRA.
For a function f(x) ∈ L2(R), the wavelet transform Wf [35] is defined as follows:
where:
where the wavelet coefficients Wj,lf and Wlf are given by the inner product of f(x) and the wavelet system ϕ(x − l) ∪ ϕ(2jx − l), <g> is the inner product defined in the Hilbert space, and the bar stands for complex conjugate:
with l ∈ Z+, j ∈ R.
The inverse wavelet transform for 2-D wavelet transform, the scaling function is defined as:
where ϕ(x) is the 1-D scaling function. The corresponding wavelet function is given by:
where:
The shifting and scaling function is given as:
For a 2-D function f(x, y), the wavelet analysis can be given by:
where is the 2-D wavelet coefficients. According to the definition of WS, the Parseval identity is obtained:
which suggests that the energy of the function is the square sum of the wavelet coefficients in each scale. Then the energy ε of the 2-D signal f(x, y) can be given by the wavelet coefficient in the form of:
Subsequently the wavelet coefficients derived from the selected reaction images were investigated. By comparing the plot of the energy, the scalogram which gives a density distribution of the energy at different scales, some important results are obtained.
According to the wavelet coefficient βk,j,l,l’, the energy percentage of the coefficient value Sj in different scales j can be calculated by:
3. Results and Discussion
3.1. Analysis of Waste Peanut Frying Oil
Waste peanut frying oil was analysed, according to the standard test methods, to define its chemical and physical properties. Table 1 shows the results of the analysis.
The main reason why waste vegetable oils are transesterified to alkyl esters (biodiesel) is that their high kinematic viscosity, as shown in Table 1, leads to operational problems if they are used as fuel. Indeed, the use of untransesterified oils in the diesel engine, can cause poor atomization of the fuel in the engine combustion chambers and deposits can be produced on various engine parts [37].
3.2. Experimental Plan
The catalyst percentages used are 0.25%, 0.5% and 0.75%, respectively, and reaction temperatures were chosen from what is reported in [22,38]. In detail, tests were carried out at: 70, 80, 90 and 110 °C, and each test was repeated three times. The yields of the reactions is given in Table 2.
In Table 2, the reaction performed at a temperature of 70 °C with a catalyst percentage of 0.5% gave the higher yield value. Table 2 shows how increasing the temperature results in a gradual decrease of the reaction yield. In detail, for the tests conducted at the temperature of 110 °C the transesterification process leads to the solidification of the products, or at least very low yield values. The analysis of the physical characteristics of the RME, showed that the presence of soapy pastes, mucilage and glycerol residues, not evident through a visual analysis, cause a RME viscosity value of 9 ± 0.05 mm2/s. This value did not satisfy the limits imposed by the applicable regulation (UNI EN 14214). For this reason, the washing process was needed.
3.3. Experimental Analysis
The tests performed have allowed the identification of the temperature and the percentage of catalyst which guarantee the maximum reaction yield, in terms of production of biodiesel obtained from waste peanut vegetable oil.
The tests were selected in order to show the main differences that occurred during the transesterification reaction and the washing process. In detail, the choice of images has been made considering the best and worst results of the experimentation campaign. From the selected images of the tests, the colour was analysed, highlighting how the presence of various colour components leads to the characterisation of the different samples. Subsequently, with the wavelet analysis, the coefficients of all the tests were analysed, showing the variability in each phase of the biodiesel production. For both colour and wavelet analysis the images are characterised by the same size of 40 × 20 pixel, suitable for wavelet analysis. In detail, several phases have been analysed concerning the production of biodiesel consisting of the transesterification reaction and the saponification reaction, related to the biodiesel washing phase. For each phase, both successful reactions and reactions that have not occurred were investigated.
Regarding the transesterification reactions, Figure 1, Figure 2, Figure 3, Figure 4 and Figure 5 were analysed. Figure 1, Figure 2 and Figure 3 show successful transesterification reactions in which the raw biodiesel and glycerol were separated. Figure 1 shows a transesterification reaction with a clear biodiesel, without mucilage in suspension. Figure 2 shows a transesterification reaction in which, despite the presence of the separation between the light and heavy phase, there is an amount of mucilage. Regarding Figure 3, the separation of the two phases is present but the colour of the mixture is dark. From the analyses carried out, it was confirmed that biodiesel with a dark colour presented a high value of viscosity equal to 12.5 ± 0.01 mm2/s, whereas the value imposed by the UNI EN 14214 regulation is 3.5–5.5 mm2/s.
Figure 4, Figure 5 and Figure 6 show the reactions of transesterification with a non-perfect separation of the light and heavy phase. In detail, in the reactions shown in Figure 4 and Figure 5 there is a huge quantity of soapy pastes, indeed the mixture was characterised by a gelatinous consistence. Figure 6 is a transesterification reaction in which only glycerol was produced, as visible by its dark colour.
Figure 7, Figure 8, Figure 9, Figure 10, Figure 11 and Figure 12 correspond to the different phases of the washing process to which the biodiesel is subjected. Figure 7 and Figure 8 are the final washing stagee of the biodiesel where the surface separation of the water from the clean biodiesel is visible.
The biodiesel wash steps are displayed in Figure 9, Figure 10 and Figure 11. Each step is characterized by a different amount of water added during the process. The presence of water with impurities underneath the biodiesel indicates more washes are needed. In detail, Figure 9 and Figure 11 indicate that the water is not clear yet, while in Figure 10 there is a huge amount of soaps in the water.
Figure 12 represents a failed washing process, in which the separation between biodiesel and water was not take place but a mixture with only soap was formed. The biodiesel correctly produced, after being treated with all the washes needed, according to the reference regulation is shown in Figure 13.
3.4. Colour Histogram
In this part, the colour histogram, derived of wavelet analysis of different reactions, is analysed. Table 3 shows the colour histogram of the two successful chemical reactions (1) and (2). The reaction result (1) has a bright colour and single colour component, while (2) with the double colour components. This shows that the result (2) contains some impurities (mucilages), while the result (1) shows a biodiesel in which there are no impurities, having a homogeneous colour.
In Table 4 the colour histogram of the experimental tests (3) (4) (5) (6), are displayed. The test (3) shows a homogeneous colour but with a darker scale than the test (1). In terms of product viscosity this indicates a higher value than the reference standard for biodiesel. For the failed test results (4) (5) (6), the colour of the chemical reactions tends to be darker, and they have a single colour component. The non-separation of biodiesel from glycerol provides a final product with a homogeneous colour but with a different gradation than reaction (1). The colour analysis of the reaction products allows one to rapidly understand the correct progress of the transesterification reaction and therefore the interruption of the same when the colour of the output product does not correspond to that shown in Figure (1) in Table 3. Moreover, the in-depth study of the colour histogram can give indications about how much the reaction parameters, temperature and catalyst percentage, need to be modified.
In Table 5 different phases of the biodiesel washing process are shown. In detail, the images are relative to biodiesel which is obtained after the decantation phase, that is the separation between biodiesel and water. The analysis of the colour histogram for tests from (7) to (11) shows the presence of double colour. This indicates the presence of impurities and therefore the need to repeat the washings. The test (12) refers to a failed washing process, in which the separation between biodiesel and water did not occur. The detailed analysis of the colour allows to have precise information on how the washing phases proceeds. The wavelet analyses carried out allows one to identify also colour differences that cannot be detected by the human eye. This allows one to optimise the washing process ensuring the complete absence of impurities in the finished product.
In Table 6 colour analysis of the test (13) is reported. The analysis of histogram highlights the presence of a single colour and absence of impurities in the final biodiesel. The analysis of the viscosity of the product provided a value of 4.3 ± 0.02 mm2/s, as required by the relevant regulation.
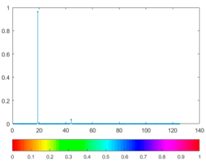
The scalograms, the percentage of energy for each wavelet coefficient, have been calculated. Table 7 and Table 8 show the tests results relating to transesterification reactions. The analysis of energy distribution in the scalogram shows a vertically energy variation in the reaction results which represents the relative colour variation due to both the presence of impurities and the production of a product where the separation between biodiesel and glycerol has not occurred.
In Table 7, the scalogram of the Figures (1) and (2) represents the successful reactions. The result (1) is better than (2) which contains some mucillages, because the distribution of the wavelet coefficient energy for (1) is distributed more uniformly than in (2).
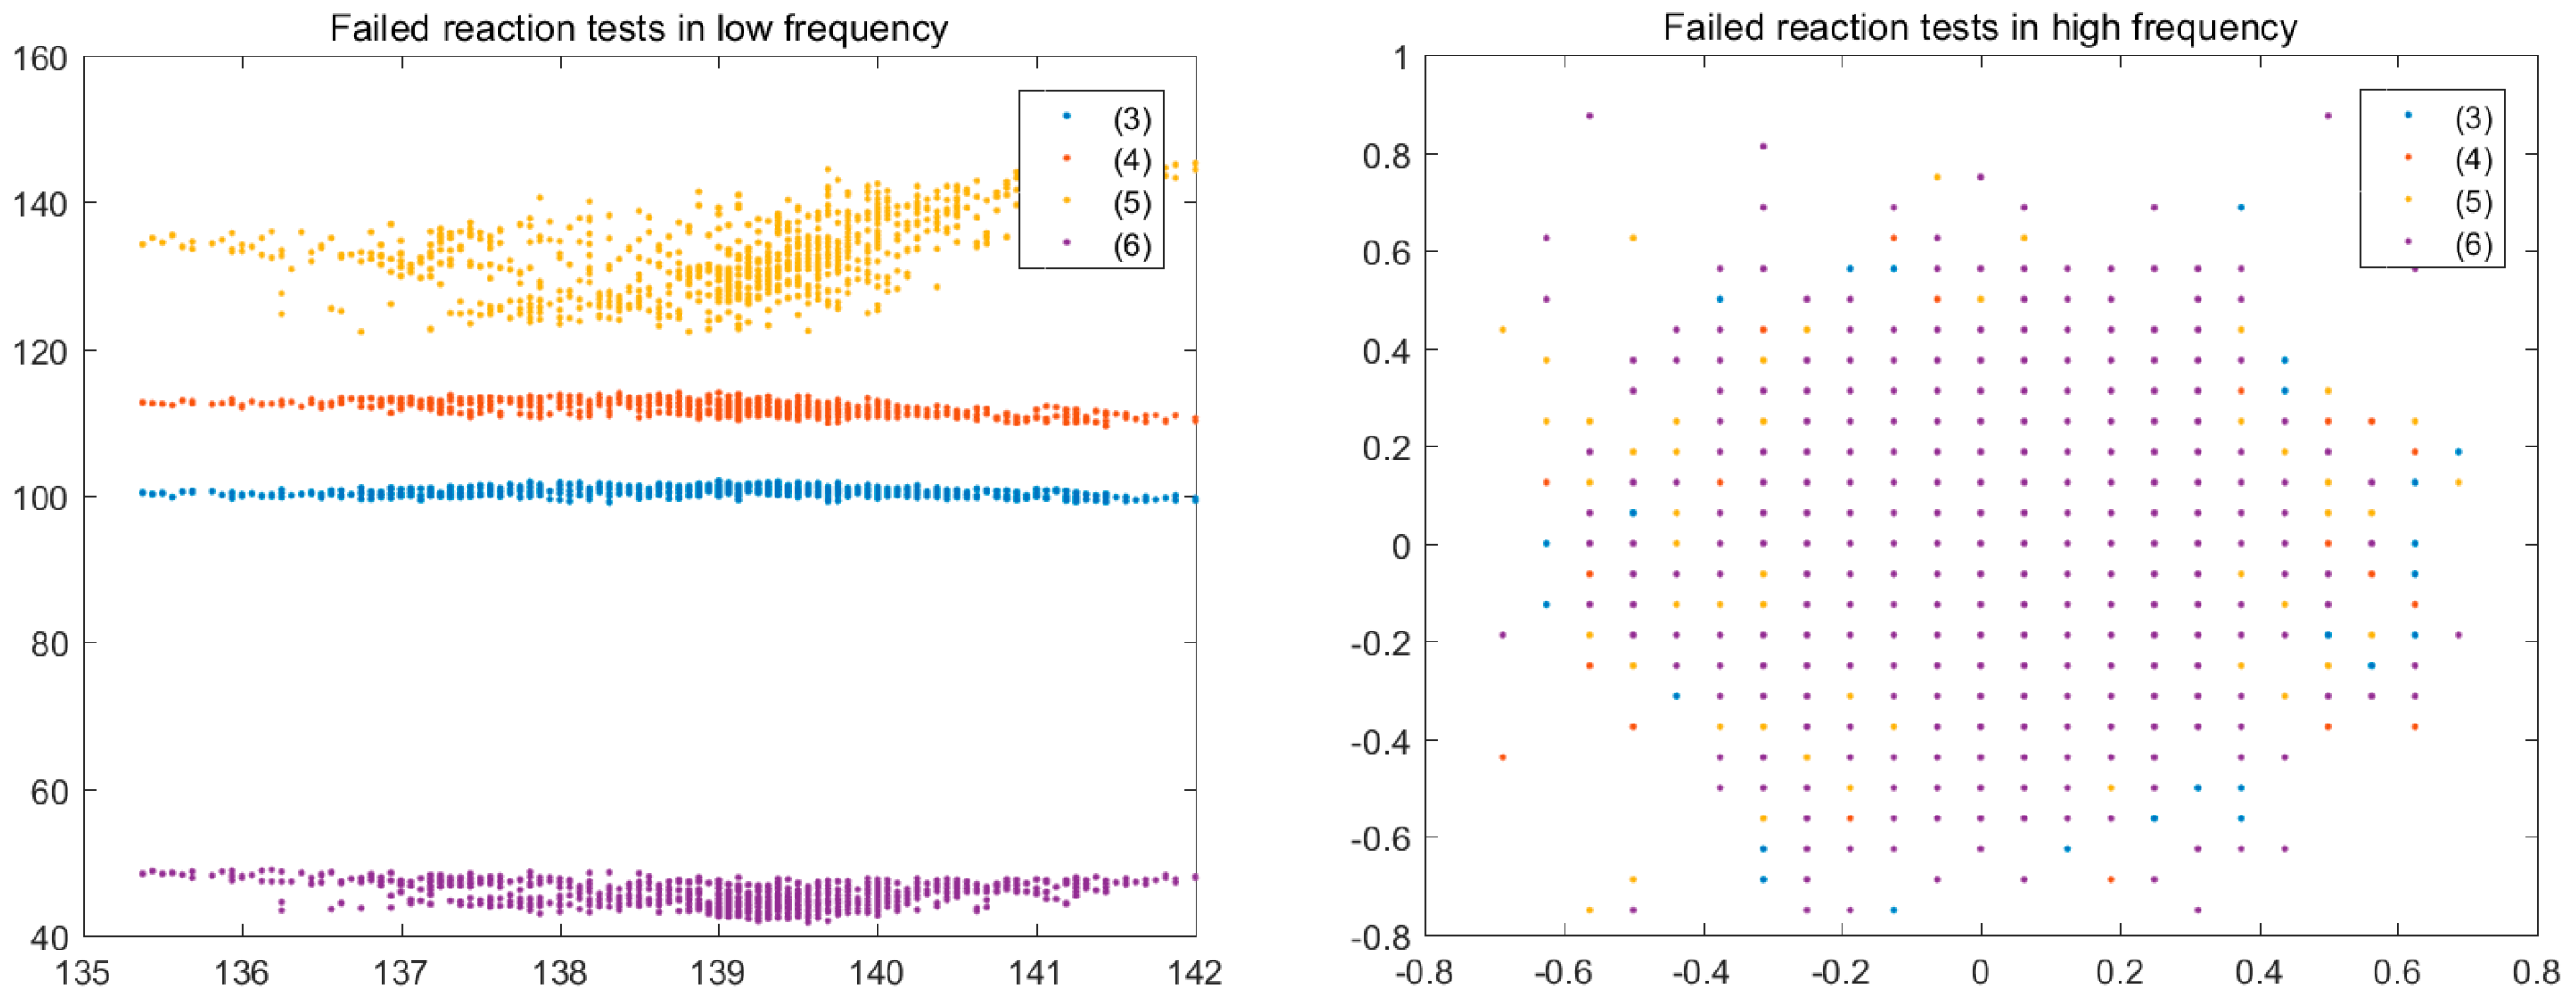
In Table 8, the low frequency wavelet coefficient scalogram of the failed reactions (3) and (6) are shown, where (3) and (6) have a similar energy distribution, and the energy is mainly distributed in the bottom, according to the reaction results. In fact, reaction (3) corresponds to a product characterised by a dark colour similar to (6) that is composed by the solid phase (glycerol) only.
While (4) and (5) have less energy variation than (3) and (6) because represent reaction in which the complete separation of the phase states has not occurred and they are full of impurities. Then the wavelet coefficient of failed tests and the best test results are compared, which are shown in Figure 14 and Figure 15. From Figure 14, we find that the low frequency wavelet coefficients of the successful test mainly concentrated between the range of 145–150, while the failed tests results are in a lower range, Figure 15.
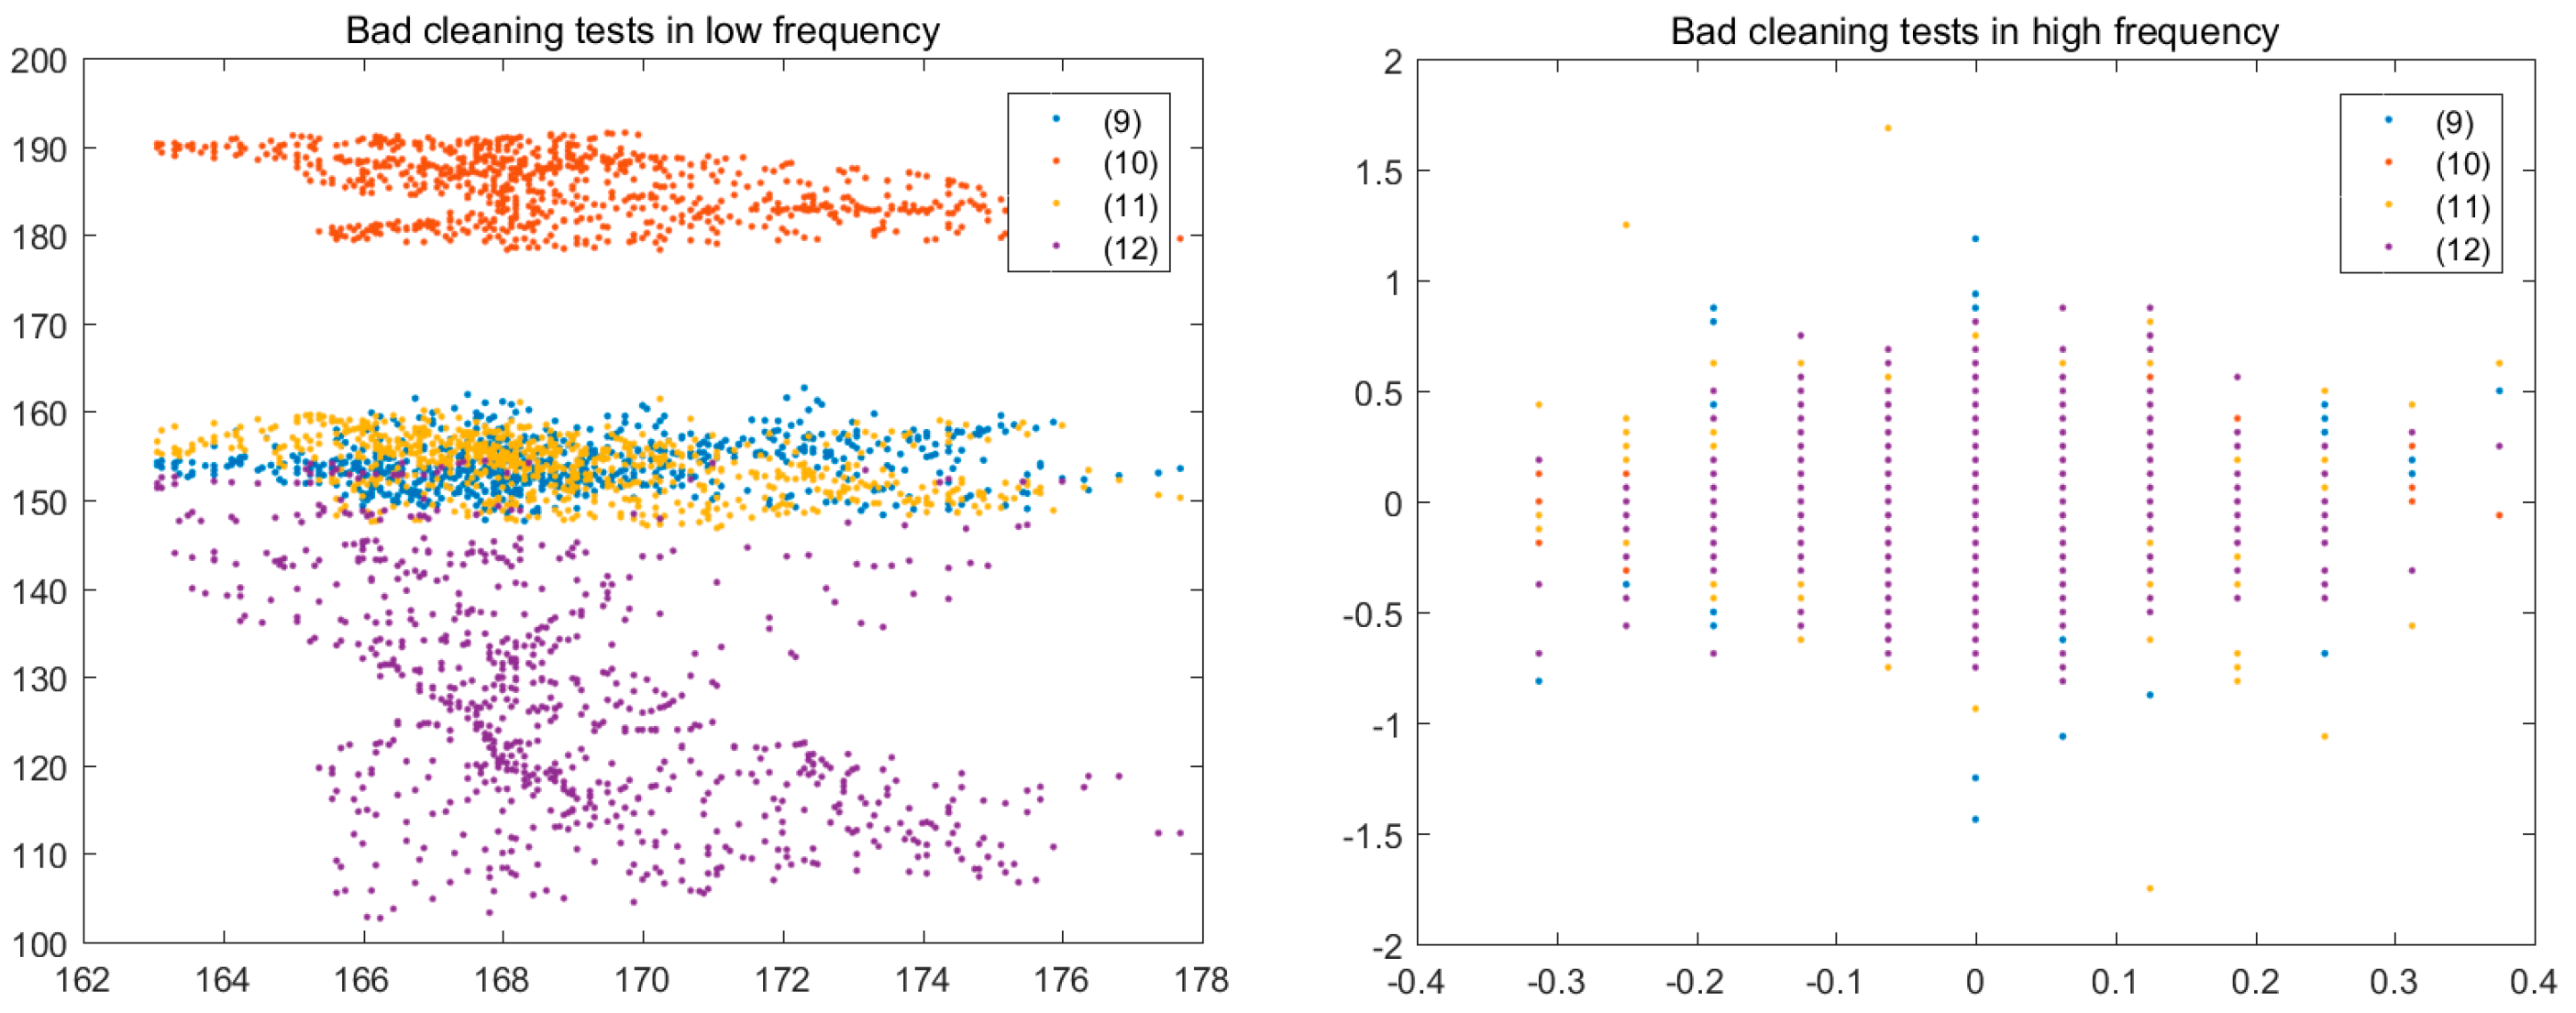
The scalograms of the washing process results are considered in Table 9. The tests (7) and (8) represent the final washing process which shows the main wavelet energy is distributed homogenously in the middle of the figure, while tests (9), (10), (11) are the tests which need more washings. In fact, (9) and (11) are the intermediate washings and have a similar energy distribution while (10) is the first wash, with an energy concentration on the top. (12) is the failed washing process in which all the energy is concentrated in the low part of the figure.
The best result of the washing process is shown in Table 10. It can be seen from the scalogram that the percentage of the high wavelet coefficients is small, thus the change in the reaction result is small, which reflects that the cleaning is the best.
For the tests (7) and (8) in Table 9, the wavelet coefficients comparison are shown in Figure 16. The comparison of the tests (9) and (12) is given in Figure 17. The wavelet scalograms in high frequency of all the tests have been analysed. The results obtained did not show a significant difference between the analysed images. For this reason, the results have not been reported.
4. Conclusions
The results of the wavelet analysis for the chemical reactions and washing process suggest that the wavelet technique is a good way to reflect the energy distribution in testing. The results obtained show that the reactions examined by through the colour histogram, showed information satisfactorily relating to the progress of the biodiesel production process. Especially using low frequency wavelet coefficients, a valid characterization of the quality of the tests was provided, which is consistent with the experimental results. The scalogram and wavelet method in this work only provide a preliminary analysis of the sample in terms of colour and presence of impurities. The colour histogram and wavelet analysis of production process in the industrial field could be used to evaluate the correct trend of any production process and could be useful to inspect the various steps during process, avoiding any prospect of wrong protraction. In this way it is possible to reduce additional industrial costs. The correlation between wavelet coefficients and chemical physical properties should be explored in a future investigation
Acknowledgments
The work of Guomin Sun was done during her visit to the University of Tuscia. This author is very grateful to the China Scholarship Council for funding the visiting fellowship. This work was supported by the National Natural Science Foundation of China under Grant 11271001, Grant 61370147, Grant 61573085.
Author Contributions
Carlini Maurizio, Castellucci Sonia, Alessandro Cardarelli have conceived and designed the experiments; Carlo Cattani, Guomin Sun and Jinsong Leng has analyzed the data with wavelet analisys; Castellucci Sonia, Alessandro Cardarelli and Guomin Sun have written the paper.
Conflicts of Interest
The authors declare no conflict of interest.
References
- Carraretto, C.; Macor, A.; Mirandola, A.; Stoppato, A.; Tonon, S. Biodiesel as alternative fuel: Experimental analysis and energetic evaluations. Energy 2004, 29, 2195–2211. [Google Scholar] [CrossRef]
- Freitas, H.F.S.; Olivo, J.E.; Andrade, C.M.G. Optimization of Bioethanol in Silico Production Process in a Fed-Batch Bioreactor Using Non-Linear Model Predictive Control and Evolutionary Computation Techniques. Energies 2017, 10, 1763. [Google Scholar] [CrossRef]
- Gnanaprakasam, A.; Sivakumar, V.M.; Surendhar, A.; Thirumarimurugan, M.; Kannadasan, T. Recent Strategy of Biodiesel Production from Waste Cooking Oil and Process Influencing Parameters: A Review. J. Energy 2013, 2013, 1–10. [Google Scholar] [CrossRef]
- El-Dalatony, M.M.; Salama, E.-S.; Kurade, M.B.; Hassan, S.H.A.; Oh, S.-E.; Kim, S.; Jeon, B.-H. Utilization of Microalgal Biofractions for Bioethanol, Higher Alcohols, and Biodiesel Production: A Review. Energies 2017, 10, 2110. [Google Scholar] [CrossRef]
- Hill, J.; Nelson, E.; Tilman, D.; Polasky, S.; Tiffany, D. Environmental, economic, and energetic costs and benefits of biodiesel and ethanol biofuels. Proc. Natl. Acad. Sci. USA 2006, 103, 11206–11210. [Google Scholar] [CrossRef] [PubMed]
- Tamošiūnas, A.; Chouchène, A.; Valatkevičius, P.; Gimžauskaitė, D.; Aikas, M.; Uscila, R.; Ghorbel, M.; Jeguirim, M. The Potential of Thermal Plasma Gasification of Olive Pomace Charcoal. Energies 2017, 10, 710. [Google Scholar] [CrossRef]
- Borges, M.; Díaz, L. Recent developments on heterogeneous catalysts for biodiesel production by oil esterification and transesterification reactions: A review. Renew. Sustain. Energy Rev. 2012, 12, 2839–2849. [Google Scholar] [CrossRef]
- Zhang, Y.; Dube, M.A.; McLean, D.D.; Kates, M. Biodiesel production from waste cooking oil: 1. Process design and technological assessment. Bioresour. Technol. 2003, 89, 1–16. [Google Scholar] [CrossRef]
- Encinar, J.M. Biodiesel from Used Frying Oil. Variables Affecting the Yields and Characteristics of the Biodiesel. Ind. Eng. Chem. Res. 2005, 44, 5491–5499. [Google Scholar] [CrossRef]
- Carlini, M.; Castellucci, S.; Cocchi, S.; Manzo, A. Waste wood biomass arising from pruning of urban green in Viterbo town: Energy characterization and potential uses. In Computational Science and Its Applications—ICCSA 2013; Lecture Notes in Computer Science; Springer: Berlin/Heidelberg, Germany, 2013; Volume 7972. [Google Scholar]
- Marucci, A.; Carlini, M.; Castellucci, S.; Cappuccini, A. Energy efficiency of a greenhouse for the conservation of forestry biodiversity. Math. Probl. Eng. 2013, 2013, 768658. [Google Scholar] [CrossRef]
- Mosconi, E.M.; Carlini, M.; Castellucci, S.; Allegrini, E.; Mizzelli, L.; di Trifiletti, M.A. Economical assessment of large-scale photovoltaic plants: An Italian case study. In Computational Science and Its Applications—ICCSA 2013; Lecture Notes in Computer Science; Springer: Berlin/Heidelberg, Germany, 2013; Volume 7972. [Google Scholar]
- Kulkarni, M.G.; Dalai, A.K. Waste Cooking OilAn Economical Source for Biodiesel: A Review. Ind. Eng. Chem. Res. 2006, 45, 2901–2913. [Google Scholar] [CrossRef]
- Supple, B. The Effect of Steam Treating Waste Cooking Oil on the Yield of Methyl Ester. J. Am. Oil Chem. Soc. 2002, 79, 175–178. [Google Scholar] [CrossRef]
- Fox, N.; Stachowiak, G. Vegetable oil-based lubricants—A review of oxidation. Tribol. Int. 2007, 40, 1035–1046. [Google Scholar] [CrossRef]
- Savuto, E.; di Carlo, A.; Bocci, E.; D’Orazio, A.; Villarini, M.; Carlini, M.; Foscolo, P.U. Development of a CFD model for the simulation of tar and methane steam reforming through a ceramic catalytic filter. Int. J. Hydrogen Energy 2015, 40, 7991–8004. [Google Scholar] [CrossRef]
- Paul, S.; Mittal, G.S. Dynamics of fat/oil degradation during frying based on optical properties. J. Food Eng. 1996, 30, 389–403. [Google Scholar] [CrossRef]
- Grams, J.; Ruppert, A.M. Development of Heterogeneous Catalysts for Thermo-Chemical Conversion of Lignocellulosic Biomass. Energies 2017, 10, 545. [Google Scholar] [CrossRef]
- Semwal, S.; Arora, A.K.; Badoni, R.P.; Tuli, D.K. Biodiesel production using heterogeneous catalysts. Bioresour. Technol. 2011, 102, 2151–2161. [Google Scholar] [CrossRef] [PubMed]
- Ramos, M.J.; Fernández, C.M.; Casas, A.; Rodríguez, L.; Pérez, A. Influence of fatty acid composition of raw materials on biodiesel properties. Bioresour. Technol. 2009, 100, 261–268. [Google Scholar] [CrossRef] [PubMed]
- Lee, D.-S.; Nohb, B.-S.; Bae, S.-Y.; Kima, K. Characterization of fatty acids composition in vegetable oils by gas chromatography and chemometrics. Anal. Chim. Acta 1998, 358, 163–175. [Google Scholar] [CrossRef]
- Lobo, B.B.; da Costa, A.E.; Gouvêa, C.A.K.; Andreazza, J.K.; Al-Rubaie, K.S. Optimization for producing biodiesel from ethanol and waste frying oil with a high concentration of ester. Rev. Fac. Ing. Univ. Antioquia 2016. [Google Scholar] [CrossRef]
- BSI. Liquid Petroleum Products-Fatty Acid Methyl Esters (FAME) for Use in Diesel Engines and Heating Applications—Requirements and Test Methods; UNI EN 14214:2014; BSI: London, UK, 2013. [Google Scholar]
- Ouanji, F.; Khachani, M.; Boualag, M.; Kacimi, M.; Ziyad, M. Large-scale biodiesel production from Moroccan used frying oil. Int. J. Hydrogen Energy 2016, 41, 21022–21029. [Google Scholar] [CrossRef]
- Carlini, M.; Castellucci, S.; Cocchi, S. A Pilot-Scale Study of Waste Vegetable Oil Transesterification with Alkaline and Acidic Catalysts. Energy Procedia 2014, 45, 198–206. [Google Scholar] [CrossRef]
- Determination of Total Content of Carbon, Hydrogen and Nitrogen Instrumental Methods; UNI EN 15104:2011; Italian National Unification authority UNI: Milan, Italy, 2011.
- Determination of Moisture Content—Oven Dry Method; UNI EN 14774-1; Italian National Unification authority UNI: Milan, Italy, 2010.
- Determination of Caloric Value; UNI EN 14918:2010; Italian National Unification authority UNI: Milan, Italy, 2010.
- ISO. Crude Petroleum and Petroleum Products—Determination of Density—Oscillating U-tube Method; ISO 12185:1996; ISO: Geneva, Switzerland, 1996. [Google Scholar]
- ISO. Petroleum Products—Transparent and Opaque Liquids—Determination of Kinematic Viscosity and Calculation of Dynamic Viscosity; ISO 3104:2000; ISO: Geneva, Switzerland, 2000. [Google Scholar]
- Noureddini, H.; Zhu, D. Kinetics of transesterification of soybean oil. J. Am. Oil Chem. Soc. 1997, 74, 1457–1463. [Google Scholar] [CrossRef]
- Ouanji, F.; Nachid, M.; Kacimi, M.; Liotta, L.F.; Puleo, F.; Ziyad, M. Small scale biodiesel synthesis from waste frying oil and crude methanol in Morocco. Chin. J. Chem. Eng. 2016, 24, 1178–1185. [Google Scholar] [CrossRef]
- Daubechies, I. Ten Lectures on Wavelets; Society for Industrial and Applied Mathematics: Philadelphia, PA, USA, 1992. [Google Scholar]
- Chui, C.K. An Introduction to Wavelets; Academic Press: San Diego, CA, USA, 1992. [Google Scholar]
- Mallat, S.G. A theory for multiresolution signal decomposition: The wavelet representation. IEEE Trans. Pattern Anal. Mach. Intell. 1989, 11, 674–693. [Google Scholar] [CrossRef]
- Rioul, O.; Martin, V. Wavelets and signal processing. IEEE Signal Process. Mag. 1991, 8, 14–38. [Google Scholar] [CrossRef]
- Knothe, G.; van Gerpen, J.; Krahl, J. The Biodiesel Handbook; AOCS Press: Champaign, IL, USA, 2005. [Google Scholar]
- Leung, D.; Guo, Y. Transesterification of neat and used frying oil: Optimization for biodiesel production. Fuel Process. Technol. 2006, 87, 883–890. [Google Scholar] [CrossRef]
Figure 1.
Successful transesterification reaction, NaOH 0.5%, T = 70 °C.

Figure 2.
Successful transesterification reaction with mucilages, NaOH 0.25%, T = 70 °C.

Figure 3.
Successful transesterification reaction with dark colour, NaOH 0.75%, T = 80 °C.

Figure 4.
Failed transesterification reaction with soapy pastes, NaOH 0.25%, T = 90 °C.

Figure 5.
Failed transesterification reaction with soapy pastes, NaOH 0.5%, T = 90 °C.

Figure 6.
Failed transesterification reaction with only the heavy phase (glycerol), NaOH 0.75%, T = 110 °C.
Figure 6.
Failed transesterification reaction with only the heavy phase (glycerol), NaOH 0.75%, T = 110 °C.

Figure 7.
Final washing process of the biodiesel, NaOH 0.25%, T = 70 °C.

Figure 8.
Final washing process of the biodiesel, NaOH 0.75%, T = 80 °C.

Figure 9.
First-step washing process of the biodiesel, 200 mL H2O.

Figure 10.
Second-step washing process of the biodiesel, 100 mL H2O.

Figure 11.
Third-step washing process of the biodiesel, 50 mL H2O.

Figure 12.
Failed washing process of the biodiesel.

Figure 13.
Pure biodiesel.

Figure 14.
The comparison between tests in Table 6.
Figure 14.
The comparison between tests in Table 6.
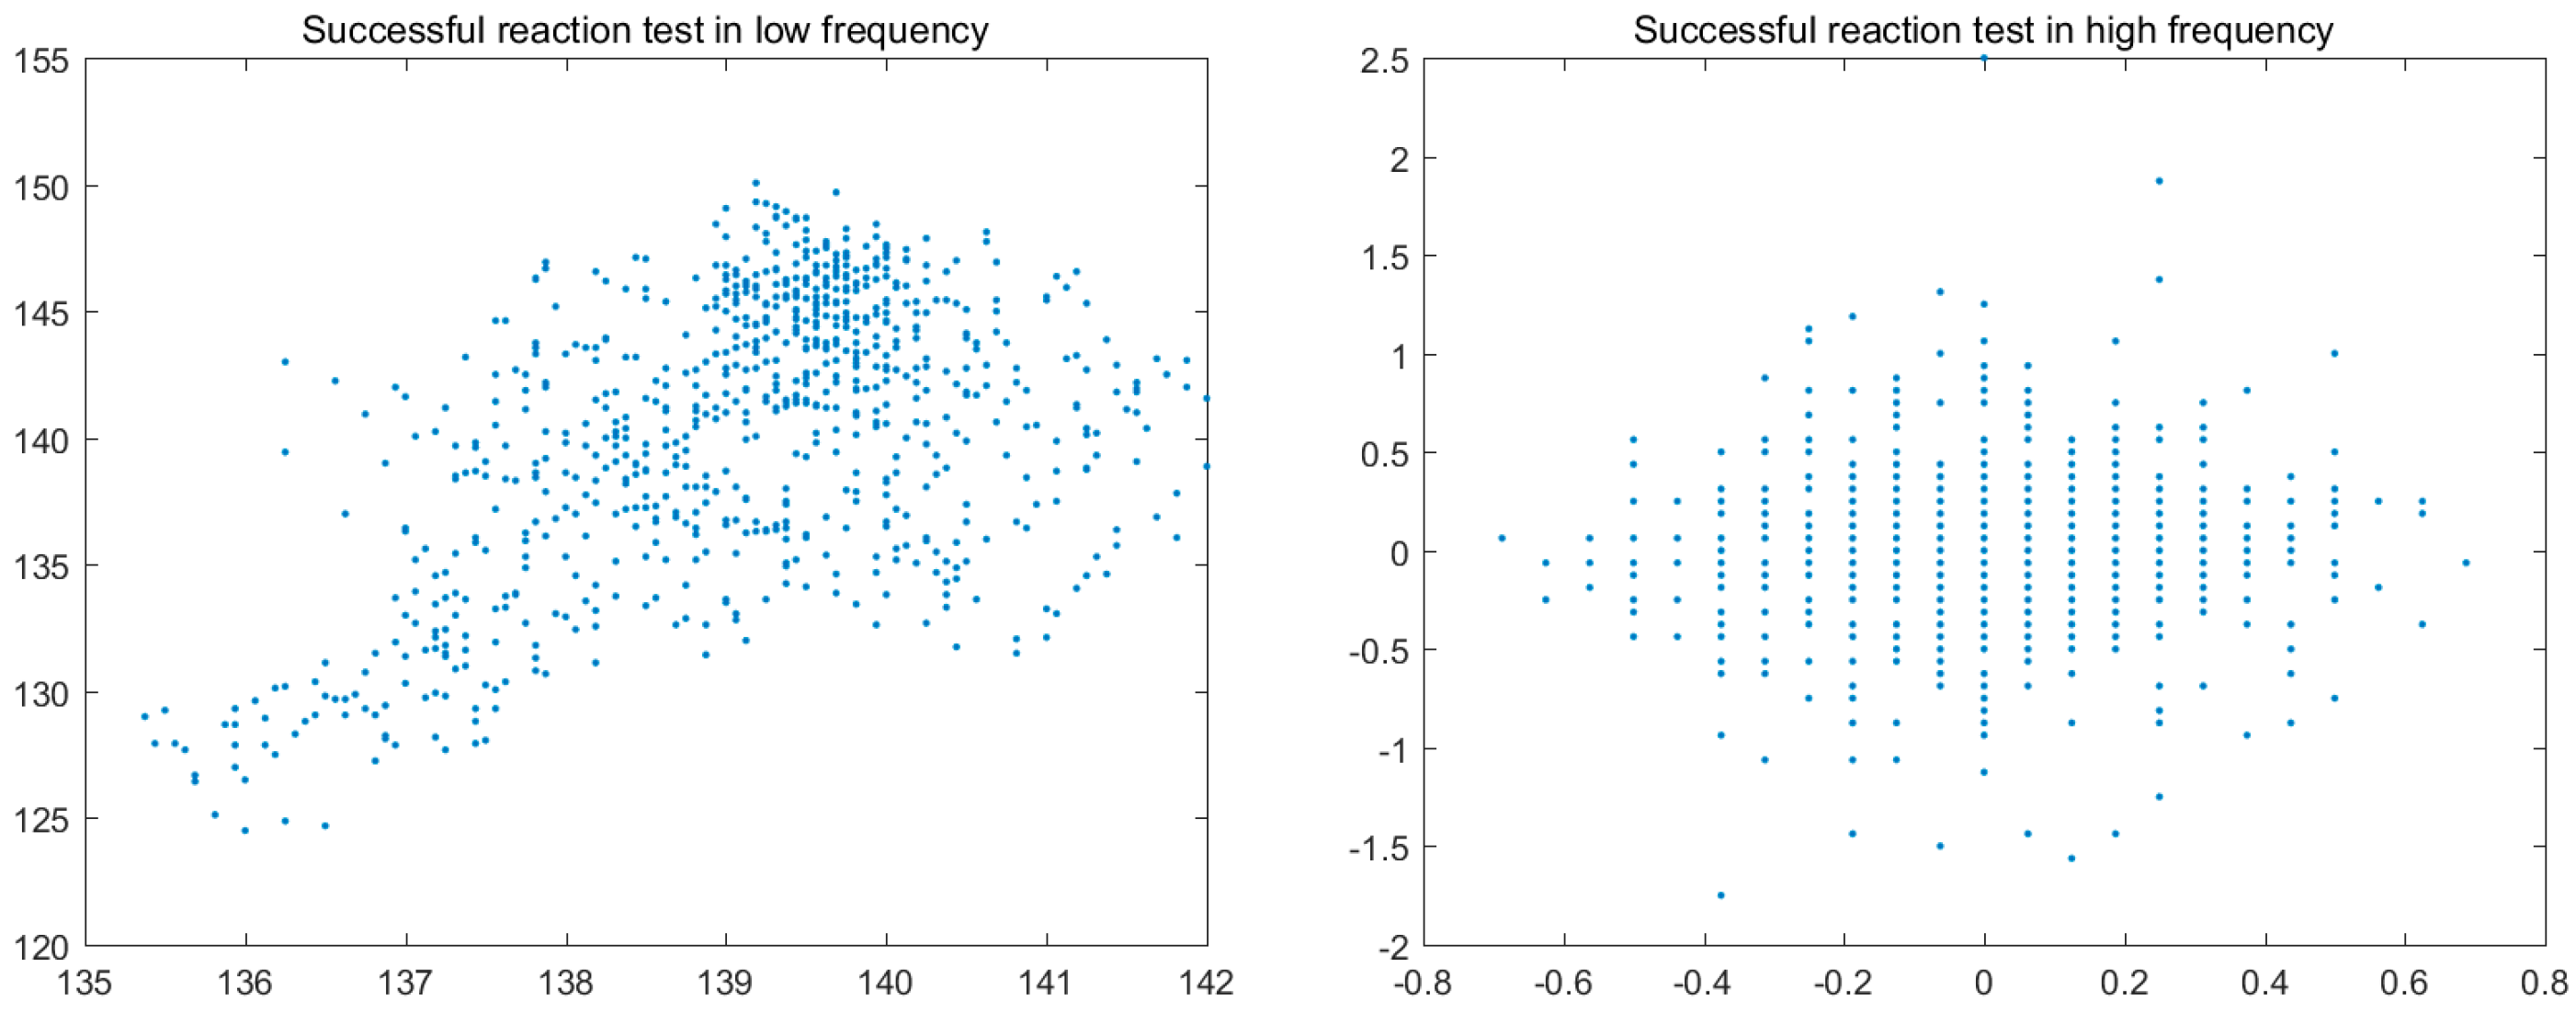

Figure 16.
The comparison of the test results (7) and (8) in Table 9.
Figure 16.
The comparison of the test results (7) and (8) in Table 9.
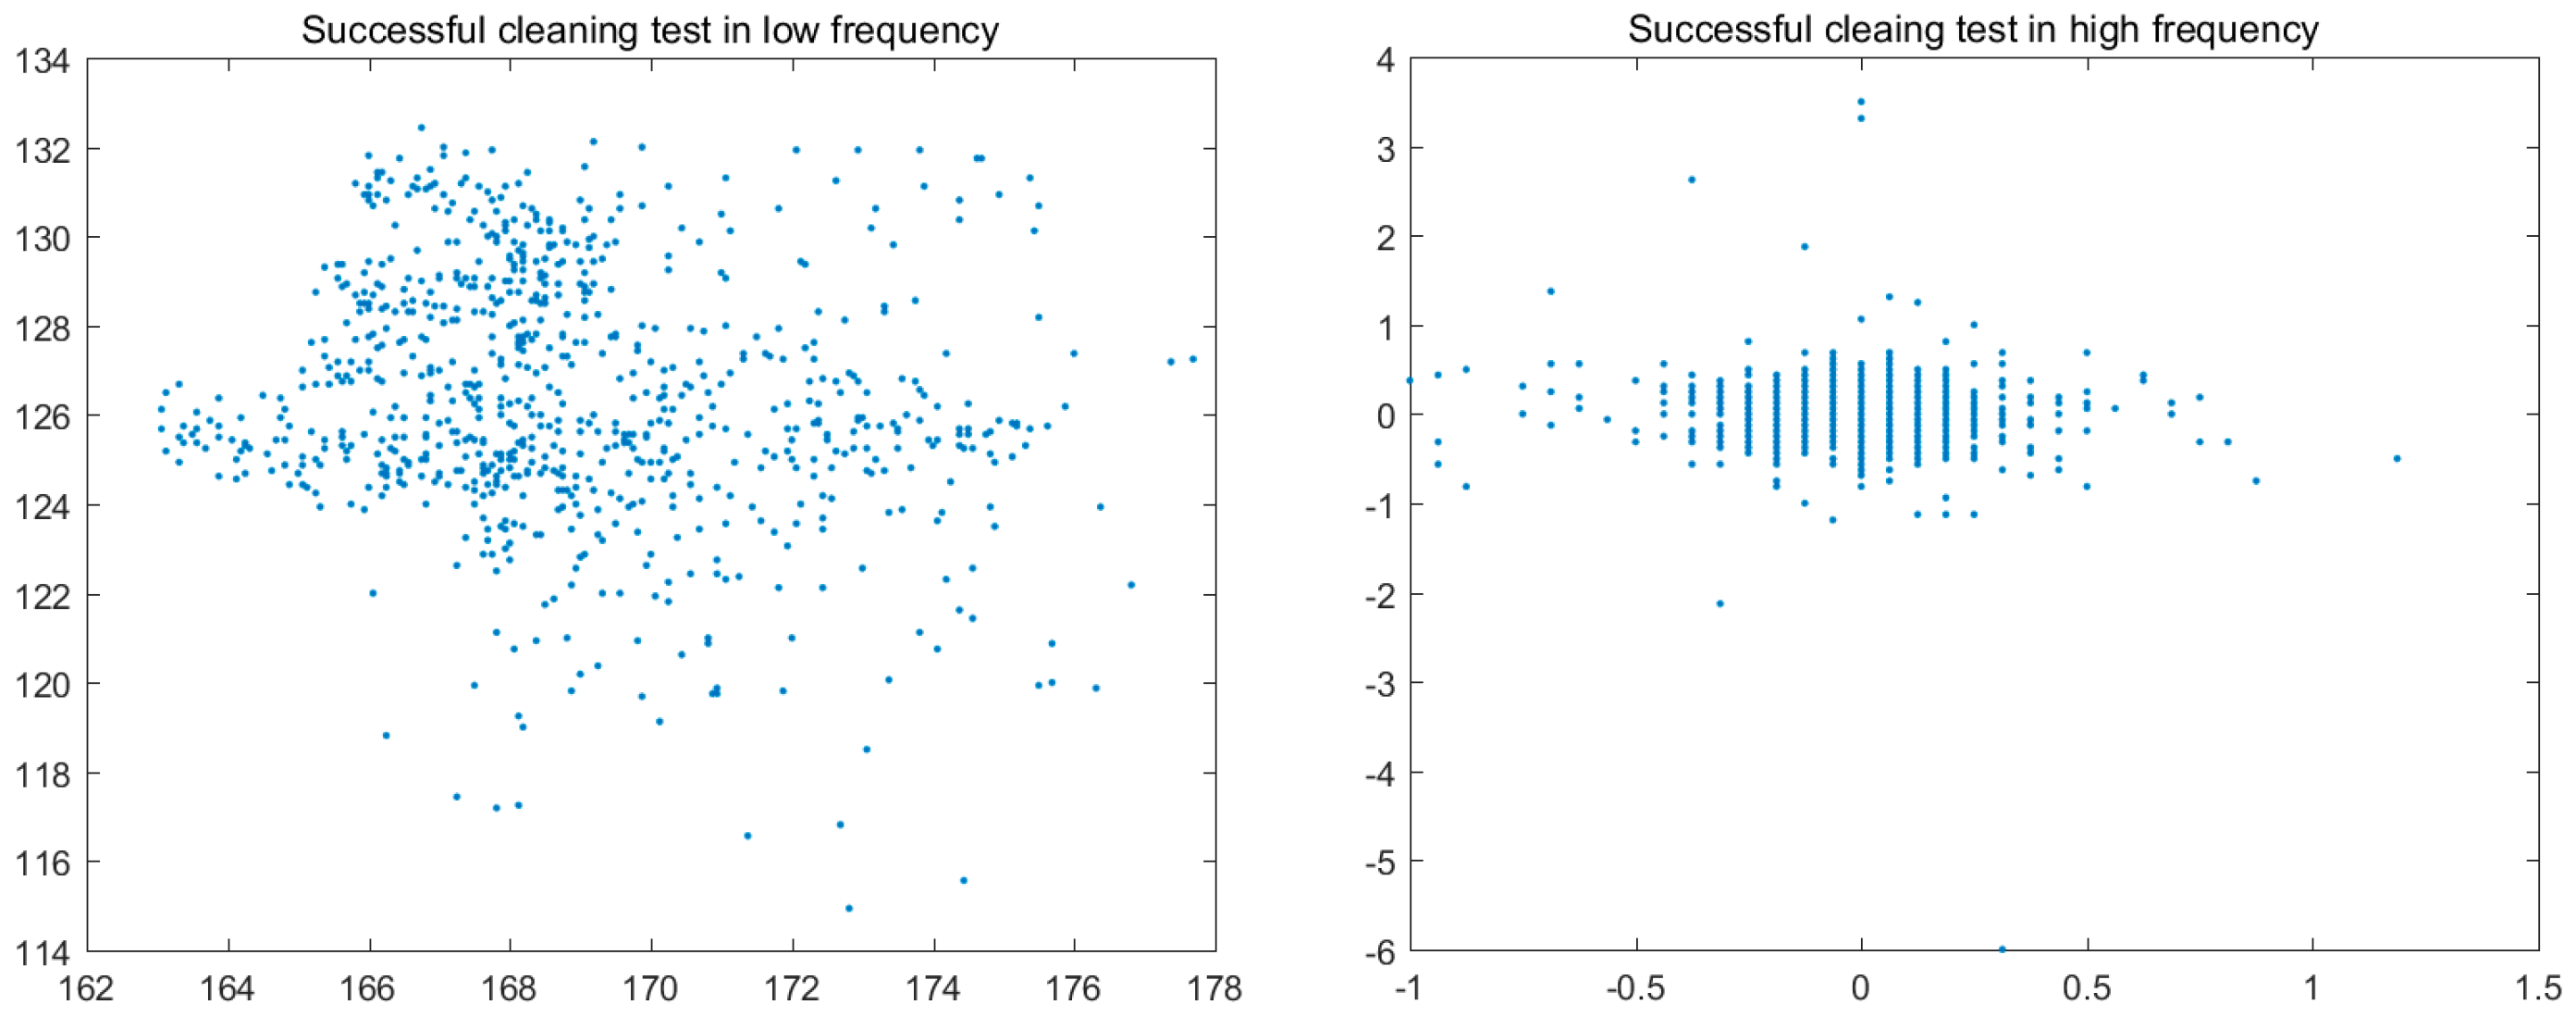
Figure 17.
The comparison of the result of the washing process (7) with the (9), (10), (11) and (12) shown in Table 9.
Figure 17.
The comparison of the result of the washing process (7) with the (9), (10), (11) and (12) shown in Table 9.

Table 1.
Analysis of waste frying peanut oil.
| Properties | Unit | Value |
|---|---|---|
| Density | kg/m3 | 937.5 ± 0.01 |
| Viscosity | mm2/s | 36.6 ± 0.04 |
| Moisture | % | 3 ± 0.03 |
| C | % | 54.893 ± 0.05 |
| H | % | 8.708 ± 0.02 |
| N | % | 0.238 ± 0.03 |
| Hs | MJ/kg | 41.42 ± 0.02 |
| Hi | MJ/kg | 39.62 ± 0.01 |
Table 2.
Percentage yield of the reactions.
| Test | Catalyst [%] | Temperature [°C] | Product Yield [%] |
|---|---|---|---|
| 1 | 0.25 | 70 | 47.57 ± 0.09 |
| 2 | 0.50 | 70 | 78.26 ± 0.05 |
| 3 | 0.75 | 70 | 44.25 ± 0.06 |
| 4 | 0.25 | 80 | 53.27 ± 0.07 |
| 5 | 0.50 | 80 | 52.85 ± 0.05 |
| 6 | 0.75 | 80 | 37.06 ± 0.04 |
| 7 | 0.25 | 90 | 52.31 ± 0.03 |
| 8 | 0.50 | 90 | 49.33 ± 0.02 |
| 9 | 0.75 | 90 | 2.25 ± 0.06 |
| 10 | 0.25 | 110 | 41.64 ± 0.01 |
| 11 | 0.50 | 110 | 21.97 ± 0.05 |
| 12 | 0.75 | 110 | - |
Table 3.
The colour histogram of successful reactions.
| Chemical Reaction | Colour Histogram | Chemical Reaction | Colour Histogram |
|---|---|---|---|
 (1) |  |  (2) | 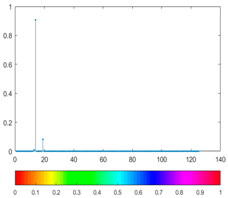 |
Table 4.
The colour histogram of failed reactions.
| Chemical Reaction | Colour Histogram | Chemical Reaction | Colour Histogram |
|---|---|---|---|
 (3) |  |  (4) |  |
 (5) |  |  (6) |  |
Table 5.
The colour histogram of washing process results.
| Chemical Reaction | Colour Histogram | Chemical Reaction | Colour Histogram |
|---|---|---|---|
 (7) |  |  (8) | 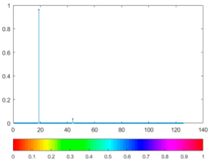 |
 (9) |  |  (10) | 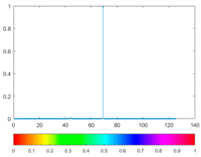 |
 (11) |  |  (12) |  |
Table 6.
The best washing process result.
| Chemical Reaction | Colour Histogram |
|---|---|
 (13) |  |
Table 7.
Comparison of the low frequency scalogram.
| Figure | Chemical Reaction | Scalogram: Percentage of Energy for Each Wavelet Coefficient | Percentage of Energy for Each Wavelet Coefficient |
|---|---|---|---|
| (1) |  |  |  |
| (2) |  |  |  |
Table 8.
The failed testing results in low frequency.
| Figure | Chemical Reaction | Scalogram: Percentage of Energy for Each Wavelet Coefficient | Percentage of Energy for Each Wavelet Coefficient |
|---|---|---|---|
| (3) |  |  |  |
| (4) |  |  | 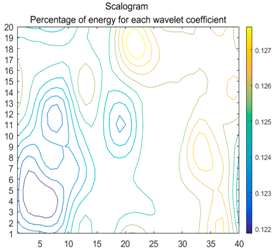 |
| (5) |  | 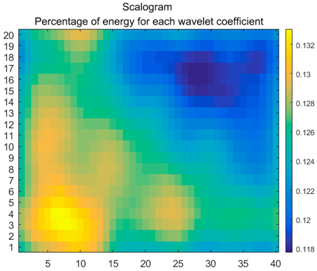 | 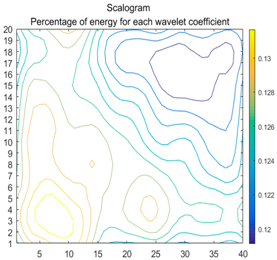 |
| (6) |  | 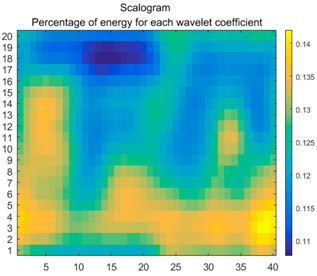 | 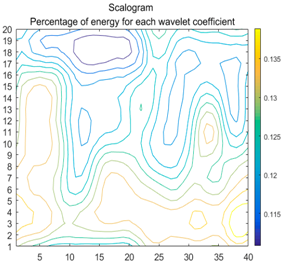 |
Table 9.
The wavelet coefficient scalogram of the washing process in low frequency.
| Figure | Chemical Reaction | Scalogram: Percentage of Energy for Each Wavelet Coefficient | Percentage of Energy for Each Wavelet Coefficient |
|---|---|---|---|
| (7) |  | 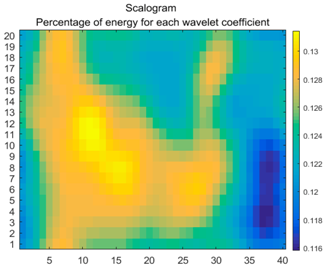 | 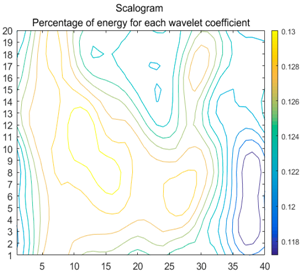 |
| (8) |  | 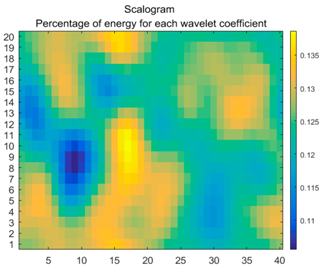 | 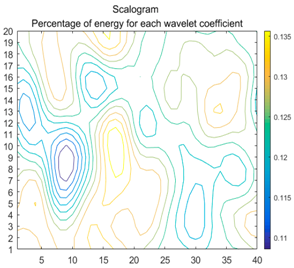 |
| (9) |  | 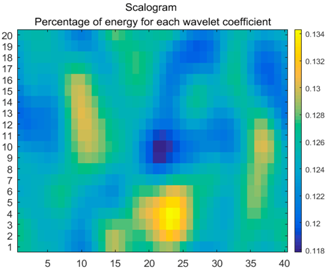 | 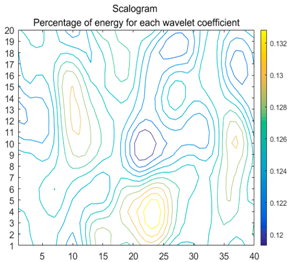 |
| (10) |  |  |  |
| (11) |  | 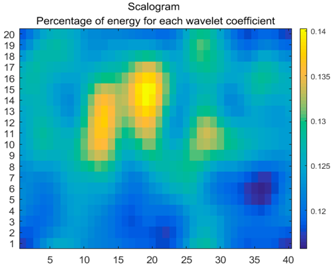 | 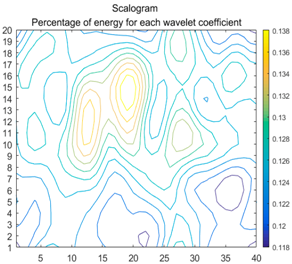 |
| (12) |  |  |  |
Table 10.
The best result of the washing process.
| Figure | Chemical Reaction | Scalogram: Percentage of Energy for Each Wavelet Coefficient | Percentage of Energy for Each Wavelet Coefficient |
|---|---|---|---|
| (13) |  | 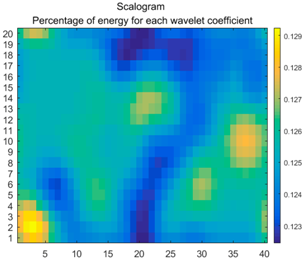 | 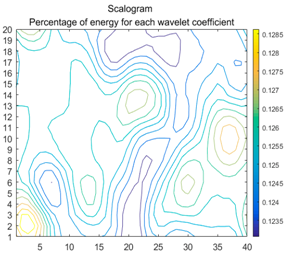 |
© 2018 by the authors. Licensee MDPI, Basel, Switzerland. This article is an open access article distributed under the terms and conditions of the Creative Commons Attribution (CC BY) license (http://creativecommons.org/licenses/by/4.0/).
Share and Cite
MDPI and ACS Style
Carlini, M.; Castellucci, S.; Sun, G.; Leng, J.; Cattani, C.; Cardarelli, A. A Wavelet-Based Optimization Method for Biofuel Production. Energies 2018, 11, 377. https://doi.org/10.3390/en11020377
AMA Style
Carlini M, Castellucci S, Sun G, Leng J, Cattani C, Cardarelli A. A Wavelet-Based Optimization Method for Biofuel Production. Energies. 2018; 11(2):377. https://doi.org/10.3390/en11020377
Chicago/Turabian StyleCarlini, Maurizio, Sonia Castellucci, Guomin Sun, Jinsong Leng, Carlo Cattani, and Alessandro Cardarelli. 2018. "A Wavelet-Based Optimization Method for Biofuel Production" Energies 11, no. 2: 377. https://doi.org/10.3390/en11020377
Note that from the first issue of 2016, this journal uses article numbers instead of page numbers. See further details here.