Investigation of Unsteady Flow Interactions in a Transonic High Pressure Turbine Using Nonlinear Harmonic Method


1
National Key Laboratory of Science and Technology on Aero-Engine Aero-Thermodynamics, School of Energy and Power Engineering, Beihang University, Beijing 100191, China
2
Collaborative Innovation Center of Advanced Aero-Engine, Beihang University, Beijing 100191, China
3
Department of Engineering, University of Cambridge, Cambridge CB2 1PZ, UK
4
School of Aeronautics and Astronautics, and ZJU-UIUC Institute, Zhejiang University, Zhejiang 310027, China
*
Authors to whom correspondence should be addressed.
Energies 2018, 11(2), 342; https://doi.org/10.3390/en11020342
Submission received: 4 January 2018
/
Revised: 21 January 2018
/
Accepted: 24 January 2018
/
Published: 2 February 2018
Abstract
:The performance of a transonic high pressure turbine is mainly influenced by the unsteady interactions associated with the passing blades. In this paper, the unsteady flow interactions in a transonic turbine have been numerically investigated using the nonlinear harmonic (NLH) method in comparison with the steady and unsteady Reynolds-averaged Navier–Stokes (RANS). The comparison shows that the NLH method using three harmonics could capture the main unsteady flow interactions efficiently with about seven times smaller computational cost than the unsteady RANS, resulting in a more accurate time-averaged flow than for steady RANS. However, the continuity of the flow variables across the rotor-stator interface has shown some discrepancies compared with the unsteady RANS, which can be further satisfied by increasing the numbers of harmonics. The unsteady interactions are analyzed in detail; the results show that the wake and trailing edge shock from the upstream stator are the major sources of unsteadiness in the downstream rotor passage. The stator trailing edge shock impinges on the suction side of the passing rotor blades and generates pressure waves. These pressure waves are periodically reflected back to trigger the stator wake shedding. These waves are strong enough to travel through the rotor passage, and eventually affect the flow at the rotor’s trailing edge. The stator wakes are chopped by the downstream rotor, and travel through the rotor passage. This significantly enhances the unsteadiness of the flow near the rotor trailing edge. Lastly, the deterministic stresses and enthalpy distributions extracted from the NLH method have revealed that the effects of the unsteadiness are relatively weaker in the axial direction. Furthermore, the deterministic correlations analysis has shown that, some empirical deterministic correlations models based on the decay concept of compressors are not suitable for turbines.
1. Introduction
The complex three-dimensional flows in high pressure turbines are mainly attributed to the inherent unsteadiness due to the relative motion between the stator and rotor blades. The understanding of these unsteady flows is essential to further reduce engine weight. Weight reducation can be achieved by using fewer turbine stages or fewer blades in a row. All these measures would lead to increased blade loading. A transonic high pressure turbine is a crucial component of a modern aero-engine. With fewer stages, transonic turbines operate at higher pressure ratios, which might result in an efficiency penalty compared to a similar subsonic turbine. To maintain the same level of efficiency, a thorough understanding of the unsteady flows is imperative. The complex interaction between shocks, wakes, tip leakage and secondary vortices, and their influence on turbine performance, require a detailed evaluation of these effects under operating conditions.
The importance of unsteady computations in the turbo machinery design process has been asserted by various researchers. Simplified models are being developed to meet the requirements of higher accuracy at manageable computational costs [1]. Various experimental and numerical analyses on transonic turbines have been conducted, with an emphasis on characterizing the shock patterns [2], the unsteady stator-rotor interaction [3,4], and the heat transfer [5]. The stator shock interacts with the adjacent blade and downstream rotor, forming an intricate system consisting of direct and reflected shocks [6]. The interaction processes promoted by stator wakes has been experimentally studied by Stieger and Hodson [7] and numerically studied by Cui et al. [8]. The stator wakes, chopped by the rotor leading edge, travel downstream independently along the fixed routine. Binder et al. [9] named this fixed routine as the wake avenues. Wei Zhao et al. [10] improved the baseline design of the suction side of the turbine blade to reduce the trailing edge shock loss. They claimed a considerable reduction in the total pressure loss coefficient by improving the suction surface profile. A deep simulation model developed by Urbikain et al. [11] has provided a bridge between scientific research and real world manufacturing challenges. This model provides a decision making strategy using some main variables of the system and processes as input. Artetxe et al. [12] have developed a cutting force prediction model by introducing the radial engagement reduction to optimize the manufacturing process involved in the integral blade rotors. This model has established a significant level of accuracy to predict shape errors. Shock–wake interactions in a vaneless counter rotating turbine have been investigated by Wang Huishe et al. [13], where a fishtail shock system appears at the rotor trailing edge, creating a pressure wave system. This wave system interacts with the rotor wakes, which increases the loss. E. Göttlich et al. [14] investigated the vortex shedding and the wake–wake interaction with advanced optical measurement techniques in the transonic turbine stage, where the complex shock–wake interaction and the phase locking of the vortex shedding was reported. Furthermore, P. Pieringer et al. [15] numerically investigated the same turbine with Spalart Allmaras (SA) turbulence model and reported the phase locking of the vortex shedding with the blade passing frequency.
The conventional low-cost steady method still have limitations in handling highly unsteady flows, especially for the mixing and separated flow. On the other hand, the increasingly popular high-fidelity methods, such as Delayed Detached Eddy Simulation (DDES), Direct Numerical Simulation (DNS) and Large Eddy Simulation (LES), can predict the highly unsteady flow with a high level of confidence. Dun Lin et al. [16] used DDES and captured the detailed flow structures in a high-pressure turbine vane. Cui et al. [17] used LES to study the interaction of the secondary flow and the wake in a low-pressure turbine. However, these high-fidelity methods are computationally too expensive to make a high impact on the industrial design in the near future.
The nonlinear harmonic (NLH) method, developed by Vilmin et al. [18], has proved to be very efficient for periodic flow simulations. The unsteady flow perturbations are stored about a time averaged value and, then Fourier decomposed in time. Transforming the unsteady Navier-Stokes system into the frequency domain, the transport equations are obtained for each time frequency. The accuracy of the unsteady solution is determined by the order of the Fourier series [19]. The NLH method has been proved to be a very efficient method for the rotor–stator (R/S) interface treatment in capturing unsteady effects in multistage turbomachinery [20]. The study [21] of impeller–diffuser interactions in a transonic centrifugal compressor stage, using the NLH method with a third order Fourier decomposition, showed significant computational cost reduction. The results also compared favorably to the unsteady method. The same method was also successfully applied to a counter rotating compressor [22]. The NLH flow simulation of a high-head Francis turbine test case for various orders of harmonics has shown high level of agreement in comparison with the experimental data [23]. The model has been used to predict the impeller–diffuser interactions in a centrifugal compressor. The deterministic correlations provided sufficient information about the flow unsteadiness.
The previous studies mainly focus on the validation of the NLH method on various types of compressors while only a few test cases are reported for the turbines [20,23]. Some preliminary work has been done on the Aachen 1.5 stage axial turbine to study clocking effects using the NLH method [20]. However, detailed investigations for the transonic high pressure turbines have been seldom conducted with the NLH method. The NLH method employs deterministic correlations to reproduce the unsteadiness due to the rotor–stator interactions. Modeling deterministic correlations is the key to close the average-passage equation system which could provide a rigorous mathematical framework for accounting for the unsteady blade row interaction in steady state calculation by introducing deterministic correlations. Liu et al. [24,25] studied the deterministic stress and enthalpy correlations in compressors, which could be valuable for modeling deterministic correlations. However, few studies focused on deterministic correlations in turbines. The deterministic analysis is important to evaluate the relative importance of various deterministic components particularly related to the unsteady blade row interactions. The deterministic components of particular interest can be used in the model development of the deterministic based codes for the transonic turbines.
The current study focuses on the unsteady flow interactions in a transonic high-pressure turbine stage using the unsteady time-accurate and the NLH methods. A widely used two-equation shear-stress transport (SST) model has been used for the detailed analysis in all the cases. The results from the NLH are compared with the steady and unsteady RANS. Then the unsteady interactions are analyzed in detail based on the unsteady RANS and the NLH. Lastly, the deterministic stresses and enthalpy distributions extracted from the NLH method are investigated in both the rotor and stator passages. The results can help designers to understand the physics of unsteady losses and their origins, and model deterministic correlations.
2. Nonlinear Harmonic Method
The NLH method is built around the idea that the instantaneous flow in a blade row is decomposed into a time-averaged part and a sum of periodic unsteady perturbations that are Fourier decomposed into N harmonics [18]:
where is the time-averaged part and is the unsteady part due to unsteady disturbances. In the current study, the unsteady disturbances are generated by the passing blades. The periodic perturbation term () is transformed into the frequency domain by the Fourier transform. The solution accuracy is ensured by the number of considered harmonics and the number of perturbations used in the decomposition [26].
The time-mean flow equation is obtained from time-averaging the unsteady equations. The conservative form of the time-mean flow equations are formulated from the finite-volume method as:
Here, represents the cell number of volume . and are discretized convective and viscous fluxes, respectively. , is the source term containing the Coriolis and centrifugal terms.
The complex amplitudes are made pseudo time dependent by casting the first order linearized equations into the frequency domain. The conservative form of these amplitudes is formulated in the finite-volume method as:
Like Reynolds averaging, the NLH method includes additional stresses, with the form of time-averaged products of fluctuations. These terms are called deterministic stresses. The deterministic stresses represent the unsteadiness in the flow field and these stresses are directly computed from the harmonic values to achieve the closure of the system. The NLH method works in the frequency domain. That allows the calculation of only one blade passage per row. If the physical phenomenon includes only a few harmonics, the NLH method can be significantly cheaper than the conventional unsteady methods [27].
3. Test Case
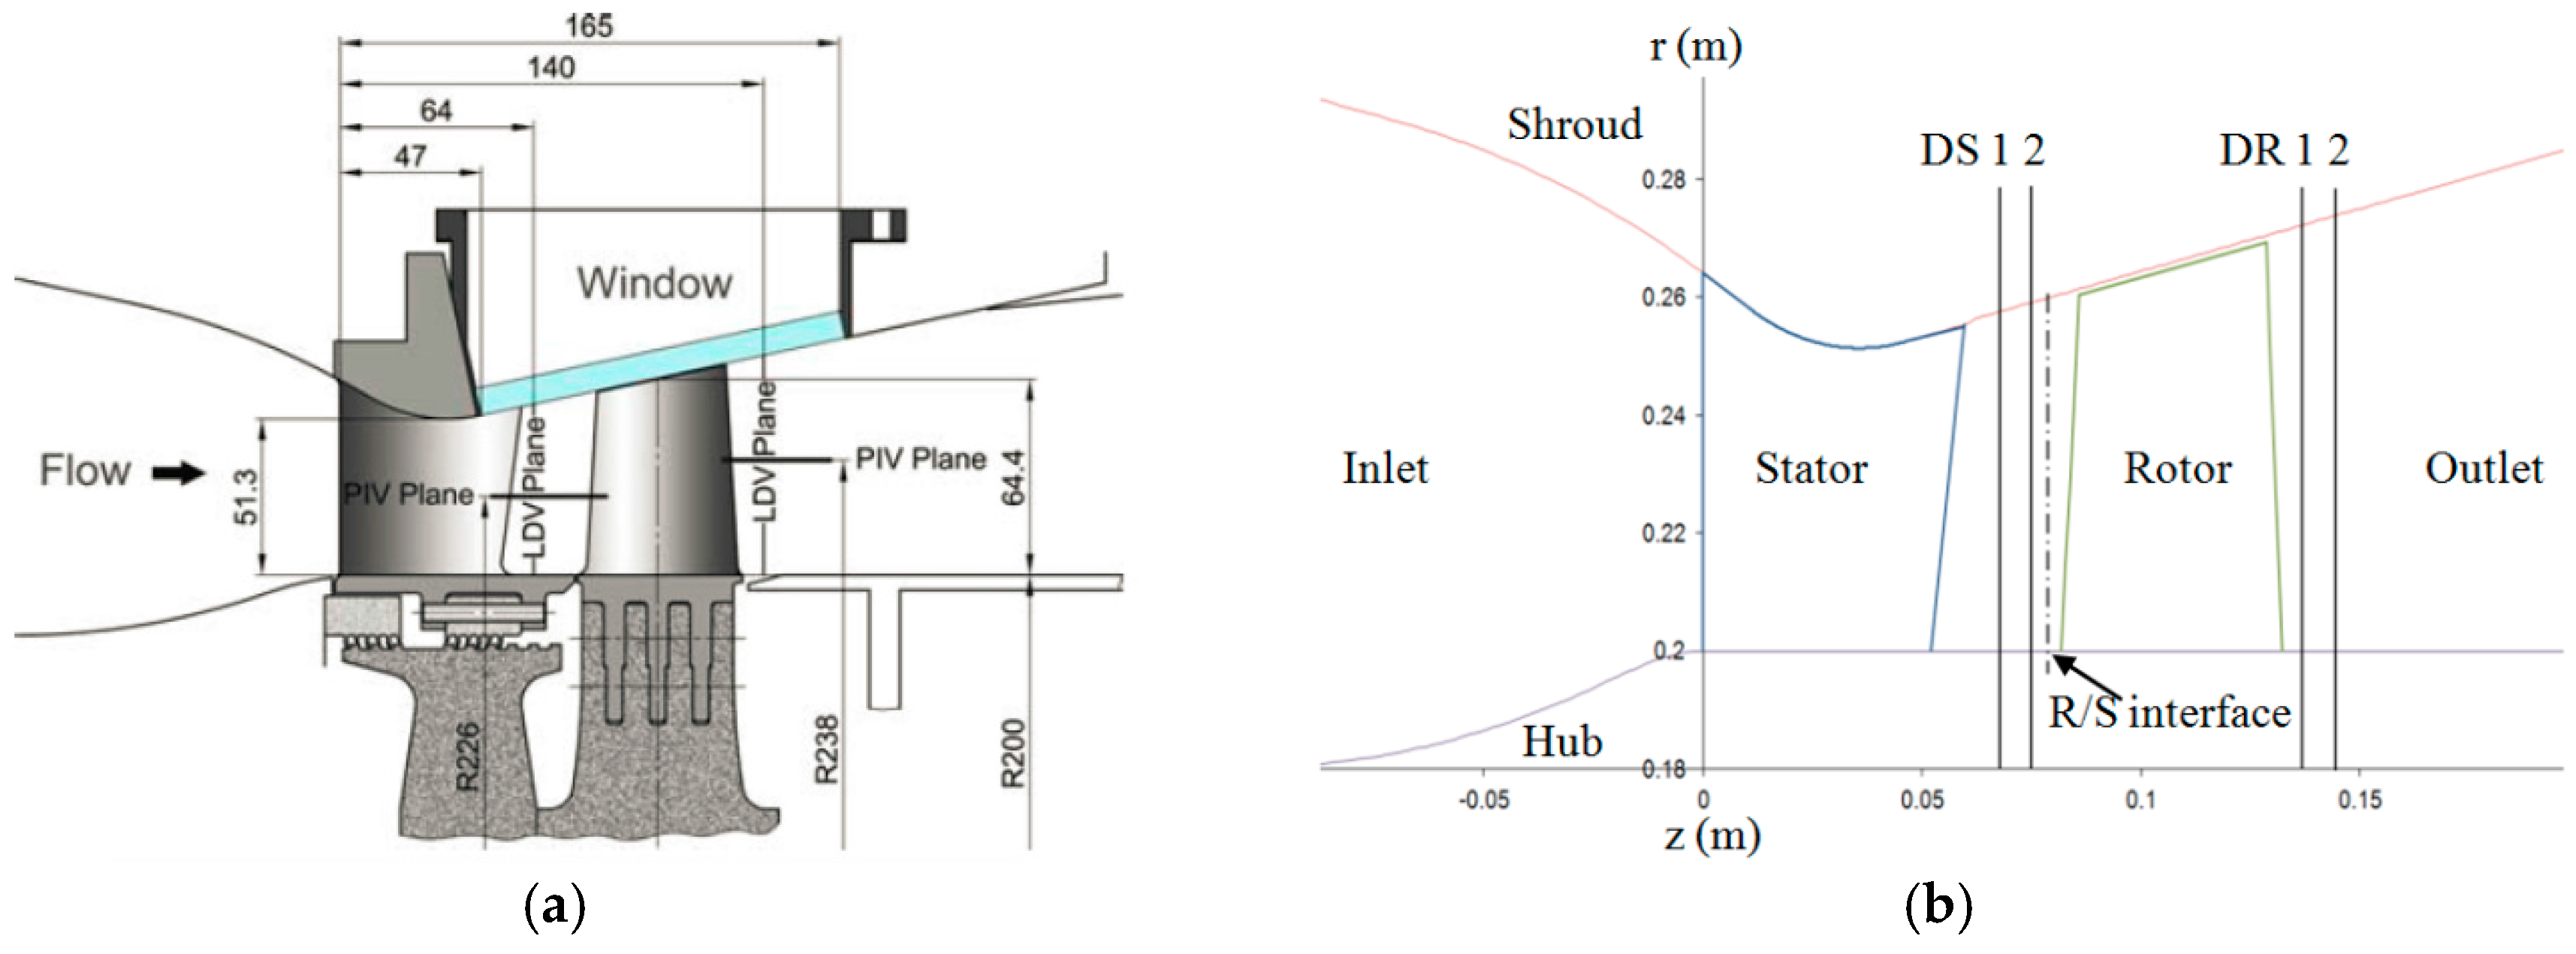
The meridional section of the transonic turbine stage is shown in Figure 1a. The convergent-divergent vane accelerates the flow to supersonic speed. The hub line is cylindrical while the shroud line is conical in the rotor section. The minimum area of the flow path is near the trailing edge of the stator. The number of stator vanes and rotor blades are 24 and 36, respectively. The rotation speed is 10,600 revolutions per minute (RPM) and the pressure ratio is 3.5. The Reynolds number at stage inlet is about 5.25 × 10⁶ based on the stator chord. The geometric turning angle for the stator vane is 70° and for the rotor blade 107°. The absolute Mach number at stator vane inlet is about 0.14 and at rotor inlet is about 1.12. The rotor tip clearance is 1 mm. More details could be found in [14]. As shown in Figure 1b, two planes are selected downstream of the stator and are named DS1 and DS2 for analysis of results. Similarly two planes are selected downstream of the rotor, named DR1 and DR2.
4. Numerical Method
The NUMECA Fine/Turbo CFD flow solver (version 10.2, NUMECA International, Brussels, Belgium) is used in the current study. It is a three-dimensional multi-block flow solver using the steady, unsteady and harmonic methods. This solver has wide applications in turbomachinery simulation and design. The flow solver is employed with the Navier–Stokes code using finite volume method. The second order central scheme with a second and fourth order artificial dissipation is used for spatial discretization. For temporal discretization, a fourth order Runge–Kutta scheme is employed. The local time-stepping approach and implicit residual smoothing are used to boost the convergence time.
For the NLH method, the number of frequencies per perturbation is set to 3, and the maximum number of perturbations per blade row is set to 1. Since the harmonic method uses a limited number of harmonics, thus continuity cannot be rigorously satisfied, but it is observed that the continuity increases with more harmonics considered in the calculation.
For the unsteady time-accurate simulation, the computational domain consists of two stator vane passages and three rotor blade passages. This avoids the introduction of an error due to the geometry scaling. The dual time stepping approach proposed by Jameson is used [28]. The numbers of physical time steps are set to 120 for each cycle after careful monitoring of the convergence of some important parameters (mass flow, efficiency and pressure ratio). In order to ensure convergence, the difference between the inlet and outlet mass flow rate was ensured to be <0.1% in all simulations. The time step for the unsteady method is about 3.93 × 10⁻⁶ s and the same time step has been used to construct the computed harmonics in the time domain for the NLH method. This makes it possible to compare the instantaneous data between the two methods at the same time steps. The time step size independence study was initially performed, based on that study, the above mentioned time step size was selected which provides a 0.25° angular resolution between each time step. This angular resolution is fine enough to capture the unsteady flow effects.
The selection of an appropriate turbulence model is critical to accurately predict the flow in turbomachinery. There is no single universal turbulence model available for all engineering applications, and the existing turbulence models do not produce results with acceptable accuracy in turbomachinery applications [29]. The SST model was the most appropriate for the current problem since it effectively handles the separations and adverse pressure gradients. The SST model modifies the turbulence viscosity function to improve the prediction of separated flows and to avoid overestimating Reynolds stresses with the k-ω and k-ε models in adverse pressure gradients. This modification is done based on the Townsend–Lighthill design for the specification of turbulent eddy viscosity [19]. Additionally, the multigrid method was used to accelerate the convergence. The computational time required by the NLH method is about five times longer than that of the steady-state method and around seven times shorter than that of the unsteady method in the present investigation.
5. Numerical Grid
In the current investigations, the computational grid is generated using the IGG-AutoGrid5, which is a fully automated grid generation tool. Since the grid resolution in radial and circumferential directions has a significant impact on the result, the fully structured multi-block strategy is employed to ensure the optimal grid.
For each blade passage, an O4H-type grid is generated and a butterfly topology, which consists of two blocks with an inner H block and an external O block, is used for the grid in the rotor tip gap. The number of grid points in the circumferential direction must follow the guideline for the NLH method. At least 30 cells must be placed in the circumferential direction for the first harmonic and no less than 15 cells for the other harmonics [19]. The circumferential cell number is also determined by the number of blades on the each side of the rotor–stator interface. The recommended grid resolution in the circumferential direction is given by following equations [19]:
where, is the number of harmonics, is the number of stator blades and is the number of rotor blades. A grid independence study has been conducted with grid sizes of about 1.8, 2.9 and 3.8 million for a single flow channel and finally a 2.9 million grid size is selected that also satisfies the above mentioned grid requirements for the NLH method.
The same grid distribution has been subsequently used for the steady and time-domain unsteady simulation to ensure the grid consistency. The domain scaling method for the R/S interface proposed by Rai [19] has been implemented for unsteady calculations. For this method, the pitch distance must be identical across the R/S interface. The main advantage of having the same pitch distance across the R/S interface is that it avoids the need to consider any time periodicity in the boundary condition treatment. There are 24 stator vanes and 36 rotor blades in the stage. The computational domain consists of two stator vanes and three rotor blades for unsteady time-accurate simulation.
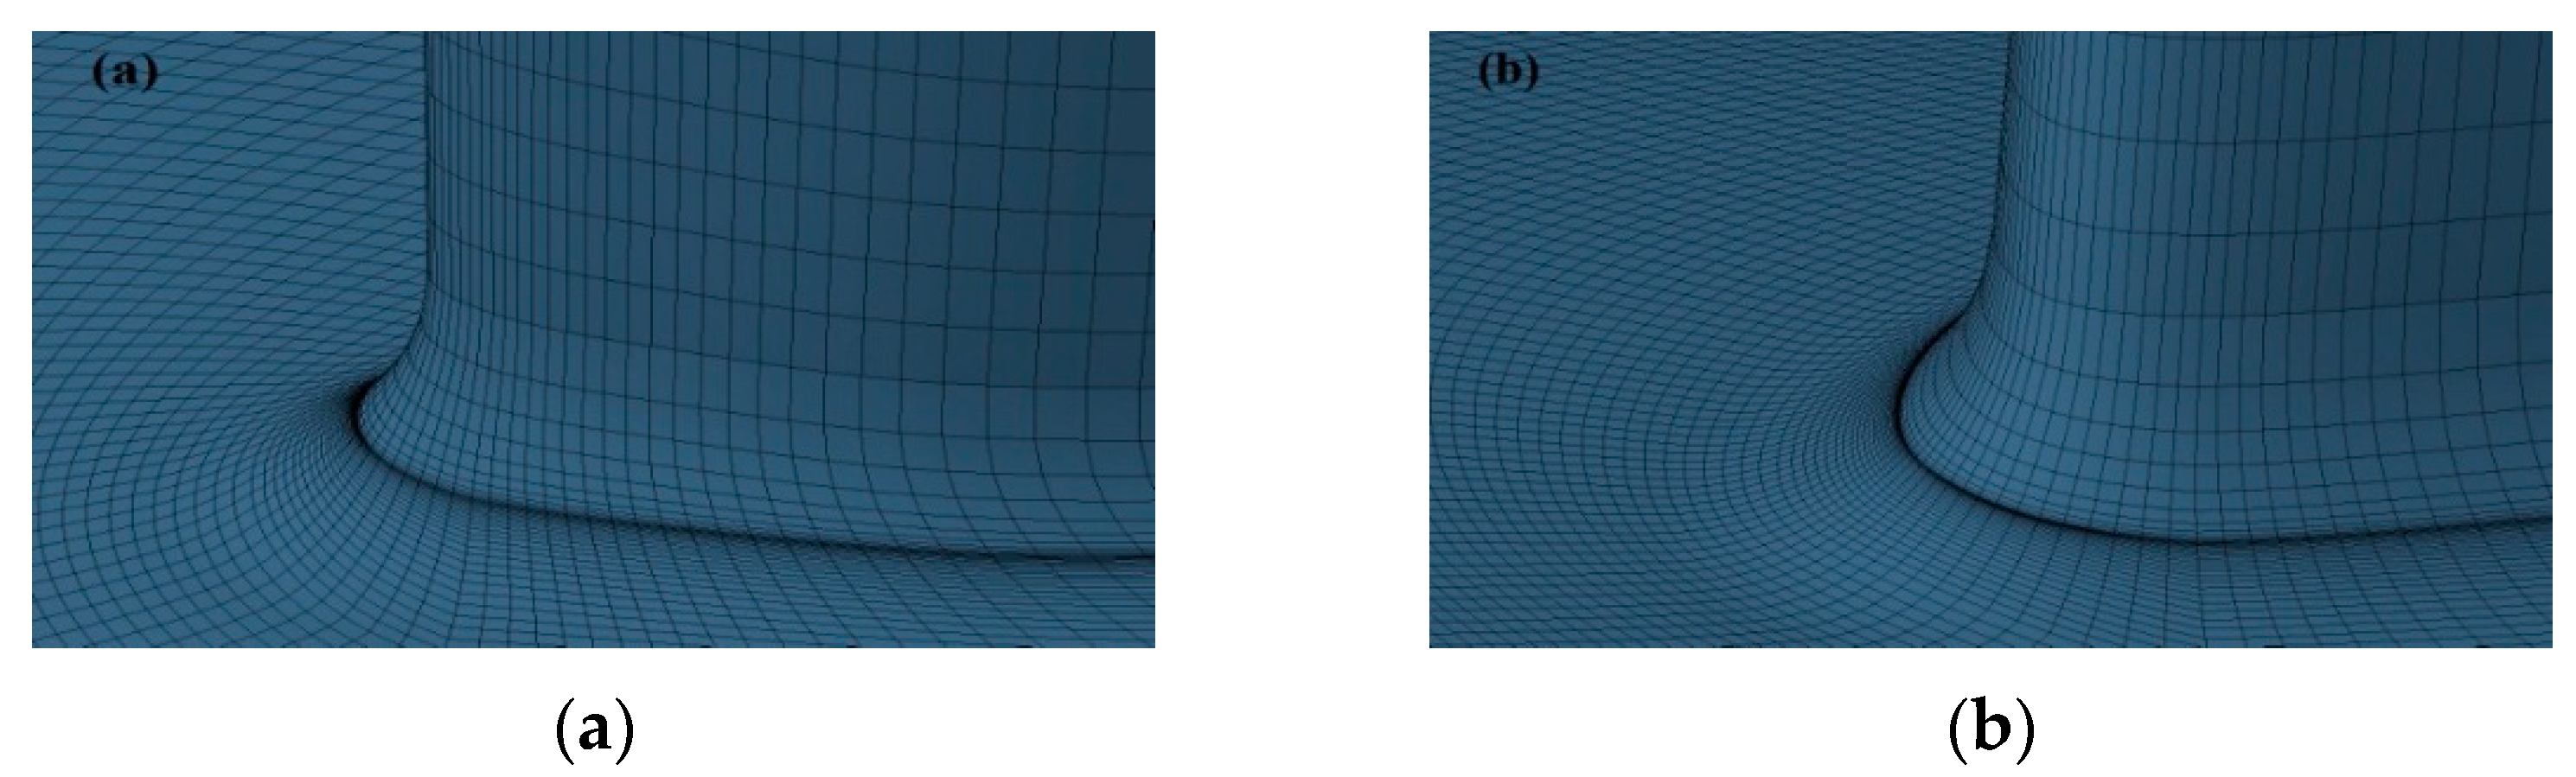
To resolve the boundary layer on the blade and over the endwall, the y+ of the first cell away from the wall is less than 3. For most grid cells, the skewness angle is larger than 36 degrees; the aspect ratio and expansion ratio are less than 1000 and 1.8 respectively. The grid distributions near the leading edge of both the stator and the rotor are shown in Figure 2.
6. Boundary Conditions
The absolute total pressure (3.5 bar) and total temperature (403 K) on the inlet boundary are specified. An average static pressure is imposed at the outlet boundary. The other dependent variables on the outlet are obtained from the interior field through extrapolation. The R/S interface in the current case is very close to the blades therefore, non-physical reflections of pressure waves, especially due to the shock, can occur at the interface. To handle this issue, a two dimensional non-reflecting boundary condition based on a characteristic analysis of the linearized Euler equations was applied at the R/S interface for the steady and NLH calculations [6]. The result of the steady calculation is used as the initial solution for both the unsteady and the NLH simulations.
7. Validation of Numerical Method
The Aachen 1.5 stage axial turbine test case provided by the RWTH Aachen University was employed for the validation of the numerical schemes used in the current study. The Aachen 1.5 stage axial turbine was tested at the Institute of Jet Propulsion and Turbomachinery. For validation, only the first stage was considered that is a subsonic axial turbine with untwisted blades. The first stage has 36 stator and 41 rotor blades. The turbine was operated at 3500 RPM. The turbine inlet temperature was kept at 308 K during experiments. The stator inlet Reynolds number was 6.8 × 10⁵ and the inlet flow velocity was 45 m/s. The rotor tip clearance was 0.4 mm for this particular case. The detailed experimental procedure and data can be found in references [30,31,32].
The SST turbulence model has been employed for the validation case. The steady simulation was initially performed with the mixing plane approach. The steady results were subsequently used for the initialization of the unsteady RANS and NLH simulations. The original blade count ratio is 36:41; however to reduce the computational cost of the unsteady simulation, the blade count ratio of 6:7 has been used. The blade scaling factor of 0.976 was used for the rotor to offer the same blockage. The accuracy of unsteady simulation can be further increased by considering the full stage simulation but at the expense of much higher computational cost. The NLH method works in the frequency domain, therefore a single blade passage is required for the simulation. Three harmonics have been considered and the maximum number of perturbations has been set to 1 for the NLH simulation.
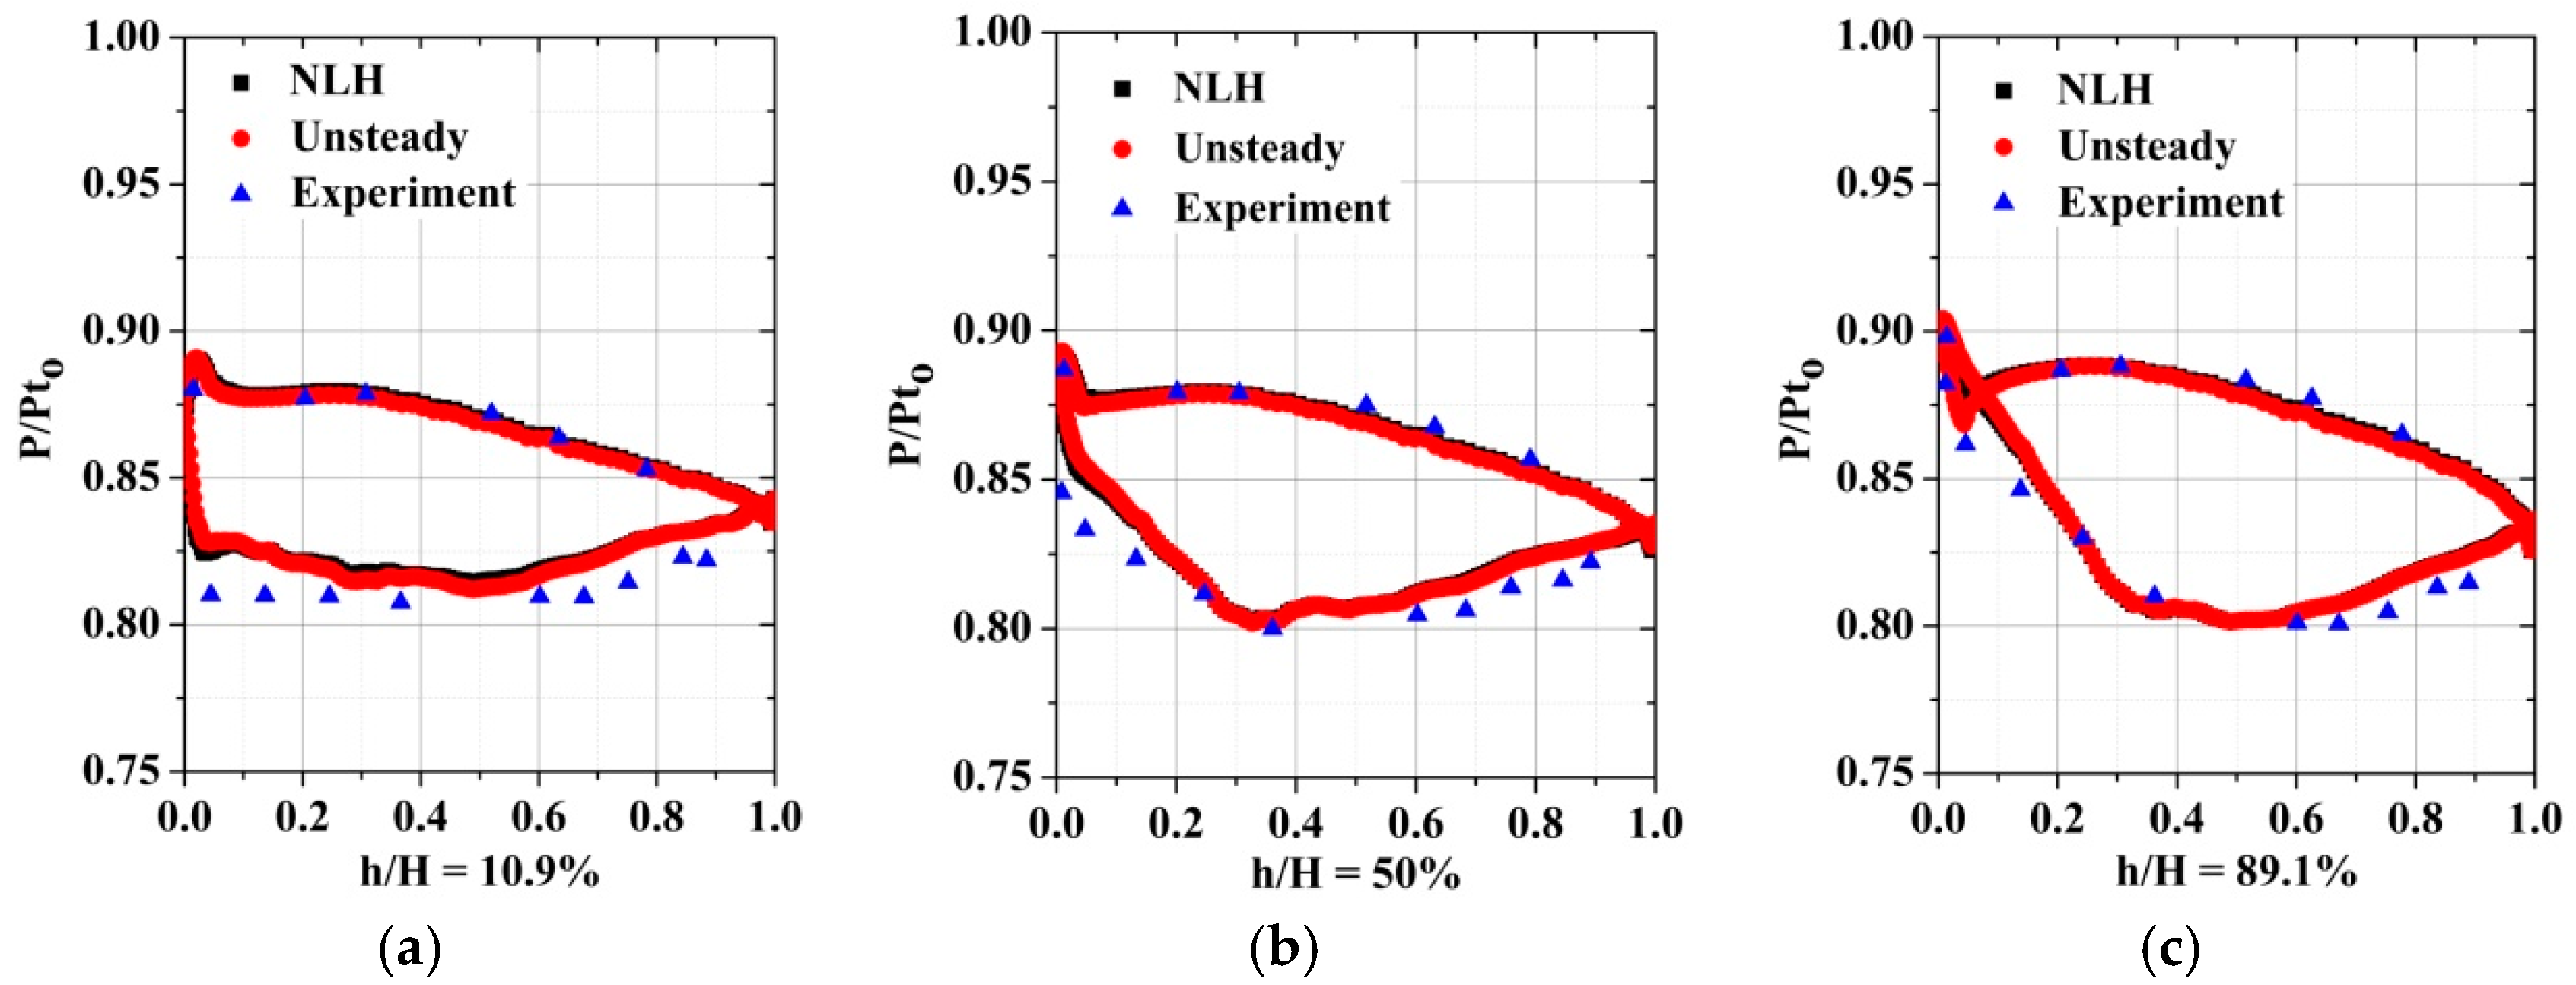
The rotor surface pressure distribution is presented in Figure 3. The time-averaged results from the unsteady RANS and NLH method are presented in comparison with the experimental data. The unsteady RANS and NLH results are in good agreement with the experimental data. The difference in predicted results on the rotor pressure side negligible, however the difference in results on the rotor pressure side is within 2.5%. The above test case shows that the NLH method has predicted the promising results in comparison with unsteady RANS and the experimental data. The NLH method has an added advantage over the unsteady RANS of considerably reduced computational cost.
8. Results and Discussions
8.1. Overall Comparison of Numerical Schemes
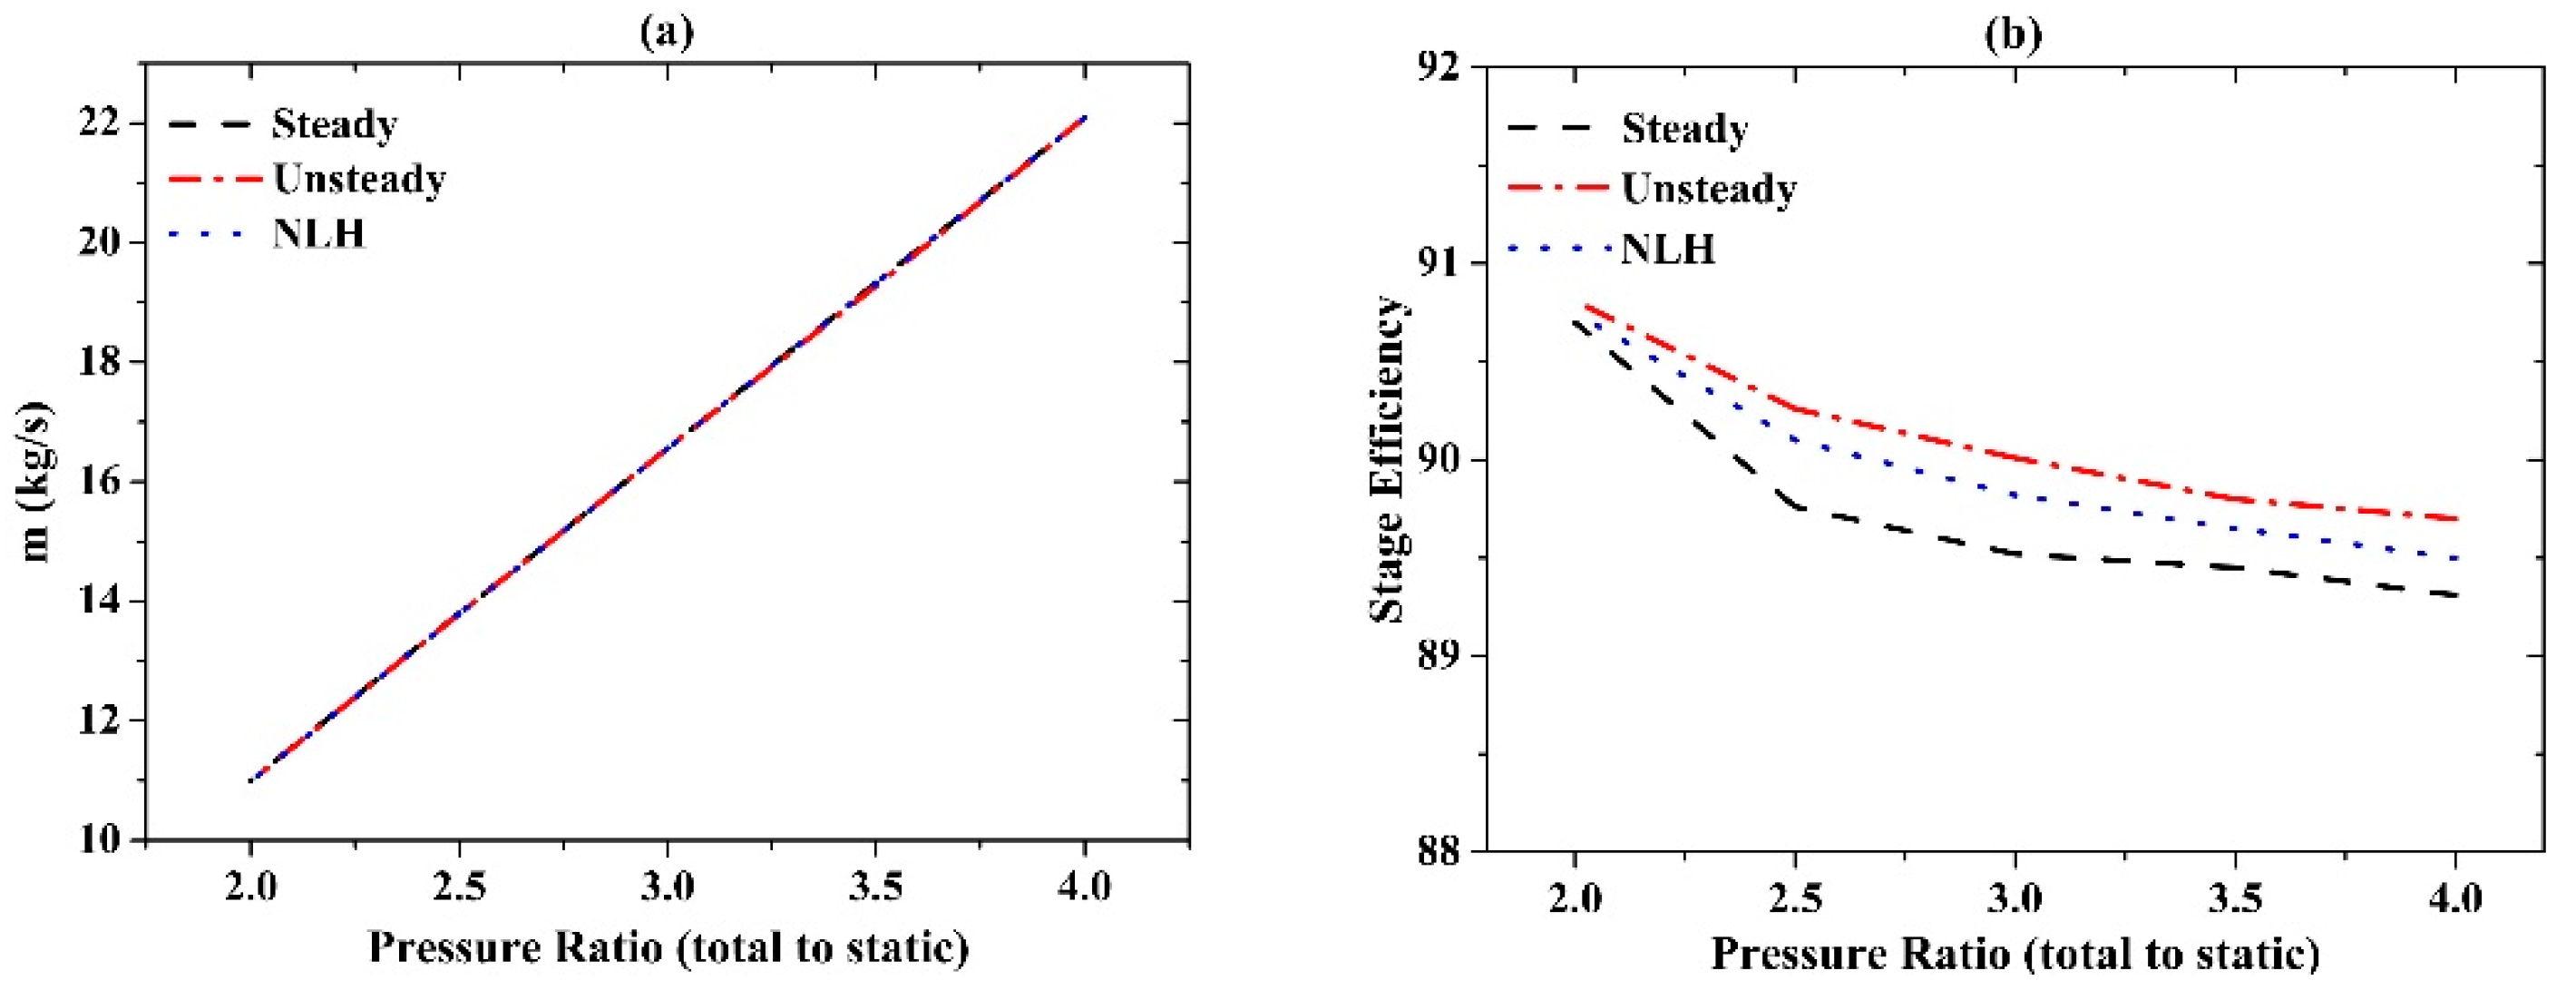
Figure 4 presents the performance of the turbine stage predicted by the steady, unsteady and NLH simulations at various pressure ratios at about 96% of the designed RPM. No considerable difference can be seen in terms of mass flow rate predicted by the three methods. However, the stage efficiency predicted by the NLH method is closer to the unsteady method than the steady method. The same turbulence model and computational domain are used in all methods. The discrepancy is mainly attributed to the unsteady R/S interactions, that are effectively captured by the unsteady and NLH method. The unsteady RANS being the highly accurate method with a much higher computational cost, however the NLH method has predicted the more promising results in comparison with unsteady RANS at a much reduced cost.
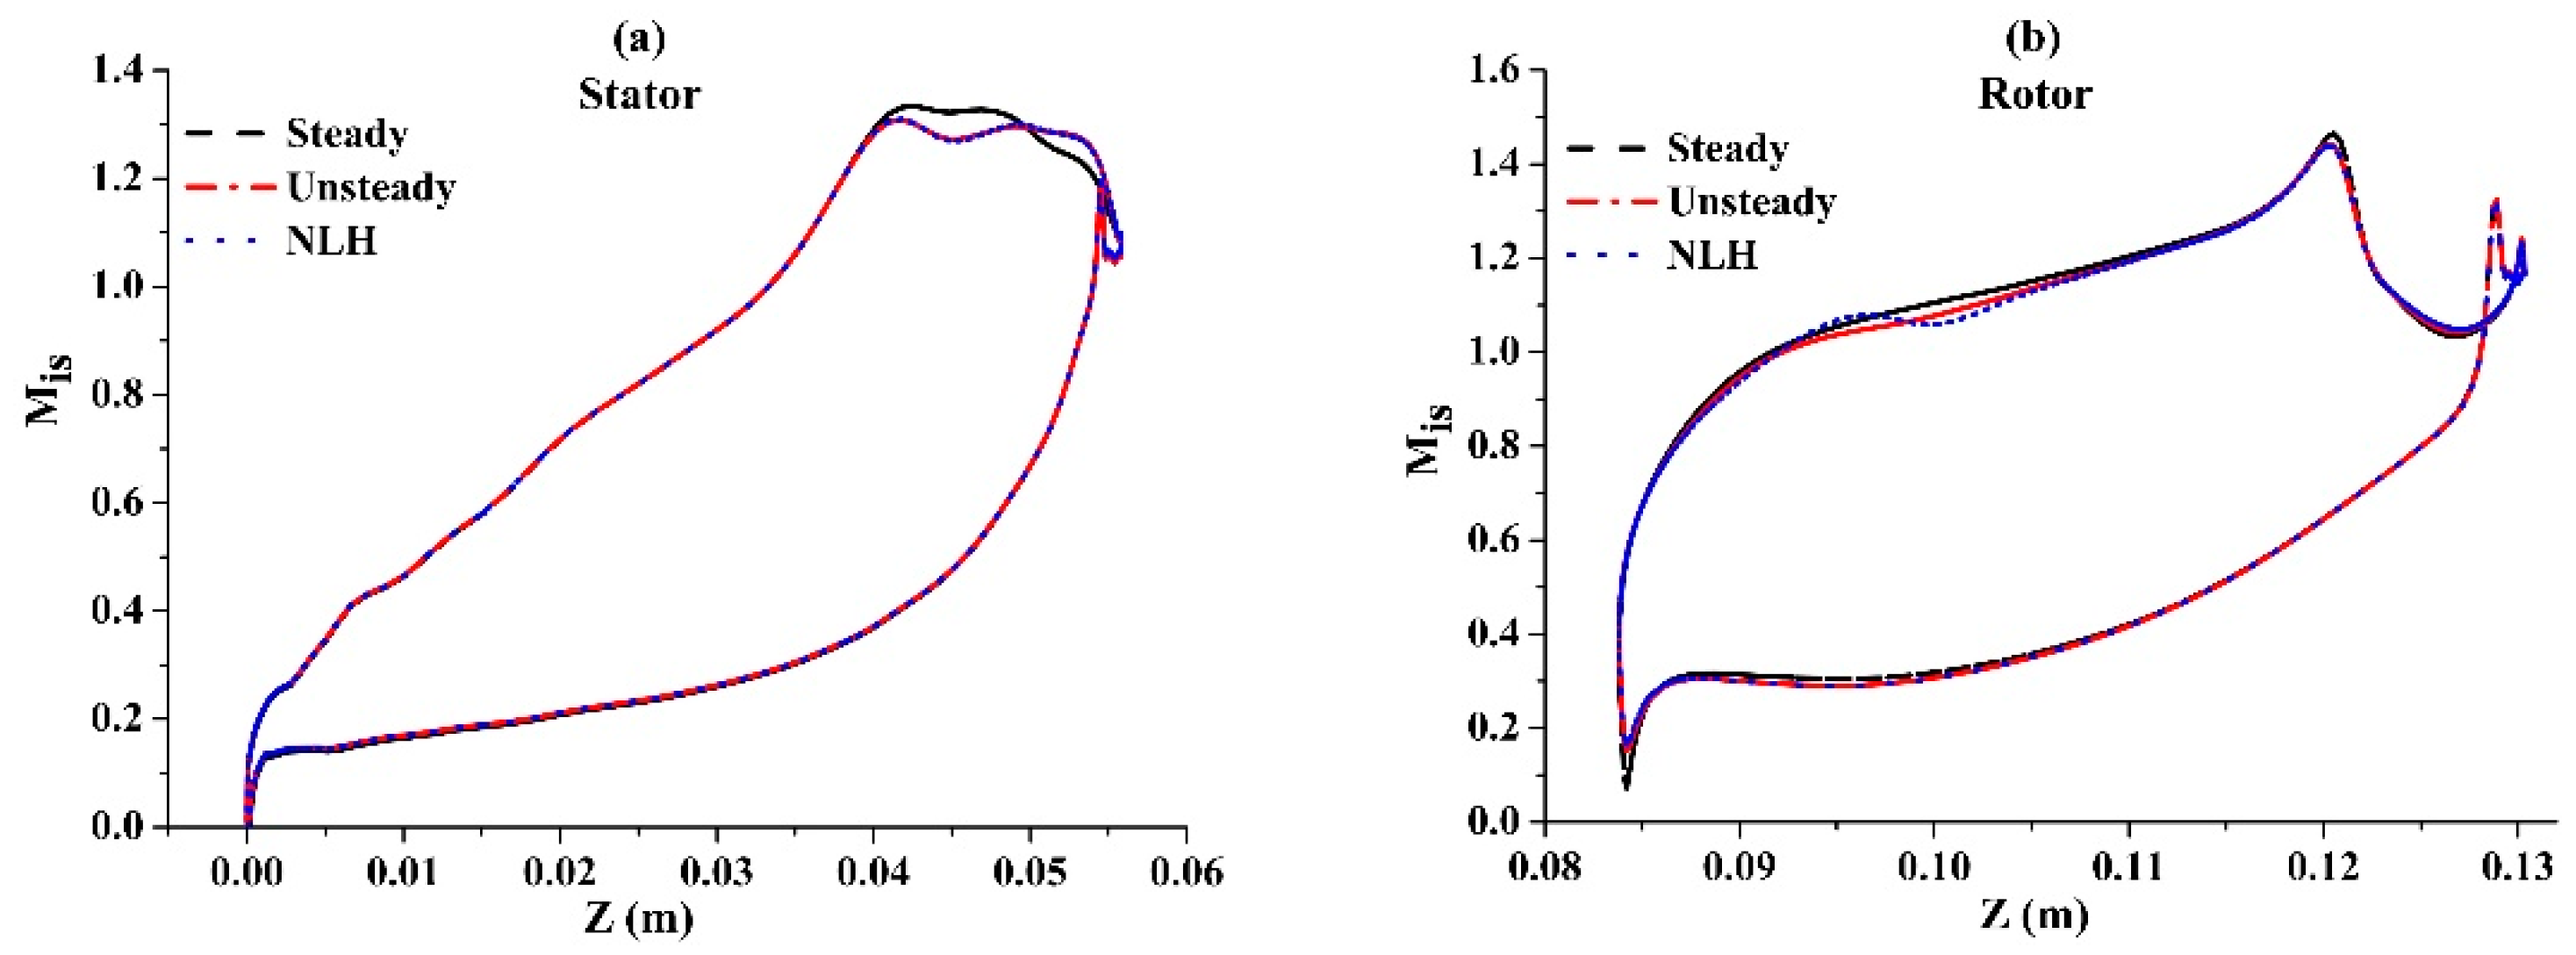
The isentropic Mach number distribution at the midspan is shown in Figure 5. Generally, the results between the unsteady time-averaged and the NLH method are in good agreement. On the stator blade, no considerable difference between the unsteady time-averaged result and the NLH method can be seen in Mach number distribution. The steady calculation predicts the results on the front-portion of the blade surface correctly, but it deviates at the rear part of the stator blade on the suction side, where the shock wave and unsteady stator-rotor interaction occur. For the rotor blade, some differences on the suction surface in the shock region can be observed in the steady calculation. Again, the discrepancy seen here is mainly attributed to the unsteady R/S interactions. Therefore, a detailed study of the unsteady R/S interactions is necessary to predict the performance accurately.
8.2. Stator Flow Field
The flow field in the stator passage will be discussed in detail in this section. The entropy and the Mach number distribution downstream of the stator at DS2 plane is shown in Figure 6. The stator wake can be clearly identified in the region with high entropy as indicated by the dashed oval. The stator suction side shock moving downstream is obvious in the Mach number distribution near the trailing edge as indicated by the dashed line.
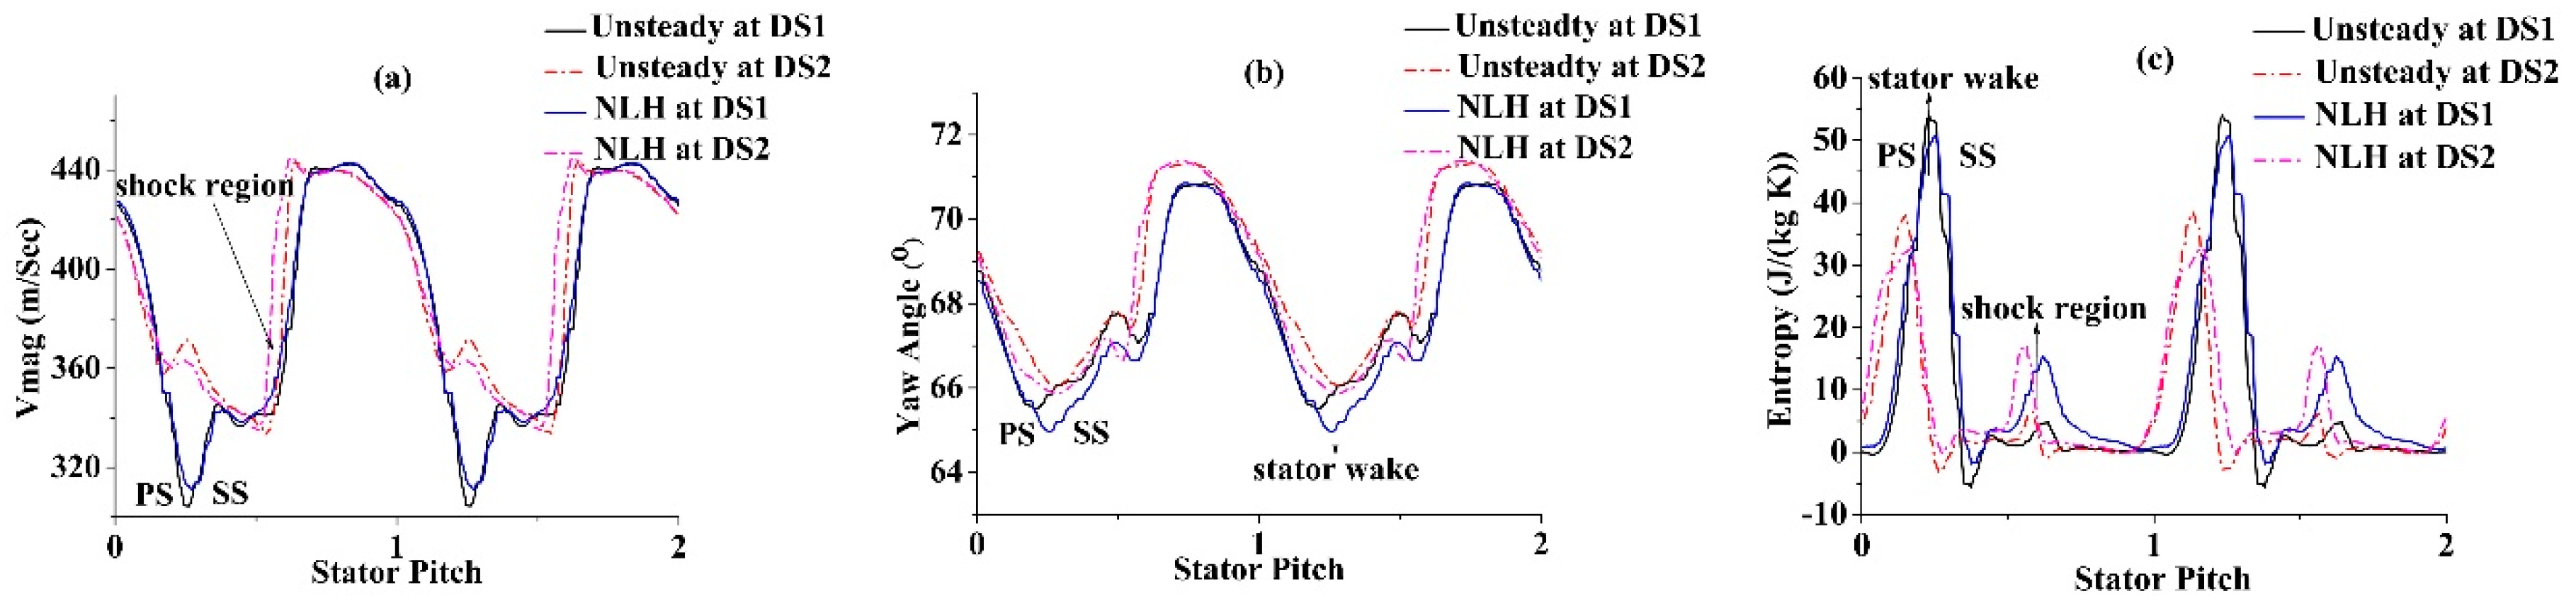
Figure 7 presents the time-averaged velocity, yaw angle and entropy downstream of the stator at two locations (DS1 & DS2) over two stator pitches. Some differences in the stator wake region for the velocity magnitude, yaw angle and entropy are observed between the two methods. There is a significant decrease in velocity at DS1 near stator TE, where the stator wake has a strong influence on the flow field. The yaw angle (), is being calculated from the meridional () and tangential velocity (), and sudden increase in yaw angle is observed across the shock. Entropy distribution shows that the NLH method predicts relatively higher entropy in the shock region for both DS1 and DS2 planes.
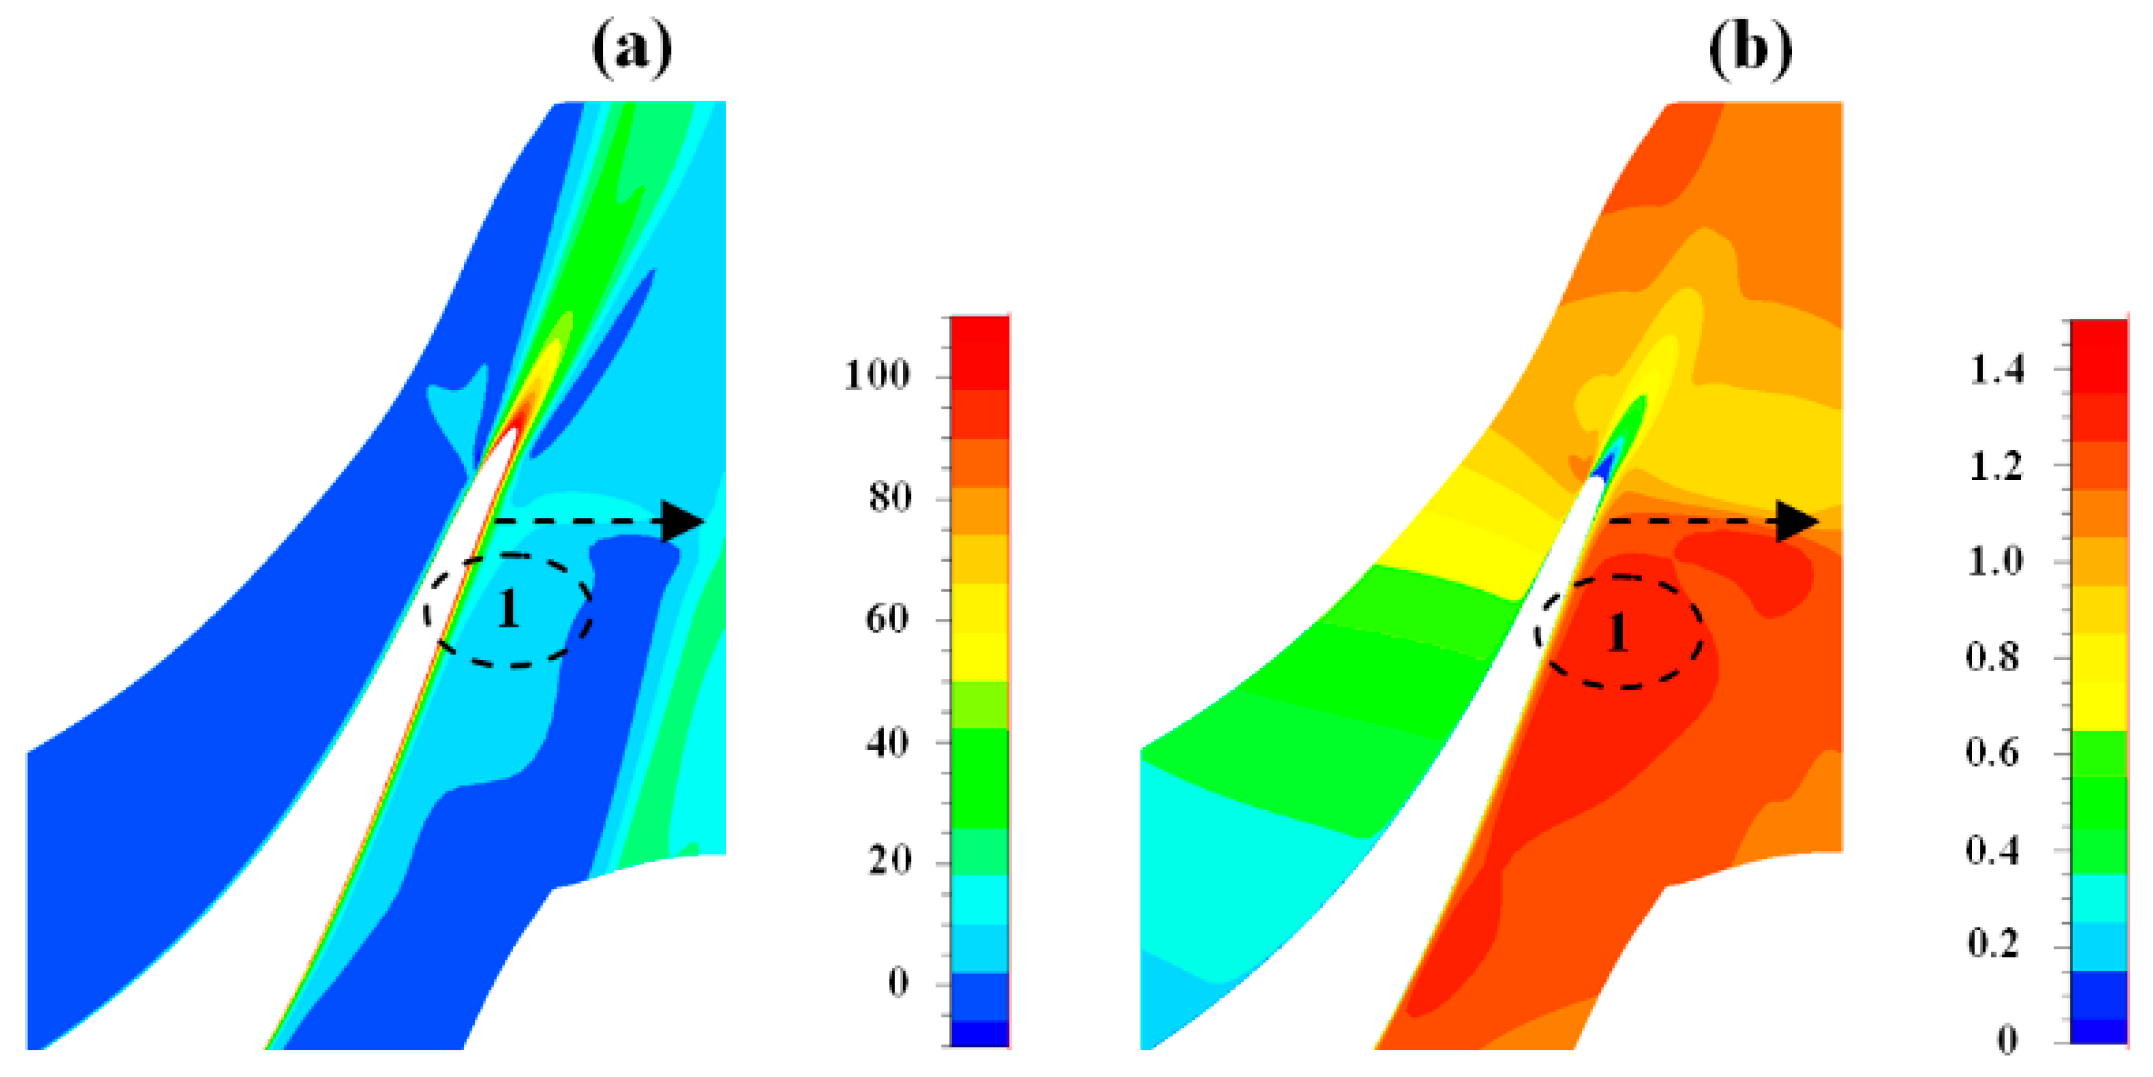
Figure 8 shows the entropy and Mach number distribution at the midspan. The high loss region on the suction side can be seen where the Mach number approaches to the maximum value. The region of maximum Mach number is located at about 1/3 of the stator axial chord where the flow channel has minimum height. The convergent-divergent flow channel, as shown in Figure 1, accelerates the flow to the maximum Mach at position 1. The shock location can also be identified on the suction side near the trailing edge (dotted arrow).
8.3. Rotor Flow Field
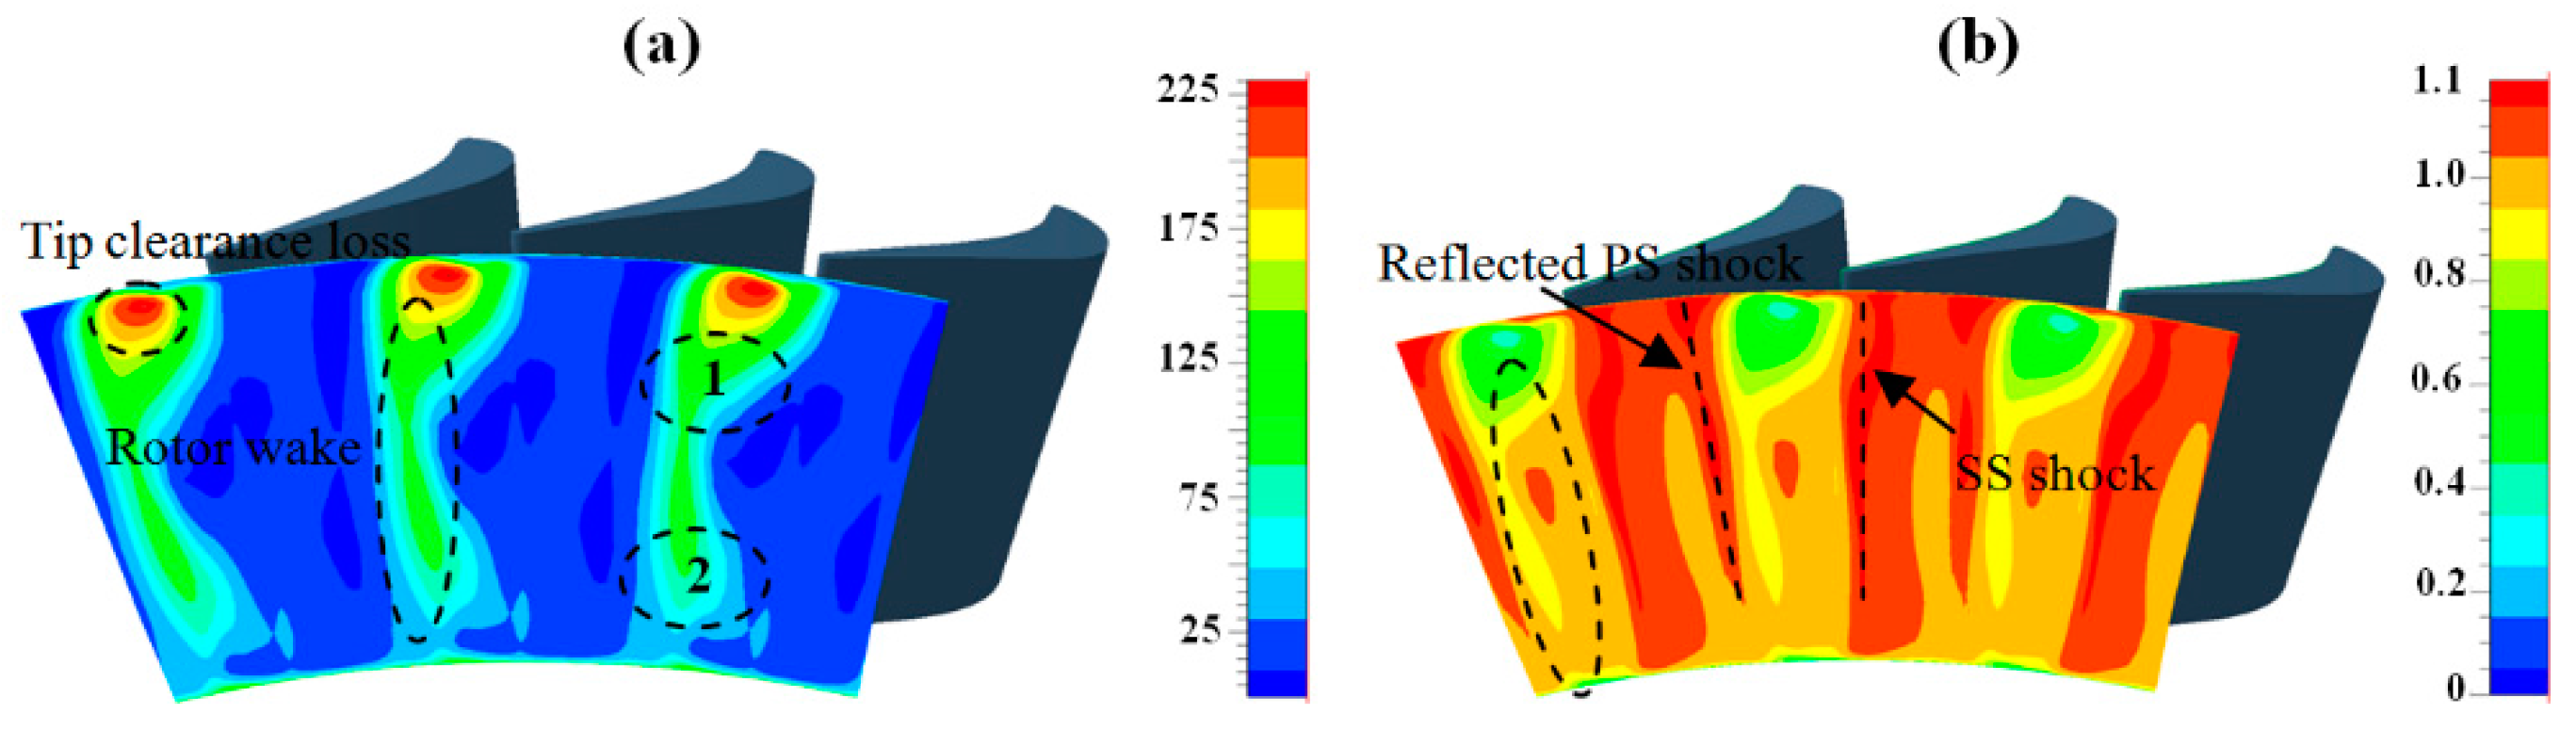
Figure 9 shows the entropy downstream of the rotor at the DR2 plane. The high loss region is located near the shroud, where the flow is highly influenced by the rotor tip clearance. The rotor wake can be identified by the higher entropy region, as indicated by the dashed oval in the figure. The upper passage vortex region, combined with the tip leakage vortex accommodates more loss (indicated by 1). The lower passage vortex (indicated by 2) is much smaller than the upper passage vortex. However, it still widens the wake area near the hub. The rotor suction side shock and reflected pressure side shock can be identified in the Mach number distribution.
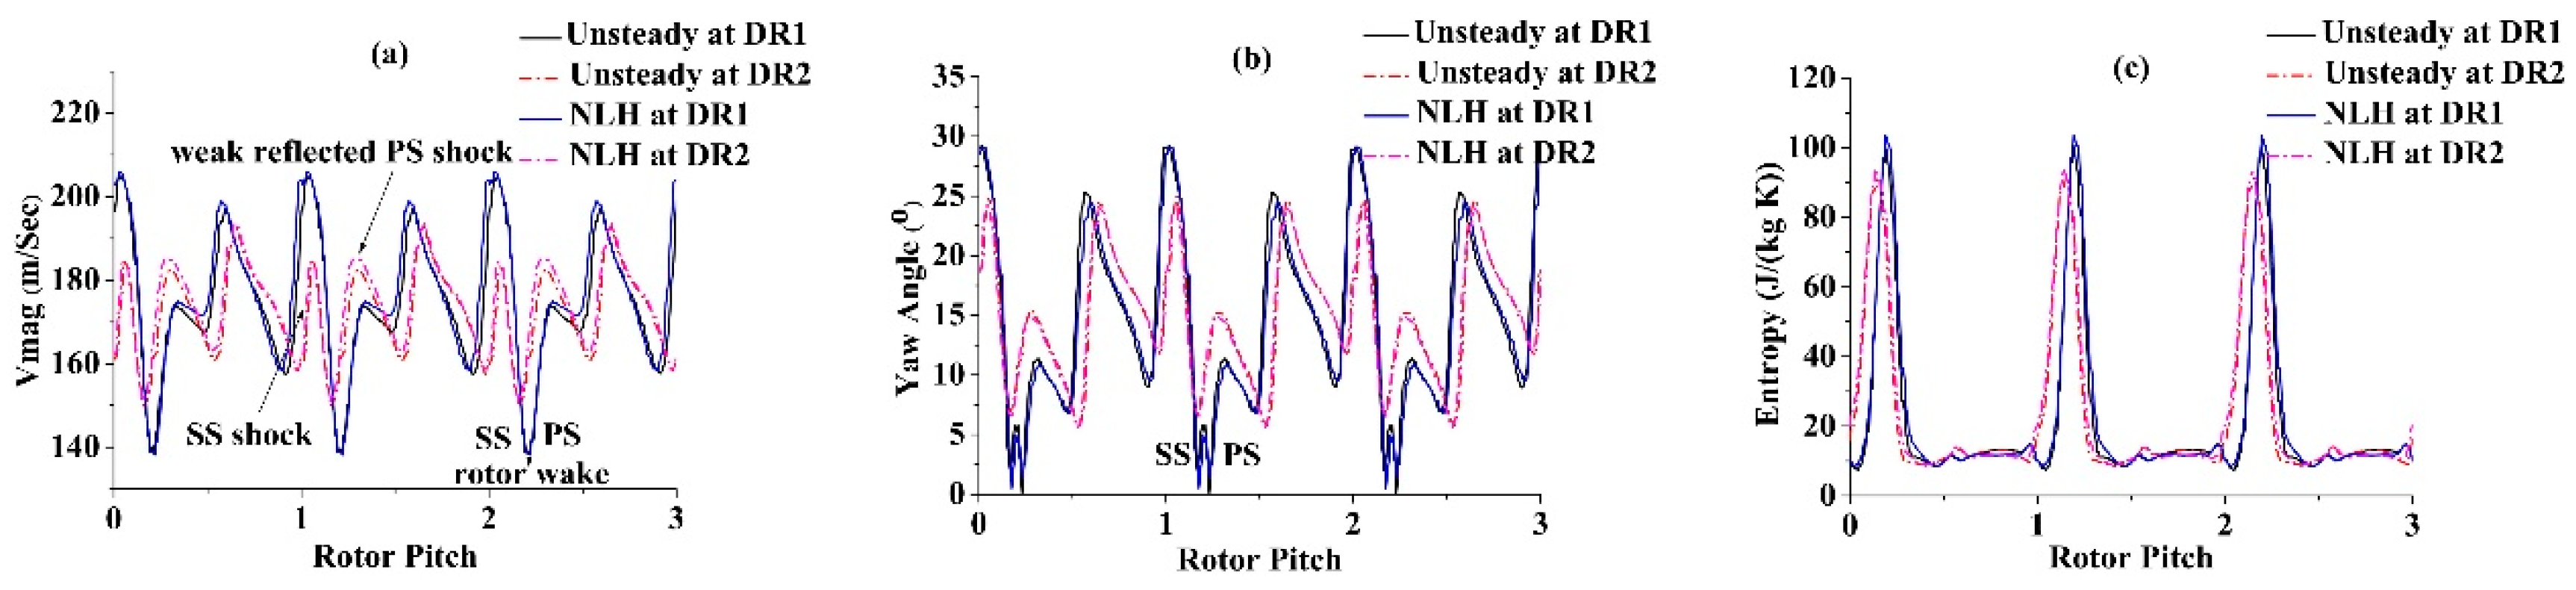
The rotor flow field is strongly influenced by the stator wakes. In the time-resolved velocity flow field, strong variations of the velocity magnitude can be found at the rotor exit. The evolution of these variations is strongly influenced by the highly turbulent stator exit flow. Figure 10 presents the time averaged velocity, yaw angle and entropy at two locations downstream of the rotor (DR1 & DR2) over three blade pitches. The suction side shock and reflected pressure side shock can be seen in the velocity distribution in Figure 10a. No obvious difference can be seen in the results predicted by the unsteady and NLH methods downstream of rotor.
Figure 11 shows the mean flow in the rotor passage. The high entropy region in the passage (indicated by 1) appears to be due to the travelling of chopped stator wakes through the passage. The rotor pressure side trailing edge shock, impinging on the suction side of the neighboring blade can be seen. The impinging shock interacts strongly with the rotor suction side boundary layer flow. The shock is then reflected and mixes with the rotor wake flow (dotted arrow) and decelerates the flow to subsonic conditions. There is also radial widening of the flow channel in the rotor section which also contributes to slow down the flow velocity at the exit of the rotor. Another weak shock on the trailing edge of rotor suction side is also evident in the Mach number distribution (solid arrow). This weak shock ultimately mixes with the rotor wake as well and causes a further flow deceleration in the rotor wake flow. The maximum Mach number appeared on 2/3 of the rotor chord on the suction side at 50% span. The presence of shocks generates entropy gradients in the flow passage. The shock–wake interactions at the rotor trailing edge causes significance flow unsteadiness downstream of the rotor. The higher unsteadiness will lead to the increased losses due to the wake and vortex shedding effects at the rotor trailing edge.
8.4. Stator-Rotor Interaction
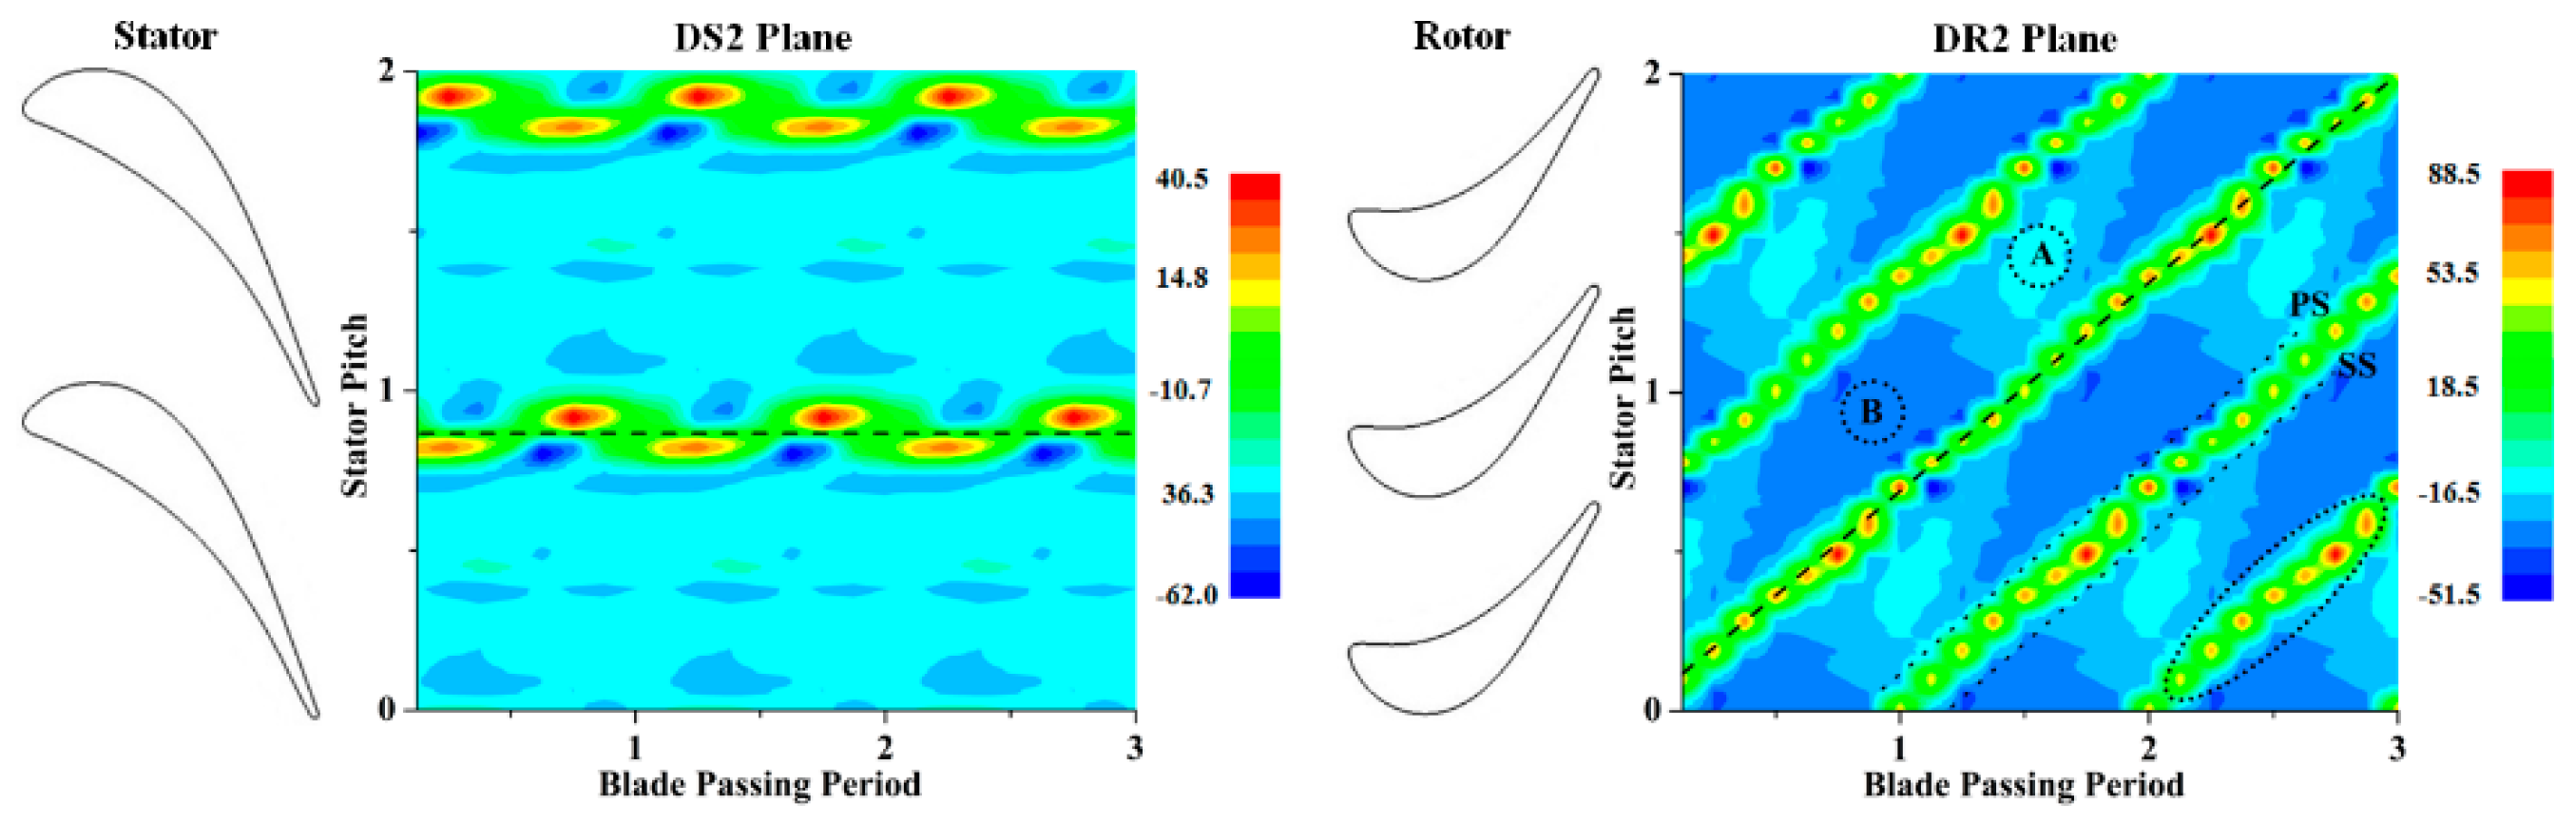
Figure 12 shows the time-space plots of entropy at the midspan, for the two locations DS2 & DR2, downstream of stator and rotor, respectively. The relative position of the stator vanes and the rotor blades is also shown in the figure. The moving blade effects appear under 45° structure format downstream of the rotor and the rotor wakes are indicated by the dashed line, whereas for the stator they appear horizontally. Within each blade passing period, the regions of high (indicated by dotted circle A) and low (indicated by dotted circle B) entropy appear. The high and low entropy levels are the evidence of the chopped stator wakes travelling through the rotor passages independently. The discrete spots of high and low entropy in the rotor wake (indicated by the dashed line) are the evidence of the wake shedding phenomena. The wake shedding is seemed to be phase locked to the blade passing period which will be further explained by the unsteady pressure distribution later in this section. Seven discrete structures of high entropy appear in each blade passing period (indicated by the dotted oval). If the wake shedding is not phase-locked to the passing blade then, there should be a continuous stripe of high entropy in the wake region. The wake shedding is also observed at the stator trailing edge where high entropy regions appear in discrete mode.
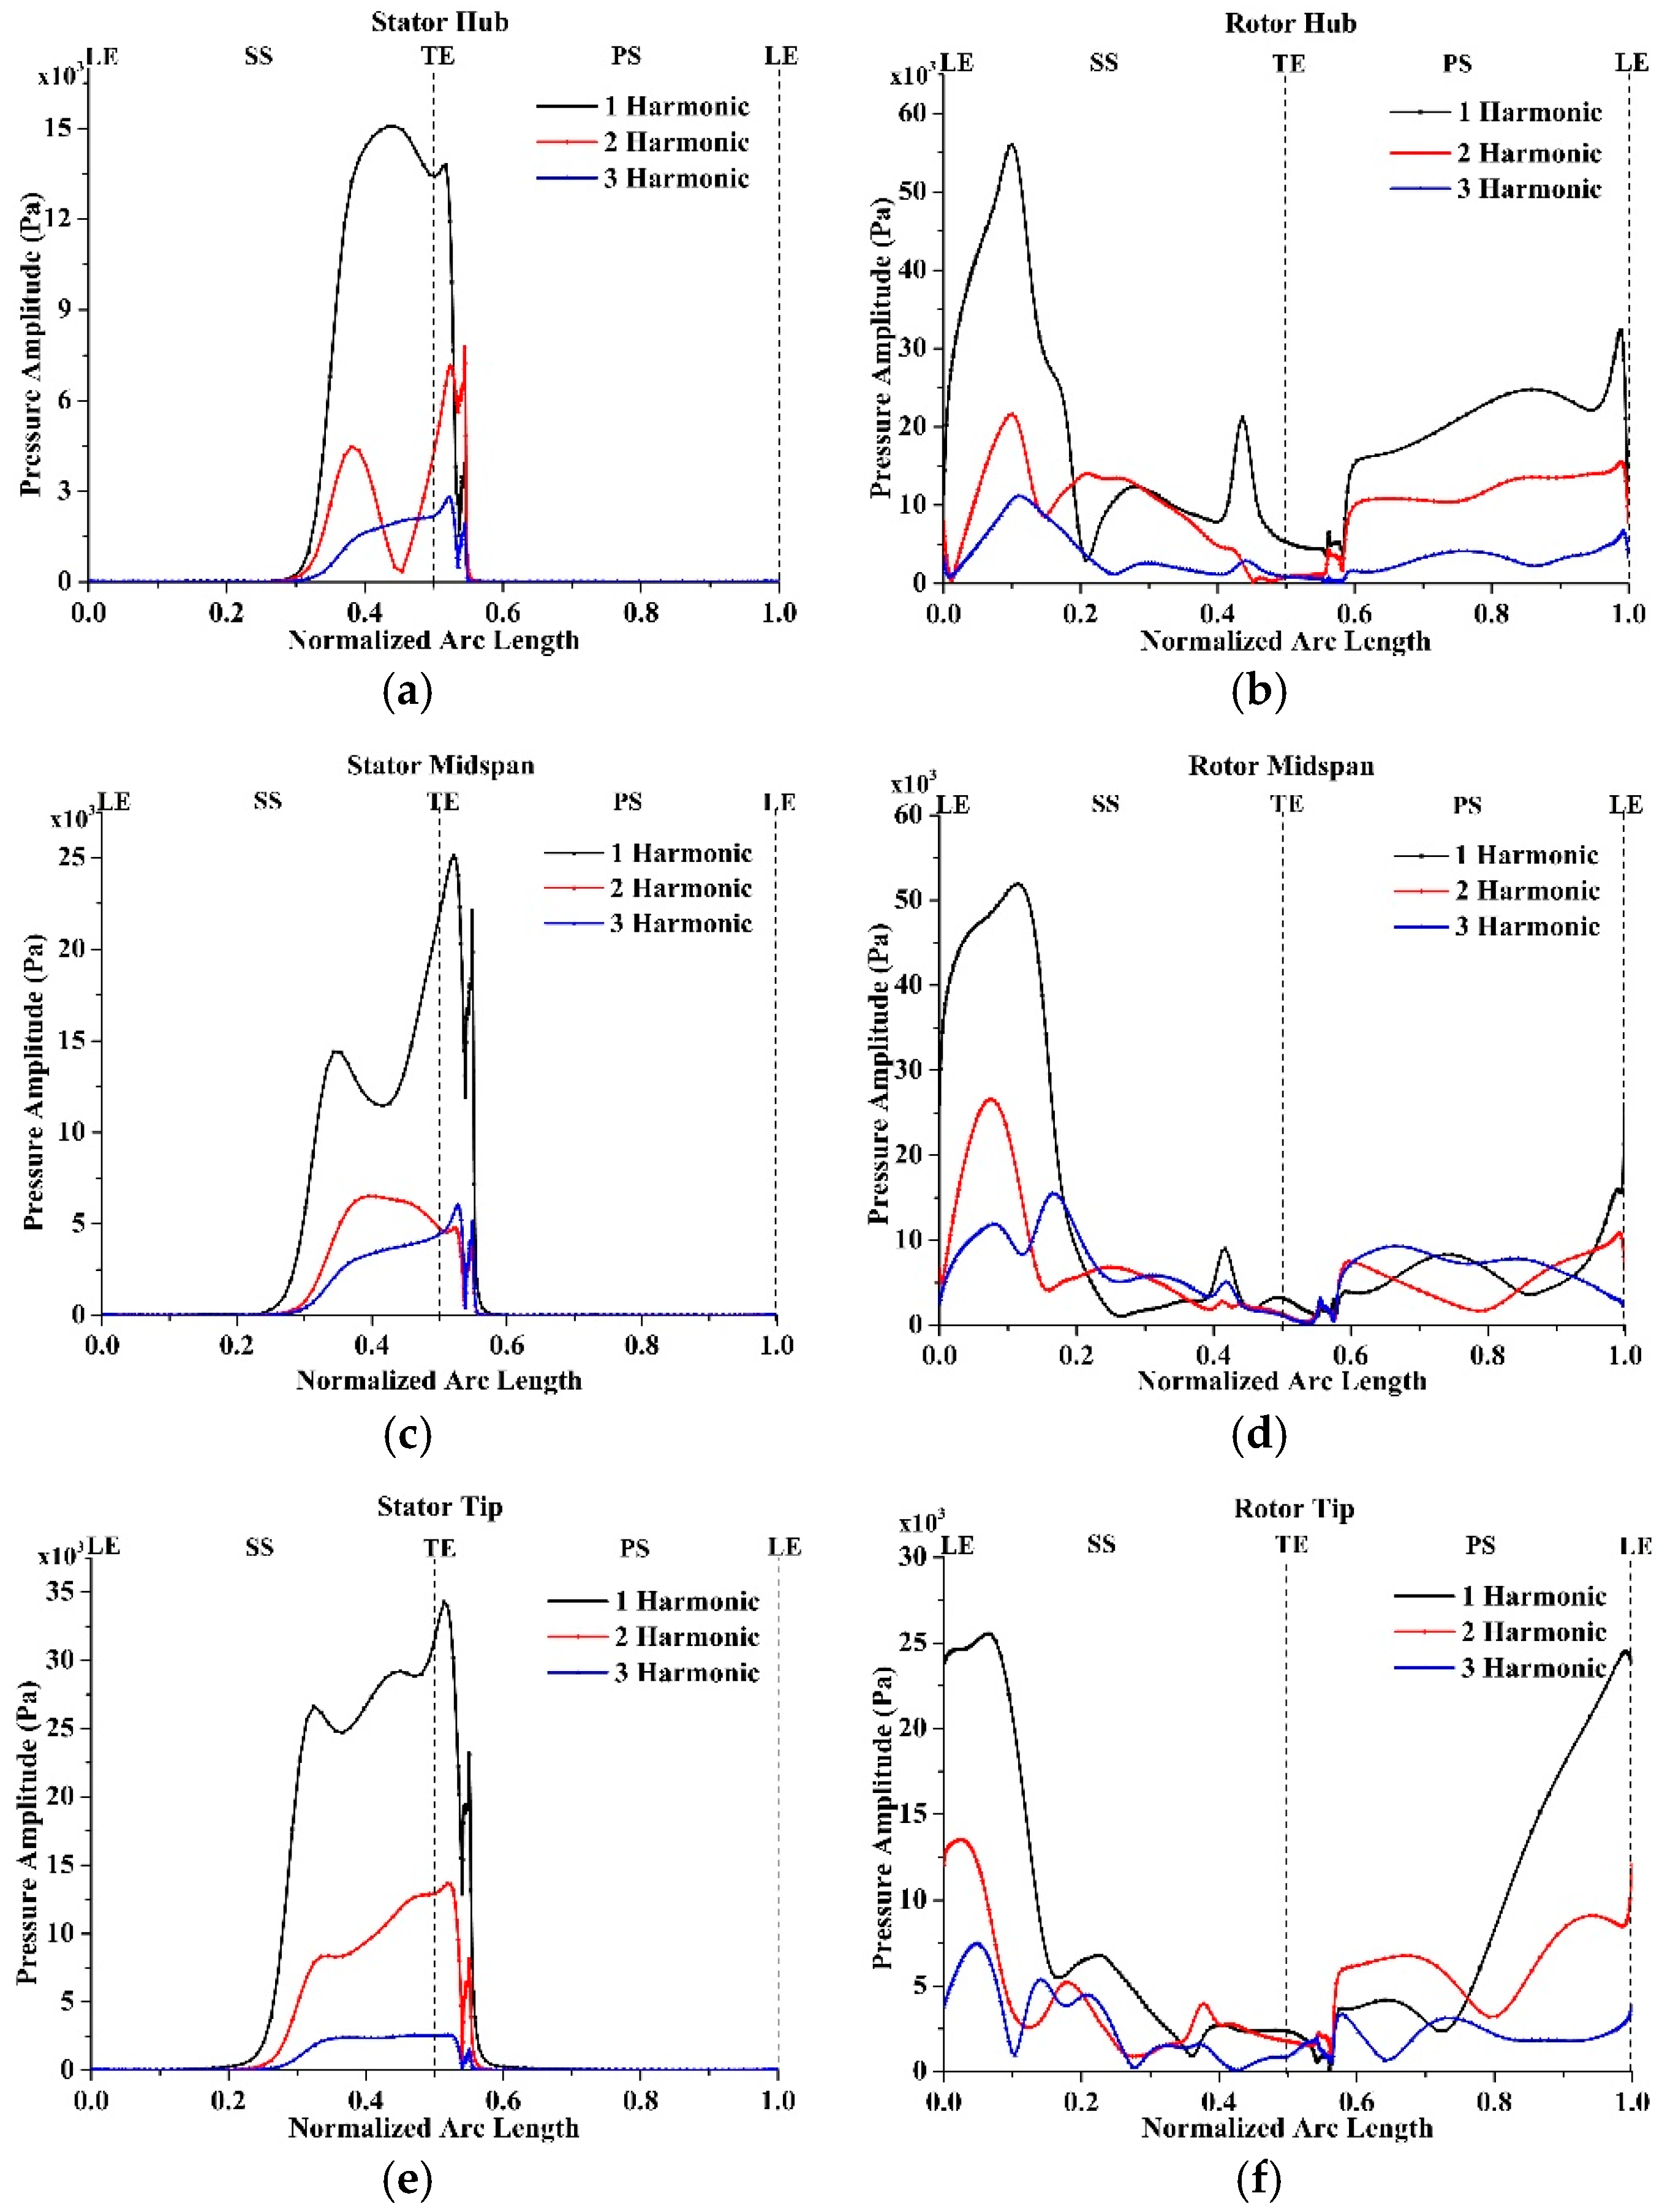
Figure 13 shows the each individual harmonic pressure amplitude on the stator and rotor surface at various spanwise positions (LE: leading edge; SS: suction surface; TE: trailing edge; PS: pressure surface; LE: leading edge). The pressure amplitude is dominated by the first and second order of harmonics, because the low frequency components are the dominant components of the periodic flow field. This also demonstrates that three orders of harmonic are well capable of predicting the main flow parameters. The pressure amplitudes on the suction surface are higher than on the pressure surface, since the rotor rotates relative to the stator from stator suction surface to pressure surface. This is different from that in compressors [33].
The transport of the stator wakes through the rotor passages can be well explained by the entropy contour in Figure 14. The stator wakes are chopped by the rotor leading edge and travel independently through the rotor passage and influence the rotor trailing edge flow. The flow field exhibits strong periodic unsteady flow phenomena. There is a phase locking between the wake shedding and the blade passing period which is evident from the instantaneous entropy distribution. The chopped stator wakes accumulate towards the suction side of the rotor and interact strongly with the rotor trailing edge wake. With three orders of harmonic perturbation, the NLH method is fully capable of capturing the physical phenomena of the stator wake transport through the rotor passage. The wake passing the rotor-stator interface is slightly wider with the NLH method as compared with the unsteady time-accurate method, but it still shows acceptable accuracy. In the NLH solution, a cut-off of flow variables occurs when the information passes across the rotor-stator interface. The periodic unsteady perturbations are Fourier decomposed at the interface therefore; the stator wakes and shocks are smeared. The continuity of the wakes and shocks across the interface would improve with higher numbers of harmonics. The smearing of the data at the rotor-stator interface is usual, as the numerical mixing takes place on these interfaces. However, for the unsteady time-domain computations, there is no such interface and transportation of flow quantities through the interface is smooth.
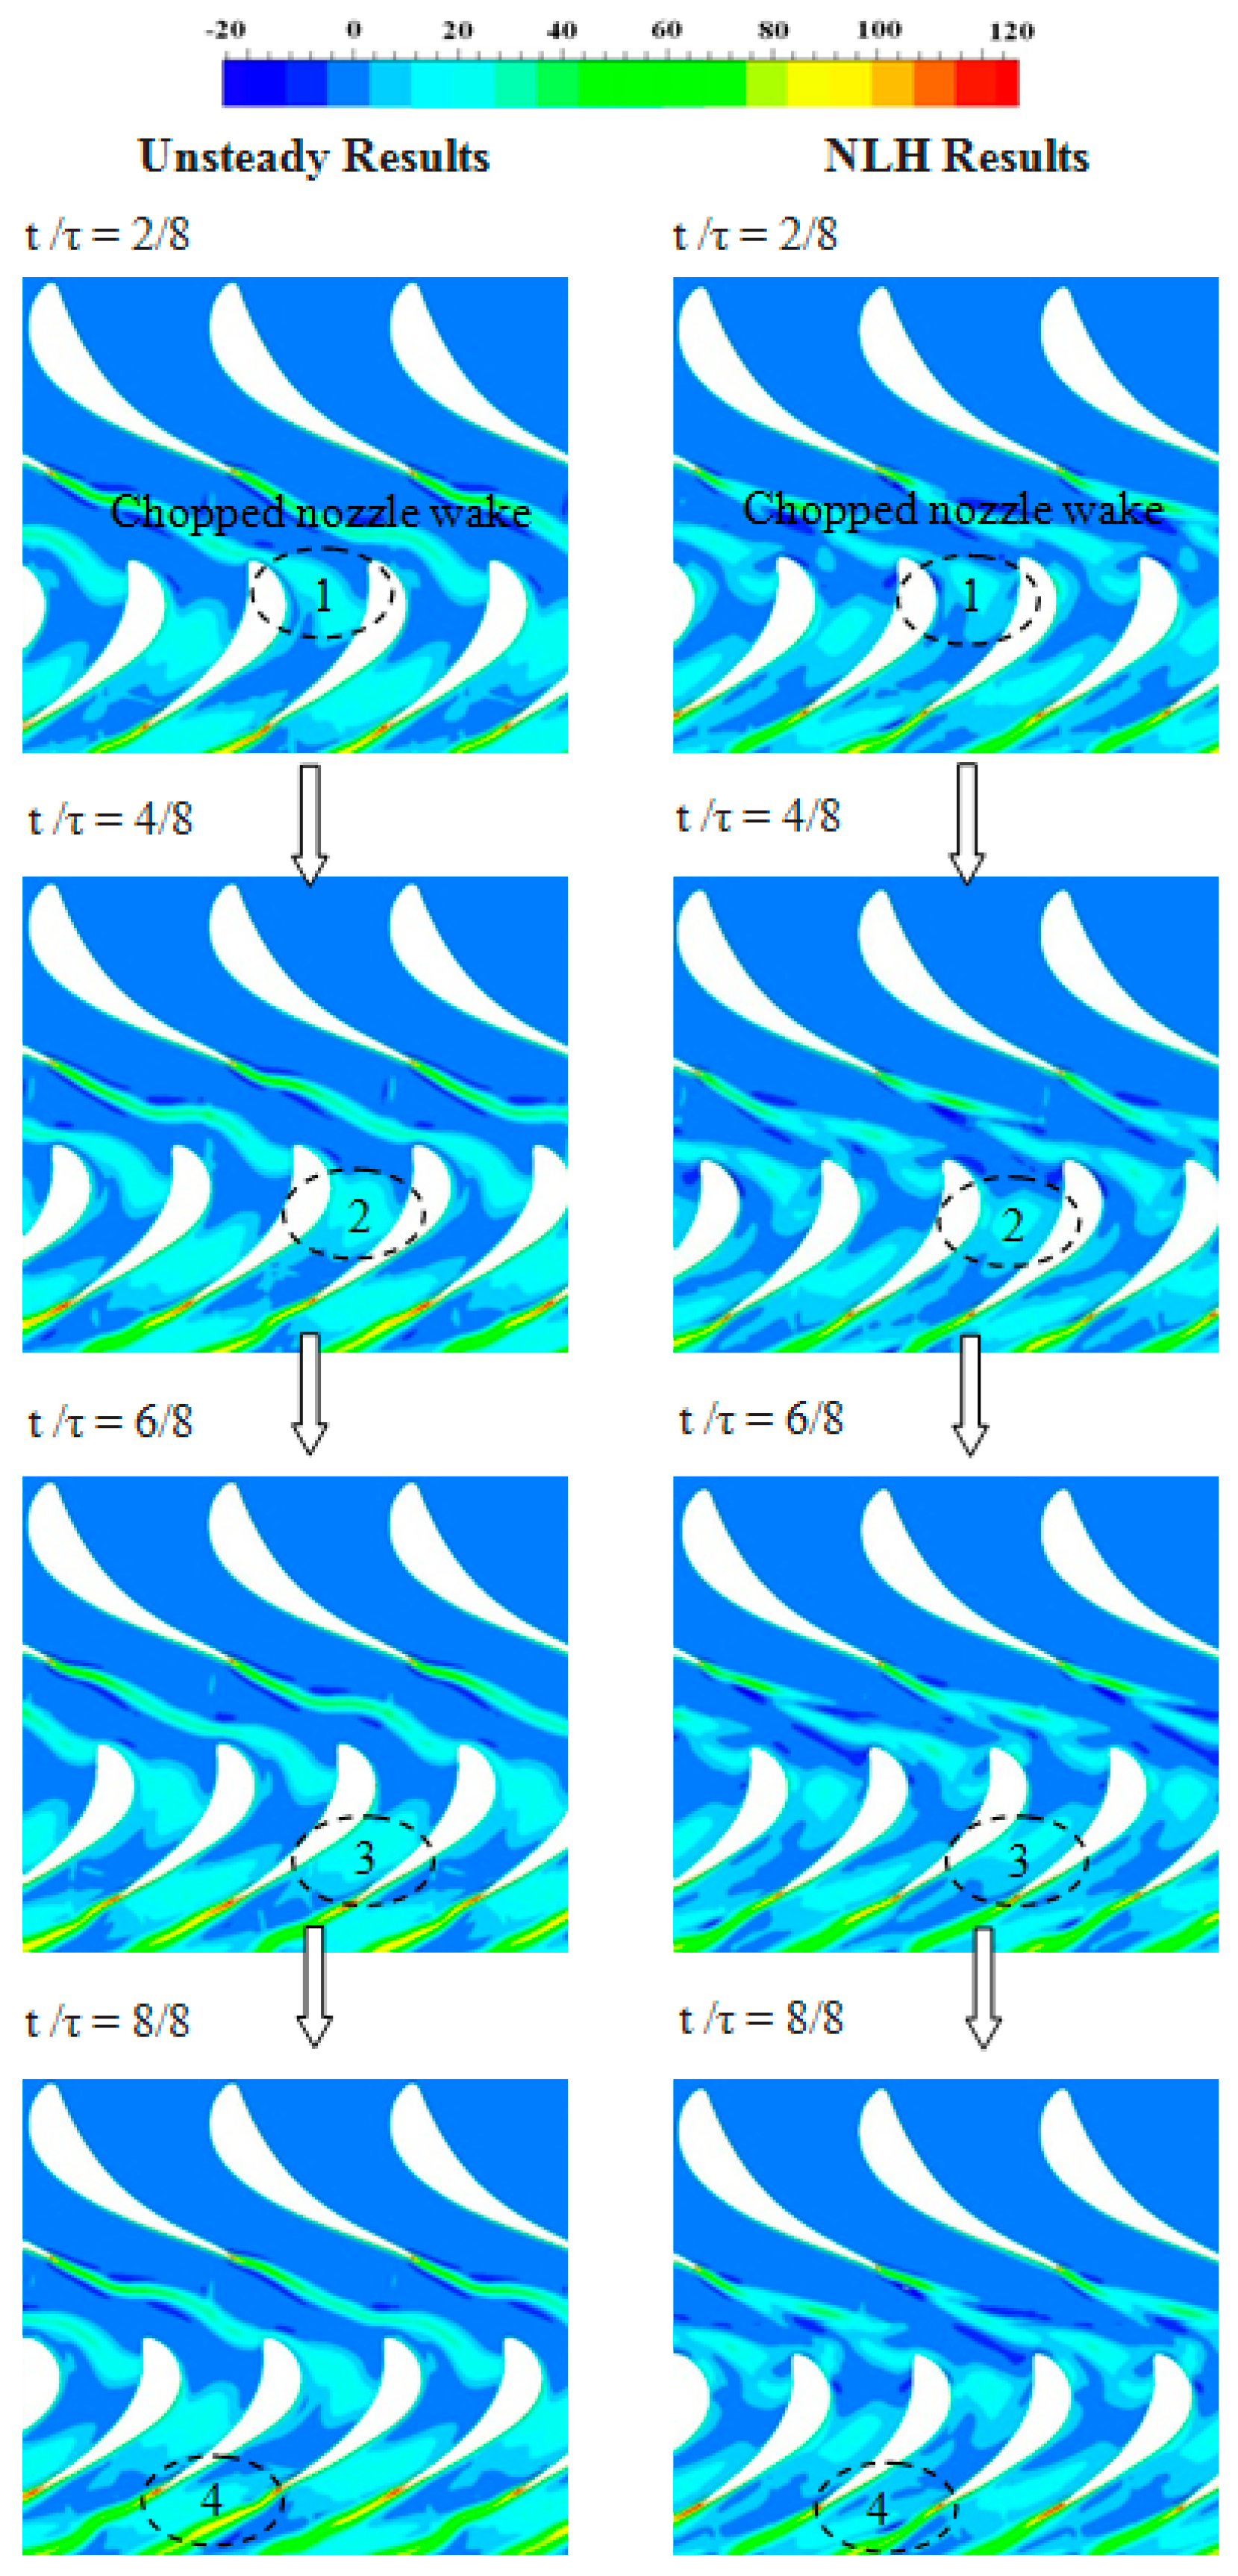
The reason for the stator wake phase locking can be explained by the unsteady pressure distribution in Figure 15. The stator trailing edge shock wave hits the passing by rotor blade at t/τ = 2/8, creating a strong circular pressure wave, which is periodically reflected back to the stator suction side (SS) at t/τ = 4/8, thus triggering the phenomena of wake shedding. A part of this pressure wave travels downstream through the rotor passage (t/τ = 6/8) and triggers the wake shedding at the rotor trailing edge as well. The pressure distribution downstream of the rotor-stator interface is smoother with the unsteady method than the NLH method. However, the NLH method has captured the pressure wave trend in good agreement with the unsteady method using only limited numbers of harmonics. The inaccuracies in the rotor–stator interface vicinity could be further reduced with the increased numbers of harmonics.
Figure 16 represents the stator and rotor surface pressure distribution at 50% span. Time-averaged data has been presented in comparison with the reconstructed instantaneous data at various time steps to monitor the flow unsteadiness. The time averaged and instantaneous pressure distribution on the stator pressure side is the same except at the trailing edge. However, on the suction side, fluctuations near the trailing edge can be seen. This is where the strong unsteady stator–rotor interaction occurs. Furthermore, the harmonic pressure amplitude in Figure 13 also shows that the pressure fluctuations on the stator suction side are higher. This is mainly because the rotor rotates relative to the stator from stator suction surface to pressure surface. The boundary layer near the trailing edge of the suction side is thicker may also cause the potential flow interaction to spread wider in that region.
The fluctuations of the surface pressure on the rotor are large compared with the stator. The whole chord of the rotor is influenced by the unsteadiness caused by the stator wake. The pressure fluctuations on the rotor suction side are much higher compared with the pressure side, which is in line with the findings of the harmonic pressure amplitude in Figure 13. The presence of the shock wave and the accumulation of the chopped stator wake on rotor suction side cause more periodic fluctuations and unsteadiness compared with the pressure side. Overall, the stator–rotor interaction can affect about one third of the stator axial chord near trailing edge; while the whole chord of the rotor is influenced. This indicates that the stator–rotor interactions in this turbine stage are very significant.
8.5. Deterministic Stress/Enthalpy Study
Modeling deterministic correlations is the key to close the average-passage equation system proposed by Adamczyk [34] which could provide an extensive mathematical framework to account for the unsteady blade row interaction in steady state calculation by introducing the deterministic correlations. The deterministic correlations in the momentum equation are called deterministic stresses and the deterministic correlations in the energy equation are called deterministic enthalpy. Adamczyk et al. [35] proposed the first model using overlapping grids for all blade rows without interface planes. In the past 30 years, many efforts have been made and several deterministic correlations models have been proposed and showed that the models apparently improve the numerical results in comparison with steady mixing plane method. However, none of these models has been widely used in the turbomachinery routine design because these models are either too complex, too temperamental or still too time consuming for routine use. Hence, more research work for modeling the deterministic correlations should be conducted.
In the NLH method the deterministic stresses appear through the time averaging of the periodic unsteadiness due to the relative rotor–stator movement. The level of the deterministic stresses in the flow field is representative of the unsteady effects like wakes and potential effects. The deterministic stress as well as the deterministic enthalpy both represent the unsteadiness. The deterministic stresses are directly computed from harmonic values. The detailed information about the flow unsteadiness appears in nine deterministic terms, of which six are related to velocity-velocity deterministic stresses (due to symmetry) and three refer to enthalpy-velocity deterministic fluxes as shown in the Equation (7):
Figure 17 shows the three orders of harmonic deterministic stress DCS_ZZ and deterministic enthalpy DCH_Z at 50% span (only one component is presented for comparison). The levels at the stator inlet are very low, however at the exit of the stator, the levels appeared to be higher due to the unsteady potential field from the downstream rotating blades. The deterministic stress and enthalpy level are also higher in the rotor passage due to the unsteadiness from the upstream stator wake. Compared to the pressure side, the level of unsteadiness on the suction side of the rotor blade is higher. The reason is that the chopped stator wakes tends to accumulate towards the suction side of the rotor blades.
Figure 18 demonstrates the results at 95% span. The results show higher levels of unsteadiness on the suction side of the rotor where the tip leakage vortex is the dominant source of unsteadiness. The higher levels appear roughly from the leading edge of the rotor and they are in-line with the tip clearance flow. The introduction of the deterministic terms in the NLH method produces the unsteady results with precision and good level of confidence. The other deterministic stresses and enthalpy components also show the same behavior. Only some of them are presented here due to the paper length limitations.
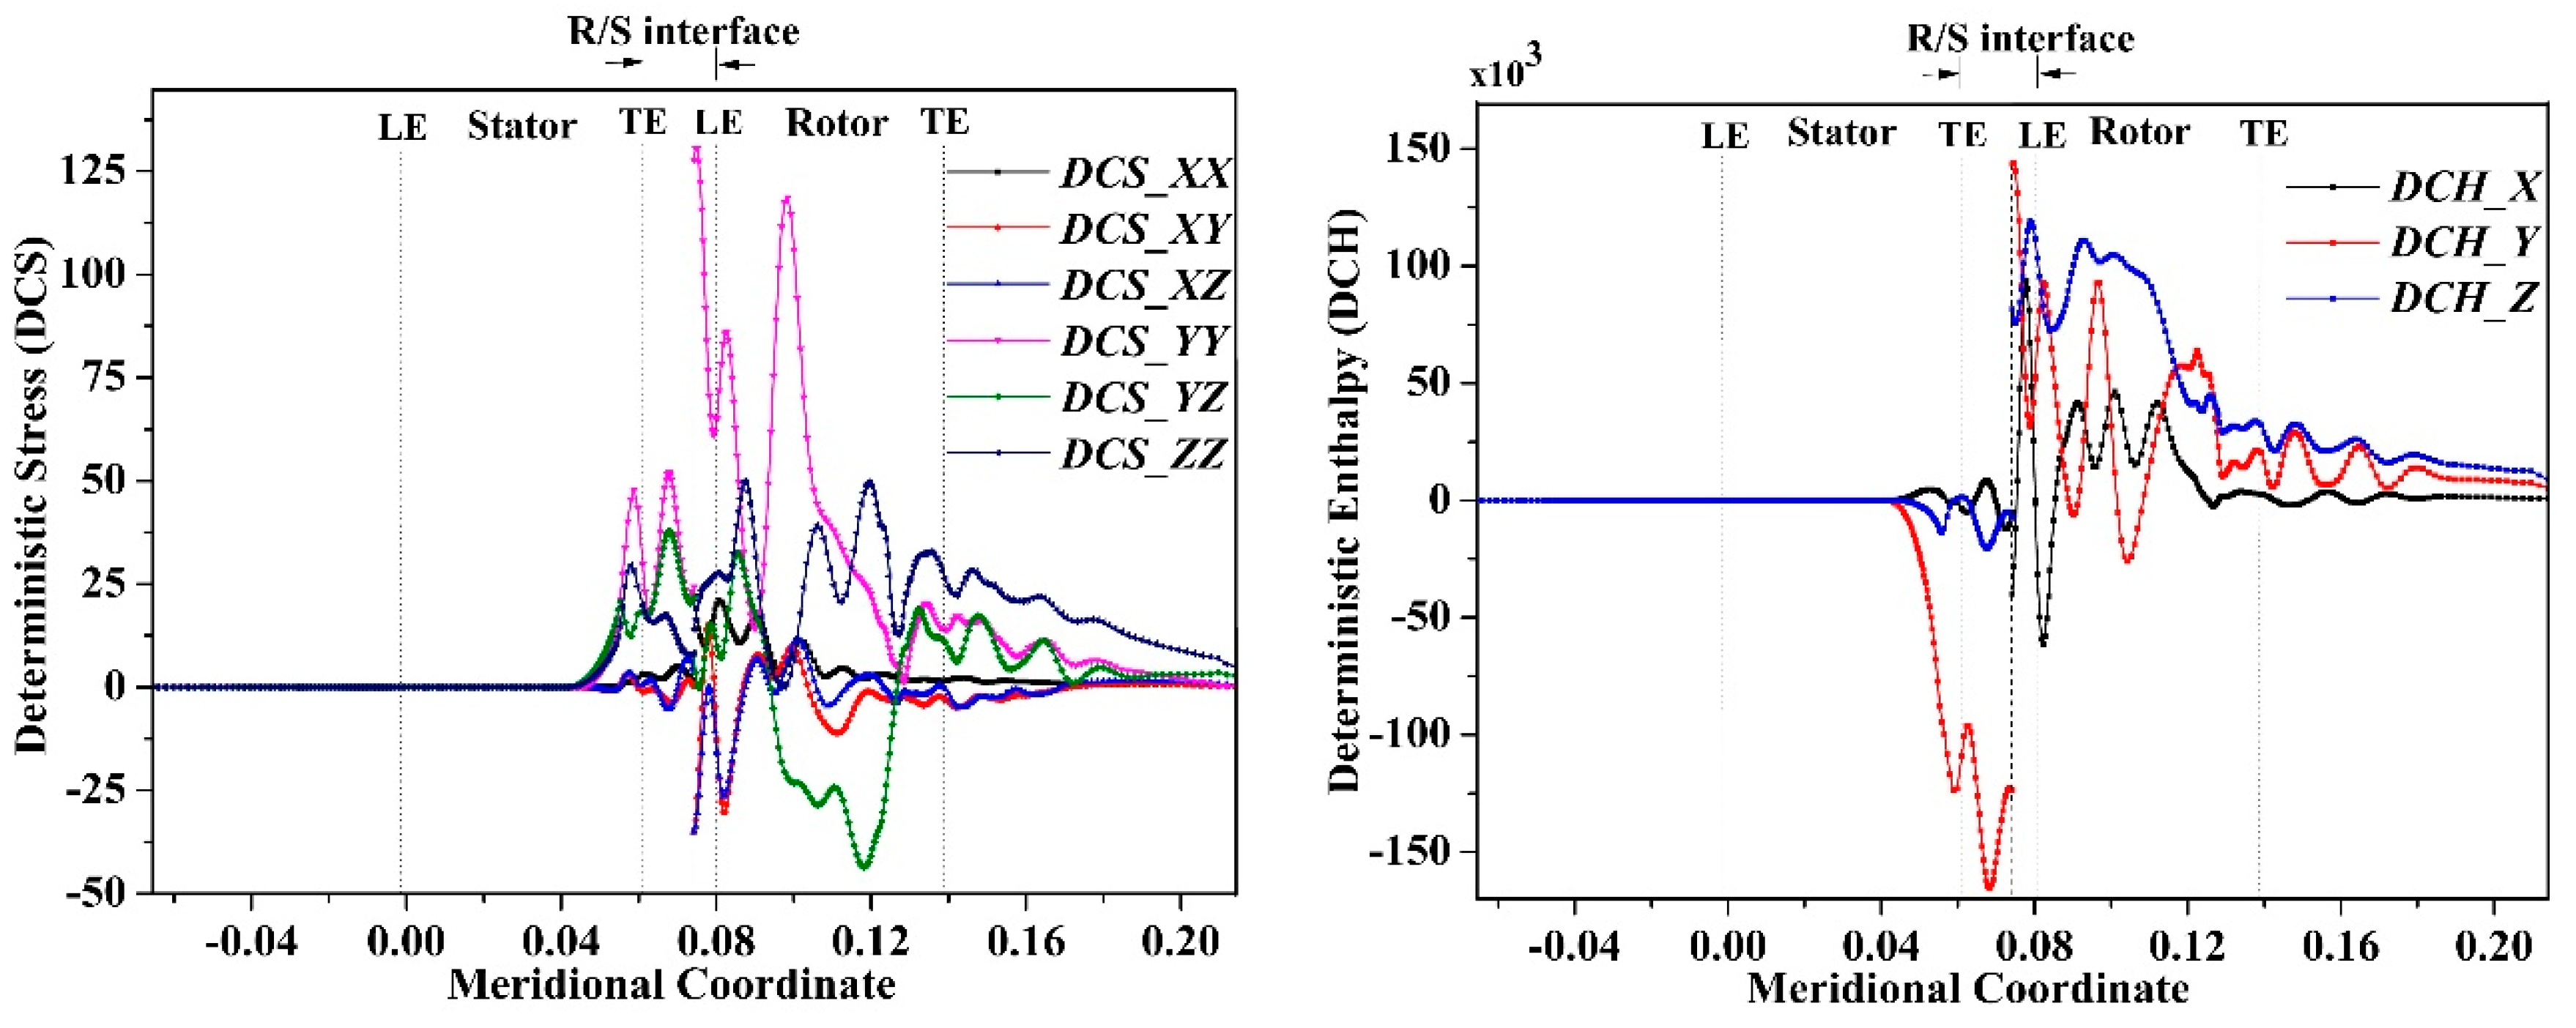
Figure 19 presents a one-dimensional variation of the deterministic stresses and deterministic enthalpy fluxes along the mean flow direction. The variations are rather complex and differ from one another. The amplitude of the deterministic terms related to the X velocity (DCS_XX, DCS_XY, DCS_XZ and DCH_X) appears much smaller than the deterministic terms in the Y and Z direction, for both stator and rotor passages. Similar behavior is observed in the region between stator and rotor near the R/S interface. This leads to the conclusion that the flow unsteadiness is stronger in Y and Z direction as compared with the X direction. Therefore, the deterministic components in the Y and Z direction are particularly related to the unsteady stator–rotor interactions. The maximum values appear in the region of the stator TE, the R/S interface and the rotor LE, which is the region mainly influenced by the unsteady stator–rotor interactions. There is a gap (discontinuity in deterministic terms) at the R/S interface because they are calculated at the interface in the stator and rotor passage respectively. Overall a decreasing trend in the deterministic terms appears from the rotor LE to the outlet, however, the large oscillation of the terms may be attributed to the chopped stator wakes, which travel independently through the rotor passage, creating fluctuations for the deterministic terms. Again, this demonstrates that the deterministic stresses and deterministic enthalpy terms in the NLH method are capable to predict the unsteady flow.
From the above analysis it is inferred that, the distributions of deterministic stress and deterministic enthalpy are quite different from that in compressors [25]. Usually in compressors, the deterministic stress and enthalpy have large magnitudes at the rotor–stator interface and decrease rapidly in the flow direction downstream of the interface; however, there is no obvious similar behavior in the turbine. This is because in compressors, there exists strong inviscid stretching due to the divergent passage, and the viscous decay for wakes. Both of these two mechanisms make the deterministic stresses and deterministic enthalpy decay rapidly. This indicates that, some empirical deterministic correlations models based on the decay concept of compressors are not suitable for turbines.
9. Conclusions
The NLH method has proved to be very efficient compared to the time-domain unsteady method. The frequency casting allows the solving of the harmonic transport equations in a similar way to that of the steady flow equations with a single blade passage, thus the time required to solve the additional harmonic variables is reduced compared with the unsteady method. In the current study, the computational time required by the NLH method is seven times smaller than that of the unsteady RANS. The NLH method has proved to be a promising way to study the stator–rotor interaction and can be used as a fast method for unsteady flow predictions at the design stage.
- (1)
- The stator wakes are chopped as they enter the rotor passage by the rotor leading edge. The chopped wake segments travel through the rotor passage independently. They also interfere with the rotor trailing edge shocks, creating a source of unsteadiness for the trailing edge flow. The R/S interface treatment in the NLH method has shown good capability for reproducing the unsteady signals across the interface. Some minor differences can be seen across the R/S interface, which can be further satisfied by increasing the numbers of harmonics.
- (2)
- Static pressure distribution has been used to explain the triggering mechanism and the phase-locking of the wake shedding phenomena. The pressure wave generated by the reflection of the stator trailing edge shock on the suction side of the passing rotor blade is responsible for the phase locking. These pressure waves travel upstream and enforce the wake shedding as they strike the rear section of the stator suction side, where it interacts with the boundary layer. These pressure waves are strong enough to travel downstream within the rotor passage and influence the rotor trailing edge flow. The impingement of the stator shock and the accumulation of chopped stator wakes on the rotor suction side have induced higher periodic fluctuations on the suction side compared with the pressure side.
- (3)
- The distribution of the deterministic correlations shows that the flow unsteadiness is particularly stronger in the Y and Z directions. Furthermore, the distributions of the deterministic correlations indicate that, some empirical deterministic correlations models based on the decay concept of compressors are not suitable for turbines.
Acknowledgments
This work is support by the National Natural Science Foundation of China (No. 51676007, No. 51420105008 and No. 51376001) and the National Basic Research Program of China (No. 2014CB046405). Yangwei Liu is supported by the China Scholarship Council (CSC) for a one-year visit to the University of Cambridge. The authors would like to thank Dr.-Ing. Herwart Hoenen of the Institute of Jet Propulsion and Turbomachinery, RWTH Aachen University, Germany; for providing the experimental data of the validation case upon our request.
Author Contributions
Muhammad Afzaal Asghar conducted the simulations and did the analysis. Yangwei Liu put forward the main idea. Lipeng Lu has supervised the research work. Muhammad Afzaal Asghar, Yangwei Liu and Jiahuan Cui drafted the manuscript. All authors discussed the results and reviewed the manuscript.
Conflicts of Interest
The authors declare no conflict of interest.
Nomenclature
| N | number of harmonics of perturbations |
| conservative flow variable | |
| position vector | |
| time | |
| imaginary unit | |
| angular frequency | |
| grid resolution in circumferential direction | |
| number of rotor blades | |
| number of stator blades | |
| V | velocity |
| density | |
| DCS | deterministic stress |
| DCH | deterministic enthalpy |
| Subscripts | |
| periodic fluctuation index | |
| Superscripts | |
| ˉ | time mean |
| ′ | periodic perturbation |
| ~ | harmonic complex amplitude |
References and Note
- Blumenthal, R.; Hutchinson, B.; Zori, L. Investigation of transient CFD methods applied to a transonic compressor stage. In Proceedings of the ASME 2011 Turbo Expo Turbine Technical Conference and Exposition, Vancouver, BC, Canada, 6–10 June 2011. [Google Scholar] [CrossRef]
- Emunds, R.; Jennions, I.K.; Bohn, D.; Gier, J. The computation of adjacent blade-row effects in a 1.5 stage axial flow turbine. In Proceedings of the ASME 1997 International Gas Turbine and Aeroengine Congress and Exhibition, Orlando, FL, USA, 2–5 June 1997. [Google Scholar] [CrossRef]
- Gerolymos, G.A.; Hanisch, C. Multistage three-dimensional Navier-Stokes computation of off-design operation of a four-stage turbine. Proc. Inst. Mech. Eng. Part A 1999, 213, 243–261. [Google Scholar] [CrossRef]
- Ashworth, D.A.; Ashworth, J.E.; Schultz, D.L.; Grindrod, K.J. Unsteady aerodynamic and heat transfer processes in a transonic turbine stage. J. Eng. Gas Turbines Power 1985, 107, 1022–1030. [Google Scholar] [CrossRef]
- Liu, Y. Aerodynamics and heat transfer predictions in a highly loaded turbine blade. Int. J. Heat Fluid Flow 2007, 28, 932–937. [Google Scholar] [CrossRef]
- Giles, M.B. Stator/rotor interaction in a transonic turbine. J. Propuls. Power 1990, 6, 621–627. [Google Scholar] [CrossRef]
- Stieger, R.; Hodson, H. The unsteady development of a turbulent wake through a downstream low-pressure turbine blade passage. J. Turbomach. 2005, 127, 388–394. [Google Scholar] [CrossRef]
- Cui, J.; Rao, V.N.; Tucker, P. Numerical investigation of contrasting flow physics in different zones of a high-lift low-pressure turbine blade. J. Turbomach. 2016, 138, 011003. [Google Scholar] [CrossRef]
- Binder, A.; Schroeder, T.; Hourmouziadis, J. Turbulence measurements in a multistage low-pressure turbine. ASME J. Turbomach. 1989, 111, 153–161. [Google Scholar] [CrossRef]
- Zhao, W.; Luo, W.; Zhao, Q.; Xu, J. Investigation on the reduction of trailing edge shock losses for a highly loaded transonic turbine. In Proceedings of the ASME Turbo Expo 2016: Turbomachinery Technical Conference and Exposition, Seoul, South Korea, 13–17 June 2016. [Google Scholar] [CrossRef]
- Urbikain, G.; Alvarez, A.; López de Lacalle, L.N.; Arsuaga, M.; Alonso, M.A.; Veiga, F. A reliable turning process by the early use of a deep simulation model at several manufacturing stages. Machines 2017, 5, 15. [Google Scholar] [CrossRef]
- Artetxe, E.; Olvera, D.; de Lacalle, L.N.L.; Campa, F.J.; Olvera, D.; Lamikiz, A. Solid subtraction model for the surface topography prediction in flank milling of thin-walled integral blade rotors (IBRs). Int. J. Adv. Manuf. Technol. 2017, 90, 741–752. [Google Scholar] [CrossRef]
- Wang, H.; Zhang, H.; Zhao, Q.; Yang, K.; Zhang, Z.; Zhao, X.; Xu, J. Unsteady numerical simulation of shock systems in vaneless counter-rotating turbine. J. Eng. Thermophys. 2007, 28, 477–485. [Google Scholar]
- Göttlich, E.; Woisetschläger, J.; Pieringer, P.; Hampel, B.; Heitmeir, F. Investigation of vortex shedding and wake-wake interaction in a transonic turbine stage using laser-doppler-velocimetry and particle-image-velocimetry. J. Turbomach. 2006, 128, 178–187. [Google Scholar] [CrossRef]
- Woisetschläger, P.P.-E.G.-J.; Heitmeir, W.S.-F. Numerical investigation of the unsteady flow through a transonic turbine stage using an innovative flow solver. In Proceedings of the 6th European Conference on Turbomachinery, At Lille, France, 7–11 March 2005. [Google Scholar]
- Lin, D.; Yuan, X.; Su, X. Local entropy generation in compressible flow through a high pressure turbine with delayed detached eddy simulation. Entropy 2017, 19, 29. [Google Scholar] [CrossRef]
- Cui, J.; Rao, V.N.; Tucker, P.G. Numerical investigation of secondary flows in a high-lift low pressure turbine. Int. J. Heat Fluid Flow 2017, 63, 149–157. [Google Scholar] [CrossRef]
- Vilmin, S.; Lorrain, E.; Tartinville, B.; Capron, A.; Hirsch, C. The nonlinear harmonic method: From single stage to multi-row effects. Int. J. Comput. Fluid Dyn. 2013, 27, 88–99. [Google Scholar] [CrossRef]
- NUMECA International User Manual FINE™/Turbo V10.2. 2016.
- Vilmin, S.; Lorrain, E.; Debrabandere, F.; Tartinville, B.; Capron, A.; Hirsch, C. The nonlinear harmonic method applied to the combined effects of multi-row unsteady flows. In Proceedings of the ASME Turbo Expo 2013: Turbine Technical Conference and Exposition, San Antonio, TX, USA, 3–7 June 2013. [Google Scholar] [CrossRef]
- Liu, B.J.; Zhang, B.; Liu, Y.W. Numerical investigations of impeller–diffuser interactions in a transonic centrifugal compressor stage using nonlinear harmonic method. Proc. Inst. Mech. Eng. Part A 2014, 228, 862–877. [Google Scholar] [CrossRef]
- Lei, W.; Bo, L. Investigation of the unsteady flow in a counter-rotating compressor using the nonlinear harmonic method. Int. J. Energy Sci. 2012, 2, 182–188. [Google Scholar]
- Lestriez, R.; Amet, E.; Tartinville, B.; Hirsch, C. Non-linear harmonic flow simulations of a high-head francis turbine test case. In IOP Conference Series: Earth and Environmental Science; IOP Publishing: Bristol, UK, 2016; p. 62011. [Google Scholar]
- Liu, B.J.; Zhang, B.; Liu, Y.W. Investigation of model development for deterministic correlations associated with impeller-diffuser interactions in centrifugal compressors. Sci. China Technol. Sci. 2015, 58, 499–509. [Google Scholar] [CrossRef]
- Liu, Y.W.; Liu, B.J.; Lu, L.P. Study of modeling unsteady blade row interaction in a transonic compressor stage part 1: Code development and deterministic correlation analysis. Acta Mech. Sin. 2012, 28, 281–290. [Google Scholar] [CrossRef]
- Wang, L.; Liu, B.; Yang, X.; Cao, Z. Unsteady simulation of a counter–rotating research compressor using the nonlinear harmonic method. Proc. Inst. Mech. Eng. Part G 2013, 227, 415–424. [Google Scholar] [CrossRef]
- Zhang, P.; Liu, B.; Shi, L.; Li, J. Investigation of the unsteady flow of a transonic compressor using the nonlinear harmonic method. Proc. Inst. Mech. Eng. Part G 2016, 230, 1263–1272. [Google Scholar] [CrossRef]
- Jameson, A. Application of Dual Time Stepping to Fully Implicit Runge Kutta Schemes for Unsteady Flow Calculations. In Proceedings of the 22nd AIAA Computational Fluid Dynamics Conference, Dallas, TX, USA, 22–26 June 2015; p. 2753. [Google Scholar]
- Bradshaw, P. Turbulence modeling with application to turbomachinery. Prog. Aerosp. Sci. 1996, 32, 575–624. [Google Scholar] [CrossRef]
- Zeschky, J.; Gallus, H. Effects of stator wakes and spanwise nonuniform inlet conditions on the rotor flow of an axial turbine stage. In Proceedings of the ASME 1991 International Gas, Turbine and Aeroengine Congress and Exposition, Orlando, FL, USA, 3–6 June 1991. [Google Scholar] [CrossRef]
- Walraevens, R.; Gallus, H. Testcase 6–1-1/2 Stage Axial Flow Turbine. Ercoftac Testcase 1997, 6, 201–212. [Google Scholar]
- Reinmöller, U.; Stephan, B.; Schmidt, S.; Niehuis, R. Clocking effects in a 1.5 stage axial turbine: Steady and unsteady experimental investigations supported by numerical simulations. In Proceedings of the ASME Turbo Expo 2001: Power for Land, Sea, and Air, New Orleans, LA, USA, 4–7 June 2001. [Google Scholar] [CrossRef]
- Liu, Y.W.; Liu, B.J.; Lu, L.P. Investigation of unsteady impeller-diffuser interaction in a transonic centrifugal compressor stage. In Proceedings of the ASME Turbo Expo 2010: Power for Land, Sea, and Air, Glasgow, UK, 14–18 June 2010. [Google Scholar] [CrossRef]
- Adamczyk, J.J. Model equations for simulating flows in multistage turbomachinery. In Proceedings of the ASME 1985 International Gas Turbine Conference and Exhibit, Houston, TX, USA, 18–21 March 1985. ASME Paper No. 85-GT-226. [Google Scholar]
- Adamczyk, J.J.; Mulac, R.A.; Celestina, M.L. A Model for closing the invisid form of the average passage equation system. J. Turbomach. 1986, 108, 180–186. [Google Scholar] [CrossRef]
Figure 1.
Meridional flow path of turbine stage: (a) Meridional flow path [14]; (b) Planes of DS1, DS2, DR1 and DR2.
Figure 1.
Meridional flow path of turbine stage: (a) Meridional flow path [14]; (b) Planes of DS1, DS2, DR1 and DR2.

Figure 2.
Grid distribution near leading edge of stator (a) and rotor (b).

Figure 3.
Pressure distribution on turbine rotor surface at various spanwise locations: (a) 10.9% span; (b) 50% span; (c) 89.1% span.
Figure 3.
Pressure distribution on turbine rotor surface at various spanwise locations: (a) 10.9% span; (b) 50% span; (c) 89.1% span.

Figure 4.
Plots of mass flow rate (a) and stage efficiency (b).

Figure 5.
Isentropic Mach number distribution at the midspan on the (a) stator and (b) rotor blade.

Figure 6.
Time-averaged entropy (a) and Mach number (b) distribution downstream of stator from the NLH simulation.
Figure 6.
Time-averaged entropy (a) and Mach number (b) distribution downstream of stator from the NLH simulation.
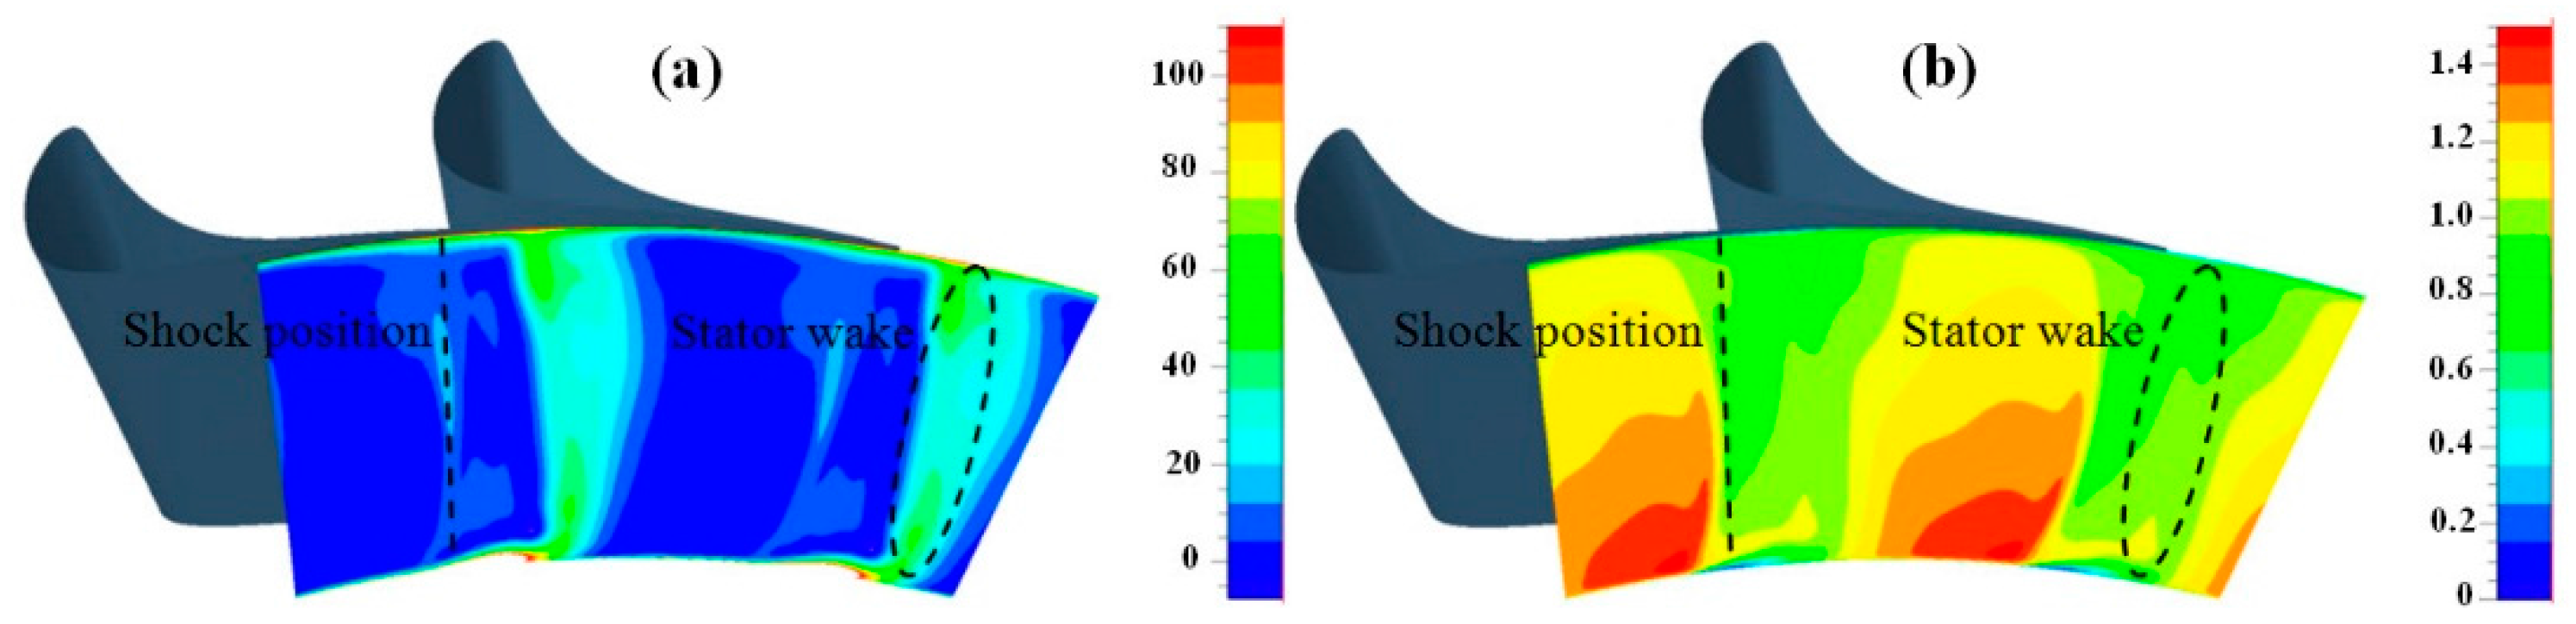
Figure 7.
Time-averaged velocity (a), yaw angle (b) and entropy (c) downstream of stator.

Figure 8.
Time-averaged entropy (a) and Mach number (b) distribution in stator at 50% span near trailing edge from the NLH simulation.
Figure 8.
Time-averaged entropy (a) and Mach number (b) distribution in stator at 50% span near trailing edge from the NLH simulation.

Figure 9.
Time-averaged entropy (a) and Mach number (b) distribution downstream of the rotor from the NLH simulation.
Figure 9.
Time-averaged entropy (a) and Mach number (b) distribution downstream of the rotor from the NLH simulation.

Figure 10.
Time-averaged velocity (a), yaw angle (b) and entropy (c) downstream of rotor.

Figure 11.
Time-averaged Entropy (a) and Mach number (b) distribution in rotor at 50% span from the NLH simulation.
Figure 11.
Time-averaged Entropy (a) and Mach number (b) distribution in rotor at 50% span from the NLH simulation.
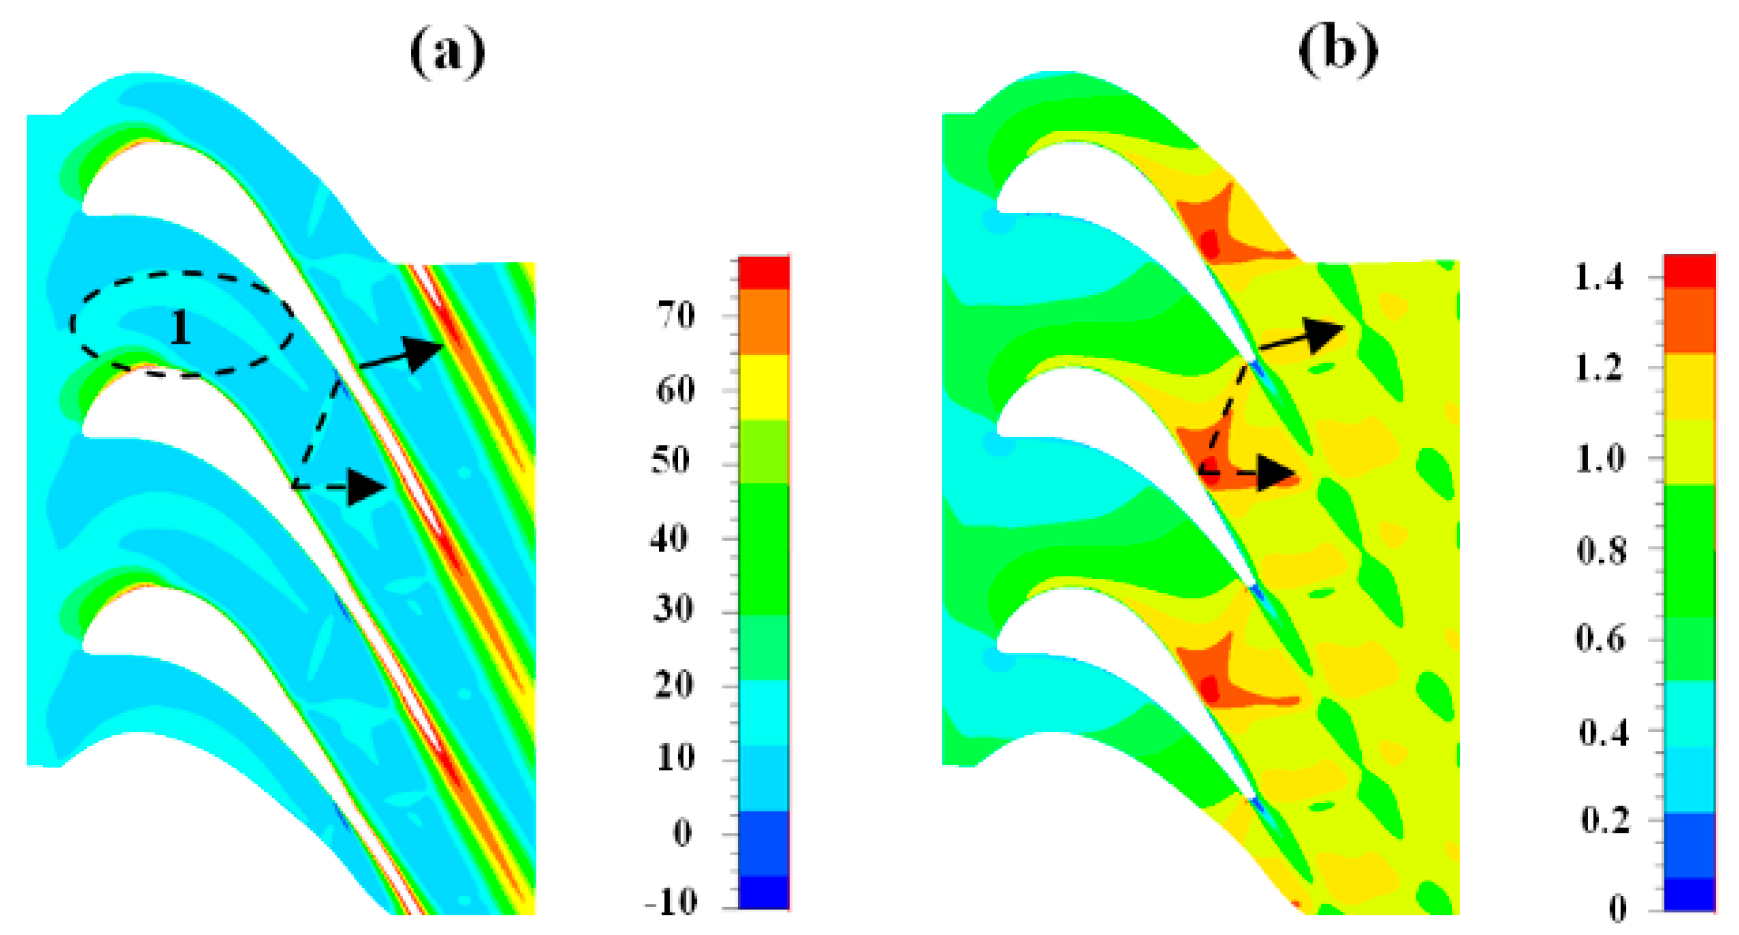
Figure 12.
Time-space plots of Entropy distribution for the DS2 and DR2 planes from the NLH method.

Figure 13.
Harmonic pressure amplitude on the stator (left) and rotor (right) blade surface: (a) stator hub; (b) rotor hub; (c) stator midspan; (d) rotor midspan; (e) stator tip; (f) rotor tip.
Figure 13.
Harmonic pressure amplitude on the stator (left) and rotor (right) blade surface: (a) stator hub; (b) rotor hub; (c) stator midspan; (d) rotor midspan; (e) stator tip; (f) rotor tip.

Figure 14.
Time resolved entropy distribution at 50% span.

Figure 15.
Time resolved pressure (Pa) distribution at 50% span.
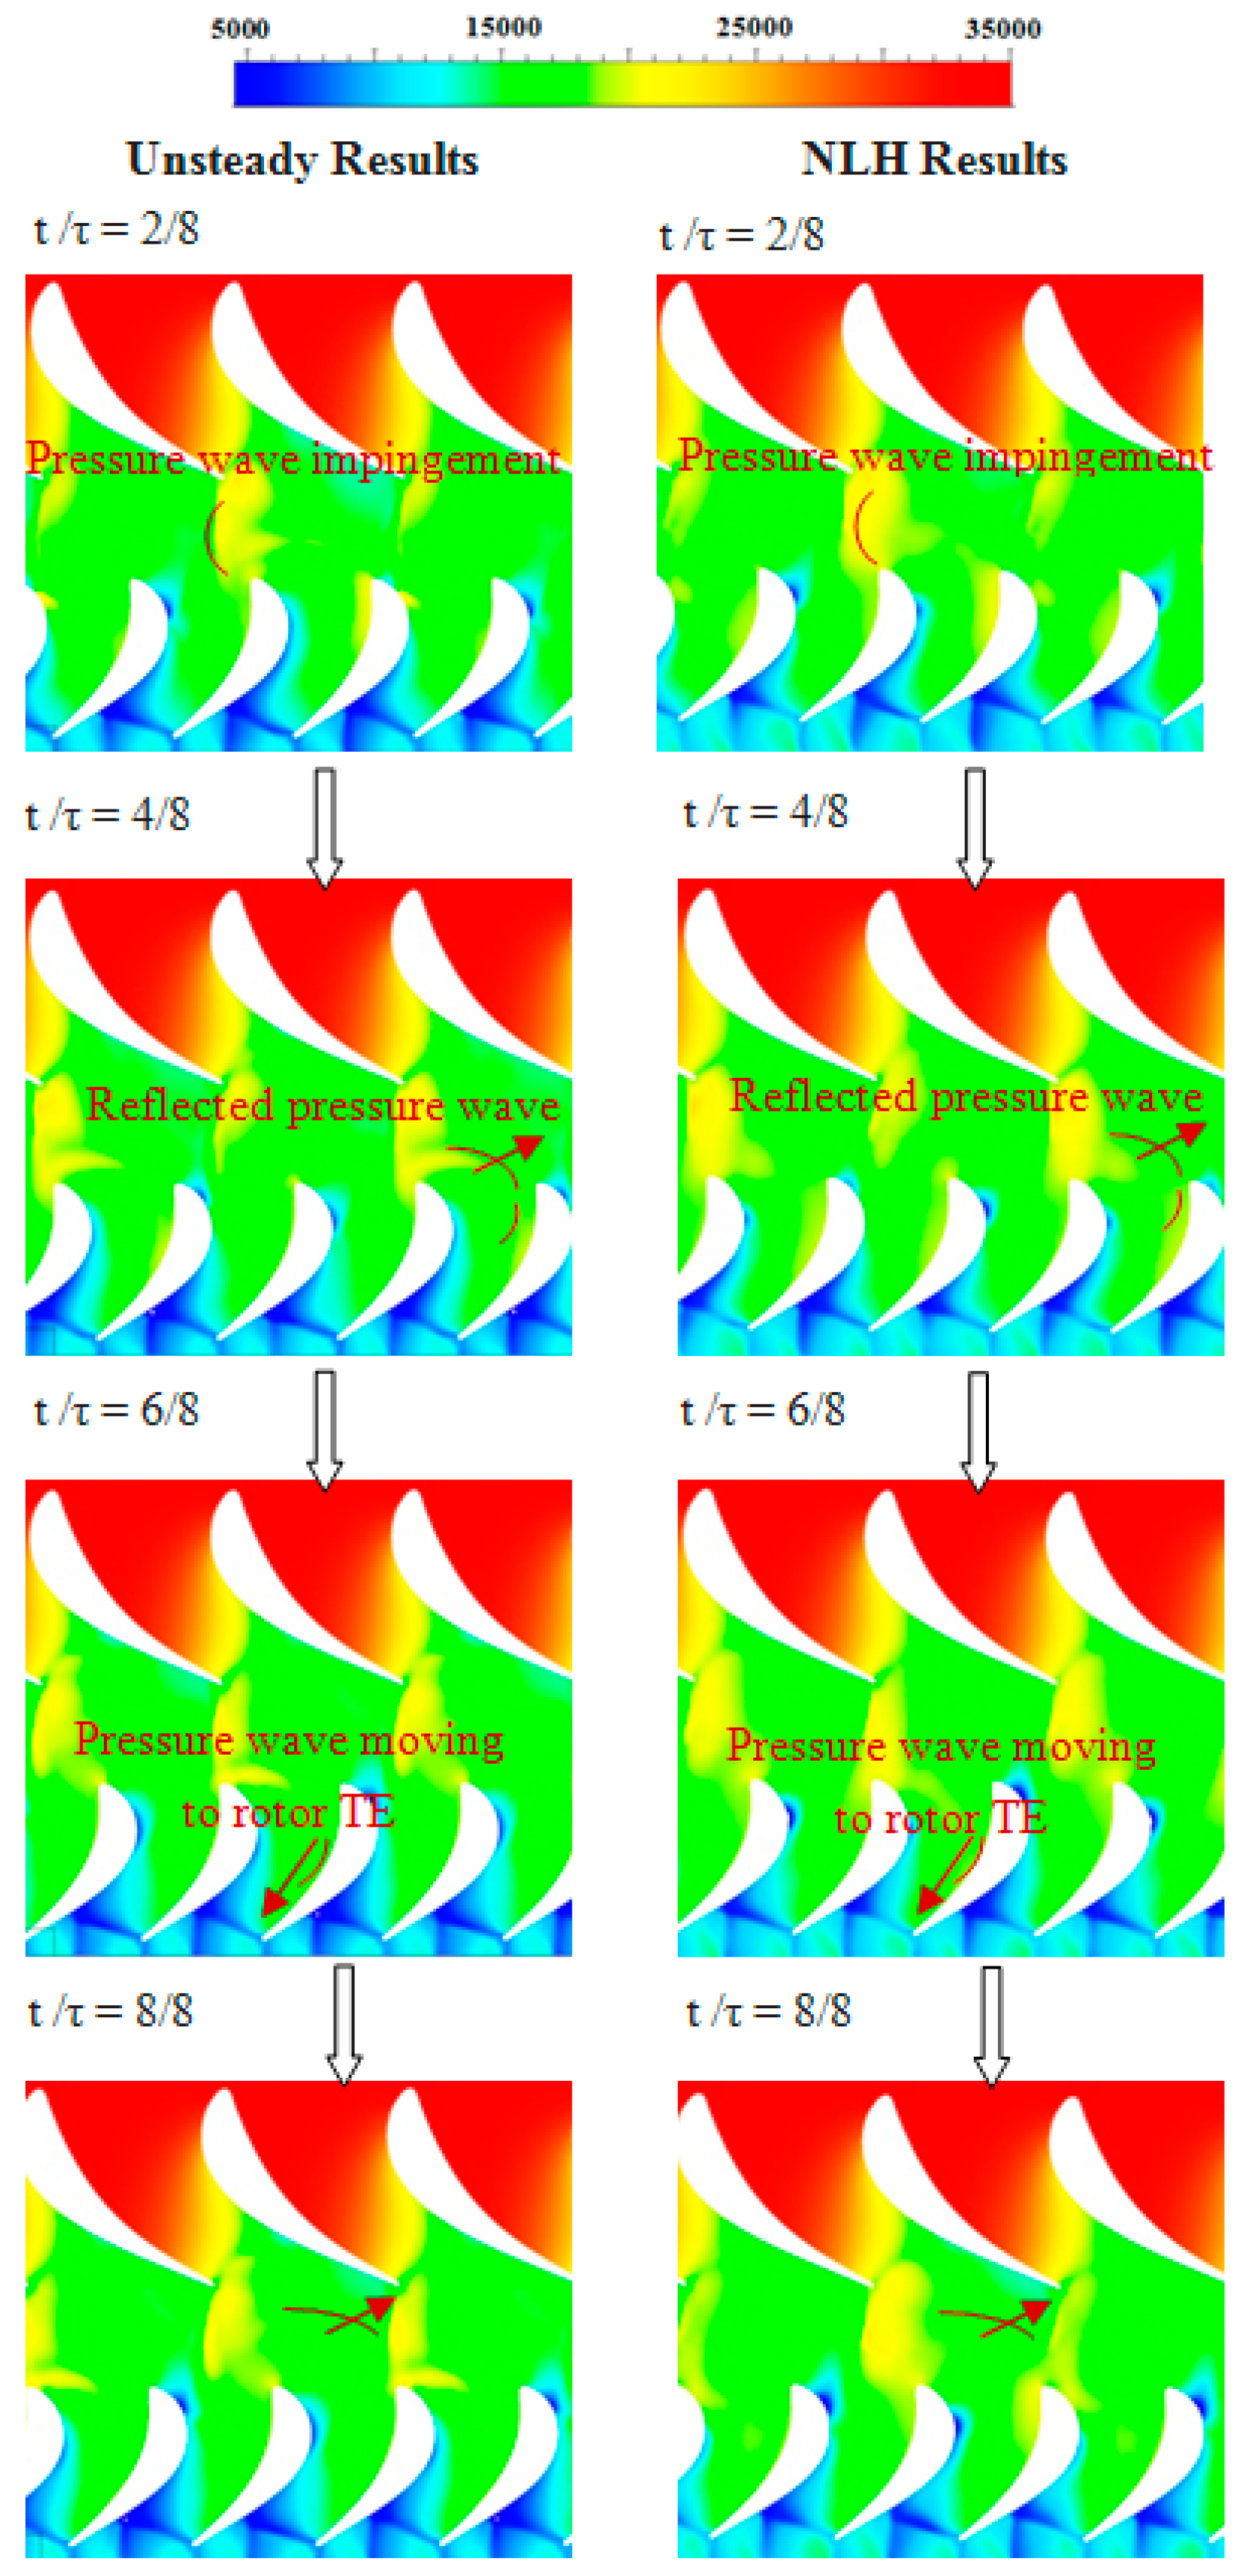
Figure 16.
Pressure fluctuations on stator (a) and rotor (b) at midspan from the NLH method.
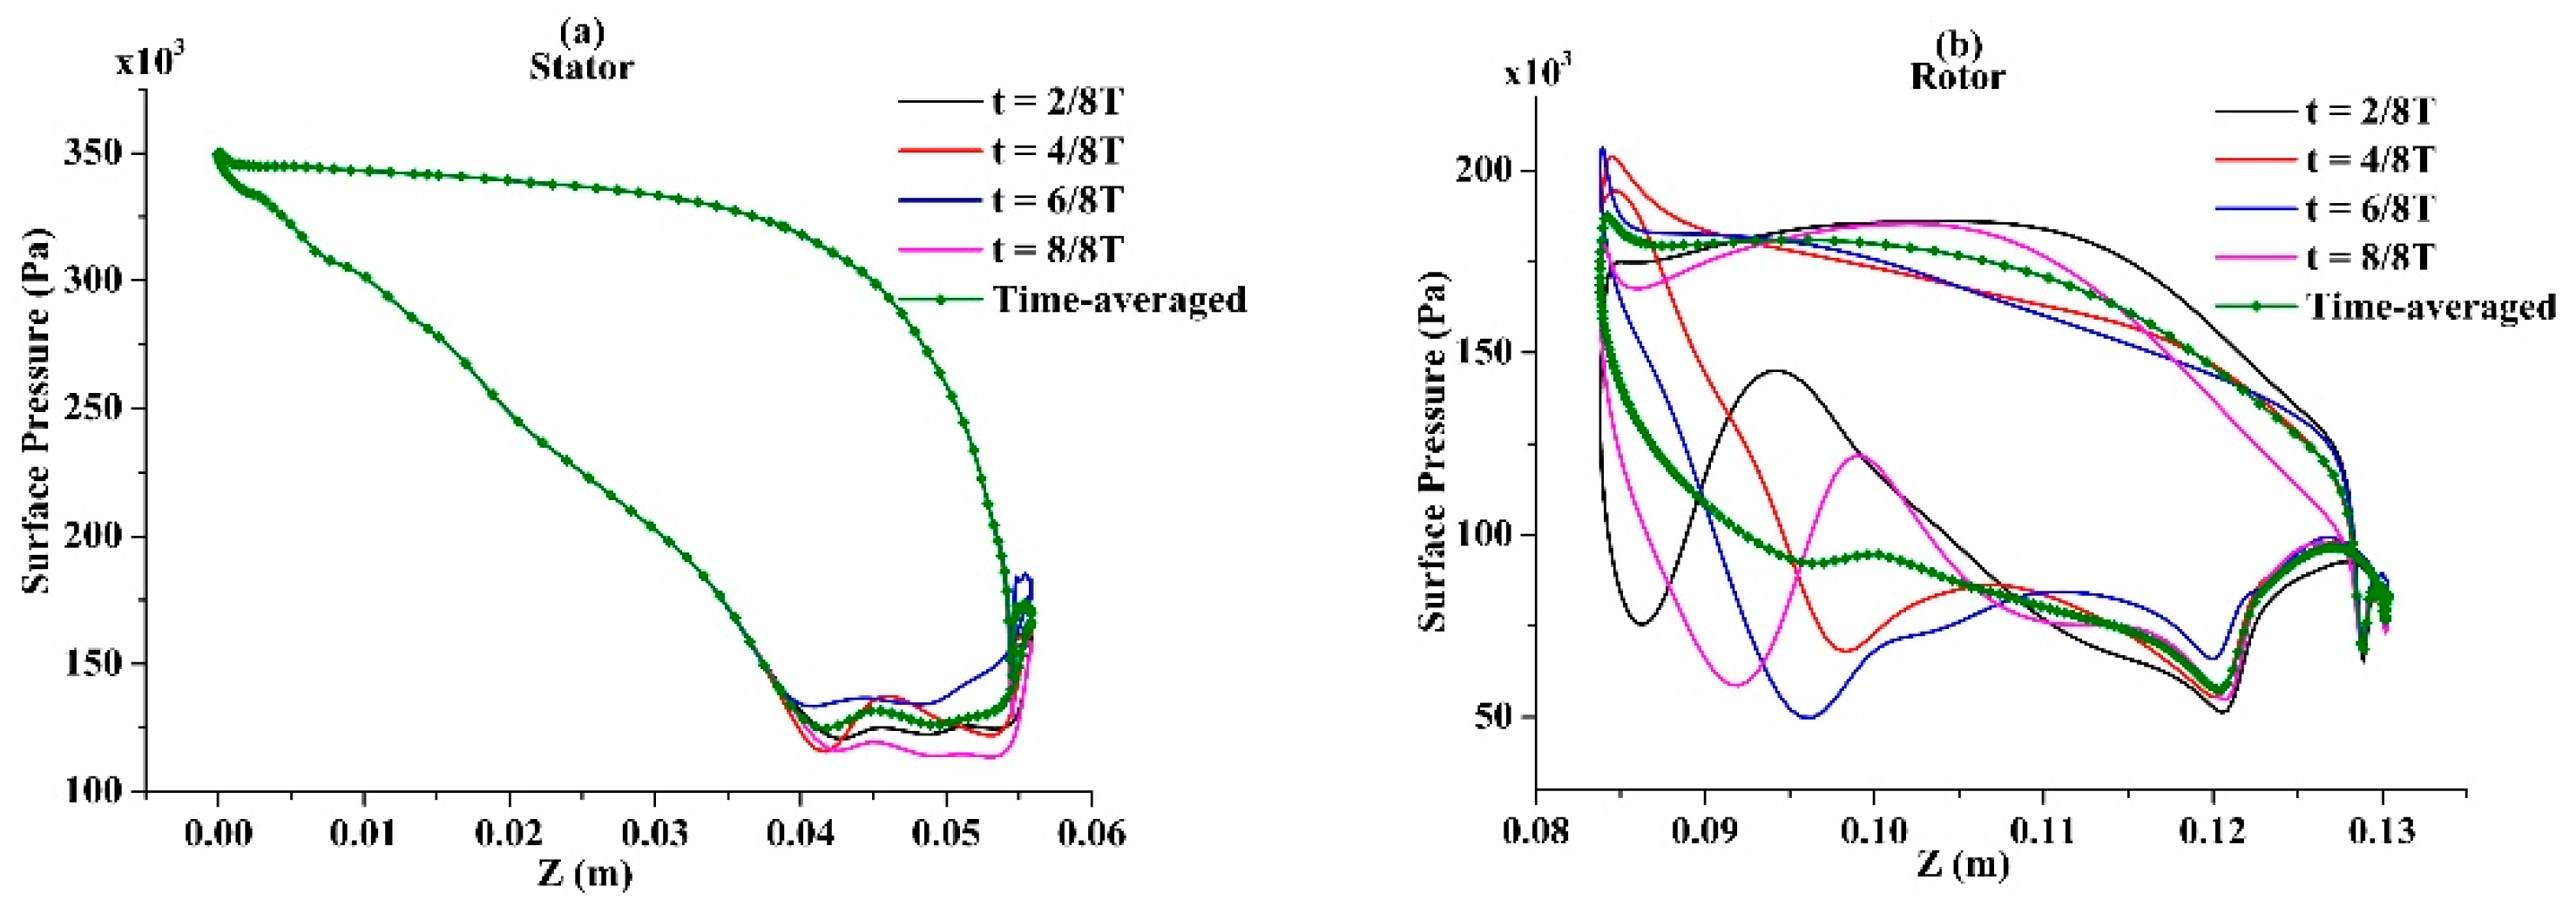
Figure 17.
Deterministic stress DCS_ZZ (a) and deterministic enthalpy DCH_Z (b) at 50% span.
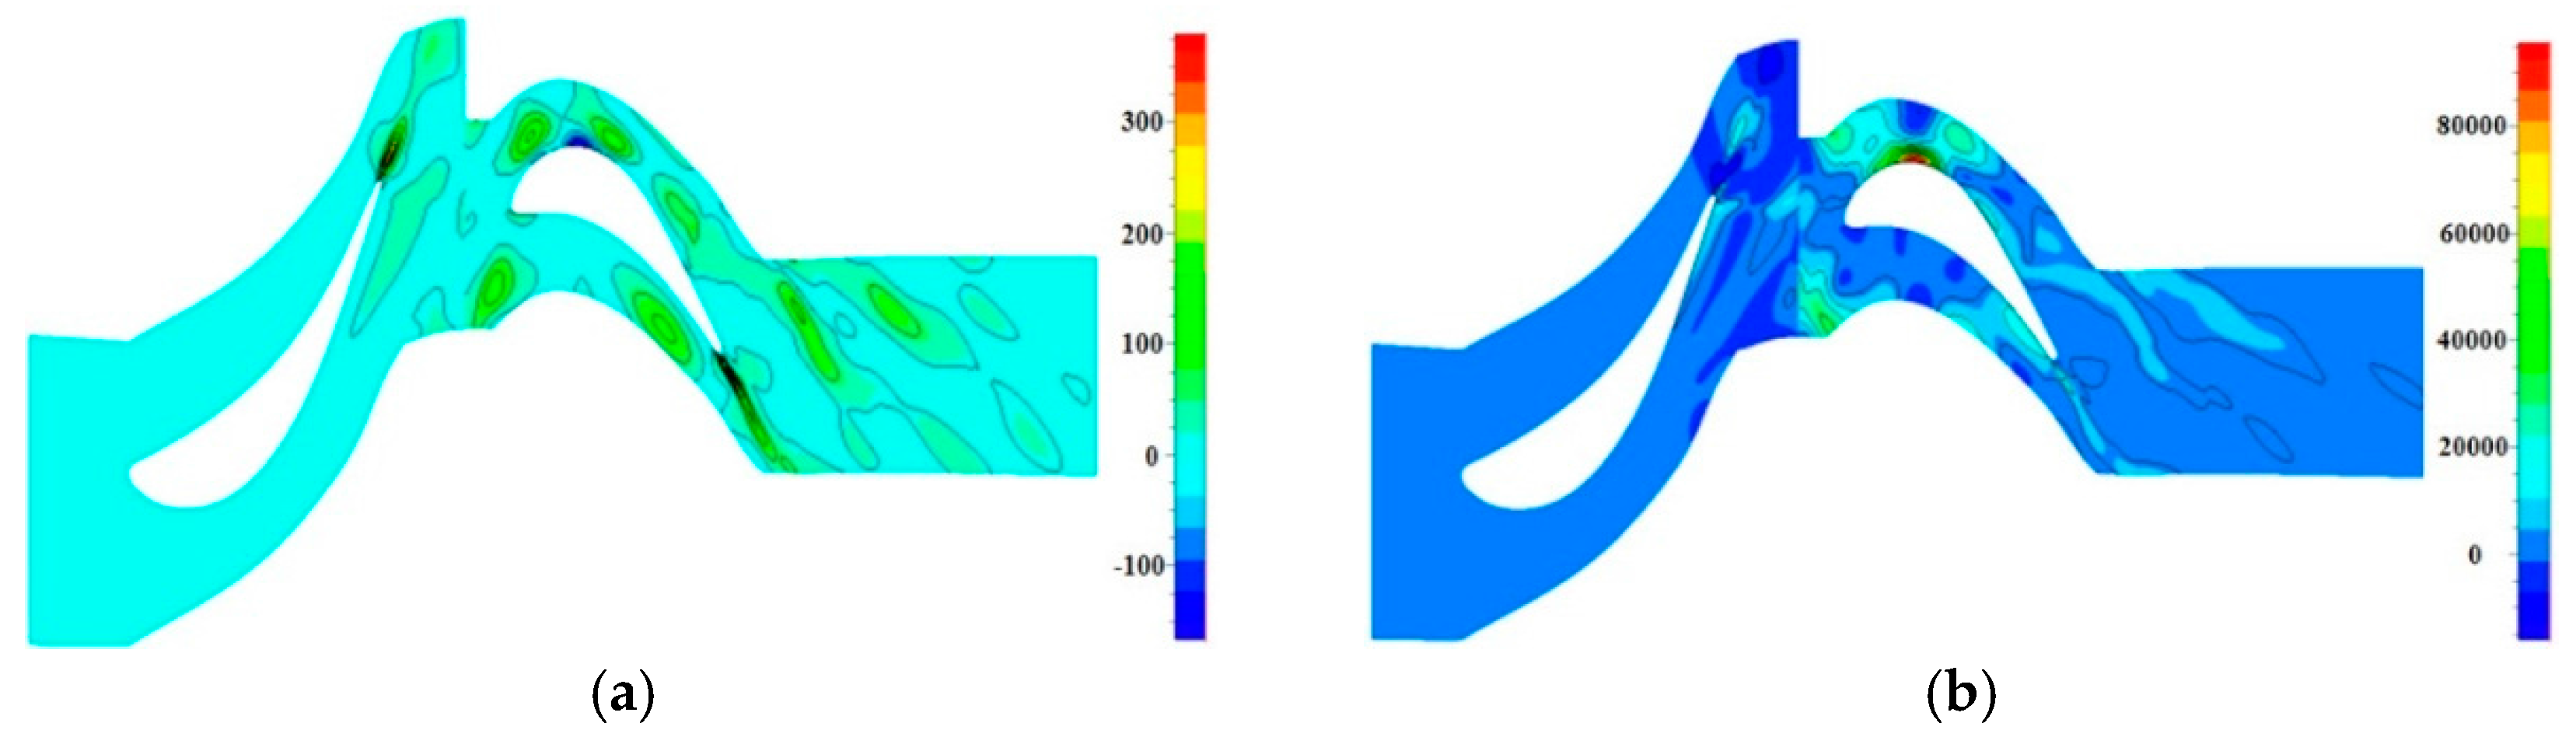
Figure 18.
Deterministic stress DCS_ZZ (a) and deterministic enthalpy DCH_Z (b) at 95% span.
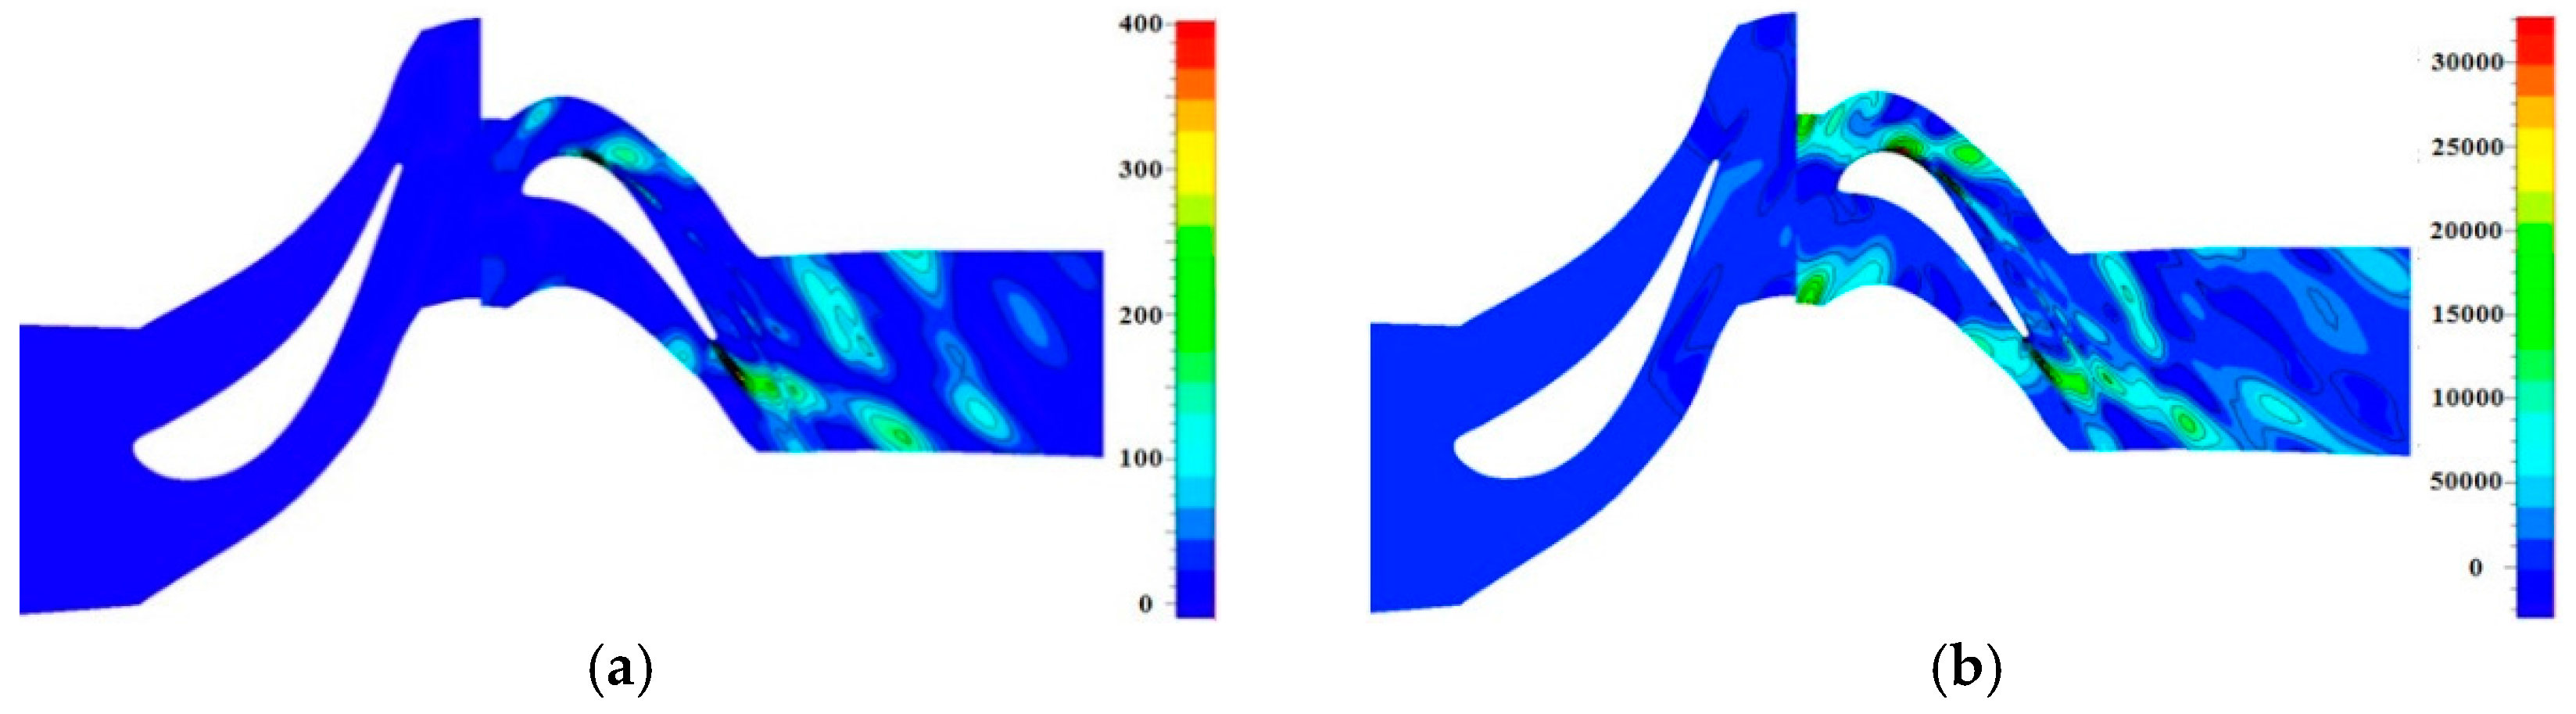
Figure 19.
One-dimensional distribution of deterministic terms (DCS-Left; DCH-right) along the flow direction.
Figure 19.
One-dimensional distribution of deterministic terms (DCS-Left; DCH-right) along the flow direction.

© 2018 by the authors. Licensee MDPI, Basel, Switzerland. This article is an open access article distributed under the terms and conditions of the Creative Commons Attribution (CC BY) license (http://creativecommons.org/licenses/by/4.0/).
Share and Cite
MDPI and ACS Style
Asghar, M.A.; Liu, Y.; Cui, J.; Lu, L. Investigation of Unsteady Flow Interactions in a Transonic High Pressure Turbine Using Nonlinear Harmonic Method. Energies 2018, 11, 342. https://doi.org/10.3390/en11020342
AMA Style
Asghar MA, Liu Y, Cui J, Lu L. Investigation of Unsteady Flow Interactions in a Transonic High Pressure Turbine Using Nonlinear Harmonic Method. Energies. 2018; 11(2):342. https://doi.org/10.3390/en11020342
Chicago/Turabian StyleAsghar, Muhammad Afzaal, Yangwei Liu, Jiahuan Cui, and Lipeng Lu. 2018. "Investigation of Unsteady Flow Interactions in a Transonic High Pressure Turbine Using Nonlinear Harmonic Method" Energies 11, no. 2: 342. https://doi.org/10.3390/en11020342
Note that from the first issue of 2016, this journal uses article numbers instead of page numbers. See further details here.