1. Introduction
Shale gas has become an important source of natural gas. Successful shale gas extraction requires accurate and detailed characterization of shale reservoir properties. Permeability, porosity, and elastic properties of shale reservoir rocks are critical parameters that affect the fluid flow and rock deformation in shale reservoirs. These parameters are stress sensitive, as their values can vary significantly with in-situ stress changes and consequently affect the fluid flow and geomechanics effects in shale [
1,
2,
3]. Therefore, it is critical to apply adequate techniques to the study of effects of stress sensitivity in shale rocks. Specifically, experimental analysis and mathematical models are often used to study stress sensitive effects.
Experimental studies on shale cores provide correlations between rock property changes and stresses changes. Based on experiments, many correlations between permeability, porosity, rock elastic properties, pore structures, anisotropy, stress, and pore pressure were established, and some of the correlations were used to validate theoretically proposed mathematical functions that depict property changes in stress sensitive shale rocks [
1,
2,
3,
4,
5,
6,
7,
8,
9,
10,
11,
12,
13]. These experimental results help to establish validated correlations describing shale rock stress sensitivity, and help to improve the accuracy and reliability of theoretically proposed analytical models. However, in these studies, the analytical solutions usually ignore the volume of the analyzed sample and treat the sample as a point. These solutions assume that properties are uniformly distributed in the analyzed volume, which limits the studies’ capability of addressing spatial characteristics of shale rock stress sensitivity. Besides, exact analytical solutions for nonlinear behaviors in fluid flow and geomechanics problems are not available, while nonlinearity (e.g., nonlinear elasticity and nonlinear shale gas flow behaviors) is an important effect that cannot be neglected in flow and geomechanics problems, as proved in many studies [
7,
14,
15,
16].
Many studies based on numerical models were also carried out to study the stress sensitivity in reservoir rocks. As a complement to analytical approaches, numerical models are known for their capability of handling complex temporal and spatial evolutions of reservoir characteristics, as numerical methods can efficiently address the heterogeneity in space and the nonlinear behaviors of flow and geomechanics problems [
17,
18]. In the study of stress sensitivity related problems, the involved numerical simulators usually implement the coupling between the fluid flow problem and the geomechanics problem. Wu et al. incorporated an analytical correlation into their numerical simulator coupling flow and geomechanics problems to model the stress distribution in a field-scale problem considering stress sensitive reservoir rock properties [
17]. This lab-validated analytical correlation represents the stress sensitive permeability hysteresis curve depicting permeability changes due to stress changes. Cao et al. also used a coupled flow and geomechanics model to study the effects of stress sensitivity on shale permeability [
18]. The stress sensitive permeability was incorporated in their model using a lab-validated correlation. An et al. used a coupled flow and geomechanics simulator to test the effect of stress-dependent permeability on hydrocarbon production in organic-rich shale reservoirs [
19]. They indicated that the selection of the correlation for the stress-dependent permeability significantly affects the field production performance. Shovkun and Espinoza applied an empirical correlation between horizontal permeability, compressibility, and stress to their coupled flow-geomechanics simulator for shale reservoir, and pointed out that the degree of the permeability alteration due to its stress sensitivity varies with location in the reservoir: near-well locations have stronger stress changes due to production while far-field locations have smaller stress changes due to production [
20]. While these researches provide insights in numerical investigations of stress sensitive reservoir rocks, limitations of these previous numerical studies are observed. In An et al. [
19] and Shovkun and Espinoza [
20], the numerical methods for the geomechanics modeling only consider linear elasticity, implying that these numerical methods could not describe the nonlinear elastic behaviors as rocks are being compacted and consolidated due to in-situ stresses changes and hydrocarbon depletion in the reservoir. The correlations between rock deformation and stress sensitive rock properties were theoretically derived and they lack the validation with field/experimental results, indicating that their methods work for theoretical analysis but have limitations when it comes to realistic shale rocks [
19,
20].
Based on the review of previous works, it is meaningful to combine the numerical modeling with lab-validated analytical correlations so that the stress sensitive shale rock properties can be properly addressed. In addition, it is important to take nonlinear elasticity into account to improve the effectiveness of the modeling study. Thus, the mechanism of gas production in realistic shale gas reservoirs can be better studied.
In this work, an improved coupled flow and geomechanics model considering lab-validated nonlinear elasticity is proposed in a case study. The lab validation is based on laboratory experiments on shale samples taken from the realistic shale gas play in the Lower Silurian Longmaxi Formation in Southwest China. Using this model, the characteristics of spatial distribution of stress and stress sensitive rock properties are analyzed. Also, quantification of the effect of considering nonlinear elasticity on numerical results is presented. In the paper, first, the target shale gas reservoir in the Lower Silurian Longmaxi Formation and its core samples are described. The stress sensitive permeability hysteresis curves obtained from lab measurements are also presented. Second, the finite element based numerical model that couples fluid flow and geomechanics is introduced, and nonlinear elasticity is incorporated in the numerical model based on elastic modulus alteration due to nonlinear rock consolidation. The incorporation of nonlinear elasticity is validated with the experimental results. Finally, using the calibrated numerical model, sensitivity analyses for stress, permeability, pore pressure, and porosity are conducted to improve the understanding of stress sensitivity in the shale gas play of the Lower Silurian Longmaxi Formation. Results from numerical modeling only considering linear elasticity are compared with numerical results considering nonlinear elasticity so that the effect of nonlinear elasticity is quantified.
4. Numerical Study
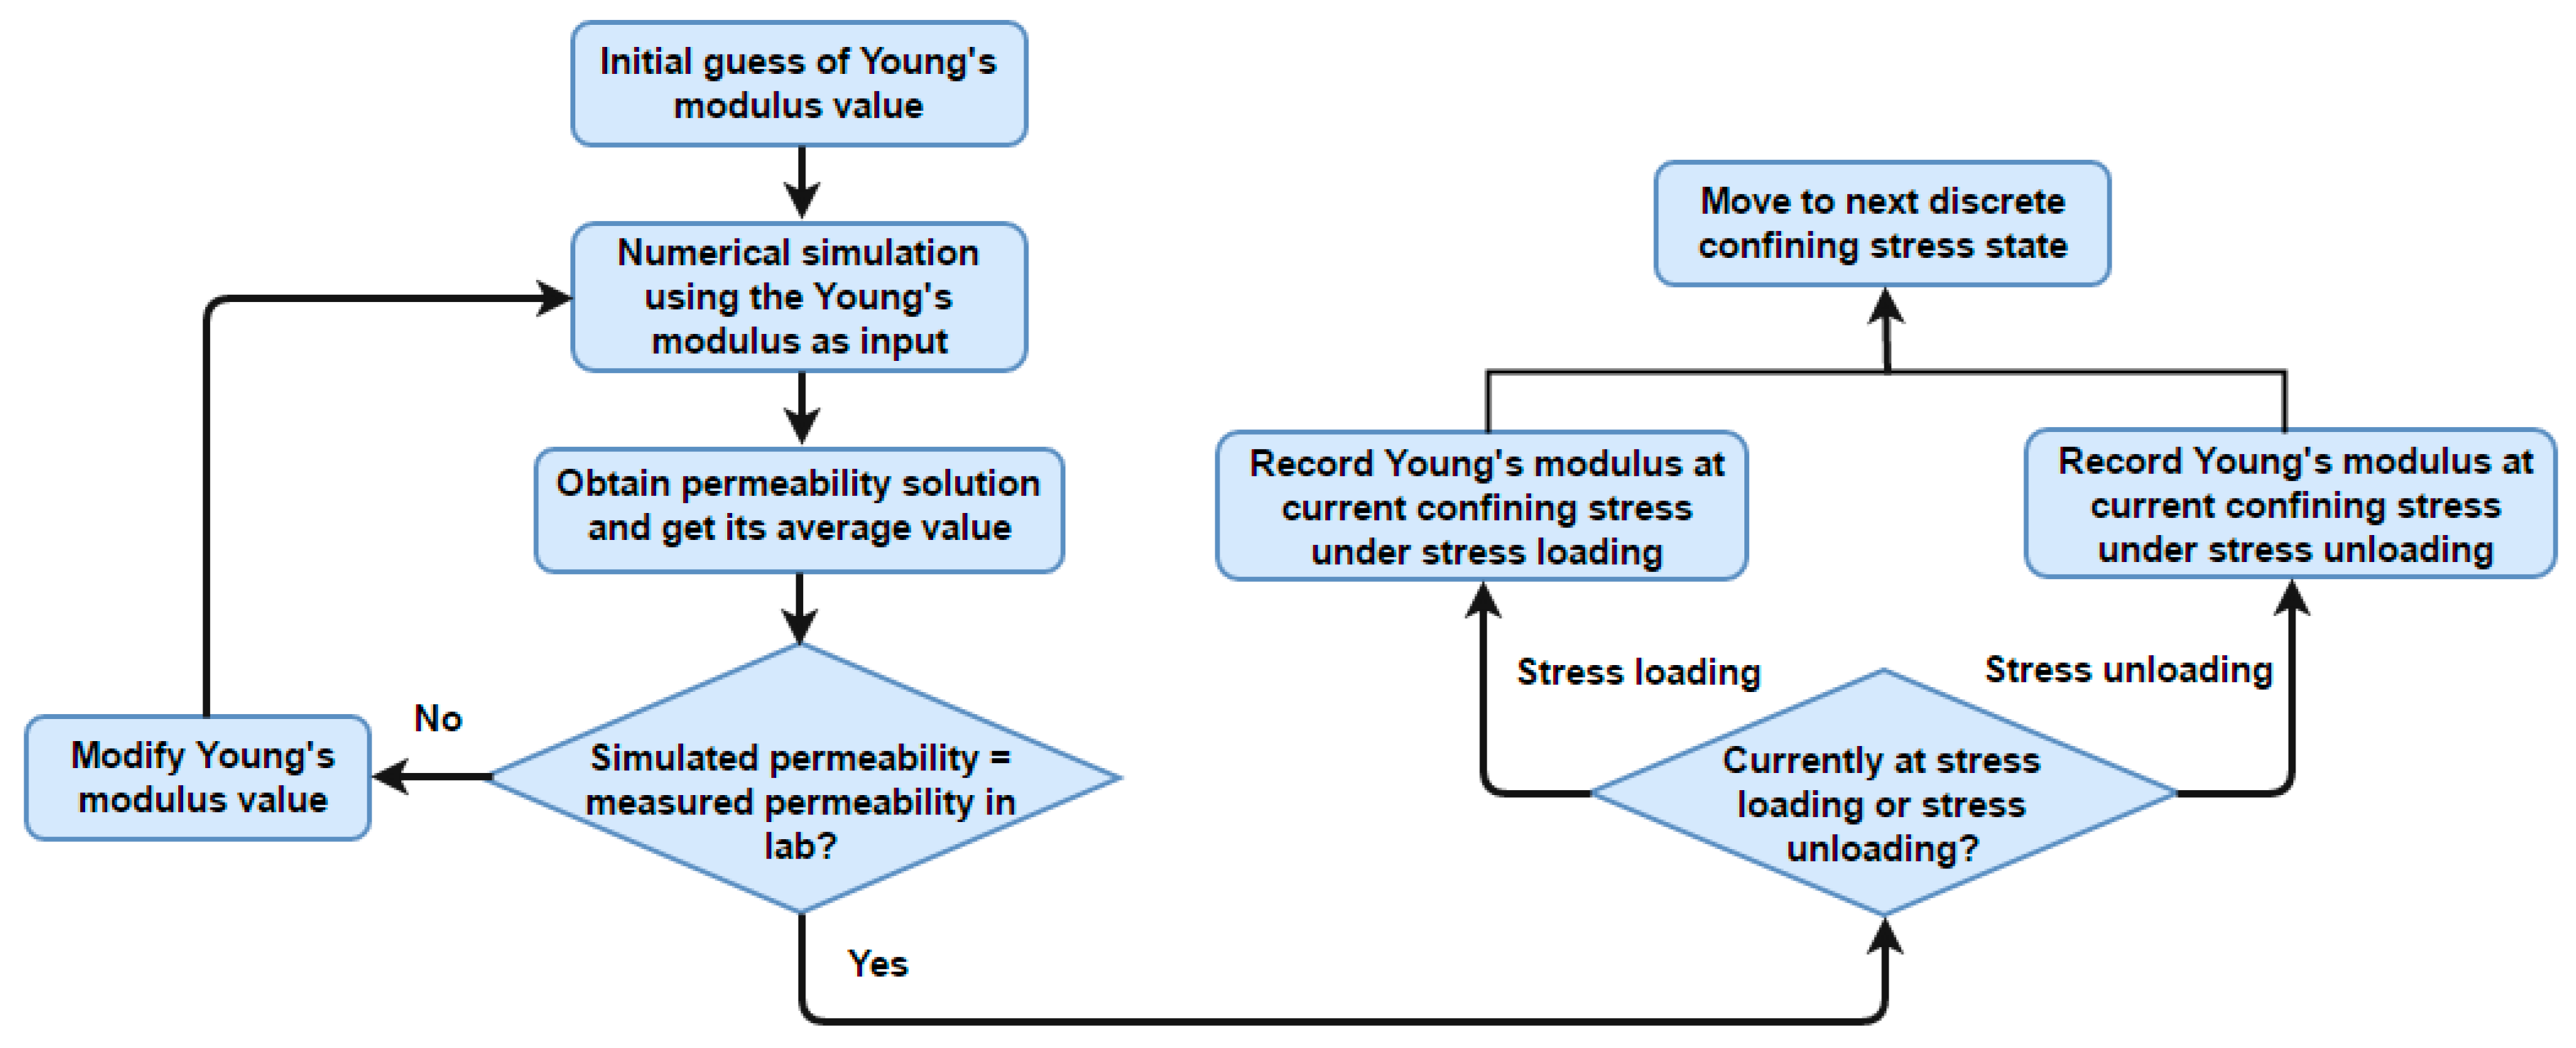
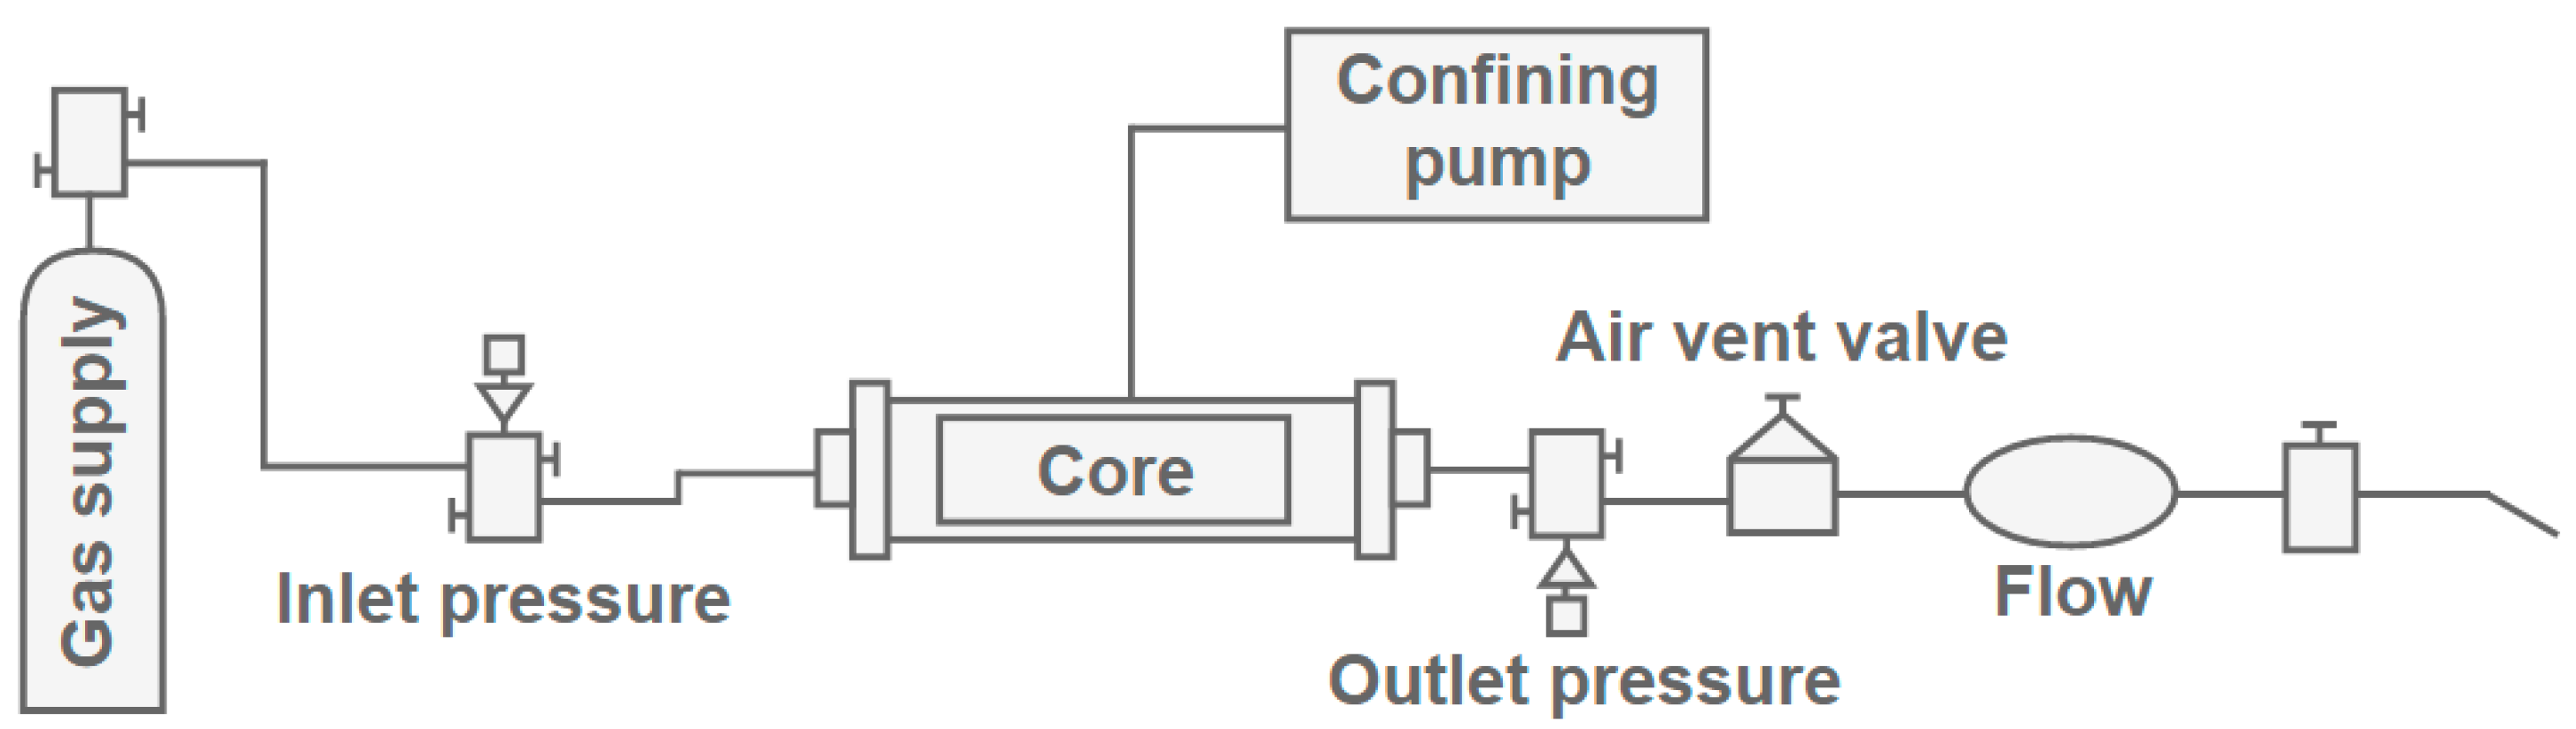
Using the improved numerical model considering nonlinear elasticity, a set of numerical results is obtained for detailed characterization of pore pressure, permeability, and porosity within the analyzed core volume to study the shale stress sensitivity. The numerical simulation models the stress and pressure evolution in the core plugs flooded as
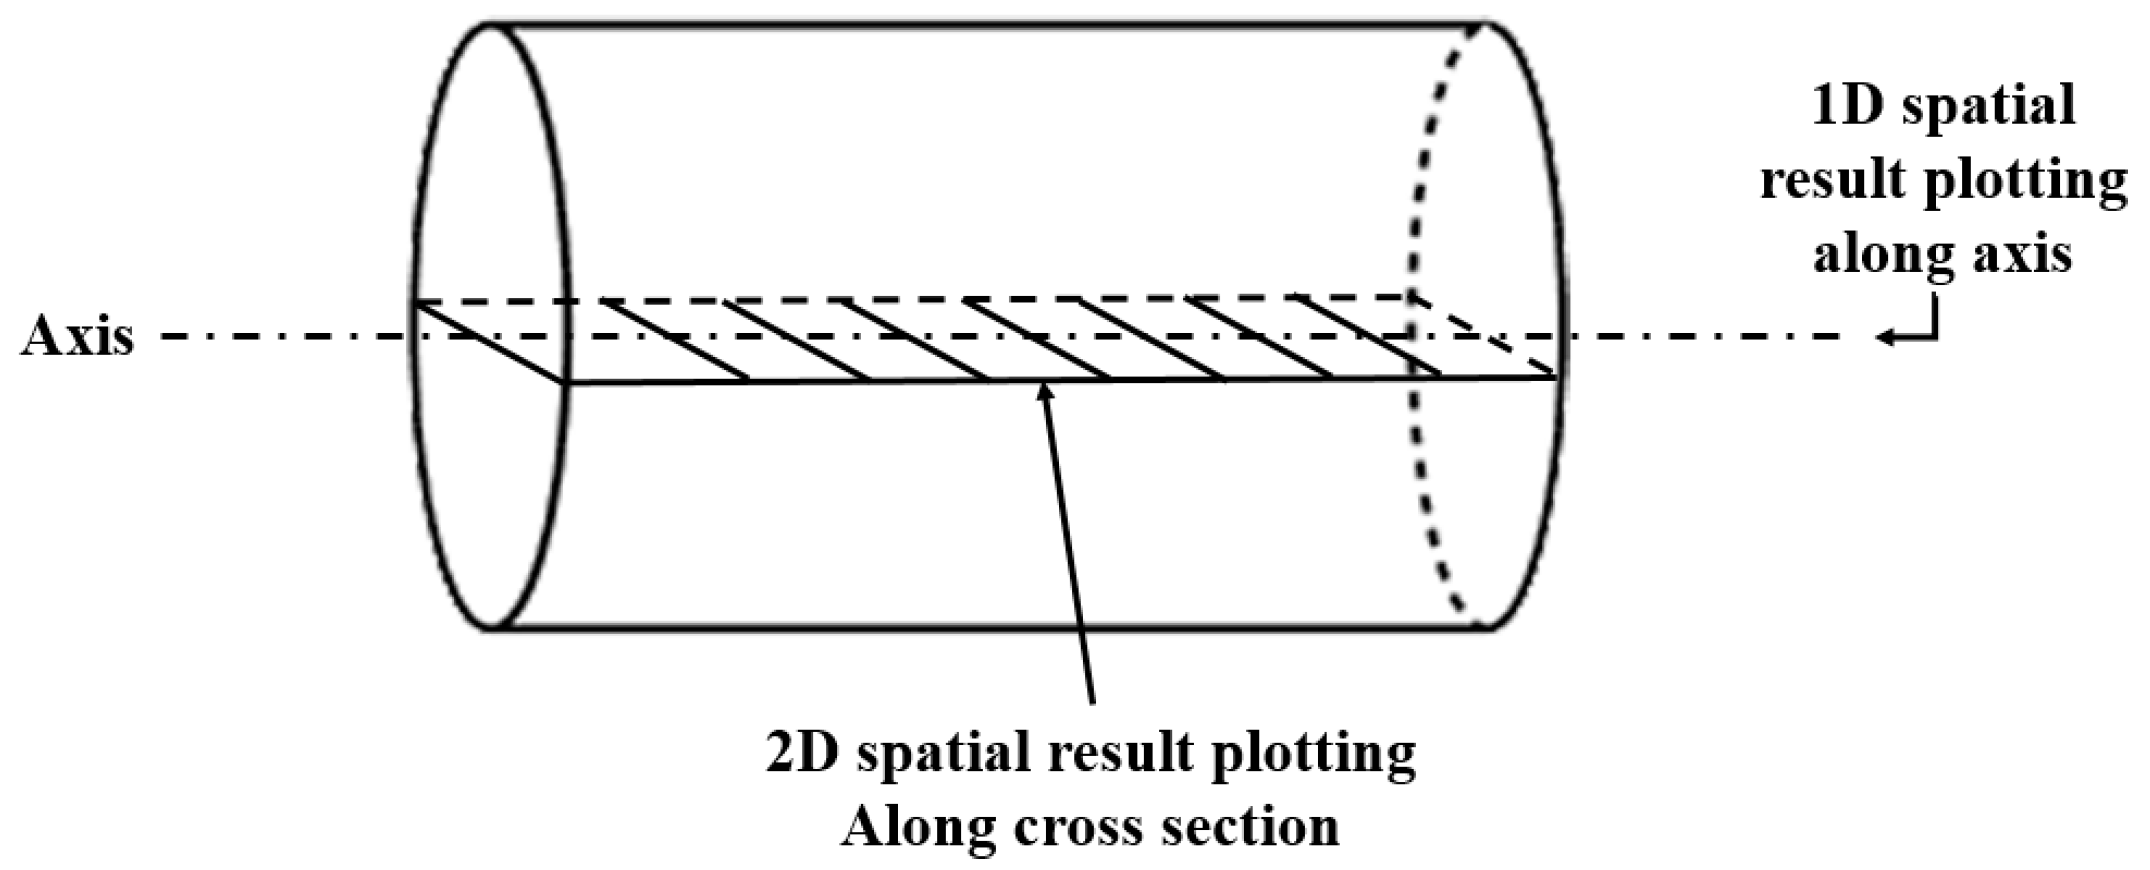
Figure 1. The 1D and 2D spatial distributions of the results are reported as in
Figure 6. Numerical simulation is conducted for all five shale samples.
4.1. Quantification of Effects of Nonlinear Elasticity
Numerical results obtained by the improved model are compared with numerical results simulated by the basic model [
22] which only considers linear elasticity so that effects of nonlinear elasticity can be quantified.
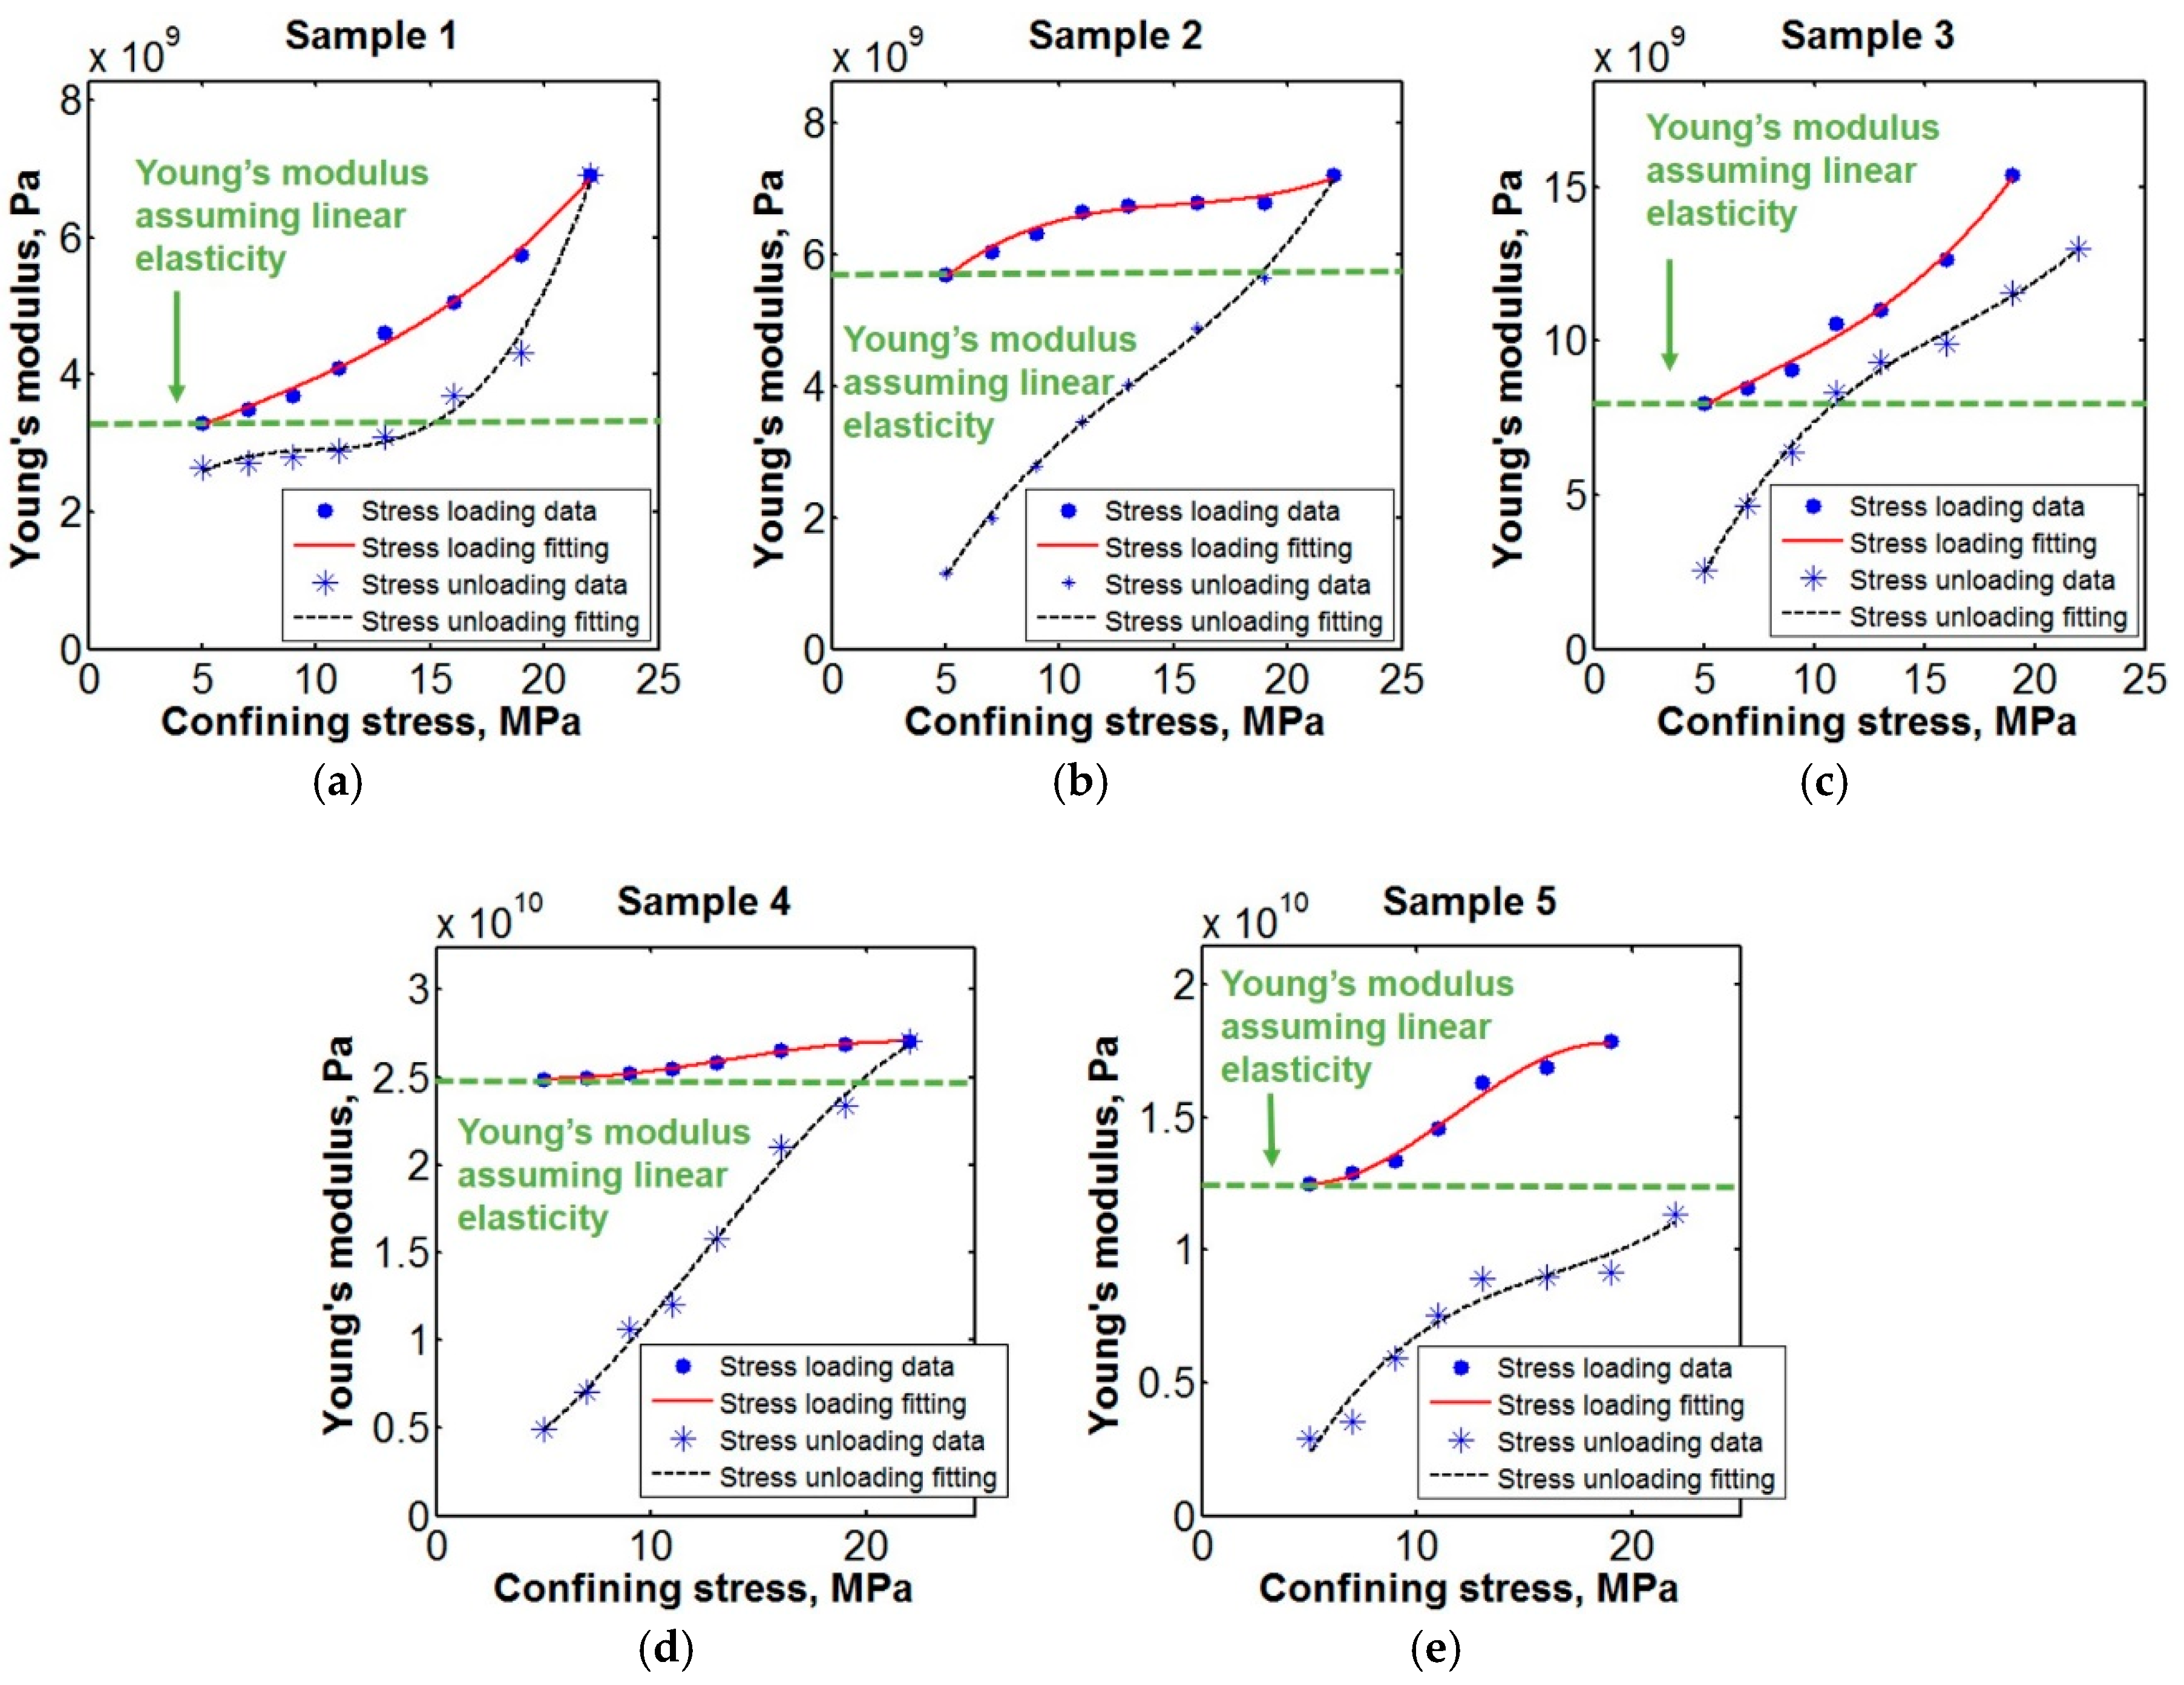
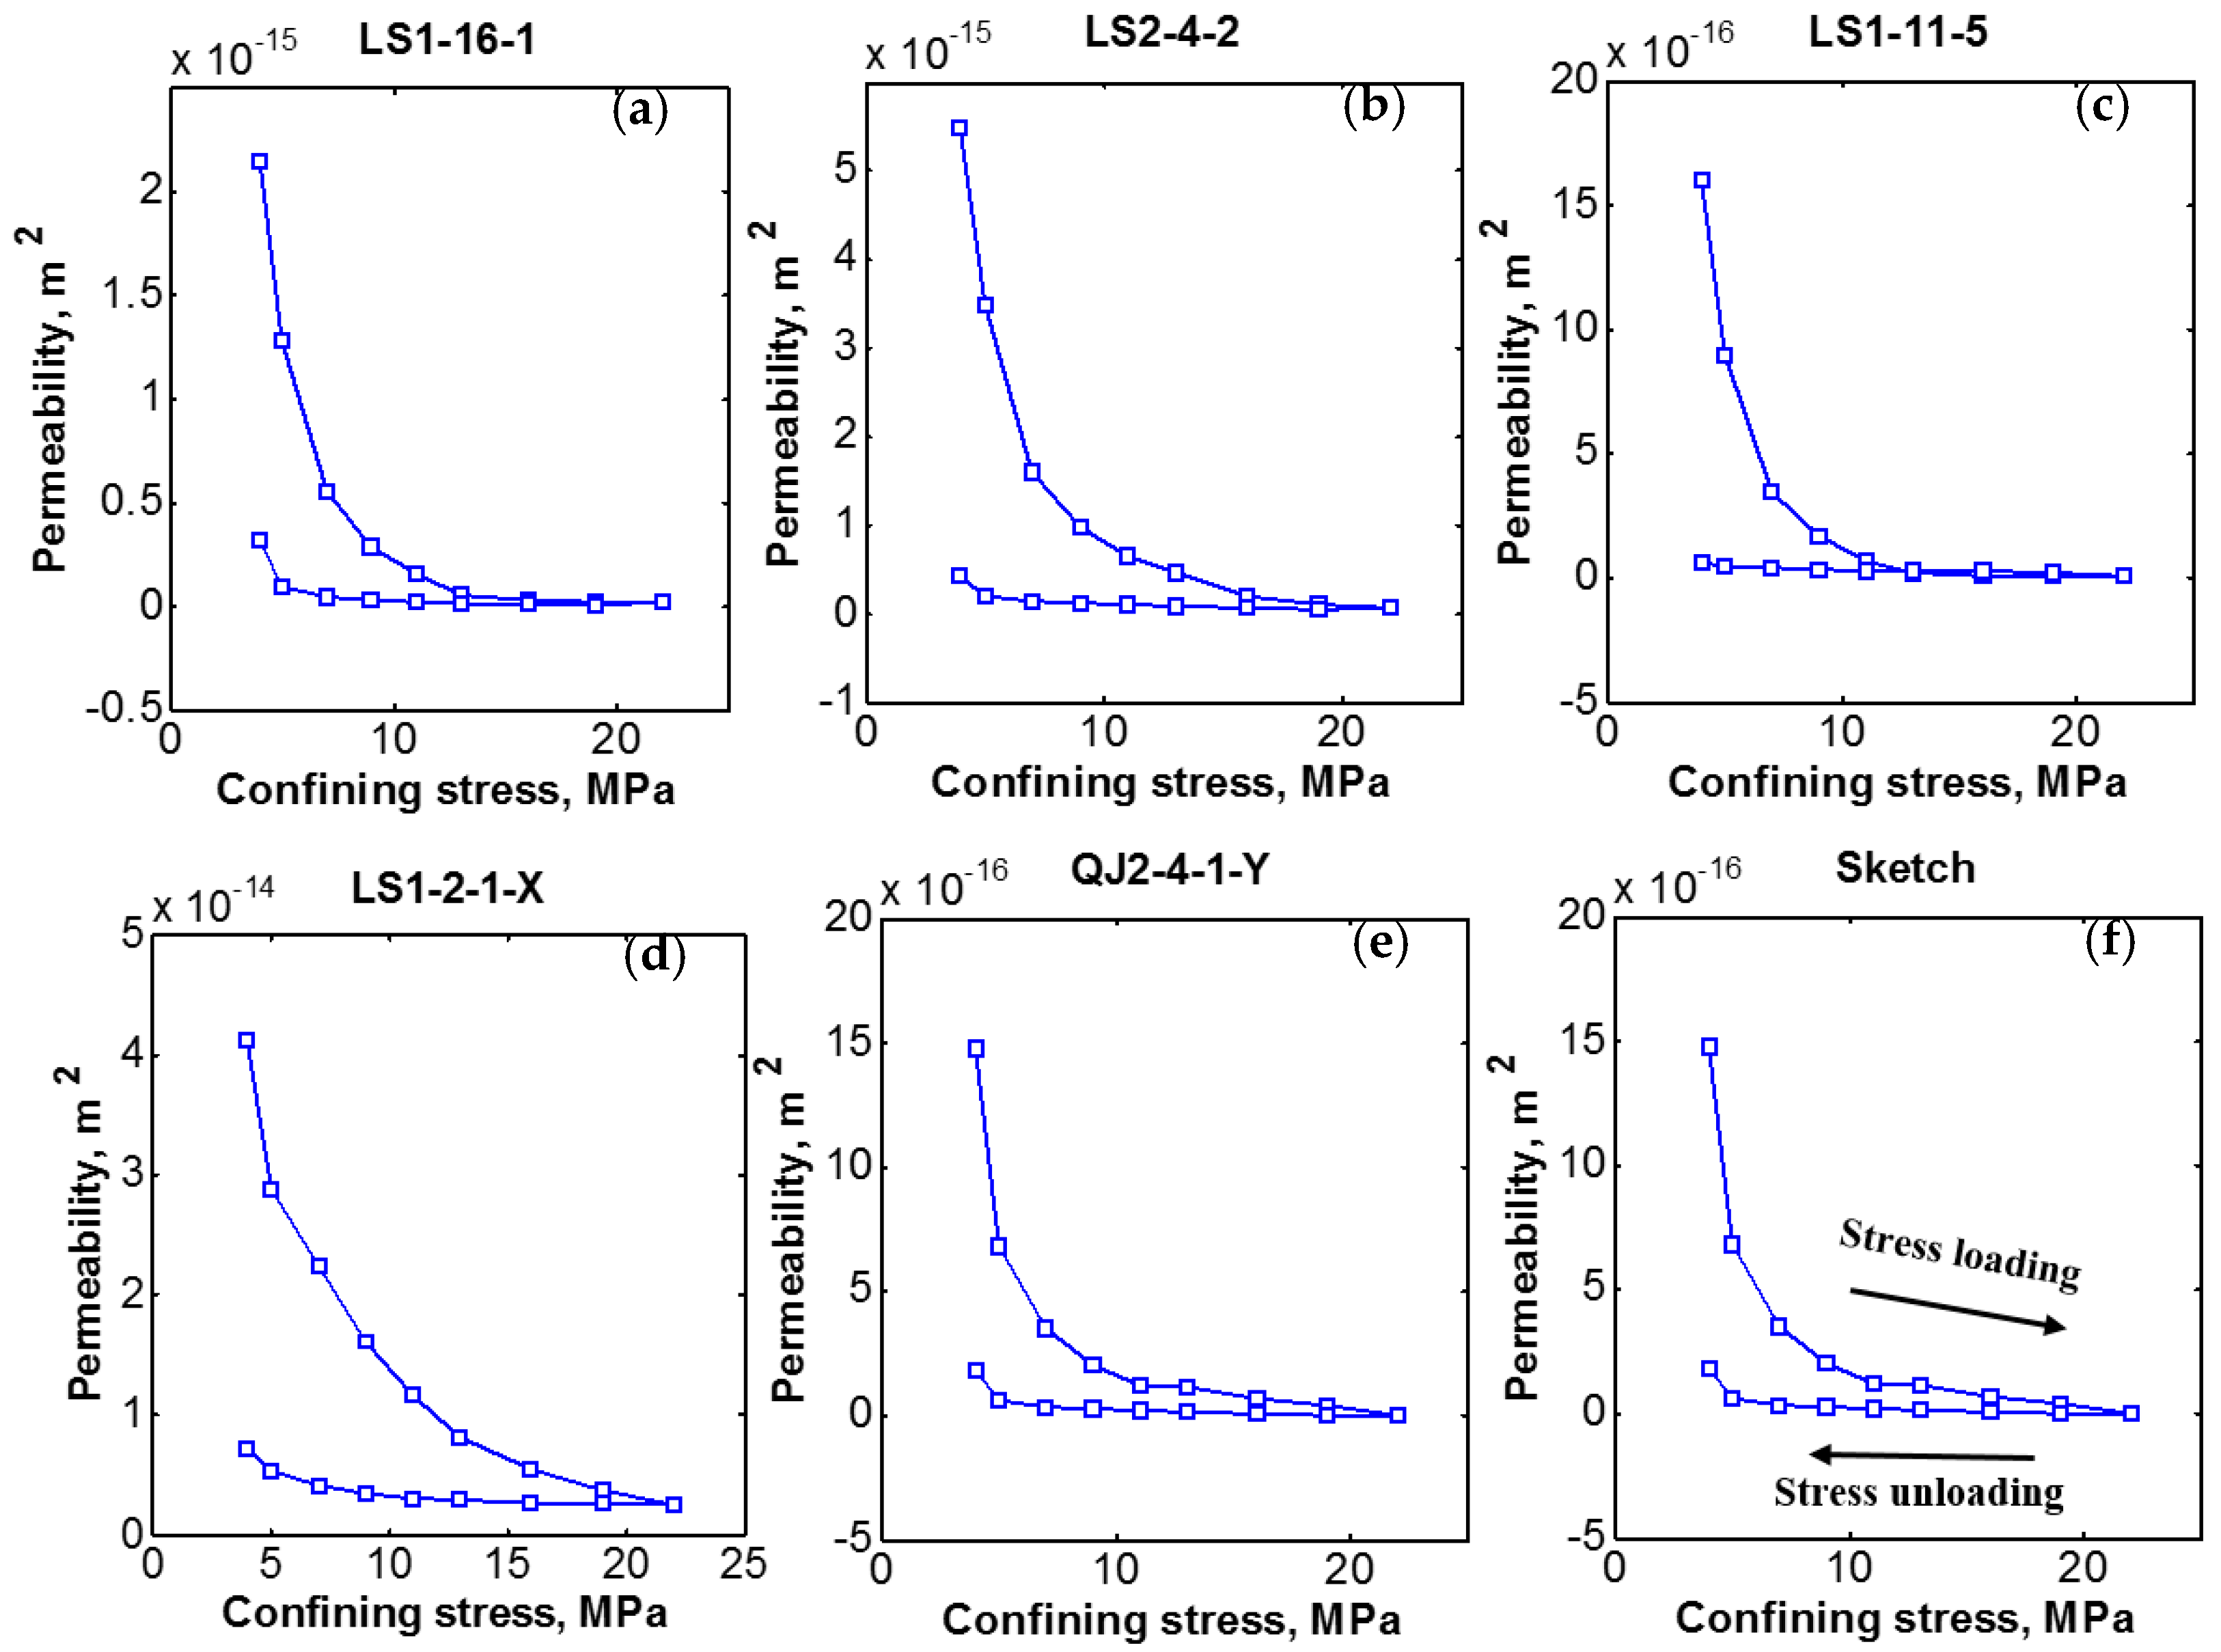
In hydrocarbon production, effective stress generally increases as the hydrocarbon in the pores are depleted, and initial reservoir condition before hydrocarbon depletion has the lowest effective stress. In this study, as shown by flat dashed lines in
Figure 5, the confining stress of 5 MPa at the beginning of the stress loading curve is used to represent the intact/initial shale reservoir condition. In the reference case, the Young’s modulus at this initial state is used in the modeling that only considers linear elasticity, and this value is not changing with confining stress changes.
In contrast, the improved modeling that considers nonlinear elasticity has a changing Young’s modulus as confining stress is altered. The increase of confining stress is used to represent the increase of effective stress caused by shale gas production in the reservoir. Several confining stress values in the stress loading process (13, 16 and 19 MPa) are used for the numerical modeling that considers nonlinear elasticity. Young’s modulus values used in this quantification study are in
Table 3, corresponding to the calibrated correlations in Equation (13). Numerical simulations of both the reference linear elasticity scenarios and the nonlinear elasticity scenarios are carried out. The spatial distribution results averaged over the 1D axis as in
Figure 6 are shown in
Table 4,
Table 5 and
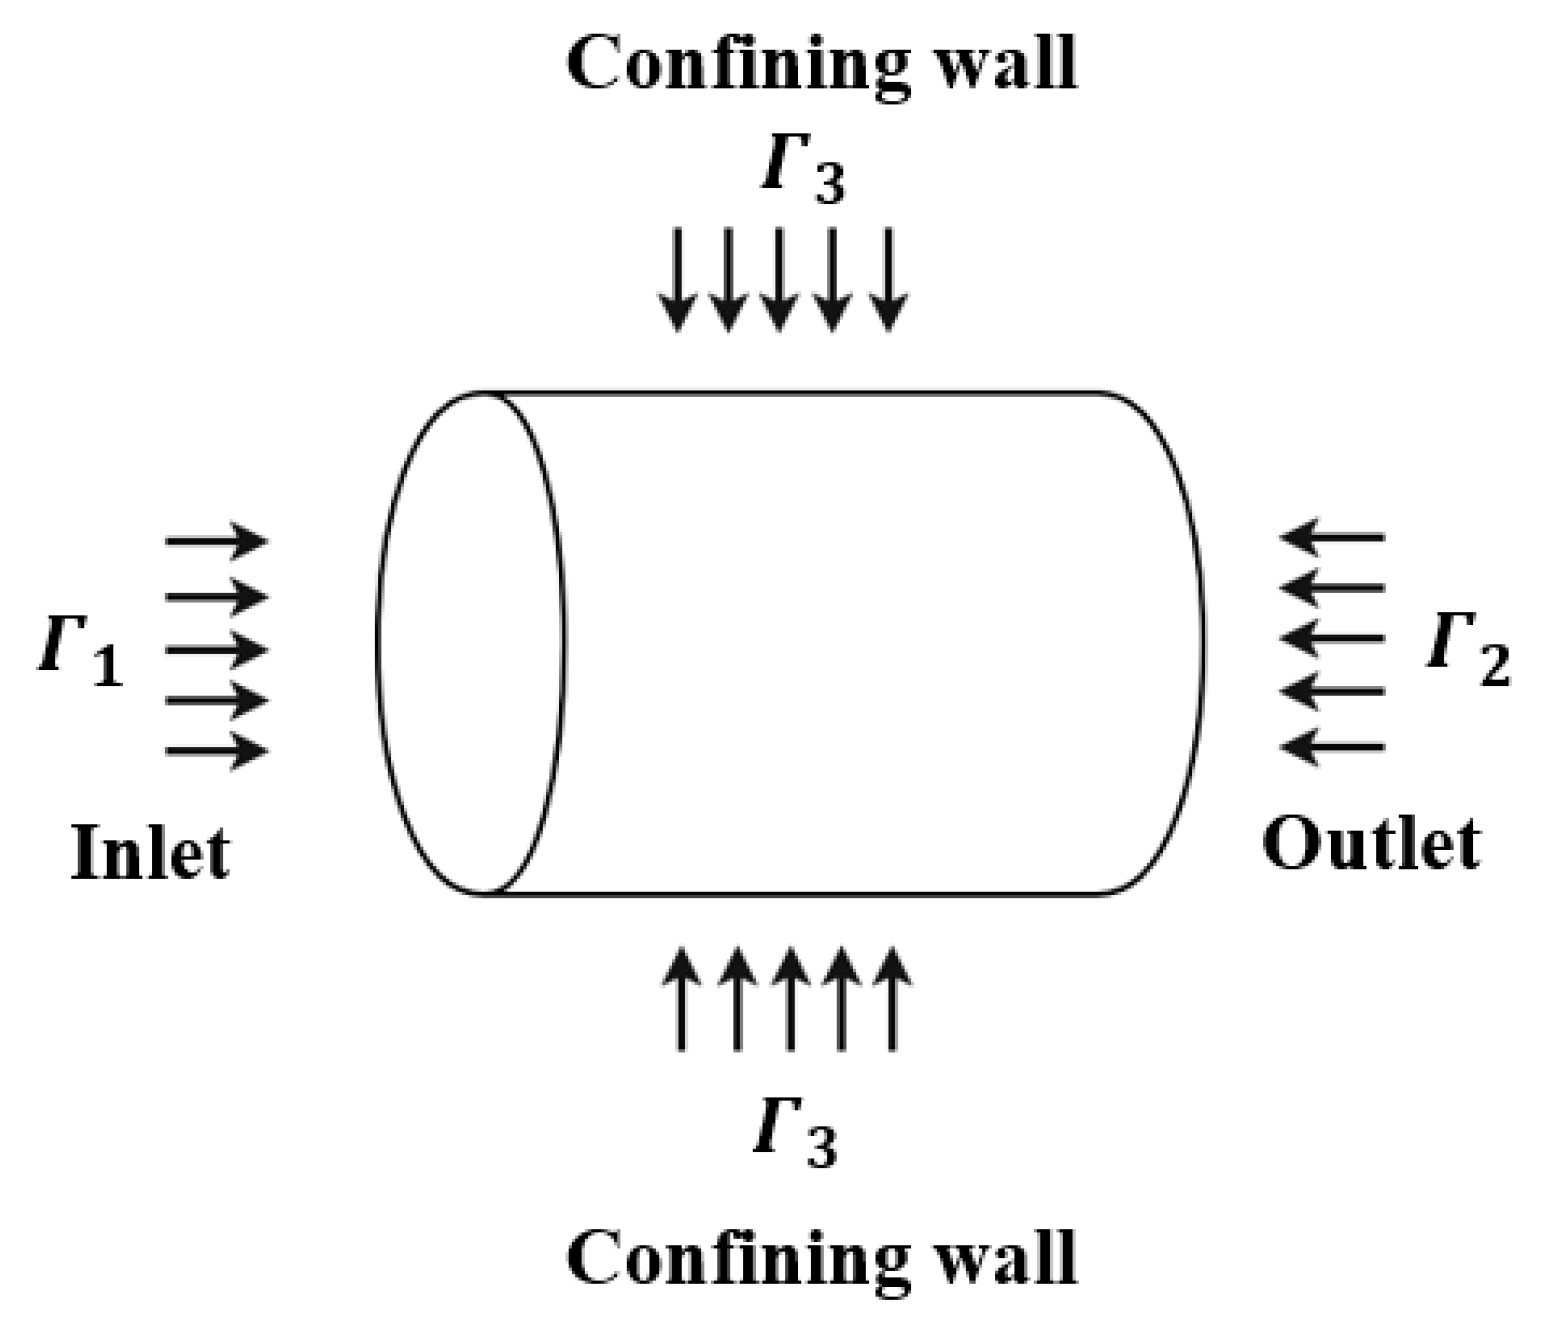
Table 6 with values averaged over the 1D profiles. Additionally, following the 2D profiling scheme,
Figure 7 and
Figure 8 are plotted. The reported results are average permeability, average porosity, average minimum principal stress, and average pressure. The numerical results for stress presented in this section are the effective stress excluding pore pressure.
The difference between linear elasticity simulation results and nonlinear elasticity simulation results (Equation (14)) becomes larger as confining stress increases. This trend is observed for all results of , , , and , which indicates that, as effective stress caused by hydrocarbon depletion becomes larger during gas extraction, the effects of nonlinear elasticity on permeability of rock parameters and stress/pressure spatial evolution become more significant. This is because in the nonlinear elasticity model, the increment of Young’s modulus is caused by stress increase, and the increased Young’s modulus leads to greater stress magnitude in the analyzed volume. The stress then significantly affects values of the stress sensitive rock properties. However, in the linear elasticity model, the initial Young’s modulus is kept as constant and does not increase as stress increases, which leads to underestimated in-situ stress magnitudes.
In the results above, it is noted that the in-situ stress and pore pressure are altered as confining stress changes. In the stress loading process, as the confining stress increases, the stress increases and the pore pressure decreases. The decreasing pore pressure is due to the decreased porosity as shown in the numerical results: the increased confining stress leads to decreased pore volume which facilitates pore fluid depletion. The increased principal stress is because of the increased compression caused by the increased confining stress.
4.1.1. Effect of Nonlinear Elasticity on Permeability
The permeability presented in these numerical results are the corrected liquid permeability instead of the apparent permeability. Thus the value is generally smaller than the lab measured permeability data. Comparing with results from the linear elasticity model, consideration of nonlinear elasticity decreases the shale permeability value . This is because the Young’s modulus in the nonlinear elasticity model is increased due to confining stress increase, which leads to greater effective stress magnitudes. Greater in-situ stress indicates larger damage to permeability. In linear elasticity modeling, the overestimated permeability will lead to inaccurate modeling of shale gas production and largely decrease modeling effectiveness.
4.1.2. Effect of Nonlinear Elasticity on Effective Stress
Compared with linear elasticity model, consideration of nonlinear elasticity increases the effective stress within the analyzed volume. This is because Young’s modulus values are larger in the nonlinear elasticity model, resulting in greater stress simulation results.
This observation indicates that, as linear elasticity modeling does not consider the Young’s modulus increase due to stress increase, the assumption of linear elasticity leads to underestimated effective stress during the shale gas depletion process.
4.1.3. Ranking of Effects
Based on the differences in percentages, the effects of nonlinear elasticity on numerical results are ranked from the greatest to the smallest as permeability > stress > porosity > pore pressure. Regarding numerical results of all five samples with all three confining stresses (13 MPa, 16 MPa, and 19 MPa), the consideration of nonlinear elasticity can make the numerical result for permeability differ by one order of magnitude, with the difference ranging from 1.6 times (160.19% difference in sample LS1-2-1-X for 13 MPa
) to 53 times (5343.93% difference in sample LS2-4-2 for 19 MPa
). The consideration of nonlinear elasticity makes the numerical result for effective stress differ by 76% to 85%. The consideration of nonlinear elasticity makes the numerical result for porosity differ by 4% to 39%. The consideration of nonlinear elasticity makes the numerical result for pore pressure differ by 0.03% to 1.73%, which is very small:
4.2. Nonlinear Elasticity Modeling Results and Discussion
Numerical results based on the improved model considering nonlinear elasticity are discussed in this section. Core sample LS1-16-1 is specifically analyzed for profiles of numerical result distribution. The 1D and 2D characterizations indicate that the numerical model in this study can describe the heterogeneous rock characteristics in shale core samples, while the heterogeneity is usually neglected in analytical models.
4.2.1. Effective Stress
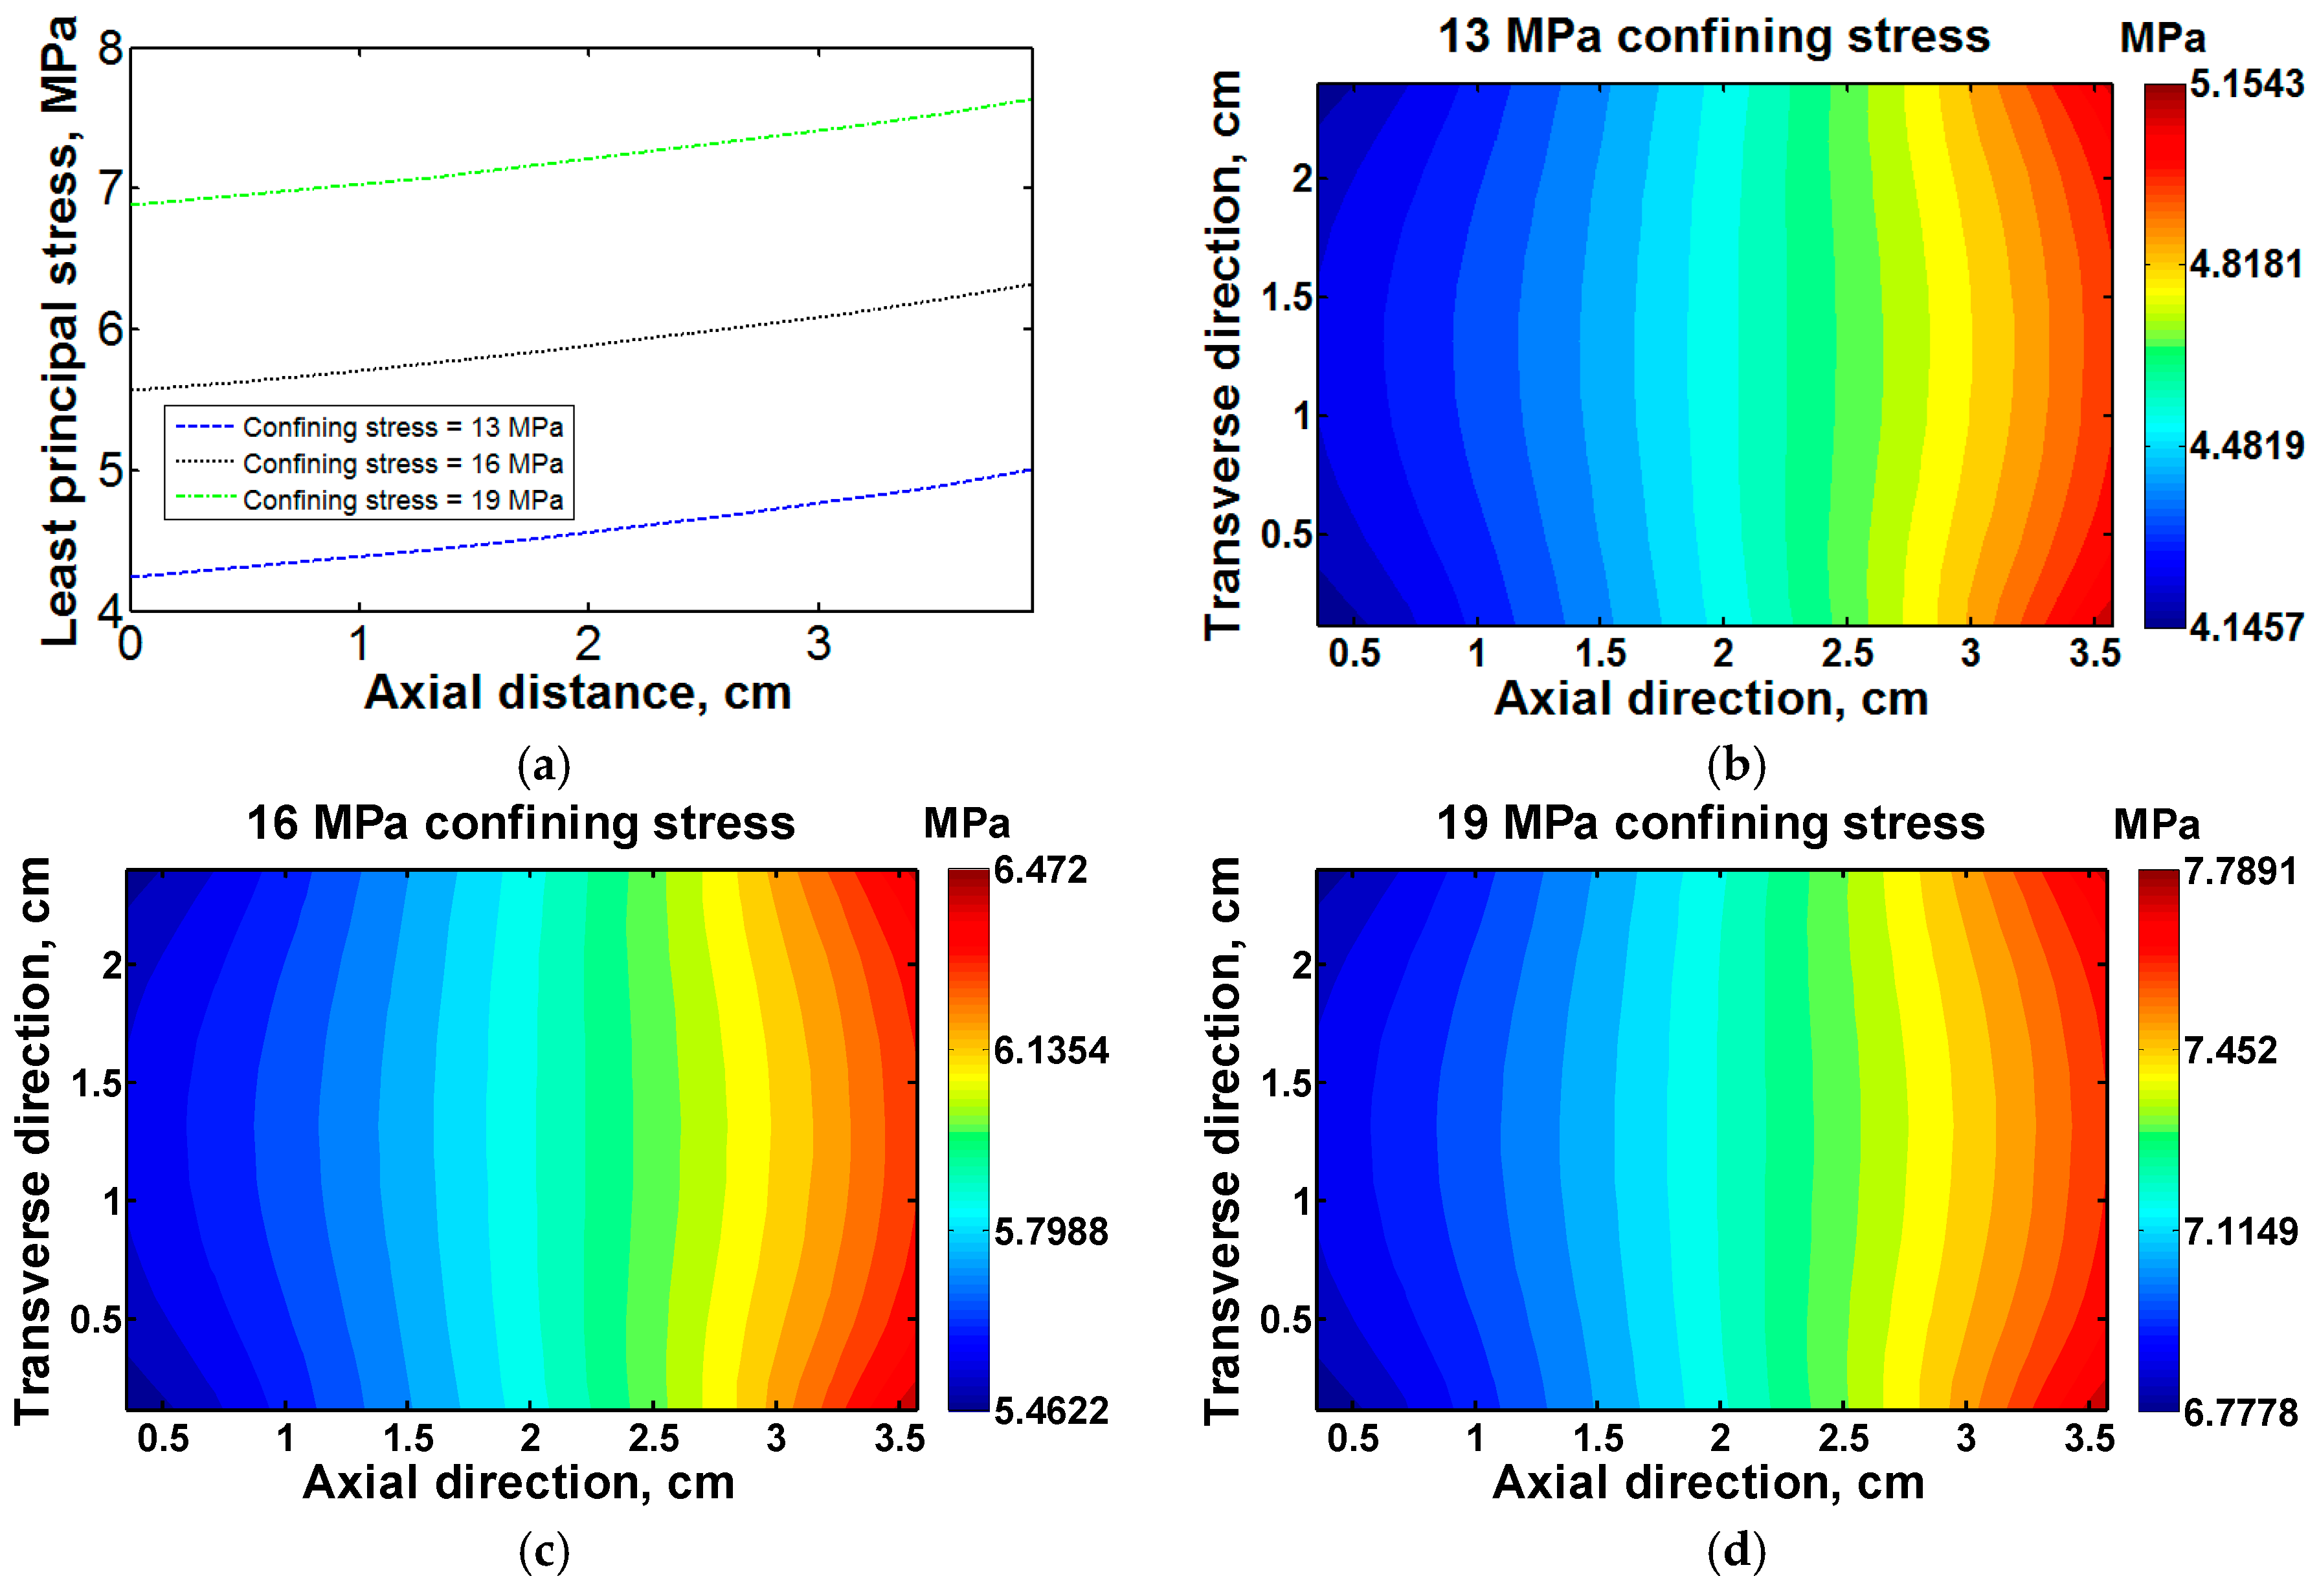
In
Figure 7 effective stress distribution exhibits non-uniformity along both the axial and transverse directions. The transverse non-uniformity is the least significant in the middle of the studied area at around 2.2 cm along the axial direction. The effective stress monotonically increases along the axial direction from the inlet on the left to the outlet on the right. This is because, before core flooding, the entire volume has the initial pressure equal to inlet pressure. In core flooding, the pressure depletion near the outlet results in large rock deformation and large stress. Besides, the overall effective stress increases with confining stress increase.
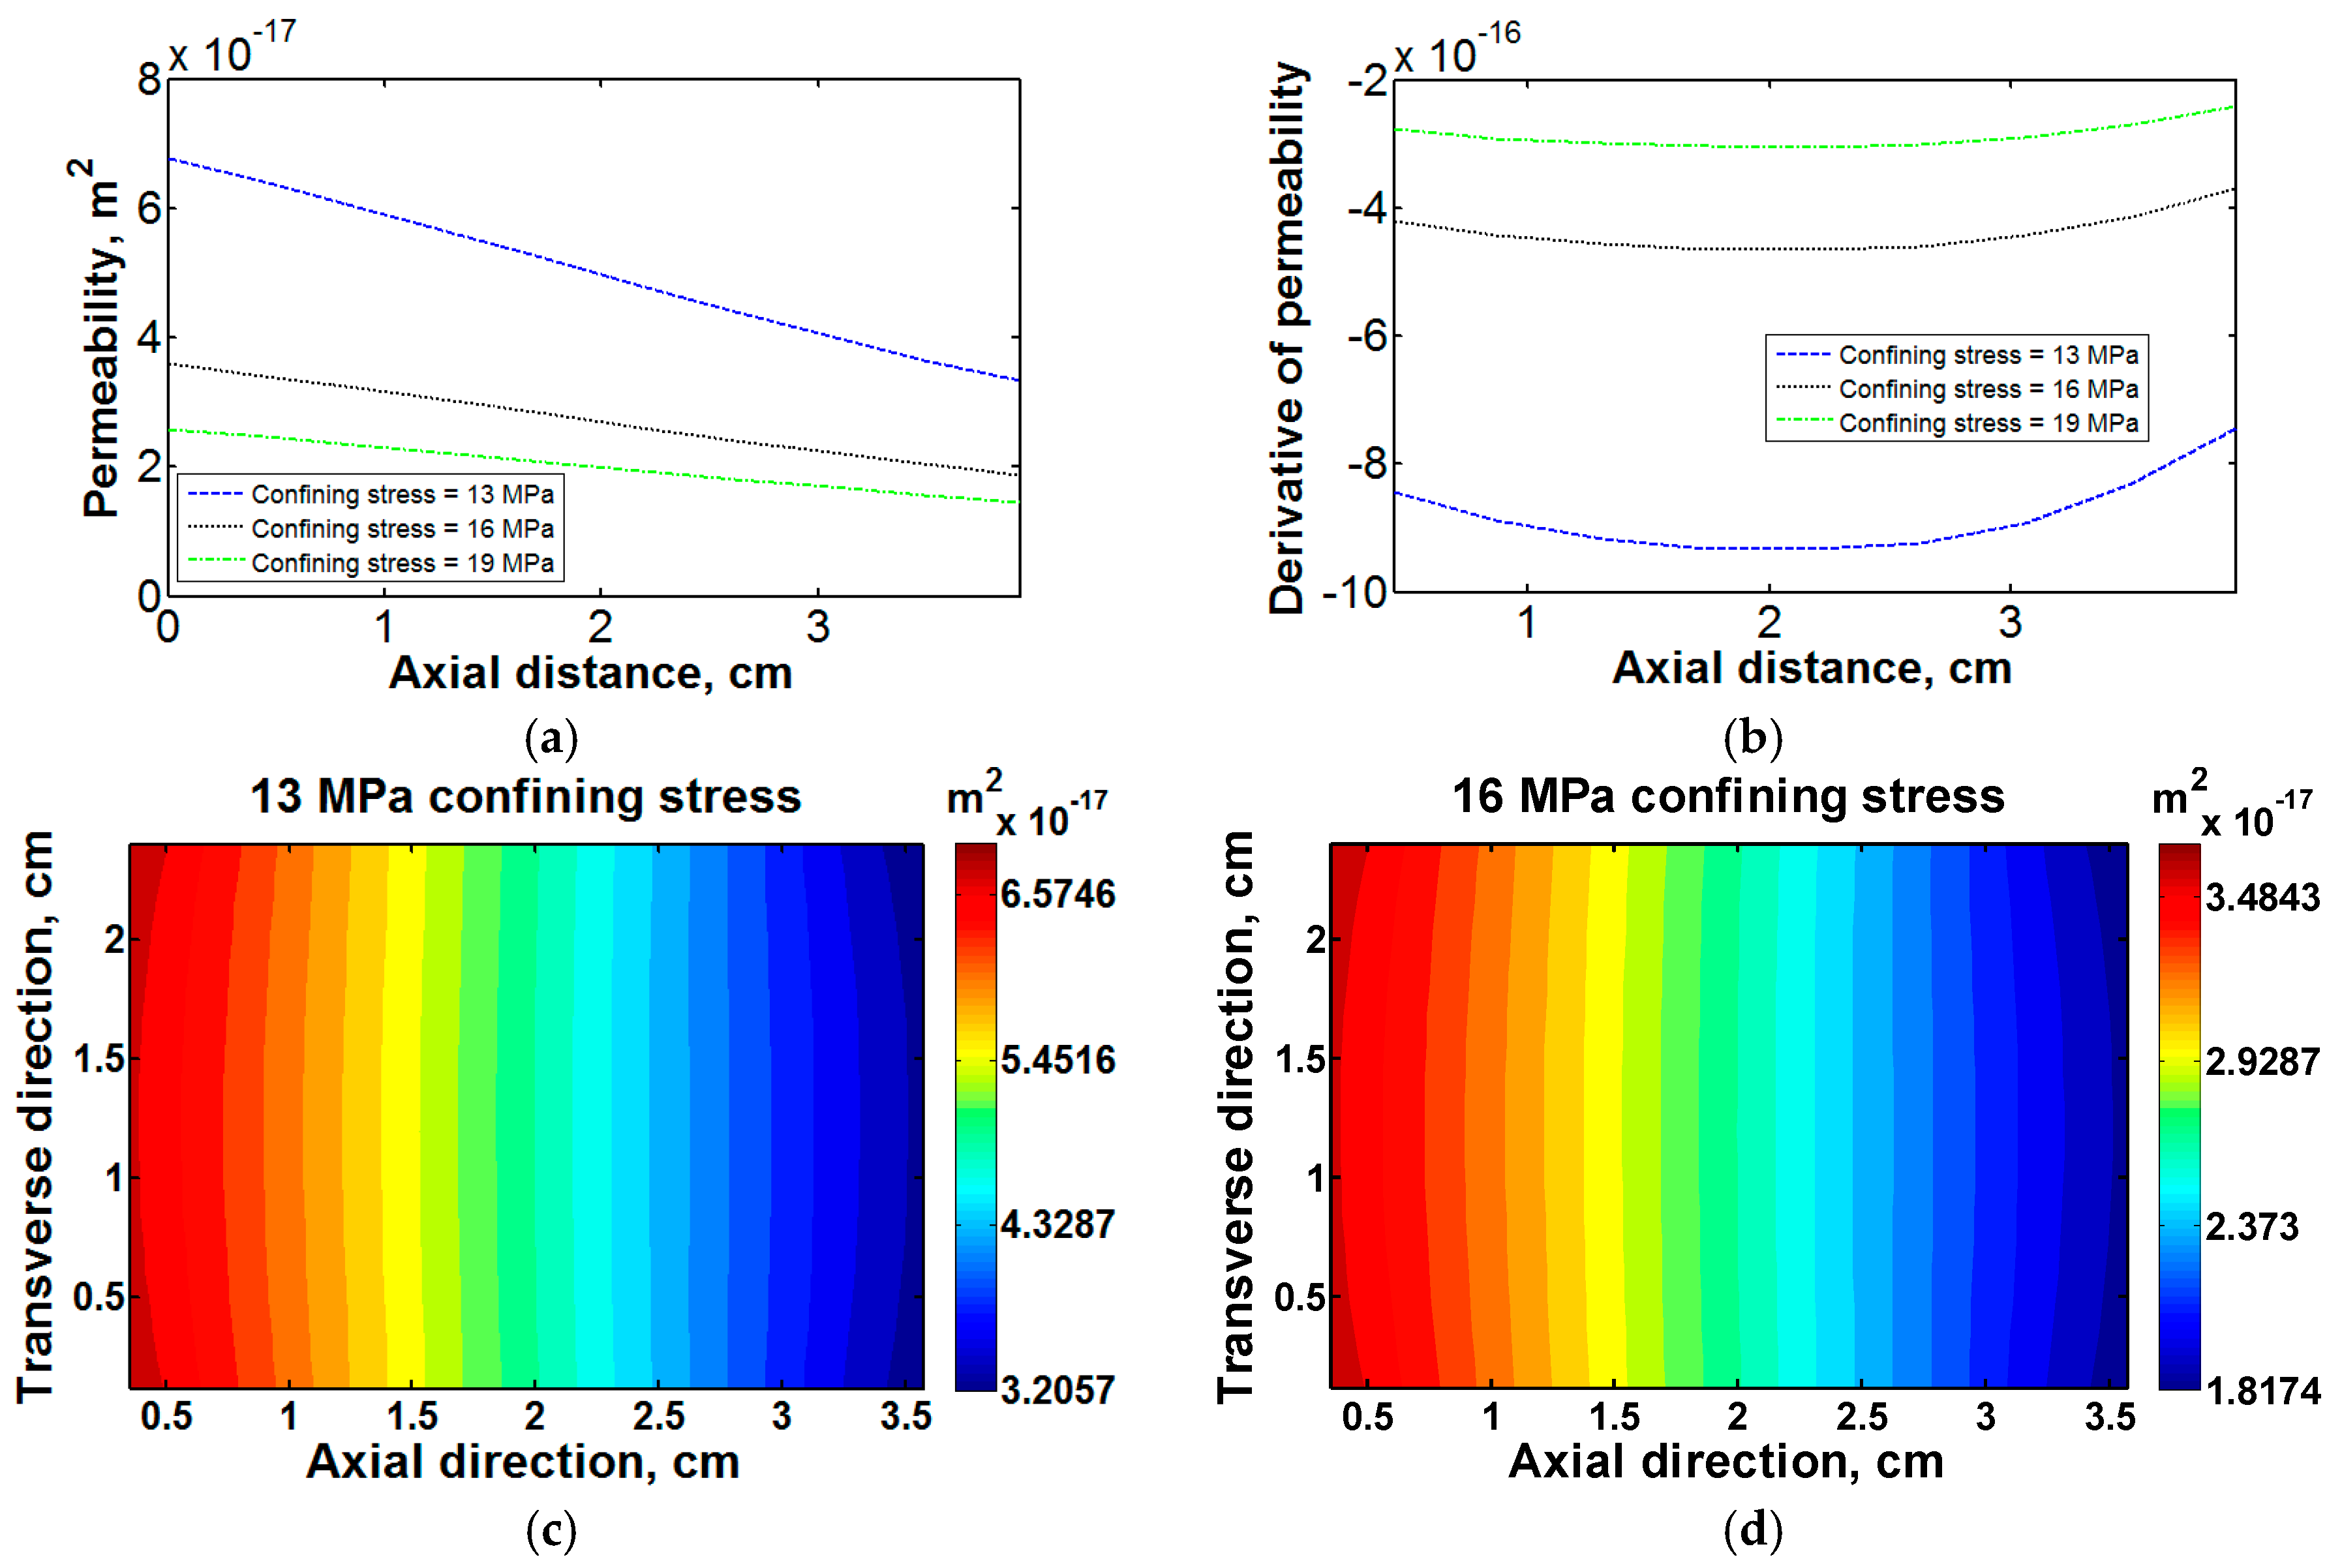
4.2.2. Permeability
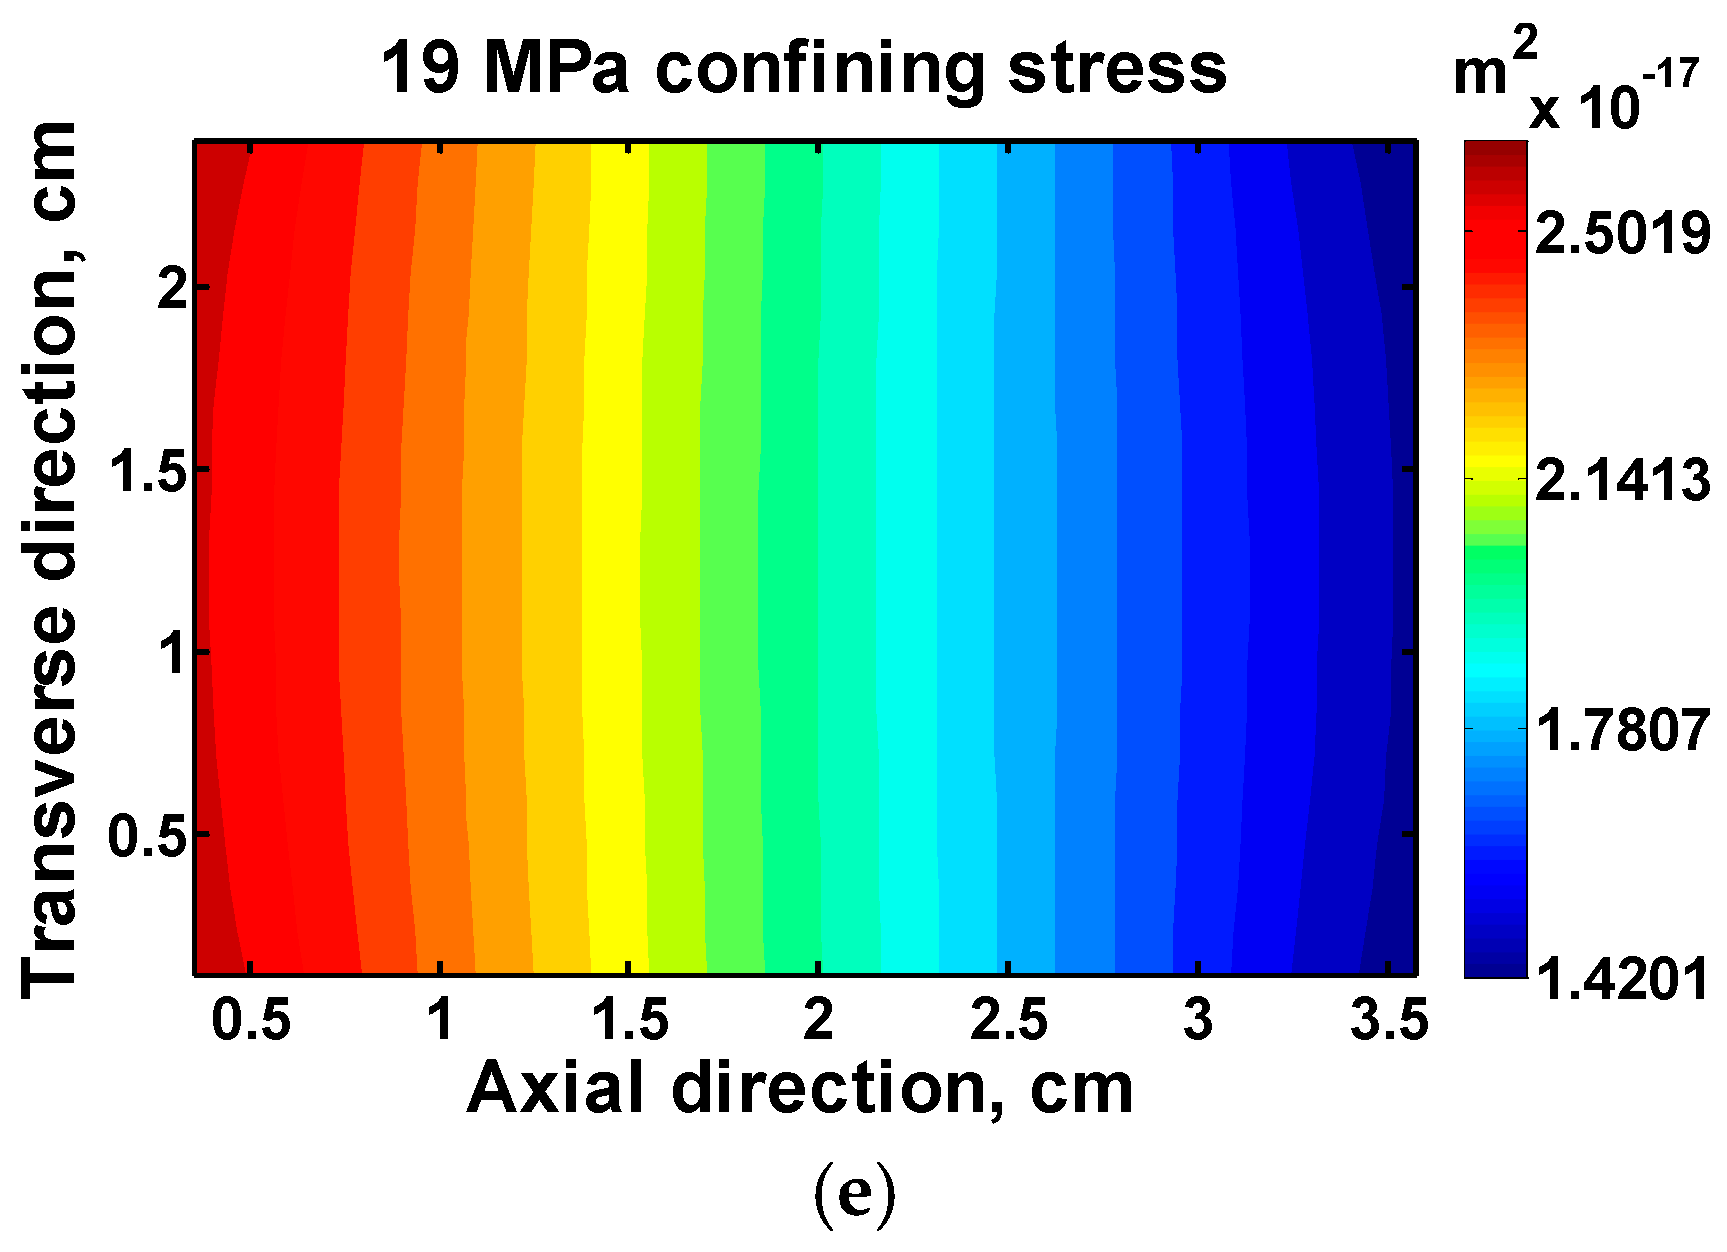
In
Figure 8, permeability distribution is also non-uniform in the analyzed volume. The permeability is liquid permeability excluding the gas slippage effect and is smaller than lab measured apparent permeability. The non-uniform permeability distribution is caused by the non-uniform stress distribution, as permeability is significantly affected by stress and pore pressure. 1D results show that larger confining stress leads to greater damage to permeability. Also, the permeability decreases from the inlet to the outlet, as the effective stress increases from the inlet to the outlet. The first derivative of permeability represents how fast the permeability decreases along the axial direction. A larger absolute value of permeability indicates a faster permeability decrease along the axis. As confining stress increases, the permeability decrease along the axis becomes slower. This indicates that, as confining stress increases, although permeability damage is increased, the effect of axial stress distribution on axial permeability distribution is decreased.


