A Seasonal Model Using Optimized Multi-Layer Neural Networks to Forecast Power Output of PV Plants


1
The School of Control and Computer Engineering, North China Electric Power University, Changping District, Beijing 102206, China
2
The School of Renewable Energy, North China Electric Power University, Changping District, Beijing 102206, China
3
The State Key Laboratory of Alternate Electrical Power System with Renewable Energy Sources, North China Electric Power University, Changping District, Beijing 102206, China
4
The Beijing Key Laboratory of New and Renewable Energy, North China Electric Power University, Changping District, Beijing 102206, China
*
Author to whom correspondence should be addressed.
Energies 2018, 11(2), 326; https://doi.org/10.3390/en11020326
Submission received: 26 December 2017
/
Revised: 21 January 2018
/
Accepted: 26 January 2018
/
Published: 2 February 2018
Abstract
:With the continuous increase of grid-connected photovoltaic (PV) installed capacity and the urgent demand of synergetic utilization with the other power generation forms, the high-precision prediction of PV power generation is increasingly important for the optimal scheduling and safe operation of the grid. In order to improve the power prediction accuracy, using the response characteristics of PV array under different environmental conditions, a data driven multi-model power prediction method for PV power generation is proposed, based on the seasonal meteorological features. Firstly, through the analysis of PV power characteristics in typical seasons and seasonal distribution of the weather factors, such as solar irradiance and ambient temperature, the influences of different weather factors on PV power prediction are studied. Then, according to the meteorology characteristics of Beijing, different seasons can be divided. The historical data corresponding to different seasons are acquired and then the seasonal PV power forecasting models are established based on optimized multi-layer back propagation neural network (BPNN), realizing the multi-model prediction of PV power. Finally, effectiveness of the seasonal PV power forecasting method is compared and validated. The performance analysis of the neural network forecasting model under typical seasonal conditions shows that the multi-model forecasting method based on seasonal characteristics of PV power generation is better than that of single power forecasting model for the whole year. The results show that the proposed method can effectively improve the power forecasting accuracy of PV power.
1. Introduction
In recent years, solar energy utilization has gained great development, and the grid-connected PV power generation has become more and more [1]. From 2005 to 2016, the annual average growth rate of PV installed capacity is higher than 30 percent in the world. By the end of 2016, the global PV installed capacity reached 305 GW. From 2009 to 2016, the annual average growth rate of PV installed capacity is higher than 100 percent in China. By the end of 2016, the Chinese PV installed capacity had reached 77.42 GW. Among them, the distributed PV power generation contributes a proportion of 13.3 percent, and the centralized PV power generation contributed a proportion of 86.7 percent [2]. Worldwide, PV power generation will play a more and more important role in the future energy supply system.
Affected by varying irradiance levels and different weather conditions, output power of PV plants has obvious intermittent volatility and randomness [3]. Currently, the large-scale integration of PV power into the existing energy supply structure has brought about a critical challenge for the power grid’s security and economy. The PV power forecasting techniques, which are timely and accurate, can be very helpful to reasonably schedule PV plants, and to efficiently balance the operation of the power-grid [4]. Reliable forecasting information can strongly support the synergetic utilization of different power supply forms. It will help to integrate more PV power into the power-grid and promote the deployment of large-scale renewable energy resources.
Currently, the time scales such as ultra-short term (15 min to 4 h ahead), short term (several hours to 3 days ahead), medium term (several days to 1 month ahead) and long term (1 month ahead or longer), have been studied for PV power forecasting. The spatial scales such as the micro-scale, small-scale, meso-scale and large-scale, can be interpreted by corresponding to a PV unit, a PV plant, PV plants cluster, and regional PV plants, respectively, shown in Figure 1. With different combinations of time scales and spatial scales, the power forecasting accuracy will be different [5]. Time scale and spatial scale of the studied PV plant here are located in Figure 1. As a result, the short-term and small-scale forecasting problem is addressed.
In practice, the direct and the stepwise approaches are both utilized for PV power forecasting [6]. For the direct approaches, the inputs include historical weather, PV power, and forecasted weather, and the output is PV power [7,8]. Only one forecasting model needs to be established for a direct approach. The stepwise approaches mainly include two steps. The first step is the forecasting of relevant weather factors, such as solar irradiance, ambient temperature and relative humidity, etc. The second step is the modeling of PV power generation characteristics [9,10], and the output is PV power. Compared with the single holistic model of direct approaches, the two steps of stepwise approach have clear physical meaning, and the steps are independent, to bring in greater flexibility. Any improvement of each step can effectively raise the whole forecasting performance. As a result, the stepwise approach will be further studied in this paper.
For a stepwise approach, the forecasting of weather factors, such as solar irradiance, ambient temperature, relative humidity, wind speed, wind direction, and atmospheric pressure, etc., plays an important role. Among them, solar irradiance is the most important factor. An overview of different approaches to forecast solar irradiance is given in [11]. For short-term forecasting in a temporal range up to some hours, the utilization of satellite data has been proposed [12]. For forecasting up to two days ahead or even more, the output from numerical weather prediction (NWP) is used [13,14]. With the accuracy enhancement of NWP and post-data reduction technology, more accurate prediction of solar irradiance and relevant weather factors in specific sites during specific times can be achieved [15,16,17].
According to the spatiotemporal resolution of NWP, there are mainly two modes: the global NWP and the meso-scale NWP. In spatial scale, the resolution of meso-scale NWP is 5–20 km, and even to 1 km. In the time scale, the resolution is 15 min–1 h. For the power-grid, the time resolution requirement of 15 min can be fulfilled. Considering the occupied space scale of a PV plant, the spatial resolution of meso-scale NWP can fulfill the requirement with properly downscaling technologies, to obtain the NWP data for a specific PV plant site [9].
As a result, the weather factors, such as solar irradiance and ambient temperature, etc., in the first step of a stepwise approach, can be provided by the meso-scale NWP, and then the modeling of PV power generation characteristics is mainly studied in this paper. Currently, it mainly includes two classes of methods: physical modeling [18] and statistical modeling [19]. For physical modeling, the major equipment, such as PV array and inverter efficiency, etc., need to be modelled. The accurate modeling of their dynamics has become an attractive research field now [20,21,22]. However, in practice, the physical modeling is more complex, and the model parameters are difficult to be identified. Always, the simplified models that are obtained are easily disturbed by external influences. In addition, operation characteristics of the major equipment often change with time, such as degradation of PV array and varying efficiency of inverter, etc., which cause a great challenge for physical modeling [23]. Especially, for PV power generation, the influence from local site environment, such as sand dust cover, rain scour, and shadow shelter to the PV panels, cannot be properly represented in a physical way, which further increases the modeling difficulty [24,25].
For statistical modeling, a data-driven model can be established to approximate the nonlinear dynamics of PV power generation [26,27]. In [28], the radial basis function neural network (RBFNN) was utilized to obtain the 24 h forecast of the solar irradiation on the horizontal plane. In [29], the RBFNN was adopted to establish the PV power forecasting model, taking the difference of meteorological feature vector between the nearest similar day and the forecasted day as inputs. Besides, the associated data model is used to represent PV power generation characteristics in [7]. According to the literature, it can be found that the historical data of PV power generation contained abundant operation information. Meanwhile, the statistical methods have reliable theory support and matured application experiences, which bring in appropriate model complexity and convenient program implementation [8]. As a result, the statistical method has great potential to accurately model the PV power generation characteristics and to be efficiently applied into the practice.
The statistical algorithms generally used for solar irradiance and PV power prediction include artificial neural network (ANN), classification and regression, time series, wavelet analysis, random forest, probabilistic prediction, and integrated methods. Thereinto, due to the good generalization and fault tolerated performance, the ANN algorithms have been popularly used for PV power forecasting [30,31].
As a nonlinear dynamic process, PV power generation is affected by many factors, such as solar irradiance, ambient temperature, and PV cells themselves, etc., and thus, different operating conditions exist [32]. According to the literature [33,34,35], it is significantly affected by solar irradiance and ambient temperature, which vary with weather conditions and seasons. Different operating conditions correspond to different dynamics of PV power generation. As a result, PV power forecasting with a single model is inaccurate, as it does not have enough generalization performance for the whole year, and different PV models should be established to improve the forecasting accuracy. A forecasting method that extracts data from similar days to train the data-driven model has been proposed [36,37,38,39]. Different weather types are partitioned, and the data of days with similar weather types are extracted for the modeling of PV power generation characteristics [40]. As a result, different models can be established corresponding to different weather types. It inspired a way to improve PV power forecasting accuracy under a multi-model structure from the point of weather types. Meanwhile, under the multi-model structure, the other forecasting methods can also be studied from the other points.
Solar cycle movement induces seasonal changes in solar irradiance and ambient temperature, etc., which may have a seasonal impact on PV output power. Meanwhile, different seasons have their representative weather types [39]. Then, establishing PV system models in different seasons may be an effective solution. The multi-model forecasting method is proposed [41]. In this paper, seasonal characteristics of different weather factors are analyzed, and the feasibility to establish multi-model of PV system is studied.
Beijing area has four distinct seasons, a large number of sunny days, while each season contains a variety of weather conditions. Considering these features and the advantages of ANN on data-driven modeling, the multi-layer BPNN is adopted in this paper to build multiple models of PV power generation in the Beijing area. The multi-layer BPNN model has strong generalization ability, suitable for various weather types in single seasons. Meanwhile, optimize the model parameters of BPNN, such as initial weights and thresholds, using genetic algorithm (GA), determine BPNN structure via k-cross validation (k-CV) method, and use the sliding time window mechanism for data update. These will further improve the forecasting accuracy of PV power. The paper is organized as follows: Section 2 analyzes the seasonal distribution characteristics for some important weather factors to PV power generation. Section 3 introduces the multi-model approach for PV power forecasting, based on the optimized multi-layer BPNN. A simulation example is analyzed and shown in Section 4; Finally, Section 5 concludes the paper.
2. Seasonal Characteristics Analysis of PV Power Generation
PV power generation is closely related to weather conditions of which the changes can be described by multiple meteorological parameters. According to meteorological conditions and the operation principles of PV power generation, the parameters such as solar irradiance, ambient temperature, relative humidity, wind speed, wind direction, and atmospheric pressure can affect PV power generation in varying degrees. On the one hand, the impact of each factor on PV power generation is different; on the other hand, impact of the same factor often changes under different working conditions. Moreover, there are multiple correlations and coupling relationships among the meteorological factors, which need to be analyzed and evaluated.
According to the existing literature, the factors such as solar irradiance and ambient temperature are generally used as input variables in the physical modeling of PV power generation [42]. A typical PV power generation physical model is shown in Equation (1), which takes solar irradiance and ambient temperature as inputs, and generation power as output. The basic principle of PV power generation is PV effect, using PV modules to convert solar energy into electricity. The actual output power Pt of a PV module at instant t can be calculated using Equation (1):
where, PSTC is the standard output power of a PV module which corresponds to the solar radiation intensity = 1000 W/m2 and the temperature = 25 °C; is the power-temperature coefficient of a PV module; is the actual solar irradiance at instant t received by the PV module; is the ambient temperature at instant t [43]. Obviously, output power of a PV module is mainly determined by the solar irradiance and the ambient temperature.
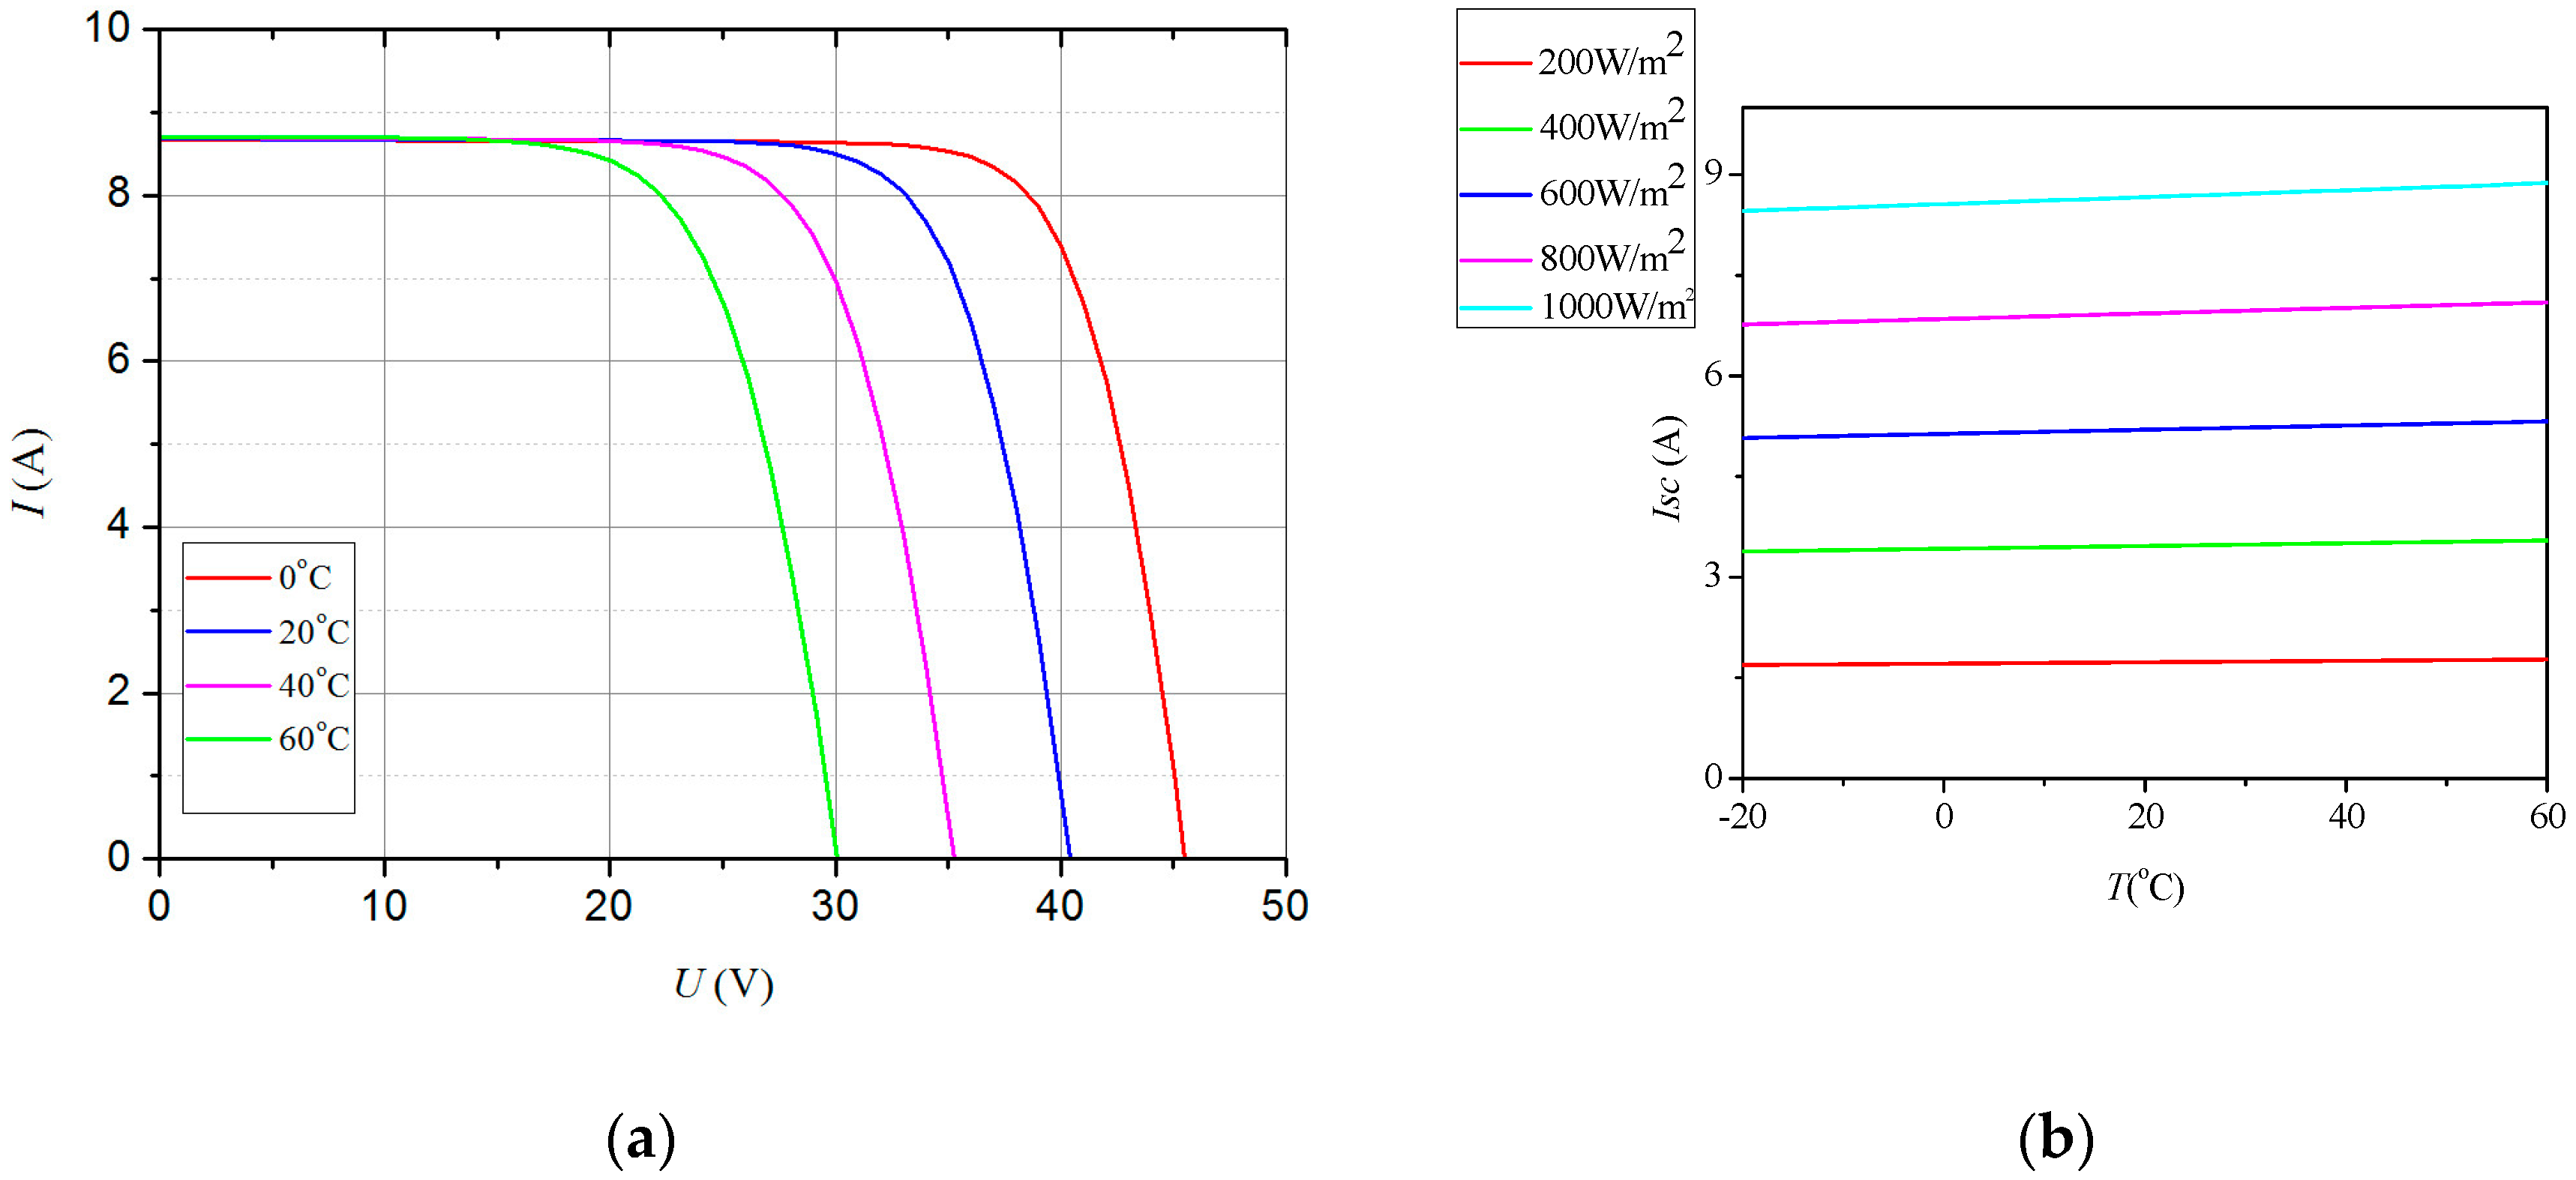
Via regulating solar irradiance and ambient temperature, I-V curve of the PV module changes significantly. Meanwhile, the output power also changes. The solar irradiance and the ambient temperature mainly affect the short-circuit current and the open-circuit voltage, respectively. The curves are shown in Figure 2. It can be found that the open-circuit voltage decreases with the increase of temperature, and the short-circuit current increases with the increase of solar irradiance. The solar irradiance and the ambient temperature have obvious seasonal characteristics relative to the output power.
According to the season division criteria in meteorology, the four seasons from spring to winter correspond to the time intervals by months, such as from March to May, from June to August, from September to November, and from December to February in the Gregorian calendar, respectively. Adopting the real-time monitoring data of a PV power station in North China Electric Power University, the seasonal characteristics of the main meteorological factors, such as solar irradiance and ambient temperature, can be analyzed. Meanwhile, the relationship between them and the PV power generation characteristics will be further studied.
Select data samples of the above PV power station from November 2016 to October 2017, and then set the sampling period as 15 min. In order to ensure data quality, the data preprocessing methods, such as abnormal data elimination and missing data interpolation reconstruction, are carried out for the data samples.
For the PV plant, the historical data of solar irradiance and ambient temperature from November 2016 to October 2017 is analyzed, as shown in Figure 3, Figure 4 and Figure 5.
Figure 3a,b are the annual time-sharing display charts of solar irradiance and ambient temperature in the whole year from November 2016 to October 2017, respectively. They show the overall trends of solar irradiance and ambient temperature in different seasons of a year.
Figure 4a shows the average solar irradiance per month at different times of a day. Along the abscissa axis, the differences of the amplitudes in different months at a certain time vary between 150–300 W/m2. Along the ordinate axis, the amplitudes at different times in a certain month vary greatly, and are affected by the sunrise and sunset. At all timepoints, the amplitudes of spring and summer are greater than autumn and winter. In January, the minimum amplitudes appear mostly at all times of a day. Figure 5a displays the average solar irradiance of each season at different times of a day, such as 8, 10, 12, 14, 16, and 18 o’clock. It can be seen that the solar irradiance obviously changes with the season. The descending order of the average solar irradiance in different seasons at all times of a day is spring, summer, autumn, and winter.
Figure 4b shows the average ambient temperature per month at different times of a day. Along the abscissa axis, the differences of the amplitudes in different months at a certain time vary around 30 centigrade. Along the ordinate axis, the amplitudes at different times in a certain month vary obviously. At all the times, the amplitudes in July are at the maximum, which suggests a cluster of unimodal curves, of which the overall trend has a single peak. In January, the minimum amplitudes appear at all times of a day. Figure 5b displays the average ambient temperature of each season at different times of a day, such as 8, 10, 12, 14, 16, and 18 o’clock. It can be seen that the ambient temperature has obvious seasonal distribution characteristics. The descending order of the average ambient temperature in different seasons at all times of a day is summer, spring, autumn, and winter.
From the above statistical analysis, both the solar irradiance and ambient temperature have significant seasonal characteristics.
Due to the Equation (1), it can be found that the PV output power is mainly determined by the solar irradiance and ambient temperature. In order to reveal the relevance between PV output power and the above two external factors, the PV output power can be analyzed as follows.
Figure 6 is the PV power analysis in statistic of the demonstration PV power station from November 2016 to October 2017. Figure 6a is the annual time-sharing display chart of PV output power in the whole year from November 2016 to October 2017. The overall trend of PV output power in one year can be seen.
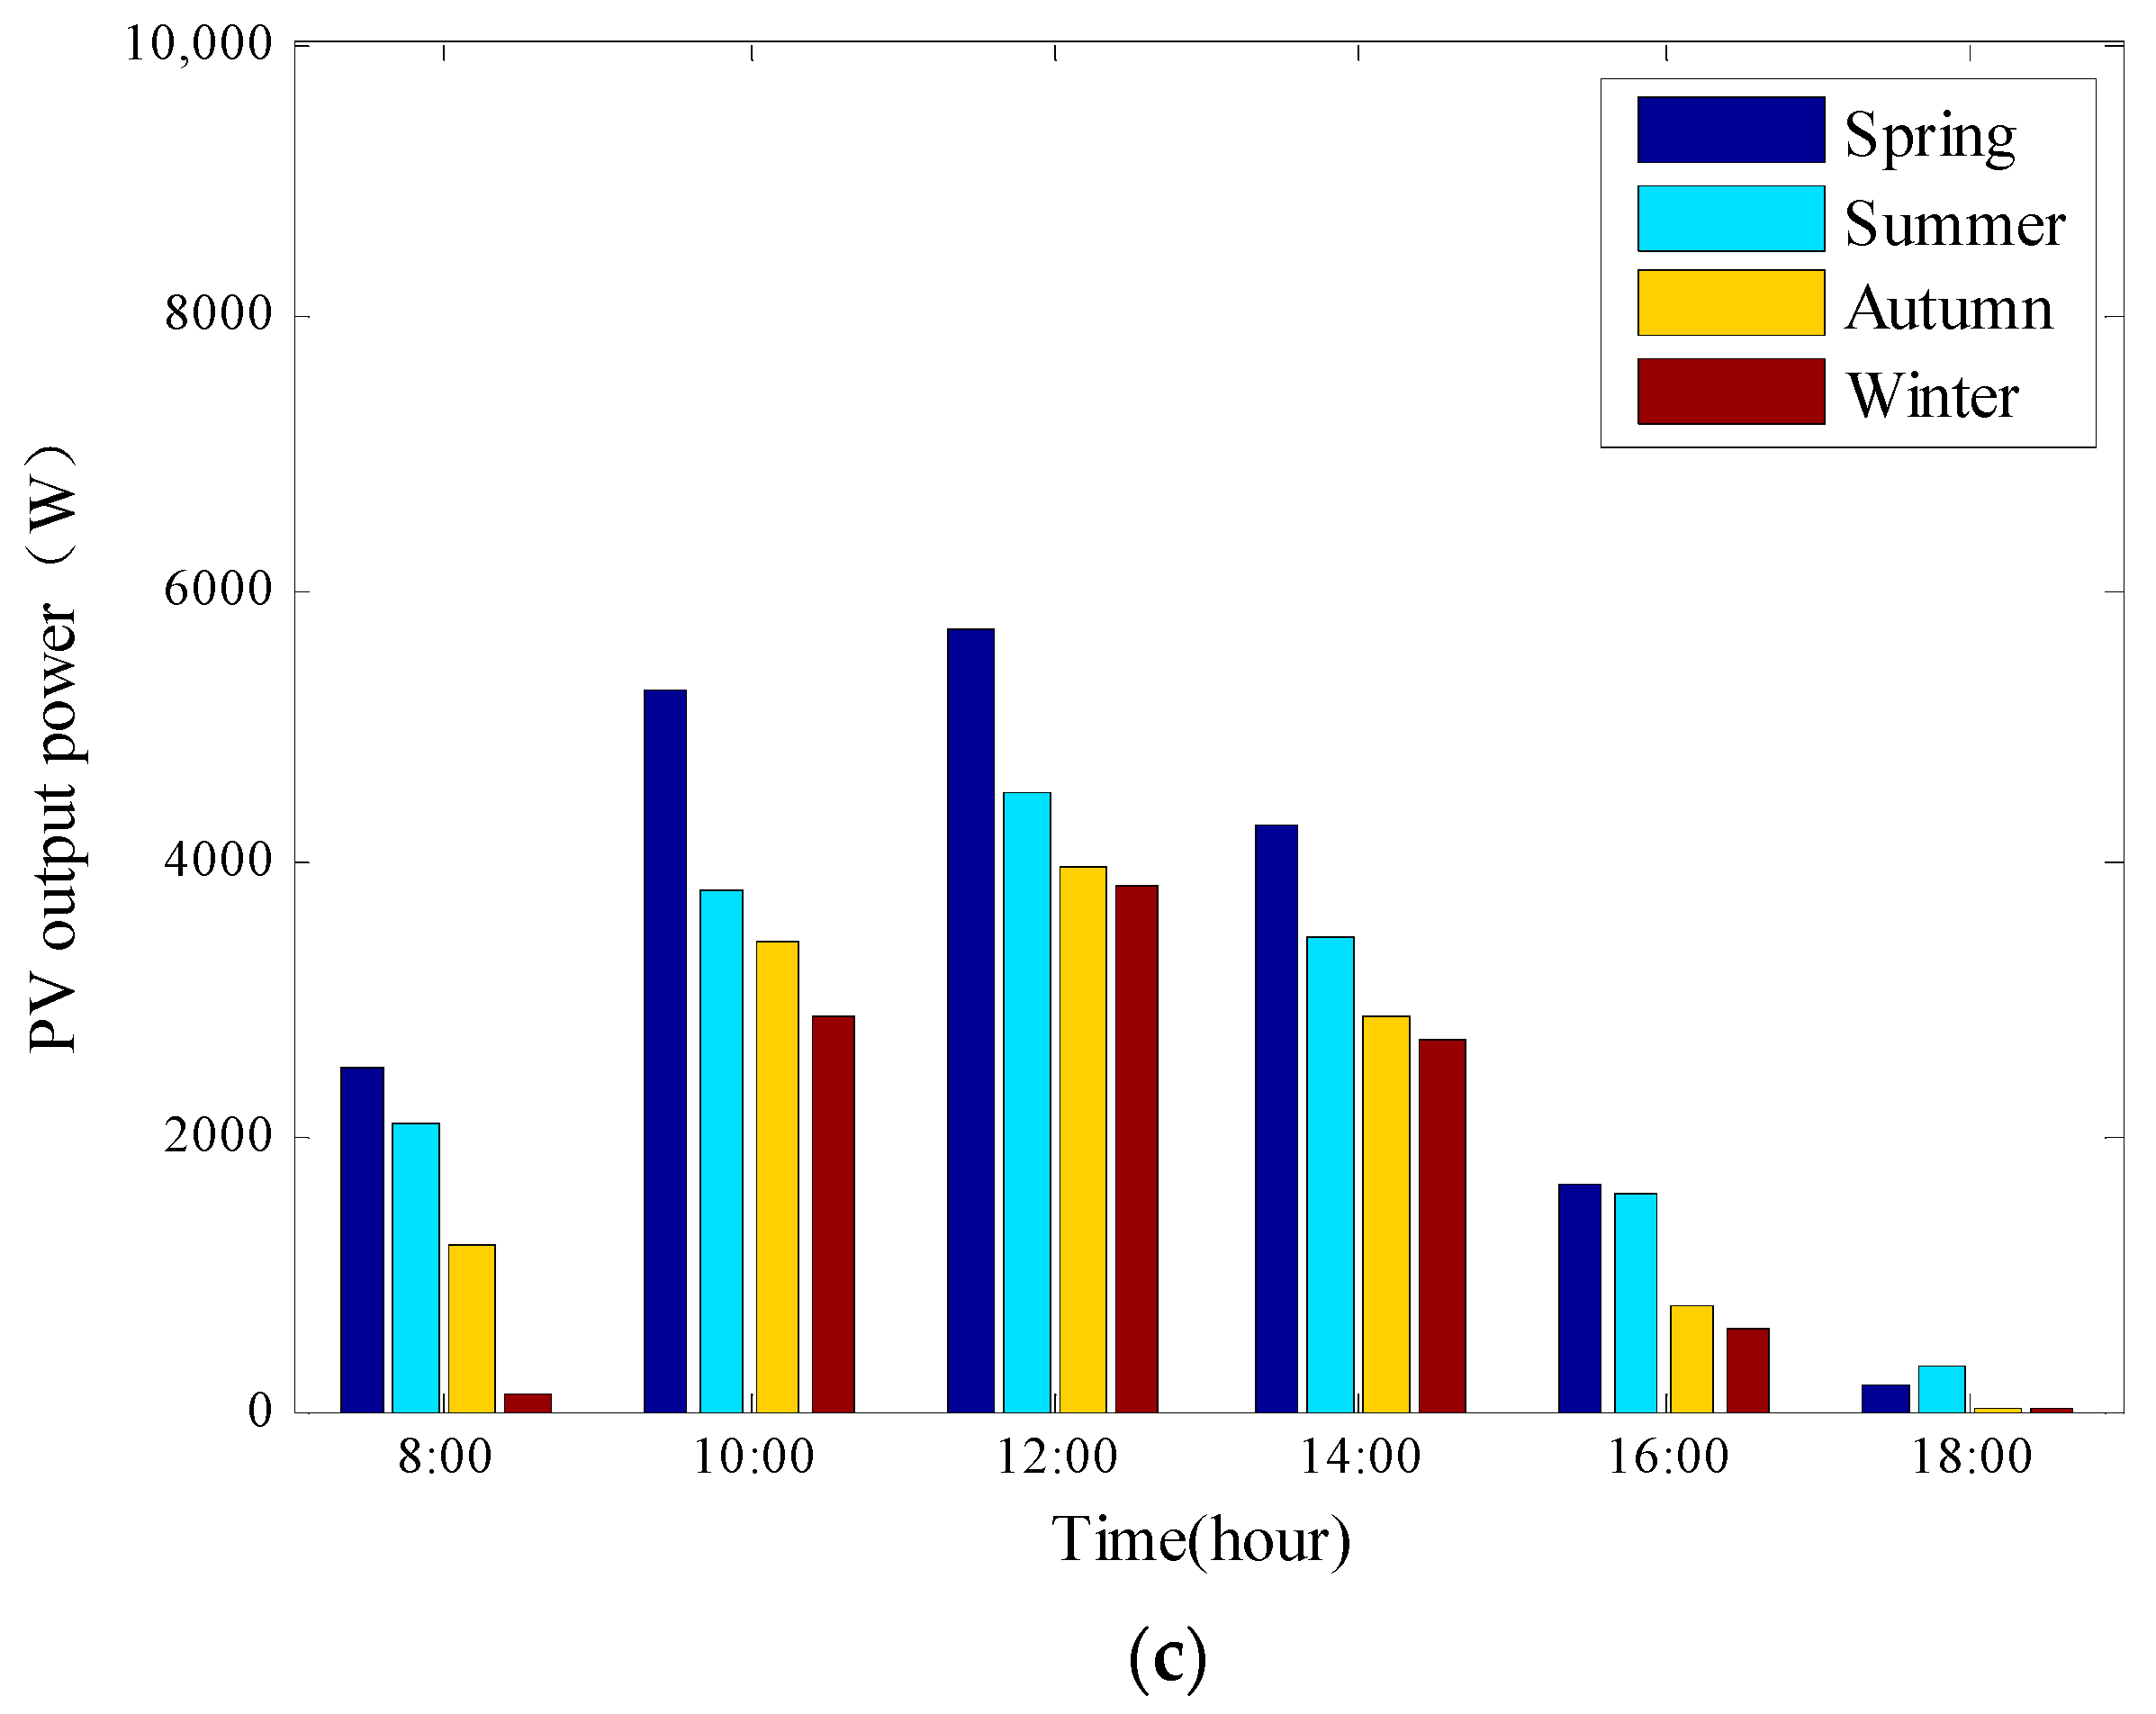
Figure 6b is the display chart of monthly average PV output power at different times of a day, such as 8, 10, 12, 14, 16, and 18 o’clock. Figure 6c is the display chart of seasonal average PV output power at different times of a day. It can be seen that the differences are obvious in different seasons. However, the distribution characteristics are varying, which is different from that of solar irradiance and ambient temperature. It suggests that PV output power is comprehensively affected by solar irradiance and ambient temperature. Under different combinations of solar irradiance and ambient temperature, the PV output power and generation efficiency are varying. Actually, it shows the natural nonlinearity of PV power generation process, which is the most critical challenge in PV power forecasting.
Furthermore, the statistical value of solar irradiance, ambient temperature, and PV power are shown in Table 1. It can be seen that the statistical indicators, such as maximum, minimum, and average values of the above three variables in different seasons are significantly different. Taking the average indicator as an example, it shows that under the combination of solar irradiance and ambient temperature in different seasons, the PV power characteristics have clearly seasonal changes. It suggests that the PV modules operate under significantly different operating conditions. Therefore, it is necessary to establish the PV forecasting models in different seasons to improve the modeling accuracy.
3. A Multi-Model Approach of PV Power Forecasting Based on Optimized BPNN
Besides the data validity, the performance of BPNN depends on the selection of input variables, the design of network structure, and the optimization of network parameters. This determines the performance of BPNN.
3.1. Selection of Input Variables for PV Power Forecasting Model
For the model of PV power characteristics, in addition to the general inputs such as solar irradiance and ambient temperature used in statistical models [29,44], many factors such as relative humidity, wind speed, and air pressure, etc., also affect the PV power. Reasonably increasing the input space dimension of forecasting model is helpful to approximate the actual PV power characteristics more accurately. Due to that the above meteorological factors are mutually coupled to influence PV power generation, their influence degrees to the PV power generation are different. Through path analysis, the meteorological factors which have greater influence can be selected as the additional input variables [45]. Besides, according to the analysis in Section 2, the meteorological conditions are obviously different in four seasons. Thus, in each season, the path analysis should be executed.
Generally speaking, PV power generation are influenced by the weather factors, such as solar irradiance, ambient temperature, relative humidity, wind speed, wind direction, and atmospheric pressure, which are also readily available in weather stations and NWP. Taking the historical data of PV power demonstration platform in North China Electric Power University for 2016 as data samples, seasonal characteristics of the influence factors are analyzed through path analysis. The results suggest that the highest correlation exists between the four factors (such as solar irradiance, ambient temperature, relative humidity, and wind speed) and PV power. It keeps in line with the research of [46]. As a result, it is reasonable to select the four variables for the forecasting modeling of PV power and the results of path analysis are shown in Table 2, Table 3, Table 4, Table 5 and Table 6. From the results, the relationship among different influence factors and PV power are clear. It is easy to select the input variables of seasonal model and the annual model.
There are many weather factors affecting PV power generation, whose influence ways and effects are different. The complex nonlinear relationships exist between the different weather factors and PV power, while influences of different weather factors are also coupled with each other. However, statistical methods can be used to measure and contrast it quantitatively, so as to identify the critical weather factors which play a key role. From Table 2, Table 3, Table 4, Table 5 and Table 6, the terms such as realsun, realtem, realhum, and realwin represent the surface solar irradiance, ambient temperature, relative humidity, and wind speed, respectively.
3.2. Structure and Parameter Optimization of BPNN via k-Cross Validation
BPNN is a kind of supervised machine learning algorithm. The output error is propagated back from output layer to input layer via the hidden layer, and then the weight coefficient of each neuron is modified dynamically. BPNN can process the information in a distributed parallel manner. The properly trained BPNN has great approximating performance to the nonlinearity, which can approximate the nonlinearity with arbitrary precision. Besides, BPNN has good fault tolerance and generalization ability. Thus, the constructed model has good robustness and strong advantages in PV power generation modeling, a complex nonlinear system.
In order to approximate the actual characteristics of PV power, the GA is adopted to optimize the initial parameters of multi-layer BPNN. The output of a typical neuron structure is , where pi is the i-th input and the input vector is P; wi,j is the weight coefficient of the i-th input to the j-th hidden layer node, and the weighting coefficient matrix is W; b is the threshold of a neuron; f is a transfer function.
Based on the analysis in Section 3.1, the BPNN in each season selects different variables as input. The output variable is PV power. However, there is no uniform standard to determine the number of layers and the hidden layer nodes. Besides, the initial values of weighting coefficient and threshold also have important influence on the performance of BPNN.
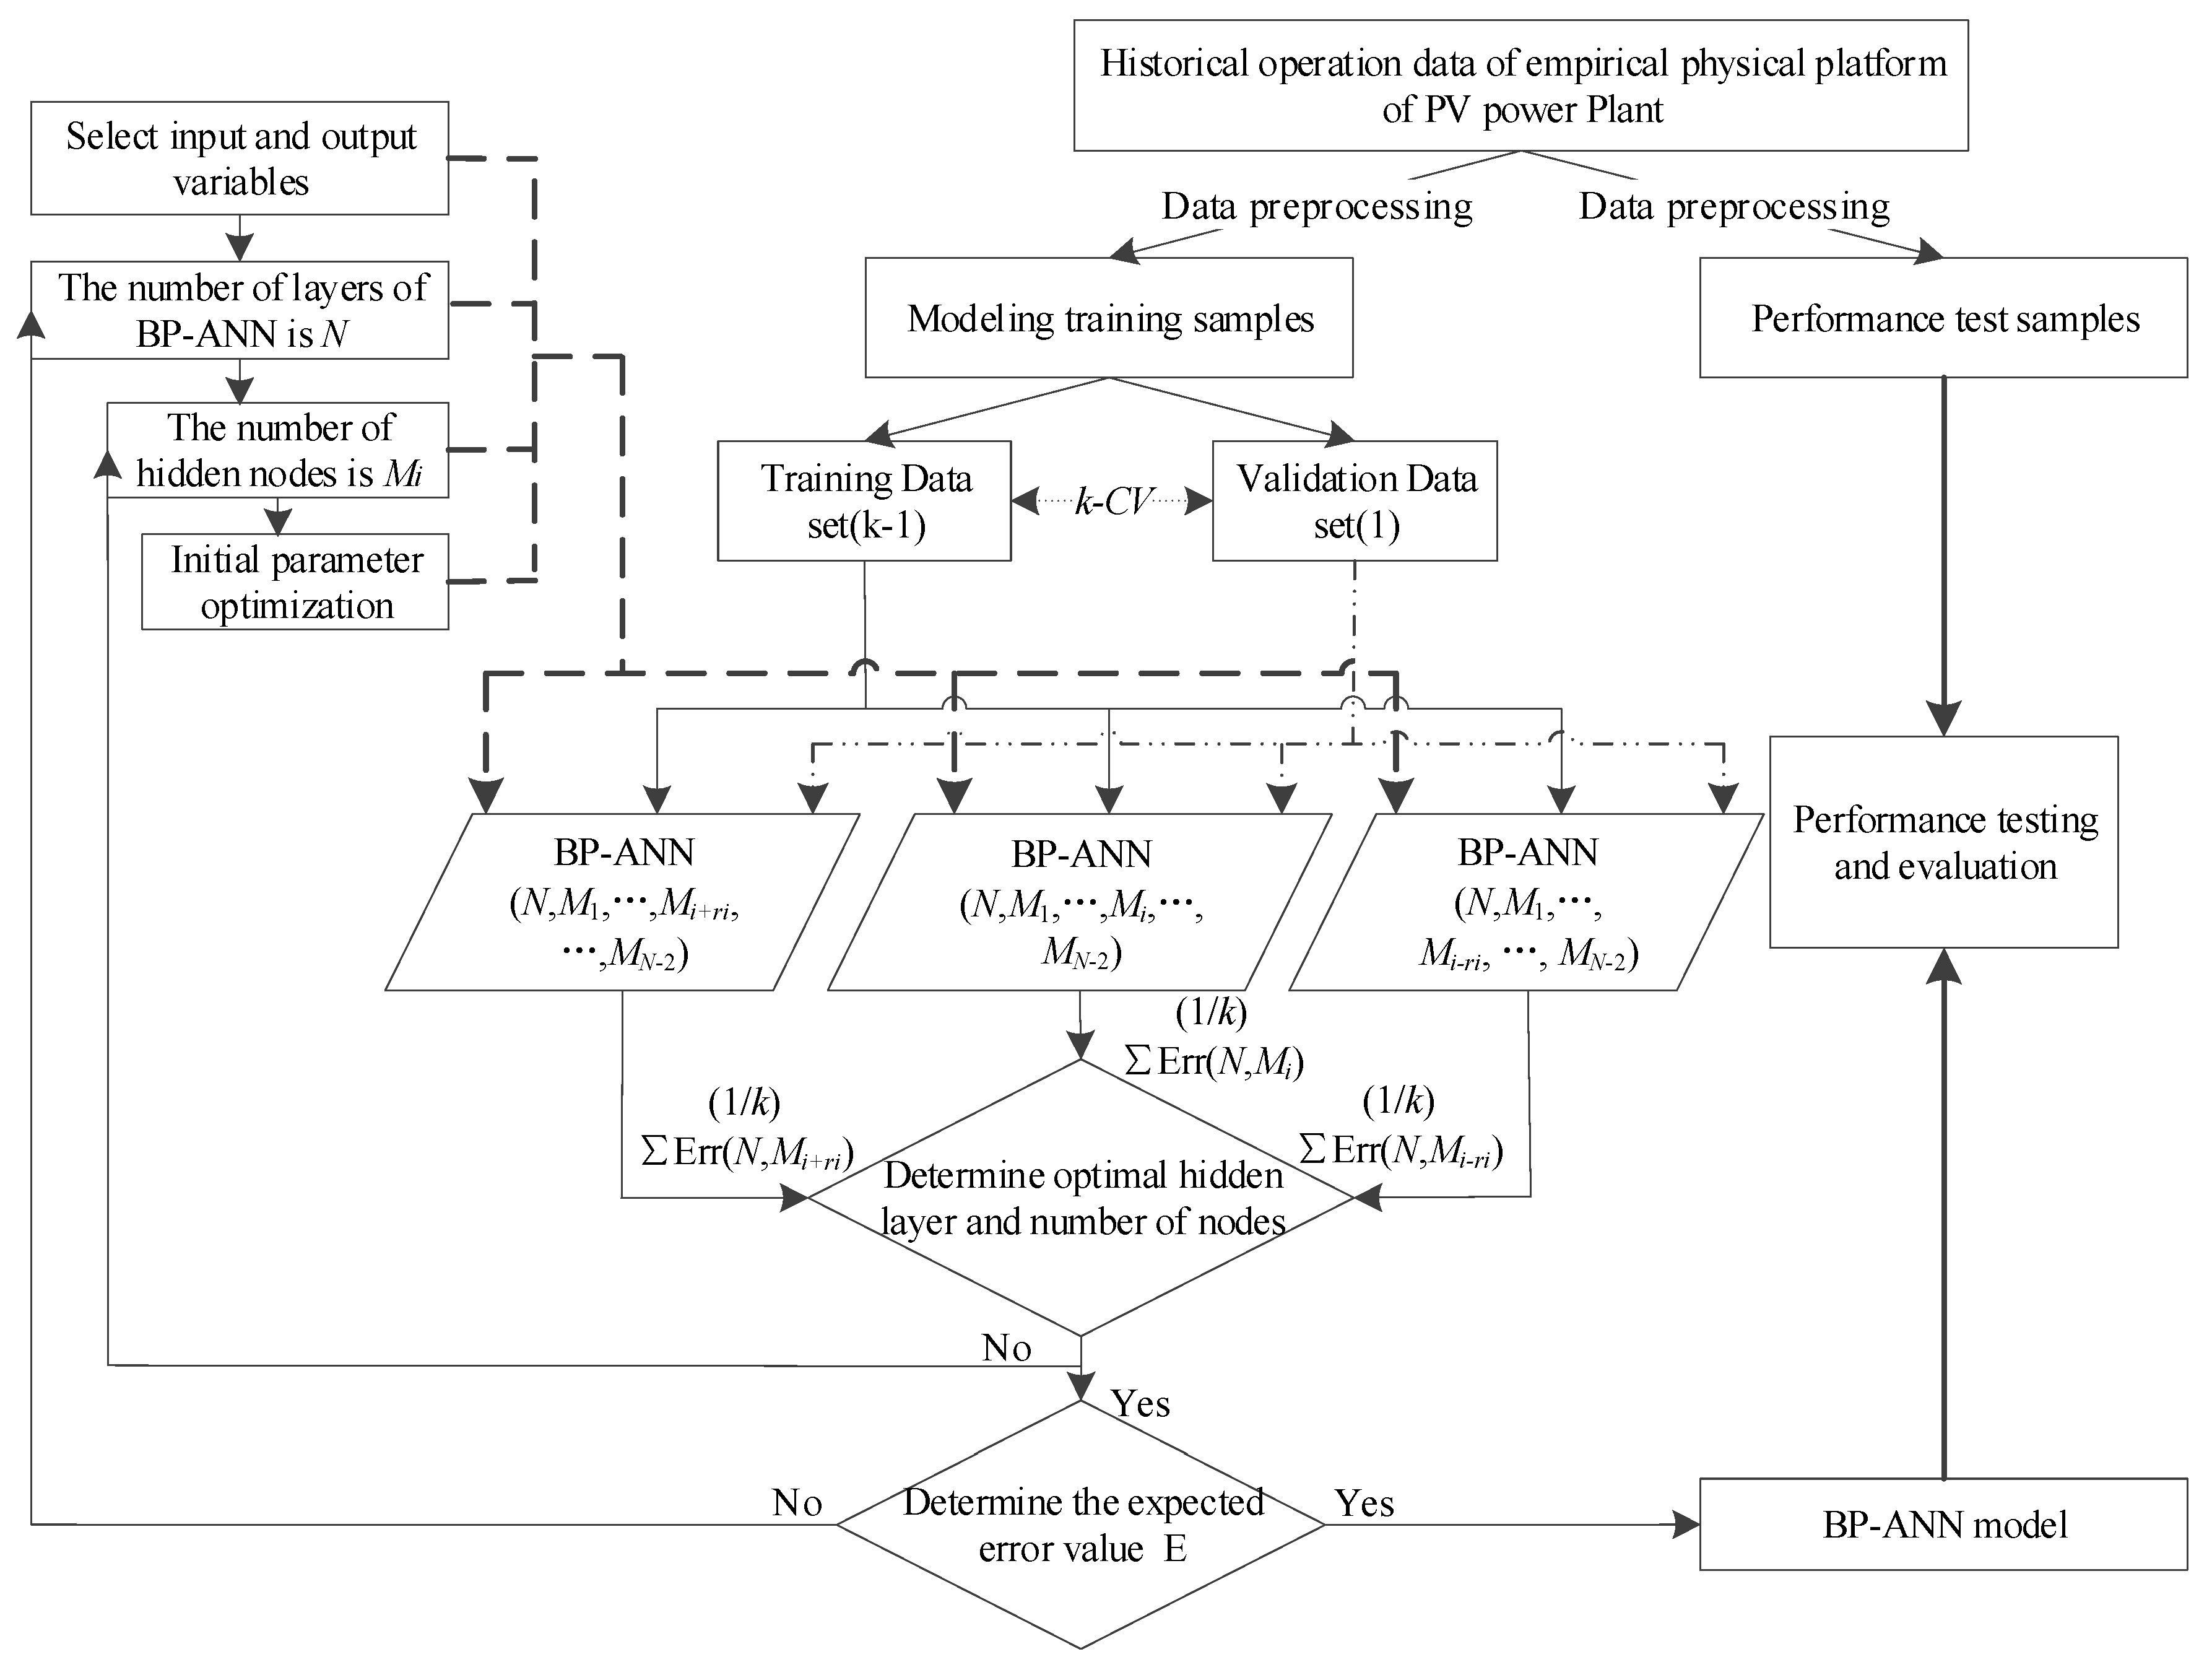
On the basis, the k-CV is adopted to properly determine the layers of BPNN, while the GA is adopted to optimize the approximating performance. The detailed implementation scheme is shown in Figure 7.
If the input and output variables have been determined, the implementation scheme above can be used to optimize the layers of BPNN. Usually, BPNN prefer to adopt a three-layer structure, where a commonly used empirical formula to determine the hidden layer nodes is shown as follows:
where is the number of hidden layer nodes; is the number of input variables; is the number of output variables; is a constant value between (1,10) [46].
If the required accuracy cannot be achieved, the layers can be gradually increased and evaluated. As the number of hidden layers increases, selection of the optimal number of hidden layer nodes needs to consider the balance between training time and fitting accuracy using the trial and error method [47]. For example, heuristic grid search can be used. When the BPNN structure has been determined, the GA is used to optimize its initial weights and thresholds.
Based on the historical operation data of a PV power station in Beijing, the samples are preprocessed. In order to obtain a reliable and accurate model, the k-CV method is used to optimize the structure and parameters of BPNN model. The advantage of the k-CV method is that all sample data are used for training and verification by random equal, and each part is used only once [48].
3.3. Multi-Model Approach for PV Power Forecasting
In this paper, NWP is used to obtain the solar irradiance and other meteorological data. By improving the modeling accuracy of PV power generation characteristics, the prediction accuracy of PV power generation is improved.
The multi-model building process of PV power generation based on BPNN is divided into the following three steps.
Step 1: Data quality control and data pretreatment. The effective sample data is of great significance to improve the accuracy of PV power generation prediction model, and the outlier data points are identified and eliminated. Then, the data acquisition is normalized. Through the above steps, we can complete the acquisition of massive effective data samples, and improve the effectiveness of the data sample.
Step 2: Based on the four seasons division method of meteorology, the BPNN model of different seasons is established according to the implementation scheme proposed in Section 3.2 in spring, summer, autumn, and winter, respectively.
Step 3: The performance of the multi-model BPNN for PV power generation is evaluated.
In addition, considering the adaptability of the model, the BPNN model of the four seasons is introduced into the error feedback system. Through the data update to improve and optimize the prediction model, this can make it more adaptive to the current operating conditions of PV power station.
All in all, the multi-model power prediction implementation scheme of PV power plant based on seasonal characteristics is shown in Figure 8.
4. Instance Verification
4.1. Determination of Seasonal Multi-Model Structure
The annual data for 2017 are divided into four seasons. The setting of model structure is shown in Table 7. The maximum training times is about 5000. The training accuracy goal is about 0.01. The learning rate is 0.1.
4.2. Performance Verification
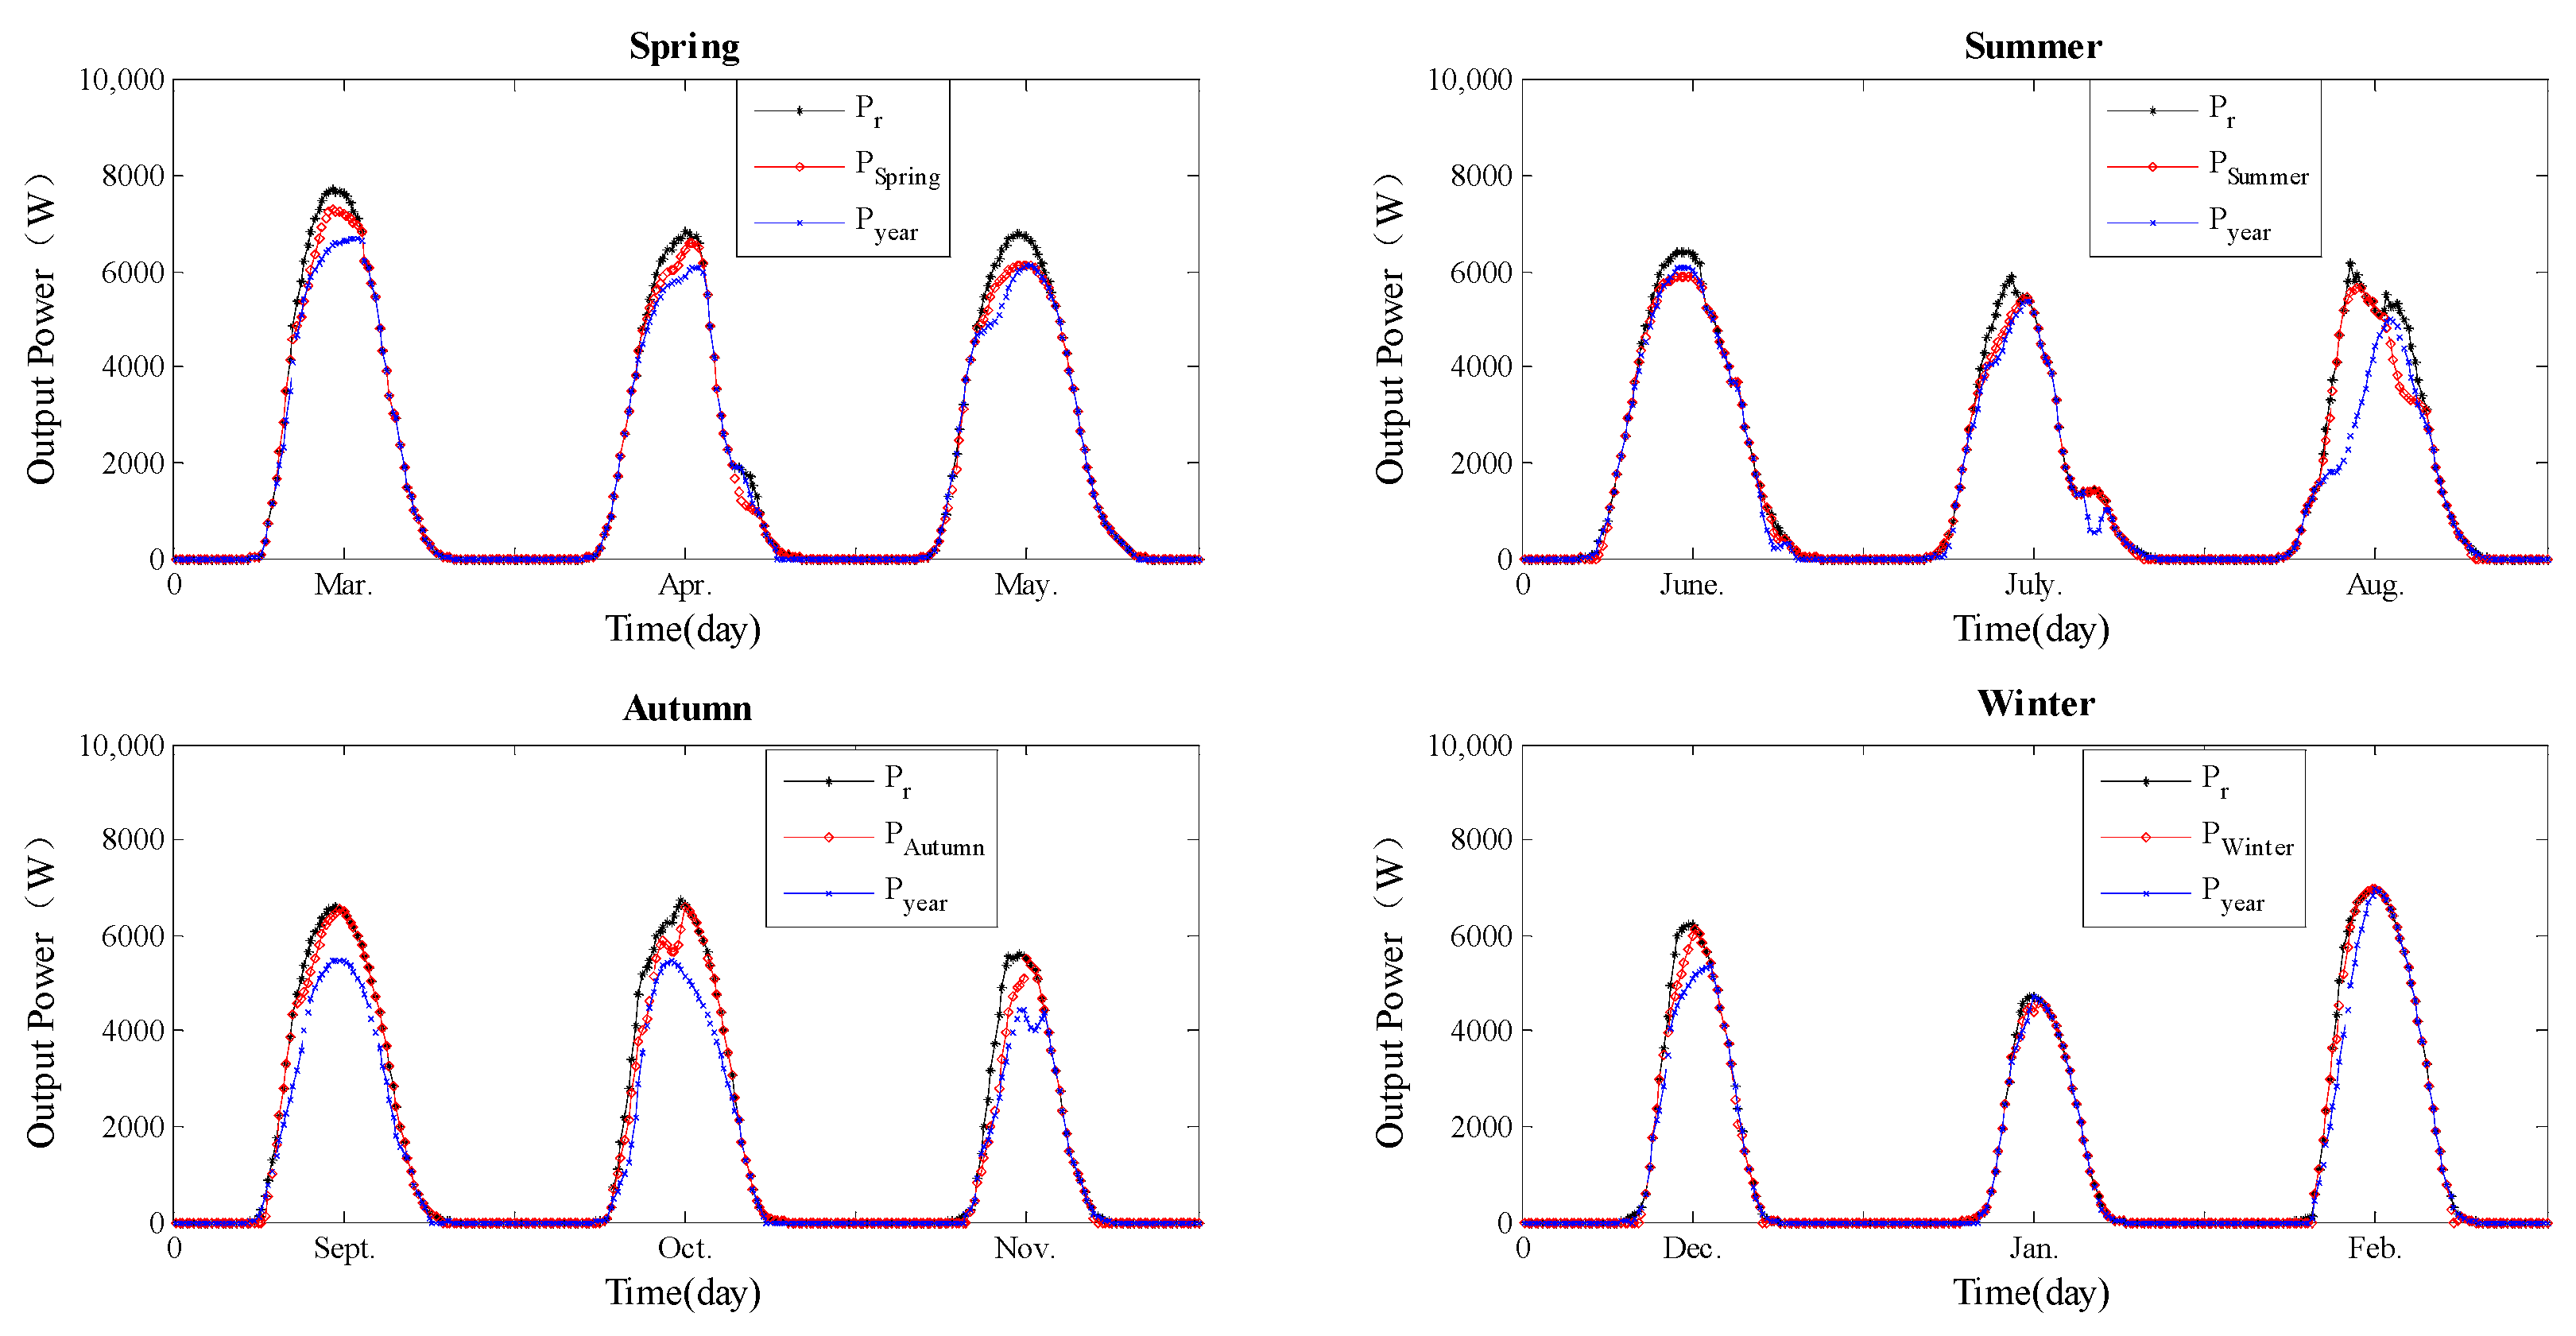
In order to verify the availability and universality of the multi-model power prediction method for PV power plant based on seasonal characteristics, this paper randomly selects 1 day data from each month of 2017 for comparative analysis. To quantitatively verify the prediction results, the indexes of MAE (mean absolute error) and RMSE (root mean square error) are used to evaluate the accuracy of different methods.
The model accuracy is calculated as Equation (3):
- Both of the seasonal model and annual model have good prediction results, and the prediction accuracy is more than 90 percent.
- The root mean square error and mean absolute error of the multi-layer BPNN model PV power prediction method based on seasonal characteristics are less than the annual model and the single-layer BPNN model. The prediction error improves, and the stability of prediction results also obviously improves.
- Multi-layer BPNN model PV power prediction method based on seasonal characteristics is more accurate than the whole year model and the single-layer BPNN model. It has better performance, and can be used to design more accurate PV power prediction algorithms.
- Multi-layer BPNN model is superior to support vector machine (SVM) model in accuracy, root mean square error, and mean absolute error.
4.3. Performance Analysis and Evaluation
The PV power is obviously affected by the weather conditions. The weather factors, such as solar irradiance, ambient temperature, relative humidity, wind speed, wind direction, and atmosphere pressure, etc., are the possible influence factors. According to the simplified physical-based model (1), the solar irradiance and ambient temperature are the dominant influence factors. Then, the I-V curve in Figure 2 can be obtained, due to the silicon-based solar cells work in the maximum power point tracking (MPPT) mode all the time. A single combination of solar irradiance and ambient temperature corresponds to a maximum power point in theory. Therefore, a single combination of solar irradiance and ambient temperature represents a kind of external operation condition which corresponds to a maximum power point. In practice, a combination of more weather factors also represents a kind of external operation condition. However, it is more complex. Then, the multi-layer BPNN is used to represent the mapping relation between external operation conditions and PV power based on the practical data. For the seasonal models and annual model, different weather factors, data, and PV power data are acquired as samples for the modeling, and the mapping relations which the BPNN represent are different, though they have the same model inputs and outputs. Besides, different seasonal models and the annual model have different structures of multi-layer BPNN, including different hidden layers and neuron nodes. As a result, they have certain differences in forecasting accuracy of PV power. It explains well the accuracy difference of the different forecasting models shown in Figure 9.
In summary, the seasonal models established in this paper can reflect the unique output characteristics of PV plants under different season conditions, and have superior forecasting performance.
5. Conclusions
The seasonal distribution of PV power prediction parameters is obvious. It is affected by the seasonal climatic conditions. Without consideration, the prediction accuracy of PV power prediction is truly affected. Therefore, this paper proposes a multi-model PV power prediction method based on seasonal characteristics, and establishes the prediction model according to the seasonal classification variables as input. The key points of this paper are summarized as follows.
The output power of PV plant will be affected by the solar irradiance and temperature. The revolution of the earth will lead to the solar irradiance and temperature in most regions of China presenting a seasonal pattern. If the factors of the season are not considered, the generality and generalization of the model are poor, and the prediction accuracy of the power station is affected.
The output power curve of the same season is highly similar. Based on the principle of difference and relativity, it proposes to classify the historical data, which are taken as a sample to establish the BPNN prediction model according to the season. The multi-model PV power forecasting method based on seasonal characteristics is more targeted.
Multi-model PV power prediction method based on seasonal characteristics is simple and effective, and shows better prediction performance.
The results show that the multi-model PV power prediction method based on seasonal characteristics has better prediction accuracy, and has a certain practicability and feasibility.
Acknowledgments
The authors would like to acknowledge the Fundamental Research Funds for the Central Universities “2016MS52, 2016MS31” and the Research Funds from State Grid Corporation of China “SGHE0000KXJS1700074”.
Author Contributions
All the authors contributed to this work by collaboration. Yang Hu and Honglu Zhu mainly guide the writing of the paper and provide the funds support of the research. All the authors revised and approved for the publication.
Conflicts of Interest
The authors declare no conflict of interest.
References
- International Energy Agency. World Energy Outlook 2016 Part B: Special Focus on Renewable Energy; IEA: Paris, France, 2016; p. 11. [Google Scholar]
- British Petroleum. BP Statistical Review of World Energy; BP: London, UK, 2017; p. 6. [Google Scholar]
- Da Silva Fonseca, J.G., Jr.; Oozeki, T.; Takashima, T.; Koshimizu, T.; Uchida, T.G.Y.; Ogimoto, K. Use of support vector regression and numerically predicted cloudiness to forecast power output of a photovoltaic power plant in Kitakyushu, Japan. Prog. Photovolt. Res. Appl. 2012, 20, 874–882. [Google Scholar] [CrossRef]
- Hong, T.; Fan, S. Guest Editorial: Special Section on Analytics for Energy Forecasting with Applications to Smart Grid. IEEE Trans. Smart Grid 2014, 5, 399–401. [Google Scholar] [CrossRef]
- Antonanzas, J.; Osorio, N.; Escobar, R.; Urraca, R.; Ascacibar, F.J.; Antonanzas, F. Review of photovoltaic power forecasting. Sol. Energy 2016, 136, 78–111. [Google Scholar] [CrossRef]
- Rana, M.; Koprinska, I.; Agelidis, V. 2D-interval forecasts for solar power production. Sol. Energy 2015, 122, 191–203. [Google Scholar] [CrossRef]
- Wang, F.; Mi, Z.; Su, S.; Zhang, C. A practical model for single-step power prediction of grid-connected PV plant using artificial neural network. In Proceedings of the Innovative Smart Grid Technologies Asia, Perth, Australia, 13–16 November 2011; pp. 1–4. [Google Scholar]
- Chen, C.; Duan, S.; Cai, T.; Liu, B. Online 24-h solar power forecasting based on weather type classification using artificial neural networks. Sol. Energy 2011, 85, 2856–2870. [Google Scholar] [CrossRef]
- Lorenz, E.; Hurka, J.; Heinemann, D.; Beyer, H.G. Irradiance forecasting for the power prediction of grid-connected photovoltaic systems. IEEE J. Sel. Top. Appl. Earth Obs. Remote Sens. 2009, 2, 2–10. [Google Scholar] [CrossRef]
- Mellit, A.; Massi Pavan, A. A 24-h forecast of solar irradiance using artificial neural network: Application for performance prediction of a grid-connected PV plant at Trieste, Italy. Sol. Energy 2010, 84, 807–821. [Google Scholar] [CrossRef]
- Voyant, C.; Notton, G.; Kalogirou, S.; Nivet, M.-L.; Paoli, C.; Motte, F.; Fouilloy, A. Machine learning methods for solar radiation forecasting: A review. Renew. Energy 2017, 105, 569–582. [Google Scholar] [CrossRef]
- Dunlop, E.; Wald, L.; Suri, M. Solar Energy Resource Management for Electricity Generation from Local Level to Global Scale; Nova Science Publishers Inc.: Hauppauge, NY, USA, 2016. [Google Scholar]
- Zamora, R.; Dutton, E.G.; Trainer, M.; McKeen, S.A.; Wilczak, J.; Hou, Y.-T. The accuracy of solar irradiance calculations used in mesoscale numerical weather prediction. Mon. Weather Rev. 2005, 133, 783–792. [Google Scholar] [CrossRef]
- Perez, R.; Moore, K.; Wilcox, S.; Renné, D.; Zelenka, A. Forecasting solar radiation—Preliminary evaluation of an approach based upon the national forecast database. Sol. Energy 2007, 81, 809–812. [Google Scholar] [CrossRef]
- Pelland, S.; Galanis, G.; Kallos, G. Solar and photovoltaic forecasting through post-processing of the global environmental multiscale numerical weather prediction model. Prog. Photovolt. Res. Appl. 2013, 21, 284–296. [Google Scholar] [CrossRef]
- Mathiesen, P.; Kleissl, J. Evaluation of numerical weather prediction for intra-day solar forecasting in the continental United States. Sol. Energy 2011, 85, 967–977. [Google Scholar] [CrossRef]
- Gong, Y.; Lu, Z.; Qiao, Y.; Wang, Q. An Overview of Photovoltaic Energy System Output Forecasting Technology. Autom. Electr. Power Syst. 2016, 40, 141–151. [Google Scholar]
- Kim, S.-K.; Jeon, J.-H.; Cho, C.; Kim, E.-S.; Ahn, J. Modeling and simulation of a grid-connected PV generation system for electromagnetic transient analysis. Sol. Energy 2009, 83, 664–678. [Google Scholar] [CrossRef]
- Almeida, M.P.; Perpiñán, O.; Narvarte, L. PV power forecast using a nonparametric PV model. Sol. Energy 2015, 115, 354–368. [Google Scholar] [CrossRef]
- Gueymard, C.; Ruiz-Arias, J. Extensive worldwide validation and climate sensitivity analysis of direct irradiance predictions from 1-min global irradiance. Sol. Energy 2016, 128, 1–30. [Google Scholar] [CrossRef]
- Dolara, A.; Grimaccia, F.; Leva, S.; Mussetta, M.; Ogliari, E. A physical hybrid artificial neural network for short term forecasting of PV plant power output. Energies 2015, 8, 1138–1153. [Google Scholar] [CrossRef] [Green Version]
- Ayompe, L.M.; Duffy, A.; McCormack, S.J.; Conlon, M. Validated real-time energy models for small-scale grid-connected PV-systems. Energy 2010, 35, 4086–4091. [Google Scholar] [CrossRef]
- Ndiaye, A.; Charki, A.; Kobi, A.; Cheikh, M.F.; Kebe, C.M.F.; Ndiaye, P.A.; Sambou, V. Degradations of silicon photovoltaic modules: A literature review. Sol. Energy 2013, 96, 140–151. [Google Scholar] [CrossRef]
- Massi Pavan, A.; Mellit, A.; De Pieri, D. The effect of soiling on energy production for large-scale photovoltaic plants. Sol. Energy 2011, 85, 1128–1136. [Google Scholar] [CrossRef]
- Massi Pavan, A.; Mellit, A.; De Pieri, D.; Kalogirou, S.A. A comparison between BNN and regression polynomial methods for the evaluation of the effect of soiling in large scale photovoltaic plants. Appl. Energy 2013, 108, 392–401. [Google Scholar] [CrossRef]
- Pedro, H.T.C.; Coimbra, C.F.M. Assessment of forecasting techniques for solar power production with no exogenous inputs. Sol. Energy 2012, 86, 2017–2028. [Google Scholar] [CrossRef]
- Mandal, P.; Teja Swarroop Madhira, S.; Haque, A.; Meng, J.; Pineda, R.L. Forecasting Power Output of Solar Photovoltaic System Using Wavelet Transform and Artificial Intelligence Techniques. Proc. Comput. Sci. 2012, 12, 332–337. [Google Scholar] [CrossRef]
- Ciabattoni, L.; Ippoliti, G.; Longhi, S.; Cavalletti, M.; Rocchetti, M. Solar irradiation forecasting using RBF networks for PV systems with storage. In Proceedings of the IEEE International Conference on Industrial Technology, Athens, Greece, 19–21 March 2012; pp. 699–704. [Google Scholar]
- Wang, X.; Pengjiang, G. PV array output power forecasting based on similar day and RBFNN. Electr. Power Autom. Equip. 2013, 1, 100–103. [Google Scholar]
- Mellit, A.; Kalogirou, S. Artificial intelligence techniques for photovoltaic applications: A review. Prog. Energy Combust. Sci. 2008, 34, 574–632. [Google Scholar] [CrossRef]
- Tao, Y.; Chen, Y. Distributed PV power forecasting using genetic algorithm based neural network approach. In Proceedings of the 2014 International Conference on Advanced Mechatronic Systems (ICAMechs), Tokai, Japan, 10–12 August 2014. [Google Scholar]
- Dolara, A.; Leva, S.; Manzolini, G. Comparison of different physical models for PV power output prediction. Sol. Energy 2015, 119, 83–99. [Google Scholar] [CrossRef] [Green Version]
- Fernandez-Jimenez, L.; Muñoz Jiménez, A.; Falces, A.; Mendoza-Villena, M.; Garcia-Garrido, E.; Lara-Santillan, P.; Zorzano Alba, E.; Zorzano-Santamaria, P.J. Short-term power forecasting system for photovoltaic plants. Renew. Energy 2012, 44, 311–317. [Google Scholar] [CrossRef]
- Cao, J.; Lin, X. Study of hourly and daily solar irradiance forecast using diagonal recurrent wavelet neural networks. Energy Convers. Manag. 2008, 49, 1396–1406. [Google Scholar] [CrossRef]
- Hassanzadeh, M.; Etezadi-Amoli, M.; Fadali, S. Practical approach for sub-hourly and hourly prediction of PV power output. In Proceedings of the North American Power Symposium(NAPS), Arlington, TX, USA, 26–28 September 2010; pp. 1–5. [Google Scholar]
- Meng, Y.; Lu, J.; Sun, H.; Pan, X.; Gao, D.; Liao, Y. Short-Term Wind Power Forecasting Based on Similar Days and Artificial Neural Network. Power Syst. Technol. 2010, 34, 163–167. [Google Scholar]
- Dai, Q.; Duan, S.; Cai, T.; Chen, C.; Chen, Z.; Qiu, C. Short-term PV Generation System Forecasting Model Without Irradiation Based on Weather Type Clustering. Proc. CSEE 2011, 31, 28–35. [Google Scholar]
- Fu, M.P.; Ma, H.W.; Mao, J.R. Short-term photovoltaic power forecasting based on similar days and least square support vector machine. Power Syst. Prot. Control 2012, 40, 65–69. [Google Scholar]
- Shi, J.; Lee, W.; Liu, Y.; Yang, Y.; Wang, P. Forecasting power output of photovoltaic systems based on weather classification and support vector machines. IEEE Trans. Ind. Appl. 2012, 589, 1064–1069. [Google Scholar] [CrossRef]
- Zhou, L.; Liao, B.; Long, Y.; Zhang, L.; Li, H.; Du, J. Grid-connected photovoltaic power conditioner system based on amplitude integral. Electr. Power Autom. Equip. 2013, 33, 100–109. [Google Scholar]
- Wang, F.; Mi, Z.; Zhen, Z.; Yang, G.; Zhou, H. A classified forecasting approach of power generation for photovoltaic plants based on weather condition pattern recognition. Proc. CSEE 2013, 33, 75–82. [Google Scholar]
- Skoplaki, E.; Palyvos, J.A. On the temperature dependence of photovoltaic module electrical performance: A review of efficiency/power correlations. Sol. Energy 2009, 83, 614–624. [Google Scholar] [CrossRef]
- Marion, B. A method for modelling the current–voltage curve of a PV module for outdoor conditions. Prog. Photovolt. Res. Appl. 2002, 10, 205–214. [Google Scholar] [CrossRef]
- Wang, F.; Mi, Z.; Yang, Q.X.; Zhao, H. Power forecasting approach of PV plant based on ANN and relevant data. Acta Energ. Sin. 2012, 33, 1171–1177. [Google Scholar]
- Cheng, Z.; LIU, C.; LIU, L. A Method of Probabilistic Distribution Estimation of PV Generation Based on Similar Time of Day. Power Syst. Technol. 2017, 41, 448–454. [Google Scholar]
- Wang, F. Power Forecasting Approach and System of Grid-Connected PV Plant. North China Elec. Power Univ. 2013, 6. [Google Scholar]
- Shen, H.Y.; Wang, Z.X.; Gao, C.Y. Determining the number of BP neural network hidden layer units. J. TianJin Univ. Technol. 2008, 24, 13–15. [Google Scholar]
- Kohavi, R. A study of cross-validation and bootstrap for accuracy estimation and model selection. In Proceedings of the International Joint Conference on Artificial Intelligence, Montreal, QC, Canada, 20–25 August 1995; Morgan Kaufmann Publishers Inc.: San Francisco, CA, USA, 1995; pp. 1137–1143. [Google Scholar]
Figure 1.
Time scales and spatial scales of photovoltaic (PV) power forecasting.
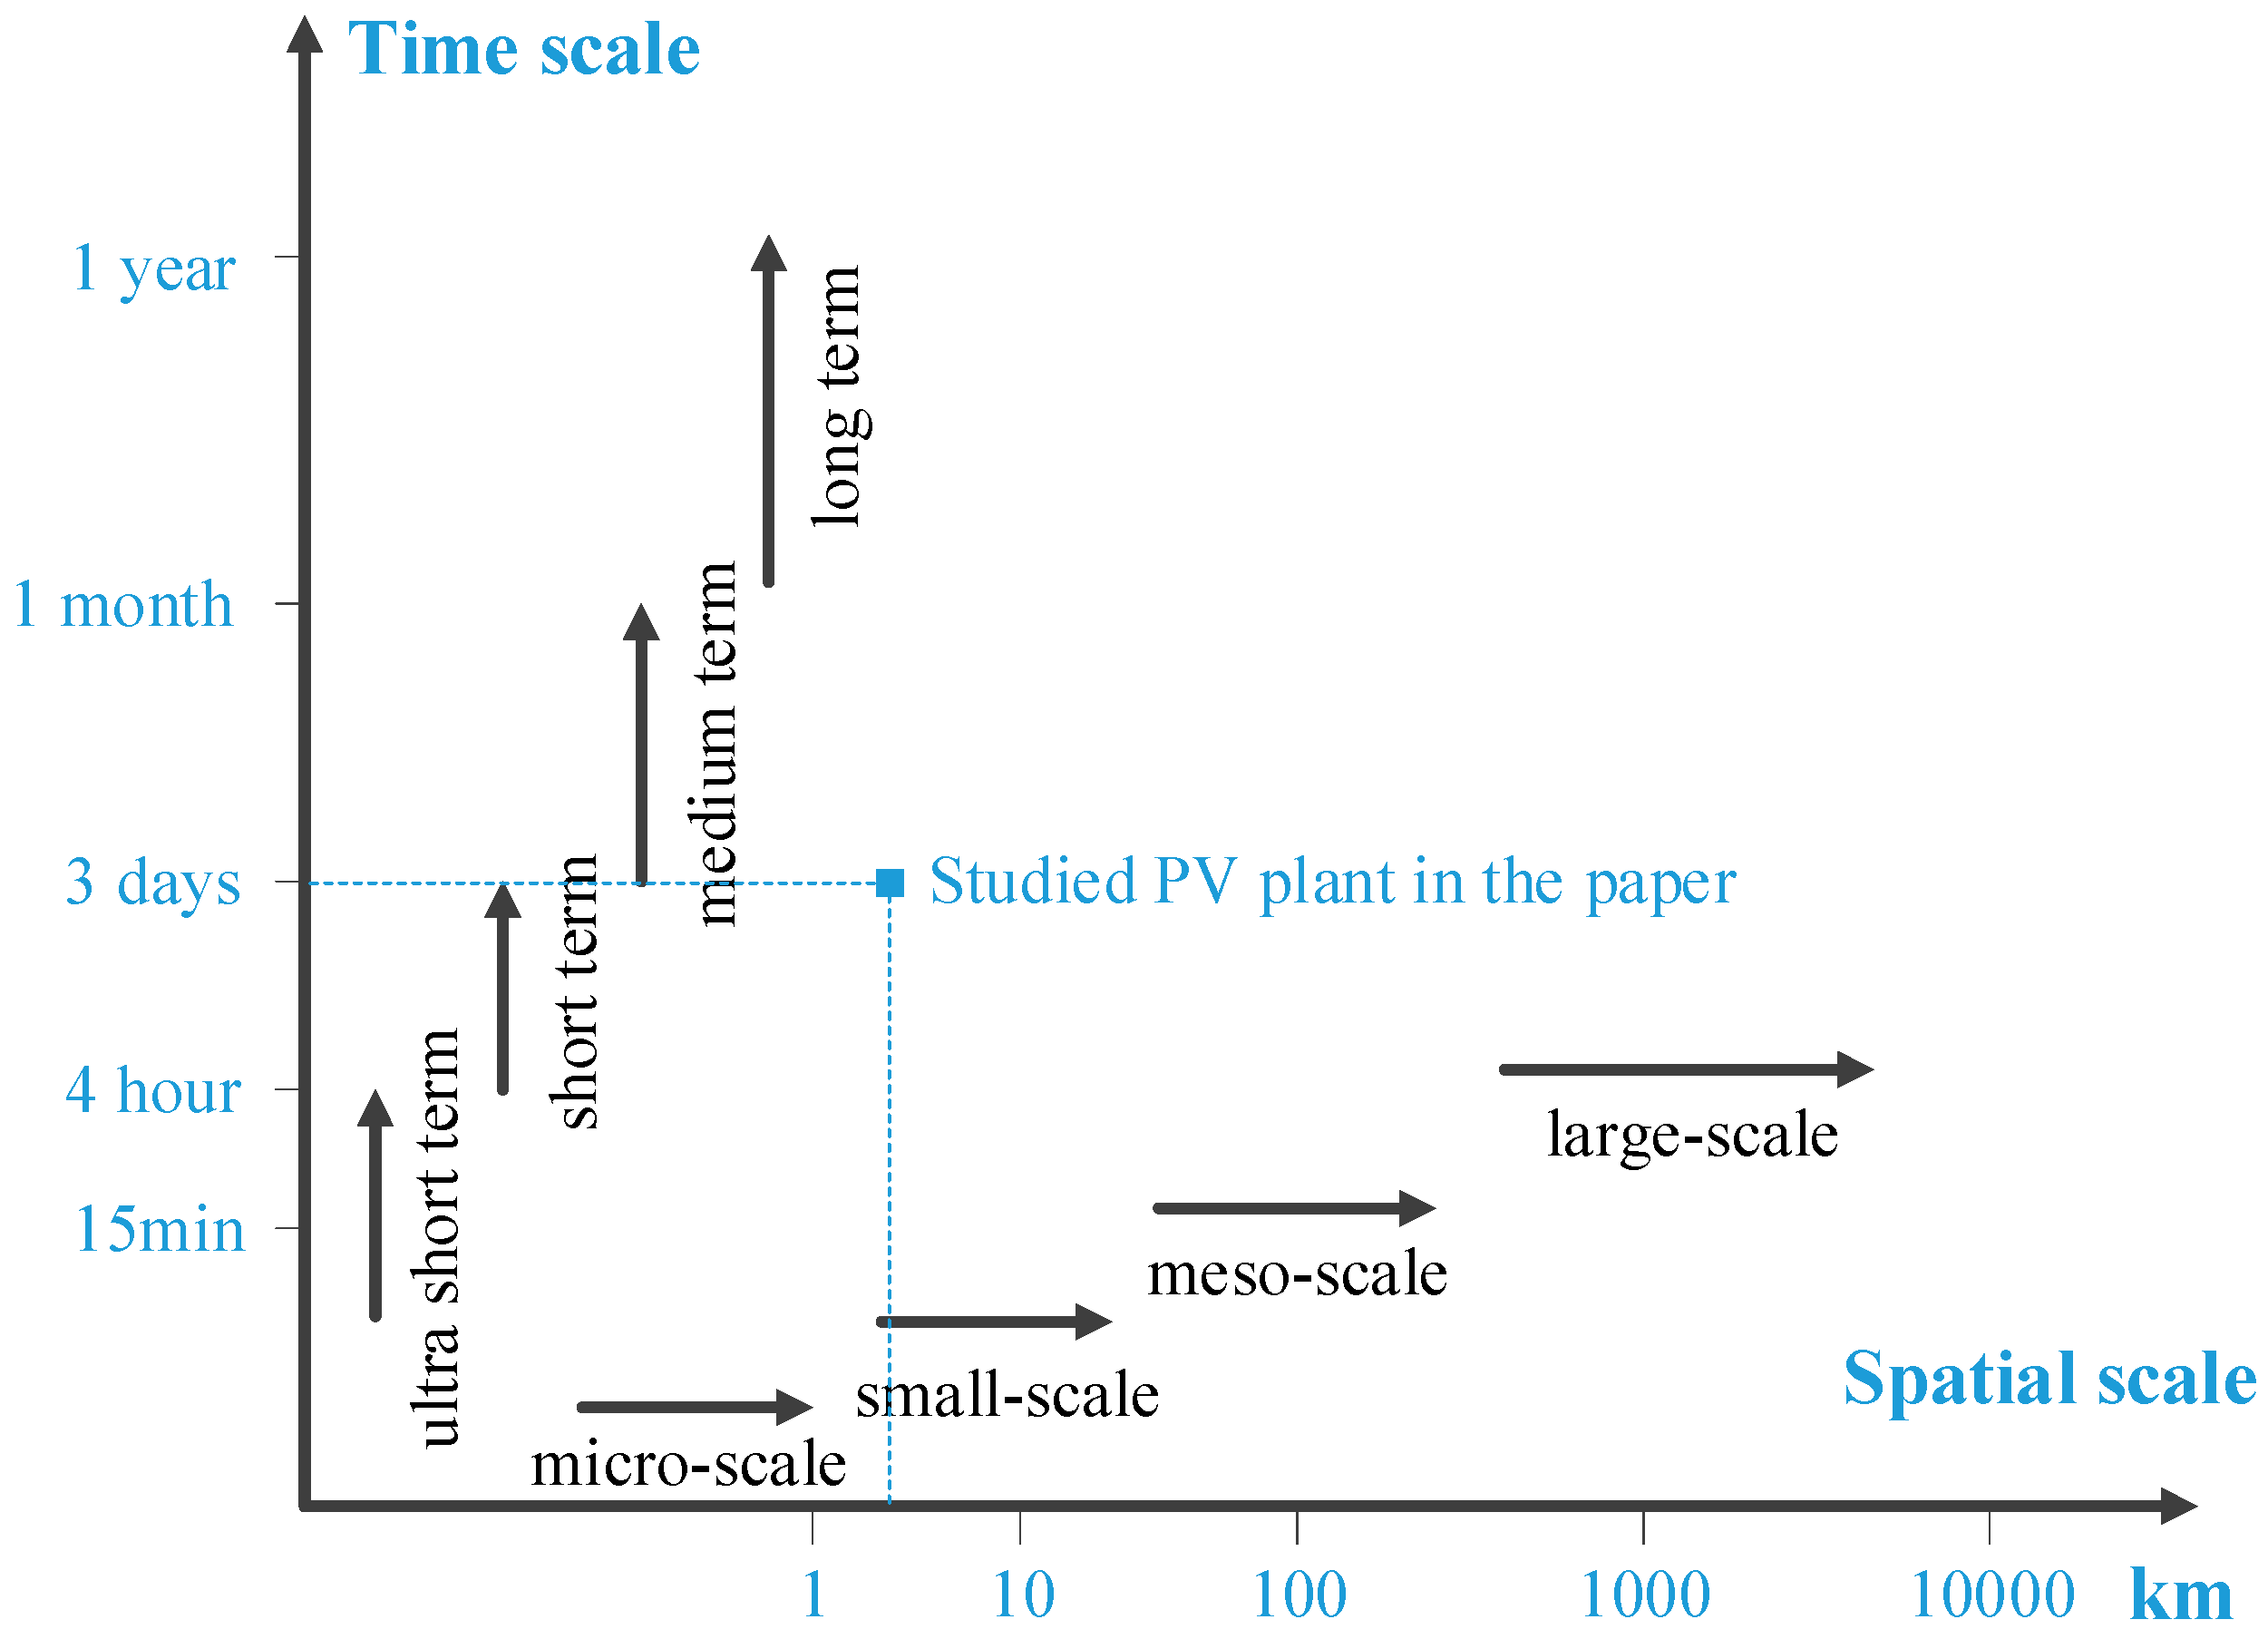
Figure 2.
(a) Electrical characteristics of silicon-based solar modules under different temperatures; (b) Electrical characteristics of silicon-based solar modules under different solar irradiance conditions.
Figure 2.
(a) Electrical characteristics of silicon-based solar modules under different temperatures; (b) Electrical characteristics of silicon-based solar modules under different solar irradiance conditions.

Figure 3.
(a) Solar irradiance from November 2016–October 2017; (b) ambient temperature from November 2016–October 2017.
Figure 3.
(a) Solar irradiance from November 2016–October 2017; (b) ambient temperature from November 2016–October 2017.
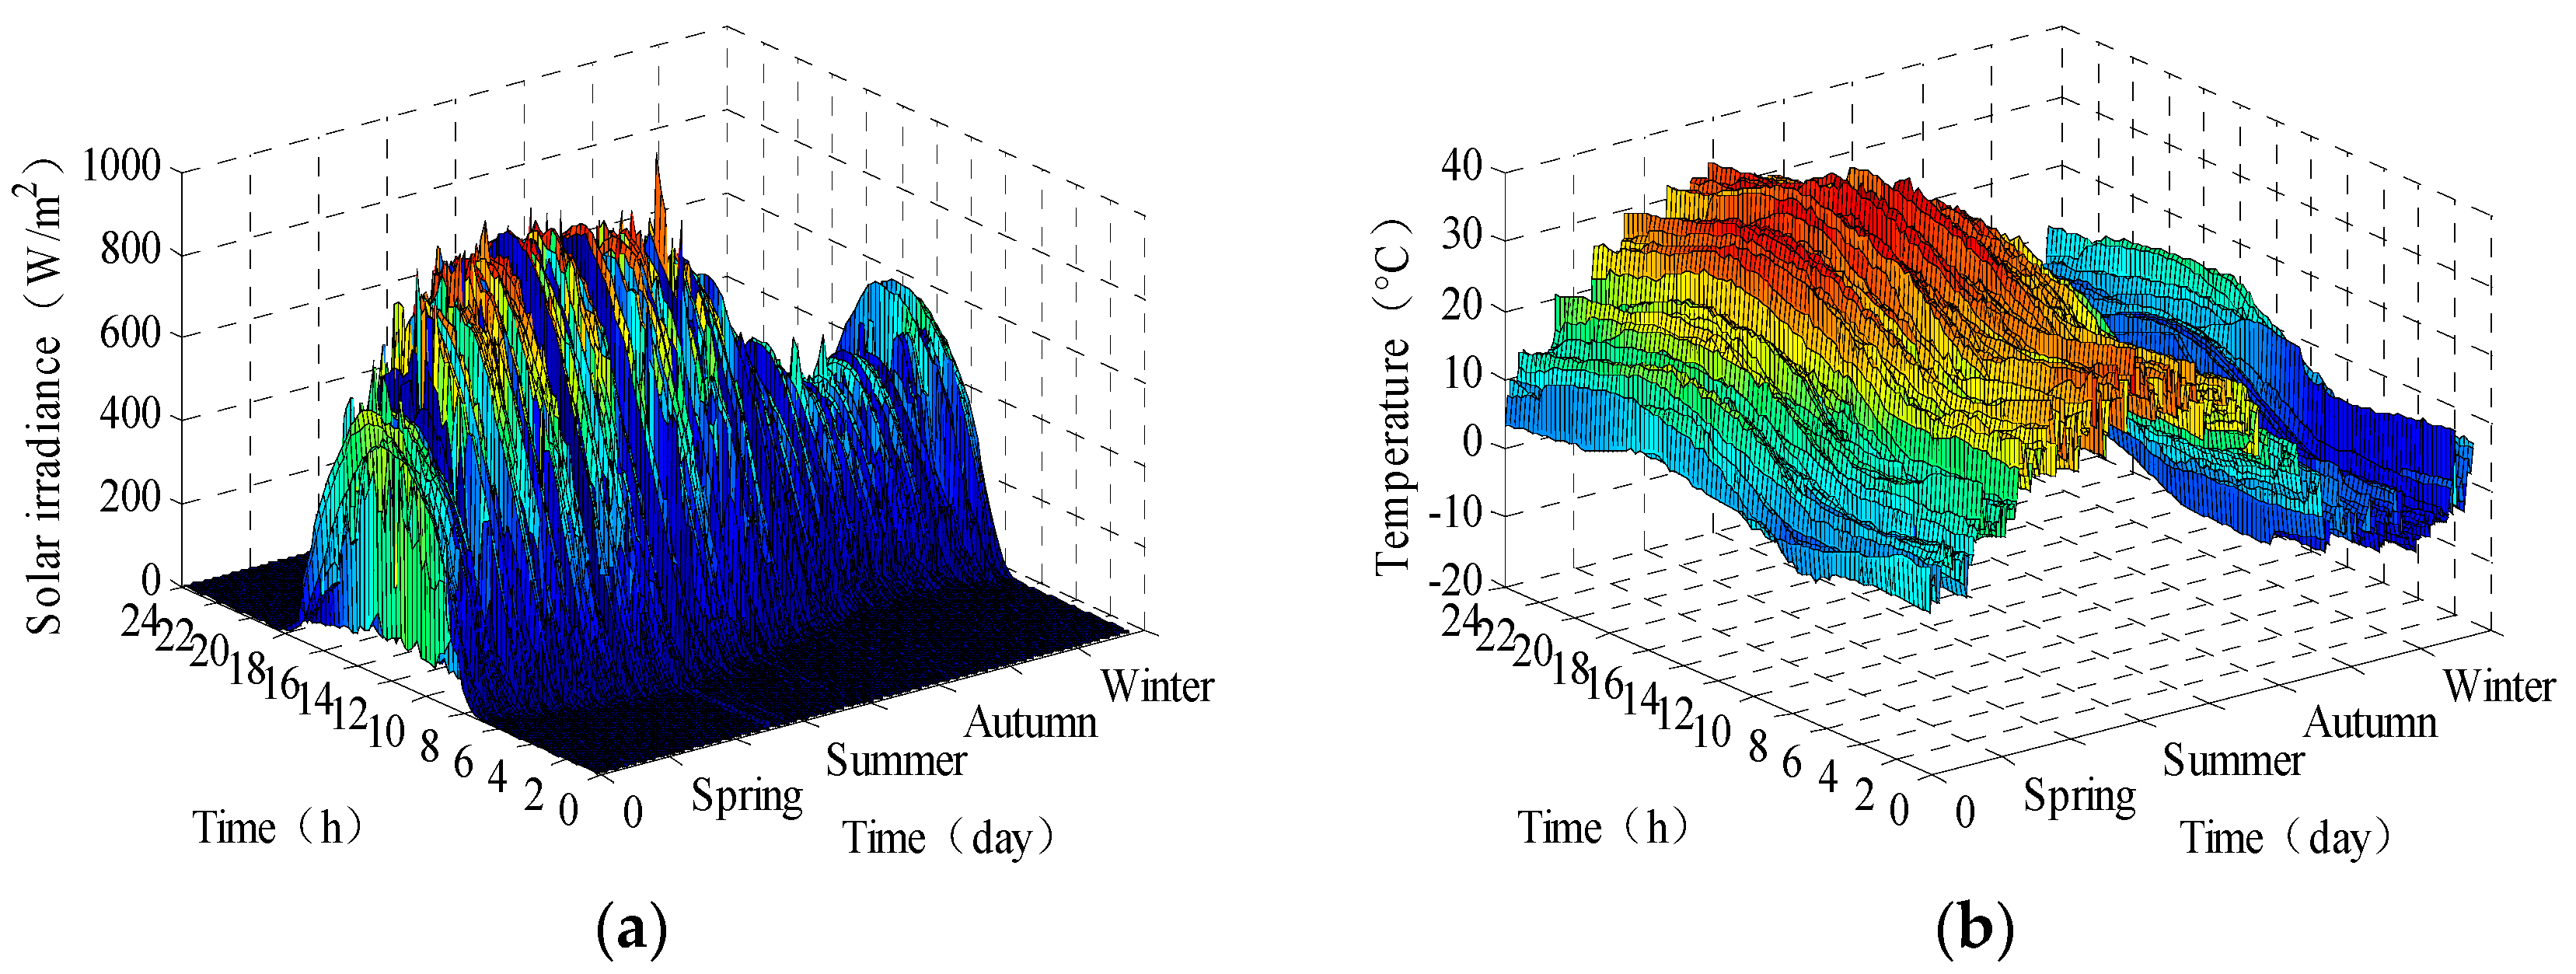
Figure 4.
(a) Average solar irradiance per month at different times of a day; (b) average solar irradiance of each season at different times of a day.
Figure 4.
(a) Average solar irradiance per month at different times of a day; (b) average solar irradiance of each season at different times of a day.
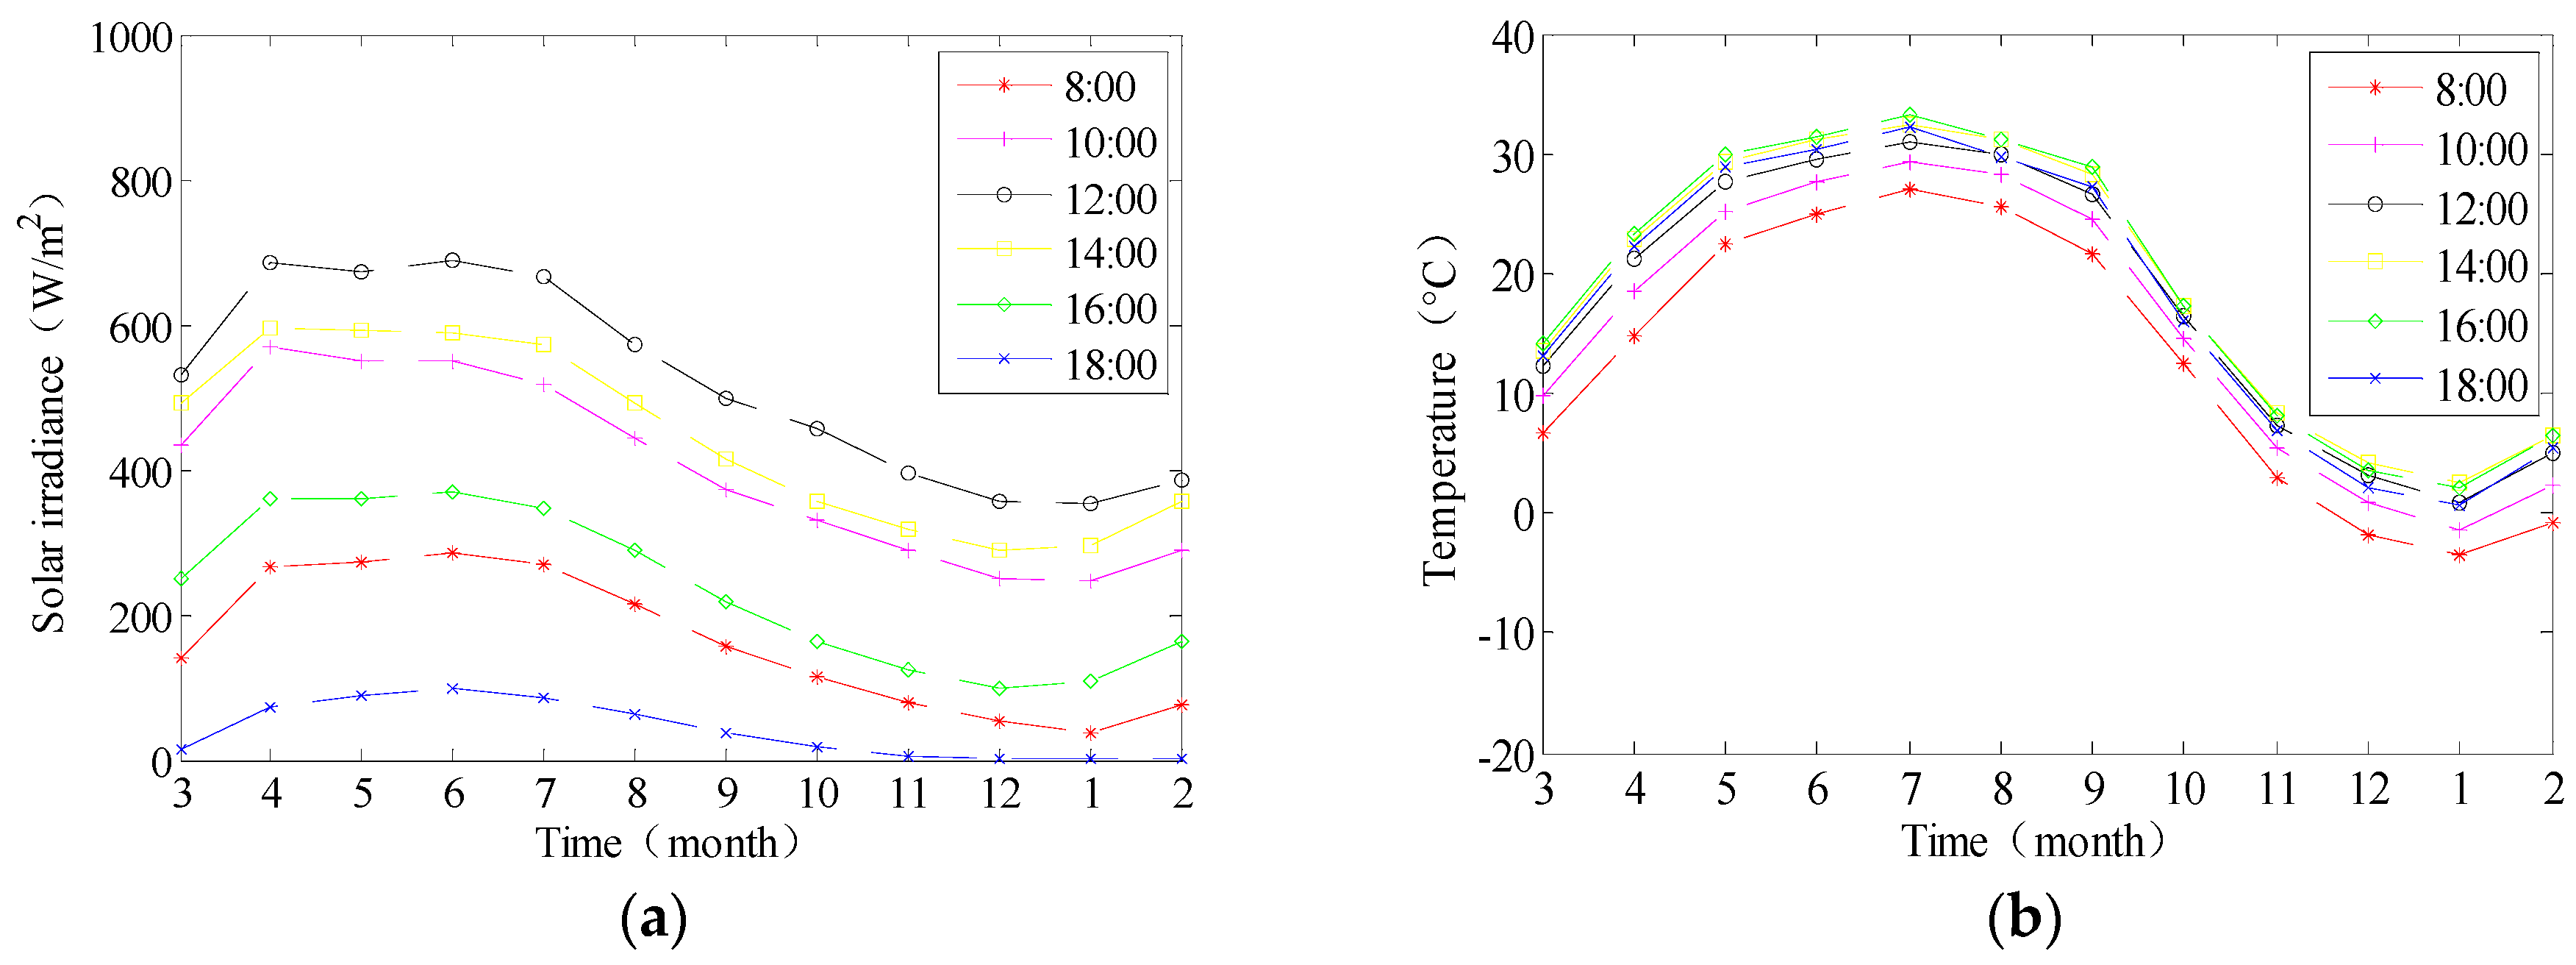
Figure 5.
(a) Average ambient temperature per month at different times of a day; (b) average ambient temperature of each season at different times of a day.
Figure 5.
(a) Average ambient temperature per month at different times of a day; (b) average ambient temperature of each season at different times of a day.
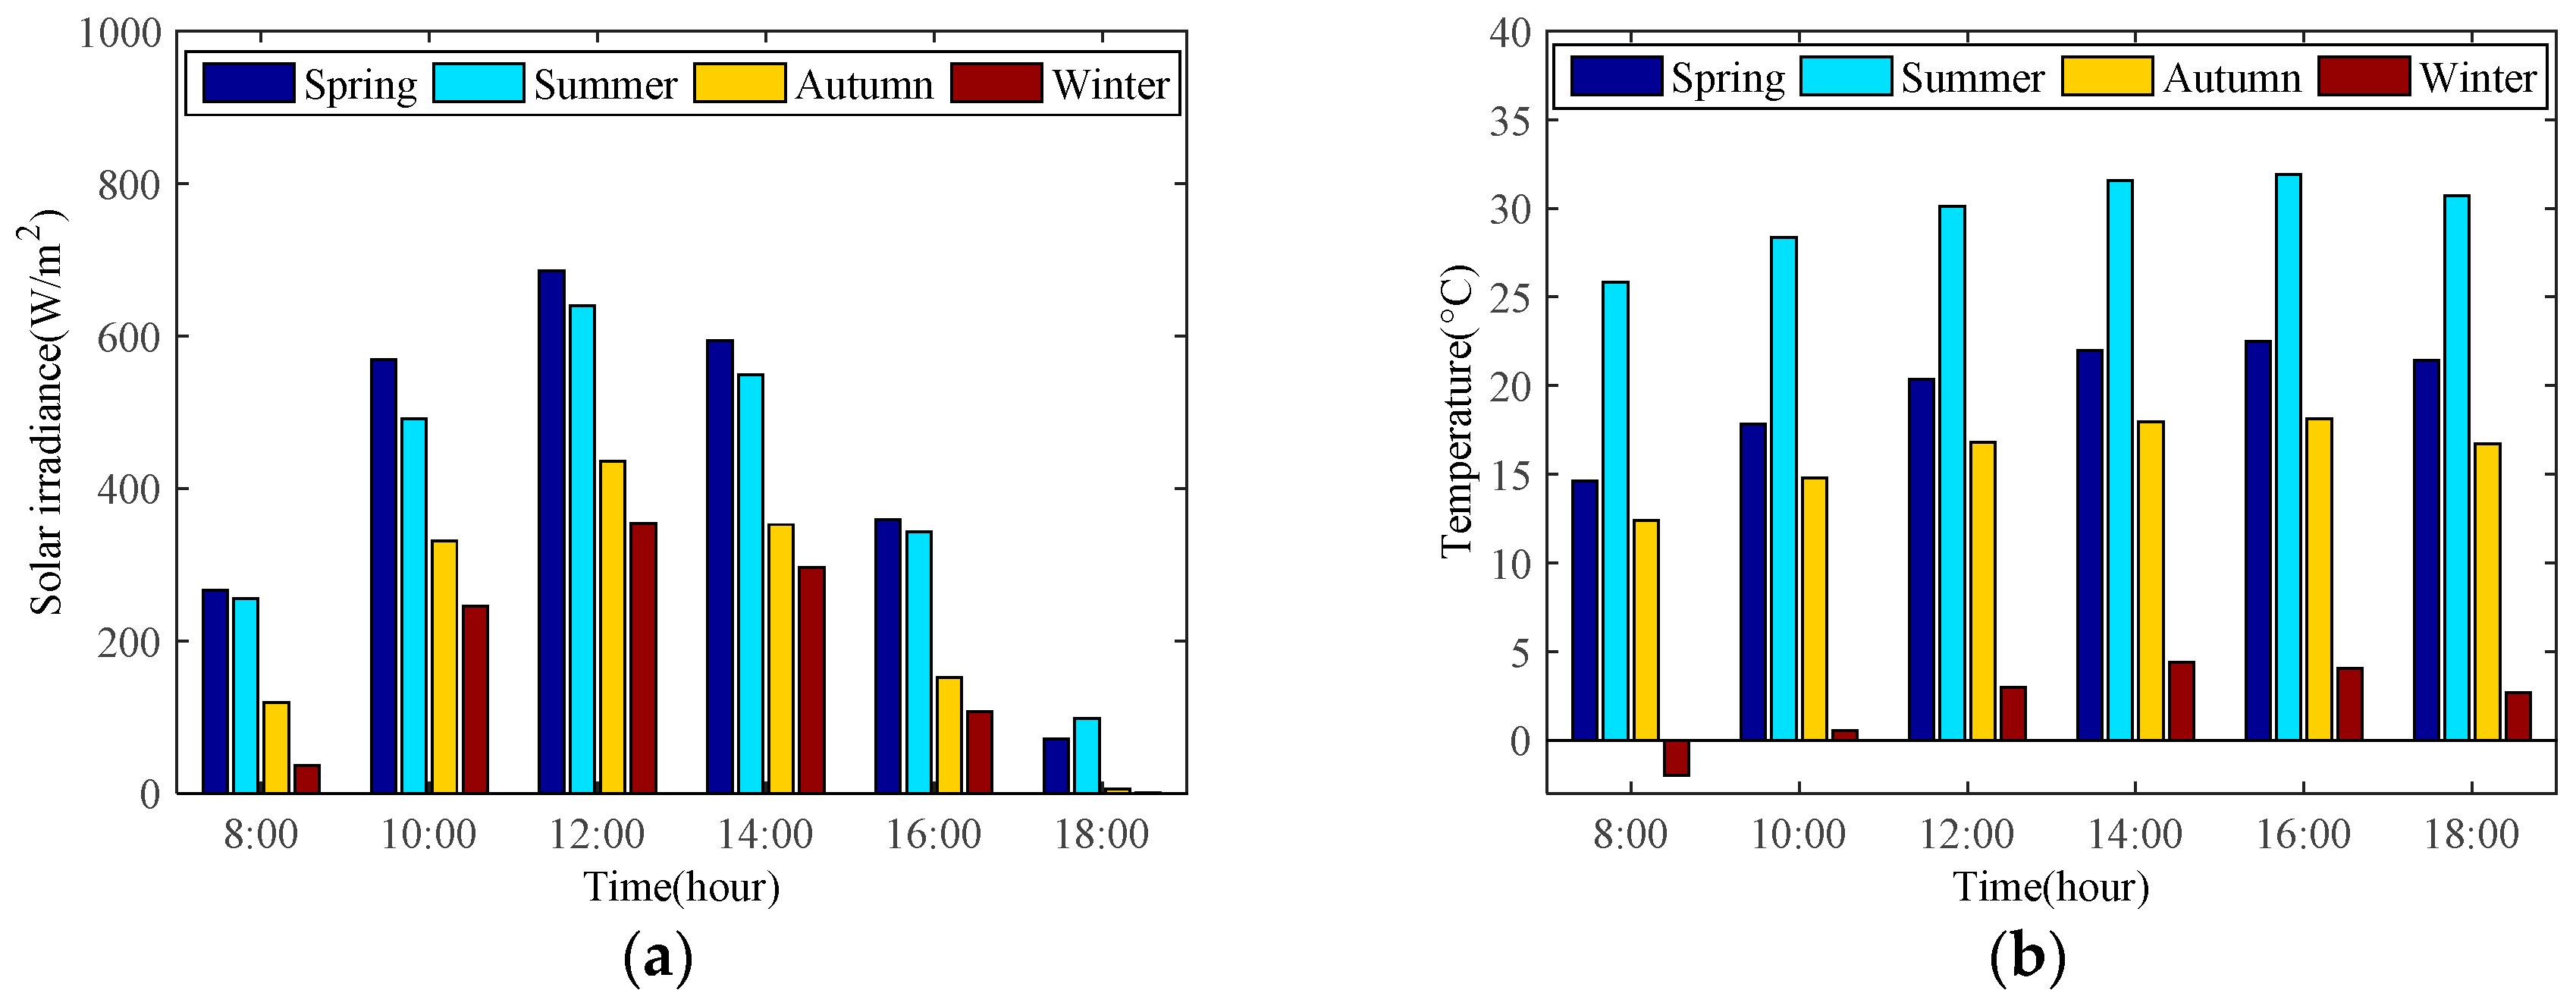
Figure 6.
Seasonal characteristics of PV output power from November 2016–October 2017. (a) PV output power from November 2016–October 2017; (b) average PV output power per month in different times of a day; (c) average PV output power of each season at different times of a day.
Figure 6.
Seasonal characteristics of PV output power from November 2016–October 2017. (a) PV output power from November 2016–October 2017; (b) average PV output power per month in different times of a day; (c) average PV output power of each season at different times of a day.
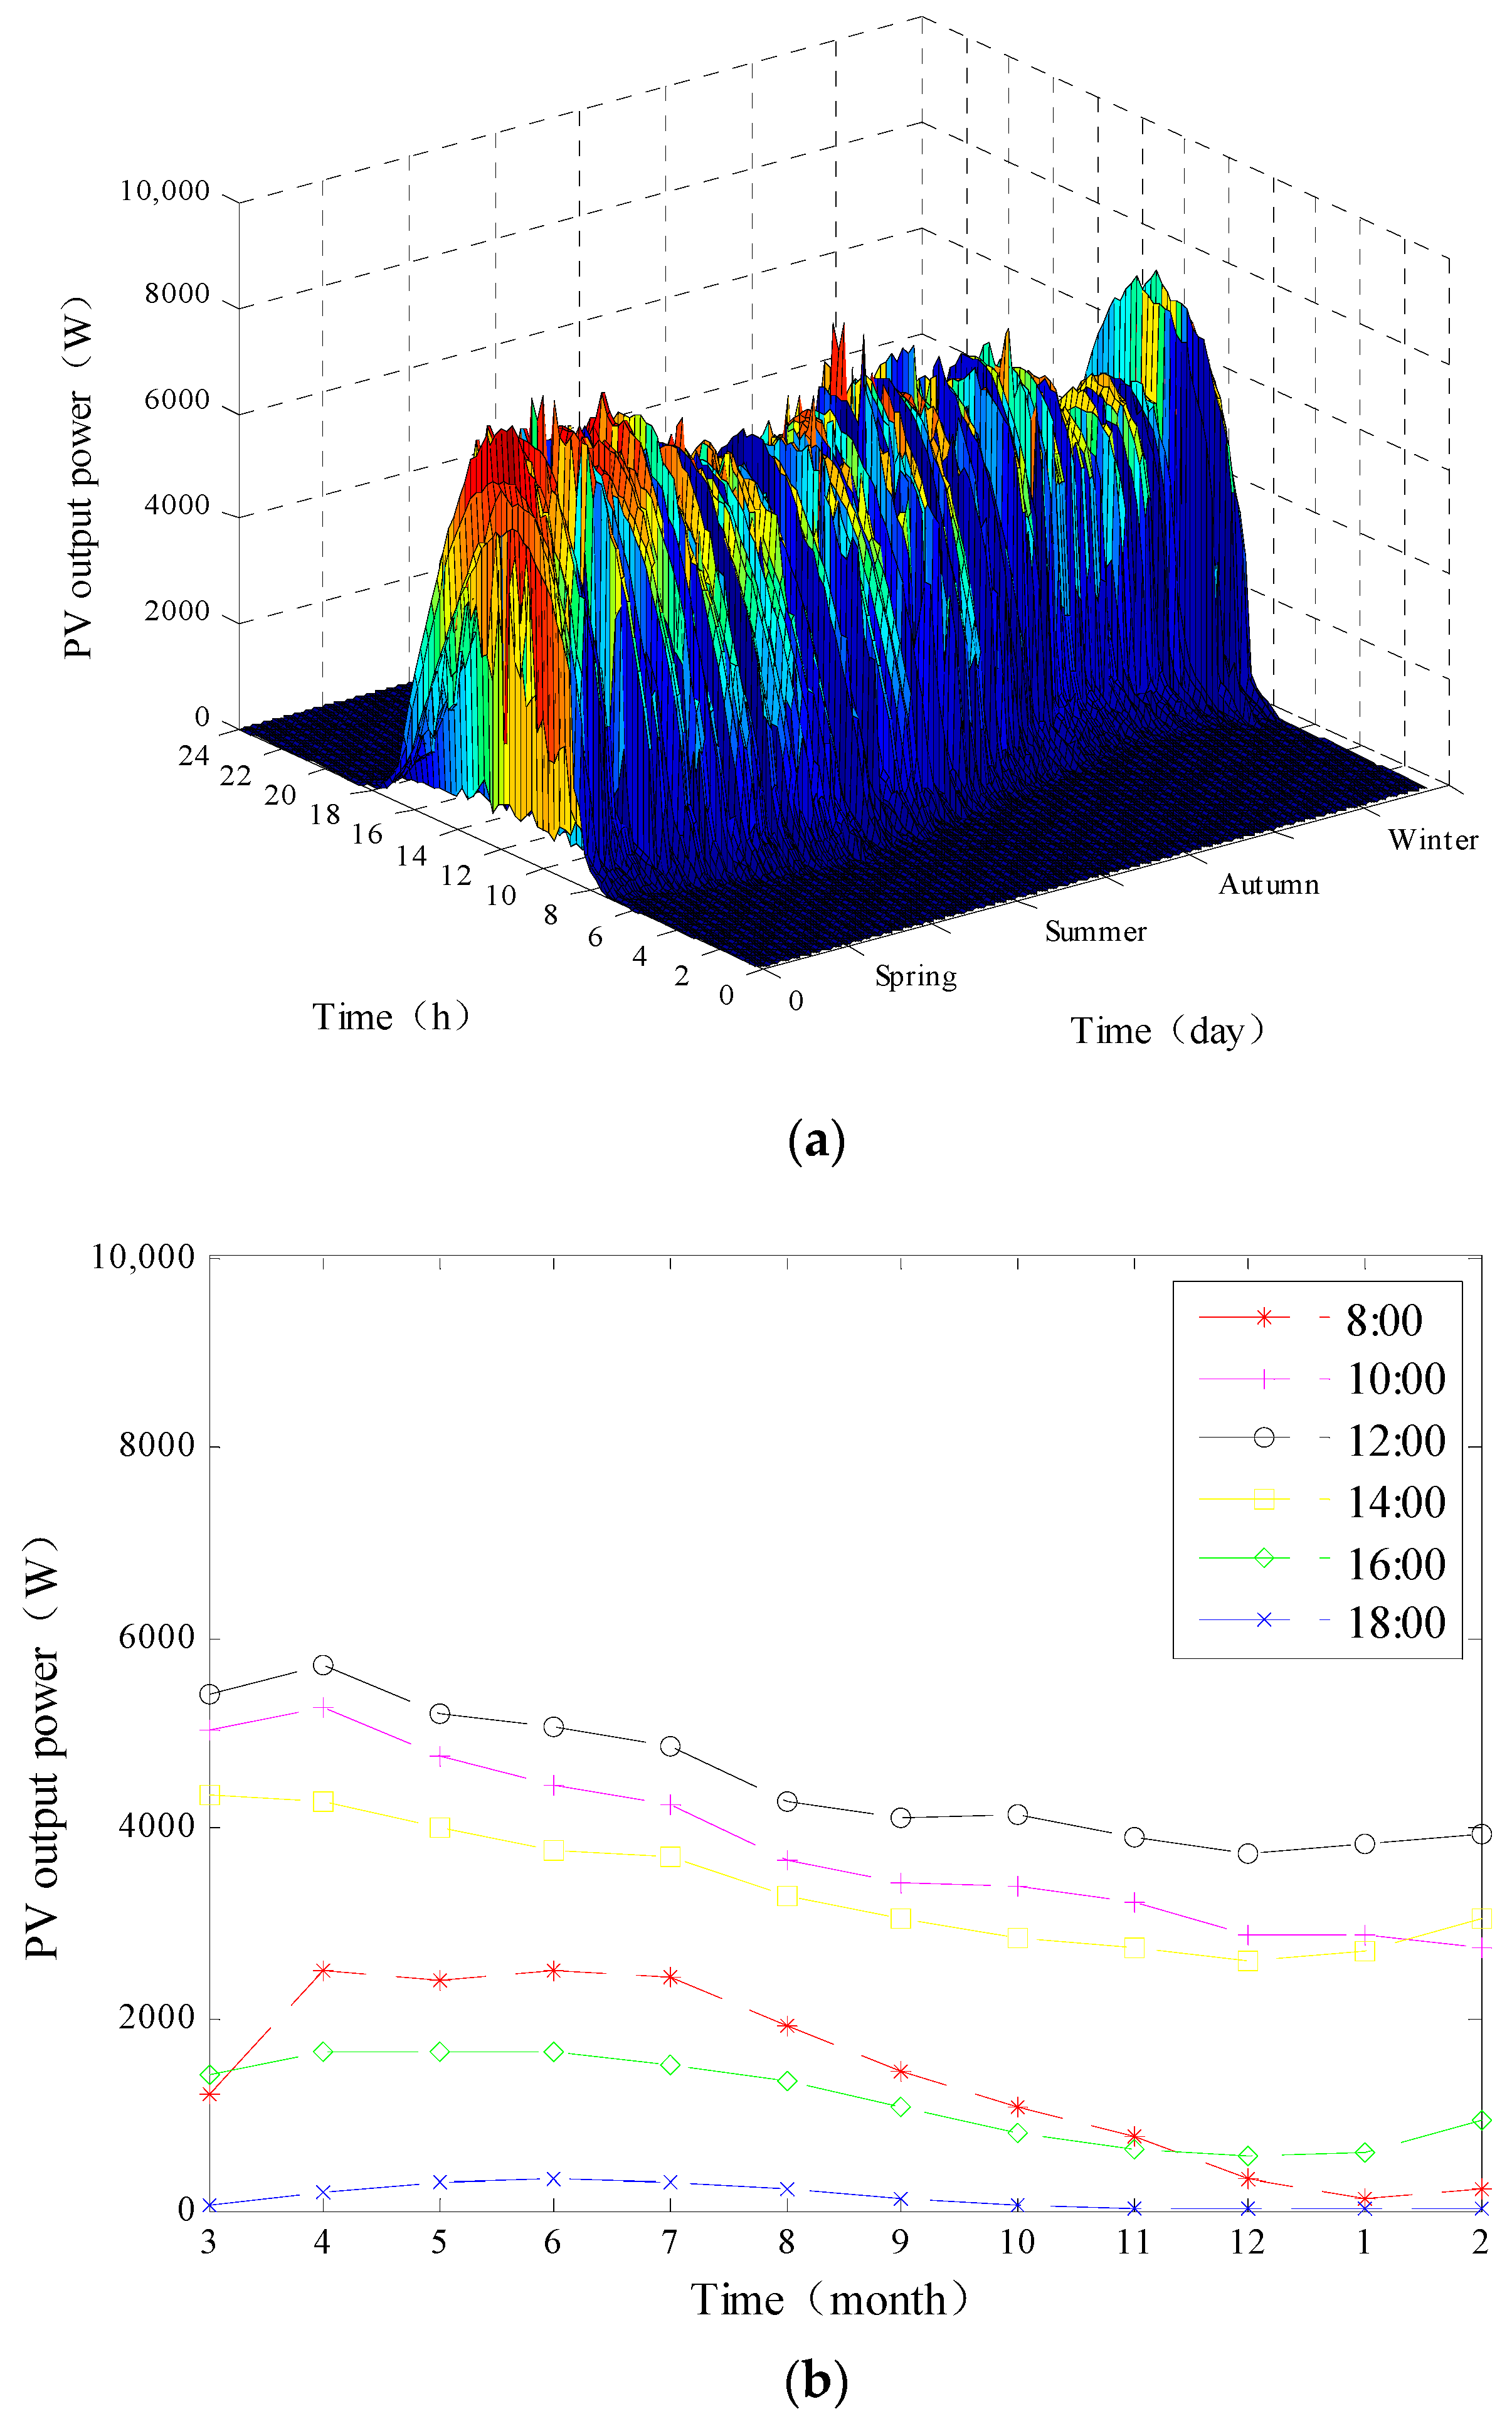

Figure 7.
Structure optimization of back propagation neural network (BPNN).

Figure 8.
PV power forecasting based on seasonal models.
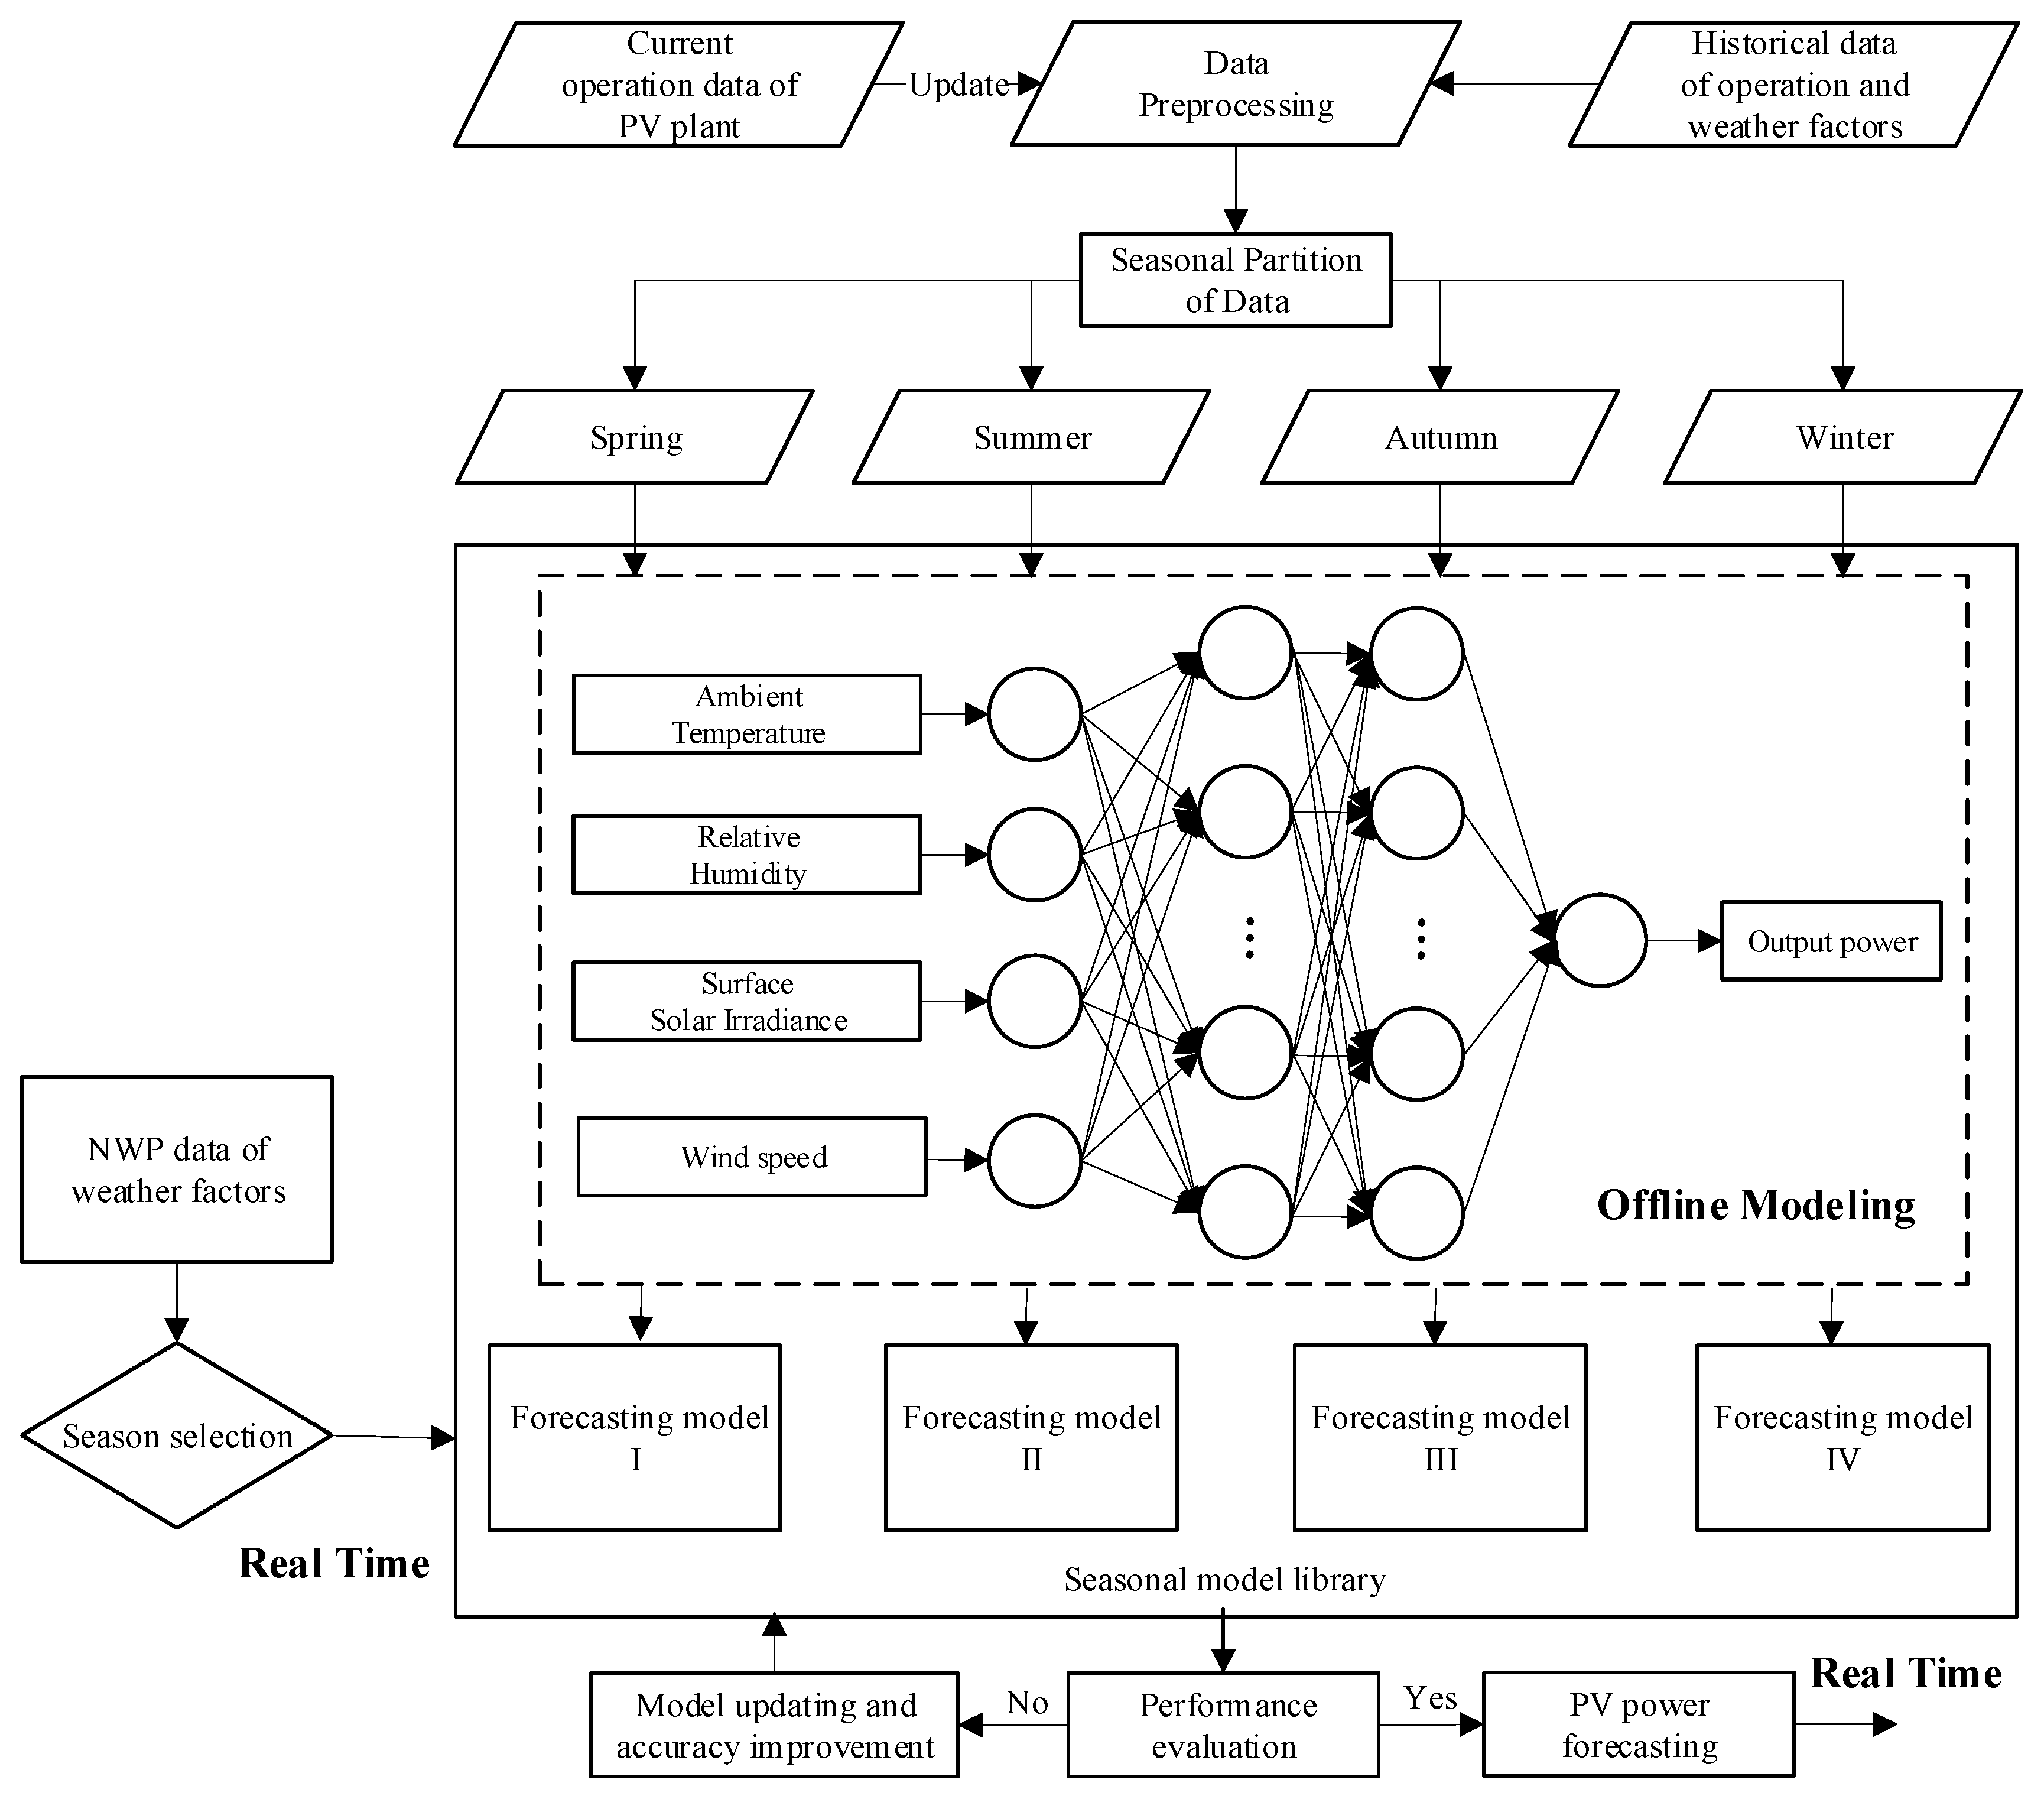
Figure 9.
Comparison results of multi-seasons model and year model.


Table 1.
Seasonal characteristics of PV output power, solar irradiance, and ambient temperature.
| Classes | Indexes | Spring | Summer | Autumn | Winter |
|---|---|---|---|---|---|
| PV output power (W) | max | 8359 | 8409 | 7674 | 7554 |
| mean | 1652.601 | 1328.891 | 1050.705 | 854.372 | |
| Solar irradiance (W/m2) | max | 1030 | 1106 | 865 | 607 |
| mean | 215.704 | 201.306 | 119.911 | 87.040 | |
| Ambient temperature (°C) | max | 38.7 | 41 | 34.6 | 16.1 |
| min | 0.3 | 15.4 | −5.2 | −8.7 | |
| mean | 17.83 | 27.89 | 15.23 | 0.97 |
Table 2.
Path analysis among influence factors and PV power in spring.
| Independent Variable | Realsun | Realtem | Realhum | Realwin | |
|---|---|---|---|---|---|
| Correlation Coefficient of Dependent Variable | 0.95873 | 0.255731 | −0.31341 | 0.272908 | |
| Direct Path Coefficient | 1.021881 | −0.12474 | −0.0052 | −0.04526 | |
| Indirect Path Coefficient | realsun | - | 0.398408 | −0.35771 | 0.368896 |
| realtem | −0.04863 | - | 0.030323 | −0.05293 | |
| realhum | 0.00182 | 0.001264 | - | 0.002203 | |
| realwin | −0.01634 | −0.01921 | 0.019179 | - | |
| Total Coefficient of Indirect Path | −0.06315 | 0.380466 | −0.30821 | 0.318169 | |
Table 3.
Path analysis among influence factors and PV power in summer.
| Independent Variable | Realsun | Realtem | Realhum | Realwin | |
|---|---|---|---|---|---|
| Correlation Coefficient of Dependent Variable | 0.975757 | 0.364541 | −0.39879 | 0.200967 | |
| Direct Path Coefficient | 1.01065 | −0.06376 | 0.011728 | −0.00951 | |
| Indirect Path Coefficient | realsun | - | 0.436579 | −0.45203 | 0.223661 |
| realtem | −0.02754 | - | 0.037907 | −0.00874 | |
| realhum | −0.00525 | −0.00697 | - | −0.00444 | |
| realwin | −0.0021 | −0.0013 | 0.003601 | - | |
| Total Coefficient of Indirect Path | −0.03489 | 0.428303 | −0.41052 | 0.210475 | |
Table 4.
Path analysis among influence factors and PV power in autumn.
| Independent Variable | Realsun | Realtem | Realhum | Realwin | |
|---|---|---|---|---|---|
| Correlation Coefficient of Dependent Variable | 0.974487 | 0.462872 | −0.45872 | 0.145937 | |
| Direct Path Coefficient | 1.006202 | −0.0795 | −0.03496 | −0.0433 | |
| Indirect Path Coefficient | realsun | - | 0.519011 | −0.49694 | 0.185212 |
| realtem | −0.04101 | - | 0.06067 | −0.00608 | |
| realhum | 0.017264 | 0.026675 | - | 0.010098 | |
| realwin | −0.00797 | −0.00331 | 0.012508 | - | |
| Total Coefficient of Indirect Path | −0.03172 | 0.542377 | −0.42376 | 0.189234 | |
Table 5.
Path analysis among influence factors and PV power in winter.
| Independent Variable | Realsun | Realtem | Realhum | Realwin | |
|---|---|---|---|---|---|
| Correlation Coefficient of Dependent Variable | 0.956769 | 0.19684 | −0.28237 | 0.224916 | |
| Direct Path Coefficient | 0.974543 | −0.04214 | 0.025597 | 0.003372 | |
| Indirect Path Coefficient | realsun | - | 0.24123 | −0.30972 | 0.228889 |
| realtem | −0.01043 | - | 0.00321 | 0.003722 | |
| realhum | −0.00813 | −0.00195 | - | −0.01107 | |
| realwin | 0.000792 | −0.0003 | −0.00146 | - | |
| Total Coefficient of Indirect Path | −0.01777 | 0.238982 | −0.30796 | 0.221544 | |
Table 6.
The path analysis of power influencing factors in annual year.
| Independent Variable | Realsun | Realtem | Realhum | Realwin | |
|---|---|---|---|---|---|
| Correlation Coefficient of Dependent Variable | 0.950524 | 0.223799 | −0.33318 | 0.240803 | |
| Direct Path Coefficient | 0.999056 | −0.11028 | 0.007113 | −0.03114 | |
| Indirect Path Coefficient | realsun | - | 0.336672 | −0.34796 | 0.285248 |
| realtem | −0.03716 | - | −0.00521 | −0.01037 | |
| realhum | −0.00248 | 0.000336 | - | −0.00294 | |
| realwin | −0.00889 | −0.00293 | 0.012875 | - | |
| Total Coefficient of Indirect Path | −0.04853 | 0.334081 | −0.34029 | 0.271942 | |
Table 7.
Setting of different forecasting models.
| Name of Method | Method Description | BPNN Hidden Layers Nodes | |
|---|---|---|---|
| Model_Year_Multi-layer | The input of the model is solar irradiance, ambient temperature, relative humidity and wind speed. The output is the PV power. Based stepwise experimental method, the BPNN structure is tested by k-fold cross validation. Genetic algorithm is used to optimize initial weights and thresholds | 50 | 30 |
| Model_Spring_Multi-layer | 50 | 15 | |
| Model_Summer_Multi-layer | 63 | 10 | |
| Model_Autumn_Multi-layer | 52 | 30 | |
| Model_Winter_Multi-layer | 60 | 20 | |
| Model_Spring_Single-layer | 12 | ||
| Model_Summer_Single-layer | 20 | ||
| Model_Autumn_Single-layer | 15 | ||
| Model_Winter_Single-layer | 10 | ||
Table 8.
Multi-model and annual model prediction error analysis based on seasonal characteristics.
| Classes | Spring | Summer | Autumn | Winter | |
|---|---|---|---|---|---|
| RMSE | Multi-seasons model | 2.98 | 4.42 | 4.49 | 2.12 |
| Year model | 4.77 | 9.45 | 9.51 | 4.98 | |
| MAE | Multi-seasons model | 1.33 | 1.65 | 1.65 | 0.61 |
| Year model | 2.15 | 3.59 | 6.54 | 1.61 | |
| Accuracy | Multi-seasons model | 97.02 | 95.58 | 95.51 | 97.88 |
| Year model | 93.86 | 90.55 | 90.49 | 95.01 | |
Table 9.
Multi-layer back propagation neural network (BPNN) model, single-layer BPNN model, and support vector machine (SVM) model prediction error analysis based on seasonal characteristics.
Table 9.
Multi-layer back propagation neural network (BPNN) model, single-layer BPNN model, and support vector machine (SVM) model prediction error analysis based on seasonal characteristics.
| Classes | Spring | Summer | Autumn | Winter | |
|---|---|---|---|---|---|
| RMSE | Multi-layers BPNN model | 2.98 | 4.42 | 4.49 | 2.12 |
| Single-layer BPNN model | 6.14 | 8.86 | 6.73 | 5.29 | |
| SVM | 10.95 | 11.79 | 9.55 | 9.72 | |
| MAE | Multi-layers BPNN model | 1.33 | 1.65 | 1.65 | 0.61 |
| Single-layer BPNN model | 3.05 | 2.96 | 2.95 | 1.96 | |
| SVM | 7.26 | 3.59 | 6.54 | 6.55 | |
| Accuracy | Multi-layers BPNN model | 97.02 | 95.58 | 95.51 | 97.88 |
| Single-layer BPNN model | 93.86 | 91.14 | 93.27 | 94.71 | |
| SVM | 95.05 | 92.21 | 90.45 | 95.28 | |
© 2018 by the authors. Licensee MDPI, Basel, Switzerland. This article is an open access article distributed under the terms and conditions of the Creative Commons Attribution (CC BY) license (http://creativecommons.org/licenses/by/4.0/).
Share and Cite
MDPI and ACS Style
Hu, Y.; Lian, W.; Han, Y.; Dai, S.; Zhu, H. A Seasonal Model Using Optimized Multi-Layer Neural Networks to Forecast Power Output of PV Plants. Energies 2018, 11, 326. https://doi.org/10.3390/en11020326
AMA Style
Hu Y, Lian W, Han Y, Dai S, Zhu H. A Seasonal Model Using Optimized Multi-Layer Neural Networks to Forecast Power Output of PV Plants. Energies. 2018; 11(2):326. https://doi.org/10.3390/en11020326
Chicago/Turabian StyleHu, Yang, Weiwei Lian, Yutong Han, Songyuan Dai, and Honglu Zhu. 2018. "A Seasonal Model Using Optimized Multi-Layer Neural Networks to Forecast Power Output of PV Plants" Energies 11, no. 2: 326. https://doi.org/10.3390/en11020326
Note that from the first issue of 2016, this journal uses article numbers instead of page numbers. See further details here.