Experimental Study on Improvement of Performance by Wave Form Cathode Channels in a PEM Fuel Cell


1
SFR NSSS System Design Division, Korea Atomic Energy Research Institute, 111 Daedeok-daero 989 Beon-gil, Yuseong-gu, Daejeon 34057, Korea
2
Department of Mechanical Engineering, Sunmoon University, 221-70 Sunmoon-ro, Tangjeong-myeon, Asan-si, Chungcheongnam-do 31460, Korea
3
Graduate School of Disaster Prevention, Kangwon National University, 346 Joongang-ro, Samcheck-si, Gangwon-do 25913, Korea
*
Author to whom correspondence should be addressed.
Energies 2018, 11(2), 319; https://doi.org/10.3390/en11020319
Submission received: 14 December 2017
/
Revised: 3 January 2018
/
Accepted: 26 January 2018
/
Published: 2 February 2018
(This article belongs to the Special Issue Polymer Electrolyte Membrane Fuel Cells 2017)
Abstract
:We propose a wave-like design on the surface of cathode channels (wave form cathode channels) to improve oxidant delivery to gas diffusion layers (GDLs). We performed experiments using proton-exchange membrane fuel cells (PEMFCs) combined with wave form surface design on cathodes. We varied the factors of the distance between wave-bumps (the adhesive distance, AD), and the size of the wave-bumps (the expansion ratio, ER). The ADs are three, four, and five times the size of the half-circle bump’s radius, and the ERs are two-thirds, one-half, and one-third of the channel’s height. We evaluated the performances of the fuel cells, and compared the current-voltage (I-V) relations. For comparison, we prepared PEMFCs with conventional flat-surfaced oxygen channels. Our aim in this work is to identify fuel cell operation by modifying the surface design of channels, and ultimately to find the optimal design of cathode channels that will maximize fuel cell performance.
1. Introduction
Most energy comes from fossil fuels. However, reserves of fossil fuels will soon reach their limits. Furthermore, the problems of environmental pollution and climate change due to fossil fuel usage have created the need to develop new energy sources. Thus, study on developing various renewable energy sources is being conducted. The South Korean government is also actively supporting the development of various renewable energy resources. Energy alternatives, including wind energy, solar cells, and fuel cells, are under development. In fuel cell research, researchers are addressing flow field patterns to supply fuel and oxygen more effectively [1]. Since the internal structure in a fuel cell cannot be directly observed, measurement is difficult [2].
Therefore, research combining computational analysis with experimentation is ongoing. Looking at some of the leading research, Springer et al. [3] conducted experiments using Nafion 117 membrane to observe various phenomena, including the electro-osmotic drag phenomenon, and presented parameters of membranes in constant humid conditions, using equations based on the values obtained from their experiments. Natarajan and Nguyen [4] suggested a numerical analysis method of fuel cell flow regarding two-phase flow. They verified that the fuel cell performance improved in a thinner gas diffusion layer (GDL) and higher porosity. Yoon et al. [5] conducted experiments varying the proton-exchange membrane fuel cell (PEMFC) rib thickness and channel form. Variance of fuel cell performance according to rib width was observed, due to its effect on fuel and air diffusion. Fuel cell performance was improved with smaller rib width, because the diffusion of gas to electrode was improved. Kuo et al. [6,7,8] conducted three-dimensional numerical analysis regarding velocity and temperature distribution in the PEMFC channel using wave-like and ladder-like surfaces, thus comparing the current density (CD) with that of the normal surface, to improve performance.
Li and Sabir [9] introduced the separation plate design and latest flow path design made by various research institutions. Additionally, problems were identified, and several suggestions were made regarding the optimization of each channel pattern. Su et al. [10] analyzed the fuel cell performance of a straight channel pattern and the S-shaped pattern of a serpentine channel for PEMFC, through three-dimensional computational analysis and experimentation. The channel with S-shaped serpentine patterns showed higher mass transfer performance than the channel with a straight pattern. Perng and Wu [11] compared fuel cell performance through computational analysis of flow field characteristics in the catalyst layer surface and inside the channel, using different forms in the GDL of PEM fuel cells. In addition, they varied the number of forms to compare the flow characteristics and fuel cell performance [12].
This study suggests design factors of the amplitudes and pitches of waves to effectively improve the catalysis reaction performance of the catalyst layer, and proves the effectiveness of this method by estimating the performance of the PEM fuel cell. The present study provides the design factors and conditions that are required for the performance improvements of the PEM fuel cell. These represent important information for the optimization of the cathode channel design of the PEM fuel cell.
The purpose of this study is to suggest contemporary alternatives to reduce concentration loss. For this reason, we examined the performance according to variations of the heights and distances of the wave form, and the changes of variations induced by the suppression of concentration loss. The optimized channel for the experiment on the PEM fuel cell was determined in order to compare the performance of the optimized channel with that of other channels.
2. Theoretical Background
2.1. Polarization Curve
Equation (1) demonstrates three voltage losses. First, activation loss depends on the activation levels of the electrochemical reactions. Ohmic loss is the resistance loss induced by the unique resistances of the components of the fuel cell. Concentration loss occurs when the reaction rates of hydrogen and oxygen are faster than their supply rates [13].
Among these, mass transfers of hydrogen and oxygen occur during concentration loss through the GDLs in the channels. The GDLs have low permeability and minimal convection effects [14].
In Figure 1, and denote the catalyst layer reactant and product concentrations, and and represent the bulk reactant and product concentration. δ is the thickness of the GDLs. The fuel cell produces current at time t = 0, starting from certain initial values ( and ), and the reactant and product concentration profiles develop with increasing time (t1 < t2 < t3). Finally, the profiles have a steady-state form, where the concentration varies linearly with distance through the diffusion layer. Also, the diffusion flux created according to this linear concentration gradient in the steady-state accurately balances in the catalyst layer. Equation (2) defines this balance.
Here, is the CD in the fuel cell, and is the diffusion flux of a reactant transferred to the catalyst layer. is defined in Equation (3).
The steady-state of this equation is defined as Equation (4).
The diffusion flux of a reactant according to the CD in the steady-state can be calculated by substituting Equation (4) into Equation (2):
2.2. Factors for Displacement in the Wave Form Channels
In order to reduce concentration loss in the area of high CD, alternatives to improve mass transfers are suggested in this study. The bottoms of the channels were fabricated to have a wave shape, to create a greater flow velocity gradient in the GDLs, and to suppress the concentration loss induced by unstable mass transfers, in order to improve the performance of the fuel cell.
The amplitudes and pitches of the waves determine the pattern of wave channels [16], as shown in Figure 2. The expansion ratio (ER) is defined as the ratio of the channel height (H) to the channel amplitude (h), and the adhesive distance (AD) is defined as the ratio of the pitch (the distance between one crest and the following crest) to the amplitude.
3. Experimental Method
3.1. Experimental Apparatus
The efficiency of the PEMFC depends on the stoichiometry of the cathode, the temperature of the cell outlet, the pressure difference between the inlet and the outlet of the cell, and the channel depth [17]. Reference [18] detailed specifications and explanations of the experimental apparatus used in this study. In order to facilitate an understanding of the experimental setup, the contents described in Reference [18] are briefly described as follows. The PEMFC humidifies all air and hydrogen, before they are supplied to the unit cells, in order to prevent the drying effect of hot air. Water generated by the electrochemical reactions causes channel flooding. The experimental setup is shown in Figure 3, and was designed in order to determine the effect of stoichiometry, the cell outlet temperature, and the pressure differential for flooding. The mass flow controller (MFC) delivered conditioned air and hydrogen through each humidifier to maintain adequate humidity. The temperature of the humidifier was adjusted to maintain the relative humidity of the inlet at an appropriate level.
Figure 4 shows the schematic diagram of the fuel cell experimental unit. The flow rate and relative humidity of reactant gases were controlled by the MFC. The humidifier maintains the proper temperatures before entering the unit cell. The line heater was installed at the cell entrance, in order to maintain the temperature of humidified air and hydrogen. The temperature of the reaction gas controlled by the line heater may vary depending on the heat transfer process in the unit cell. To prevent this, the heater was installed at the unit cell end plate and the thermocouple was attached to the bipolar plate in order to maintain the bipolar temperature of the unit cell. The temperature of the cell was measured by attaching T-type thermocouples to the inlet and outlet of the cell. The inlet and outlet pressures were measured using a pressure gauge installed at the inlet of the cell, and a differential pressure gauge installed at the outlet of the cell. Data sent from measurement devices were recorded on the recorder (fluke). Experiments were performed with an accuracy of ±0.1%, at fixed current, voltage, and reaction. External signals can be used to simulate unit cell response and output characteristics. Detailed specifications of the experimental devices are shown in Table 1 [18].
3.2. Experimental Conditions
Figure 5 shows the schematic of the unit-cell channel shape. To measure fuel cell performance, the apparatus was stabilized for 30 min in a steady state, where humidity, temperature, and pressure were maintained constant at the inlet and outlet. The temperature and pressure of the inlet and outlet, relative humidity, unit cell temperature, and open circuit voltage were measured every 1 s. Relative humidity in the unit cell was controlled by adjusting the humidifier temperature, and the relative humidity of the humidified air was measured with a hygrometer installed at the cathode inlet.
To operate the unit fuel cell with an operational temperature of 50 °C, the unit cell temperature was set to 54 °C, so the inlet and outlet temperature were kept constant for 30 min before the actual measurement. If the calculated humidity and the relative humidity measured by the hygrometer differed, the humidifier temperature was adjusted to achieve the desired relative humidity. During the experiment, the relative humidity was maintained at 50, 75, and 90%, respectively, and the error range was maintained within ±0.2. The flow rate into the fuel cell was 2.62 × 10⁻⁷ m3/s, which is the same in all cases of this experiment.
In order to verify the effect of ER and AD, the effect of the variance of AD was considered. The wave form flow characteristics through experimental analysis were compared with those of the reference channel. Fully developed flow in the reference channel reduces mass transfer due to the low flow rate near the GDL layer. In contrast, the flow field with the wave-form channel does not fully develop and the amount of mass transfer to GDL layer is increased. The effect of the wave form increases the gas flow velocity in the channel and thus improves the catalytic performance in the catalyst layer. Thus, it can be deduced that the wave form channel will have a higher performance than the reference channel. Thus, as shown in Figure 2, this study varied the design parameters of the ER and AD of the wave form channel in order to produce the cathode channel shapes shown in Figure 6 and Figure 7.
The fuel cell performance in the normal cathode channel of width and height 0.9 mm × 0.9 mm, with aspect ratio 1, was compared with that of the wave form channel where the ER varied between 1.5, 2.0, and 3.0. The conditions for the fuel cell performance experiment were a fuel cell reaction gas temperature of 50 °C, relative humidity of 75%, fuel side stoichiometry of 1.5, and cathode side stoichiometry of 2.0.
4. Results and Discussion
4.1. Fuel Cell Performance Variation According to the ER Variation
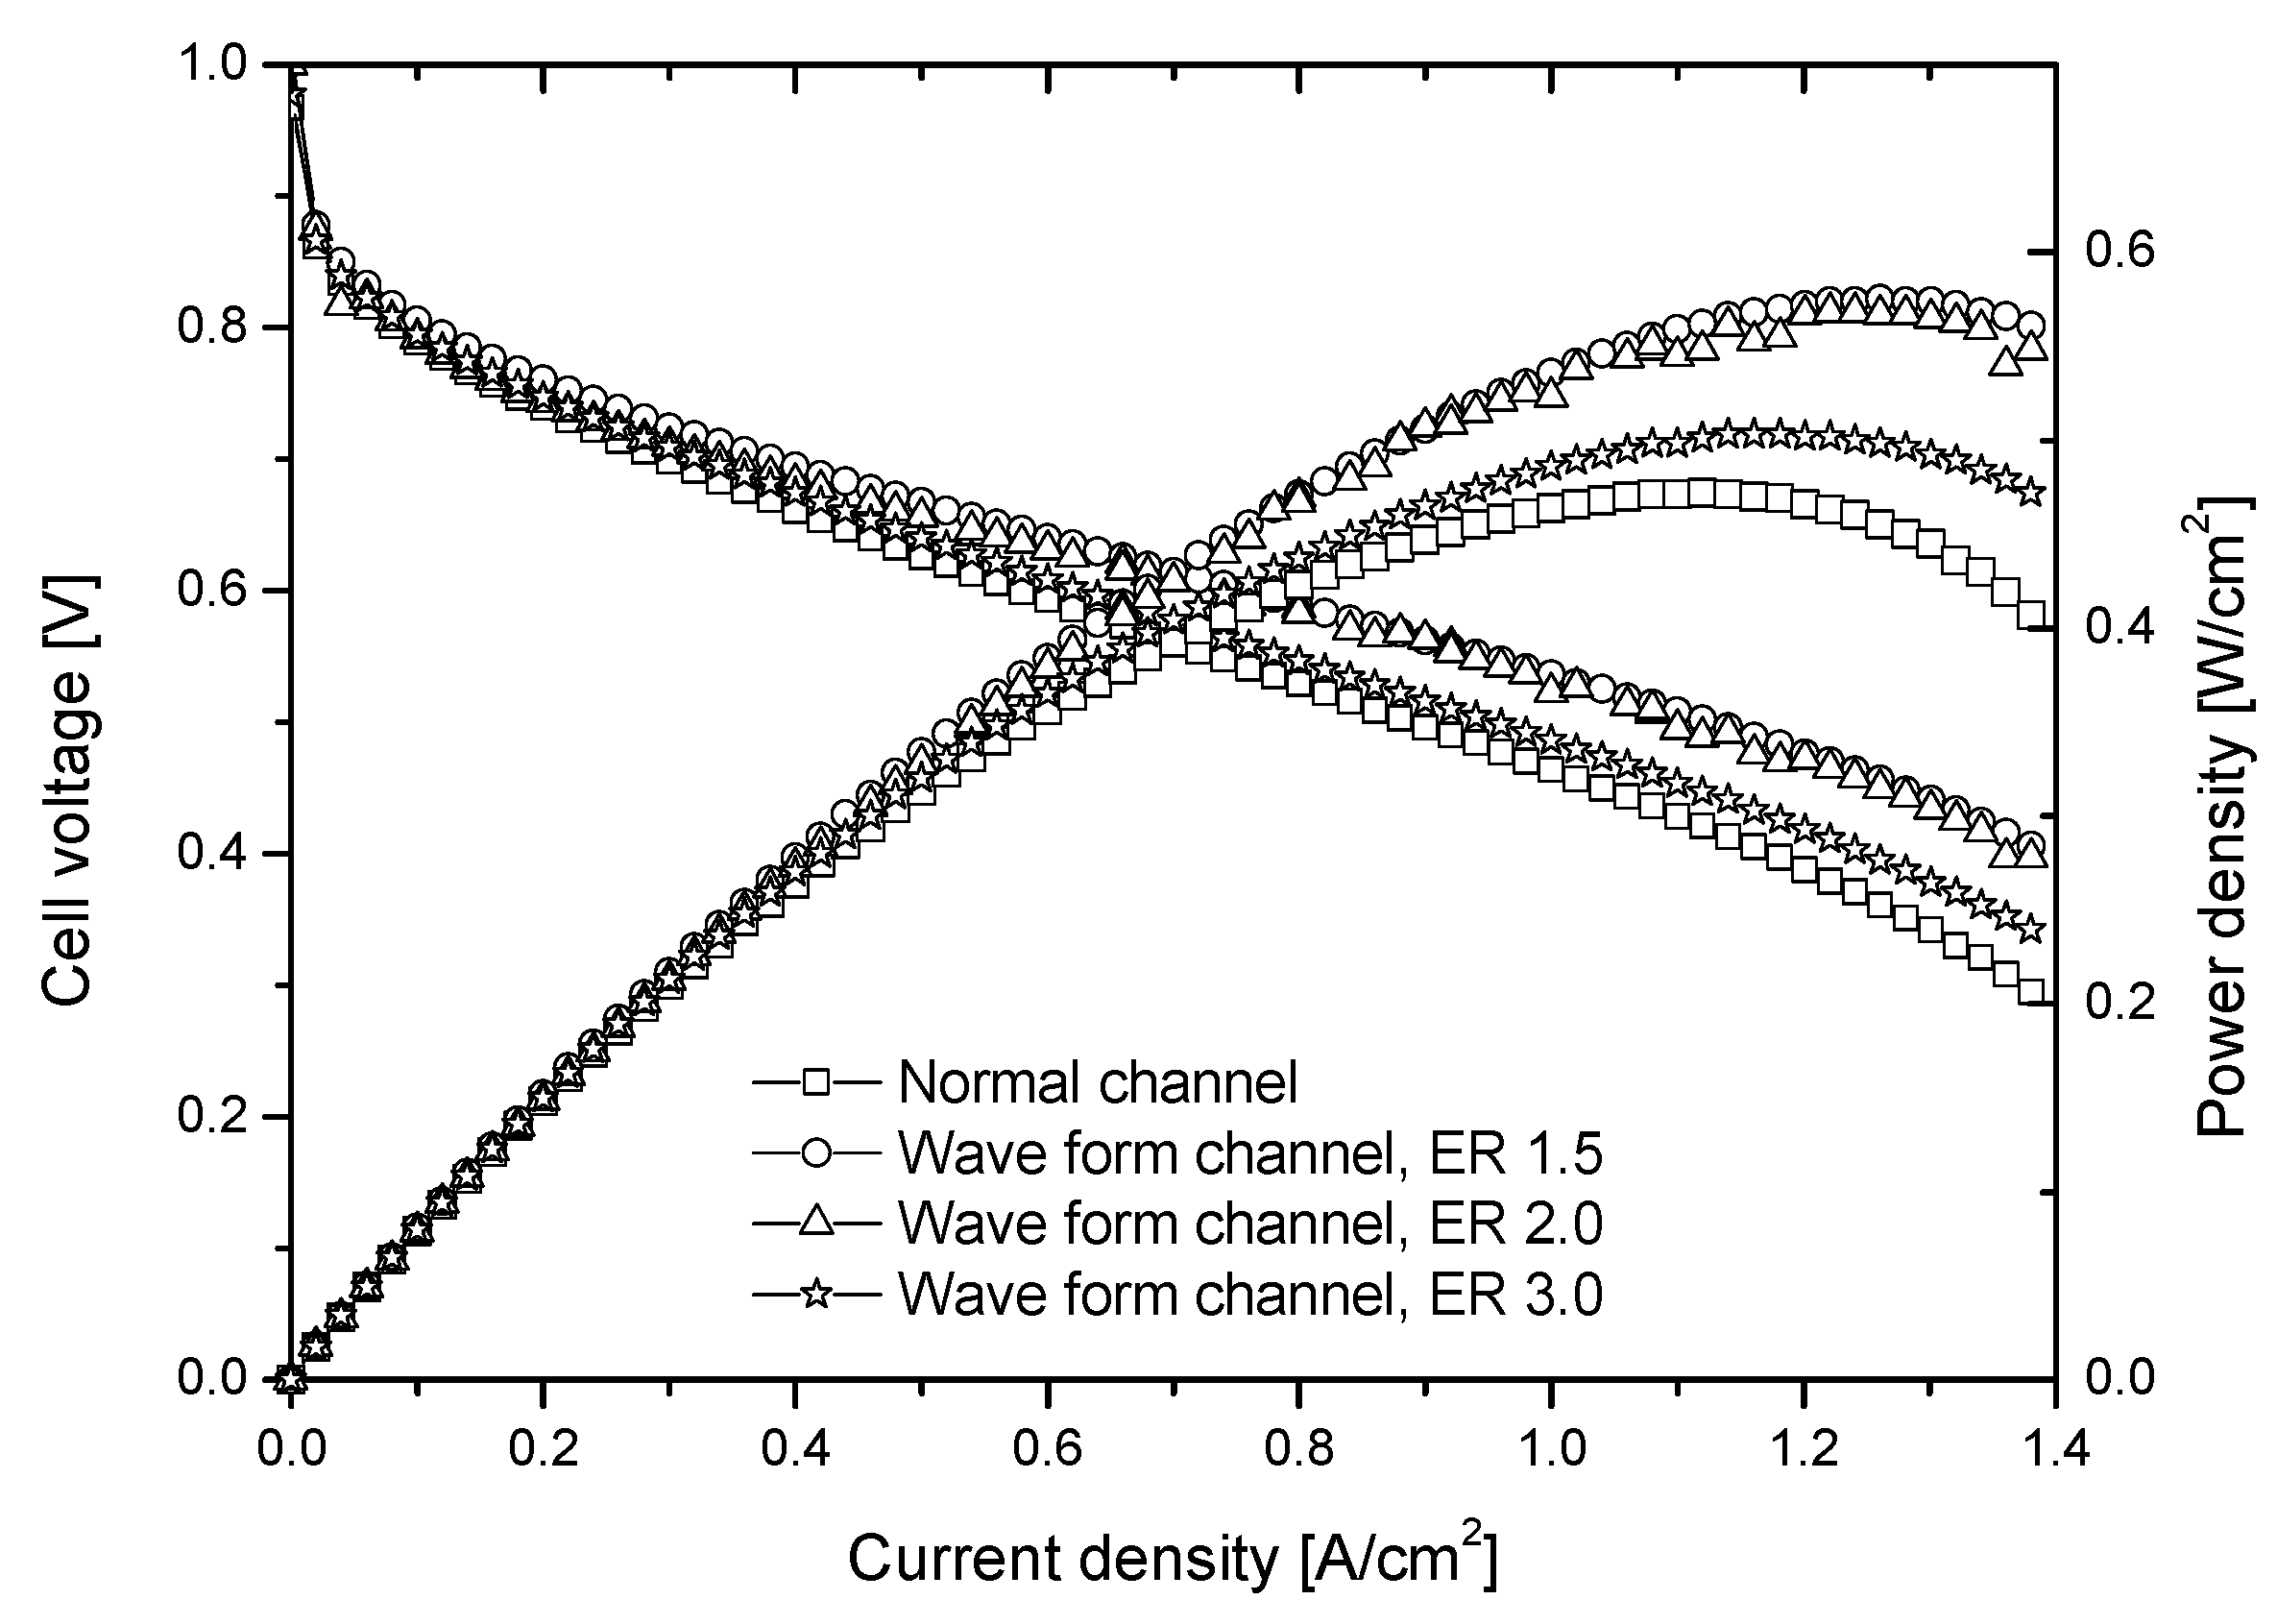
Figure 8 shows the fuel cell performance by variation of the expansion ratio (ER). In the normal channel, the maximum power output was around 11.9 W, while the improvements of maximum power output in the wave form channel were around 21% for ER 1.5, 20% for ER 2.0, and 6% for ER 3.0. The cause of this improvement in maximum power output was the high air concentration maintained at the catalyst layer and GDL. In the high CD region between CD 0.8–1.4 A/cm2, the normal channel shows a rapid decrease of power output at CD 1.2, while the wave form channel shows a sluggish decrease of power output. This sluggish decrease is caused by the reduction of concentration loss.
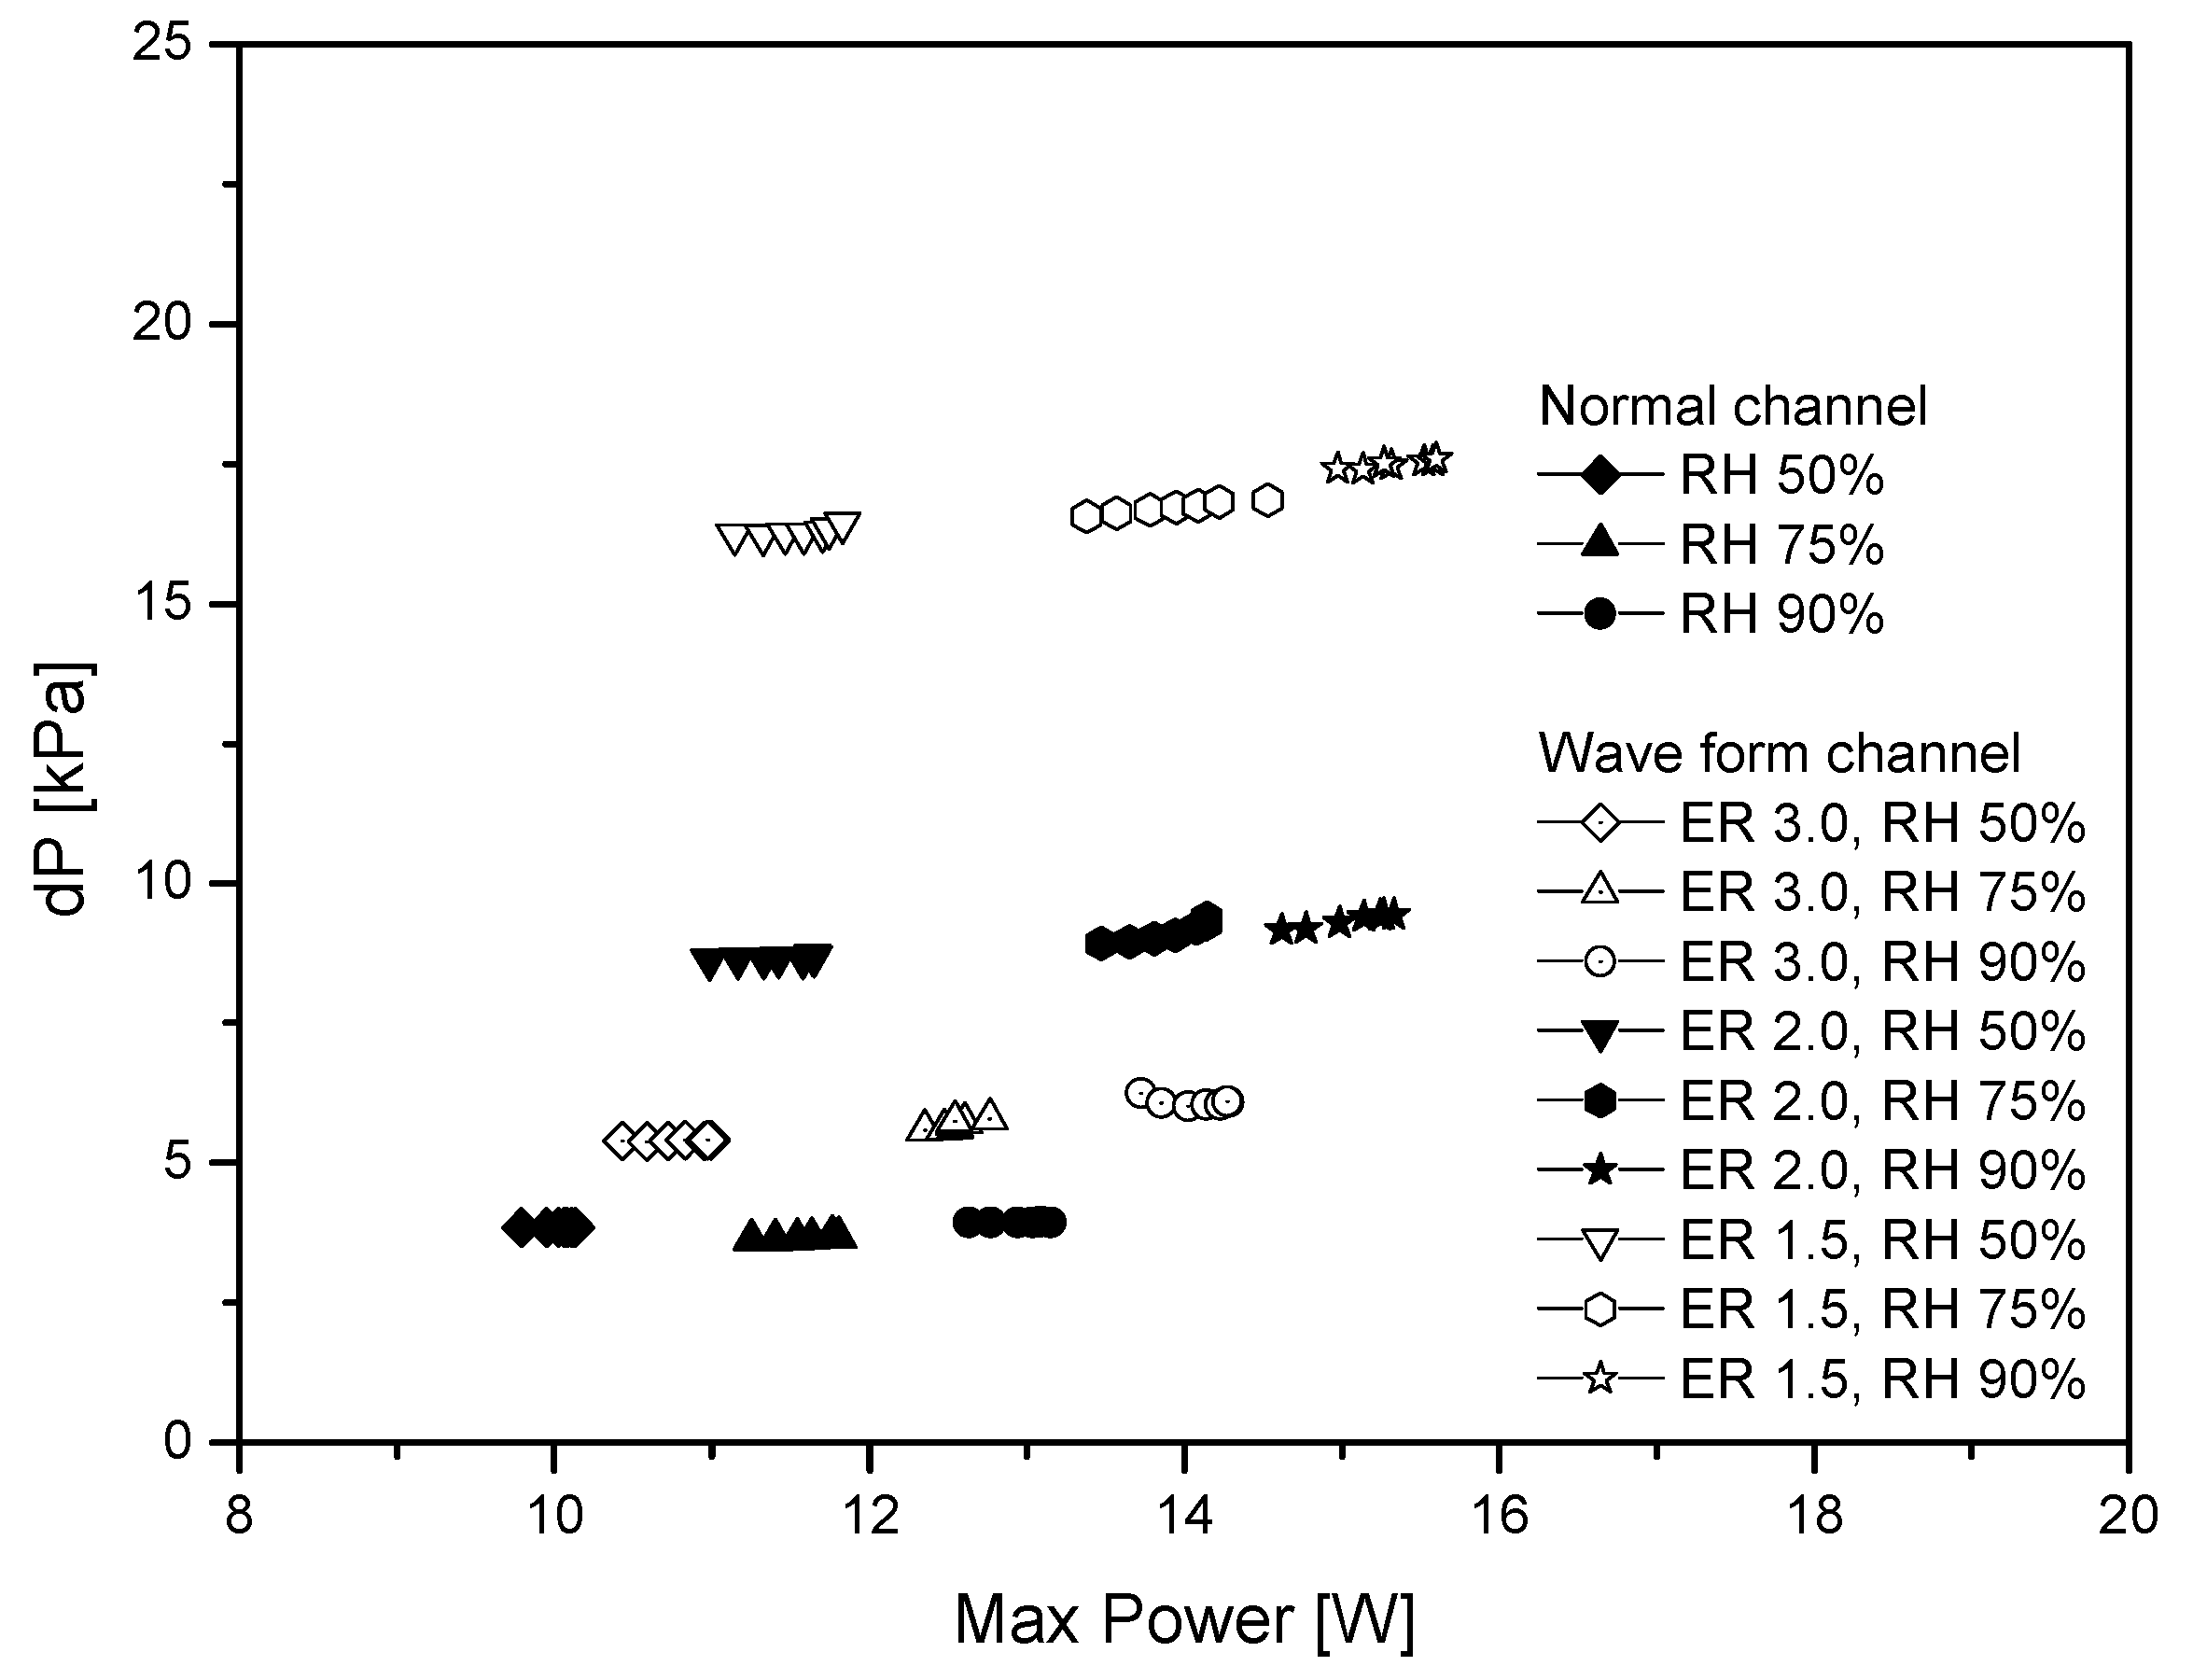
Figure 9 shows the pressure difference at the inlet and outlet of the unit cell. The wave form channel shows a higher pressure difference, compared to that of the normal channel. The fuel cell performance in wave form channels ER 1.5 and ER 2.0 are similar, but rapid pressure increase is observed in ER 1.5. The rapid increase in pressure contributes to overall loss in the system, and demands higher apparatus durability.
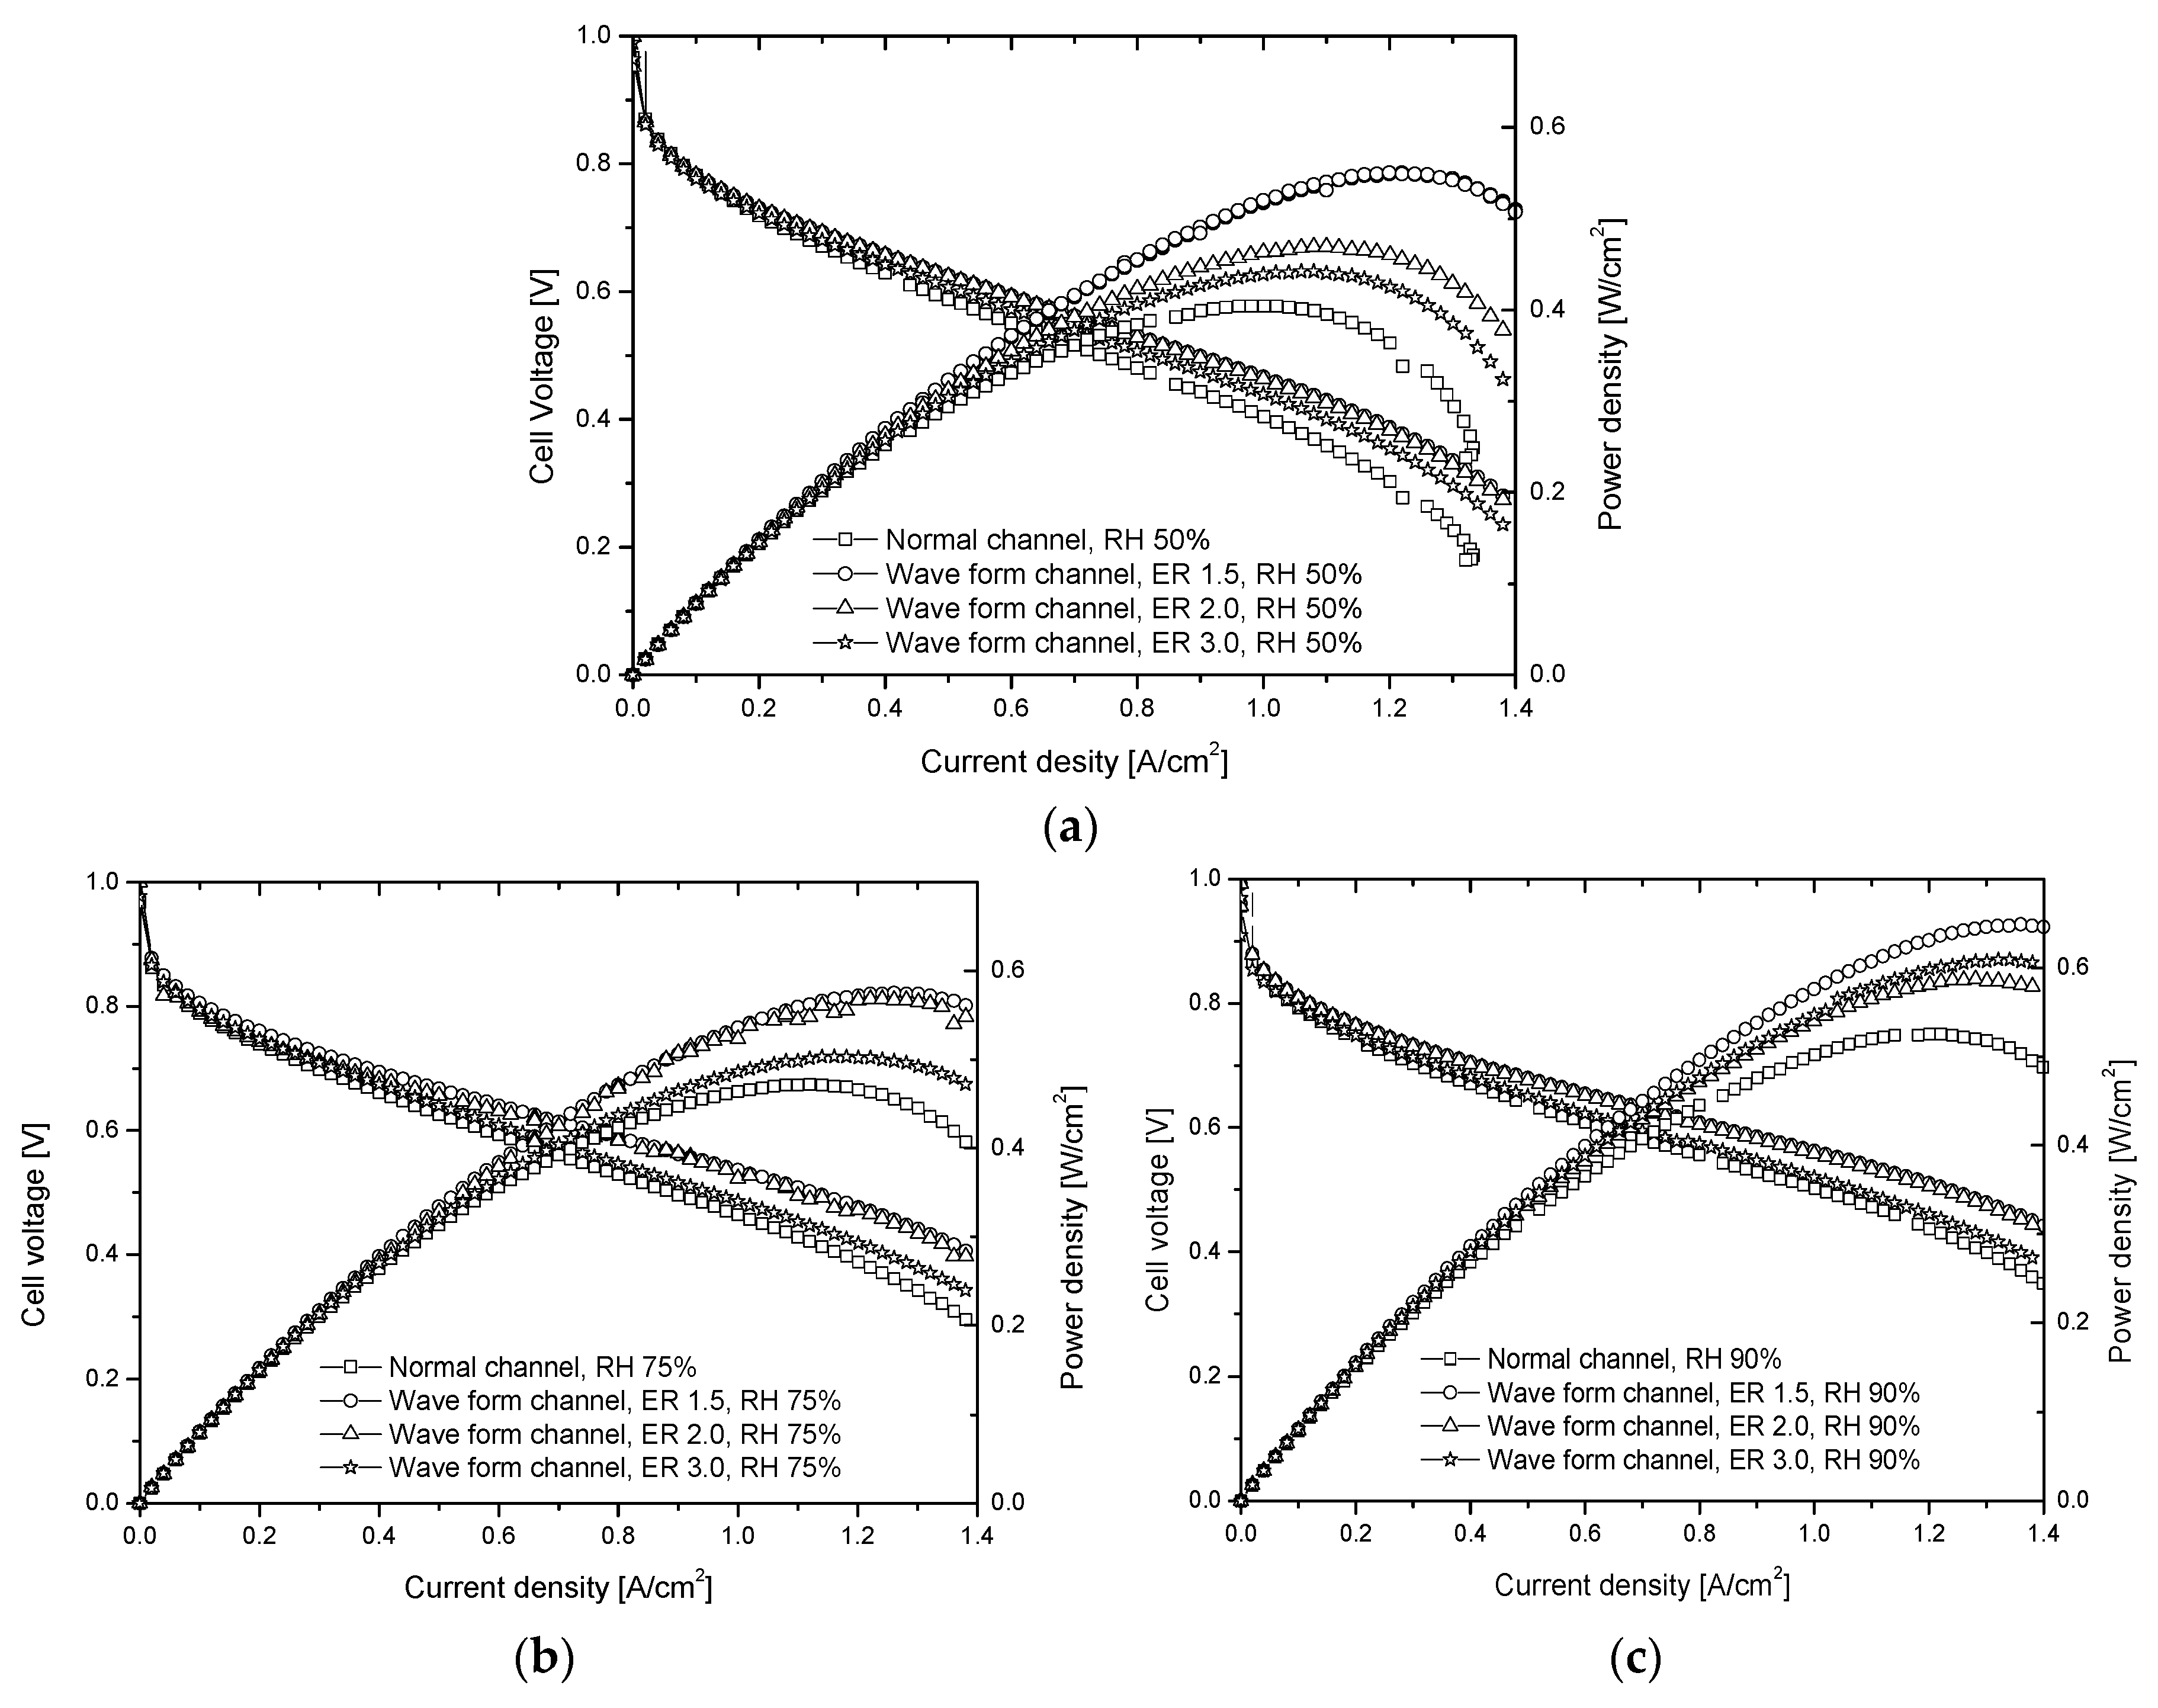
Figure 10 shows the performance curves of the fuel cell by variation in the relative humidity. Figure 10a shows the performance curves of the normal channel and wave form channel with various ER, with a relative humidity (RH) of 50%. As the ER increases, the unit cell performance with respect to maximum power output increases by around 7–15%. In the high CD region with a CD over 1.2, the power density and cell voltage were unstable in the normal channel, but showed a stable trend in the wave form channel. Figure 10b shows an insignificant difference in performance between ER 2.0 and ER 1.5 with RH 75%, and the unit cell pressure difference increases greatly as the ER increases. Figure 10c shows that the fuel cell performance of the wave form channel increases by about 8–17%, compared to the normal channel, in RH 90%, and the performances are similar in ER 2.0 and ER 1.5. Thus, in the wave form channels, the maximum power density and high CD increase as the relative humidity increases. Low concentration and the mass transport of catalyst reactants in high CD are overcome by changing the flow inside the channel, by applying the wave form channel, thus resulting in the improvement of fuel cell performance.
Figure 11 shows the pressure difference inside the normal channel and wave form channel with varied ER. However, after a certain increase of ER, the fuel cell performance is not much influenced, and we predict that the increase of the internal pressure might cause system instability.
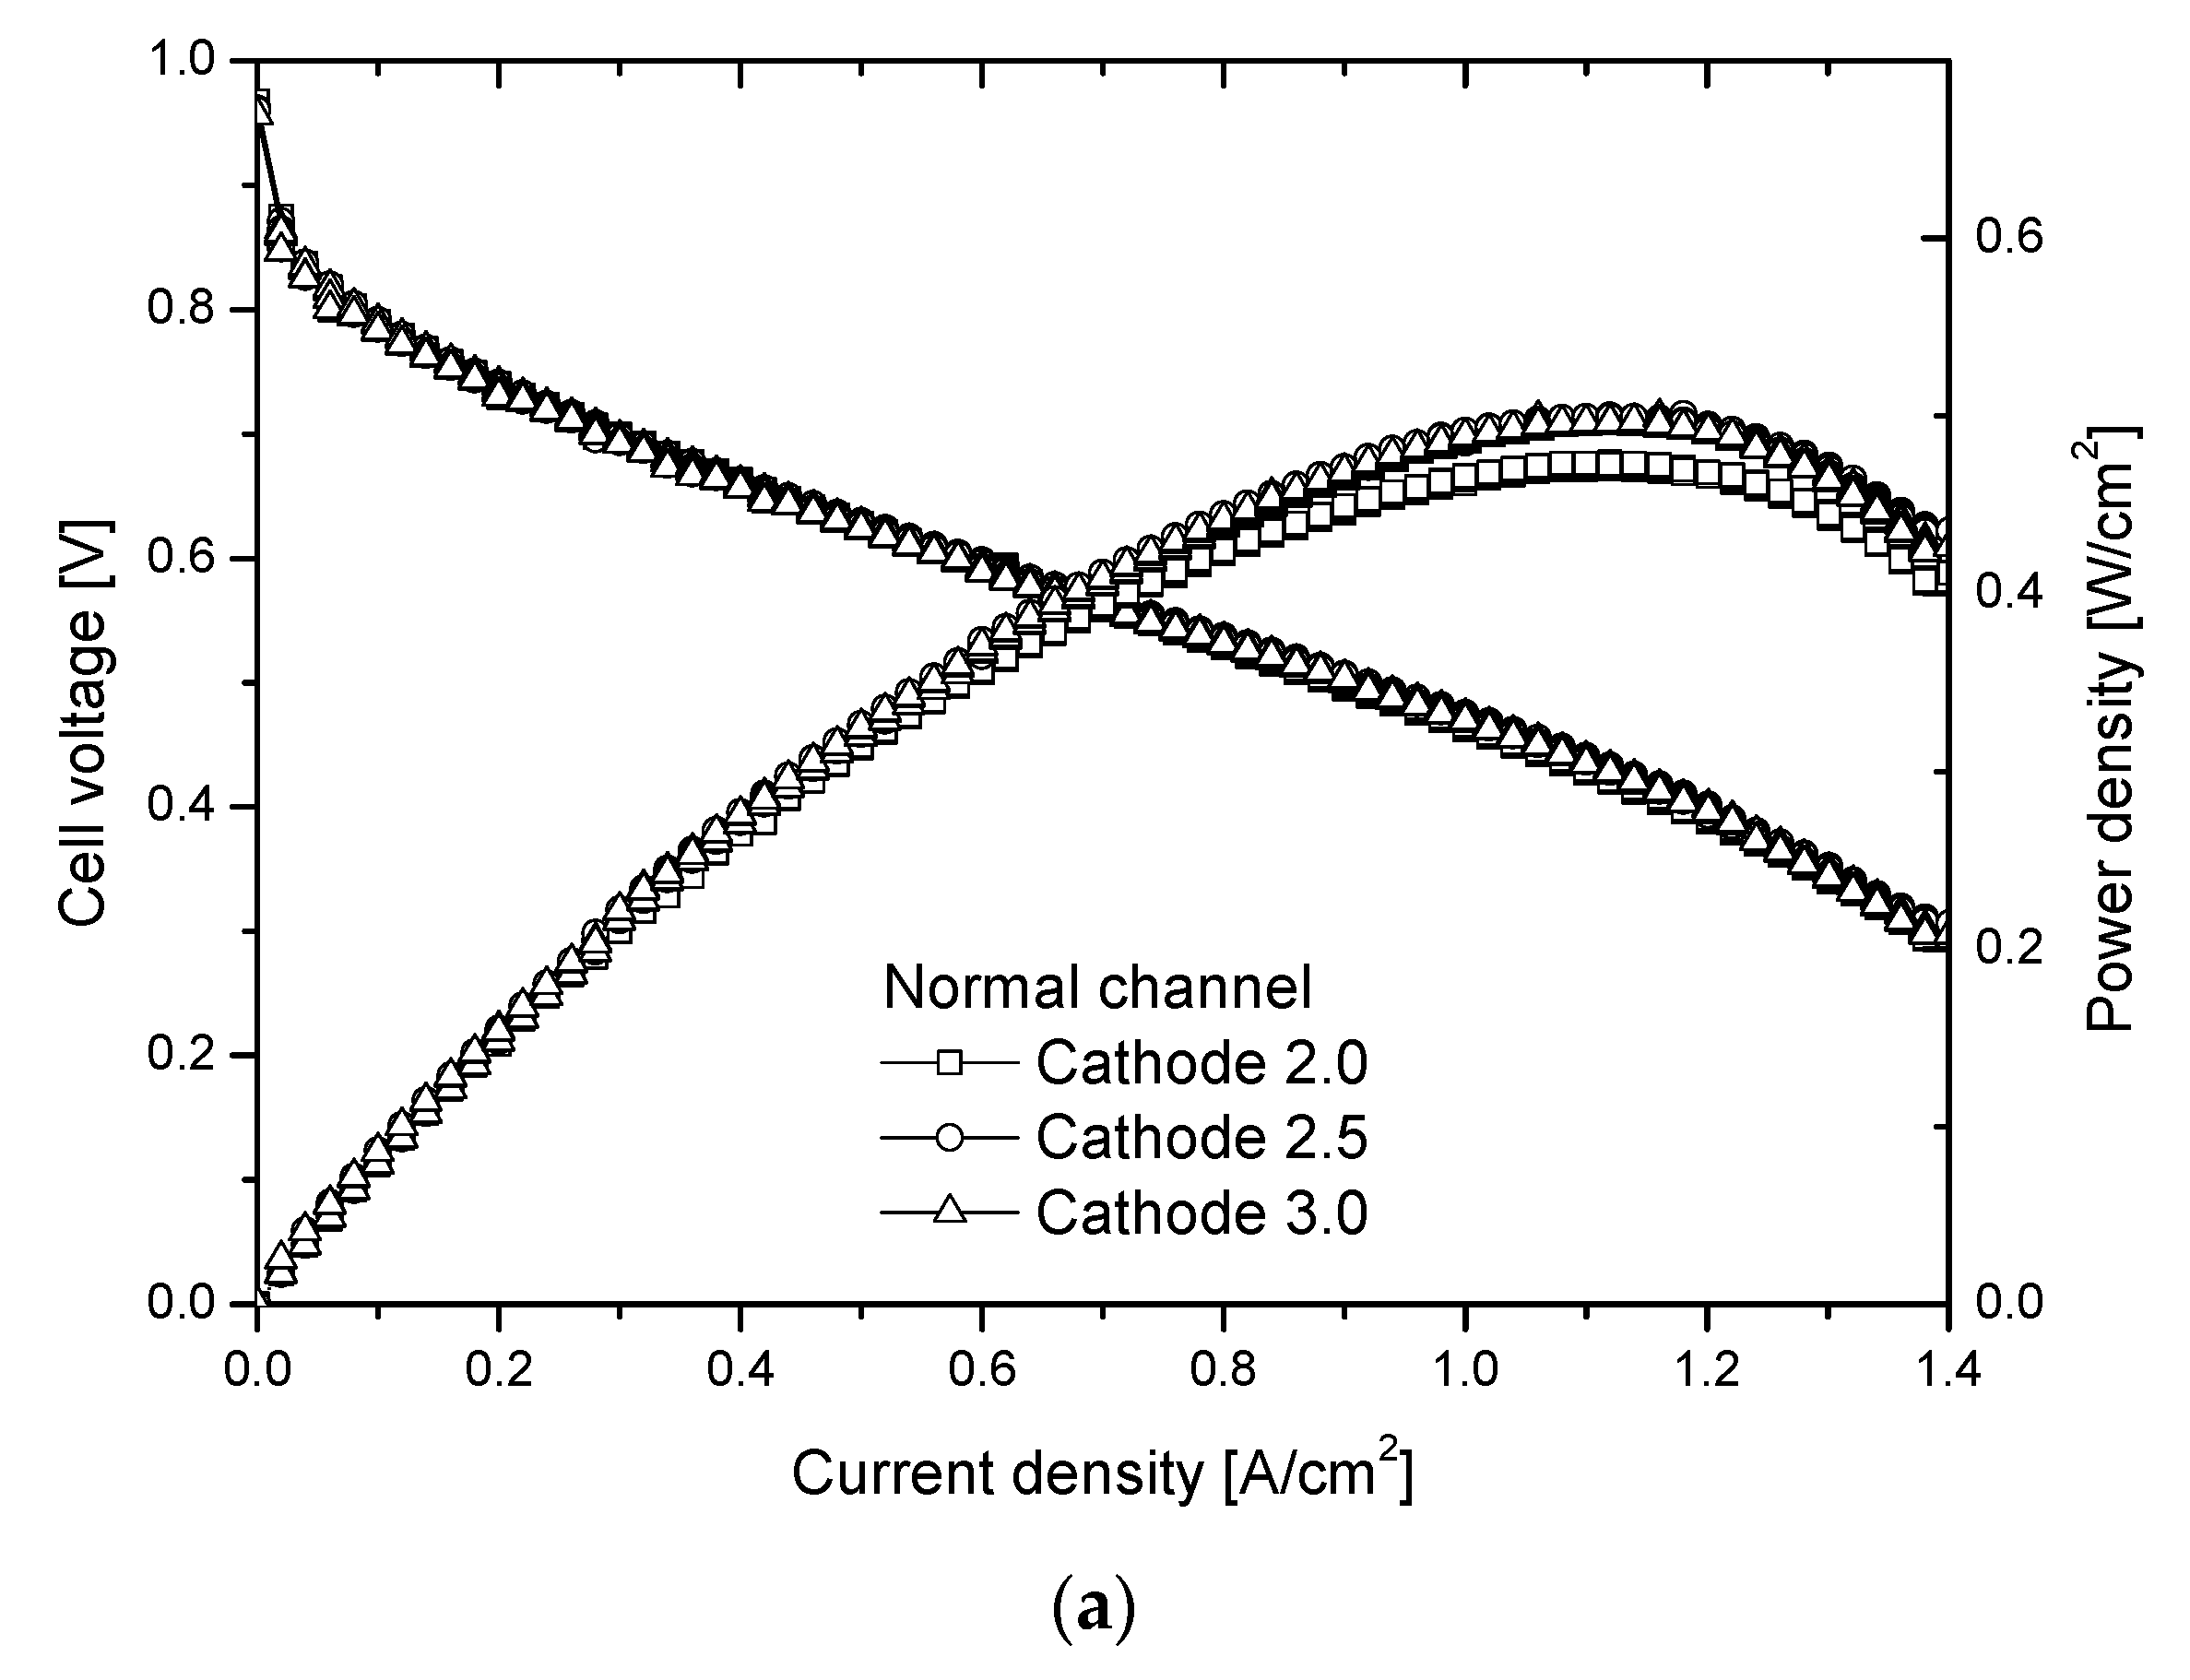
Figure 12 shows the fuel cell performance according to cathode stoichiometry variation. With a stoichiometry of 1.0, the supply of the reactant at the outlet is insufficient, due to the reactant gas reaction; thus, the reactant gas must be supplied to the fuel cell at an excessive rate, compared to the exact reacting amount, due to various losses. This study conducted the fuel cell performance experiment with an anode stoichiometry of 1.5, ER 2.0, and fixed RH of 75%. The cathode stoichiometry varied between 2.0, 2.5, and 3.0 in the normal channel and wave form channel.
In Figure 12a, the performances under CD 0.8 do not vary much, due to increases in the cathode stoichiometry. However, in high CD over 1.0, the differences are noticeable. The results suggest that a cathode stoichiometry of 2.0 is sufficient in the low CD region, while in the high CD region, the reactant supply is not fluent, due to concentration loss, thus yielding no increases in fuel cell performance when the stoichiometry is increased.
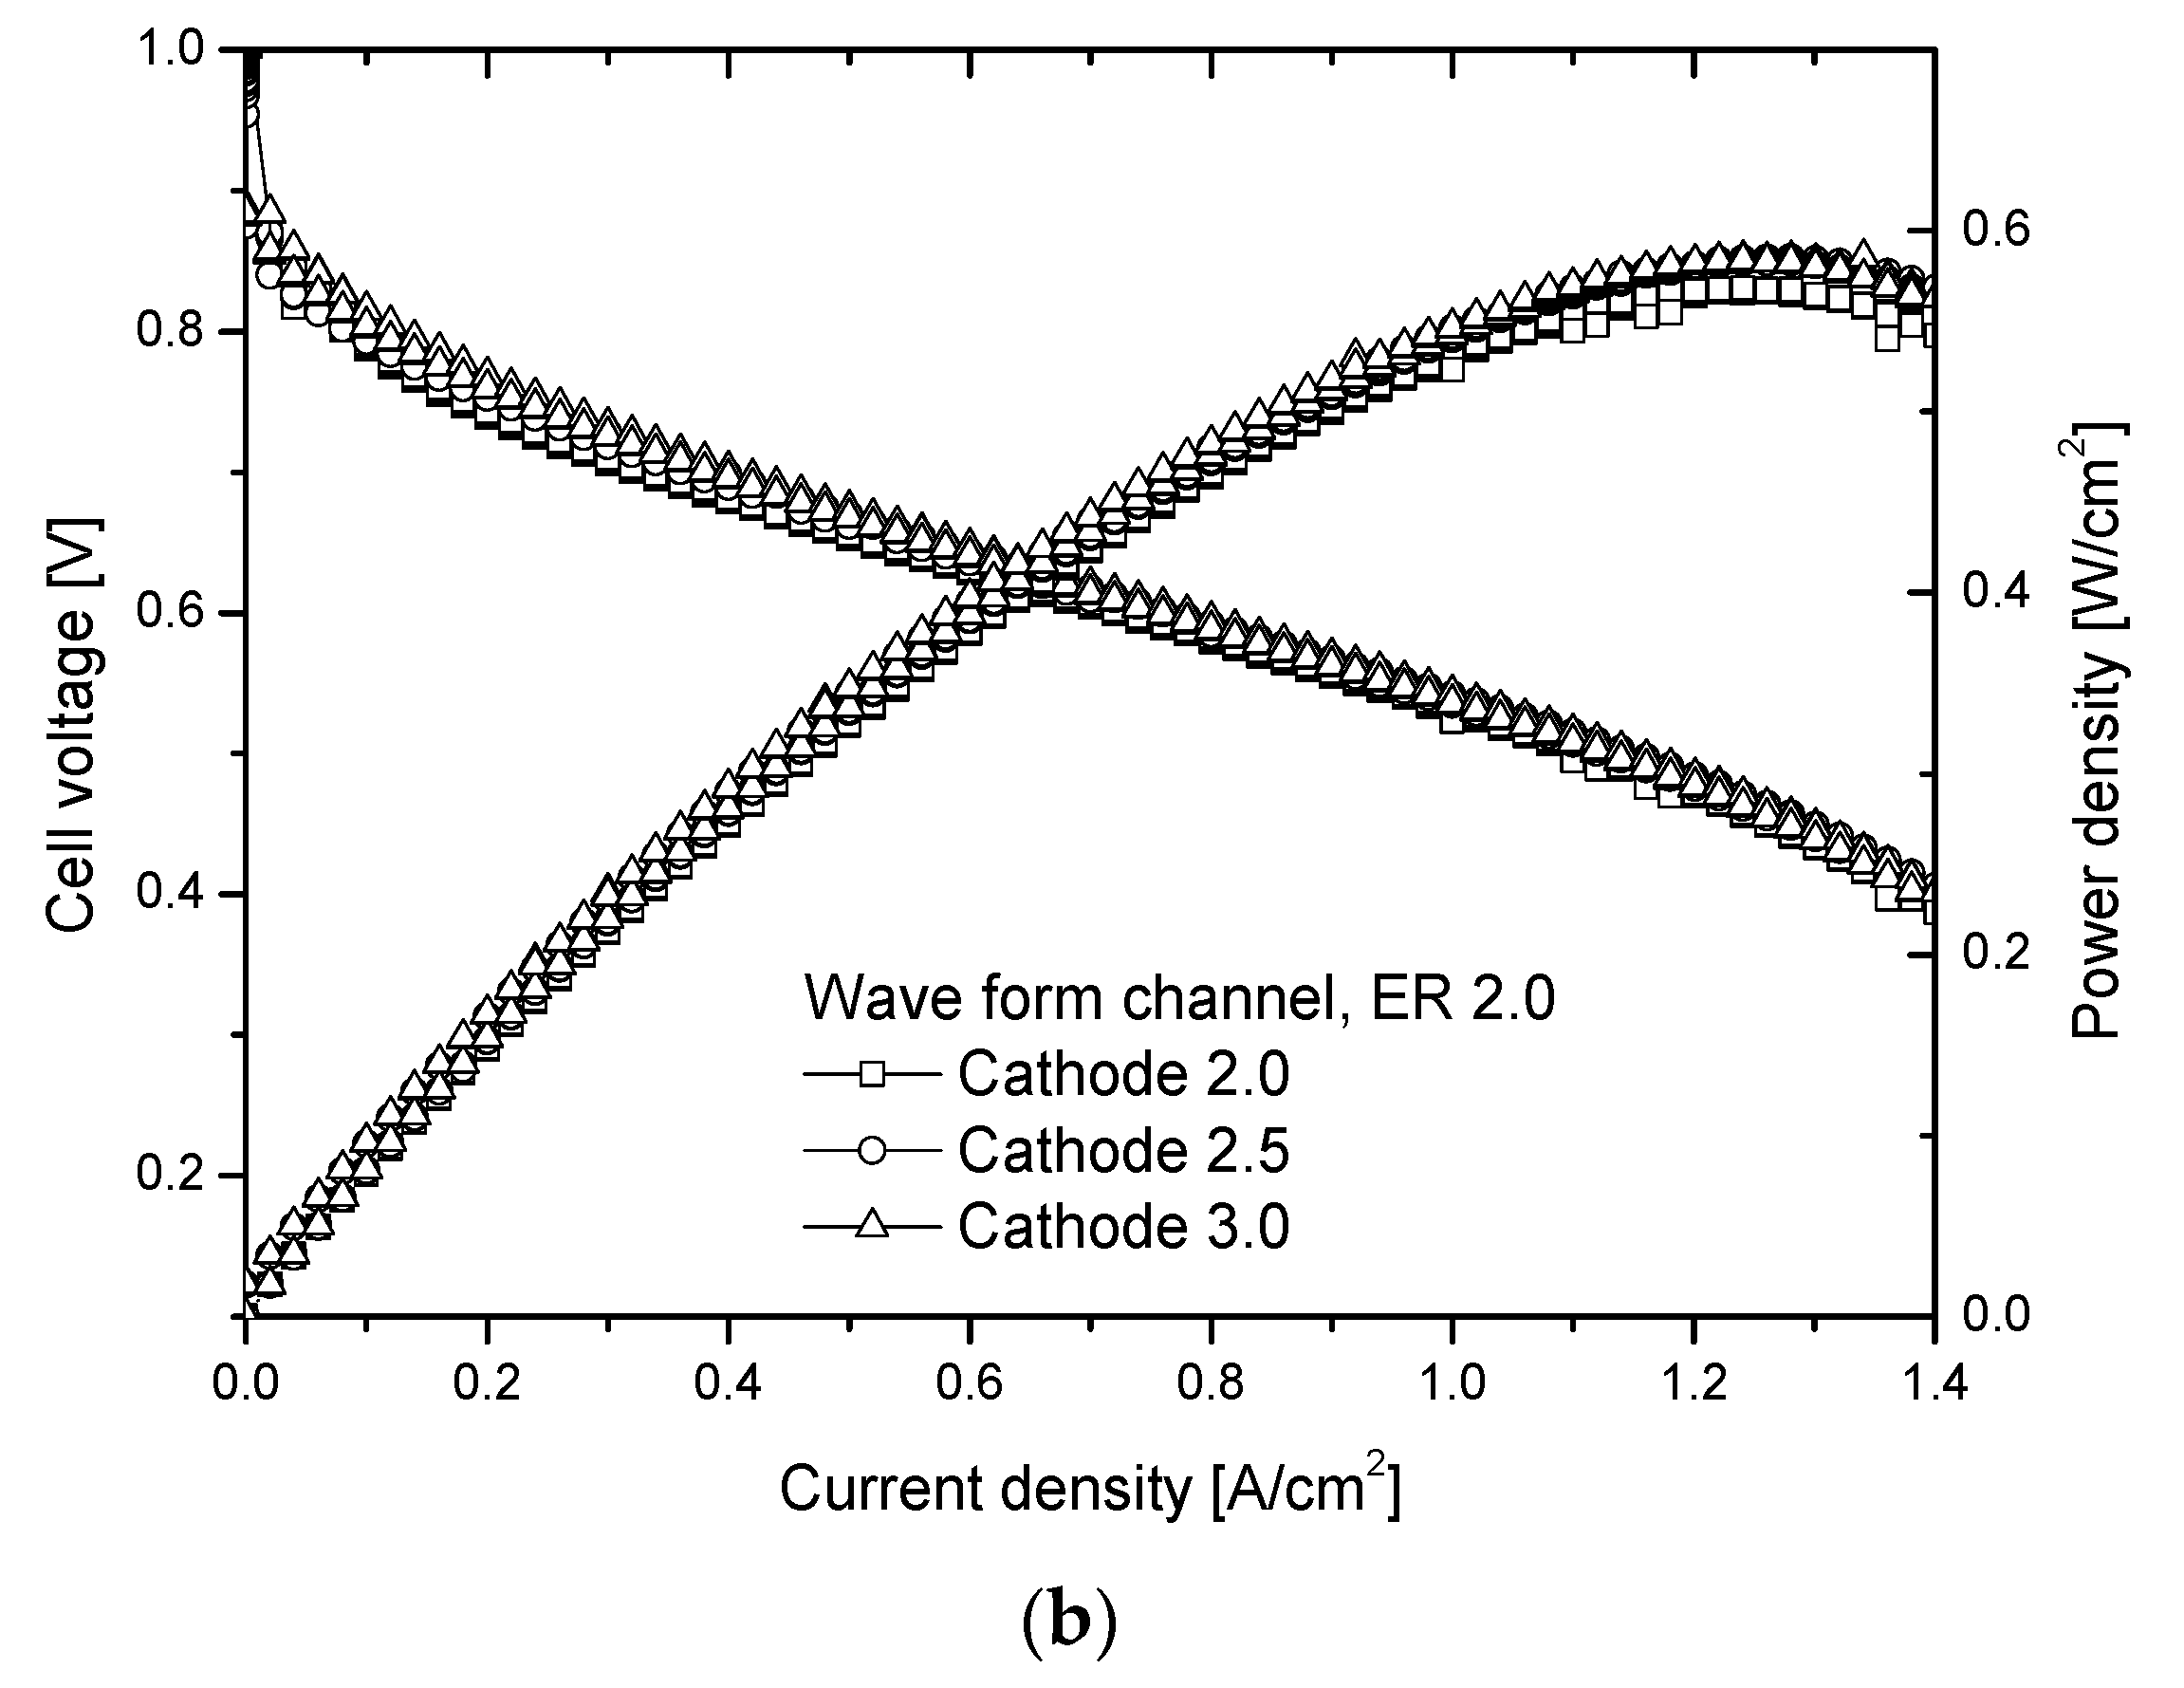
Figure 12b shows the fuel cell performance of the wave form channel with ER 2.0, as the cathode stoichiometry varies. Increasing the wave form channel cathode stoichiometry yielded a 2% increase, compared to the maximum power density. The result indicates that sufficient reactant supply was achieved in the catalyst layer and GDL of the wave form channel.
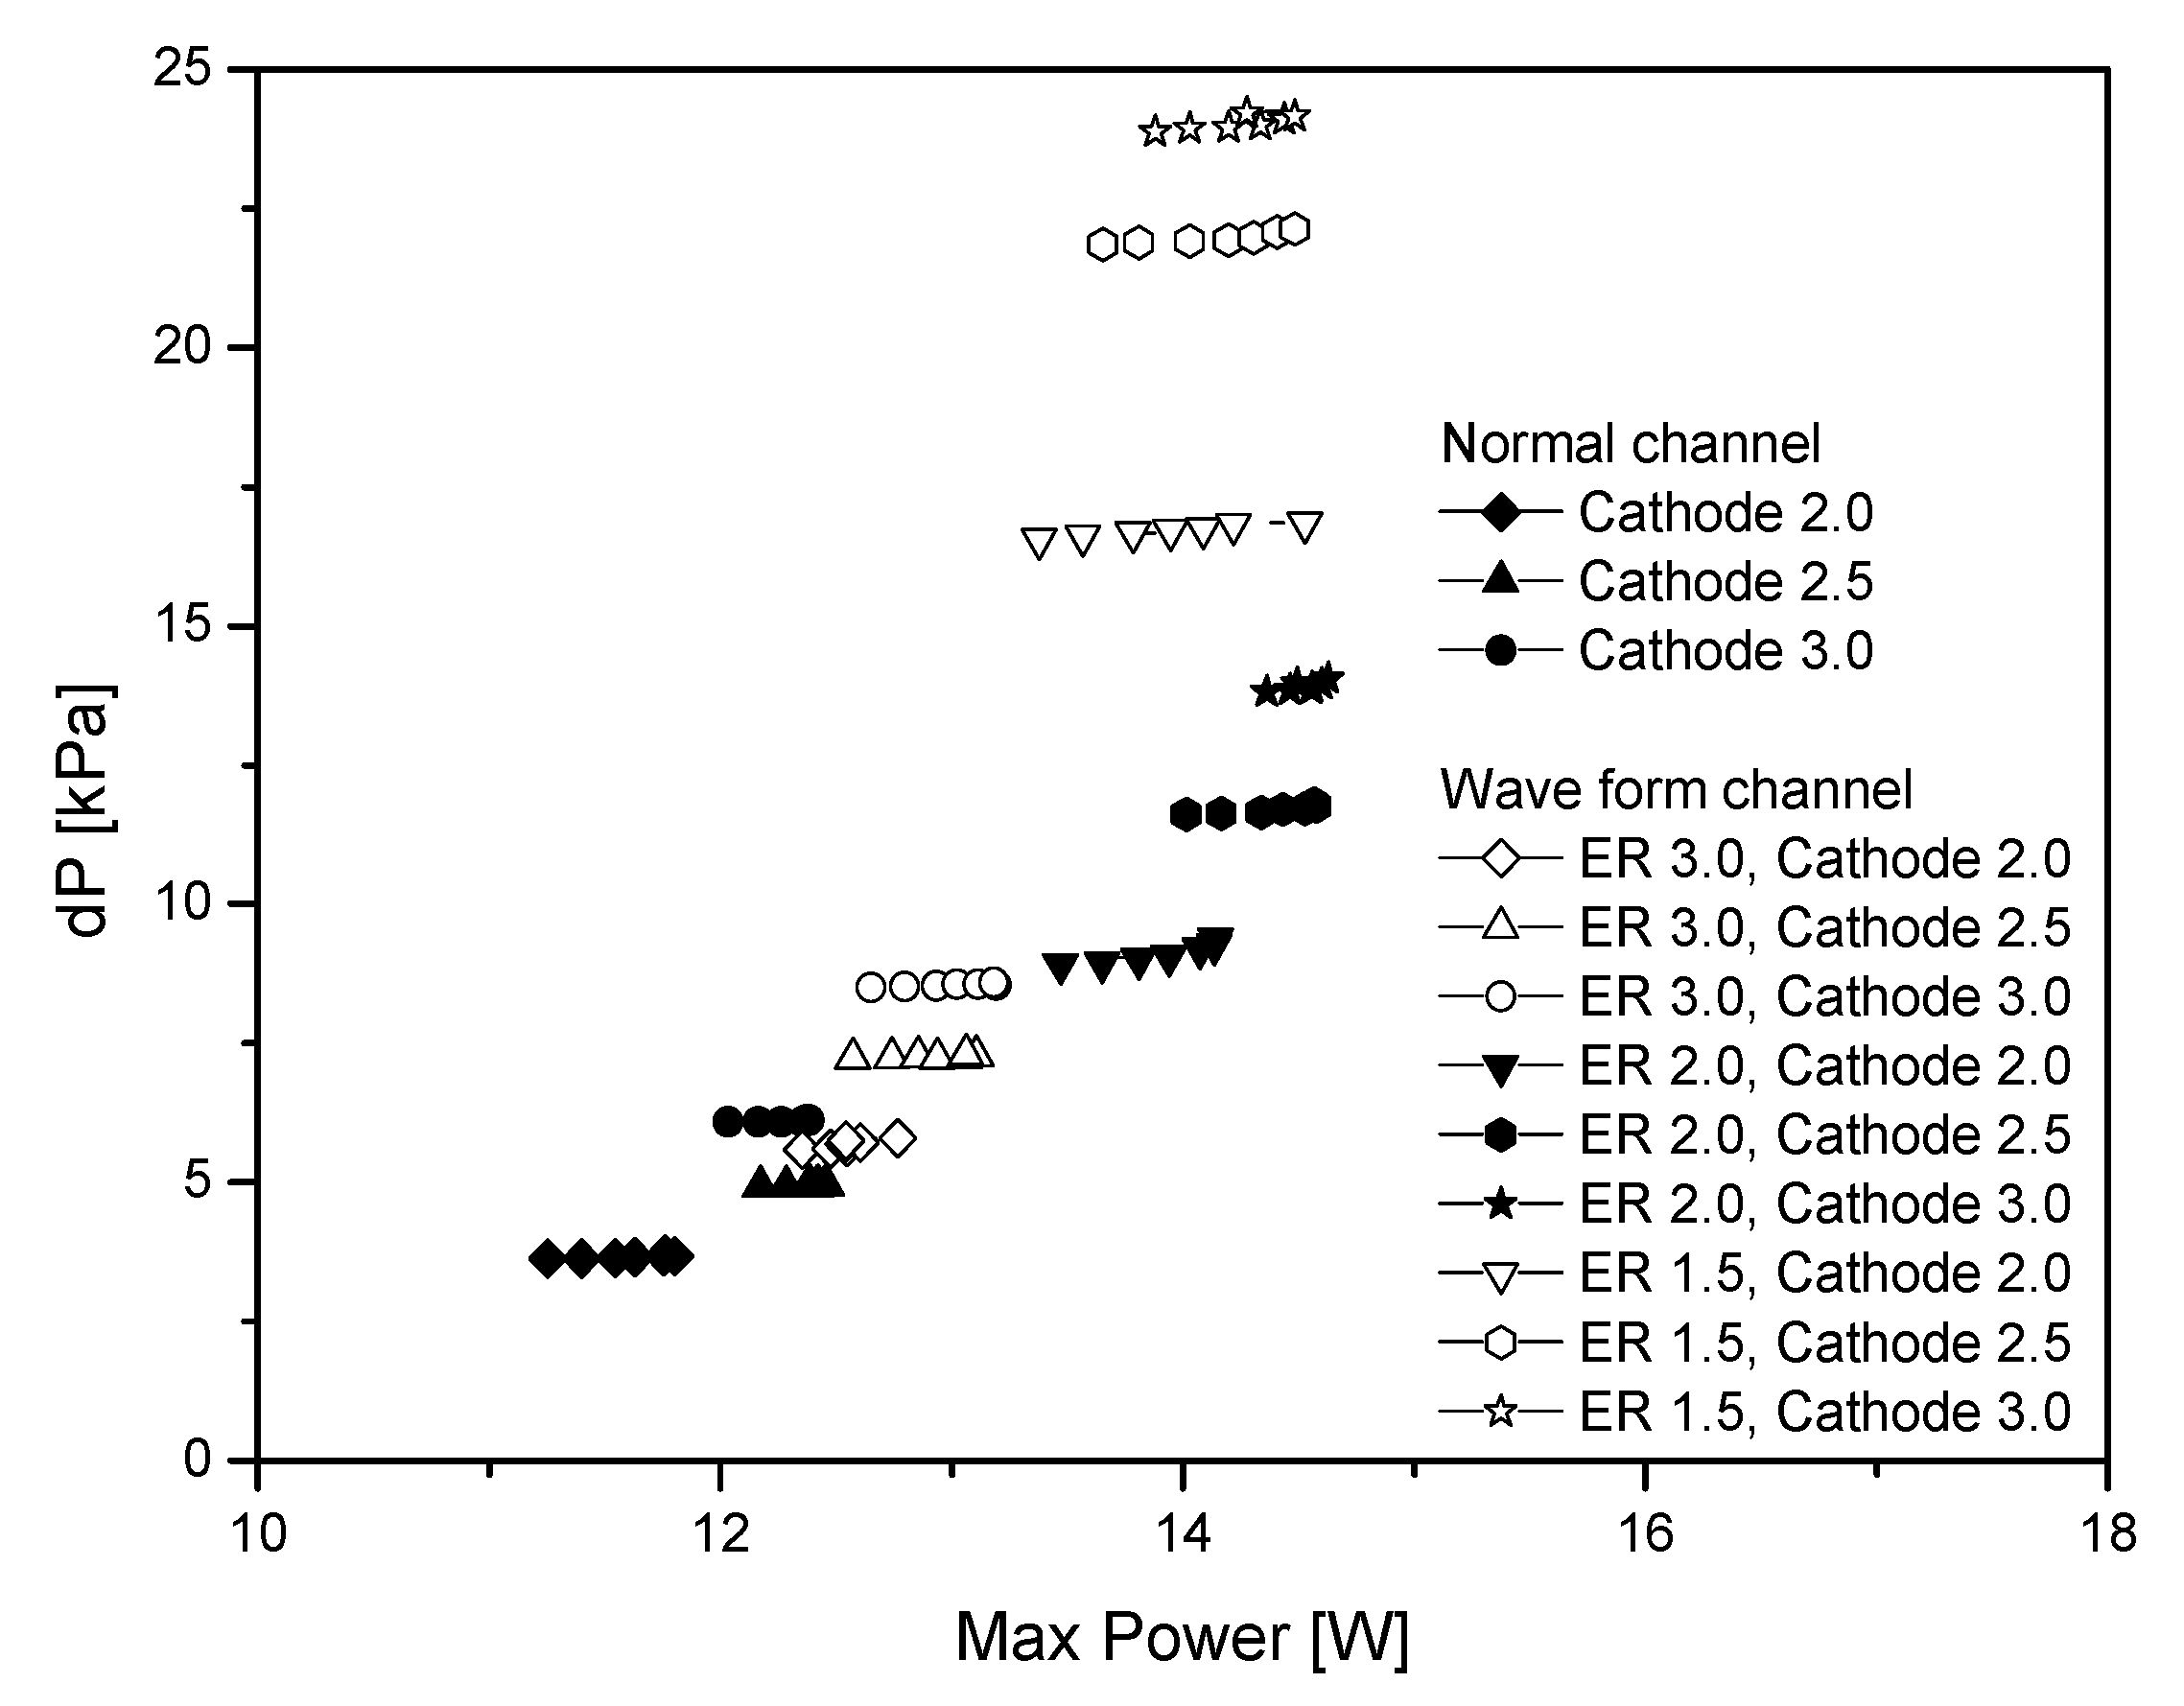
Figure 13 shows the pressure difference of the wave form channel and normal channel, according to the change of cathode stoichiometry. The wave form channel shows higher performance compared to the normal channel, and ER 1.5 and ER 2.0 show similar performance, but a high pressure difference is observed in the case of ER 1.5. Thus, it can be deduced that stability problems and internal resistance loss can arise in a fuel cell system when a high pressure difference occurs.
4.2. AD Variation and Fuel Cell Performance
We varied the wave form channel design parameter AD during the experiment in order to select the optimal AD by comparing the performance with that of the normal channel. The ER was fixed during the experiment. The size of the ER is related to the increase of reactant internal flow at the catalyst layer and GDL inside the channel, while AD maintains the distance at a certain value, so that the channel internal flow is prevented from reaching a steady state, thus increasing the reactant flow. The experimental conditions in this study were an anode stoichiometry of 1.5, cathode stoichiometry of 2.0, operating temperature of 50 °C, and ER of 2.0.
Figure 14 shows the performance curves of the normal channel and wave form channel with varied AD. As the AD distance increases, the improvement of performance compared to the normal channel decreases. This indicates that the mass transport of reactants decreases as the wave form distance increases. Furthermore, the increase of relative humidity means that the performance of the fuel cell is improved. We conducted experiments in the wave form channel by varying the ER and AD in order to determine the optimal wave form channel shape for ER 2.0 and AD 4.0.
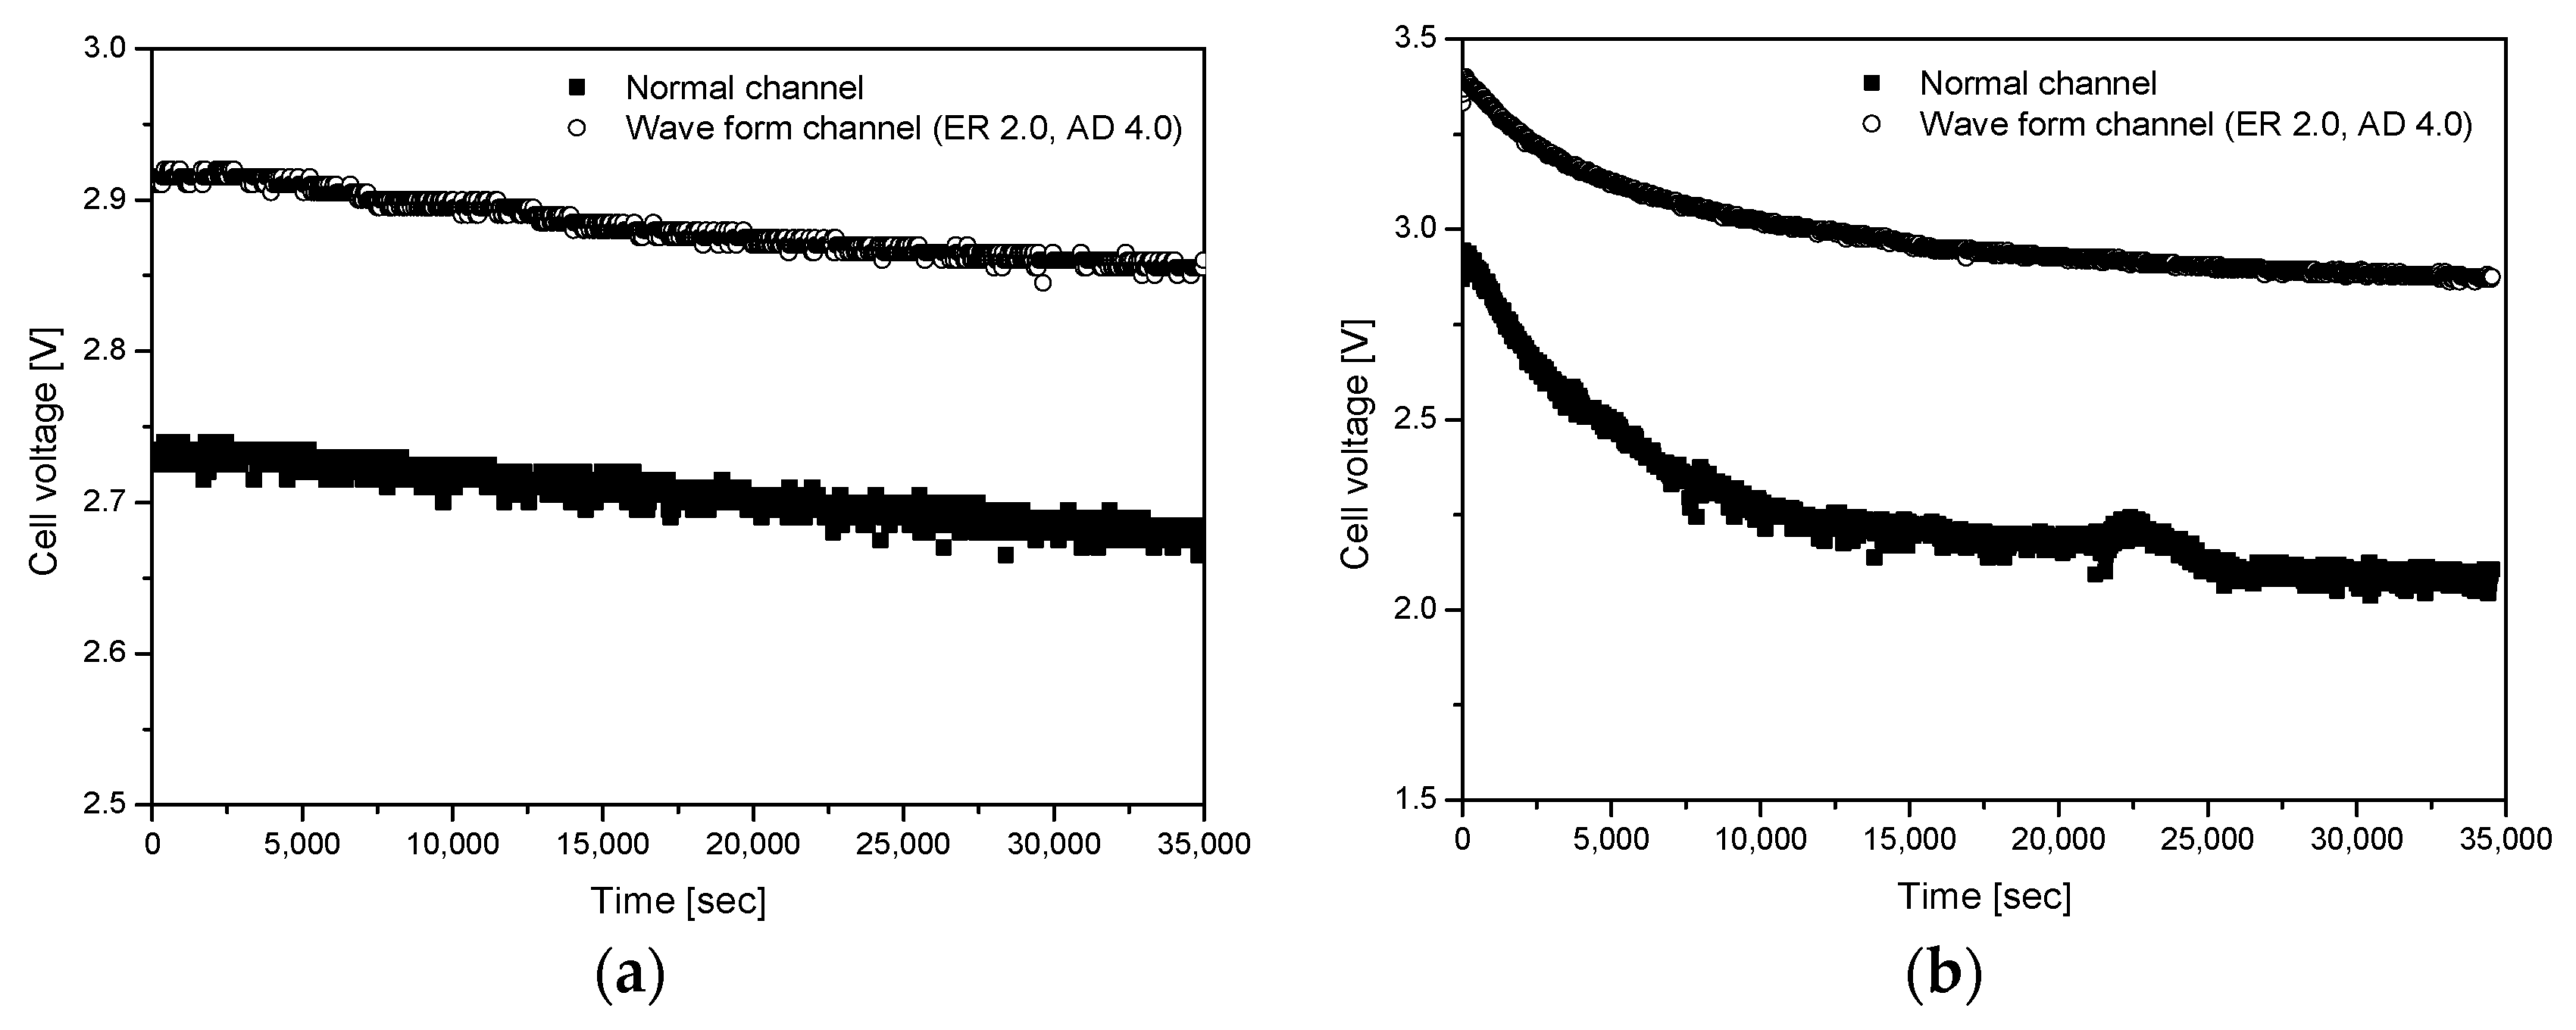
Figure 15 shows the results of the reliability experiment in high CD. Generally, in the high CD region, membrane electrode assembly (MEA) degradation, platinum catalyst poisoning, and the flooding phenomenon cause the rapid reduction of fuel cell performance.
Figure 15a shows the performance of the normal channel and the ER 2.0, AD 4.0 wave form channel at CD 0.8, over 10 h of operation. At a CD of 0.8, both the normal channel and wave form channel showed a decrease in performance of around 3%, which is insignificant. However, in the same CD, the power and voltage varied more in the wave form channel than in the normal one. This indicates that the wave form channel is more reliable than the normal one.
Figure 15b shows the time-wise fuel cell performance variation in the normal channel and wave form channel, with a CD value of 1.0. The performance in both channels is lower than that of the channels with a CD value of 0.8. Additionally, the power and voltage variations are greater in the normal channel than in the wave form channel at the same CD. However, as time passes, the wave form channel shows stable values, while the normal channel shows a great decrease after six hours. After 10 h of operation, the voltage in the normal channel is reduced by 0.12 V, and the performance is reduced by around 28%; meanwhile, in the wave form channel, the voltage is reduced by 0.7 V, and the performance by around 14%. These results suggest that concentration polarization at high CD is minimized in the wave form channel, leading to the improvement of the fuel cell performance.
5. Conclusions
The present study conducted experiments to improve fuel cell performance by increasing the mass transport and partial pressure in the fuel cell cathode. We determined the design parameters to reveal the optimal wave form shape to be the wave form channel height, wave form shape size ratio, and wave form distance in the cathode channel. Results of the wave form channel fuel cell performance experiments are as follows:
- (1)
- As the ER decreases, the maximum power density increases further. The power density of the wave form channel (ER 1.5) is about 21% better than that of the normal channel. In a CD over 1.2, the power density of the wave form channel decreases slowly, unlike that of the normal channel. The pressure difference becomes larger as the ER becomes smaller. This can affect the stability and internal resistance of the fuel cell.
- (2)
- From the performance curve of the fuel cell according to the relative humidity change (RH 50, 75, and 90%), the cell voltage, power density, and CD gradually increase at high relative humidity. At ER 1.5 and 2.0, performance is measured similarly, and the power density and cell voltage instability seen on the steady channel disappear. The performance of the fuel cell can be increased by activating the catalyst reactants, because high CD changes the flow in the channel.
- (3)
- From the fuel cell performance as a function of cathode stoichiometry, the maximum power density appears near CD 1.1 in the case of the normal channel, and near CD 1.3 in the case of the wave form channel (ER 2.0). Furthermore, the maximum power density of the wave form channel is about 20% better than that of the normal one.
- (4)
- As AD decreases, the maximum power density increases further. The power density of AD 4 (at ER 2.0) is about 20% better than that of the normal channel. As the relative humidity increases, the performance of the fuel cell is improved. From this, the optimal shape of the wave form channel if found to have ER 2.0 and AD 4.0. In the time-wise fuel cell performance variation on the normal channel and waveform channel, the wave form channel exhibits less voltage and performance degradation than the normal channel. In a high CD, the performance curve of the normal channel and wave form channel is more stable.
Acknowledgments
This work was supported by the Sun Moon University Research Grant of 2015.
Author Contributions
All authors have contributed to this research work. Sun-Jun Byun and Young-Chul Kwon proposed research ideas and contributed to manuscripts and manuscript revisions. Zhen Huan Wang and Jun Son organized the experiment data. Dong-Kurl Kwak developed the research framework.
Conflicts of Interest
The authors declare no conflict of interest.
Nomenclature
| F | Force, N |
| h | Channel amplitude, mm |
| H | Channel height, mm |
| T | Temperature, °C |
| RH | Relative humidity, % |
| Q | Flow rate, kg/s |
| T | Time, s |
| P | Operating pressure, kPa |
| W | Work |
| u | Velocity component, m/s |
| R | Radius, m |
| V | Voltage, V |
| CD | Current density, A/cm2 |
| GDL | Gas diffusion layer |
| MEA | Membrane electrode assembly |
| Greek symbols | |
| λ | Stoichiometry |
| ρ | Density, kg/m3 |
| б | Surface tension, N/m |
| Subscripts | |
| a | Air |
| g | Gas |
| act | Activation |
| sat | Saturated |
| c | Cell |
| gen | Generating force |
| adh | Adhesion |
| r | Radiation |
| in | Inlet |
| out | Outlet |
| h | Hydrostatic |
| fore | Force contact angle |
References
- Escribano, S.; Blachot, J.F.; Ethève, J. Characterization of PEMFCs gas diffusion layers properties. J. Power Sources 2006, 156, 8–13. [Google Scholar] [CrossRef]
- Lin, J.H.; Chen, W.H.; Su, Y.J.; Ko, T.H. Effect of gas diffusion layer compression on the performance in a proton exchange membrane fuel cell. Fuel 2008, 87, 2420–2424. [Google Scholar] [CrossRef]
- Springer, T.E.; Zawodzinski, T.A.; Gottesfeld, S. Polymer electrolyte fuel cell model. J. Electrochem. Soc. 1991, 138, 2334–2342. [Google Scholar] [CrossRef]
- Natarajan, D.; Nguyen, T.V. A two-dimensional, two-phase, multicomponent, transient model for the cathode of a proton exchange membrane fuel cell using conventional gas distributors. J. Electrochem. Soc. 2001, 148, A1324–A1335. [Google Scholar] [CrossRef]
- Yoon, Y.G.; Lee, W.Y.; Park, G.G.; Yang, T.H.; Kim, C.S. Effects of channel configurations of flow field plates on the performance of a PEMFC. Electrochim. Acta 2004, 50, 709–712. [Google Scholar] [CrossRef]
- Kuo, J.K.; Chen, C.K. The effects of buoyancy on the performance of a PEM fuel cell with a wave-like gas flow channel design by numerical investigation. Int. J. Heat Mass Transf. 2007, 21–22, 4166–4179. [Google Scholar] [CrossRef]
- Kuo, J.K.; Yen, T.S.; Chen, C.K. Improvement of performance of gas flow channel in PEM fuel cells. Energy Convers. Manag. 2008, 49, 2776–2787. [Google Scholar] [CrossRef]
- Kuo, J.K.; Yen, T.H.; Chen, C.K. Three-dimensional numerical analysis of PEM fuel cells with straight and wave-like gas flow fields channels. J. Power Sources 2008, 177, 96–103. [Google Scholar] [CrossRef]
- Li, X.; Sabir, I. Review of bipolar plates in PEM fuel cells: Flow-field designs. Int. J. Hydrogen Energy 2005, 30, 359–371. [Google Scholar] [CrossRef]
- Su, A.; Chiu, Y.C.; Weng, F.B. The impact of flow field pattern on concentration and performance in PEMFC. Int. J. Energy Res. 2005, 29, 409–425. [Google Scholar] [CrossRef]
- Perng, S.W.; Wu, H.W. Effect of the prominent catalyst layer surface on reactant gas transport and cell performance at the cathodic side of a PEMFC. Appl. Energy 2010, 87, 1386–1399. [Google Scholar] [CrossRef]
- Liu, F.; Lu, G.; Wang, C.Y. Water transport coefficient distribution through the membrane in a polymer electrolyte fuel cell. J. Membr. Sci. 2007, 287, 126–131. [Google Scholar] [CrossRef]
- Wan, Z.M.; Huawei, H.W.; Shu, S.M.; Wang, Y.X.; Tang, H.L. A review on cold start of proton exchange membrane fuel cells. Energies 2014, 7, 3179–3203. [Google Scholar] [CrossRef]
- Pharoa, J.G. On the permeability of gas diffusion media used in PEM fuel cells. J. Power Sources 2005, 144, 77–82. [Google Scholar] [CrossRef]
- O’Hayre, R.; Cha, S.W.; Colella, W.; Prinz, F.B. Fuel Cell Fundamentals, 2nd ed.; John Wiley & Sons Inc.: New York, NY, USA, 2006. [Google Scholar]
- Kuo, J.K.; Chen, C.K. Evaluating the enhanced performance of a novel wave-like form gas flow channel in the PEMFC using the field synergy principle. J. Power Sources 2006, 162, 1122–1129. [Google Scholar] [CrossRef]
- Miansari, M.; Sedighi, K.; Amidpour, M.; Alizadeh, E.; Miansari, M. Experimental and thermodynamic approach on proton exchange membrane fuel cell performance. J. Power Sources 2009, 190, 356–361. [Google Scholar] [CrossRef]
- Han, S.H.; Kim, K.R.; Ahn, D.K.; Choi, Y.D. Experimental analysis of a dimensionless number in the cathode channels of a polymer electrolyte membrane fuel cell with different head losses. Proc. Inst. Mech. Eng. C J. Mech. Eng. Sci. 2009, 224, 95–108. [Google Scholar] [CrossRef]
Figure 1.
Schematic variation of a fuel cell reactant and product concentration according to time [15].
Figure 1.
Schematic variation of a fuel cell reactant and product concentration according to time [15].
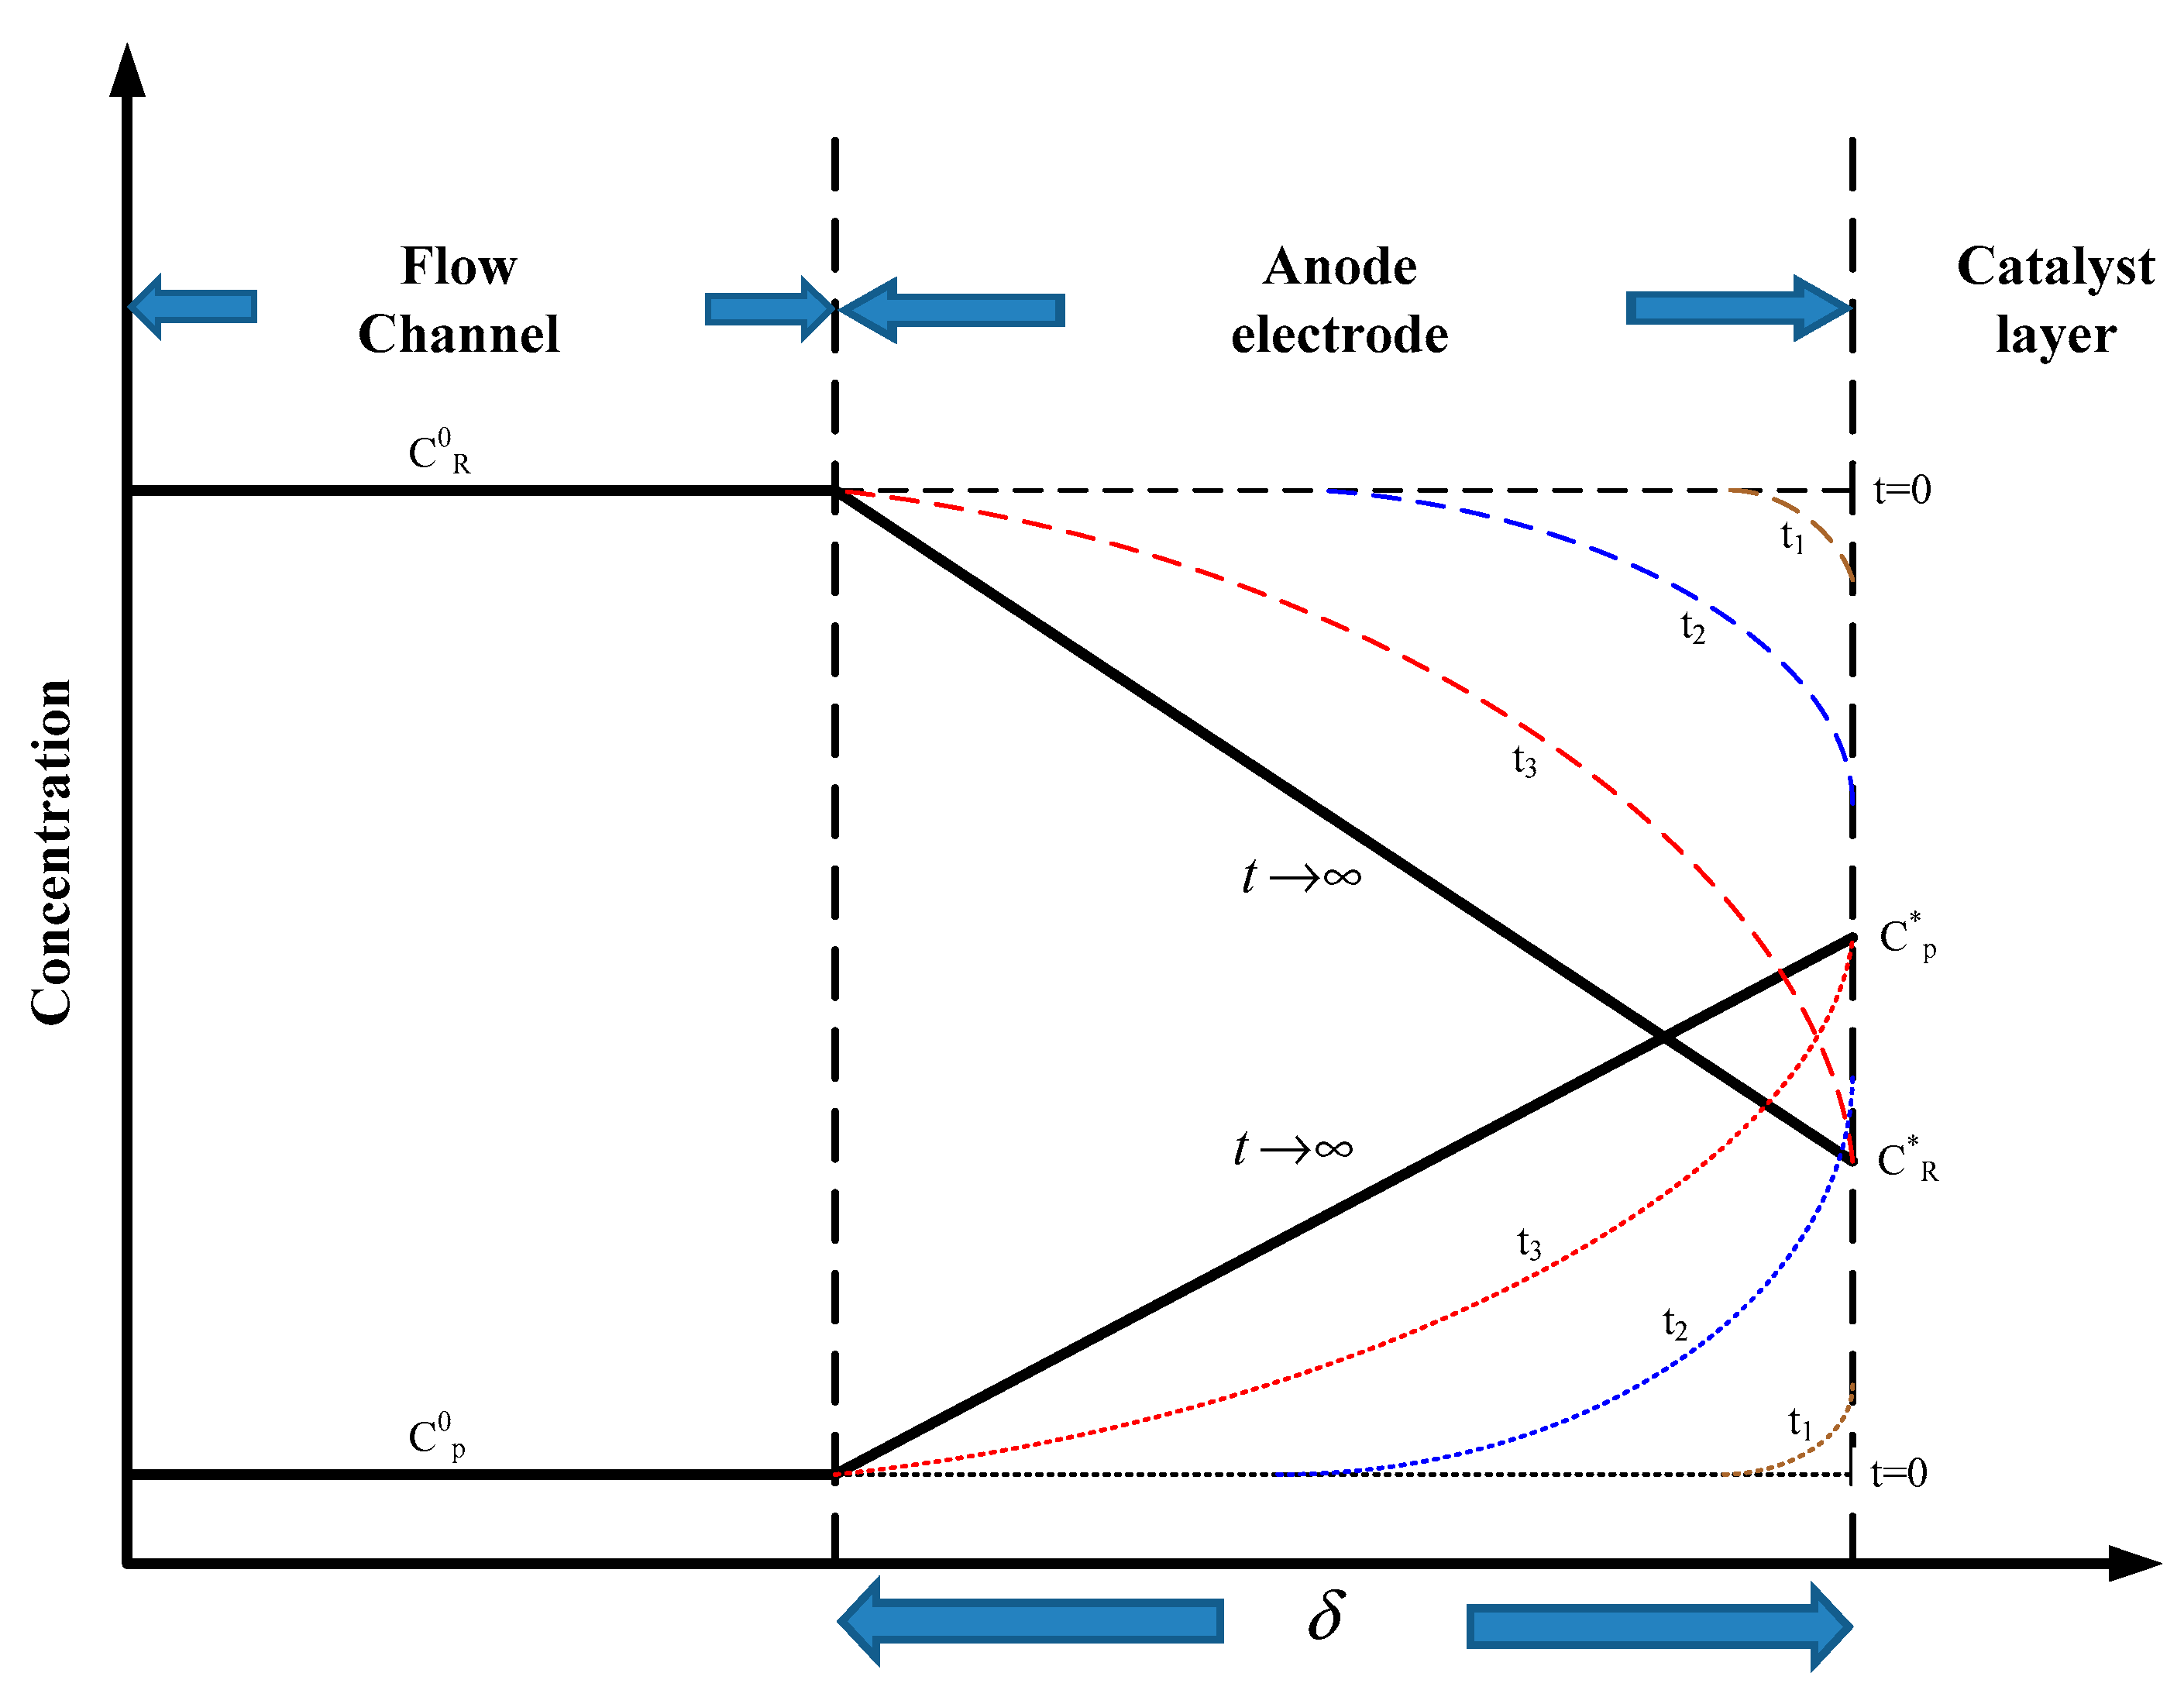
Figure 2.
The parameters of a wave form channel.
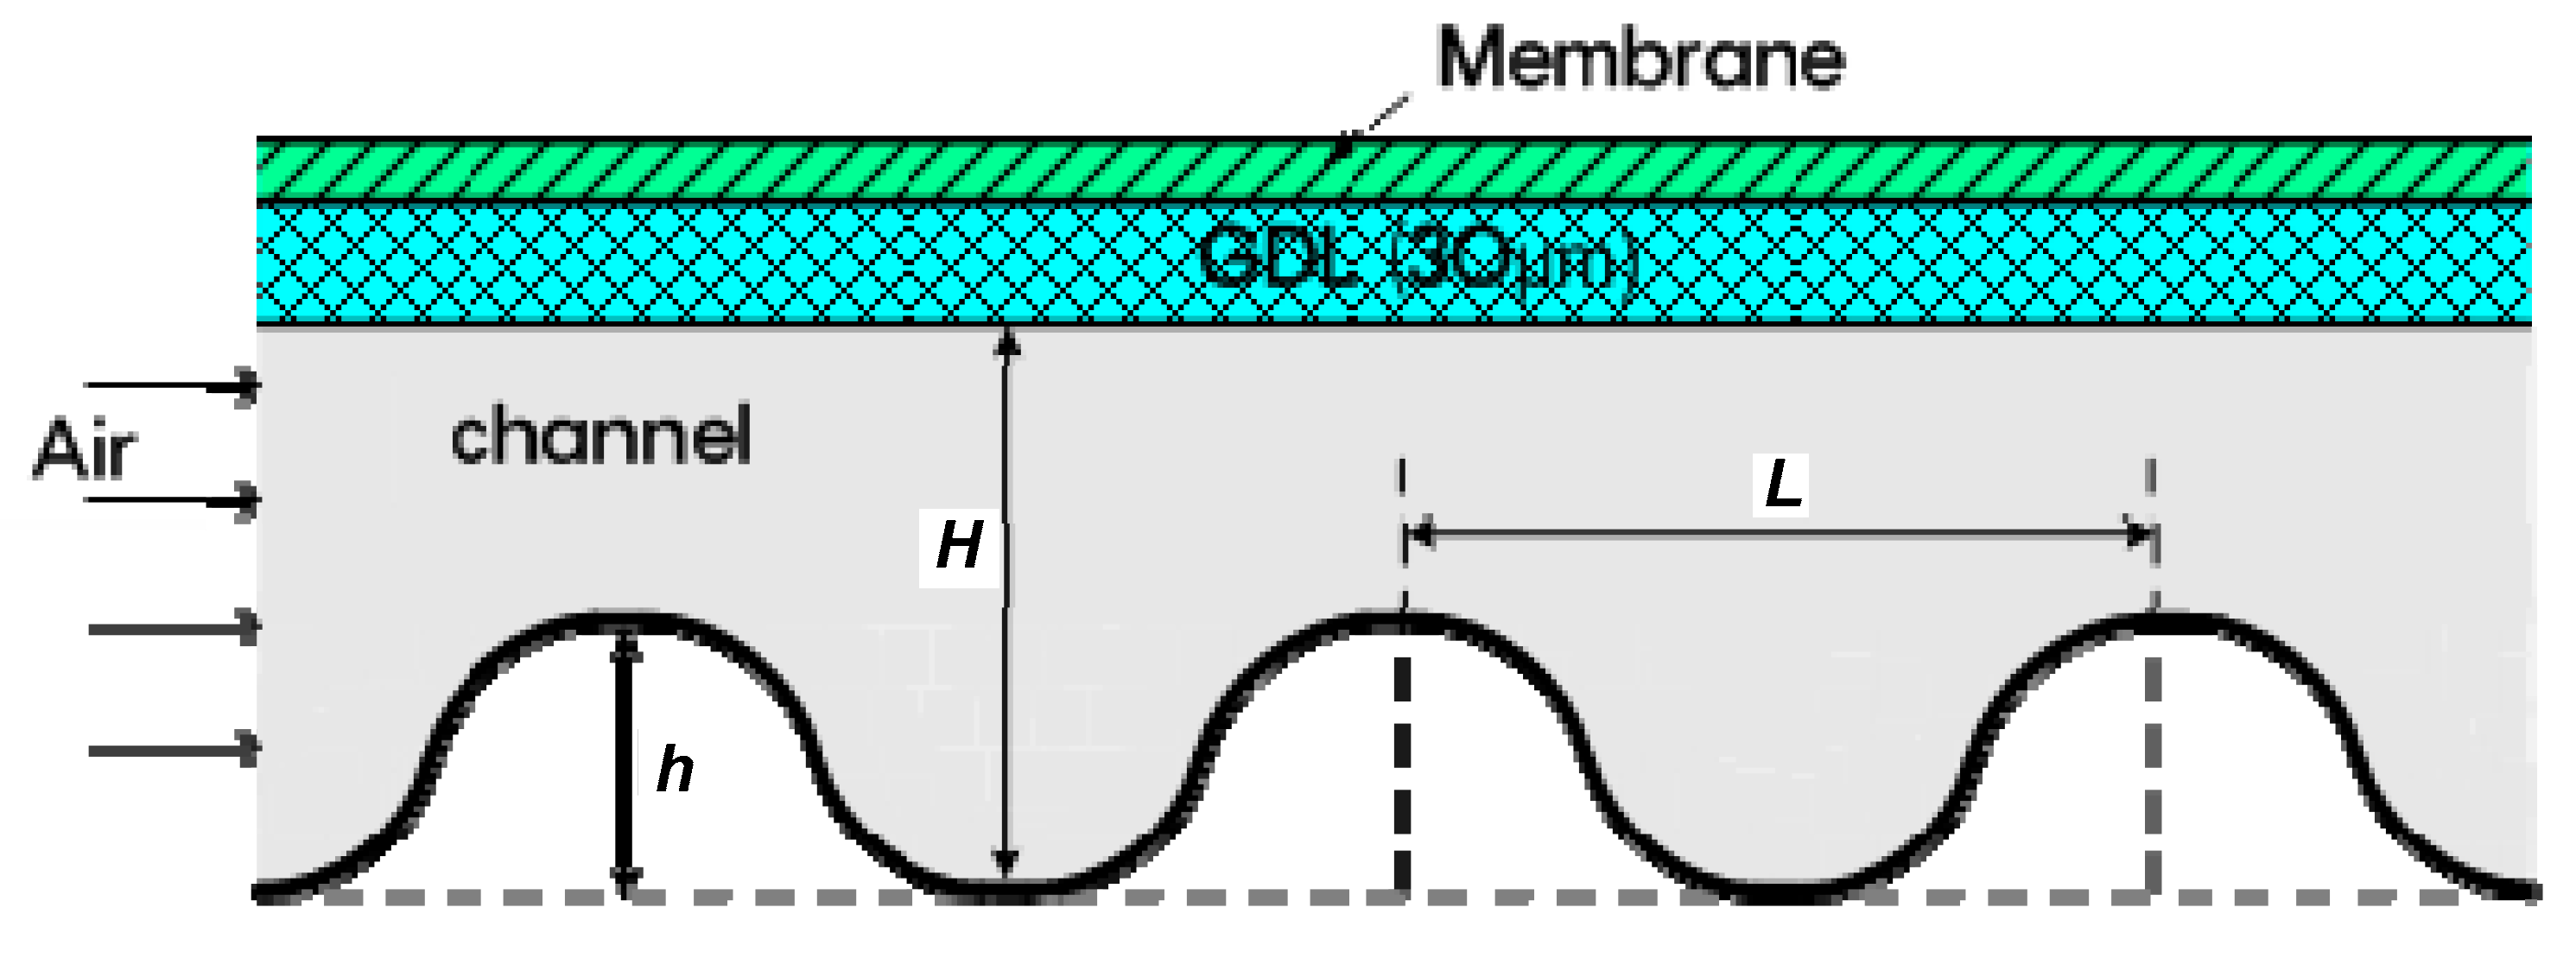
Figure 3.
Experimental unit of the fuel cell.
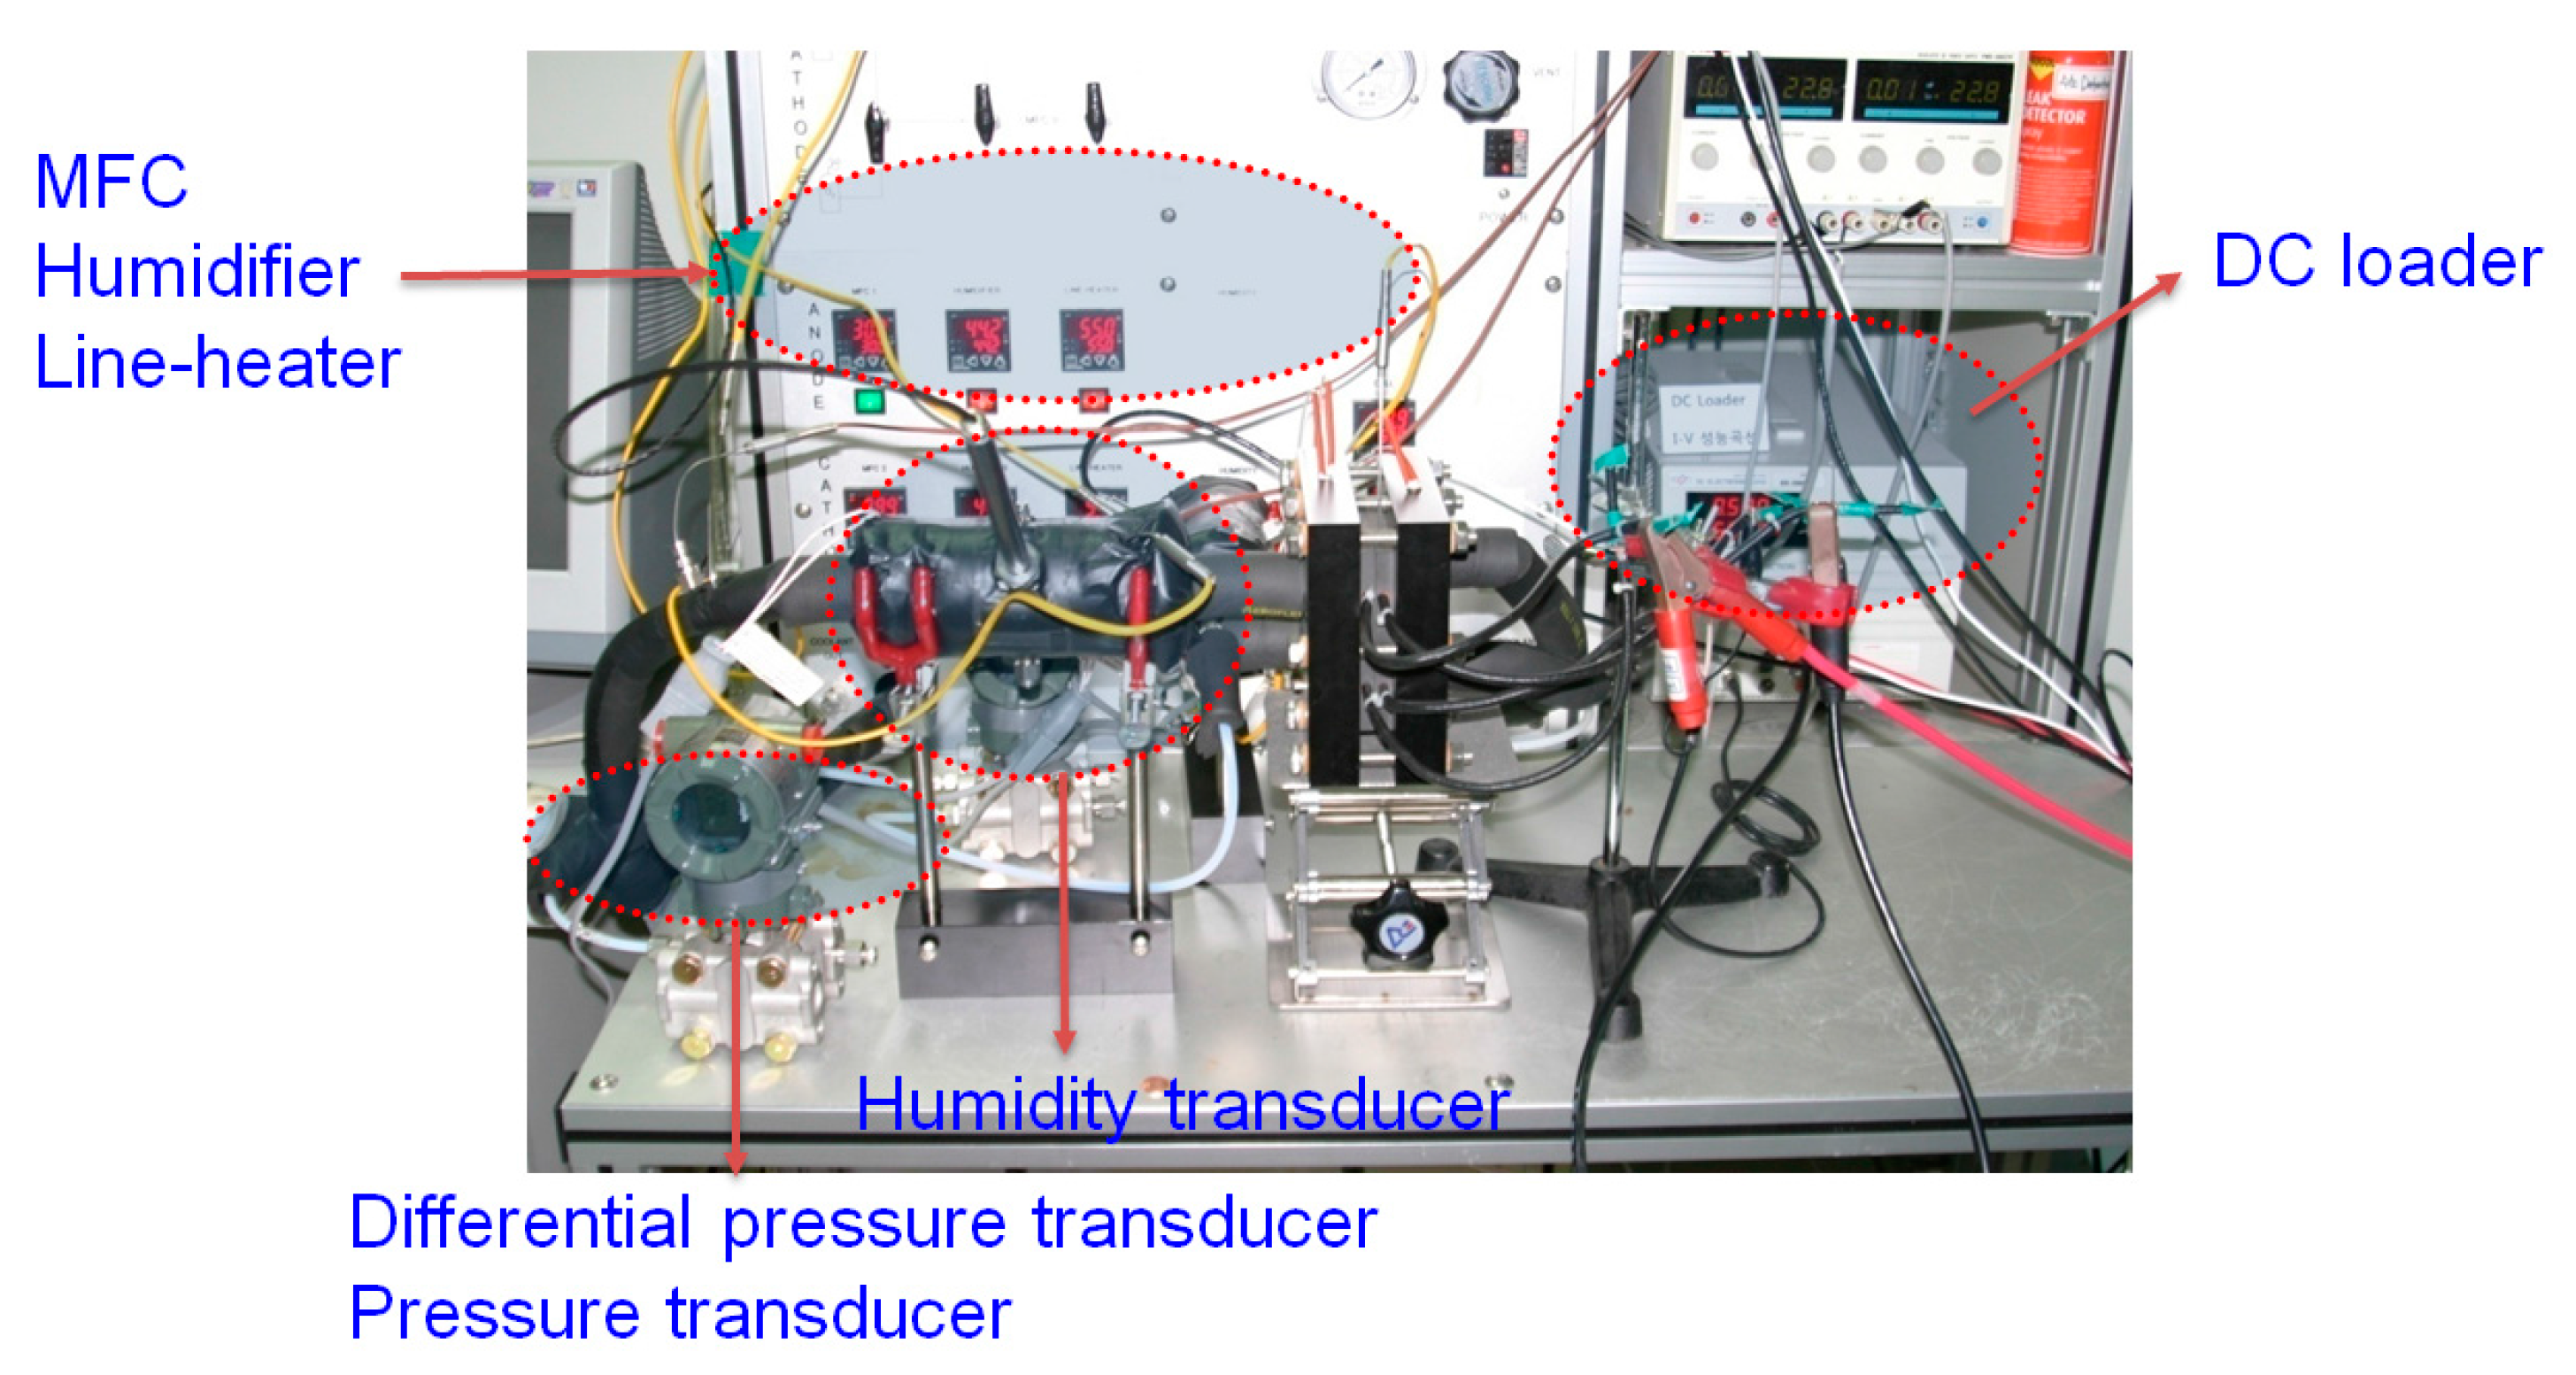
Figure 4.
Systematic of a wave form channel.
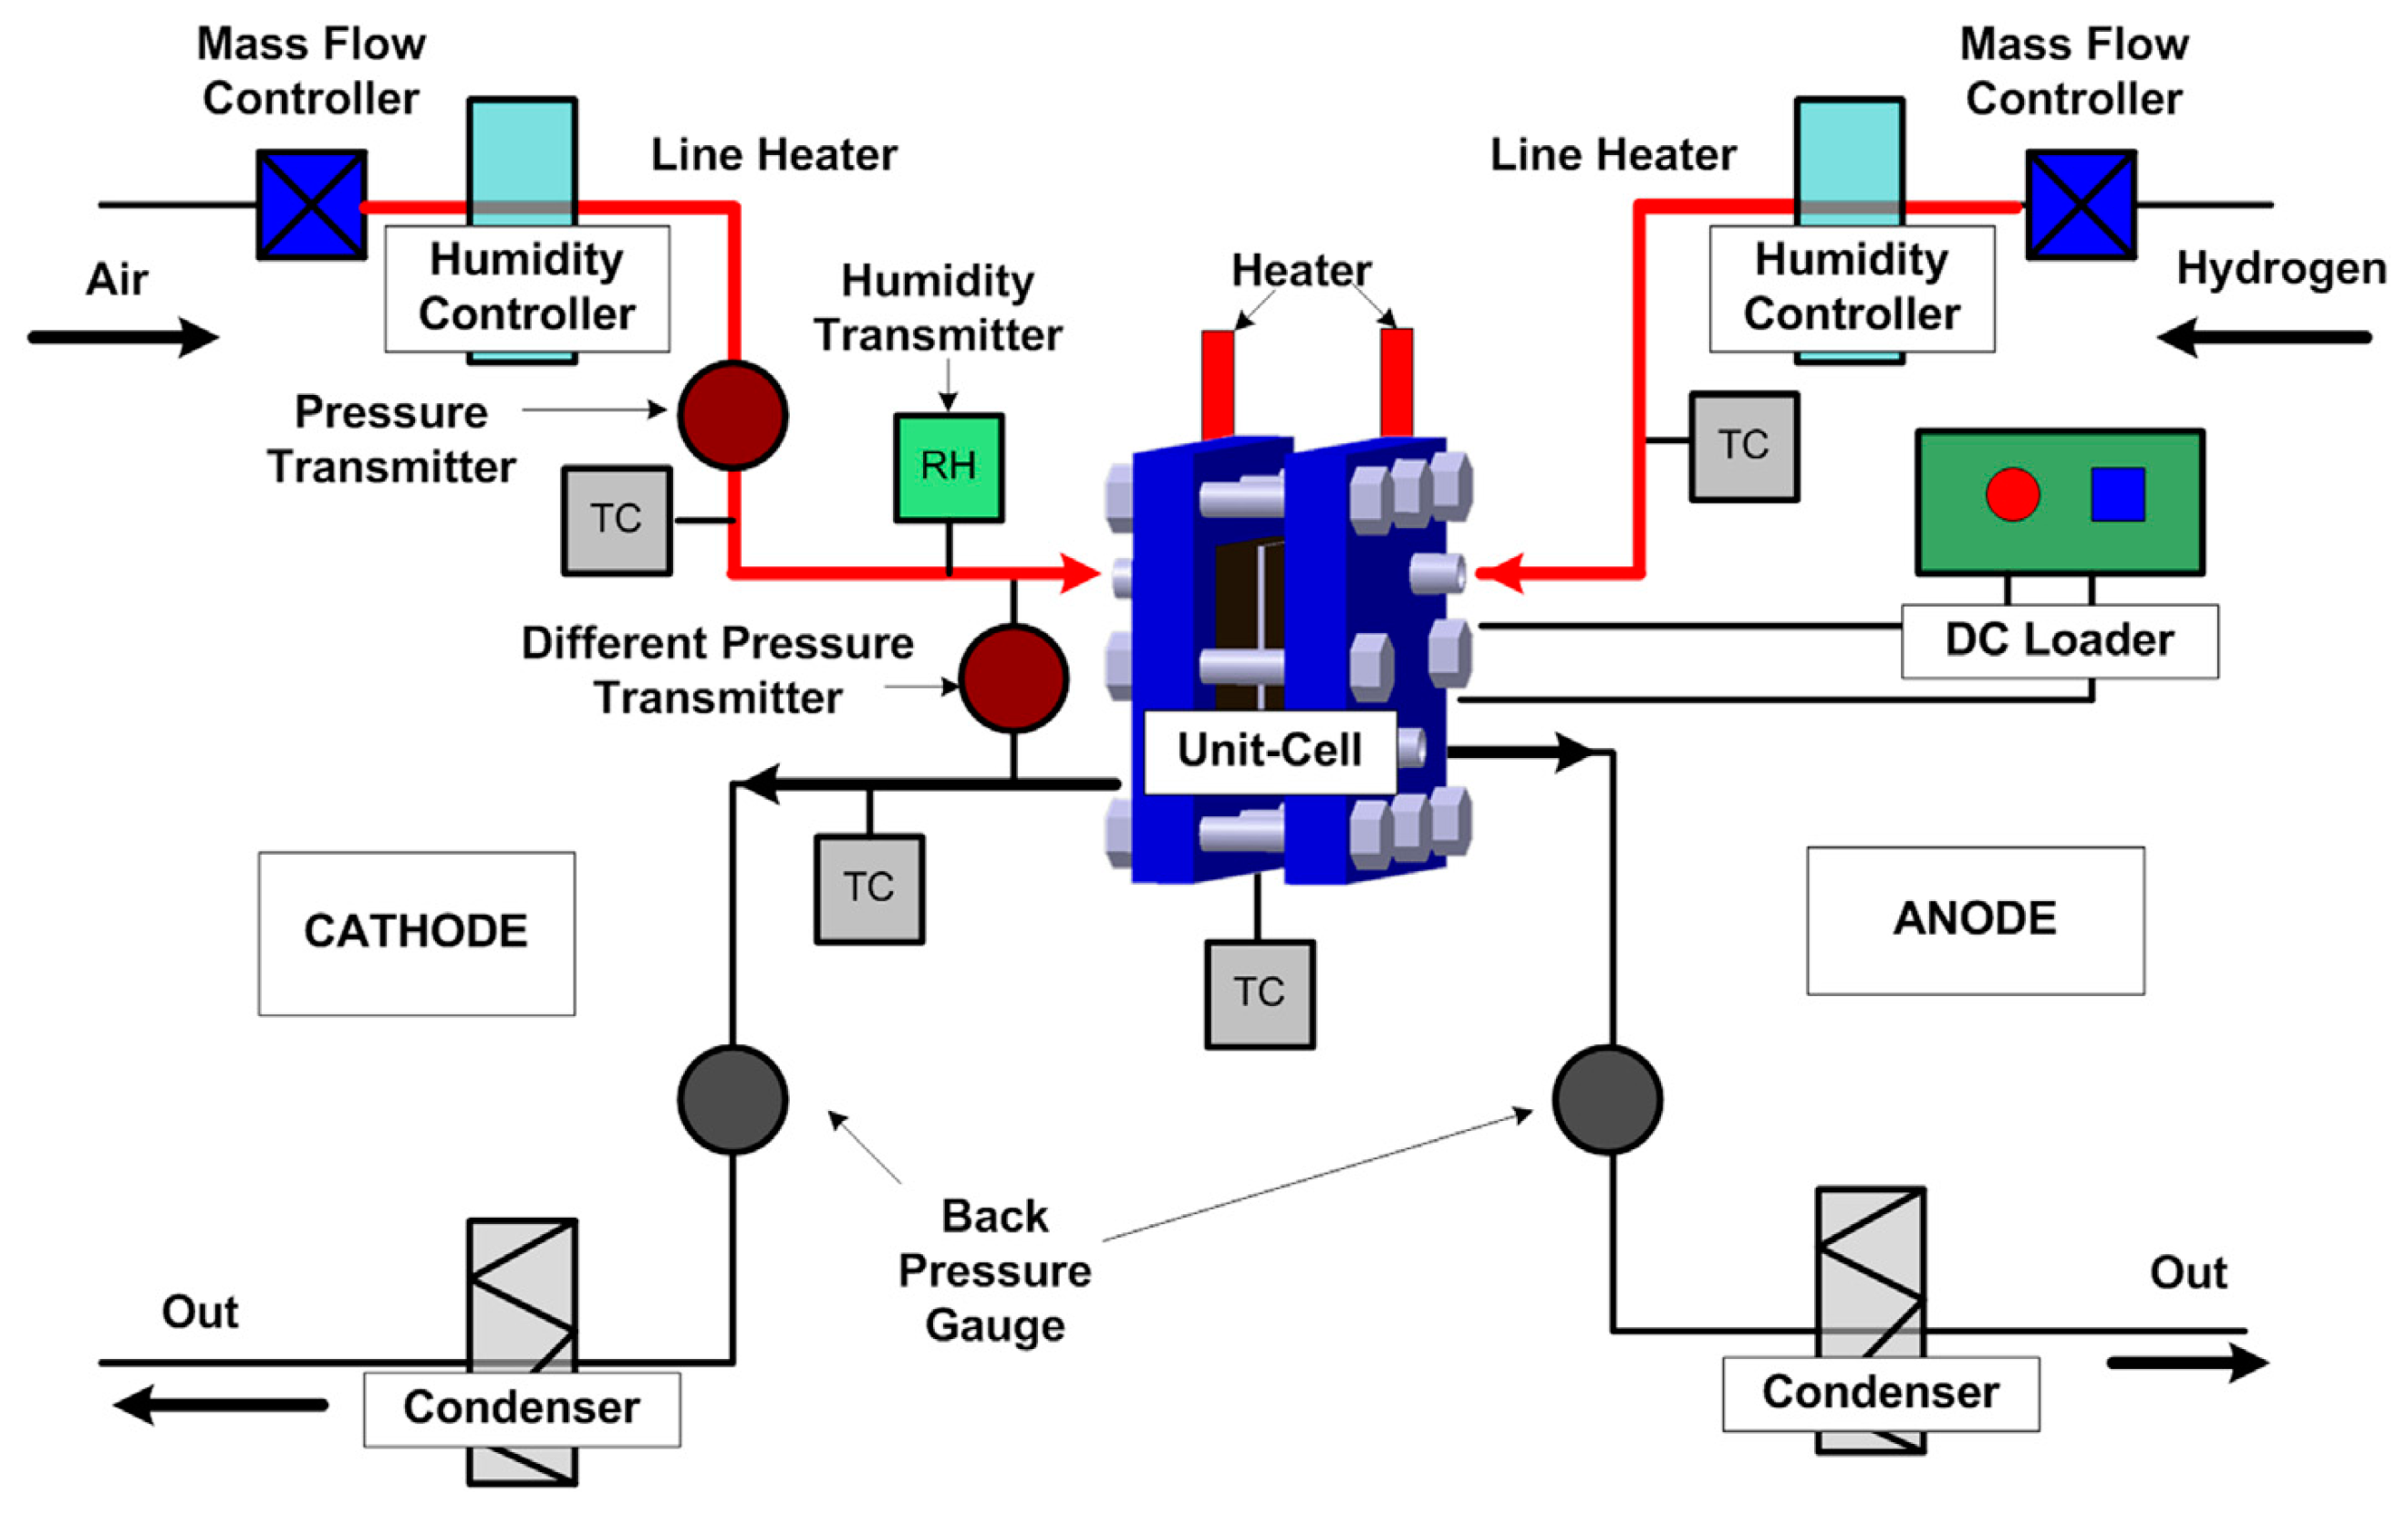
Figure 5.
Schematic of the unit-cell channel shape.

Figure 6.
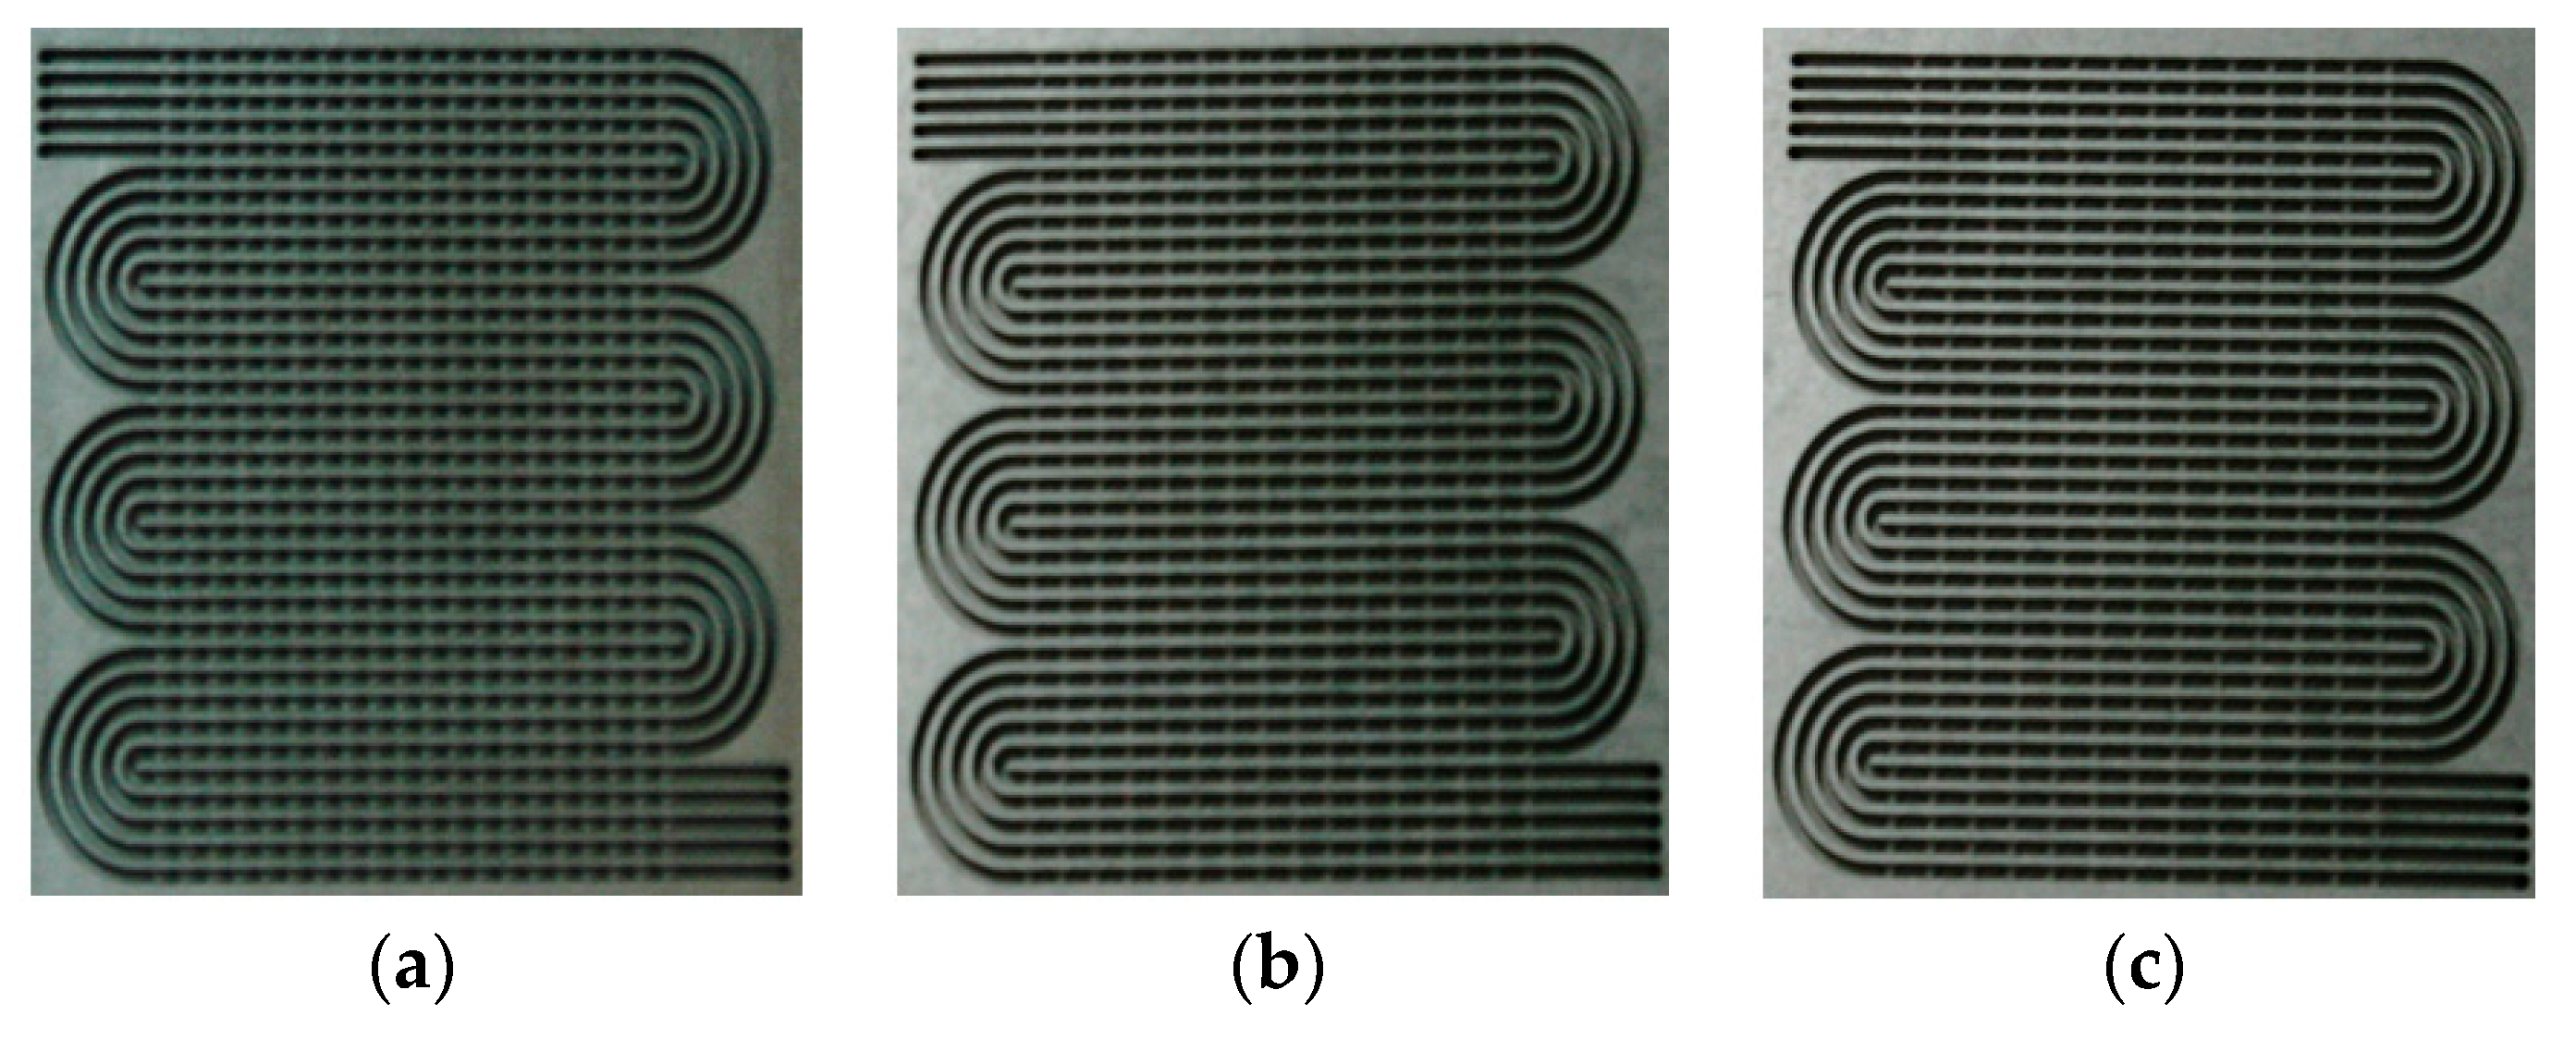
Bipolar plates of the gas flow cathode channels with the three wave form expansion ratios (ERs) of (a) ER 1.5, (b) ER 2.0, and (c) ER 3.0.
Figure 6.
Bipolar plates of the gas flow cathode channels with the three wave form expansion ratios (ERs) of (a) ER 1.5, (b) ER 2.0, and (c) ER 3.0.

Figure 7.
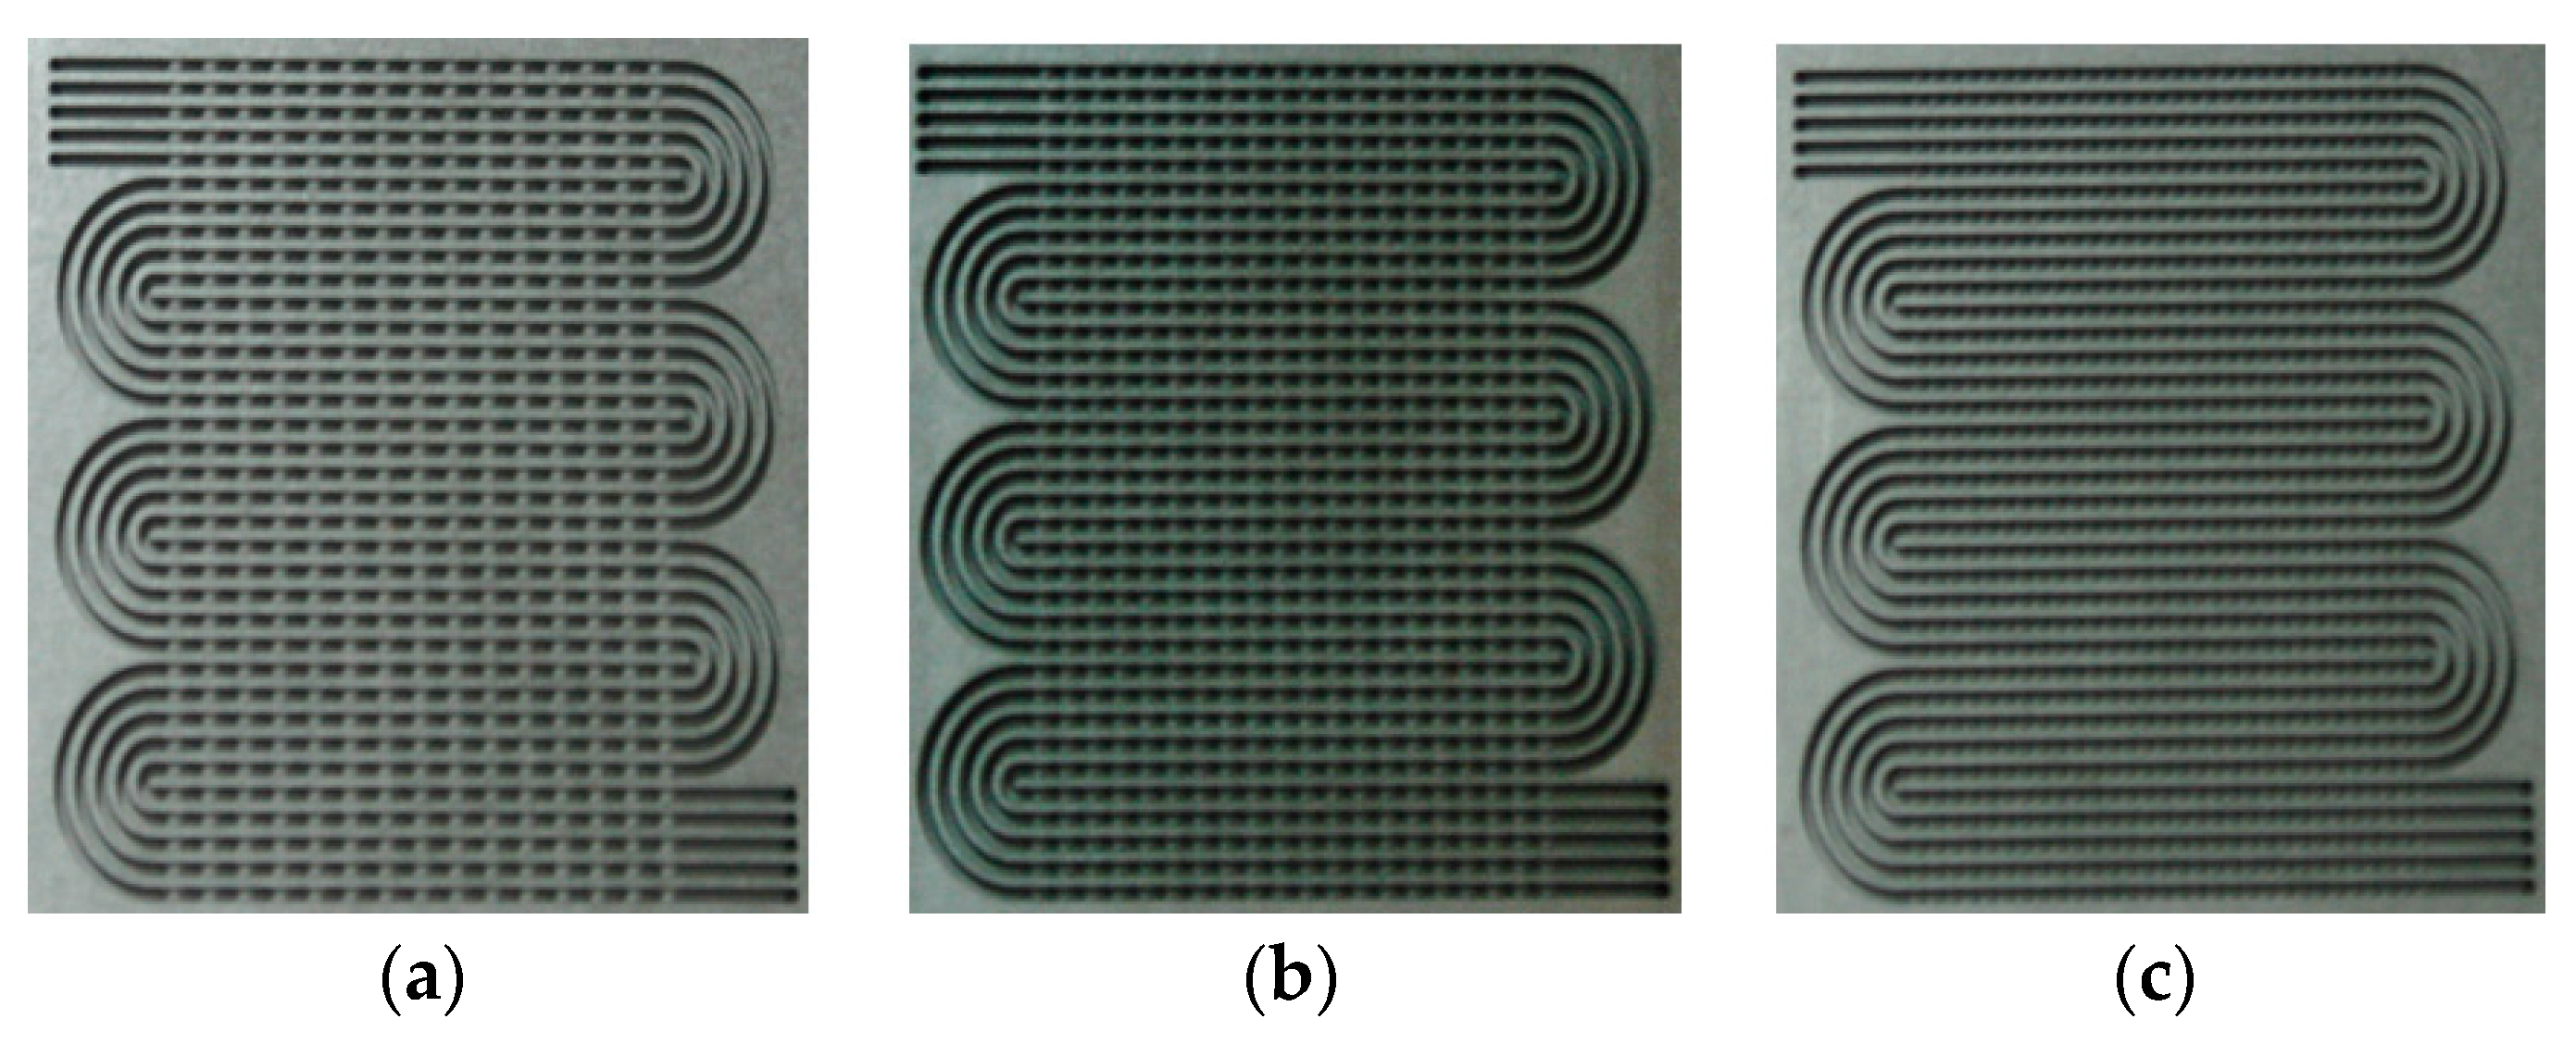
Bipolar plates of the gas flow cathode channels with the three wave form adhesive distances (ADs) of (a) AD 4.0, (b) AD 5.0, and (c) AD 6.0.
Figure 7.
Bipolar plates of the gas flow cathode channels with the three wave form adhesive distances (ADs) of (a) AD 4.0, (b) AD 5.0, and (c) AD 6.0.

Figure 8.
Bipolar plate of gas flow cathode channel with wave form AD.

Figure 9.
Unit cell difference curve in the normal channel and wave form channel, according to the variation in ER.
Figure 9.
Unit cell difference curve in the normal channel and wave form channel, according to the variation in ER.

Figure 10.
Performance curve of the normal channel and wave form channel, according to variation in the ER at constant relative humidity of (a) RH 50%, (b) RH 75%, and (c) RH 90%.
Figure 10.
Performance curve of the normal channel and wave form channel, according to variation in the ER at constant relative humidity of (a) RH 50%, (b) RH 75%, and (c) RH 90%.

Figure 11.
Pressure difference between the normal channel and wave form channel with varied ER.

Figure 12.
Pressure curve according to variation in stoichiometry at the cathode of (a) the normal channel and (b) wave form channel, ER 2.0.
Figure 12.
Pressure curve according to variation in stoichiometry at the cathode of (a) the normal channel and (b) wave form channel, ER 2.0.


Figure 13.
Pressure difference of the normal channel and wave form channel with varied ER, according to variation in the cathode stoichiometry.
Figure 13.
Pressure difference of the normal channel and wave form channel with varied ER, according to variation in the cathode stoichiometry.

Figure 14.
Pressure difference of the normal channel and wave form channel with varied ER, according to variation in the cathode stoichiometry of (a) RH 75% and (b) RH 90%
Figure 14.
Pressure difference of the normal channel and wave form channel with varied ER, according to variation in the cathode stoichiometry of (a) RH 75% and (b) RH 90%
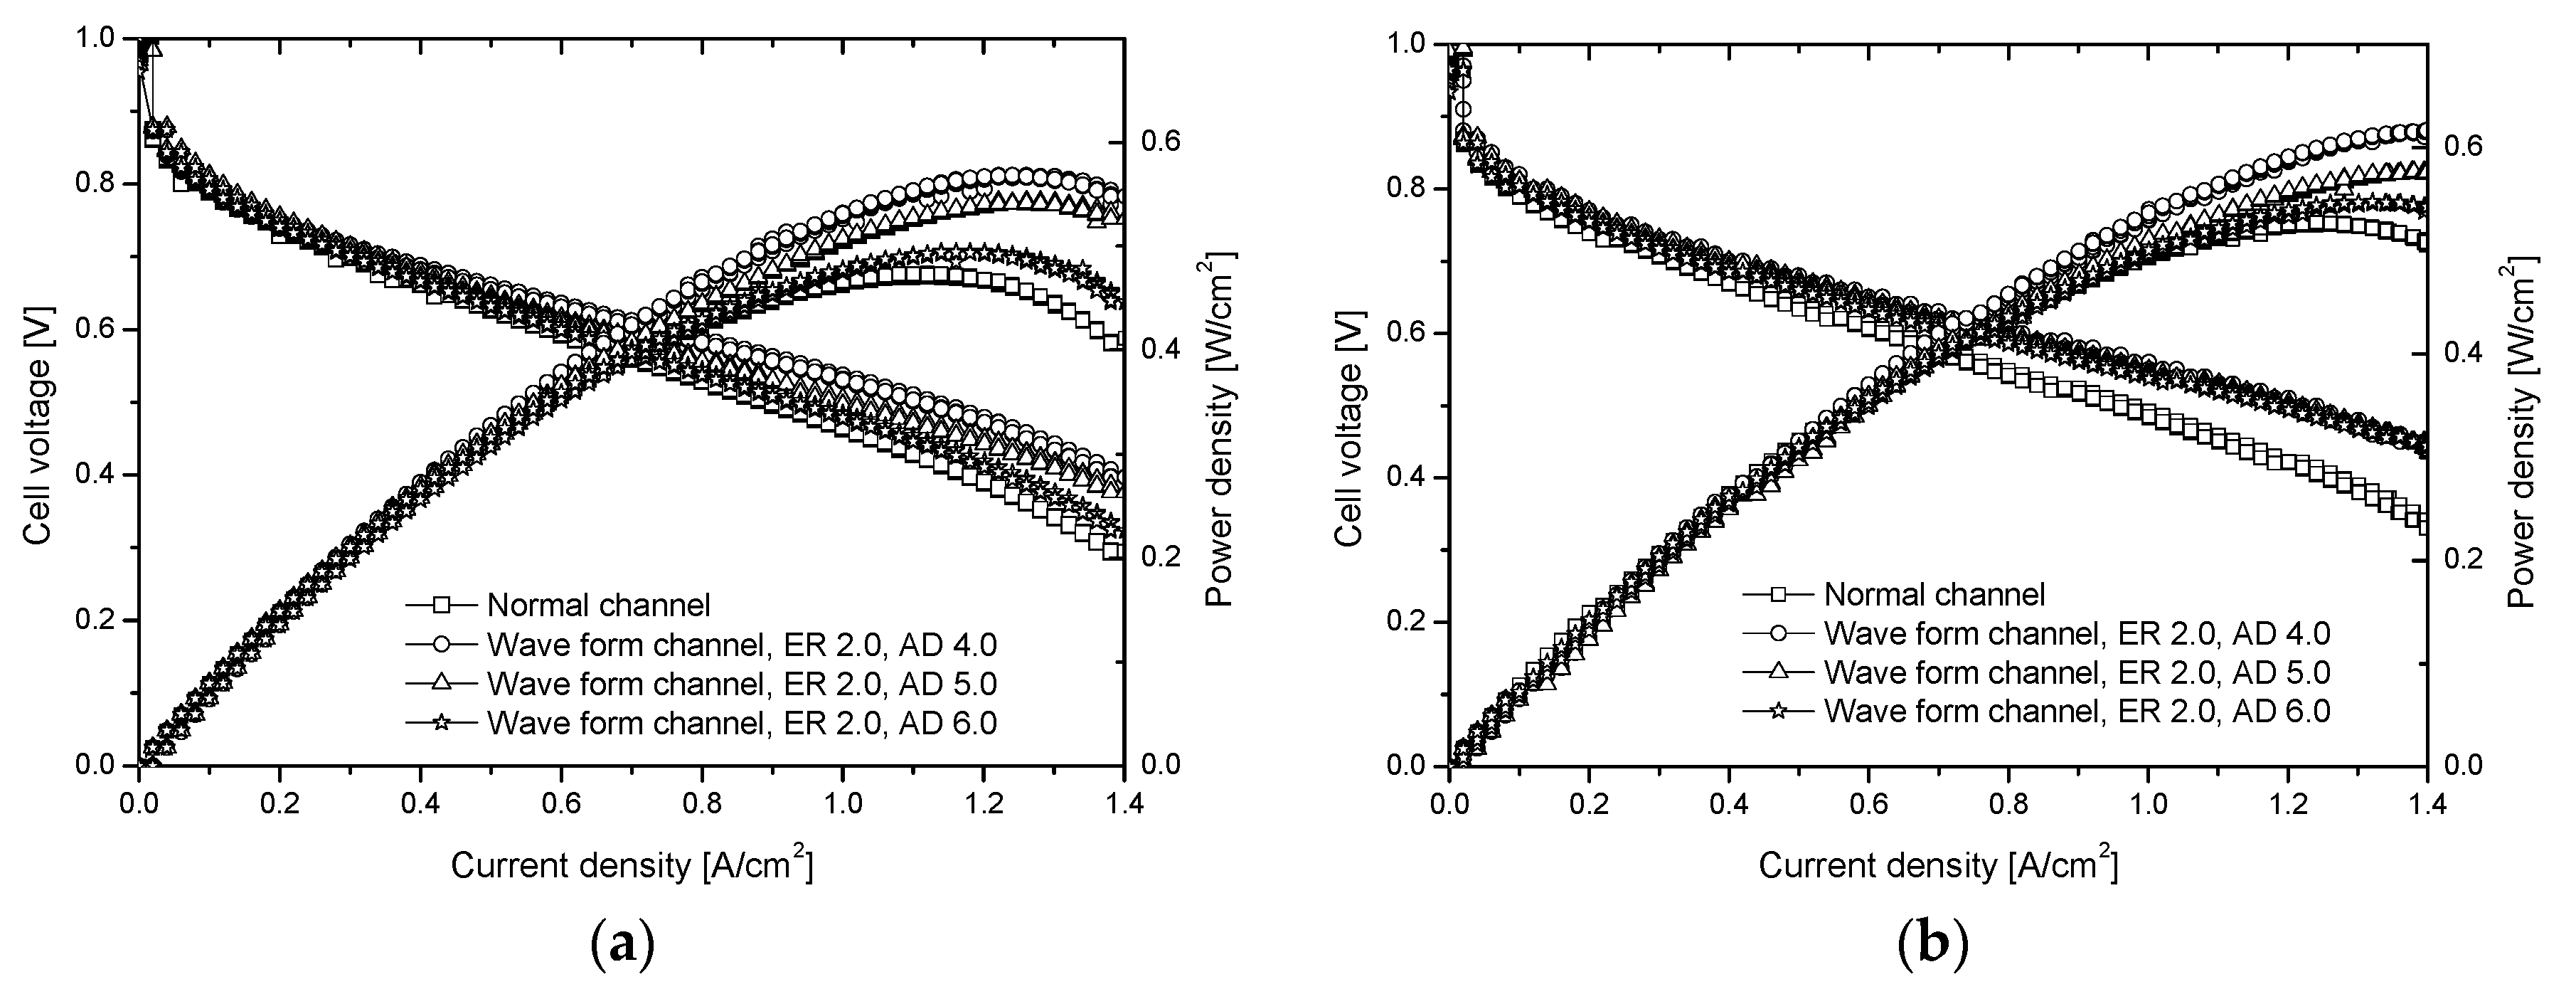
Figure 15.
Performance curve of the normal channel and wave form channel operated for 10 h, at a current density (CD) of (a) 0.8 and (b) 1.0.
Figure 15.
Performance curve of the normal channel and wave form channel operated for 10 h, at a current density (CD) of (a) 0.8 and (b) 1.0.


Table 1.
Specifications of the measurement devices [18].
Table 1.
Specifications of the measurement devices [18].
| Items | Location | Manufacturer | Model No. | Accuracy |
|---|---|---|---|---|
| Pressure gauge | Cathode inlet | YOKOGAWA | EJA530A | ±0.075% |
| Differential pressure gauge | Cathode | YOKOGAWA | EJA110A | ±0.075% |
| Electronic load | - | E.L.P. Tek | ESL-300Z | ±0.1% |
| Mass flow controller | Anode and cathode | Bronkhorst High-Tech | EL-flow F-201C | 0.5% |
| Thermocouple | Test section | Omega Engineering Inc. | T-type | 0.5 °C or 0.4% |
| Humidity | Cathode inlet | VAISALA | HMT 337 | ±1.5% |
© 2018 by the authors. Licensee MDPI, Basel, Switzerland. This article is an open access article distributed under the terms and conditions of the Creative Commons Attribution (CC BY) license (http://creativecommons.org/licenses/by/4.0/).
Share and Cite
MDPI and ACS Style
Byun, S.-J.; Wang, Z.H.; Son, J.; Kwak, D.-K.; Kwon, Y.-C. Experimental Study on Improvement of Performance by Wave Form Cathode Channels in a PEM Fuel Cell. Energies 2018, 11, 319. https://doi.org/10.3390/en11020319
AMA Style
Byun S-J, Wang ZH, Son J, Kwak D-K, Kwon Y-C. Experimental Study on Improvement of Performance by Wave Form Cathode Channels in a PEM Fuel Cell. Energies. 2018; 11(2):319. https://doi.org/10.3390/en11020319
Chicago/Turabian StyleByun, Sun-Joon, Zhen Huan Wang, Jun Son, Dong-Kurl Kwak, and Young-Chul Kwon. 2018. "Experimental Study on Improvement of Performance by Wave Form Cathode Channels in a PEM Fuel Cell" Energies 11, no. 2: 319. https://doi.org/10.3390/en11020319
Note that from the first issue of 2016, this journal uses article numbers instead of page numbers. See further details here.