Cyber-Attacks on Smart Meters in Household Nanogrid: Modeling, Simulation and Analysis


1
Department of Industrial Engineering, Tsinghua University, 100084 Beijing, China
2
Faculty of Mechanical Engineering, RWTH Aachen University, 52062 Aachen, Germany
*
Author to whom correspondence should be addressed.
Energies 2018, 11(2), 316; https://doi.org/10.3390/en11020316
Submission received: 10 November 2017
/
Revised: 21 December 2017
/
Accepted: 27 December 2017
/
Published: 2 February 2018
(This article belongs to the Section F: Electrical Engineering)
Abstract
:The subject of cyber-security and therefore cyber-attacks on smart grid (SG) has become subject of many publications in the last years, emphasizing its importance in research, as well as in practice. One especially vulnerable part of SG are smart meters (SMs). The major contribution of simulating a variety of cyber-attacks on SMs that have not been done in previous studies is the identification and quantification of the possible impacts on the security of SG. In this study, a simulation model of a nanogrid, including a complete household with an SM, was developed. Different cyber-attacks were injected into the SM to simulate their effects on household nanogrid. The analysis of the impacts of different cyber-attacks showed that the effects of cyber-attacks can be sorted into various categories. Integrity and confidentiality attacks cause monetary effects on the grid. While, availability attacks have monetary effects on the grid as well, they are mainly aimed at compromising the SM communication by either delaying or stopping it completely.
1. Introduction
The spread of distributed generation systems (DGS) and SG aided to address the challenges of traditional electric grids, such as matching power generation to demand, incorporating variable means of generation, and providing customers with sufficient real-time information [1]. SGs fully integrate advanced technology, such as high-speed and two-way communications, into power infrastructure [2]. However, the physical/cyber security of the SG is still vulnerable, mainly due to a large number of access points, as well as the frequent updating of the network components [3].
As an essential component of SG advanced metering infrastructure (AMI), SMs collect and monitor data about consumers’ real-time energy consumption. In addition, SMs support billing and increasing consumer awareness about consumption. Furthermore, SMs support energy providers with the data needed to enhance the prediction and planning of energy usage, which enables them to optimize energy production and predict critical events [4]. For these reasons, SMs need to support two-way communication between the meter and the utility server [5].
Two-way communication is vulnerable to cyber-attacks that might not only affect the SMs, but also the whole SGs through them [4,6]. SMs have several other weak points, such as limited memory, small processing power, as well as physical exposure [6,7]. Also, heterogeneous network architecture, which means that SMs connect various network devices with different operating systems or protocols, offers attackers more opportunities to launch attacks [6]. Furthermore, an internet connection of SMs provides attackers with the possibility to conduct cyber-attacks [5]. Unelaborate authentication and encryption procedures or integrity protocols of SMs provide attackers with more opportunities to inject cyber-attacks [6]. Due to these weaknesses, SMs make SGs vulnerable to malicious attempts to obtain, alter, or even destroy any cyber/physical component or subsystem [8]. In summary, the higher the complexity of the SM and the more features and functions are realized and used, the more opportunities that attackers might have to conduct cyber-attacks on them. Furthermore, the more data is collected and sent by SMs, the higher is the incentive for attackers to launch attacks on SMs.
Cyber-attacks are typically assigned to three different classes, which are availability, integrity, and confidentiality. Availability describes the network being able to perform communication in a normal manner. Integrity means the network being protected against unauthorized changes. Confidentiality means, that information is protected from unauthorized access [9]. Two more classification categories were introduced by Wang et al. [9]. They define authenticity as the network’s ability to verify the genuineness of messages. Non-repudiation describes a user not being able to deny the reception of messages. However, non-repudiation is not required for most messages in SGs [9].
In order to quantitatively assess the impact of cyber-attacks on SGs and ultimately prevent these attacks, a detailed knowledge about the impact of different cyber-attacks is crucial to define the protection measures. Therefore, a survey was conducted by the authors on the state-of-the-art knowledge of simulations of cyber-attacks on SGs and SMs. During the survey, it was found that most of the attacks that were simulated for SGs and SMs were DoS or DDoS attacks, as shown in Figure 1 [10].
The survey has shown, that most former research has addressed the injection and impact of cyber-attacks on the SG in general, as opposed to SMs in particular. Related studies especially focused on simulation of availability attacks and in this class mainly on DoS/DDoS attacks. A summary of related work concerning the simulation of cyber-attacks on SG, respectively, SMs is given in Table 1.
Soupionis and Benoist [11] simulated DoS/DDoS attacks on SG by attacking a specific web service to limit communication by a router, which connected the different SG elements. An approach utilized by Asri and Pranggono [5] used NeSSi, an agent-based simulation environment, to evaluate DDoS attack impact on SG. Concerning the classes of integrity and authenticity attacks, different research groups simulated the impact of man-in-the-middle (MITM) attacks. Zhang et al. [12] simulated DoS attacks based on e-mail, phishing and spoofing, worm attacks, viruses, and Trojan horses. Therefore, they simulated the injection of spoofing attacks in their study. Zhang et al. [12] also launched data modification attacks on metering infrastructure to impact the communication within the system by interfering with selected Modbus/TCP packets. Ciancamerla et al. [14] simulated MITM attacks by poisoning the address resolution protocol (ARP), and therefore the ARP cache.
Few research has been conducted on the injection and impact of cyber-attacks on SMs. Simulations by previous research groups focus on the injection and impact of DoS/DDoS attacks on SM. Sgouras et al. [4] used injection of both DoS and DDoS attacks into SMs to research the impact on optical fiber cable function. Another approach used by Ma et al. [13] utilized Markov games to simulate the impact of different DDoS attacks, which were flooding attacks, as well as low-rate transmission control protocol attacks.
To deepen the knowledge about cyber-attack impacts on SMs and SGs, this study will focus on the formerly identified, not yet simulated cyber-attacks on SMs. The aforementioned weaknesses make SMs especially vulnerable to cyber-attacks. For this reason, it is crucial to identify and quantify the possible impact of cyber-attacks on SM. It was found that the only extensive simulations of cyber-attacks on SMs researched the impact of DoS/DDoS attacks [4,13]. Other cyber-attacks in the classes of integrity, confidentiality and authenticity have not yet been simulated using SMs as an injection point. A simulation model enabling the simulation of a wide range of not yet researched cyber-attacks provides new insight into the identification of cyber-attacks on SMs and the quantification of the impact of cyber-attacks on SMs. To enable the simulation of a wider variety of cyber-attacks on SMs, a new simulation model had to be developed. For the injection and assessment of cyber-attacks in SMs, a household nanogrid, with communication via the SM was developed. The proposed nanogrid model allows quantification of cyber-attack impact, as well as the identification of cyber-attack injection in some cases, based on the energy values that were transmitted via the SM. For this reason, different simulation models of household nanogrids were assessed to build a simulation model best mirroring reality.
In literature, there exists few simulation models. An overview over related work in household simulation models is given in Table 2. A smart home model was developed by Kahrobaee et al. [16]. It consists of a home, which is connected to a battery as well as a form of energy generation and the electric grid. Furthermore, Kahrobaee et al. [16] defined four actions, which are available to the household in order to meet its objective of minimizing its cost of electricity. These actions are buying electricity from the grid, saving energy by either charging or discharging the battery, meeting the household’s energy demand, and selling energy to the grid.
Asare-Bediako et al. [15] present a household model as the combination of different components. The household appliances, as well as a photovoltaic system, are connected via the electrical network to the smart metering system, while the household appliances are also connected to the smart meter as well as the internet via the information and communication technology network [15].
Zhang et al. [17] introduced a classification scheme, which helps to precisely determine the energy demand of household appliances. The categories being continuous appliances, which require a constant amount of energy. Standby appliances have three operation states, which are switched on, standby, and switched off. Cold appliances are constantly in use to provide a cooling function, but do not consume the same amount of energy at all times. Active appliances are such, whose state has to be actively chosen by the user to be either on or off [17].
In this study, we include different components of former studies in the simulation model to obtain more realistic simulation results. The household’s peak energy demand was modelled following the classification scheme of Zhang et al. [17]. Furthermore, the household nanogrid model includes a photovoltaic energy generation and an energy storage option, as introduced by Kahrobaee et al. [16]. A central decision unit has different operation actions to meet household energy demand [16]. Also, the central decision unit communicates a predefined set of data to the SM and in turn receives data such as the grid energy price for the next time period from the SM through a pre-established network, as described by Asare-Bediako et al. [15].
The rest of this paper is organized as follows. Section 2 presents the mathematical modelling of the household nanogrid, with demand and energy generation that transmits data to the distribution grid via SM. It gives a detailed description of the mathematical simulation of different cyber-attacks. In Section 3, the parametrization of the simulation model is presented. In Section 4, the results of simulation of cyber-attack injection into household model will be presented and analyzed. Section 5 will conclude the findings of the conducted simulation.
2. Modelling
2.1. Household Nanogrid
The model of household nanogrid consists of different components as can be seen in Figure 2. Each component of the household nanogrid will be described and explained in detail in the following sections. The household nanogrid consists of household appliances, to model the energy demand of the household, a photovoltaic system, to model energy generation by the household itself, and a battery, to model energy storage. Furthermore, the household requires a central decision unit, which determines the usage of photovoltaic energy, the satisfaction of energy demand by household appliances, and the utilization of energy stored in the battery. Therefore, presents the “smart” feature of the household nanogrid. Between the central decision unit and the photovoltaic system, the battery, and the household appliances, communication of certain data is realized. Furthermore, the central decision unit transmits certain data to the SM, as well as receives other data from it. The SM represents the communication interface between the household nanogrid and the distribution grid, and provides the distribution grid with an opportunity to cut the energy supply to the household nanogrid. Finally, the functions of the distribution grid that are essential to the model need to be simulated as well. Therefore, grid energy price data, as well as the information, whether the energy supply to the household nanogrid is to be cut, need to be provided by the simulation of relevant distribution grid functionalities.
Following, the mathematical model describing the central decision unit’s decision making is explained. The objective function of the central decision unit ensures the minimization of cost to the household.
Furthermore, a constraint has to make sure that the household energy demand and the energy used to charge the battery equal the sum of grid energy demand , photovoltaic generated energy , and energy discharged from the battery for every time period t.
Moreover, it has to be ensured that the battery is only charged or discharged in one time period. With and being binary variables, which can only take the values of either 0 or 1.
Furthermore, it has to be ensured that the battery is not discharged further than the maximum capacity of the battery.
Also, the different energy values cannot get lower than zero in each time period t.
The cost to charge the battery has to be lower than the defined cost limit to charge the battery .
Also, the amount of photovoltaic energy sold to the grid cannot exceed the amount of photovoltaic energy that is generated in each time period t .
In order to solve the problem that is presented by covering the household’s energy demand , an algorithm is developed, which assigns the different energy sources to the energy demand under the aforementioned restrictions. The different variables, like battery capacity , maximum charging rate of the battery , and cost limit to charge the battery , are set beforehand, and are provided to the central decision unit by the different objects that are created to represent the different parts of the household nanogrid. The central decision unit utilizes these variables, as well as input data, to solve the linear program to minimize the household’s energy cost by following the different restrictions.
The central decision unit is the center piece of the household nanogrid model, it has the purpose of controlling the behavior of all household components, as well as obtaining information from, and communicate data to, the smart meter and the different household components. To fulfill these tasks, the central decision unit utilizes an algorithm to determine the different variables.
The first part of the algorithm is shown in Figure 3. The algorithm will assign the energy sources associated with least cost for the household nanogrid to be utilized to meet the household nanogrid’s energy demand first. If there is a surplus of free photovoltaic generated energy , then the battery will be charged accordingly. The algorithm determines how much photovoltaic generated energy will be sold back to the distribution grid, to what extent the battery is charged , and how much energy needs to be bought from the distribution grid in each time period.
Figure 4 shows the algorithms step of making sure the battery is charged when possible independently of ensuring the coverage of household nanogrid energy demand. Apart from charging the battery when there is a surplus of free photovoltaic generated energy , it is also charged when grid energy’s price is lower than the set price limit for battery charging .
Apart from the central decision unit, there are other household nanogrid components, which will be described in the following paragraphs.
The photovoltaic energy generation was modeled by utilizing the empirically obtained energy generation data from a photovoltaic systems producer. The curve concerning photovoltaic energy generation , as shown in Figure 5, was utilizing the data obtained by 200 kW solar panels on a particularly sunny summer day in Sheffield, UK, in an experiment by the company Powerstar [18].
The battery has different attributes, with which it is possible to control the utilization of the battery, mainly the charging and discharging processes. To have full control of the battery, setting the maximum storage capacity of the battery , setting the currently stored amount of energy , as well as setting the maximum charging rate , is essential. Also, the battery can be set to a busy state, so it cannot be employed for other actions, while it is being used.
The battery provides functions for all of the parameters to be set and read. The currently stored energy in the battery is a crucial measure to control important decisions that the central decision unit has to make.
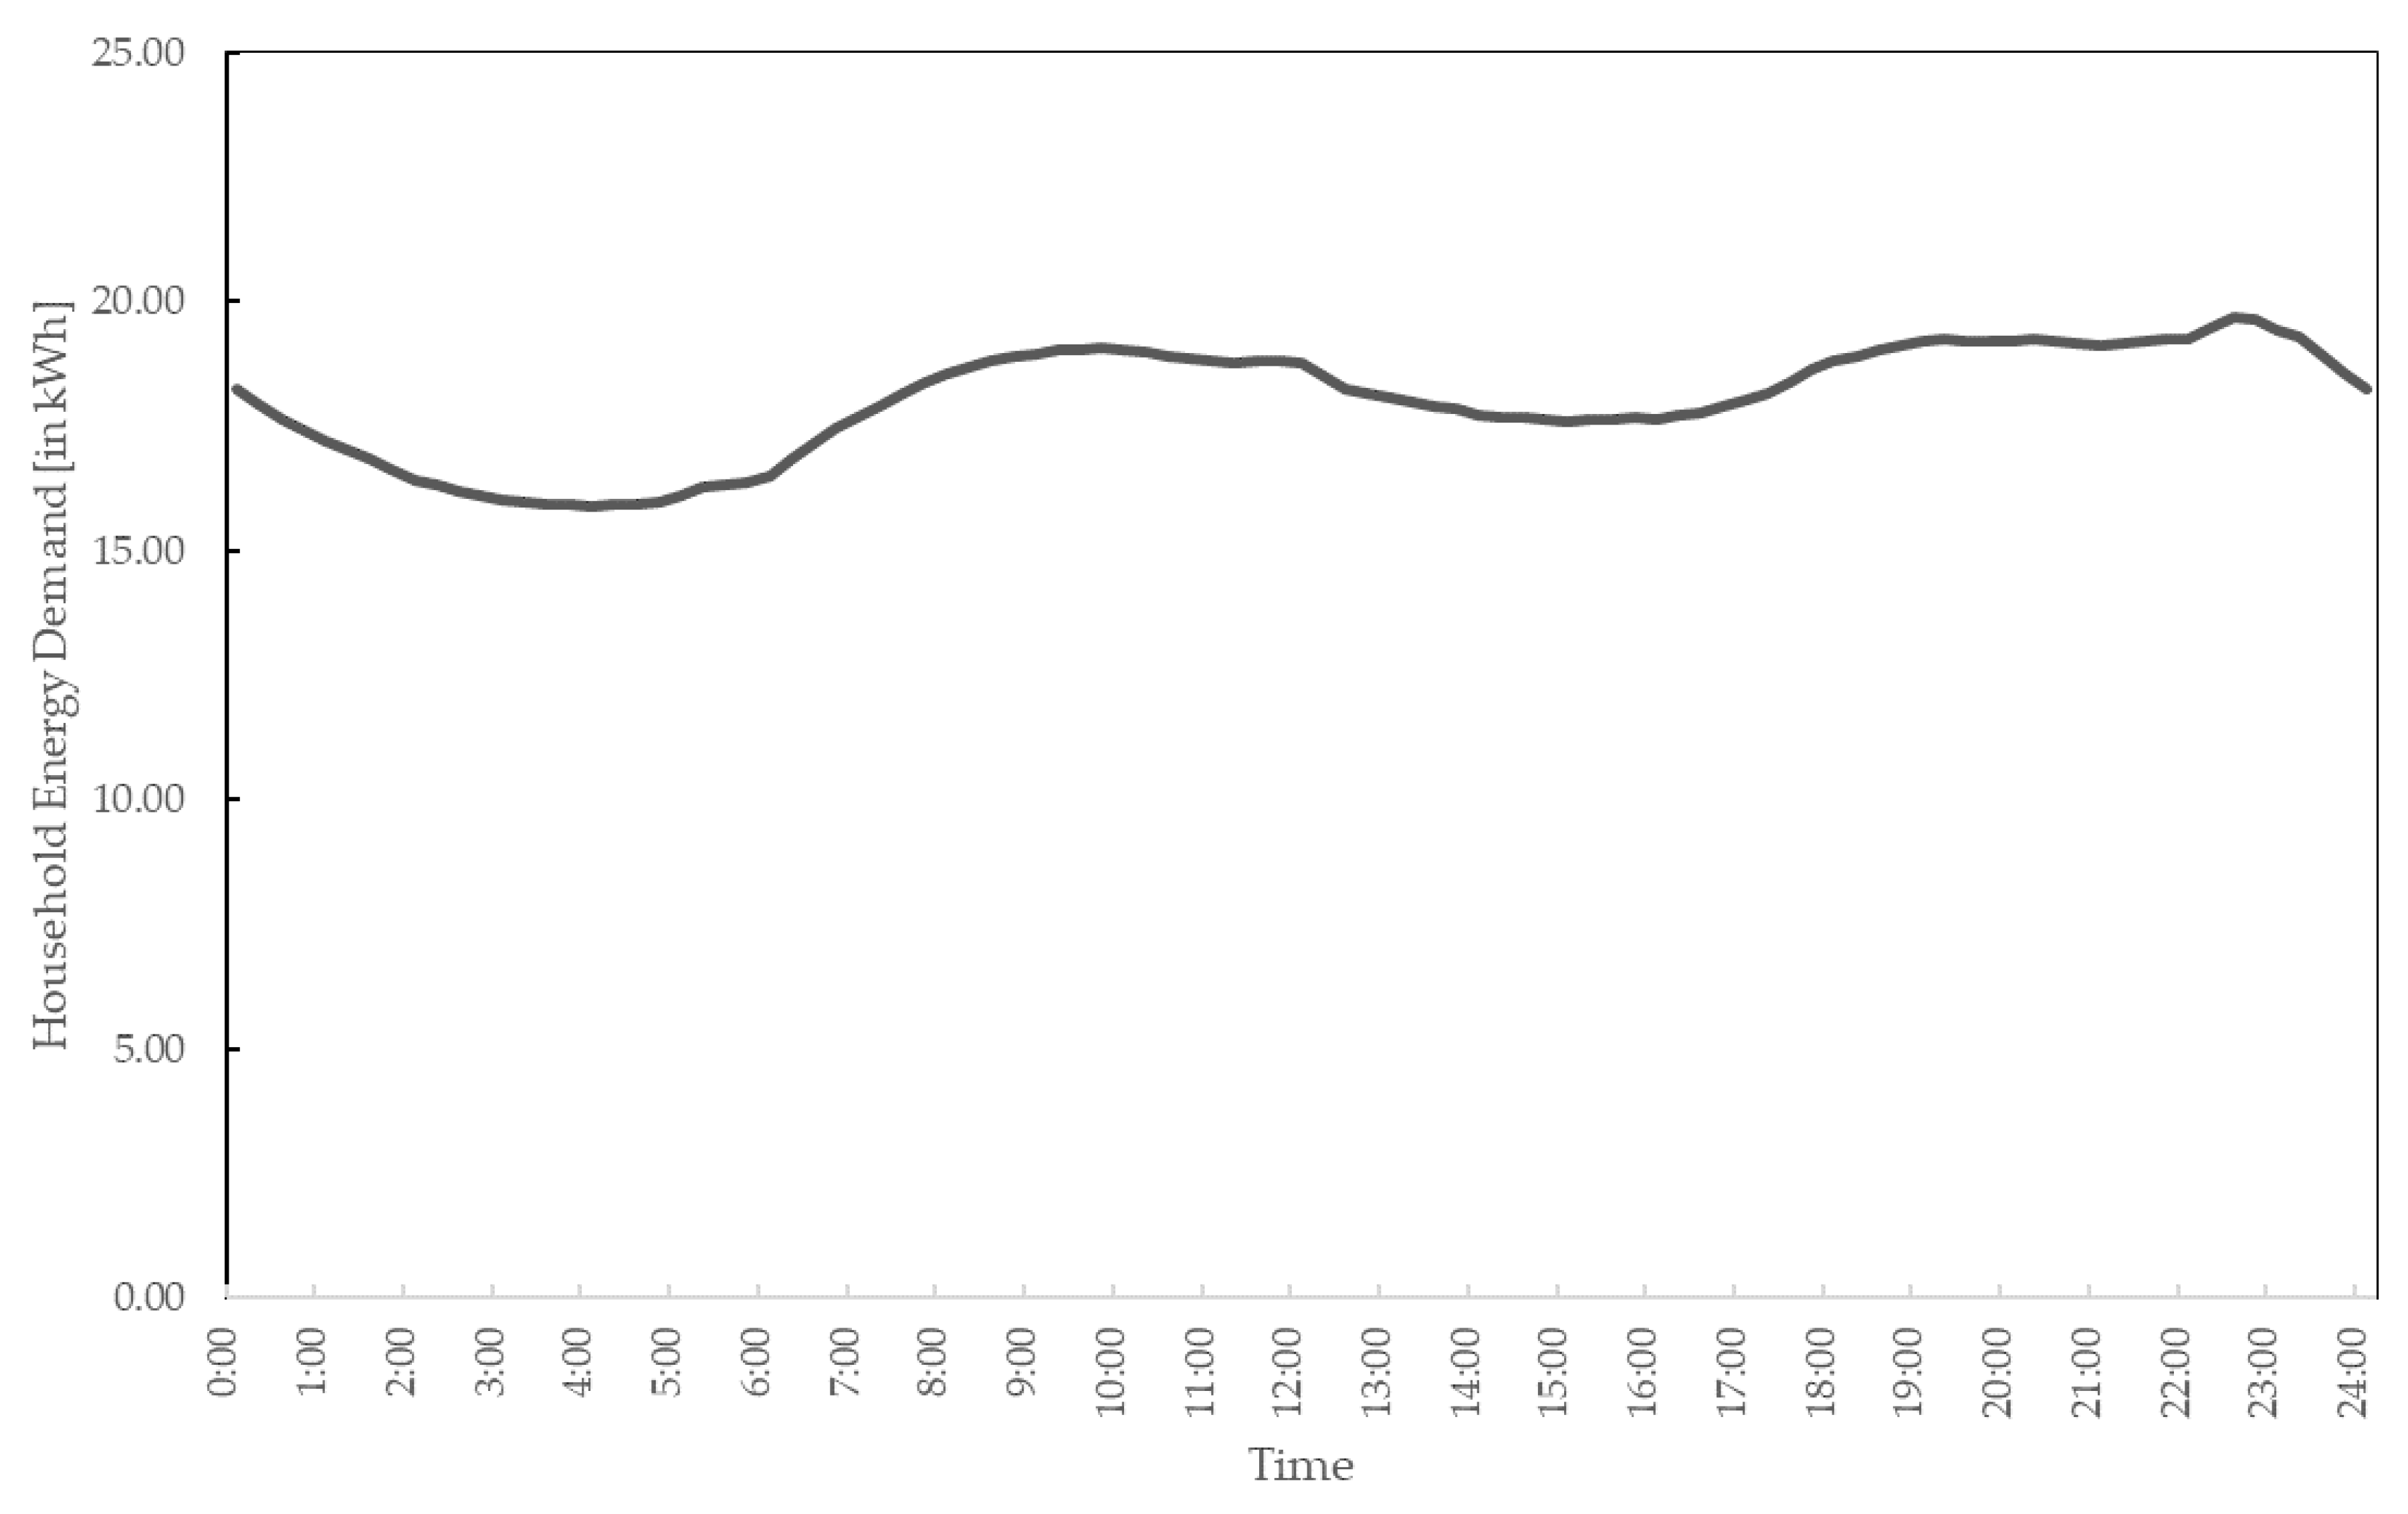
The curve for the energy demand, as shown in Figure 6, was taken from the data provided by the ELIA grid for Belgian consumers [19]. The household’s energy demand is provided to the central decision unit as a set of data, including a function in the object of energy demand , which allows the central decision unit to receive the value of household energy demand for one specific time period.
The smart meter is designed as the connection between the grid and the household. It has two main functions, namely, the transmission of different data between grid and the household, and secondly, to provide the grid with the possibility of cutting off the energy supply to the household. Also, it is the task of the smart meter to transmit the grid energy price from the grid to the household. While the grid energy demand and the amount of photovoltaic energy to be sold back to the grid have to be transmitted from the household to the grid.
In our model, the only information from the grid that is essential for the household nanogrid simulation is the grid energy price, as well as the information, whether grid energy is provided. Therefore, the distribution grid energy price is transmitted by the SM to the household nanogrid along with the information, whether the distribution grid will supply the household nanogrid with energy.
2.2. Cyber-Attacks
Cyber-attacks were injected into the household nanogrid model in order to simulate and evaluate the impact of different attacks. The first category of cyber-attacks that were injected is availability attacks. Availability attacks aim at compromising, or even blocking, the network’s communication [9]. In order to simulate availability attacks on the household nanogrid model, an individual approach for each kind of availability attack was defined in a way, in which it could be applied to the household nanogrid model. The different simulation approaches for availability attacks are shown in Table 3, and are described in the following paragraphs.
Different types of DoS/DDoS attacks, which have different effects on a network, exist [3,5]. Since DoS/DDoS attacks seek to compromise the network’s availability by attacking the network with requests, three different scenarios are simulated. The first scenario simulates a DoS attack, and therefore shows no measurable delay ∆t = 0 because a single DoS attack, as found during literature survey, does not delay the system. To simulate the impact of DDoS attacks, small ∆t > 0 and big ∆t >> 0 time delays were modelled.
The second type of availability attacks, RF jamming is an availability attack, which is characterized by interruption of the network’s communication by interference utilizing radio signals for an undefined period of time [8]. Therefore, the simulation of RF jamming aims at the interruption of data transmission for different lengths of time. First, no grid energy price data will be provided to the central decision unit for one time period . Second, no grid energy price data will be provided for multiple periods .
Thirdly, replay attacks can either aim at delaying or repeating data transmission within the network [3]. For this reason, two simulations are conducted to assess replay attacks. One simulation aims at delaying grid price energy data transmission . While the other simulation aims at repeating it .
The second category of cyber-attacks are integrity attacks. Because Integrity describes the network’s protection against unauthorized changes to communication [9], integrity attacks aim at interfering with the network’s communication by different access points. Since different types of integrity attacks only vary in the means that are used to alter data transmitted via the network, but the modification of data is likely to be the same, one simulation approach is sufficient to assess the effects of all integrity attacks.
But, in the simulation model, there are different types of data transmitted. Therefore, the effects of integrity attacks can be analyzed depending on the data type that is targeted by the attack. Simulations were defined for altered grid energy price, household energy demand, and photovoltaic energy that is being sold back to the grid, as is shown in Table 4. For the definition of the attack simulation a consumer was assumed as the attacker. Therefore, all of the alterations made by cyber-attacks benefit a consumer. A first simulation approach concerns the grid energy price data, that is set to half . Second, the grid energy demand transmitted to the distribution grid is set to half . Third, the data of photovoltaic energy sold back to the grid is set to the amount of photovoltaic generated energy .
The third category of cyber-attacks compromises the confidentiality of a network. This implies that confidentiality attacks aim at obtaining unauthorized access to sensitive information [9]. Unauthorized access can enable the attacker to alter some data transmitted via the network. Alteration of data depends on the identity and objective of the attacker. Assuming that a consumer as the attacker three different options to gain benefits by altering data exist. First, the consumer could decrease the grid energy price transmitted to the SM . In order to obtain more information about the effects of grid energy price manipulation, a grid price of was investigated. Second, the amount of photovoltaic generated energy sold back to the grid could be increased . Third, the household’s energy demand could be decreased . These different mathematical modelling approaches are shown in Table 5.
Apart from unauthorized access, there are other confidentiality attacks, which are traffic analysis, man-in-the-middle (MITM) attacks, and masquerading attacks. However, they solely aim at obtaining data from the grid, not altering it. Therefore, these attacks do not have an impact on the results of the simulation model.
The fourth category of cyber-attacks are authenticity attacks. Authenticity defines the network’s ability to verify the genuineness of messages [9]. Even though authenticity is defined differently to integrity, the cyber-attacks in both categories are the same. Simulating the cyber-attacks for the authenticity category would not add additional value to the study.
3. Simulation
The following paragraphs describe the simulation model that was utilized in order to obtain realistic results for the injection of cyber-attacks.
The algorithm that was defined in order to solve the linear program was implemented as a simulation model in Java. Different objects were defined to represent the different household nanogrid components, as well as the SM and the distribution grid. The central decision unit has the authorization to receive and send different data to the different objects.
To enable the analysis of the simulation, the data for every parameter that was present in the simulation was saved for every time period. The input data needed to run the simulation concerned photovoltaic energy generation, battery parameters, reference household nanogrid energy consumption, and distribution grid energy price. The sources for these different sets of data are described in the following paragraphs.
To model photovoltaic energy generation, the empirically obtained data by 200 kW solar panels on a particularly sunny summer day in Sheffield, UK was utilized [18]. The data was scaled to a realistic generation for the size of a household roof. For scaling the data, the usual size and power outtake of recent solar cells was scaled up to cover the area of 100 m² of a household rooftop. The size of a solar cell was found to be 15.6 × 15.6 cm² for solar PERC solar cells. Also, it was found that a module of 120 halved cells results in a power output of 285 W [20]. The scaling process indicated that one halved solar cells covers an area of 0.012168 m², which results in 120 halved cells, covering an area of 1.46016 m². On a rooftop of 100 m² size, an estimated 68 modules can be fitted. Therefore, the solar energy generation should have a peak generation of roughly 19.38 kW. This equals a peak photovoltaic energy generation of 19.38 kWh. Also, the rate at which the distribution grid buys photovoltaic energy was set to 1.38 ct/kWh [Euro Cent] [21].
The battery’s maximum storage capacity, as well as the maximum charging rate are set to 54 kWh and 0.9 kW, respectively. According to the most powerful car battery on the market at this point, because the equivalent battery for energy storage within a household nanogrid could not be found [22].
The energy consumption data obtained from the ELIA grid was averaged for the summer months of May 2016 until August 2016, as the data used for the photovoltaic energy generation was also generated on a summer day, even though the exact date was not provided [18,19]. Then, the curve was scaled to show the energy demand of an average one-person household. Therefore, the four categories of household appliances by Zhang et al. [17] were employed. For each category, the different items that a one-person household would possess were defined. In a next step, the maximum energy consumption for each item was evaluated [23,24]. After having determined the maximum household nanogrid’s energy consumption, the curve obtained from the ELIA [19] grid could be scaled to match the energy consumption of a one-person household nanogrid.
To conduct the simulation as detailed as possible, the smallest possible time interval for one simulation was chosen. Each simulation run, therefore, represents a time interval of 15 min, as the energy demand data provided by the ELIA [19] grid was only so precise.
The information of grid energy price was taken from the physical electricity index (PHELIX) for the 8th of April 2017 [25].
4. Results and Analyses
In order to analyze the impact of different cyber-attacks, various parameters have to be taken into consideration to ensure a comprehensive analysis. The parameters for the analysis were chosen according to the data output, which the simulation model provides, which are monetary criteria as well as a comparison of different energy values transmitted in the simulation model. Furthermore, the number of black outs, stops of SM communication, as well as the duration of the simulation serve as indicators of cyber-attack effects.
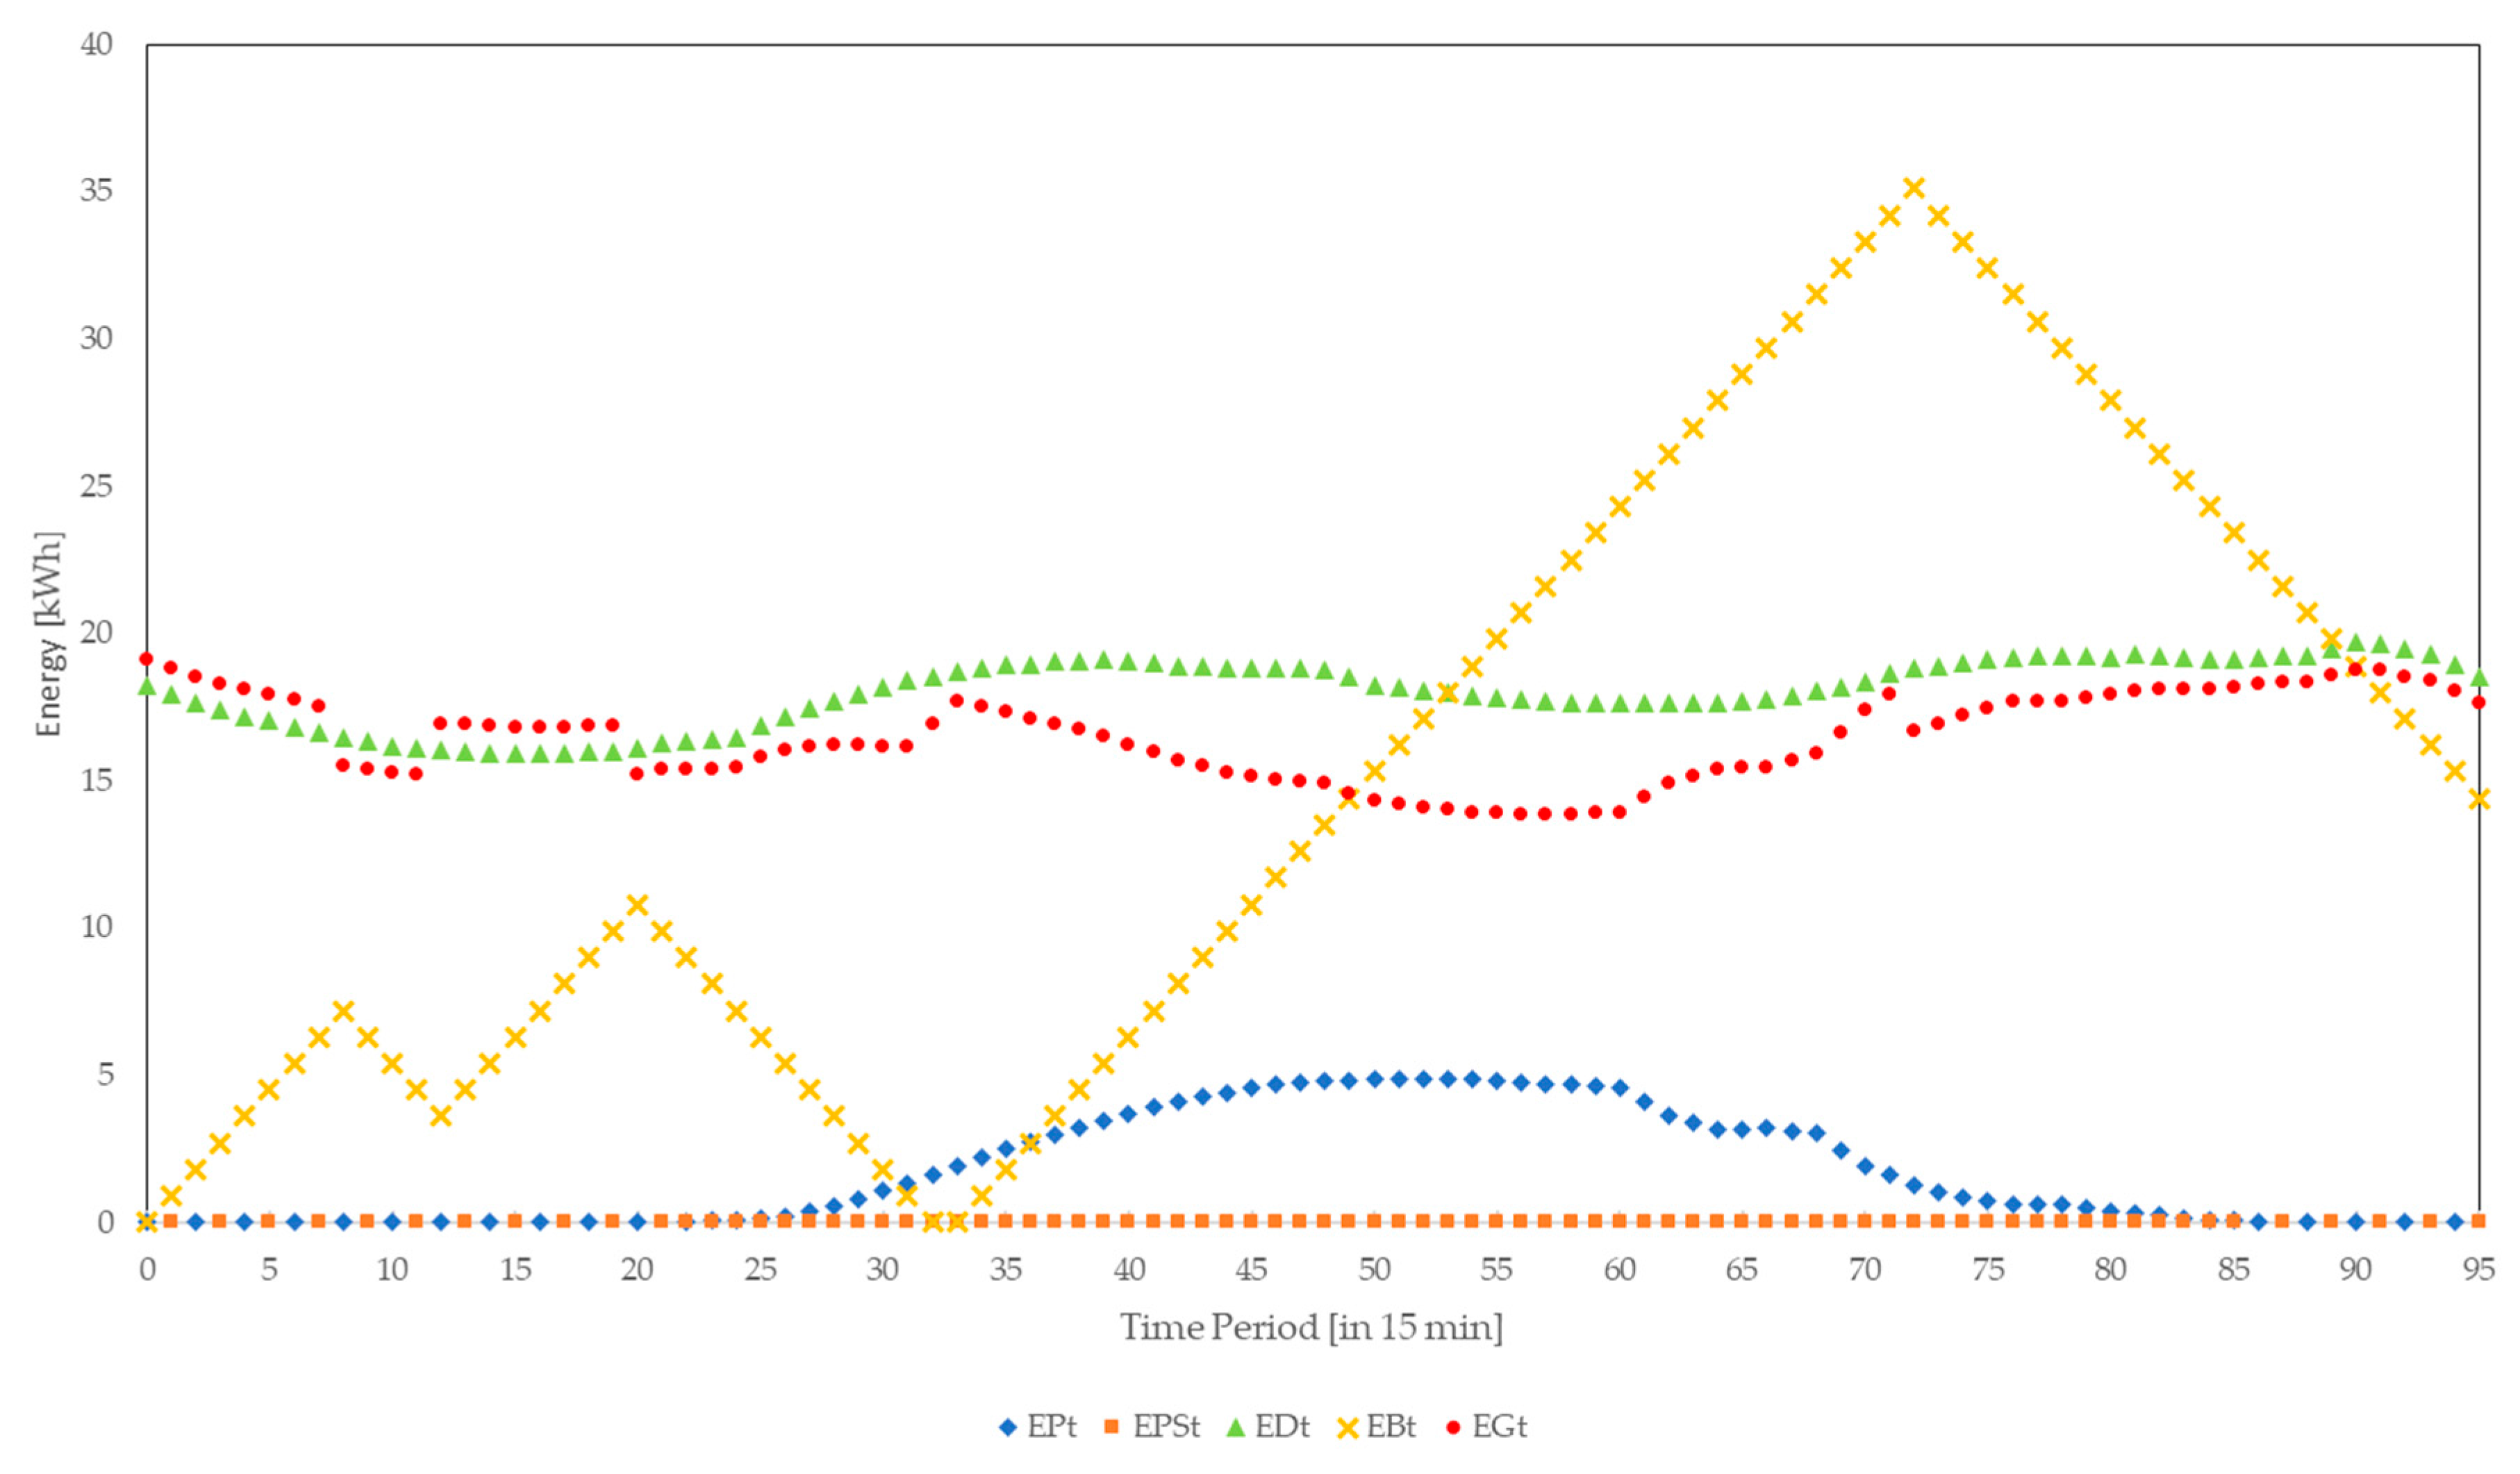
The parameters were also assessed for a normal simulation run, as shown in Figure 7, without any cyber-attacks injected. In this case, the overall energy cost for the household nanogrid for 24 h are 5456.46 ct. Of course, since no cyber-attack is injected, the loss for either household nanogrid or distribution grid equals 0 ct. The duration of the simulation was measured to be 4 ms. Figure 7 shows the plot of all different energy values, that the central decision unit uses to make its decisions on which energy sources are used to meet household energy demand. Furthermore, Figure 7 shows energy values, which the central decision unit impacts by its decision making, such as the photovoltaic energy sold back to the distribution grid or the energy stored in the battery.
4.1. Availability Attacks
4.1.1. DoS/DDoS Attacks
For the simulation of the DoS attack only one false request for the grid energy price was injected. The results of the simulation show that this does not have any influence on the simulation other than the SM answering the false request. It does not lead to a communication stop of the SM or a delay of the simulation.
For the second attack, 10,000 false requests were injected for one time period. This would lead to a stop in the communication of the SM for this period, as according to Sgouras et al. [4], even a much smaller amount of false requests leads to a rapid drop in the probability of SMs receiving meaningful communication [4], as documented in Table 6.
The second simulation of a DDoS attack injected 10,000 false requests for four time periods. According to Sgouras et al. [4], this would lead to a stop of SM communication for the duration of the cyber-attack [4]. In this case, the communication of the SM would stop for a duration of four time periods, as can be seen in Table 6.
4.1.2. Radio Frequency Jamming
The RF jamming that was simulated for one period in period 21 leads to the battery being charged for one additional period, which is charged at the price rate of the last time period, when a grid energy price was transmitted. The total cost of the 24-h simulation to the household equal 5453.77 ct. Therefore, the distribution grid loses profit of about 2.69 ct, refer to Table 6. By itself, this is not a great loss, but it already indicates that this attack bears the potential of greater losses for the distribution grid: if it is conducted for a longer time period or on a larger scale, including more households. Also, RF jamming even for one period, leads to the stop of SM communication for one period.
In the second simulation of RF jamming, the RF jamming was simulated for four time periods, ranging from period 19 to period 22. This leads to an even longer period of battery charging. The cost for the household nanogrid in this simulation equals 5451.07 ct for the 24 h of the simulation, which can be compared in Table 6. Therefore, the profit loss of the distribution grid increases to 5.39 ct. This shows, that the conclusion, that a longer period of RF jamming increases the profit loss of the distribution grid.
4.1.3. Replay Attacks
The first kind of replay attack, the delay of data transmission within the network, does not show any effect of the delaying replay attack in the transmitted energy values. But, the effect can be seen in the change of energy cost for the household nanogrid, which decreases to 5382.72 ct. This also implies a profit loss for the grid of 73.74 ct. The profit loss in this case is higher than for the RF jamming attacks, because the replay attack was simulated at the beginning of the simulation, to resemble the delay of data transmission. For this reason, there is no grid energy price of a previous period.
The second kind of replay attack is the replay of grid energy price data for two more periods. This attack does show effects on the energy values in the decision process of the household nanogrid. This replay attack decreases the first charging and discharging cycle of the battery, while increasing the second charging and discharging cycle of the battery. This is also expressed by the monetary values assessed for the simulation. In this simulation, the household nanogrid would be charged a total of 5449.88 ct. This equals a profit loss for the grid of 6.58 ct. If the attacker chose another replay pattern, it is thinkable that the profit loss for the distribution grid would be considerably higher.
In summary, the DoS attack does not lead to any measurable impact, while the various kinds of DDoS attacks have a delaying effect on SM communication. In contrast, RF jamming leads to a stop of SM communication, which leads to a monetary loss for the distribution grid that increases with an increasing duration of RF jamming. The effects of replay attacks depend on the kind of replay attack, which can be compared in Table 6. While a delaying replay attack causes a stop of SM communication, a repeating replay attack does not cause the SM communication to stop. Also, the monetary loss caused by a delaying replay attack is higher than the monetary loss that is caused by a repeating replay attack.
4.2. Integrity Attacks
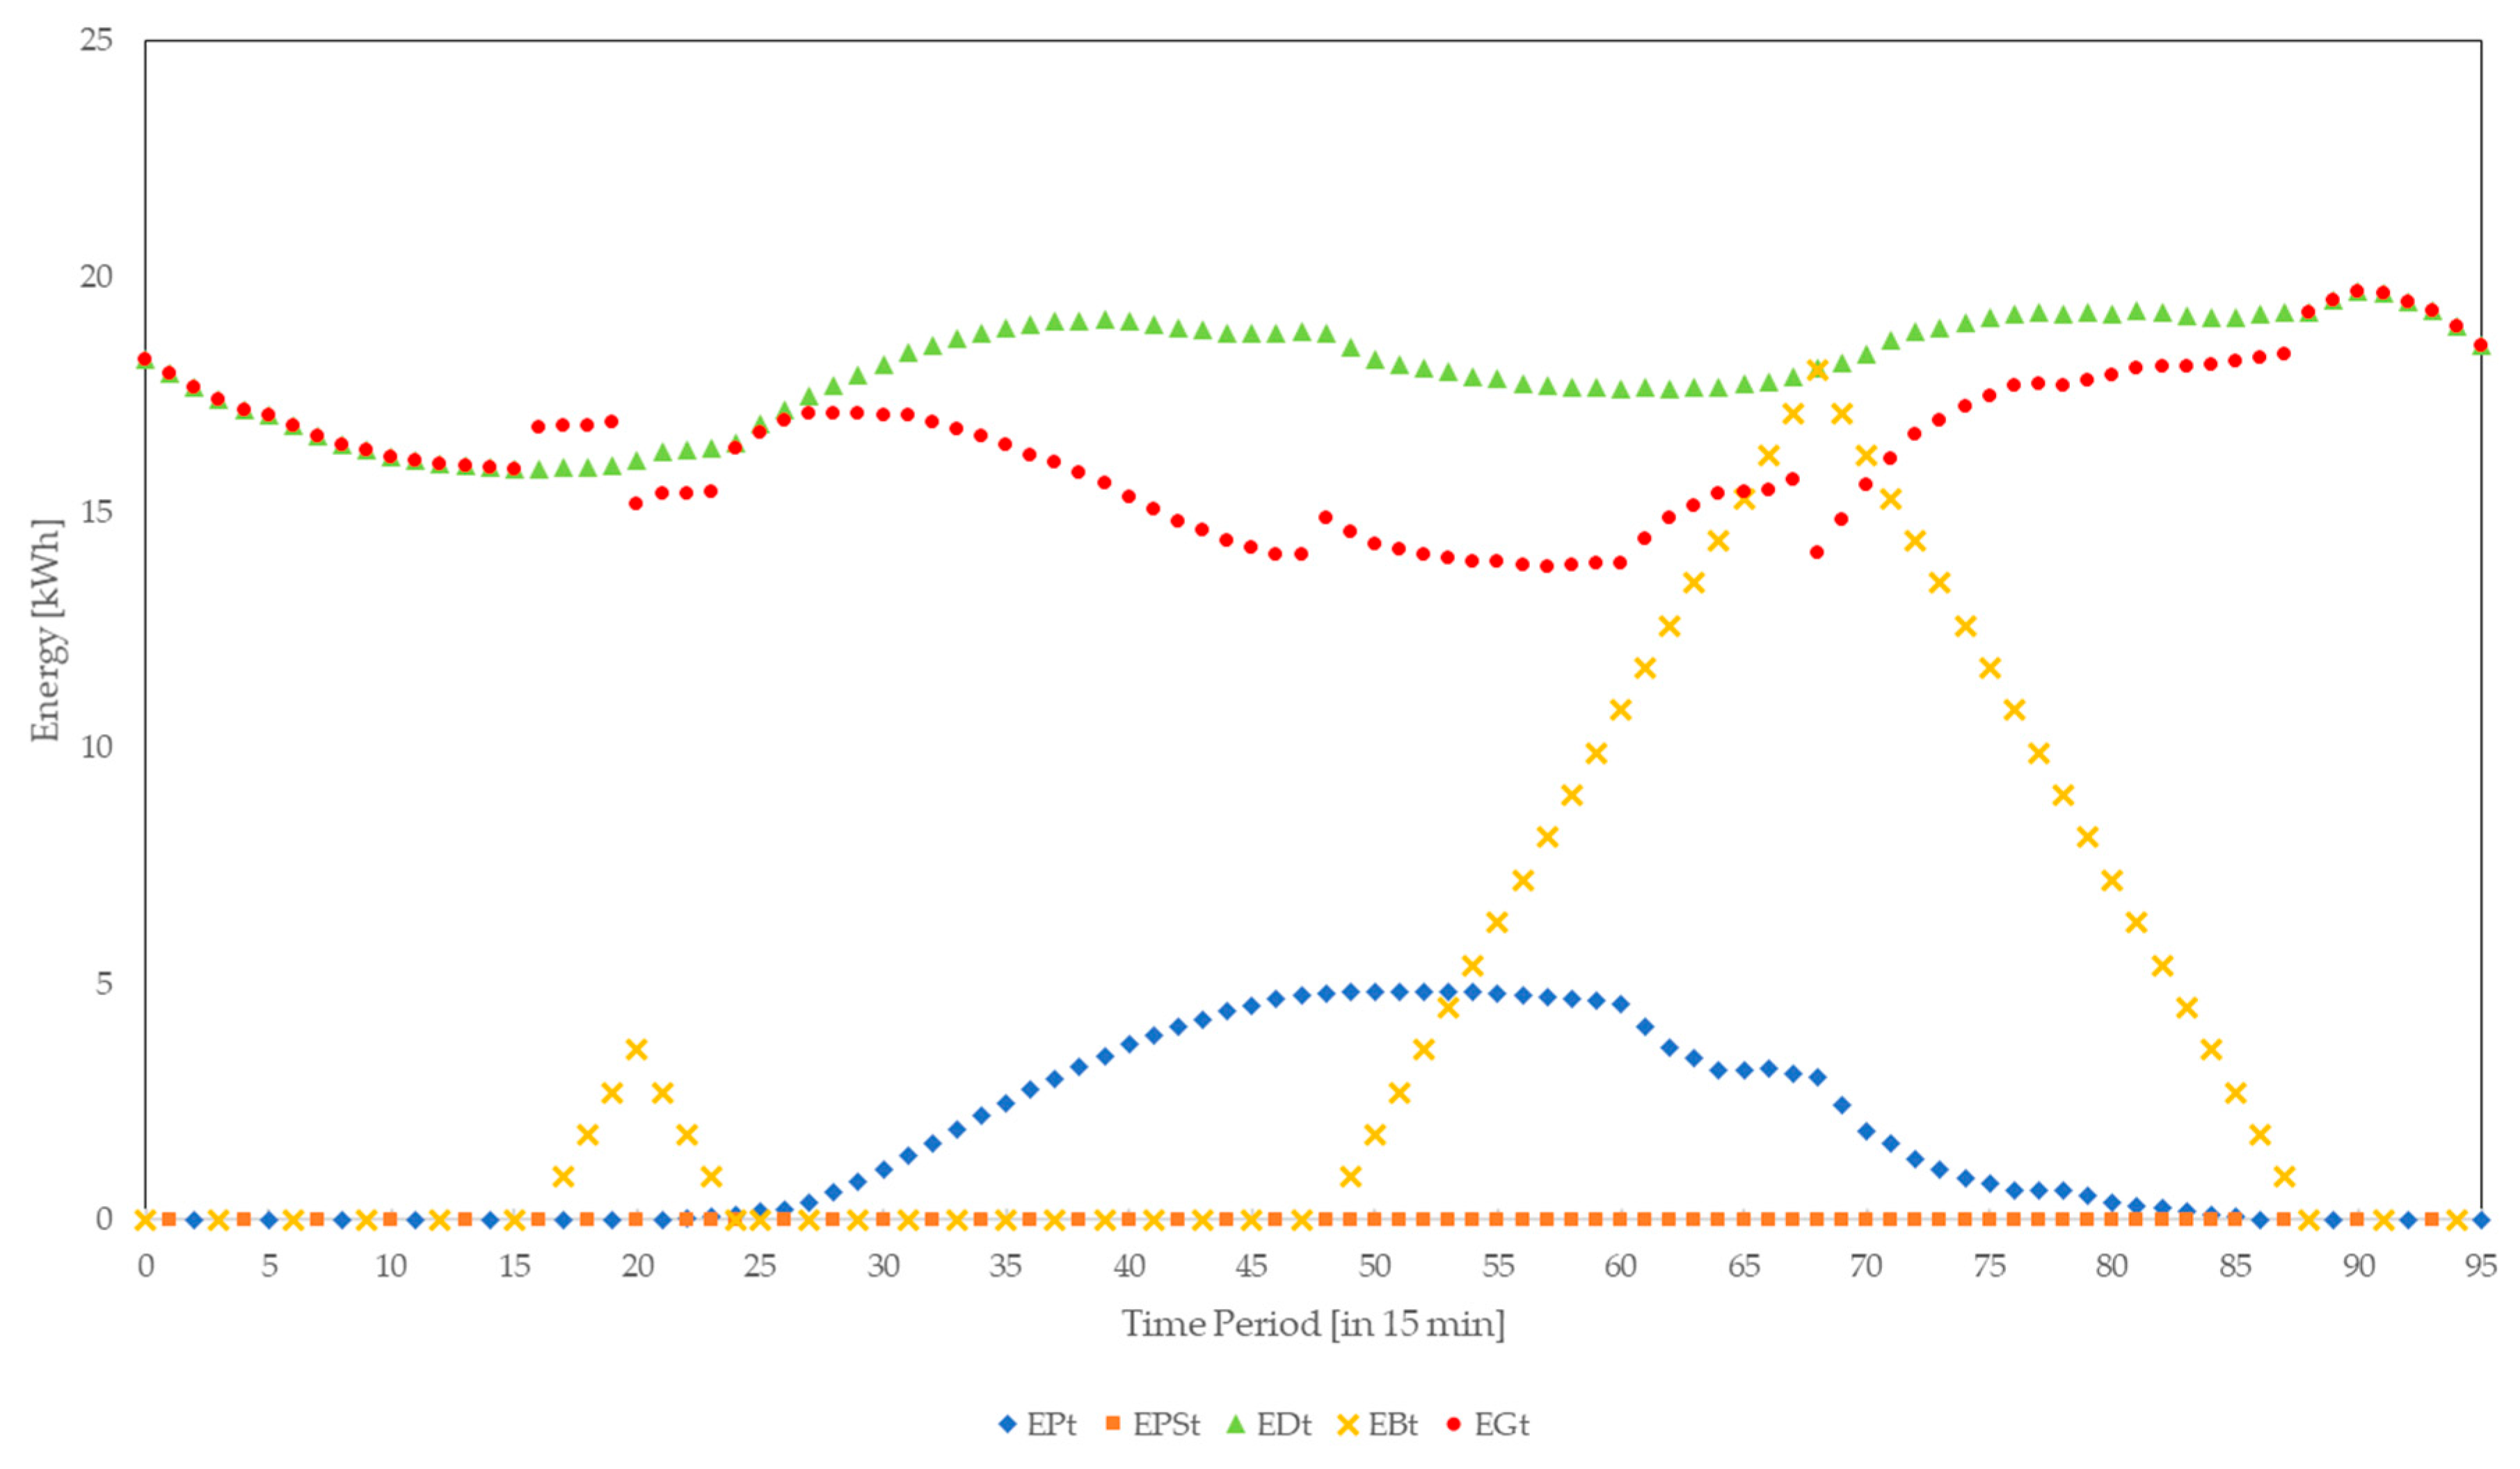
In order to simulate an integrity attack, different scenarios were considered. First, the reduction of the energy price by half for every period is simulated. Such an attack shows great impact on the charging of the battery as well as the grid energy demand, which can clearly be seen in Figure 8. This is also expressed in the total cost occurring for the household nanogrid, which are 2748.03 ct for the 24-h period. But, this is 20.2 ct more than just cutting the overall energy cost for the household of a normal simulation run without any cyber-attack in half. This can be explained by the amount of energy still saved in the battery at the end of the last simulation period. Nevertheless, the integrity attack of cutting the grid energy price to half the original price leads to a significant loss of profit for the grid of 2708.43 ct.
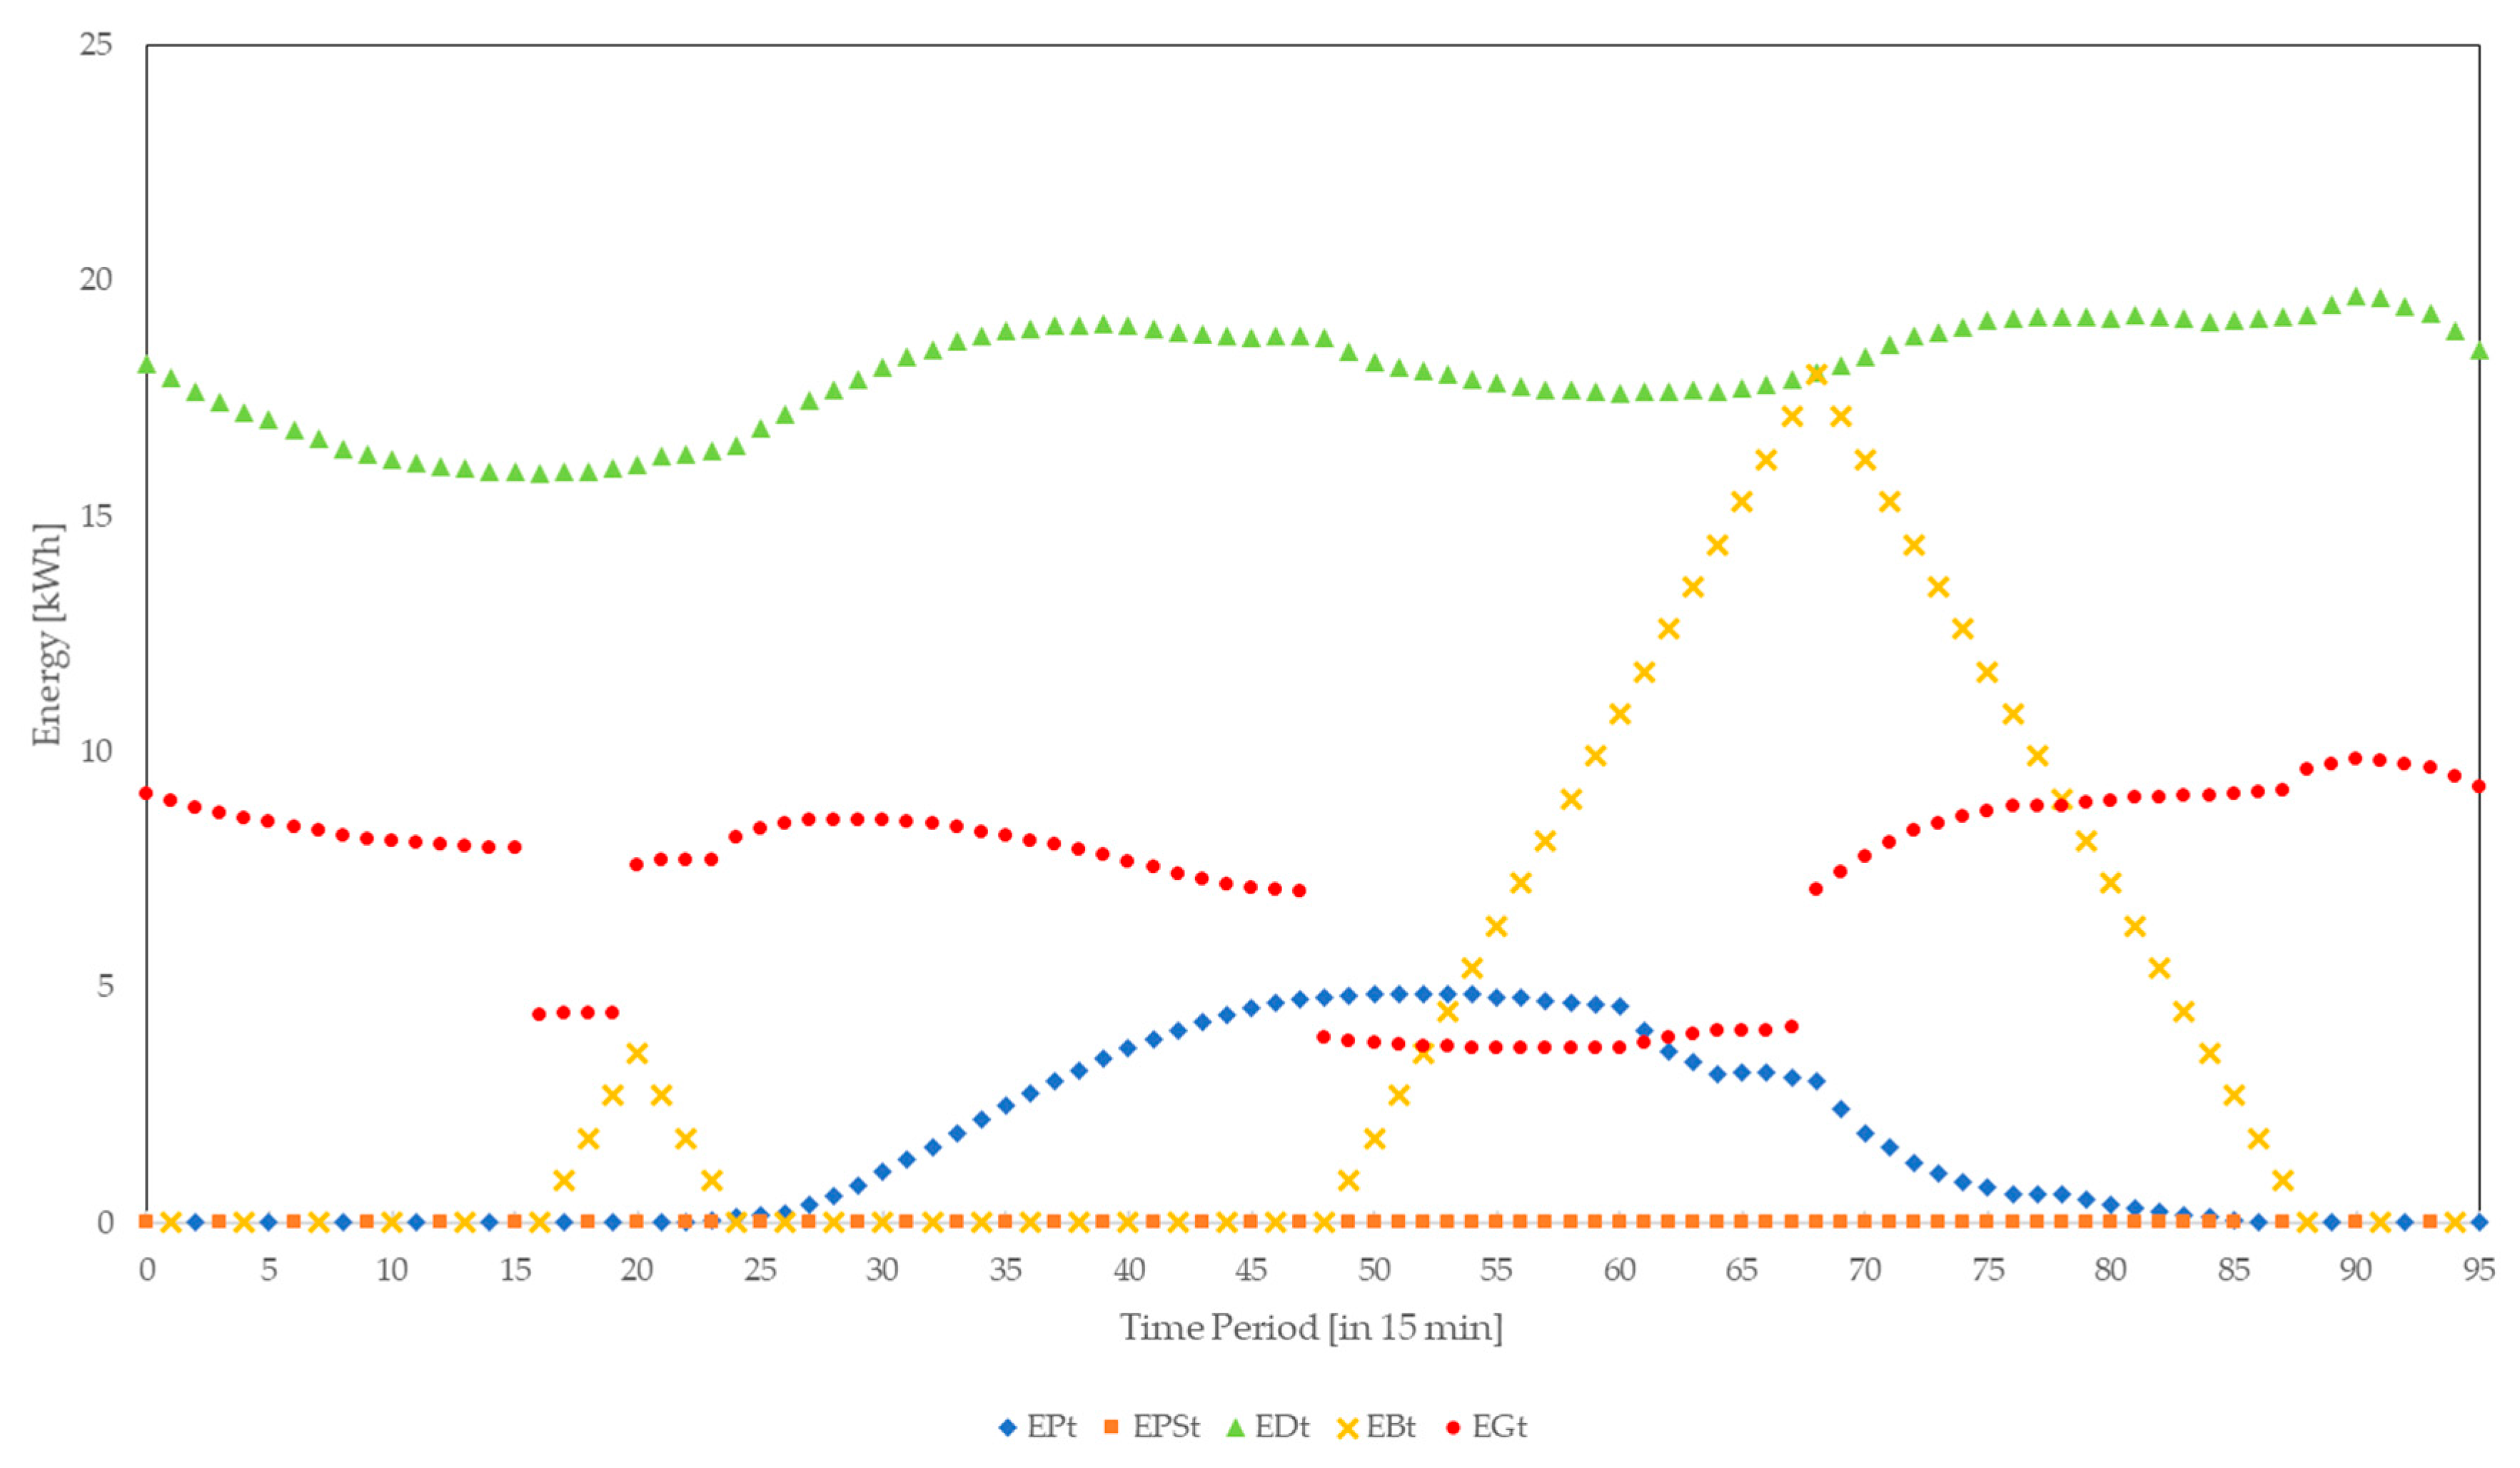
The second kind of integrity attack is cutting the grid energy demand that is reported to the smart meter to half. The transmitted energy values in Figure 9 clearly show that some data was manipulated, if the original data is known. But, the manipulation of data by the cyber-attack is not obvious to an unsuspecting spectator, as a low grid energy demand does not necessarily indicate manipulation. The cost that is charged the household nanogrid in this simulation is 2759.59 ct. This equals a profit loss for the grid of 2696.87 ct, which is a substantial financial loss for the grid.
The third kind of integrity attacks utilizes a change concerning the photovoltaic energy. In detail, the photovoltaic generated energy that is sold to the grid is set to the amount of photovoltaic generated energy in each period by the cyber-attack, see Figure 10. Again, taking the energy values that the household nanogrid utilizes into consideration, the manipulation of the photovoltaic generated energy sold back to the grid is obvious. The cost occurring for the household nanogrid in this situation would be 3613.38 ct. This equals a loss for the distribution grid of 1843.08 ct.
After having made the conclusion, that the manipulation of data is obvious from the energy values in the household nanogrid, it is also important whether the manipulation is detectable for the distribution grid via merely utilizing the data transmitted by the SM. In this case, the fact that the household nanogrid still demands energy from the distribution grid while selling back photovoltaic generated energy to the distribution grid, should raise suspicions.
All kinds of integrity attacks cause the total cost for the household nanogrid to drop when compared to the results of the household nanogrid simulation without the injection of cyber-attacks as can be seen in Table 7. This is due to the false injection in favor of the household nanogrid. The financial loss that is caused by a false injection of half the original grid energy price causes a bigger monetary loss than cutting the energy demand reported to the distribution grid to half. The smallest monetary loss concerning integrity attacks was caused by the manipulation of photovoltaic energy sold to the distribution grid. Furthermore, the manipulation of both grid energy price, as well as grid energy demand, is not obvious to the energy provider, while the data that is transmitted by the SM should raise suspicions in case of a false injection of photovoltaic generated energy sold to the distribution grid.
4.3. Confidentiality Attacks
Different kinds of confidentiality attacks are unauthorized access, traffic analysis, MITM attacks, and masquerading attacks. Except for unauthorized access the other cyber-attacks do not have any impact that would lead to measurable results in this simulation model. Therefore, only different kinds of unauthorized access cyber-attacks are simulated.
First, an unauthorized access, which results in the grid energy price being decreased to half the original grid energy price, is simulated. The impact of this attack on the energy values used by the household nanogrid can be seen in the figure below. The attack leads to a change in the charging periods of the battery. Also, the total household nanogrid’s energy costs are altered by this attack. The attack leads to total household nanogrid energy cost of 2748.03 ct. Again, some energy is still saved in the battery at the end of the simulation. This attack still causes a loss of 2708.43 ct to the distribution grid.
But, the fact that reducing the grid energy price to half does not cause the total costs to be cut to half indicates that lowering the price further might not be beneficial to the attacker in every case.
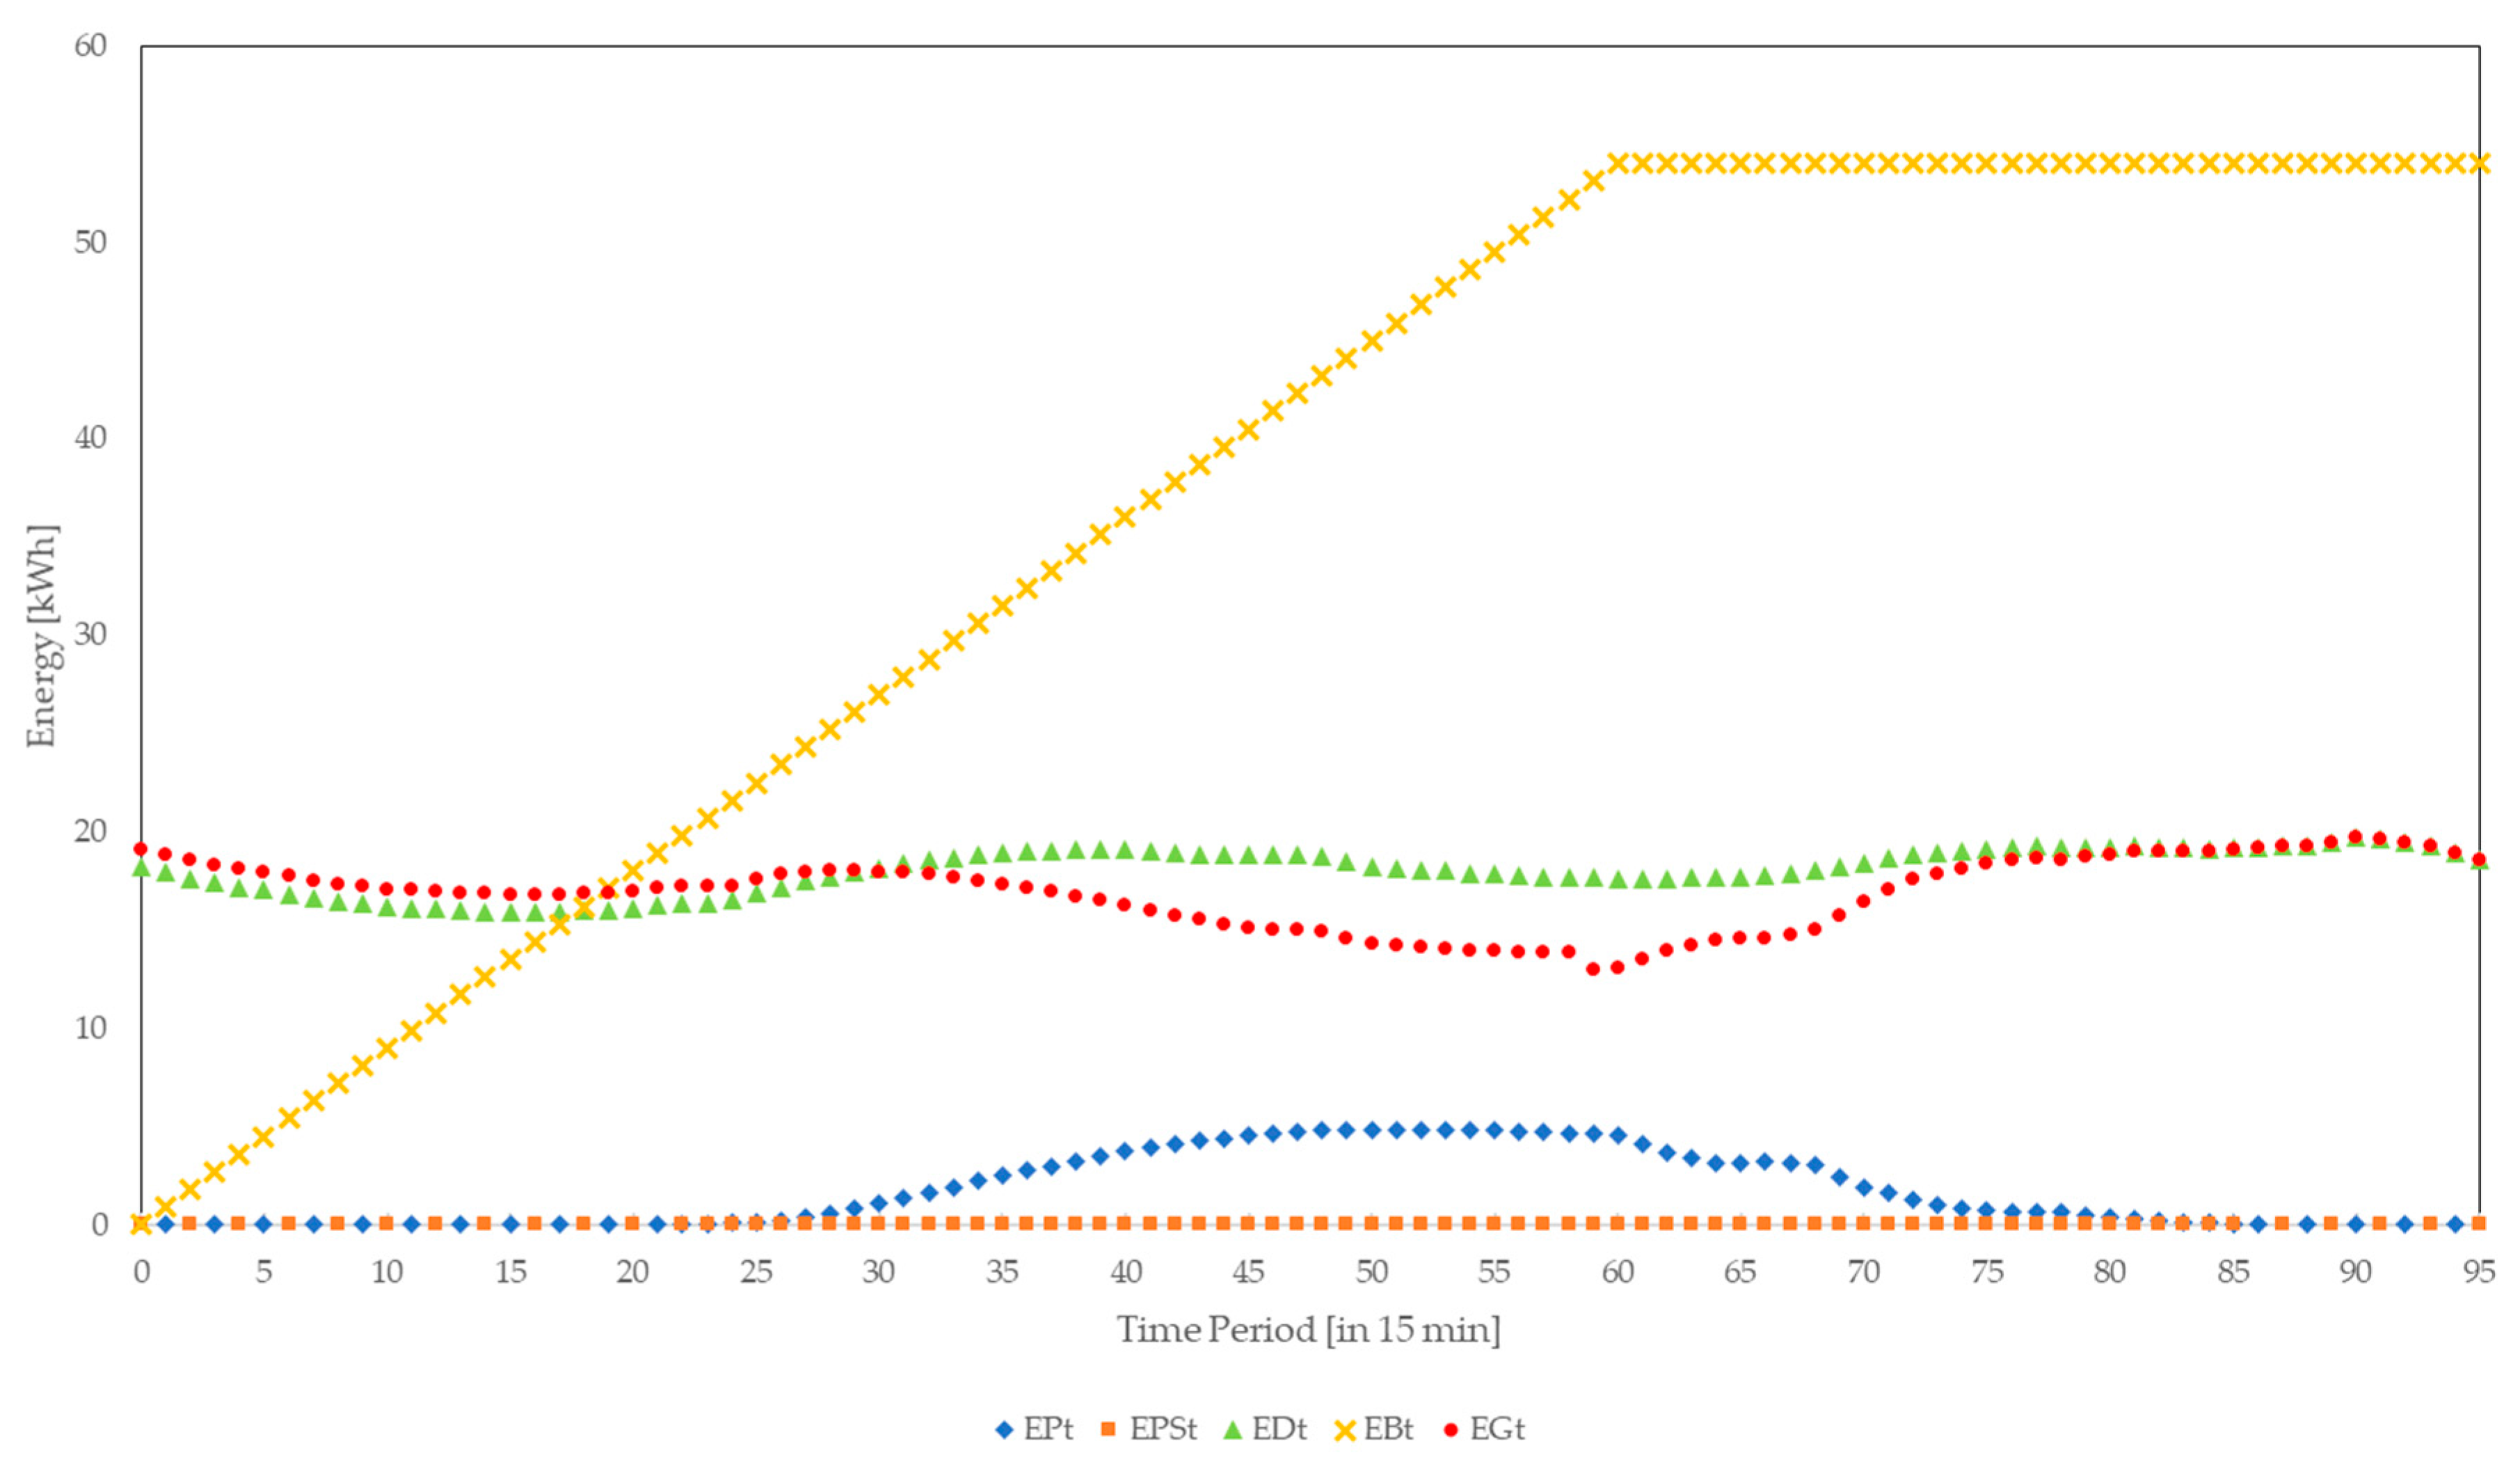
To test the hypothesis, that lowering the grid energy price as far as possible is not always beneficial to the attacker, a simulation run is conducted, setting the grid energy price to zero.
The results of this simulation are shown in Figure 11. It can be seen that the battery is charged until full capacity. Afterwards, the battery is not in use anymore, since the price of the battery energy is not lower than the price of grid energy. This shows that an attacker could cut off the battery from use by employing the according strategy.
The second kind of unauthorized access attack aims at setting the amount of photovoltaic generated energy sold to the grid to be the amount of the photovoltaic generated energy. The fact that the household nanogrid reports a demand for grid energy, while it reports to sell photovoltaic generated energy back to the distribution grid, should raise suspicions of the operator.
In the third kind of unauthorized access simulation, the amount of grid energy demand is cut to half of the original amount. The manipulation is obvious by taking the energy values that are used by the household nanogrid into consideration.
But, if only the values transmitted to the SM are taken into consideration, the manipulation is not easy to discover. The cost that is charged the household nanogrid in this simulation is 2759.59 ct. This equals a profit loss for the distribution grid of 2696.87 ct, which is a substantial monetary loss for the distribution grid.
The comparison of the effects of confidentiality effects in Table 8 shows that the attacks aiming at the grid energy price cause the biggest monetary loss to the distribution grid. But, the simulation also showed that cutting the grid energy price too low leads to the battery not being utilized by the central decision unit anymore. Again, the attack on grid energy demand causes a monetary loss for the distribution grid that is not much lower than the loss caused by an attack on the grid energy price. The injection of false data concerning photovoltaic generated energy being sold to the distribution grid leads to the lowest monetary loss for the distribution grid when compared to the other confidentiality attacks. Also, the false injection of data concerning photovoltaic generated energy sold to the distribution grid should raise suspicions because of the data transmitted to the distribution grid by the SM.
5. Conclusions
In this study, we developed a household nanogrid model to investigate cyber-attack effects. A complete household with a SM connection to a distribution grid was modelled. To investigate different cyber-attacks’ effects on the household nanogrid simulation approaches for the different cyber-attacks were defined. It was found that the impact of cyber-attacks could be measured by utilizing different dimensions. These dimensions being monetary impacts of cyber-attacks, the interruption of SM communication and the delay caused in SM communication.
Both, integrity and confidentiality attacks only have an impact on the monetary factors of the billing performed by the SM. Confidentiality attacks might serve attackers as a basis to optimize their cyber-attacks, they can be used to blackmail the grid, and might be sold as they provide a considerably detailed image of consumption behavior of households, when injected to a higher number of households. Availability attacks can have monetary impacts, but their main target is not the monetary impact, but compromising or stopping the communication of the SM.
Table 9 shows a detailed comparison of the severity of the different classes of cyber-attacks in the different impact categories, which were identified.
The comparison shows that the availability attacks have more severe impacts than both integrity and confidentiality attacks. While all the classes of cyber-attacks have monetary impacts, availability attacks also cause either SM communication delays or stop of SM communication. Results show that, in this simulation, RF Jamming and Replay Attacks had the most severe effects. They not only lead to great monetary impact, but also to the stop of SM communication.
Furthermore, the analysis of possible attackers and their motives provides valuable implications for the simulation of cyber-attacks, as well as the protection of SM against cyber-attacks.
Different mitigation methods for these attacks can be suggested. First, prevention measures can be taken against cyber-attacks. The design of SMs should be changed to eradicate the weaknesses of SMs, which were presented in Section 1. Where possible heterogenous networks should be replaced with homogenous ones. Internet connection should only be integrated when crucial for the SMs functions. Authentication, encryption procedures, and integrity protocols for SMs should be improved.
Results of this study also indicate other methods to detect cyber-attacks based on the results of this simulation. In case of alteration of grid energy price, the attack cannot be detected within the household, due to a lack of information. However, the grid has the possibility to detect the alteration of the grid energy price, if the information of grid energy price used for billing by the SM is transmitted back to the grid. The detection of alteration of grid energy demand and photovoltaic energy that is sold back to the grid is possible for the household. But, taking into consideration that the alteration of grid energy demand and photovoltaic energy that is sold back to the grid is often beneficial for the household. The household has no incentive to report the fraud, even if the alteration of these data is not caused by an attack from the household itself. Therefore, detection of these attacks by the grid is important. The grid has the possibility to detect these attacks by comparing the billing information to the actual household energy demand.
In future studies, different means of communication could be included in the simulation model, enabling the differentiation between cyber-attacks in the categories of integrity and authenticity attacks. Also, an approach to assess the impact of confidentiality attacks should be defined. This might be done by a survey, assessing the impact of data theft from SMs.
Future research could also focus on altering the simulation model. First, the demand, photovoltaic generated energy, and the grid energy price data could be simulated with uncertainty to make the simulation more realistic. Second, a longer time period of multiple days, or even months, could be simulated in order to obtain insight into the long-term effects of some of the cyber-attacks. Third, multiple households and their smart meters could be connected to the grid, enabling research on the effects of their interdependencies.
Author Contributions
Denise Tellbach designed the simulation model and performed the analysis, Yan-Fu Li conceived this study, checked and corrected the simulation model, results as well as the manuscript. All authors have read and approved the final manuscript.
Conflicts of Interest
The authors declare no conflict of interest. The founding sponsors had no role in the design of the study; in the collection, analyses, or interpretation of data; in the writing of the manuscript, and in the decision to publish the results.
Symbols
| Photovoltaic generated energy in time period t in kWh | |
| Photovoltaic generated energy sold to grid in time period t in kWh | |
| Maximum capacity of battery in kWh | |
| Maximum charging rate of battery in kW | |
| Amount of energy to charge the battery in time period t in kWh | |
| Amount of energy to discharge the battery in time period t in kWh | |
| Grid energy demand in time period t in kWh | |
| Household energy demand in time period t in kWh | |
| Energy stored in battery at beginning of time period t in kWh | |
| EPt | Photovoltaic generated energy in time period t in kWh |
| EPSt | Photovoltaic generated energy sold to the grid in period t in kWh |
| EDt | Household energy demand in period t in kWh |
| EBt | Energy stored in battery in time period t in kWh |
| EGt | Grid energy demand in time period t in kWh |
| Rate at which grid buys photovoltaic generated energy | |
| Cost in EUR cent per kWh to satisfy demand in time period t | |
| Cost in EUR cent per kWh to charge battery in time period t | |
| Grid energy cost in EUR cent per kWh in time period t | |
| Cost limit in EUR cent per kWh to charge the battery | |
| Binary variable that is 1 if battery is charged in time period t | |
| Binary variable that is 1 if battery is discharged in time period t | |
| ∆t | Time delay |
References
- Mo, Y.; Kim, T.H.J.; Brancik, K.; Dickinson, D.; Lee, H.; Perrig, A.; Sinopoli, B. Cyber–Physical Security of a Smart Grid Infrastructure. Proc. IEEE 2012, 100, 195–209. [Google Scholar]
- Wang, W.; Lu, Z. Cyber Security in the Smart Grid: Survey and Challenges. Comput. Netw. 2012, 57, 1344–1371. [Google Scholar] [CrossRef]
- Yadav, S.A.; Kumar, S.R.; Sharma, S.; Singh, A. A review of possibilities and solutions of cyber attacks in smart grids. In Proceedings of the Innovation and Challenges in Cyber Security, Noida, India, 3–5 February 2016. [Google Scholar]
- Sgouras, K.I.; Birda, A.D.; Labridis, D.P. Cyber Attack Impact on Critical Smart Grid Infrastructures. In Proceedings of the Innovative Smart Grid Technologies Conference, Washington, DC, USA, 19–22 February 2014. [Google Scholar]
- Asri, S.; Pranggono, B. Impact of Distributed Denial-of-Service Attack on Advanced Metering Infrastructure. Wirel. Pers. Commun. 2015, 83, 2211–2223. [Google Scholar] [CrossRef]
- Anzalchi, A.; Sarwat, A. A Survey on Security Assessment of Metering Infrastructure in Smart Grid Systems. In Proceedings of the Southeast Conference, Fort Lauderdale, FL, USA, 9–12 April 2015. [Google Scholar]
- Mahmud, R.; Vallkati, R.; Mukherjee, A.; Ranganathan, P.; Nejadpak, A. A Survey on Smart Grid Metering Infrastructures: Threats and Solutions. In Proceedings of the IEEE International Conference on Electro/Information Technology (EIT), Dekalb, IL, USA, 21–23 May 2015. [Google Scholar]
- Bou-Harb, E.; Fachkha, C.; Pourzandi, M.; Debbabi, M.; Assi, C. Communication Security for Smart Grid Distribution Networks. IEEE Commun. Mag. 2013, 51, 42–49. [Google Scholar] [CrossRef]
- Wang, W.; Xu, Y.; Khanna, M. A survey on the communication architectures in smart grid. Comput. Netw. 2011, 55, 3604–3629. [Google Scholar] [CrossRef]
- Tellbach, D.; Li, Y.F. A survey on the cyber-security of distributed generation systems. In Proceedings of the ESREL, Portorož, Slovenia, 18–22 June 2017. [Google Scholar]
- Soupionis, Y.; Benoist, T. Cyber-Physical Testbed—The Impact of Cyber Attacks and the Human Factor. In Proceedings of the 10th International Conference for Internet Technology and Secured Transactions, London, UK, 14–16 December 2015; pp. 326–331. [Google Scholar]
- Zhang, Y.; Wang, L.; Sun, W. Investigating the Impact of Cyber Attacks on Power System Reliability. In Proceedings of the 3rd Annual International Conference on Cyber Technology in Automation, Control and Intelligent Systems, Nanjing, China, 26–29 May 2013. [Google Scholar]
- Ma, C.Y.T.; Yau, D.K.Y.; Rao, N.S.V. Scalable Solutions of Markov Games for Smart-Grid Infrastructure Protection. IEEE Trans. Smart Grid 2013, 4, 47–55. [Google Scholar] [CrossRef]
- Ciancamerla, E.; Fresilli, B.; Minichino, M.; Patriarca, T.; Iassinovski, S. An electrical grid and its SCADA under cyber attacks Modelling versus a Hybrid Test Bed. In Proceedings of the 2014 Internation Carnahan Conference on Security Technology, Rome, Italy, 13–16 October 2014. [Google Scholar]
- Asare-Bediako, B.; Kling, W.L.; Ribeiro, P.F. Integrated agent-based home energy management system for smart grids applications. In Proceedings of the Innovative Smart Grid Technologies Europe (ISGT EUROPE), Lyngby, Denmark, 6–9 October 2013. [Google Scholar]
- Kahrobaee, S.; Rajabzadeh, R.A.; Soh, L.-K.; Asgarpoor, S. A multiagent modeling and investigation of smart homes with power generation, storage, and trading features. IEEE Trans. Smart Grid 2013, 4, 659–668. [Google Scholar] [CrossRef]
- Zhang, T.; Siebers, P.-O.; Aickelin, U. Modelling electricity consumption in office buildings: An agent based approach. Energy Build. 2011, 43, 2882–2892. [Google Scholar] [CrossRef]
- Powerstar. Integrating Energy Storage with Renewable Energy. 2017. Available online: http://powerstar.com/energy-storage-renewable-energy/ (accessed on 9 April 2017).
- ELIA. ELIA Load 2017. 2017. Available online: http://www.elia.be/en/grid-data/data-download (accessed on 25 April 2017).
- Muller, J.; Hinken, D.; Blankemeyer, S.; Kohlenberg, H.; Sonntag, U.; Bothe, K.; Dullweber, T.; Kontges, M.; Brendel, R. Resistive Power Loss Analysis of PV Modules Made From Halved 15.6 × 15.6 cm2 Silicon PERC Solar Cells With Efficiencies up to 20.0%. IEEE J. Photovolt. 2015, 5, 189–194. [Google Scholar] [CrossRef]
- Einspeiseverguetung-Photovoltaikde. Das Aktuelle EEG. 2012. Available online: http://www.einspeiseverguetung-photovoltaik.de/ (accessed on 25 April 2017).
- Masoum, A.S.; Deilami, S.; Moses, P.S.; Abu-Siada, A. Impacts of battery charging rates of plug-in electric vehicle on smart grid distribution systems. In Proceedings of the Innovative Smart Grid Technologies Conference Europe (ISGT Europe), Gothenberg, Sweden, 11–13 October 2010. [Google Scholar]
- U.S. Department of Energy and Office of Energy Efficiency & Renewable Estimating Appliance and Home Electronic Energy Use. 2017. Available online: https://energy.gov/energysaver/estimating-appliance-and-home-electronic-energy-use (accessed on 23 April 2017).
- Sibelga. How Much Energy Do My Household Appliances Use? 2017. Available online: https://www.energuide.be/en/questions-answers/how-much-energy-do-my-household-appliances-use/71/ (accessed on 23 April 2017).
- EEX. Auktion EPEX SPOT, PHELIX Marktdaten. 2017. Available online: https://www.eex.com/de/marktdaten/strom/spotmarkt/auktion#!/2017/04/08 (accessed on 9 April 2017).
Figure 1.
Formerly conducted simulations of cyber-attacks identified by Tellbach and Li [10].
Figure 1.
Formerly conducted simulations of cyber-attacks identified by Tellbach and Li [10].
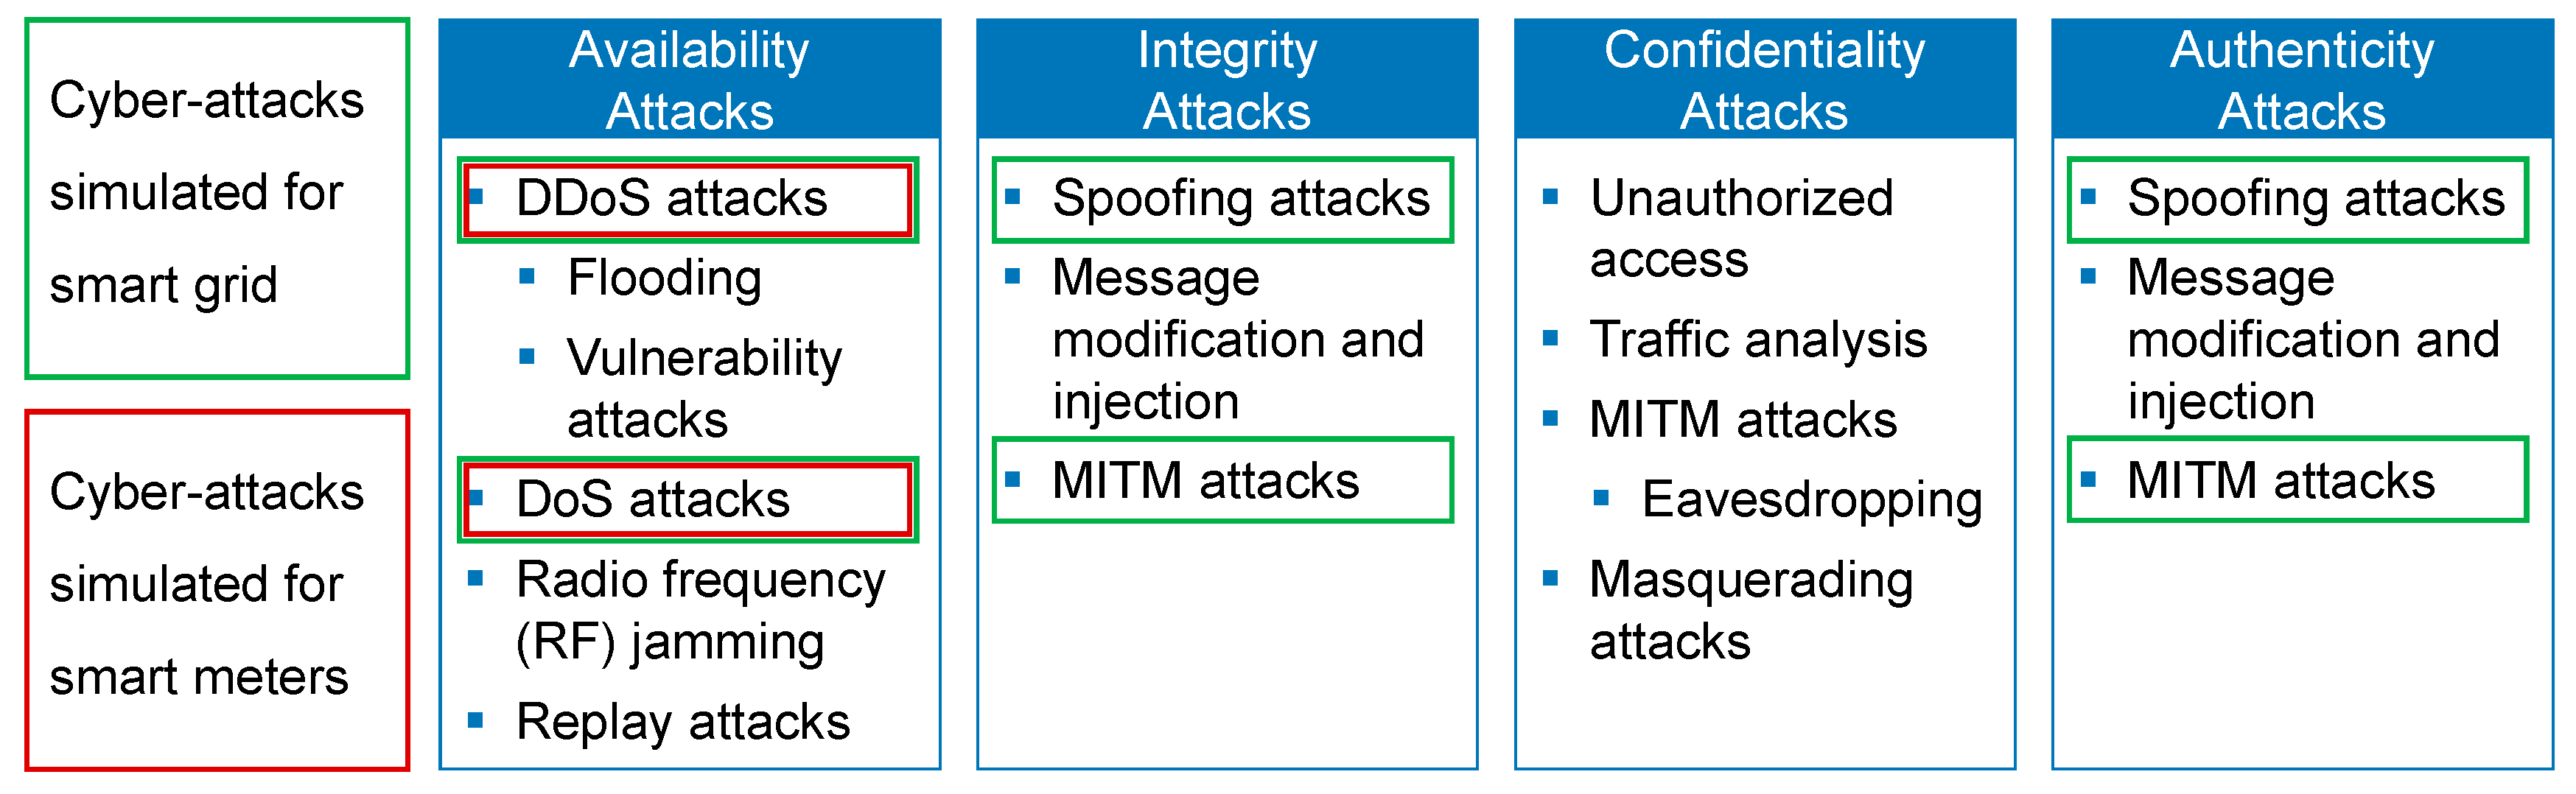
Figure 2.
Simulation model.
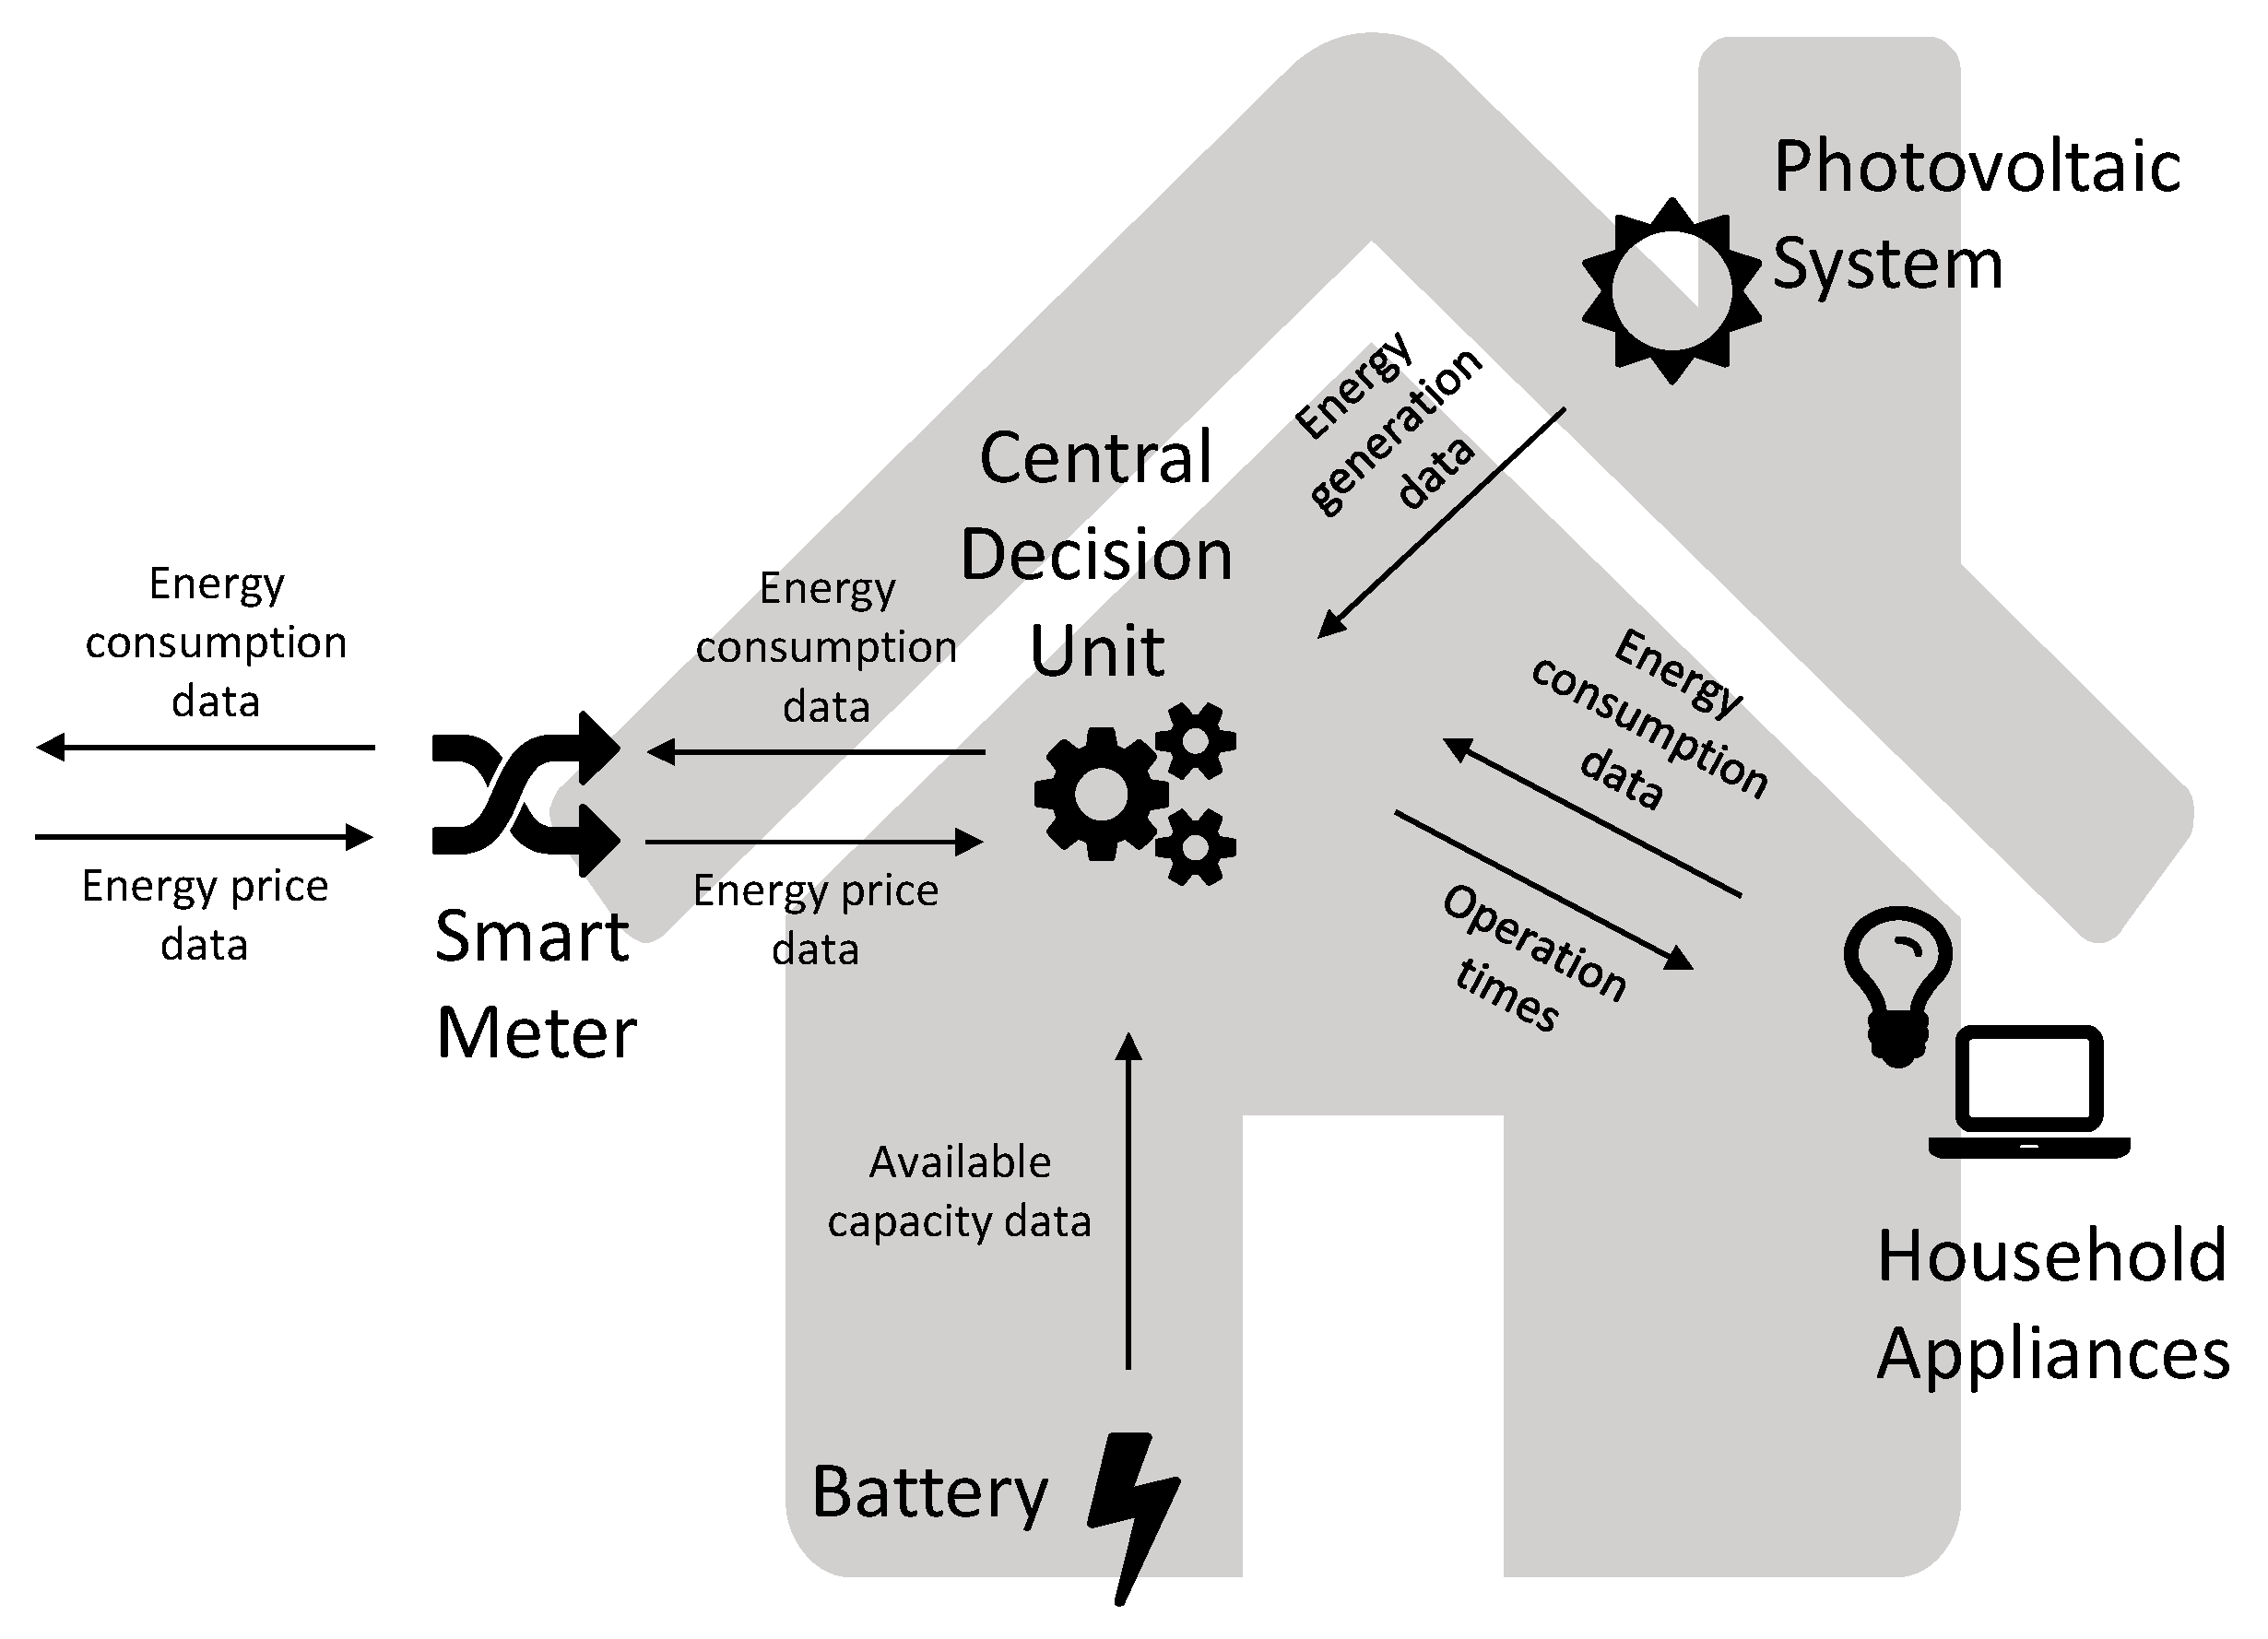
Figure 3.
Simplified Logic Flow Diagram for Meeting Household Nanogrid Energy Demand.
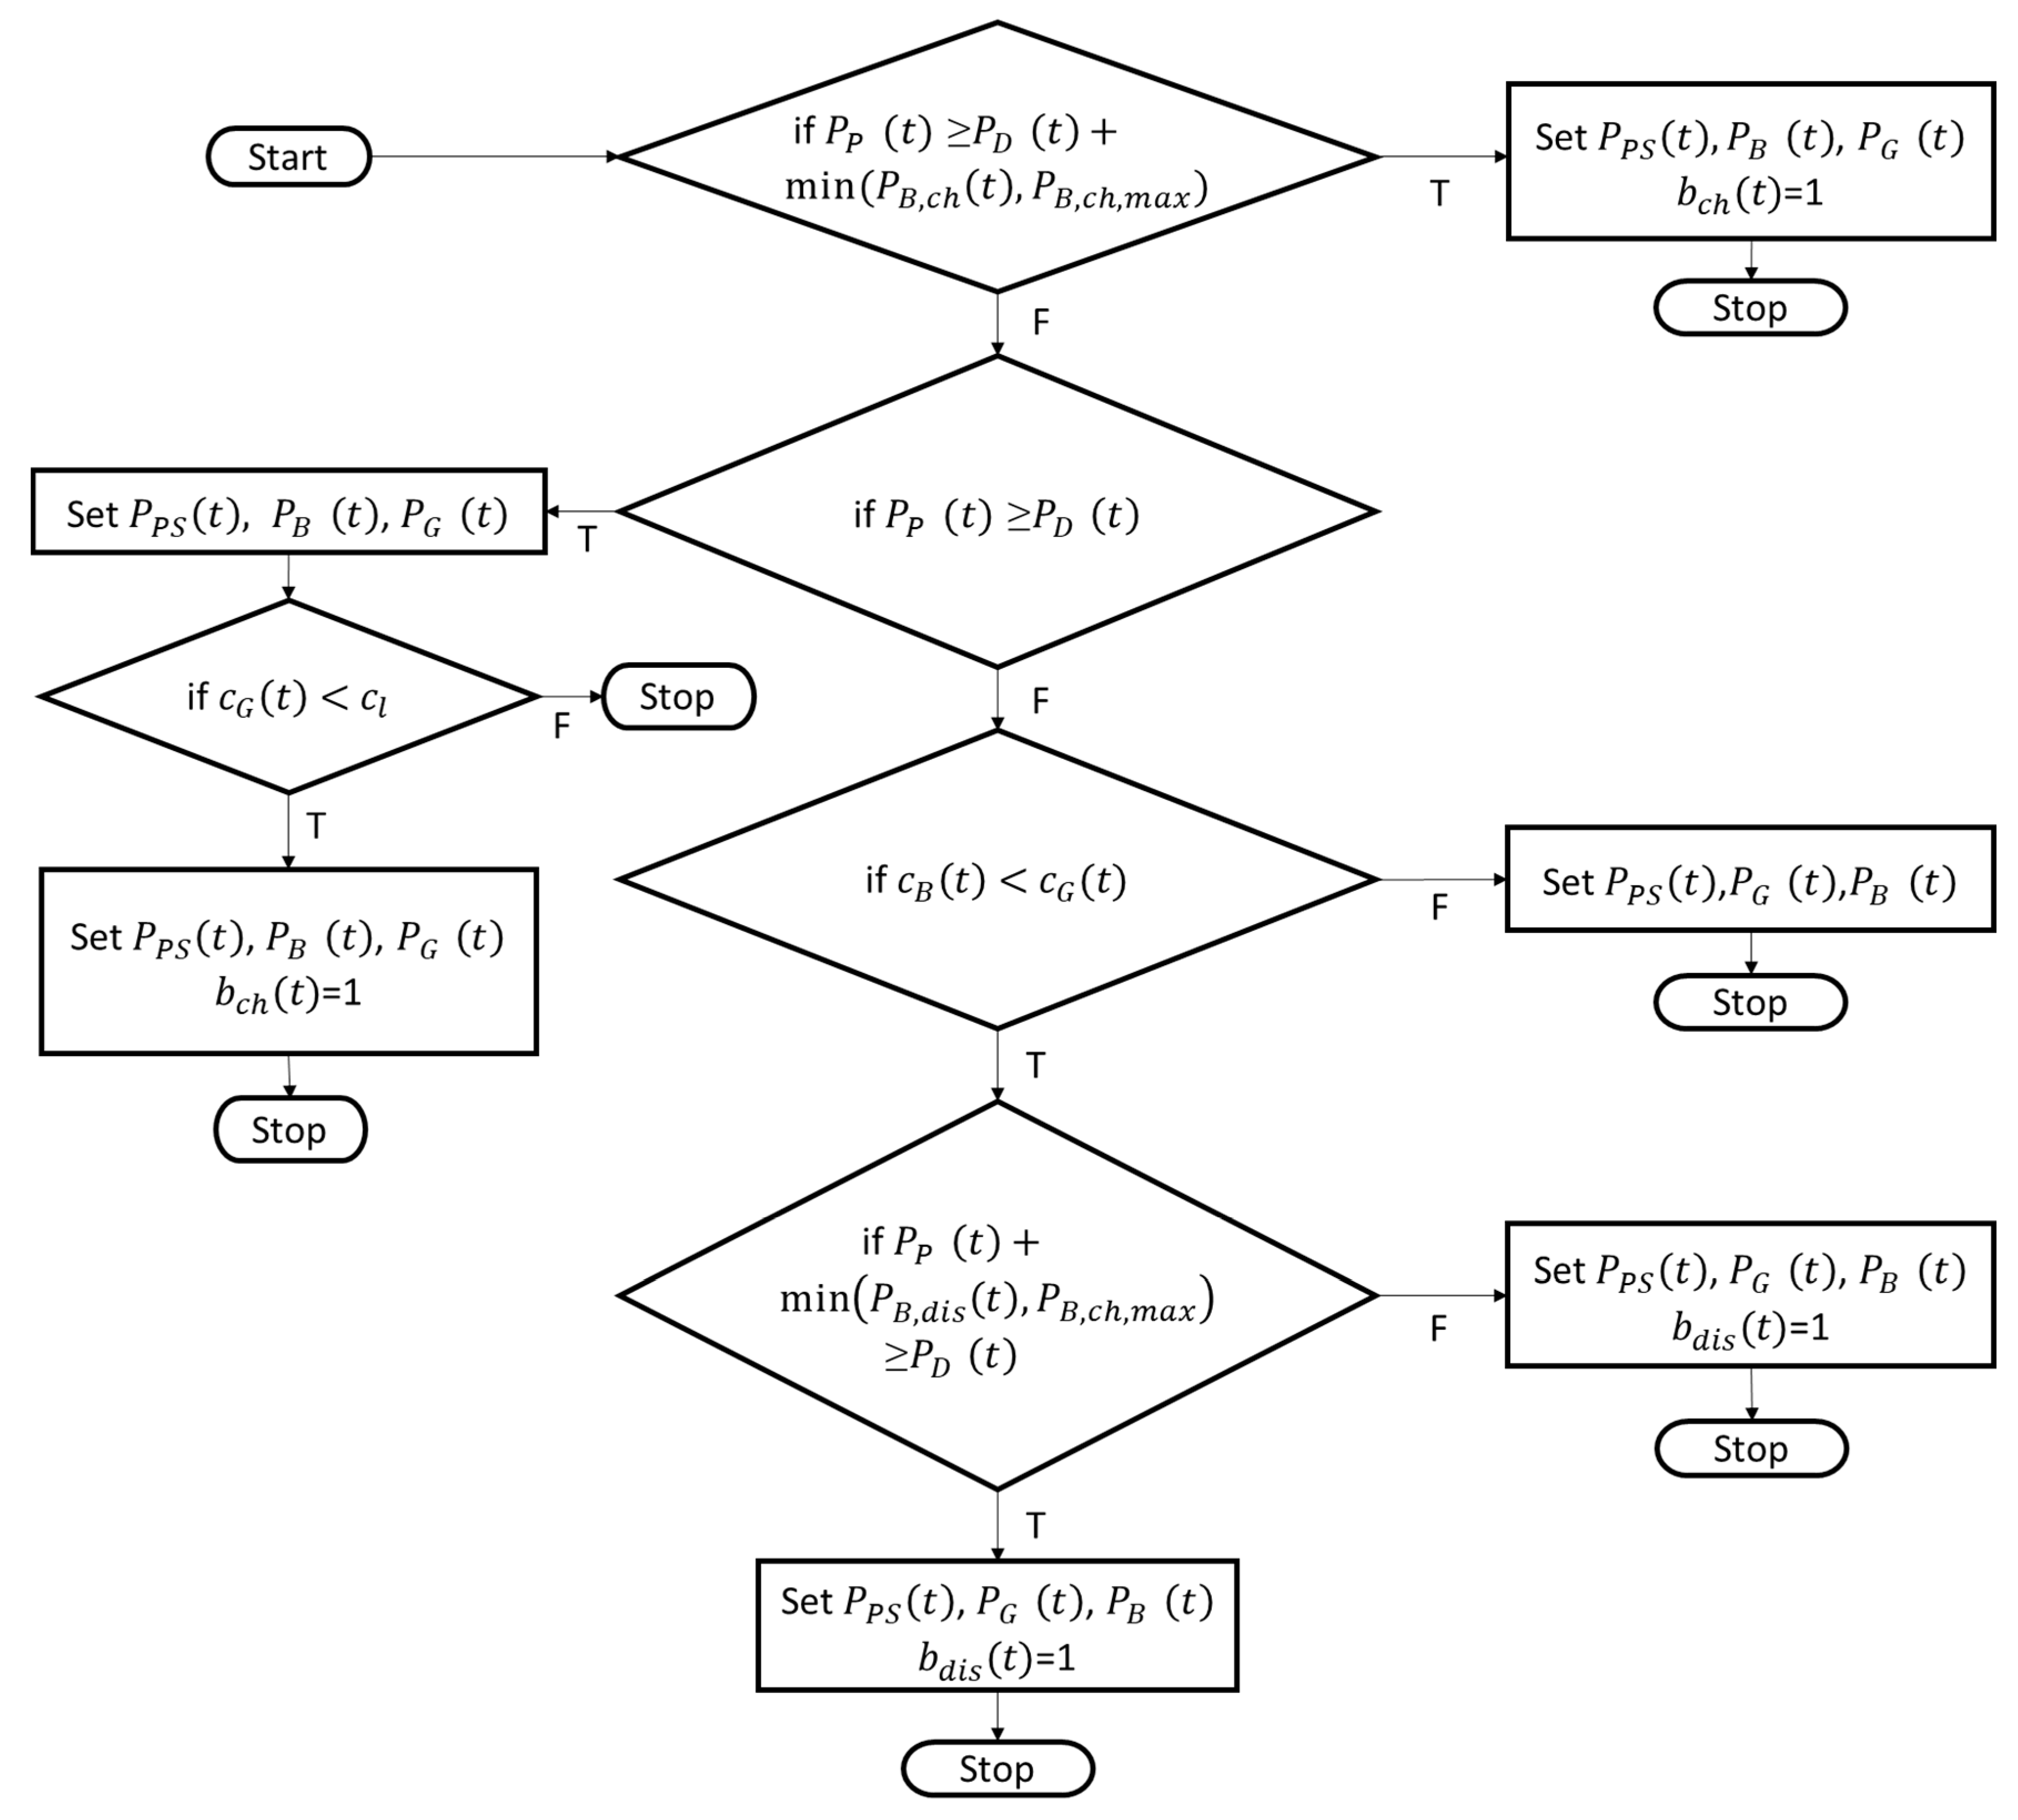
Figure 4.
Simplified Logic Flow Diagram for Battery Charging.
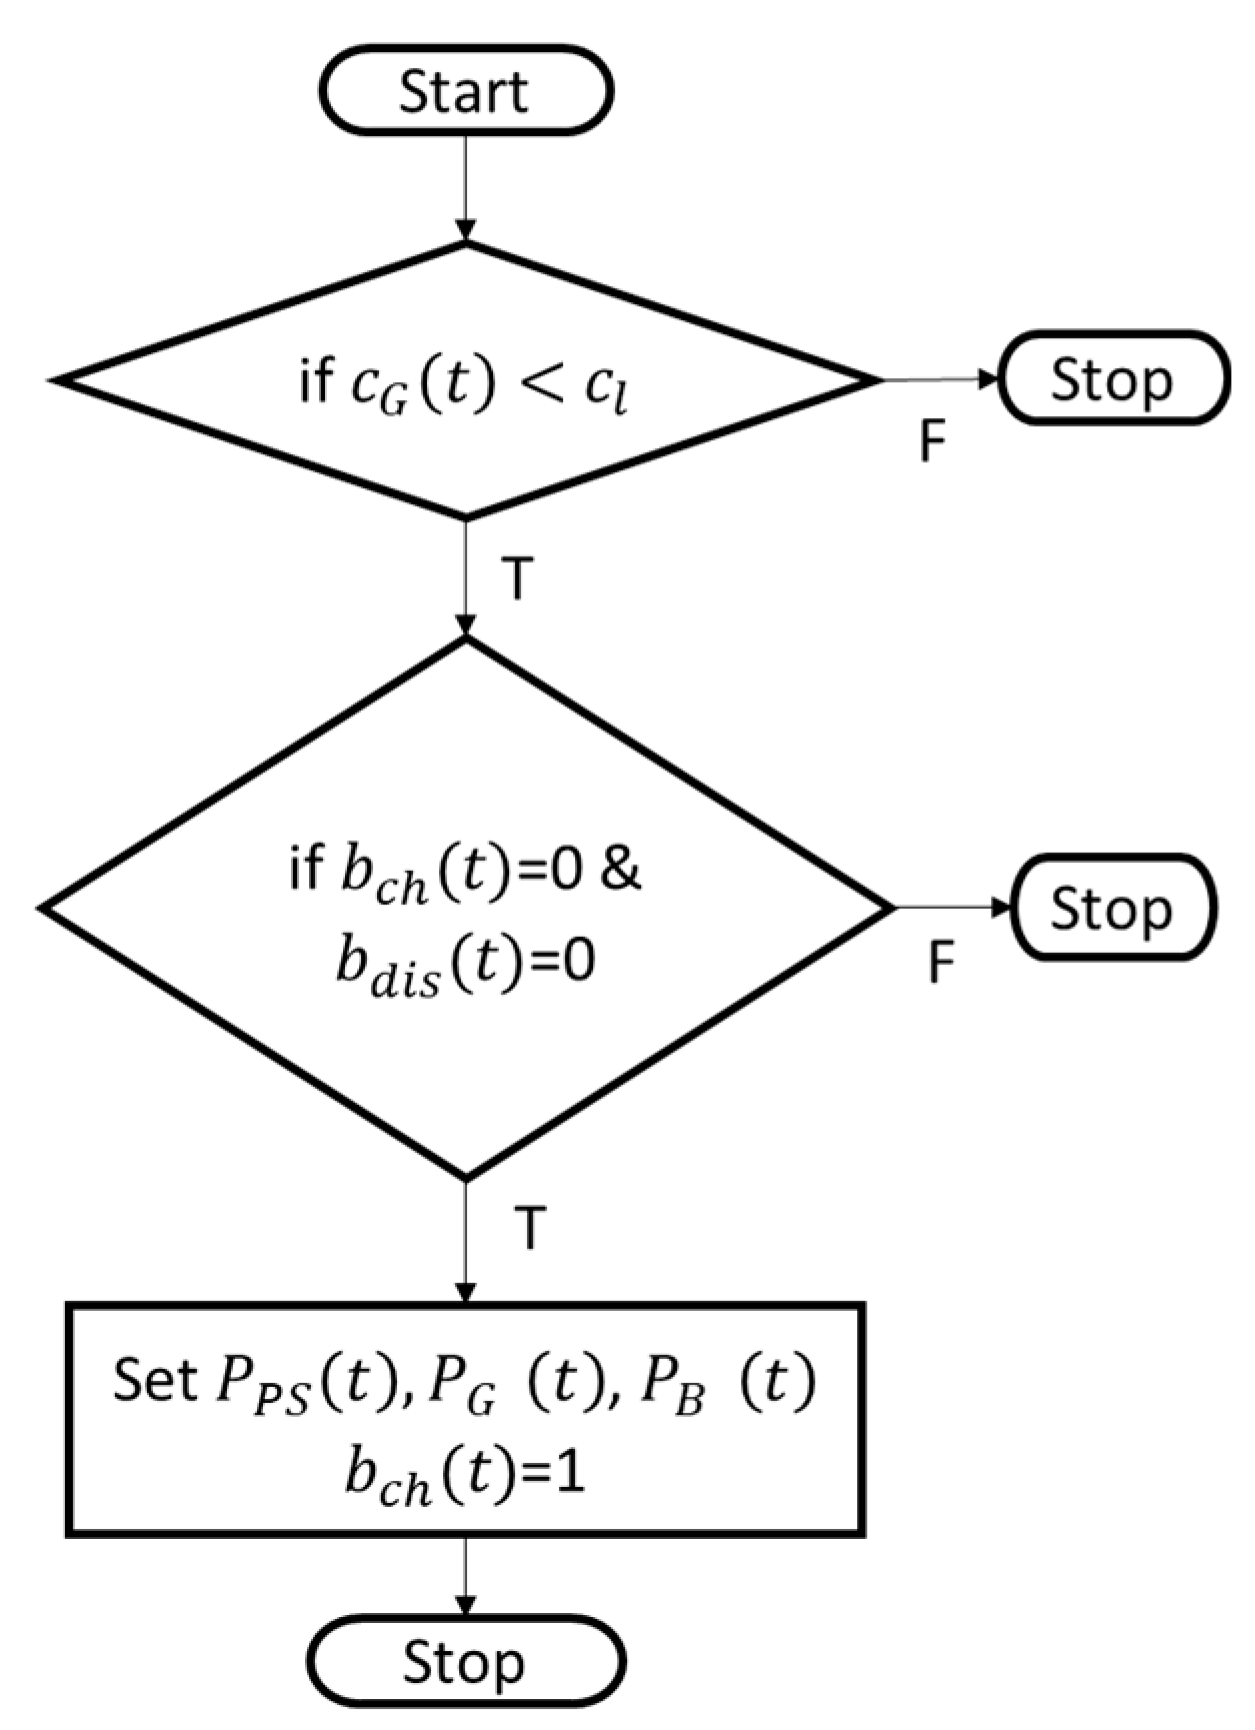
Figure 5.
Photovoltaic Energy Generation Data.
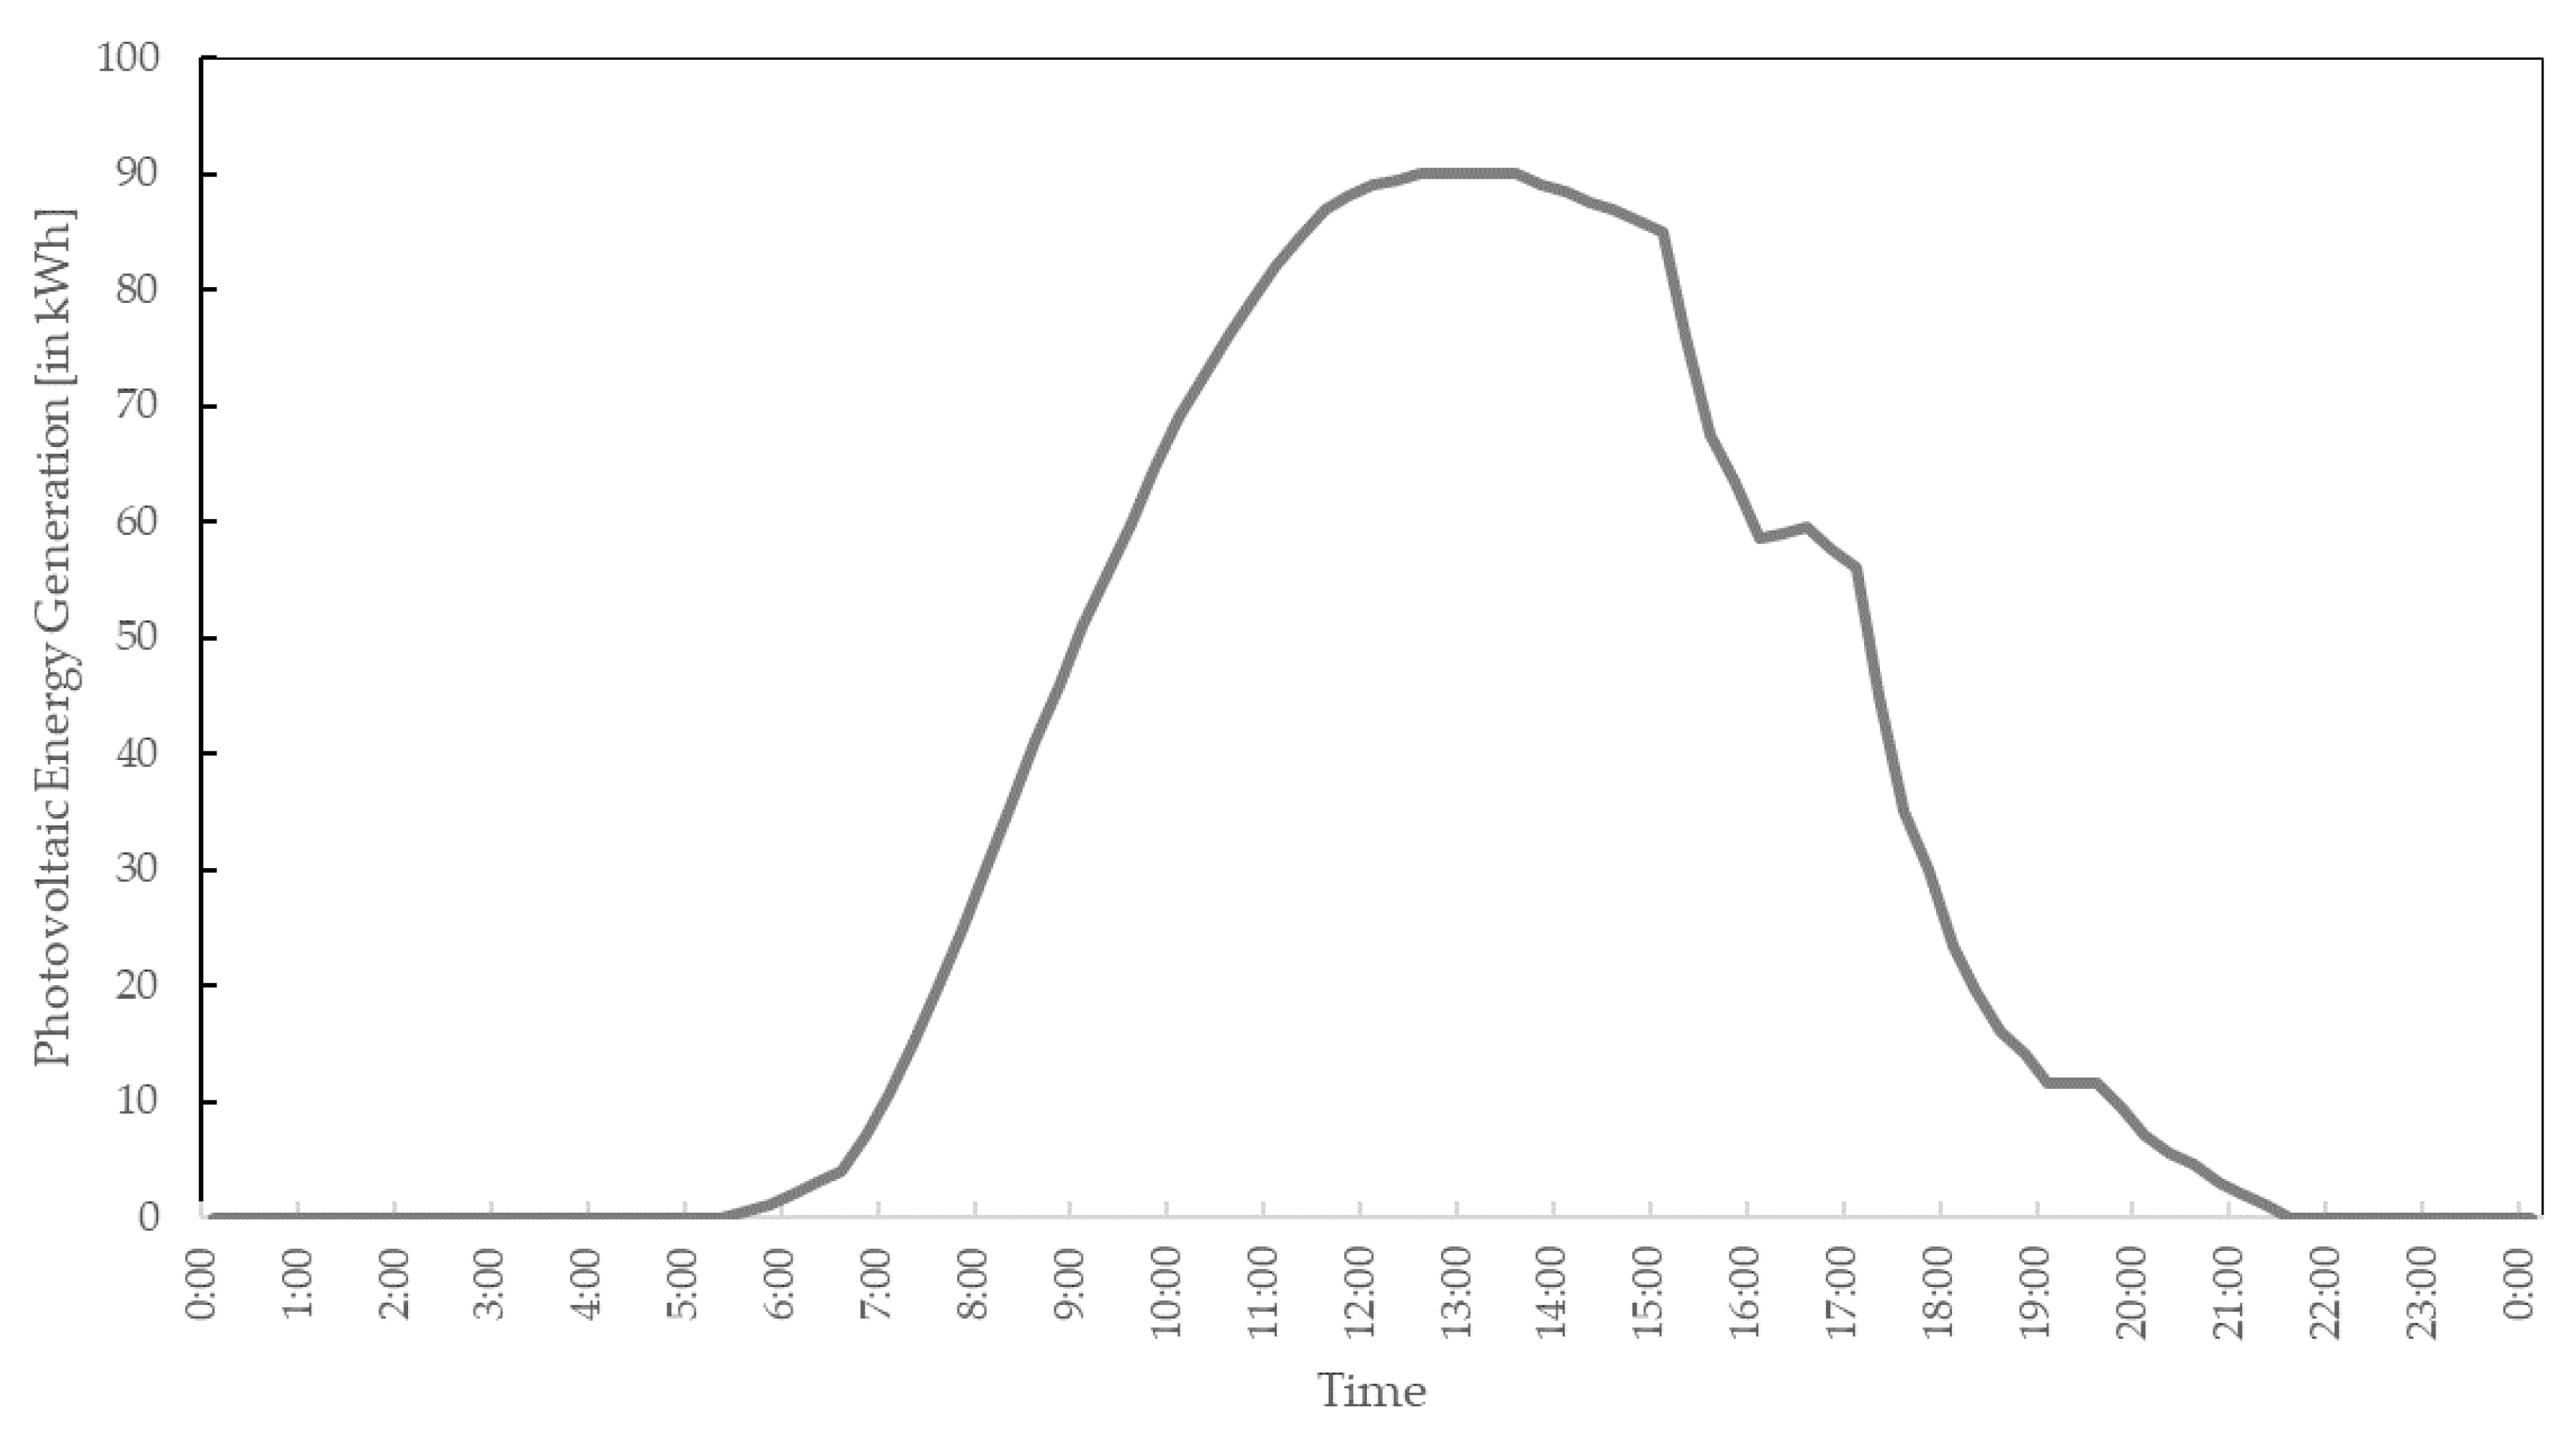
Figure 6.
Household Energy Demand Data.

Figure 7.
Graphic analysis of household simulation.

Figure 8.
Graphic analysis of the effects of an integrity attack on grid energy price.

Figure 9.
Graphic analysis of the effects of an integrity attack on grid energy demand.

Figure 10.
Graphic analysis of the effects of an integrity attack on photovoltaic energy data.
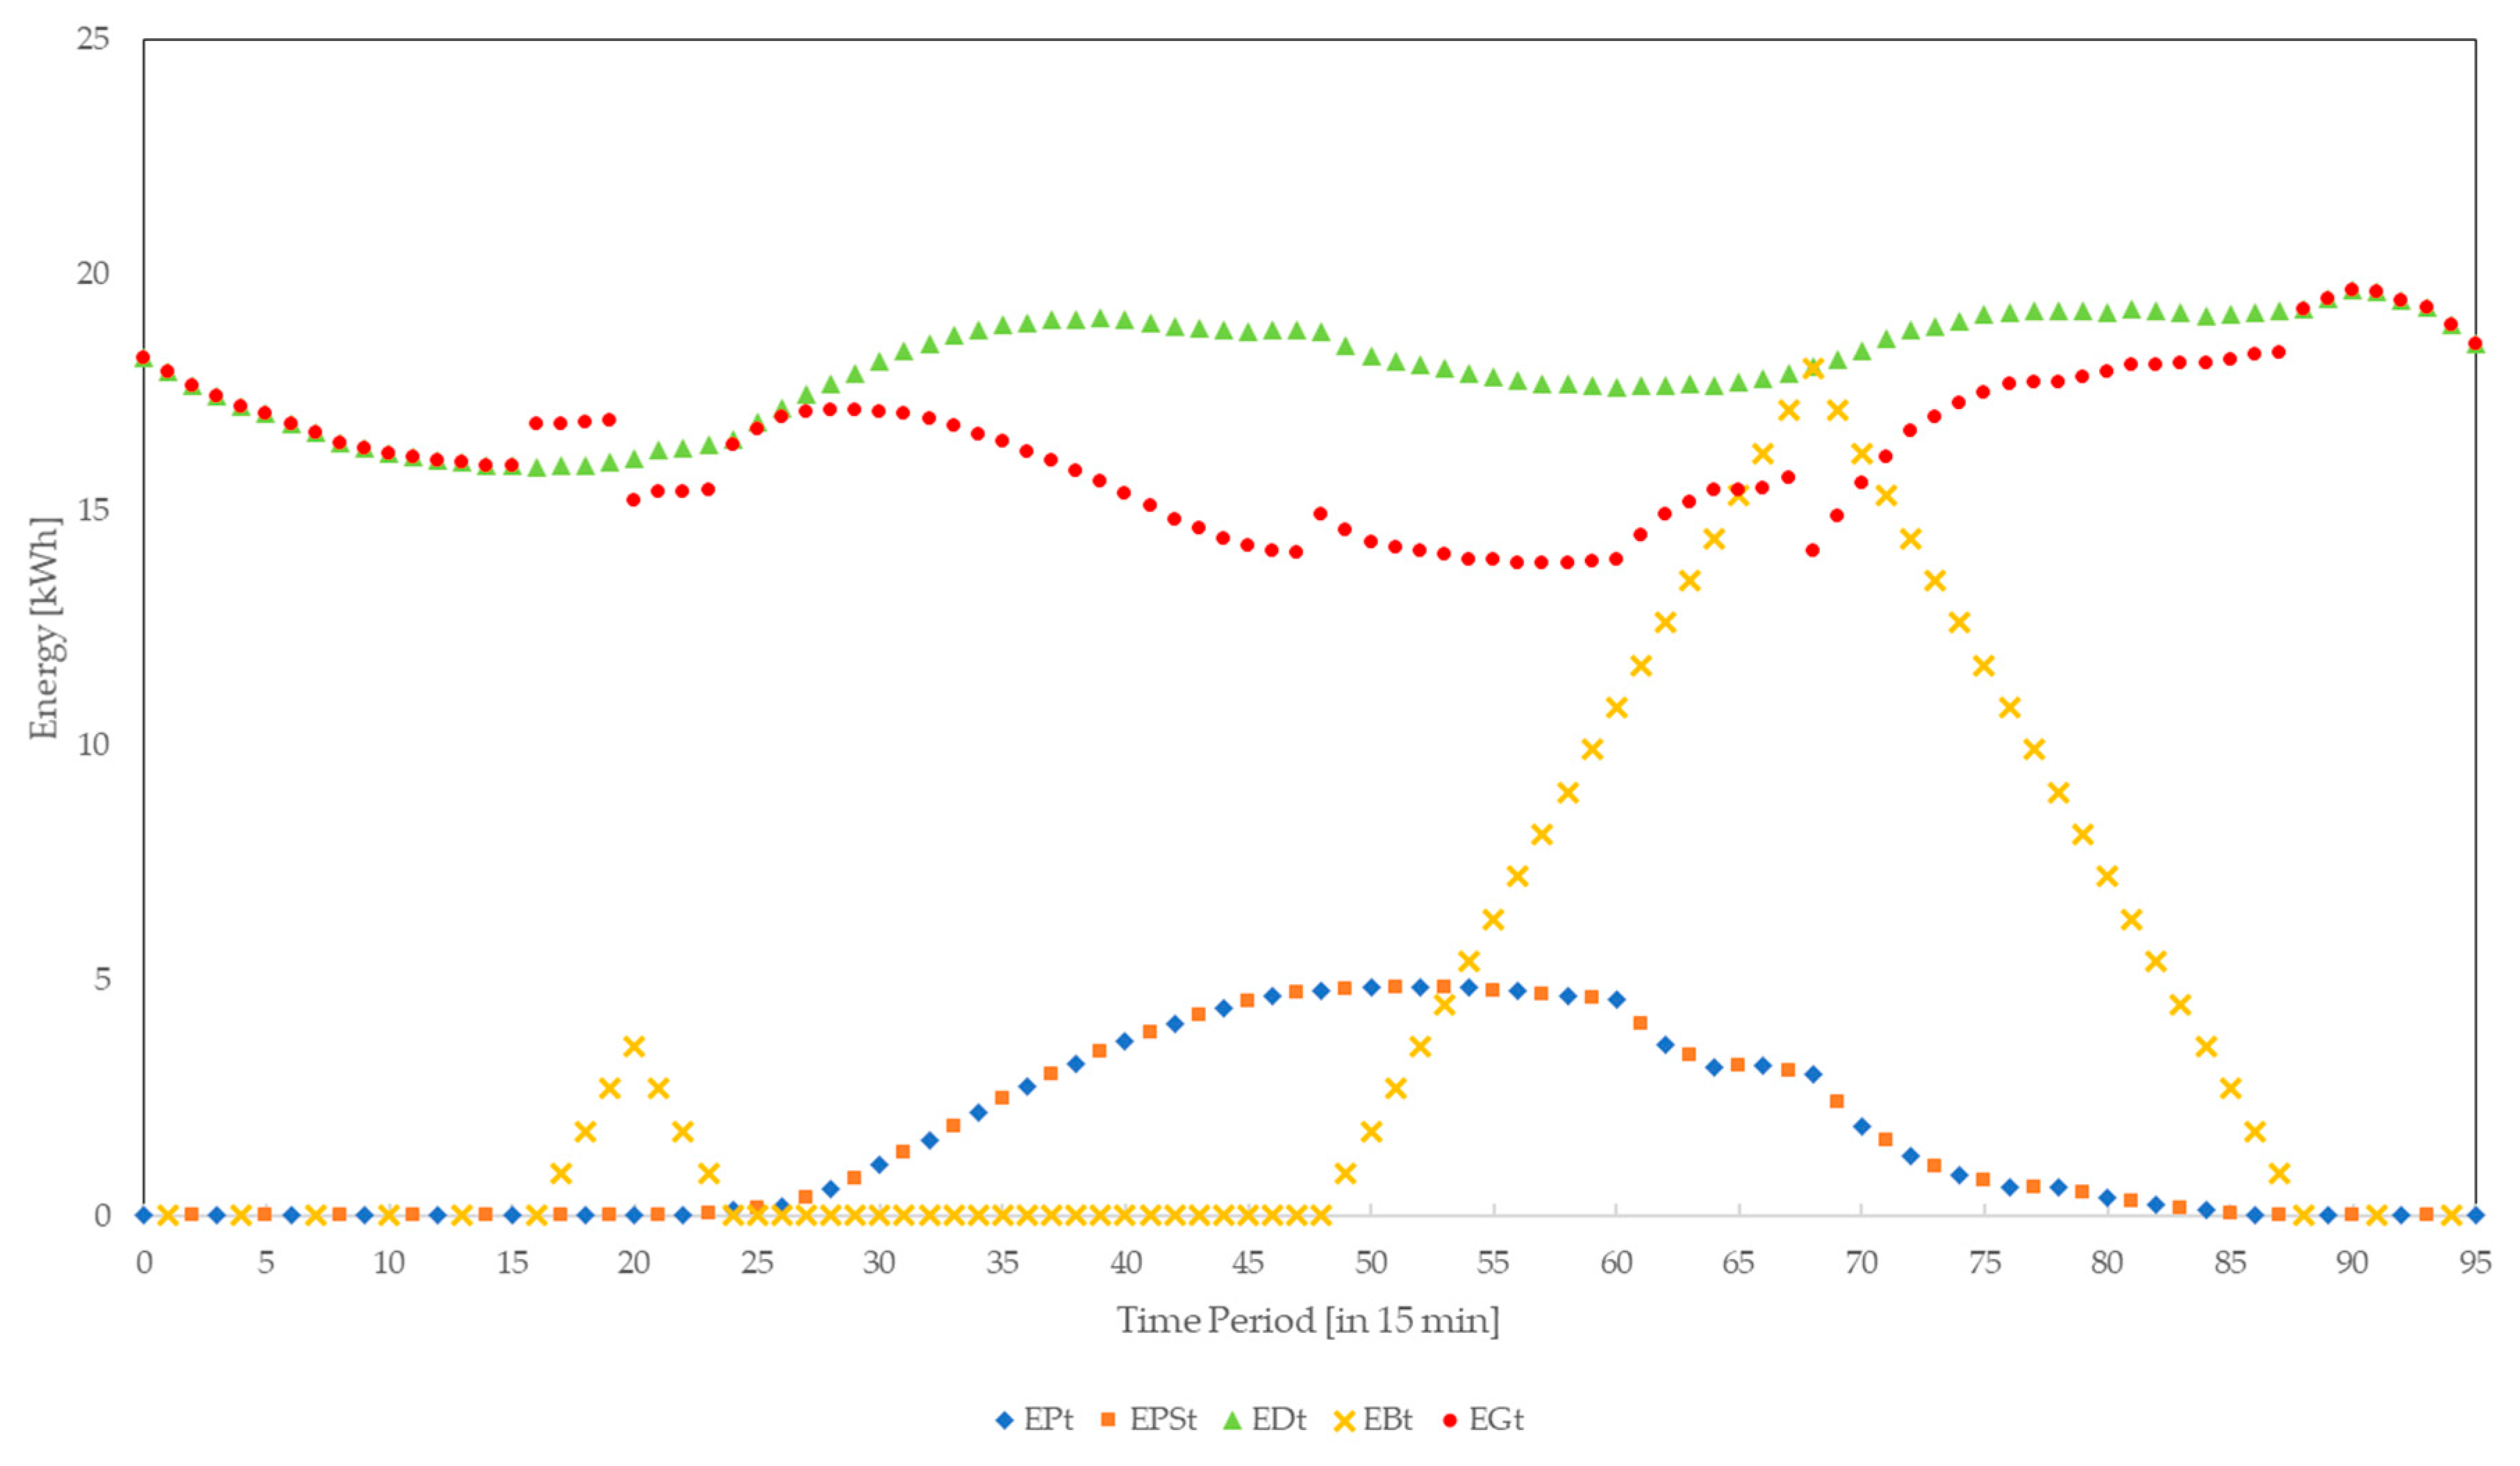
Figure 11.
Graphic analysis of the effects of a confidentiality attack on grid energy price.


Table 1.
Related work: simulation of cyber-attacks.
| Key Words | Simulation of Cyber-Attacks on SG | Simulation of Cyber-Attacks on SMs |
|---|---|---|
| Availability Attacks | ||
| DoS/DDoS Attacks | Soupionis and Benoist [11] Asri and Pranggono [5] Zhang et al. [12] | Sgouras et al. [4] Ma et al. [13] |
| Integrity/Confidentiality Attacks | ||
| Spoofing Attacks | Zhang et al. [12] | |
| Message modification | Zhang et al. [12] | |
| MITM Attacks | Zhang et al. [12] Ciancamerla et al. [14] |
Table 2.
Related work: household simulation models.
| Household Component Included in Model | Asare-Bediako et al. [15] | Kahrobaee et al. [16] | Zhang et al. [17] |
|---|---|---|---|
| Battery | x | ||
| Energy Generation | x | x | |
| Household Operations | x | ||
| Household Appliances | x | x | |
| SM | x |
Table 3.
Mathematical models for the simulation of availability attacks.
| Cyber-Attack | Math. Model | Effects |
|---|---|---|
| DoS Attack | ∆t = 0 | No measurable delay |
| DDoS Attack | ∆t > 0 | Small measurable delay |
| DDoS Attack | ∆t >> 0 | Considerable delay |
| RF Jamming | No grid energy price data for one period | |
| RF Jamming | No grid energy price data for multiple periods | |
| Replay Attack | Delaying grid energy price data | |
| Replay Attack | Repeating grid energy price data |
Table 4.
Mathematical model for the simulation of integrity attacks.
| Cyber-Attack | Math. Model | Effects |
|---|---|---|
| Grid Energy Price | Financial impact | |
| Grid Energy Demand | Financial impact | |
| Sold Photovoltaic Energy | Financial impact |
Table 5.
Mathematical model for the simulation of confidentiality attacks.
| Cyber-Attack | Math. Model | Effects |
|---|---|---|
| Grid Energy Price | Financial impact | |
| Grid Energy Price | Financial impact | |
| Sold Photovoltaic Energy | Financial impact | |
| Grid Energy Demand | Financial impact |
Table 6.
Results of the simulation of availability attack injection.
| Cyber-Attack | Total Household Cost [ct] | Loss for Grid [ct] | SM Delay | SM Communication Stop |
|---|---|---|---|---|
| DoS Attack | 5456.46 | 0 | - | - |
| DDoS Attack | 5456.46 | 0 | 6 ms | - |
| DDoS Attack | 5456.46 | 0 | 1 s | - |
| RF Jamming One period | 5453.77 | 2.69 | - | One period |
| RF Jamming Four periods | 5451.07 | 5.39 | - | Four periods |
| Replay Attack Delay | 5382.72 | 73.74 | - | One period |
| Replay Attack Repeat | 5449.88 | 6.58 | - | - |
Table 7.
Results of the simulation of integrity attack injection.
| Attack on | Total Household Cost [ct] | Loss for Grid [ct] | SM Delay | SM Communication Stop |
|---|---|---|---|---|
| Grid Energy Price | 2748.03 | 2708.43 | - | - |
| Grid Energy Demand | 2759.59 | 2696.87 | - | - |
| Photovoltaic Energy | 3613.38 | 1843.08 | - | - |
Table 8.
Results of the simulation of confidentiality attack injection.
| Attack on | Total Household Cost [ct] | Loss for Grid [ct] | SM Delay | SM Communication Stop |
|---|---|---|---|---|
| Grid Energy Half | 2748.03 | 2708.43 | - | - |
| Grid Energy Zero | 0 | 5456.46 | - | - |
| Photovoltaic Energy | 3613.38 | 1843.08 | - | - |
| Grid Energy Demand | 2759.59 | 2696.87 | - | - |
Table 9.
Comparison of severity of attacks.
| Attack | Monetary Impact | SM Delay | SM Communication Stop |
|---|---|---|---|
| Availability Attacks | |||
| DoS/DDoS Attacks |  |  | |
| RF Jamming |  | | |
| Replay Attacks | | | |
| Integrity Attacks | | | |
| Confidentiality Attacks | | | |
© 2018 by the authors. Licensee MDPI, Basel, Switzerland. This article is an open access article distributed under the terms and conditions of the Creative Commons Attribution (CC BY) license (http://creativecommons.org/licenses/by/4.0/).
Share and Cite
MDPI and ACS Style
Tellbach, D.; Li, Y.-F. Cyber-Attacks on Smart Meters in Household Nanogrid: Modeling, Simulation and Analysis. Energies 2018, 11, 316. https://doi.org/10.3390/en11020316
AMA Style
Tellbach D, Li Y-F. Cyber-Attacks on Smart Meters in Household Nanogrid: Modeling, Simulation and Analysis. Energies. 2018; 11(2):316. https://doi.org/10.3390/en11020316
Chicago/Turabian StyleTellbach, Denise, and Yan-Fu Li. 2018. "Cyber-Attacks on Smart Meters in Household Nanogrid: Modeling, Simulation and Analysis" Energies 11, no. 2: 316. https://doi.org/10.3390/en11020316
Note that from the first issue of 2016, this journal uses article numbers instead of page numbers. See further details here.