Carbon Footprint Modeling of a Clinical Lab
by
 , , ,
, , ,
Kai Ni
1 ,
,
Yihua Hu
1,*,
Xianming Ye
2,
Hamzah S AlZubi
1,3,
Phil Goddard
3 and
Mohammed Alkahtani
1 1
Department of Electrical Engineering and Electronics, University of Liverpool, L69 3GJ Liverpool, UK
2
Department of Electrical, Electronic and Computer Engineering, University of Pretoria, Pretoria 0084, South Africa
3
CSols Ltd., The Health, WA7 4QX Runcorn, Cheshire, UK
*
Author to whom correspondence should be addressed.
Energies 2018, 11(11), 3105; https://doi.org/10.3390/en11113105
Submission received: 18 October 2018
/
Revised: 2 November 2018
/
Accepted: 6 November 2018
/
Published: 9 November 2018
(This article belongs to the Section A: Sustainable Energy)
Abstract
:Modeling of a clinical lab carbon footprint is performed in this study from the aspects of electricity, water, gas consumption and waste production from lab instruments. These environmental impact indicators can be expressed in the form of the CO2 equivalent. For each type of clinical test, the corresponding consumption of energy resources and the production of plastics and papers are taken into consideration. In addition, the basic lab infrastructures such as heating, ventilation, air-conditioning (HVAC) systems, lights, and computers also contribute to the environmental impact. Human comfort is to be taken into account when optimizing the operation of lab instruments, and is related to the operation of HVAC and lighting systems. The detailed modeling takes into consideration the types of clinical tests, operating times, and instrument specifications. Two ways of disposing waste are classified. Moreover, the indoor environment is modeled. A case study of the Biochrom 30+ amino acid analyzer physiological system in Alder Hey Children’s Hospital is carried out, and the methods of mitigating the overall environmental impacts are discussed. Furthermore, the influence of climate on the results is investigated by using the climate data in Liverpool and Athens in October.
1. Introduction
Clinical laboratories are energy-intensive facilities, and each clinical laboratory can use three to six times more energy per unit surface area than a typical commercial building [1]. In addition, these laboratories consume huge amounts of water and gases. Moreover, different types of disposables are produced, including materials with toxic effects. All of the above-mentioned activities are detrimental to the environment, and they result in a CO2 equivalent. There are few studies on reducing the carbon footprint for clinical laboratories, and most of these laboratories are not aware of their negative impacts on the environment. Therefore, effective methods should be proposed to create an awareness of mitigating carbon footprints in clinical laboratories [2]. For example, it is necessary for the clinical laboratories to be accredited to the standard of environmental management ISO 14000. In Reference [2], the 3R (reduce, reuse, and recycle) concept was proposed for environmental improvement, where the main points are (1) reducing the consumption of energy, natural resources, and dangerous products; (2) reusing the items in the lab process; and (3) recycling the lab items or their components for new manufacture processes. Some guidelines for mitigating the environmental impacts of clinical laboratories were suggested in Reference [2], which are shown below.
- Enunciating an environmental policy and action plans;
- Building up an environmental management system (EMS);
- Integrating EMS with the quality management system (QMS);
- Training the staff;
- Assessing the lab performance by using audits;
- Appointing a laboratory environmental manager.
A table was presented in Reference [1] to illustrate the details relating to the initiation of sustainable environmental practices for laboratories. However, only the guidelines and suggestions for mitigating the environmental impact were given, and no carbon footprint model of the clinical lab testing process was available. It was indicated in Reference [3] that blood testing is a crucial step in the diagnosis of various diseases, and the performance analysis of a university hospital blood laboratory was conducted by simulation. Because of high testing frequencies, it is of great importance to optimize the process of blood testing to save time, and the resource utilization rates were derived to analyze the overall system performance. However, the research in Reference [3] only focused on overall patient satisfaction, while the factors of electricity, gas, water consumption, and disposable production were not taken into account for CO2 equivalent production. In Reference [4], the first green diagnostic center and laboratory buildings in Indonesia were introduced, while only the building construction was discussed. According to the clinical laboratory test list provided by the Medya Diagnostic Center [5], there are over 600 categories of clinical laboratory tests to perform. Different instruments are used for different types of tests, and the electricity, gas, water consumption, and consumable production levels vary for these tests. In addition, the number of staff involved and the time spent on implementing the instruments are distinct for different tests. Based on all of these variables, the CO2 equivalent can be calculated for each type of test. Therefore, it is necessary to establish a unified model for expressing the carbon footprint produced by the clinical lab testing process.
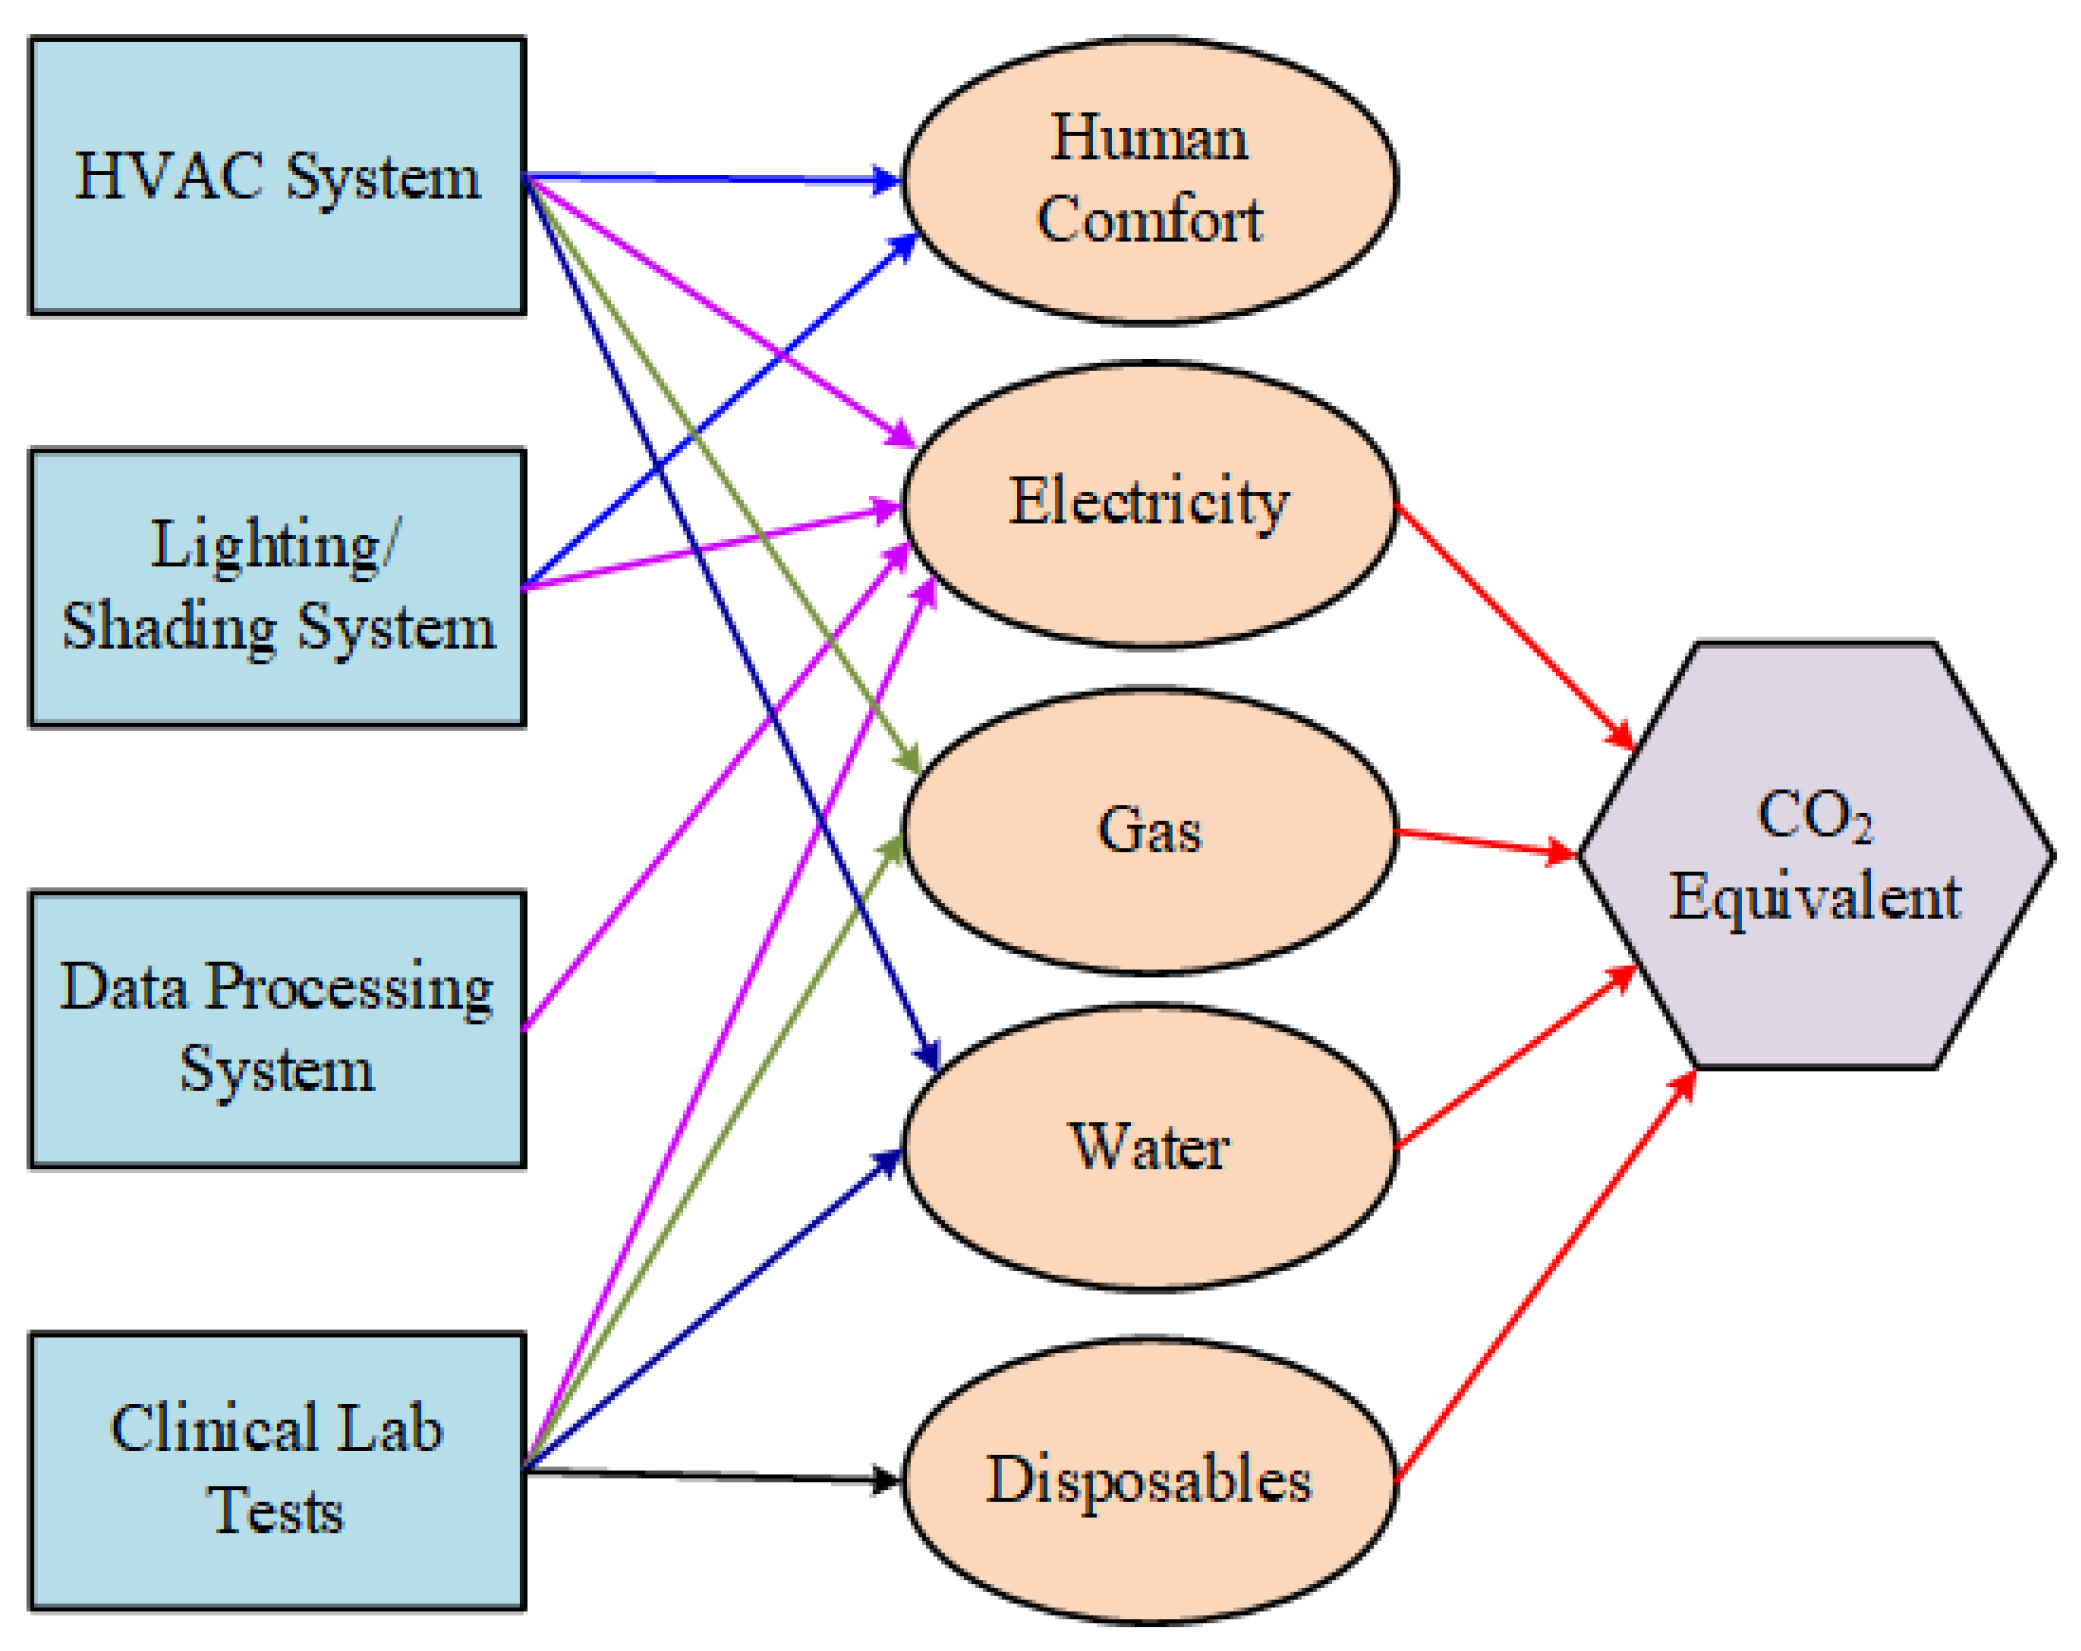
Apart from the specific clinical lab instruments, basic lab infrastructures should be considered, since they are related to human comfort, and they also contribute to the equivalent carbon footprint. In this paper, the heating, ventilation, and air conditioning (HVAC) system, lighting/shading system, and data processing systems are included. To maintain the indoor temperature and humidity at an acceptable level for the staff, the HVAC system is necessary, which is a common system in any indoor environment, and it accounts for around 40% of energy consumption in a common building [6,7]. A detailed HVAC system is extremely complicated and the subsystems may vary according to the different requirements of various buildings [8]. In this paper, only the most crucial equipment in an HVAC system are presented to simplify the model. To control the indoor temperature, heating and cooling coils are applied, while the ventilation of the lab is realized by applying the fan air unit (FAU), fan coil unit (FCU) and natural ventilation (by opening windows) [9]. Apart from HVAC system, the lighting/shading system is also crucial for the experimental procedures in a lab, and the energy consumption induced by using lights accounts for up to 15% of the total energy consumption all over the world [9]. A number of investigations were carried out in this field to study the influence of shading system control on electricity consumption by using lights [10,11,12]. In addition, computers are widely used in laboratories to process information and data from lab instruments, and they also consume electrical power. The relationship between the clinical lab testing process and the resulting CO2 equivalent is illustrated in Figure 1.
The influence of long-term occupancy information on building climate control for energy saving was investigated by simulations in Reference [13]. To implement the clinical lab tests, the indoor human comfort level should be first satisfied to provide a suitable environment for the staff in the laboratory. As one of the constraints in room temperature control, relevant research in thermal comfort has been extensively conducted by Fanger [14,15,16,17]. In addition, the indoor human comfort indicators (temperature, humidity, CO2 concentration, and light illuminance) are adjusted by controlling the HVAC and lighting/shading systems. There are a number of works on optimizing indoor human comfort and energy by HVAC control. In Reference [18], the HVAC control systems were optimized to decrease the building energy consumption and to improve thermal comfort simultaneously for the classroom environment. By comparing some advanced control methods for building energy optimization and comfort management in Reference [19], it was found that the fuzzy trial and error control system yielded the most economical performance. Additionally, for different configurations of ventilation rate and supply water temperature, the Gaussian process regression (GPR) was applied to construct the statistical models for predicting the ground-source heat pump (GSHP) power consumption and indoor thermal comfort in Reference [20]. Furthermore, a modular integrated control-oriented modeling approach for HVAC performance benchmarking was proposed to catch the interactions between the HVAC equipment [21]. However, all the above-mentioned methods did not take the CO2 emission issue into account, and the carbon footprint model for a clinical laboratory has not been established yet. When using the instruments in HVAC and lighting/shading systems, as well as implementing the clinical lab tests, electricity consumption is encountered, which corresponds to the CO2 equivalent from the thermal power plants. In addition, during the operating processes of HVAC systems and clinical lab tests, gases and water may be used, which are also the factors to be considered in the CO2 equivalent. Last but not least, a large number of clinical disposables (specimen containers, vials, storage tubes, transfer pipettes, paper, etc.) are produced in the clinical lab tests, and they act as the major contributors to the environmental effects. Therefore, the CO2 equivalent from a clinical laboratory is generated due to the electricity, gas, and water consumption, and the disposables from lab tests.
In this paper, a global carbon footprint model of the clinical laboratory is established based on the operation of basic lab instruments and the implementation of clinical lab tests. The relationship between the CO2 equivalent and the operation of each instrument in the lab is illustrated in detail. Moreover, the human comfort level should be met, which should be taken as an important factor in the modeling process. It should be noted that the optimization procedure in this study is implemented based on static reasoning, which is different from the dynamic optimization strategies used for HVAC operation by other researchers.
The structure of the paper is arranged as follows. In Section 2, the model of CO2 equivalent is set up for a clinical lab. In Section 3, the environmental impacts of the clinical lab are analyzed. In addition, the modeling of the indoor environment is presented in Section 4. In Section 5, a case study is performed to investigate the ways of mitigating clinical lab environmental impacts, and the influence of climate on the results is also considered. The conclusion is given in Section 6.
2. The CO2 Equivalent Model
In order to measure the environmental effects produced by the operational processes of a clinical laboratory, a model of CO2 equivalent (kg) is to be established. The contributors to the CO2 equivalent can be classified into four categories, which are the electricity (kWh), gas (m3), water (m3) consumption, and production of disposables (tonnes). Therefore, the rates of electricity, gas, and water consumption are defined as P (kW), G (m3/h), W (m3/h), and the operating time is t (h). The conversion factors in the UK can be derived from Reference [22] to set up the model, and proportional relationships are assumed for expressing the CO2 equivalent, CO2e, with respect to the aforementioned contributors.
The ratios of CO2e to electricity consumption (Pt), gas usage (Gt), and water supply (Wt) are respectively expressed as RP, RG, and RW,
The types of waste produced from the disposables in a clinical lab are mainly plastics (sample extraction and tests) and paper (report printing), and different CO2 emission ratios are used according to the ways of disposal, which can be categorized as has been done in Reference [22]:
- (1)
- Open-loop (OL) (only for plastics): This is a process of recycling material into other products.
- (2)
- Closed-loop (CL): This is a process of recycling material back into the same product.
- (3)
- Combustion (CB): The waste is incinerated and subsequent electricity is generated.
- (4)
- Landfill (LF): The waste materials are buried, which is the oldest form of waste treatment.
- (5)
- Composting (CP) (only for paper): The organic materials can be recycled, while CO2 equivalent is emitted as a result of composting a waste stream.
Assume the tonnes of disposable production for plastics and paper are PL and PA, respectively. With different ways of disposal, the ratios of CO2e to PL and PA are expressed in the following equations according to Reference [22],
It can be seen from Equations (2) and (3) that except the ratio of CO2e related to the landfill of waste, the other values are identical, and they can be expressed as the same ratio, RC = 21.8. Therefore, the ratios for disposal are expressed as,
In terms of CO2 equivalent, the methods of disposal for the clinical lab wastes are divided into two types, which are the landfill method and the other methods. Setting the percentages of handling the waste by the landfill for plastics and paper as pPL and pPA, the values of CO2e for plastics and paper are derived as,
This means that the specific ratios are given for the waste handled by landfill, while the remaining parts that are processed by other methods are calculated with the common ratio RC.
Combining Equations (1) and (5), the model of the CO2 equivalent for a clinical lab can be obtained as,
With Equation (6), the problem of calculating the carbon footprint of a clinical laboratory is converted to the problem of calculating the corresponding environmental impact indicators, which are the electricity consumption, gas usage, water consumption, and disposable production.
3. Environmental Impacts of Clinical Lab Tests
During a particular type of clinical lab test, a variety of clinical lab instruments are used. According to the specific operating characteristics of each instrument, the corresponding environmental effects are different. In this section, a global model of clinical lab test will be established to express electricity consumption, gas usage, water supply, and disposable production.
With the ultimate target of calculating the CO2 equivalent CO2e in a clinical laboratory, the environmental impact indicators need to be obtained according to the operational processes of clinical lab tests. Apart from the impacts produced by the operation of clinical lab instruments as mentioned in the previous subsection, the operation of the components of a basic lab infrastructure cannot be neglected.
Each test can be regarded as the overall operating processes of different clinical lab instruments. In order to correctly model a specific clinical lab testing process, the rates of electricity, gas, water consumption (P, G, W) and operating time (t) of each instrument should be used as the parameters or variables. In addition, the weights of wasted plastics and paper (PL, PA) are denoted as the parameters for each test, as the same disposable materials are used during the whole process of each test.
Assume that there are l types of tests in the lab, and each type of test is implemented for d times in a working day. The categories of clinical lab instruments are n, and assume that the number of a particular kind of instrument used is m. Moreover, the operating time of each instrument t varies according to the specific requirements. By taking all these factors into consideration, the environmental impact indicators can be calculated as,
It is noted that the value of m is determined by the types of tests and instruments, where the corresponding values of g and i are used to obtain a unique mgi. The subscript c indicates the variables related to clinical lab instruments, meaning that the effects from the basic lab infrastructures are not included at this stage. In Equation (8), the value of d is decided by the type of test l. The time tc is defined as the equivalent operating time of all the clinical lab instruments. The total weights of plastics and paper produced are only related to the operation of the clinical lab instruments, hence the subscript c is not applicable in Equation (8).
For the basic lab infrastructures, the HVAC system, lights, and computers all consume electrical power. Among them, the HVAC system also requires the supply of gas and water to operate. The electricity, gas, and water consumed by the basic lab infrastructures can be derived as,
where the subscripts b, HVAC, light, and com respectively represent the variables related to the operation of basic lab infrastructures, the HVAC system, lights, and computers. The values of the operating time in Equation (9) are the equivalent values, as the exact operating time is indicated in the expressions with more details of these pieces of equipment.
For the HVAC system, as mentioned previously, the main components to be considered are the cooling coil, heating coil, FAU, and FCU. Assume the numbers of types for these components are n1, n2, n3 and n4, and the quantities of them are m1, m2, m3, and m4. In addition, assume there are n5 and n6 types of lights and computers, respectively, with the corresponding quantities of m5 and m6. Therefore, detailed expressions for the environmental impact indicators related to the basic lab infrastructures can be achieved, as shown below.
Since the quantities for different types of a specific component are different, the value of m is determined by the product type of infrastructure. The subscripts CC, HC, FAU, FCU, L, and CO represent the variables related to the cooling coil, heating coil, FAU, FCU, light, and computer.
4. Indoor Environment Modeling
During working hours, the indoor environment of the clinical laboratory should be comfortable enough for the staff to implement the lab tests. According to Reference [9], the human comfort requirements during occupied periods are given as,
where Ta is the indoor air temperature, H is the indoor humidity, CO2 indicates the indoor CO2 concentration, and I is the illuminance. In addition, during unoccupied periods (break time or off time), there is no need to control the indoor illuminance. Although looser requirements are presented for indoor air temperature, humidity, and CO2 concentration, reasonable ranges should be kept to make sure the required level can be achieved swiftly when working time approaches.
Before illustrating the system dynamics of the clinical lab indoor environment, several assumptions need to be made to simplify the model: (1) The indoor temperature, humidity, CO2 concentration are uniform; (2) the temperature of the interior wall Tw is uniform; (3) the indoor air mass remains unchanged; (4) only the heat production in clinical lab tests is considered. The system dynamics in Reference [9] are used as the basis for the indoor environment modeling.
The indoor air temperature at time (k + 1) is determined by the following factors at time k.
- The heat generation by the occupants, heating/cooling coils, lights, computers, and lab tests;
- The heat exchange between the interior wall and indoor air;
- The heat exchange between the outdoor air and indoor air;
- The heat provided by the air ventilation equipment;
- The heat in the remaining indoor air.
According to the energy conversion principle for the indoor air in the clinical lab, the following equation is derived:
where ma is the mass of air, O is the number of occupants in the lab, Qg is the heat generated per person, and Qt is the heat produced by lab tests. S represents the switching function of the lab test, whose value equals 1 when the corresponding test is being implemented, otherwise it equals 0. hoi and hwi represent the heat convection coefficient between the outdoor and indoor air, and between the interior wall and indoor air. Aoi and Awi are respectively the contacting area between the outdoor and indoor air (windows), and that between the interior wall and indoor air. Cp represents the air-specific heat, and F is the air flow rate. The subscripts fa, aFCU and nv indicate the fresh air, air in FCU, and natural ventilation.
Equation (14) is used to calculate the thermal energy converted at the time point (k + 1) by taking the heat produced by the occupants, heating/cooling coils, lights, computers, and lab tests at time point k into account. In addition, the heat transferred from the outdoor environment to the indoor one by walls, air flow, the HVAC system, and natural ventilation are considered.
The dynamics of indoor air humidity and that of indoor CO2 concentrations are not affected by lab tests in this paper, and therefore the models in Reference [9] are directly applied without modifications.
where Hg, Ha, and Ho represent the humidity generation rate per person, and the indoor and outdoor humidity, respectively. It can be seen from Equation (15) that the mass conversion of indoor air humidity is only related to the number of occupants and the operation of the HVAC system and natural ventilation, which is also applicable to the expression for the mass conversion of indoor CO2 concentration, as is shown in Equation (16).
5. Case Study
In order to investigate the carbon footprint model for a clinical laboratory, the clinical lab in Alder Hey Children’s Hospital in Liverpool, UK [23] is taken as a case study. In this paper, the test carried out by using the Biochrom 30+ amino acid analyzer [24] in the clinical lab is taken into account to calculate the corresponding CO2 equivalent. The details of the investigated system are shown in Table 1, and the power rating of each module is displayed in Table 2.
There is only one method to run on the system, and 15 h are used for running the method over a 24-h period. The corresponding submodules should be active within these 15 h. However, there are some exceptions. For instance, the freezer has to be on for 24 h for sample storage. Additionally, some of the modules may be turned off for a while when they are not in use during the operation process of the method. Therefore, the overall electricity consumption by the system is likely to be minimized by optimizing the operation of each module. In addition, the gas usage per day is 3 L, while water consumption and waste production is not monitored by the lab. In this case, the key contributors to the CO2 equivalent are the electricity consumption and gas usage.
On top of the instruments used for lab tests, the electricity consumption by the HVAC and lighting systems cannot be neglected. According to Reference [25], the daily average electricity consumption by HVAC systems in non-residential buildings in the European Union (EU) is 11.03 W/m2, while the daily maximum electricity consumption by HVAC systems reaches 25.4 W/m2. For the lighting system, in order to get the same light intensity of 88 Ft candles, the power ratings of a 90 W incandescent bulb and a 90 LED are 59 W and 9 W, respectively [26]. For a 6 × 12 m laboratory with a ceiling height of 3.5 m, the electrical load of the lighting system is 7W/m2 for incandescent bulbs to obtain the average horizontal illuminance of 460 lx [27]. Therefore, to derive the same lighting effect, at least 9 incandescent or LED lights should be installed. As the area of the laboratory is 6 × 12 m = 72 m2, the average power rating of the HVAC system is 11.03 × 72 × 10−3 = 0.7942 kW.
According to the questionnaire from Alder Hey, the Biochrom 30+ amino acid analyzer physiological system is never turned off, while the system is used only for 15 h per day or night. Although the freezer should be on for 24 h, the other modules can be shut down when the analysis process is not ongoing. Besides, it takes 70 to 100 min for result reporting, which means that the printer is used for 70 to 100 min during each batch of analysis process.
For the operation of basic facilities such as the HVAC and lighting systems, the corresponding electricity consumption and CO2 equivalent generation can also be reduced. As the physiological system only operates for 15 h/24-h periods, the HVAC system operating time can be cut down to 16 h, leaving 1 h for the indoor environmental indicators to achieve the required level for the test. In addition, the incandescent bulbs can be replaced by LED bulbs to save energy. Assume the lights are always on during the analysis process. There are 5 scenarios to be investigated:
- (1)
- Scenario 1: All the modules in the physiological system and the HVAC system are on for 24 h, and the incandescent bulbs are on for 15 h.
- (2)
- Scenario 2: The freezer is on for 24 h, with the other modules in the physiological system on for 15 h; the HVAC system is on for 24 h; the incandescent bulbs are on for 15 h.
- (3)
- Scenario 3: The freezer is on for 24 h, and the printer is on for 100 min, while the other modules in the physiological system are on for 15 h; the HVAC system is on for 24 h; the incandescent bulbs are on for 15 h.
- (4)
- Scenario 4: The freezer is on for 24 h, and the printer is on for 100 min, while the other modules in the physiological system are on for 15 h; the HVAC system is on for 16 h; the incandescent bulbs are on for 15 h.
- (5)
- Scenario 5: The freezer is on for 24 h, and the printer is on for 100 min, while the other modules in the physiological system are on for 15 h; the HVAC system is on for 16 h; the incandescent bulbs are replaced by LED bulbs, and they are on for 15 h.
5.1. Operation with the Average HVAC System Power Rating
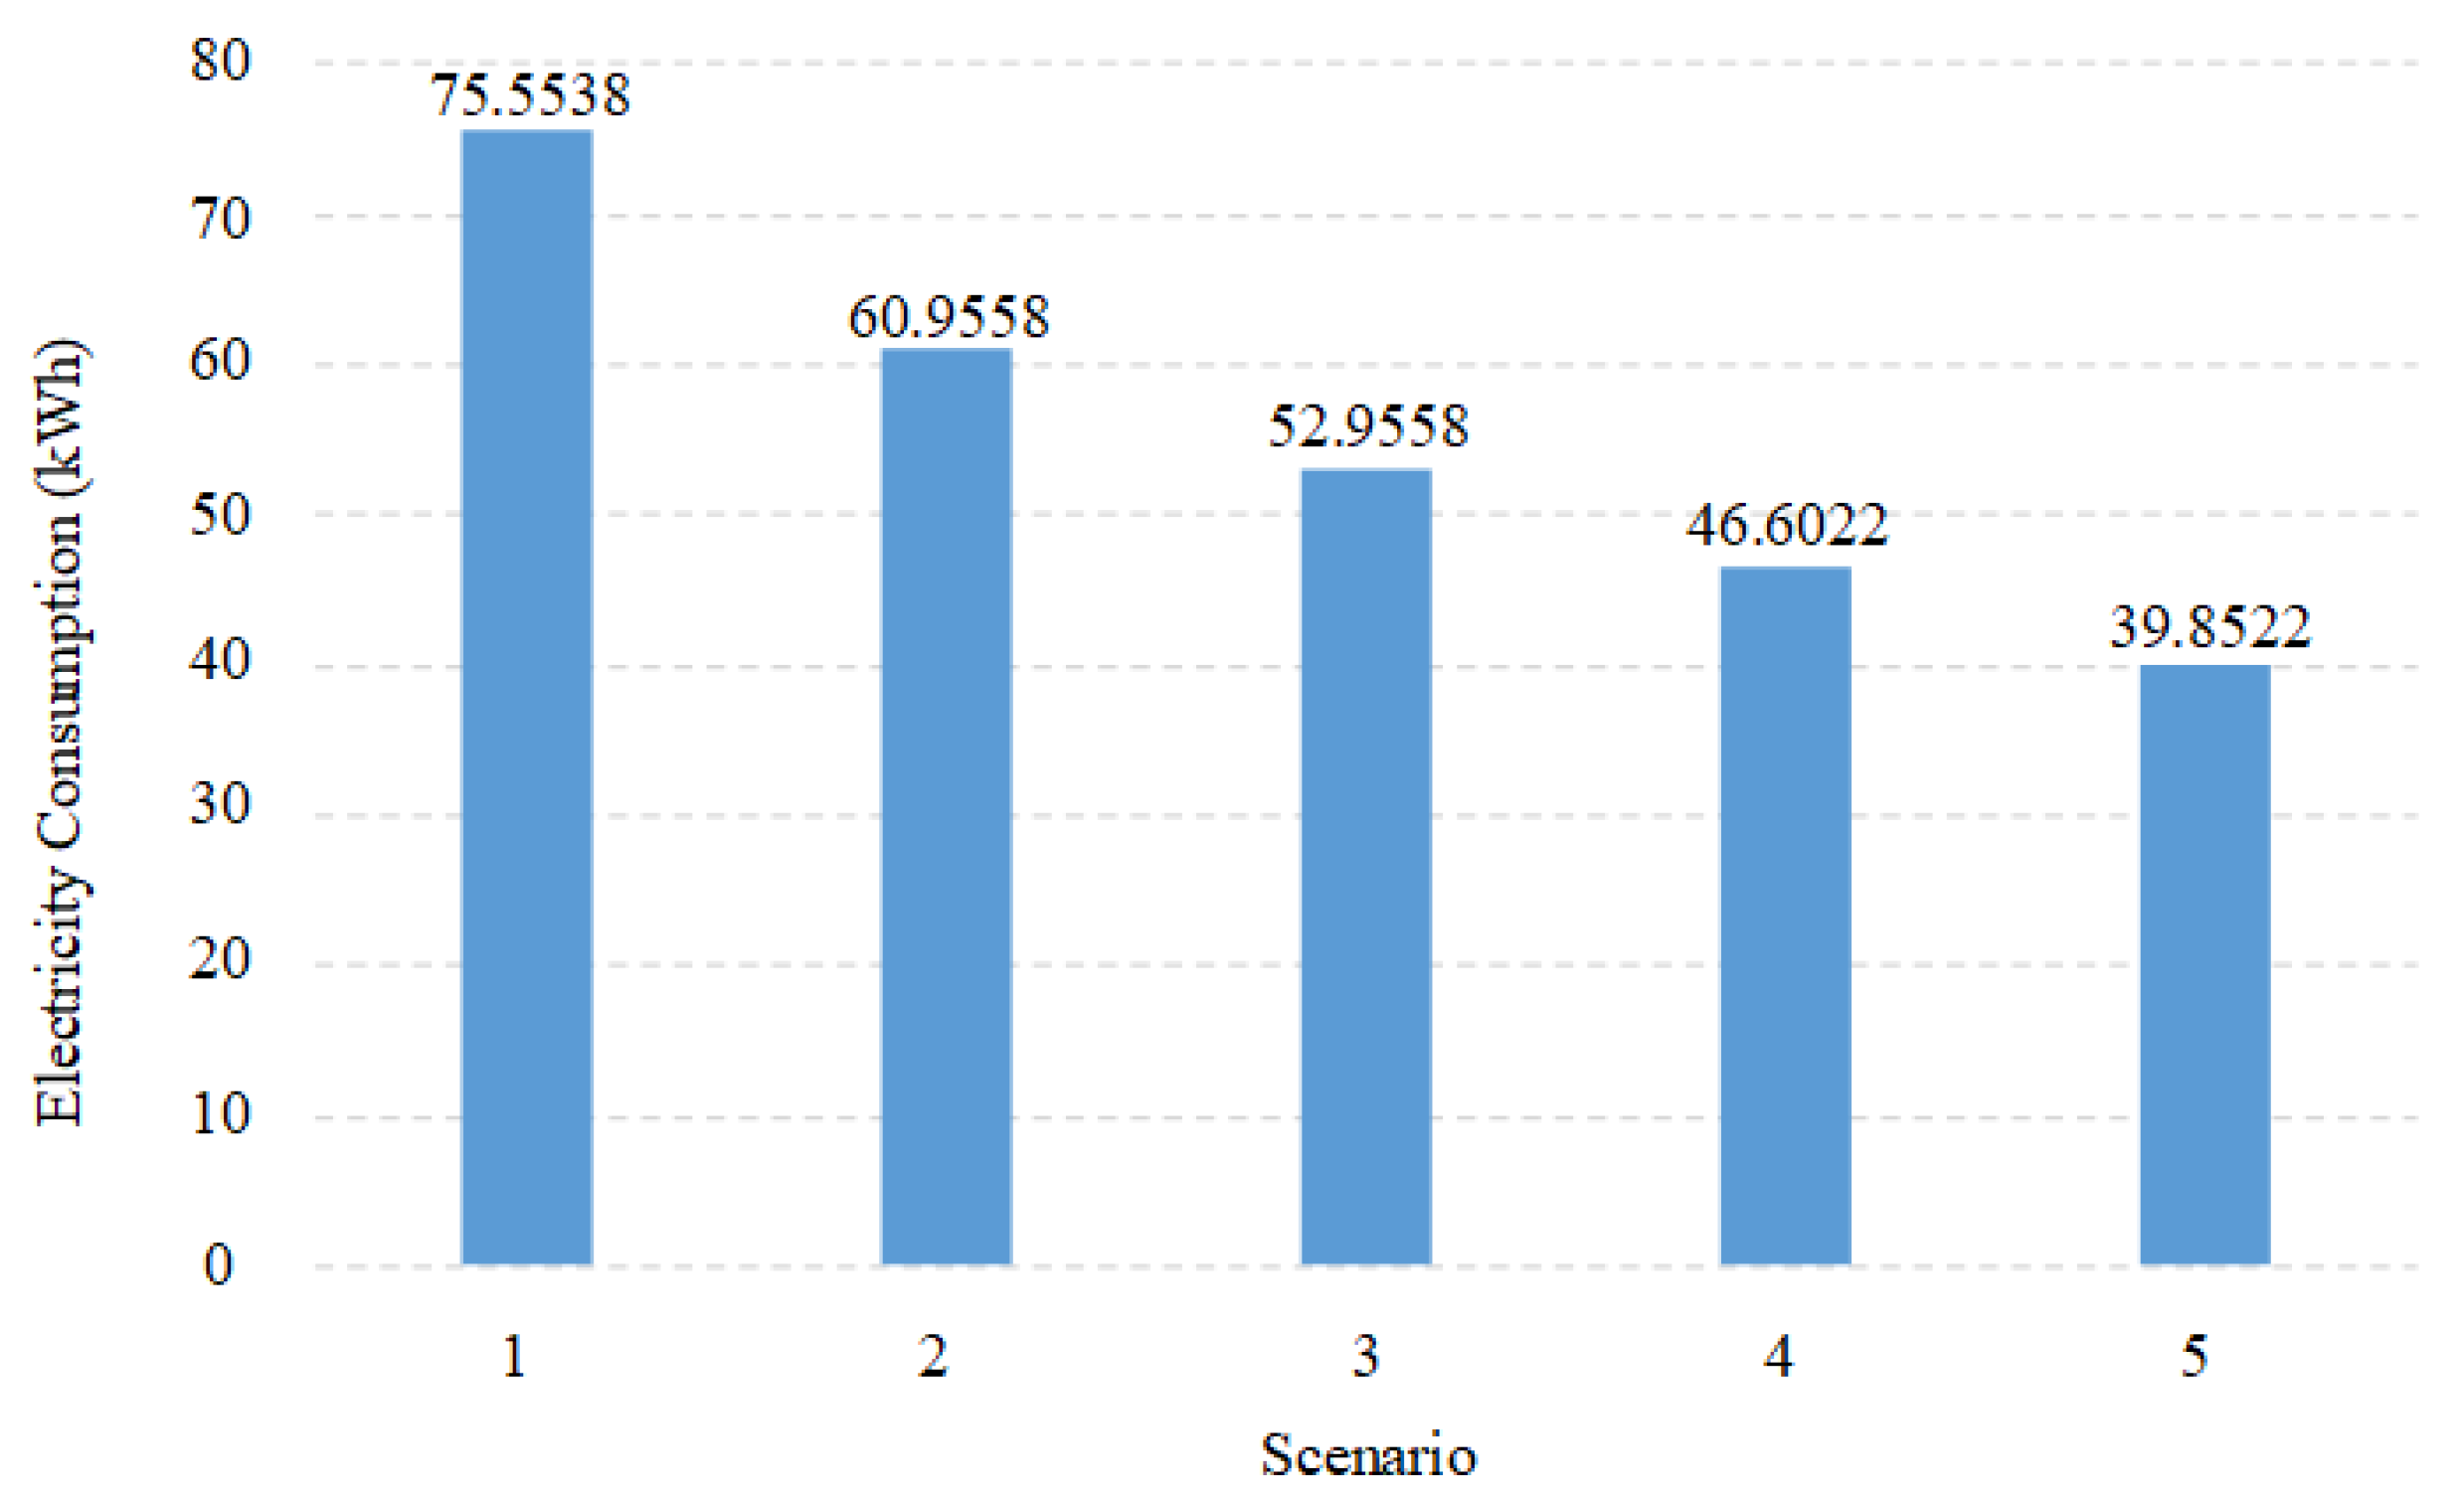
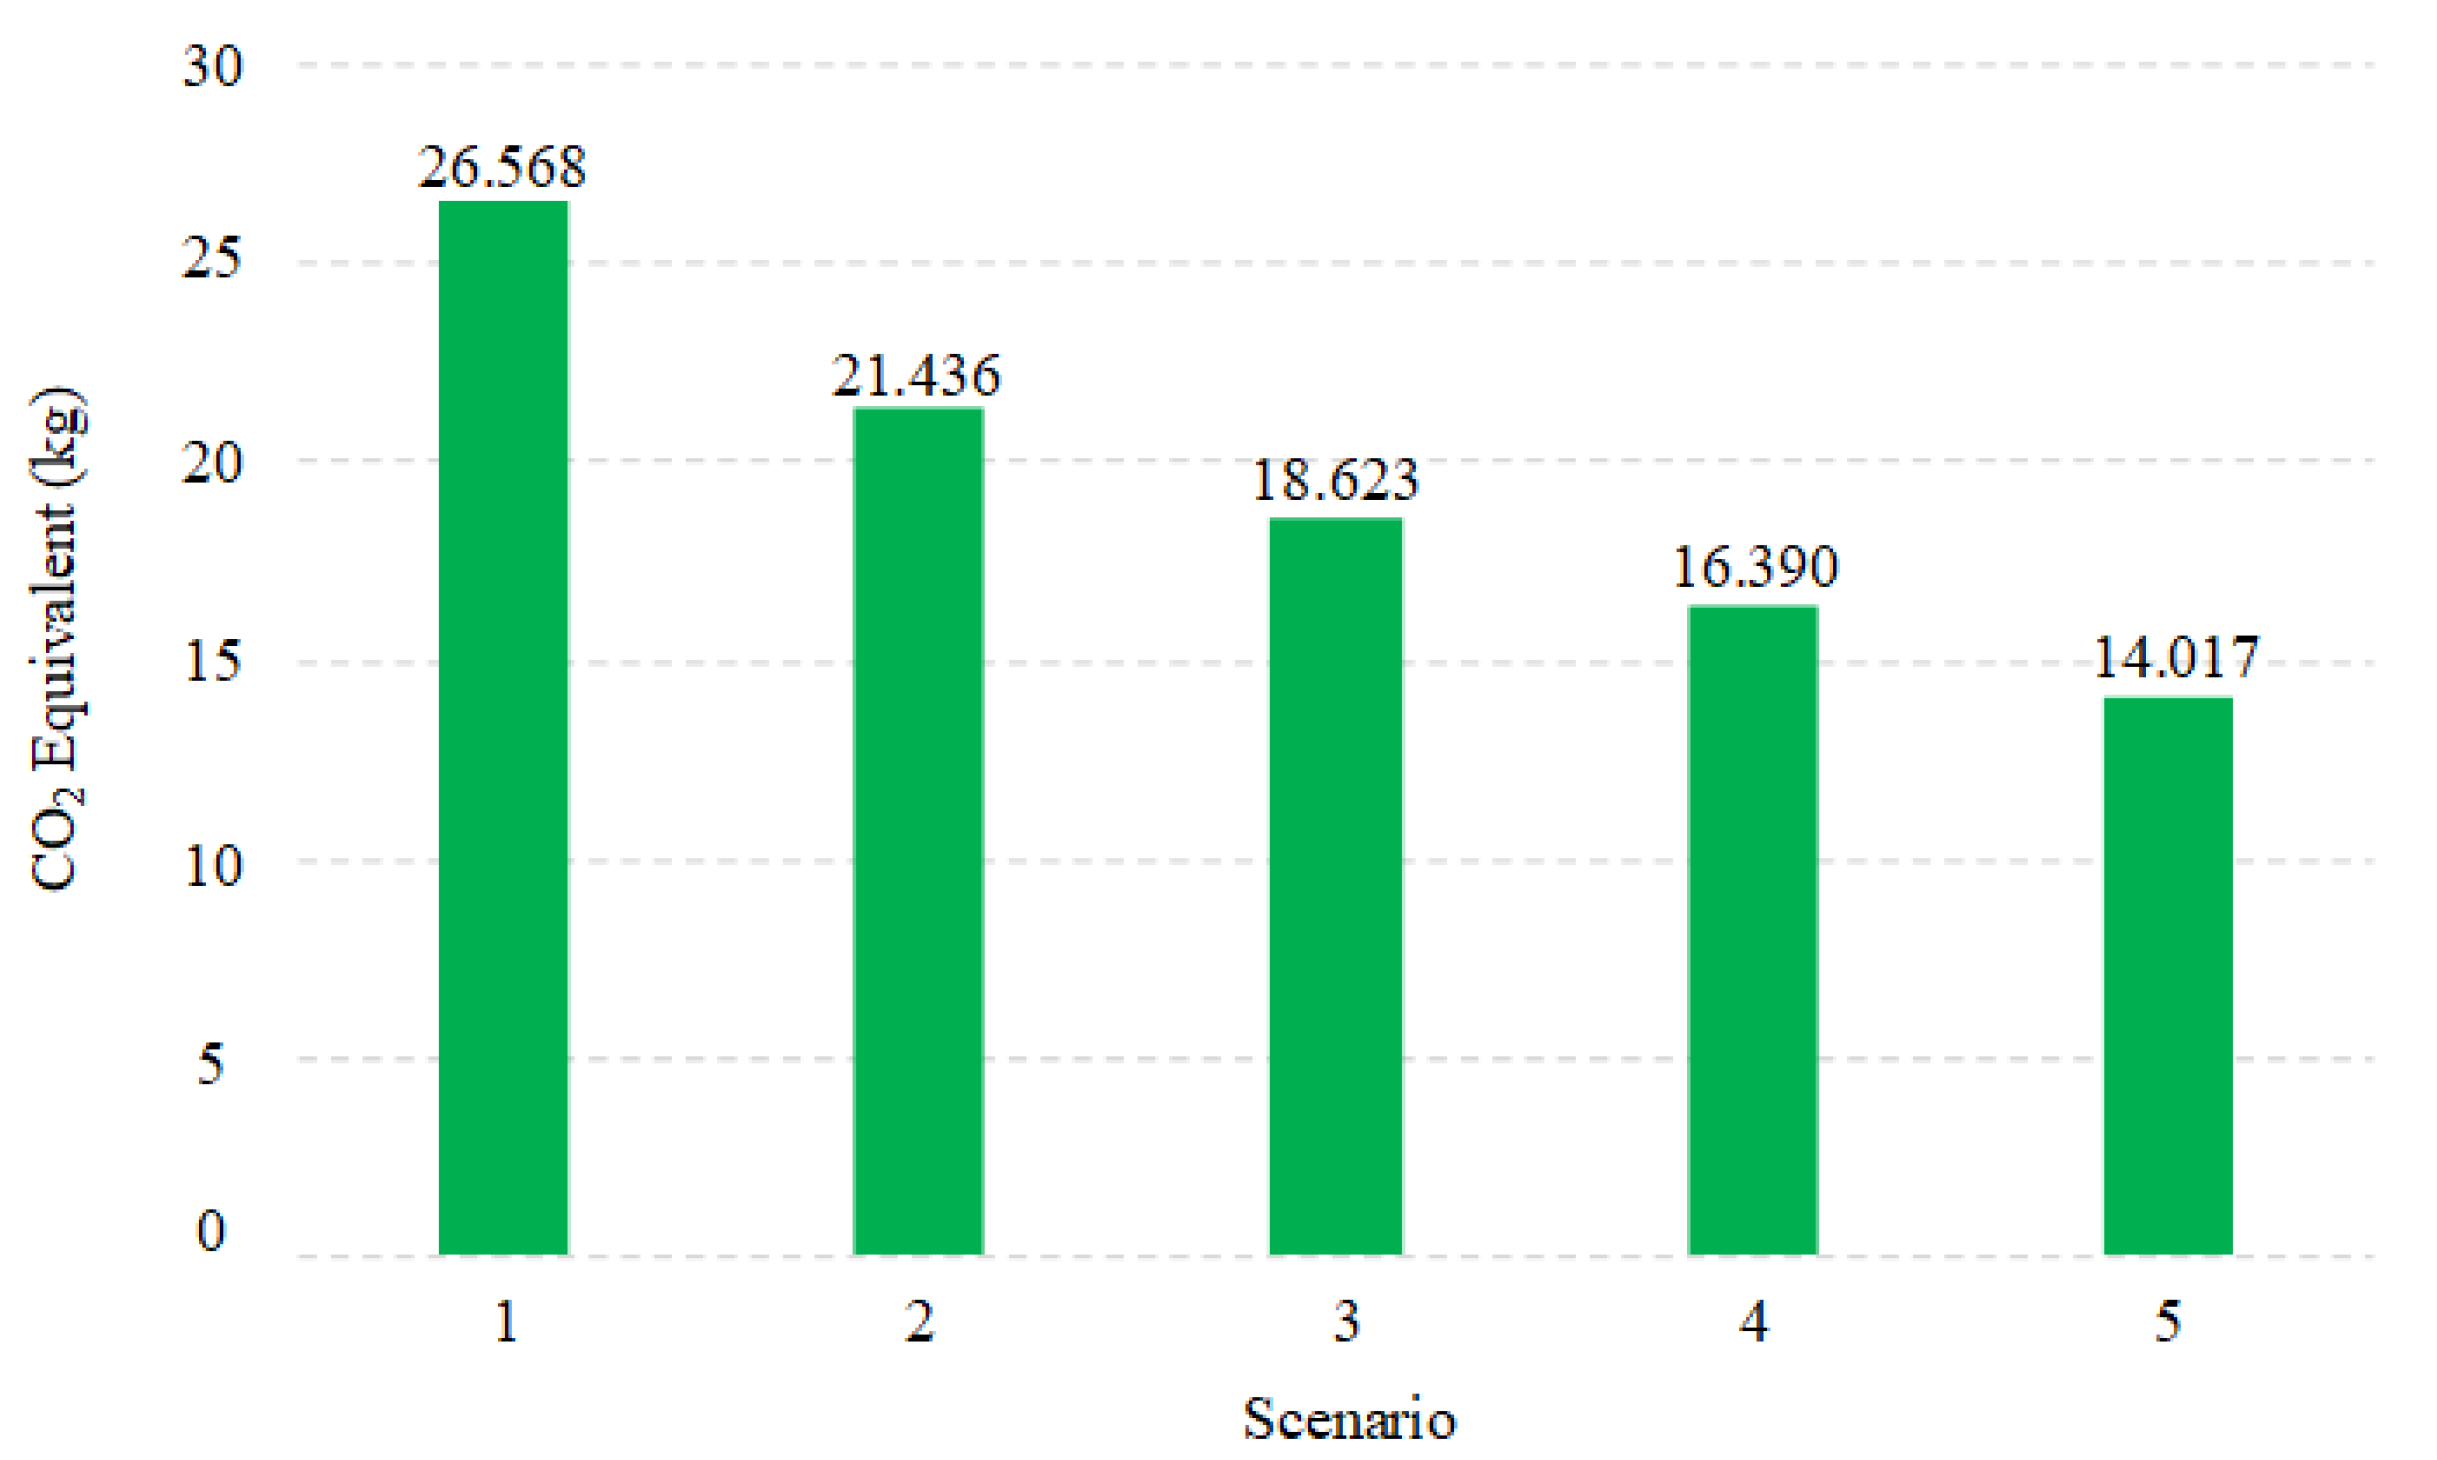
The daily electricity consumption and CO2 equivalent production for the clinical lab Biochrom 30+ amino acid analyzer physiological system with the average power rating for the HVAC system are displayed in Figure 2 and Figure 3, respectively.
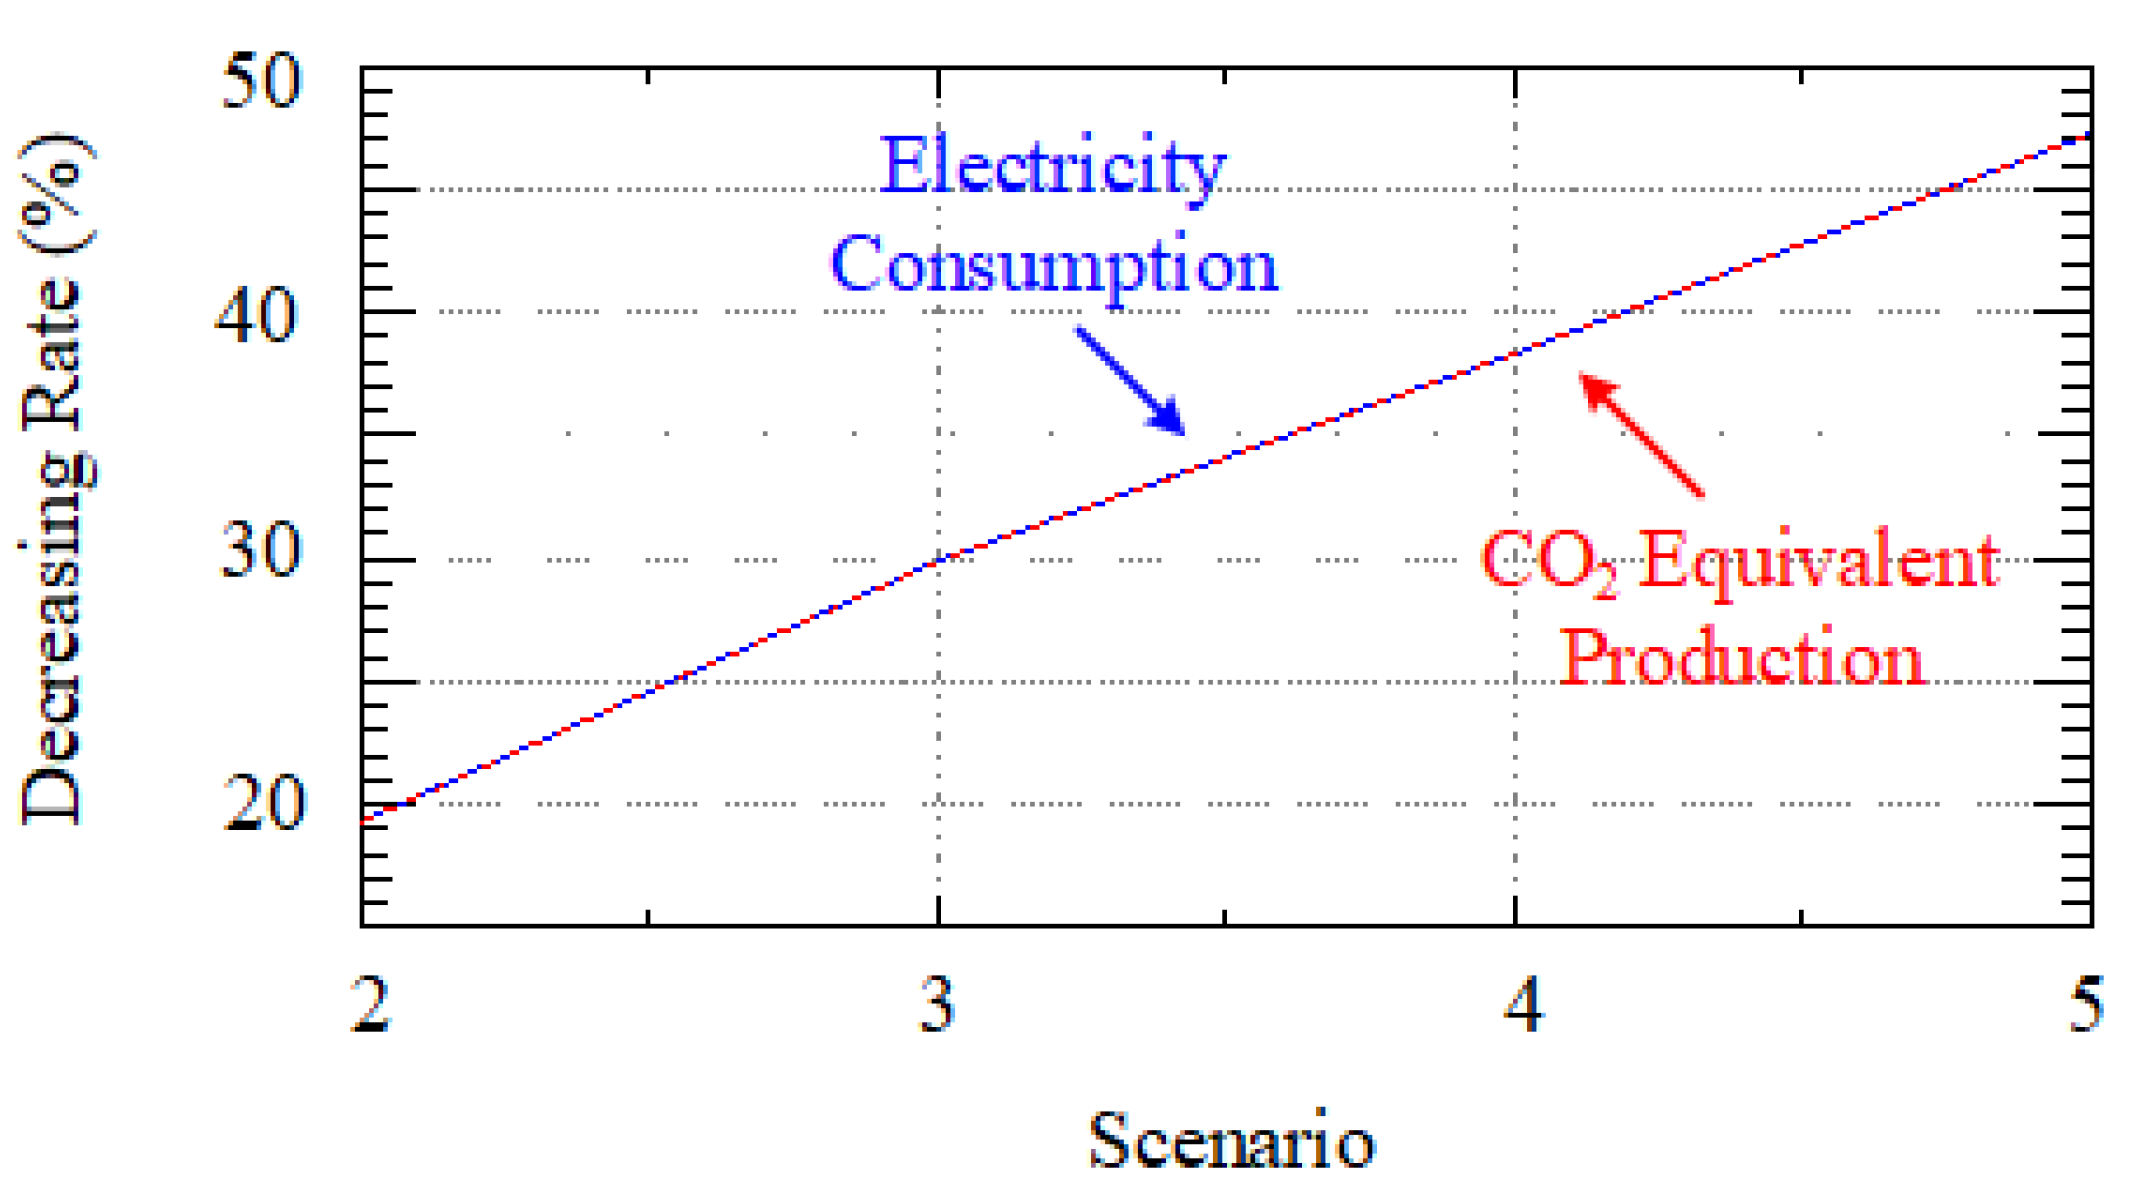
It can be seen from Figure 2 that the decreasing rates of the electricity consumption of the Biochrom 30+ amino acid analyzer physiological system for Scenarios 2–5 with respect to Scenario 1 are 19.32%, 29.91%, 38.32% and 47.25%, respectively. The corresponding values of the CO2 equivalent production of the Biochrom 30+ amino acid analyzer physiological system for Scenarios 2–5 with respect to Scenario 1 are 19.32%, 29.90%, 38.31% and 47.24%, respectively. As water usage and waste production are not taken into account, and the contribution of gas usage is negligible compared with the electricity consumption, the trends of variation in the decreasing rate are almost the same for electricity consumption and the CO2 equivalent production. The trends of decreasing rates variation for the two indicators are shown in Figure 4.
It can be seen that when the analysis process of the physiological system is optimized by minimizing the on-time for each module, around 30% of CO2 equivalent production can be saved. Furthermore, with the operation time of the HVAC minimized and the LED bulbs used for lighting systems, approximately another 20% of environmental impact can be mitigated.
5.2. Operation of the System by Considering the Influence of Climate
When the location of the clinical lab is taken into account, the local climate is a critical factor that influences the operation of the HVAC system, thus updating the electric power consumption profile and ultimately changing the CO2 equivalent production from the clinical lab. In this paper, the adjustment of indoor human comfort is realized by the implementation of HVAC system. The heat and humidity generation by people and instruments are not taken into account in this study since they are negligible compared to the heat and humidity produced during the operation process of the HVAC system.
Alder Hey Children's Hospital is located in Liverpool, UK, and the average climate data in October in Liverpool [28] is used for evaluating the electricity consumption of the clinical lab. Next, the corresponding effects on the change of the CO2 equivalent production will be observed. In order to compare the environmental impacts produced for the cases in which the clinical lab is located in different places, the average climate data in October in Athens [29] is also applied for the performance evaluation. The average climate data in October for Liverpool and Athens are displayed in Table 3.
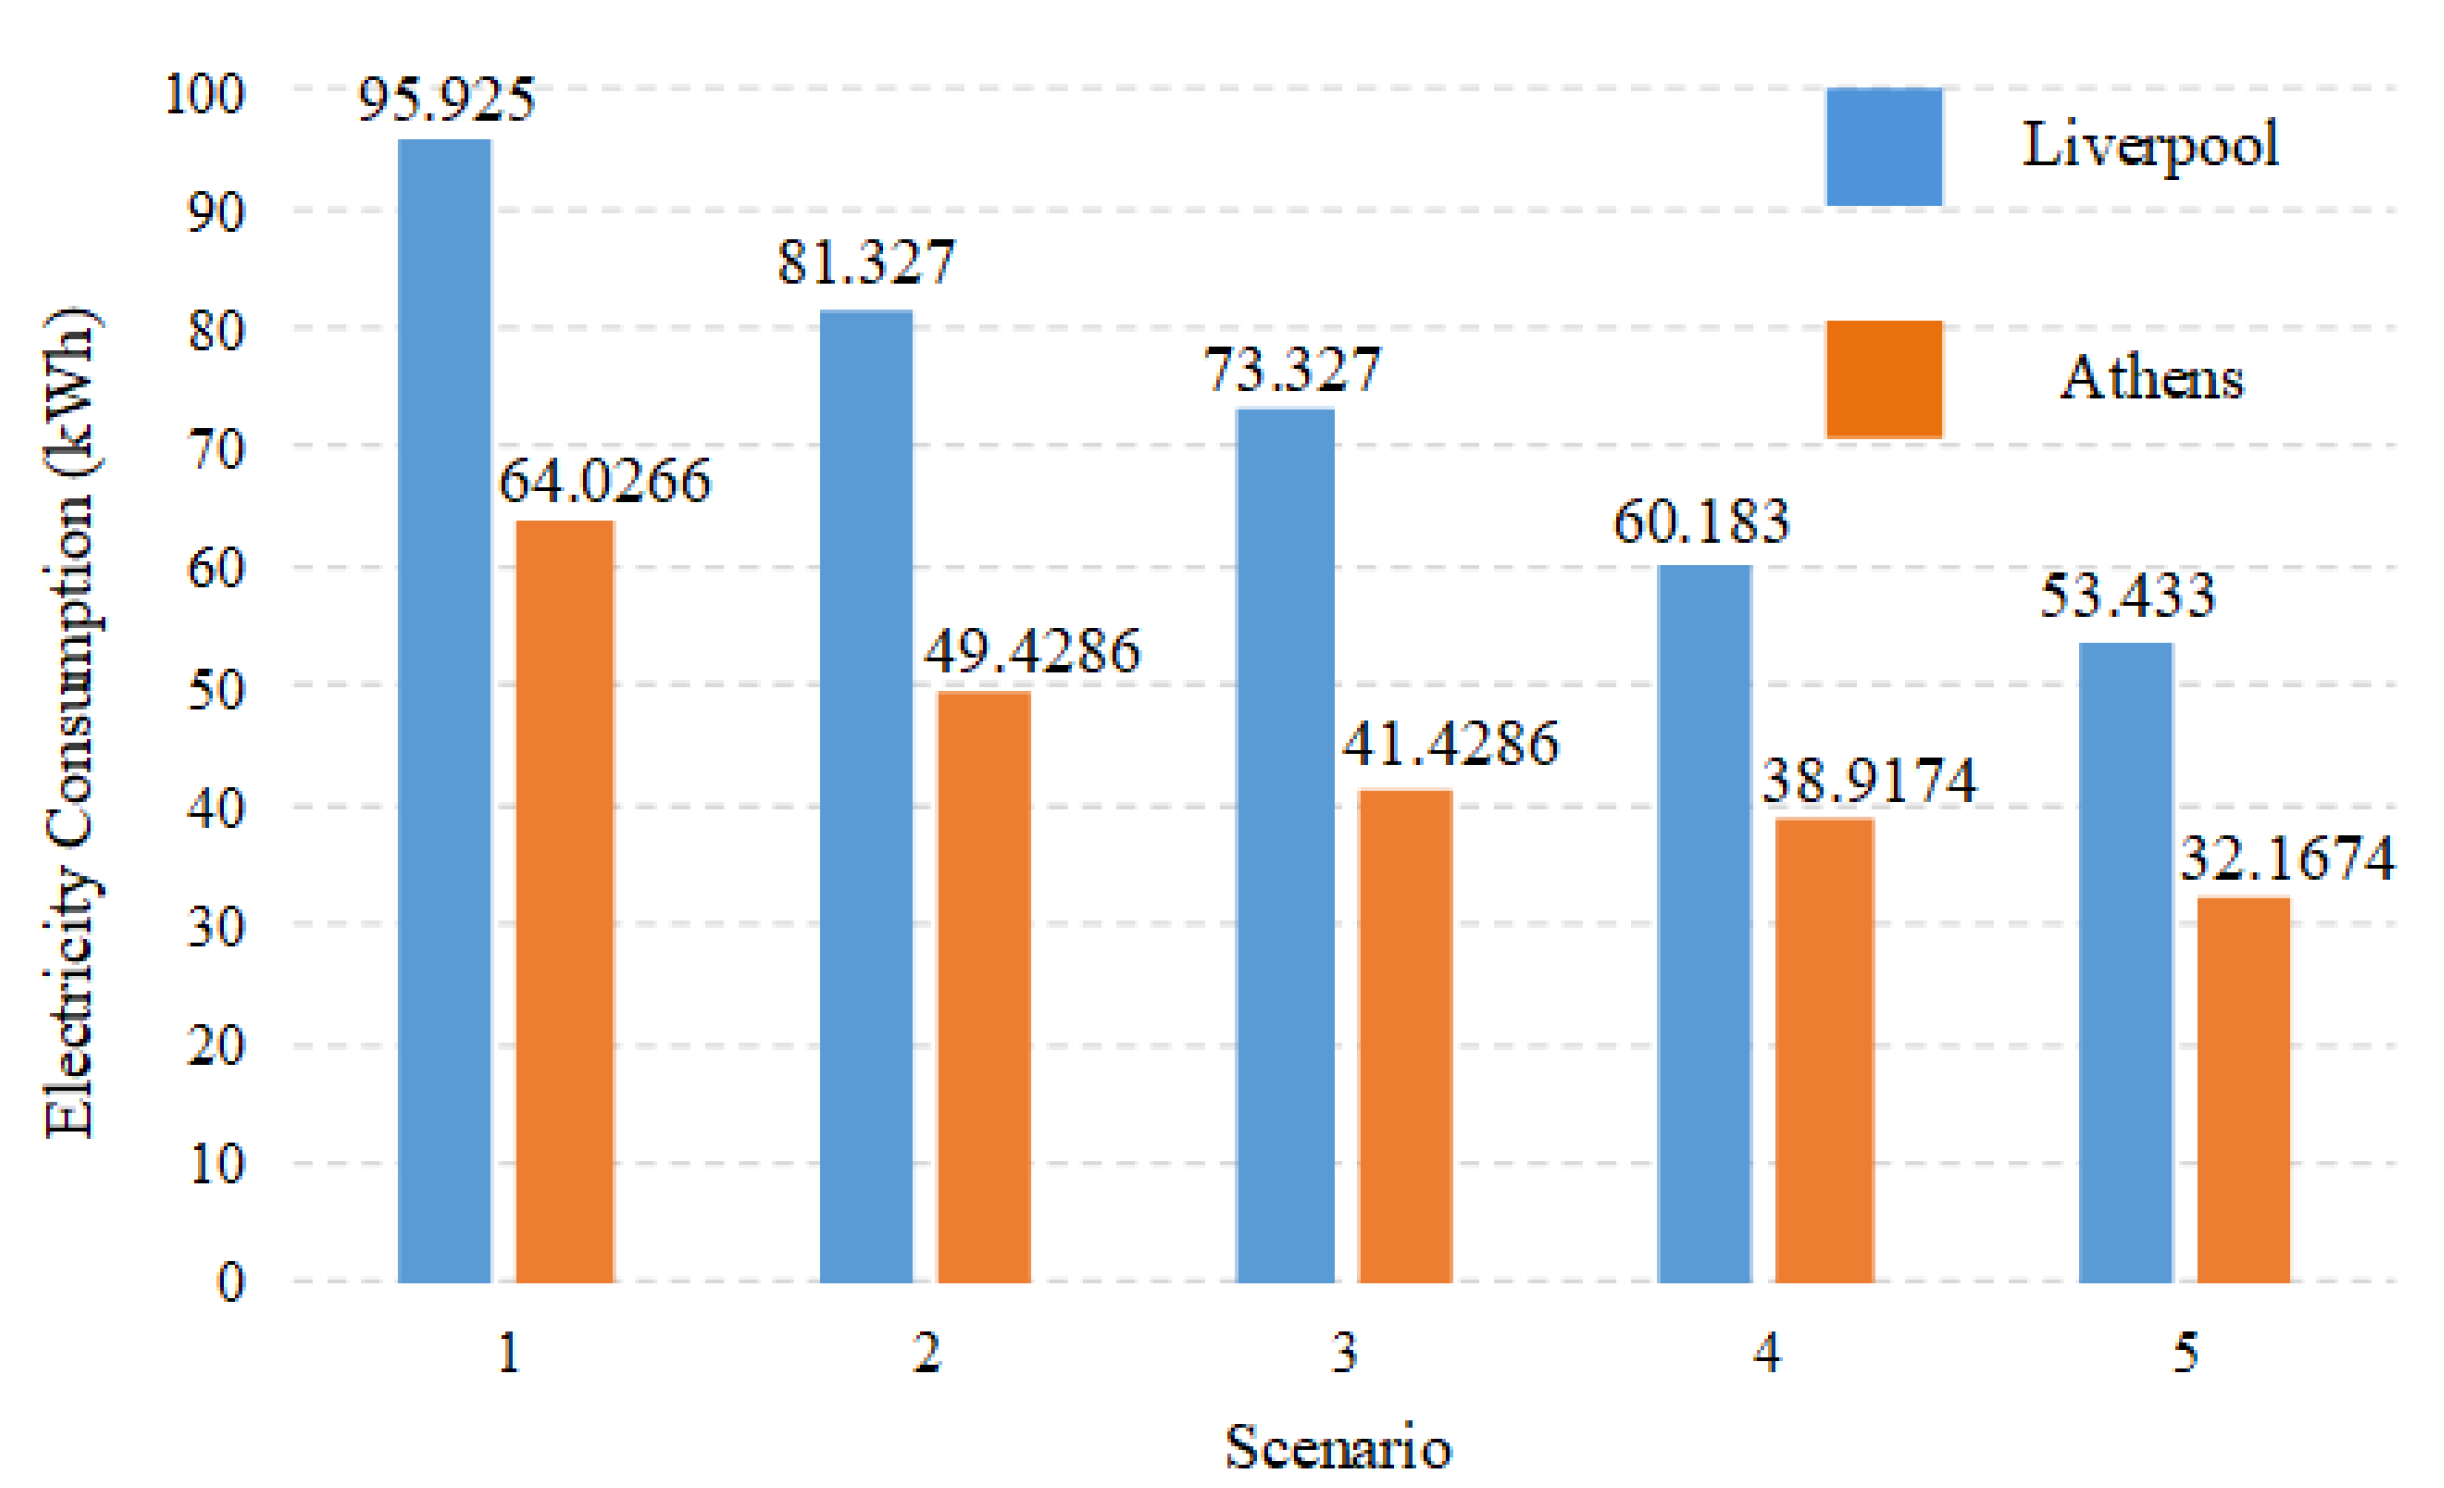
In this study, only the mean temperature and humidity for each city are applied for analysis, and the ventilation for attaining the required level of CO2 concentration is not considered for model simplification. In October, the mean temperatures in both Liverpool and Athens are below the lower limit (22 °C) of the comfortable indoor temperature range, while the mean humidity values are both above the upper limit (60%). Therefore, the cooling coils do not work. It can be seen that the climate indicators in Athens in October almost cater to the indicators for human comfort, and the electricity consumption for the HVAC system is greatly decreased in this case. The daily electricity consumption of the clinical lab Biochrom 30+ amino acid analyzer physiological system is displayed in Figure 5 for the cases of Liverpool and Athens in October.
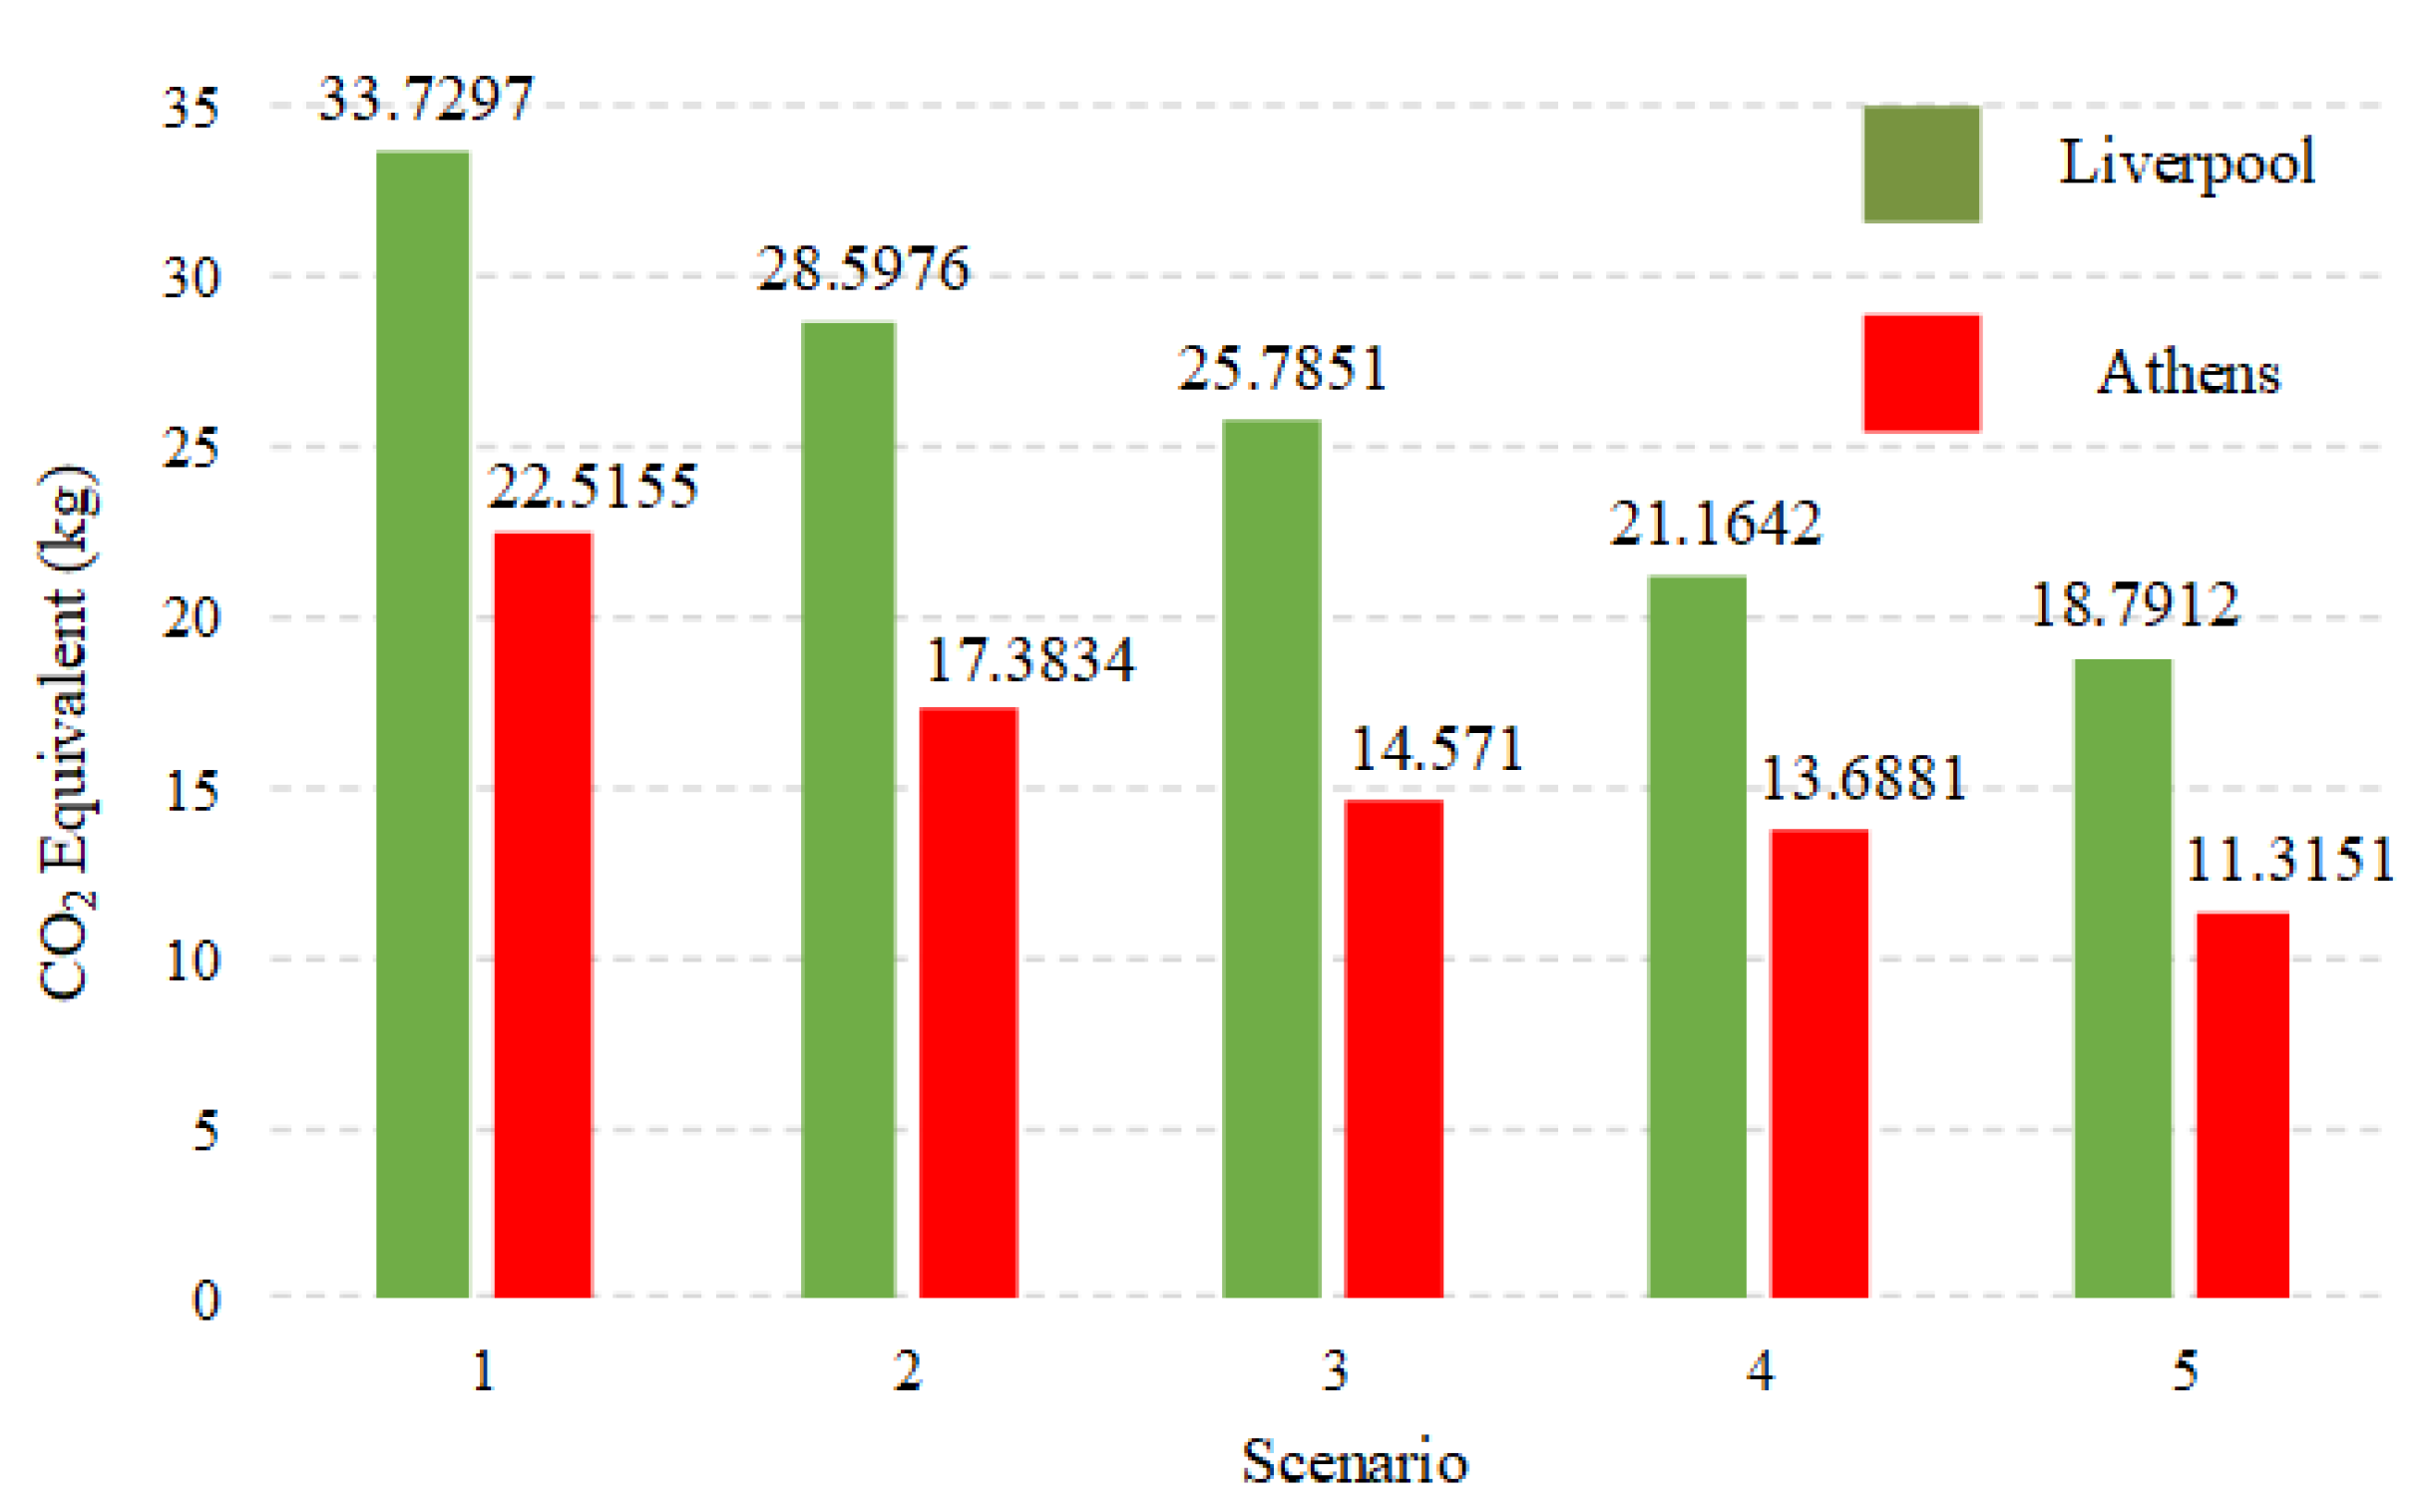
From Figure 5, it can be seen that in order to meet the indoor human comfort requirements in Equation (13), the electricity consumption for the clinical lab in Liverpool is much higher than that in Athens, in the case of October. For scenarios 1–5, the values of electricity consumption in the clinical lab in Athens are 66.75%, 60.78%, 56.50%, 64.67%, and 60.20% of those in Liverpool. According to the conversion factors in the UK [22], the corresponding CO2 equivalent produced can be derived in Figure 6 for these two different climates. Note that the climate in Athens is only taken as an example for the analysis of results, while the conversion factors are UK-based.
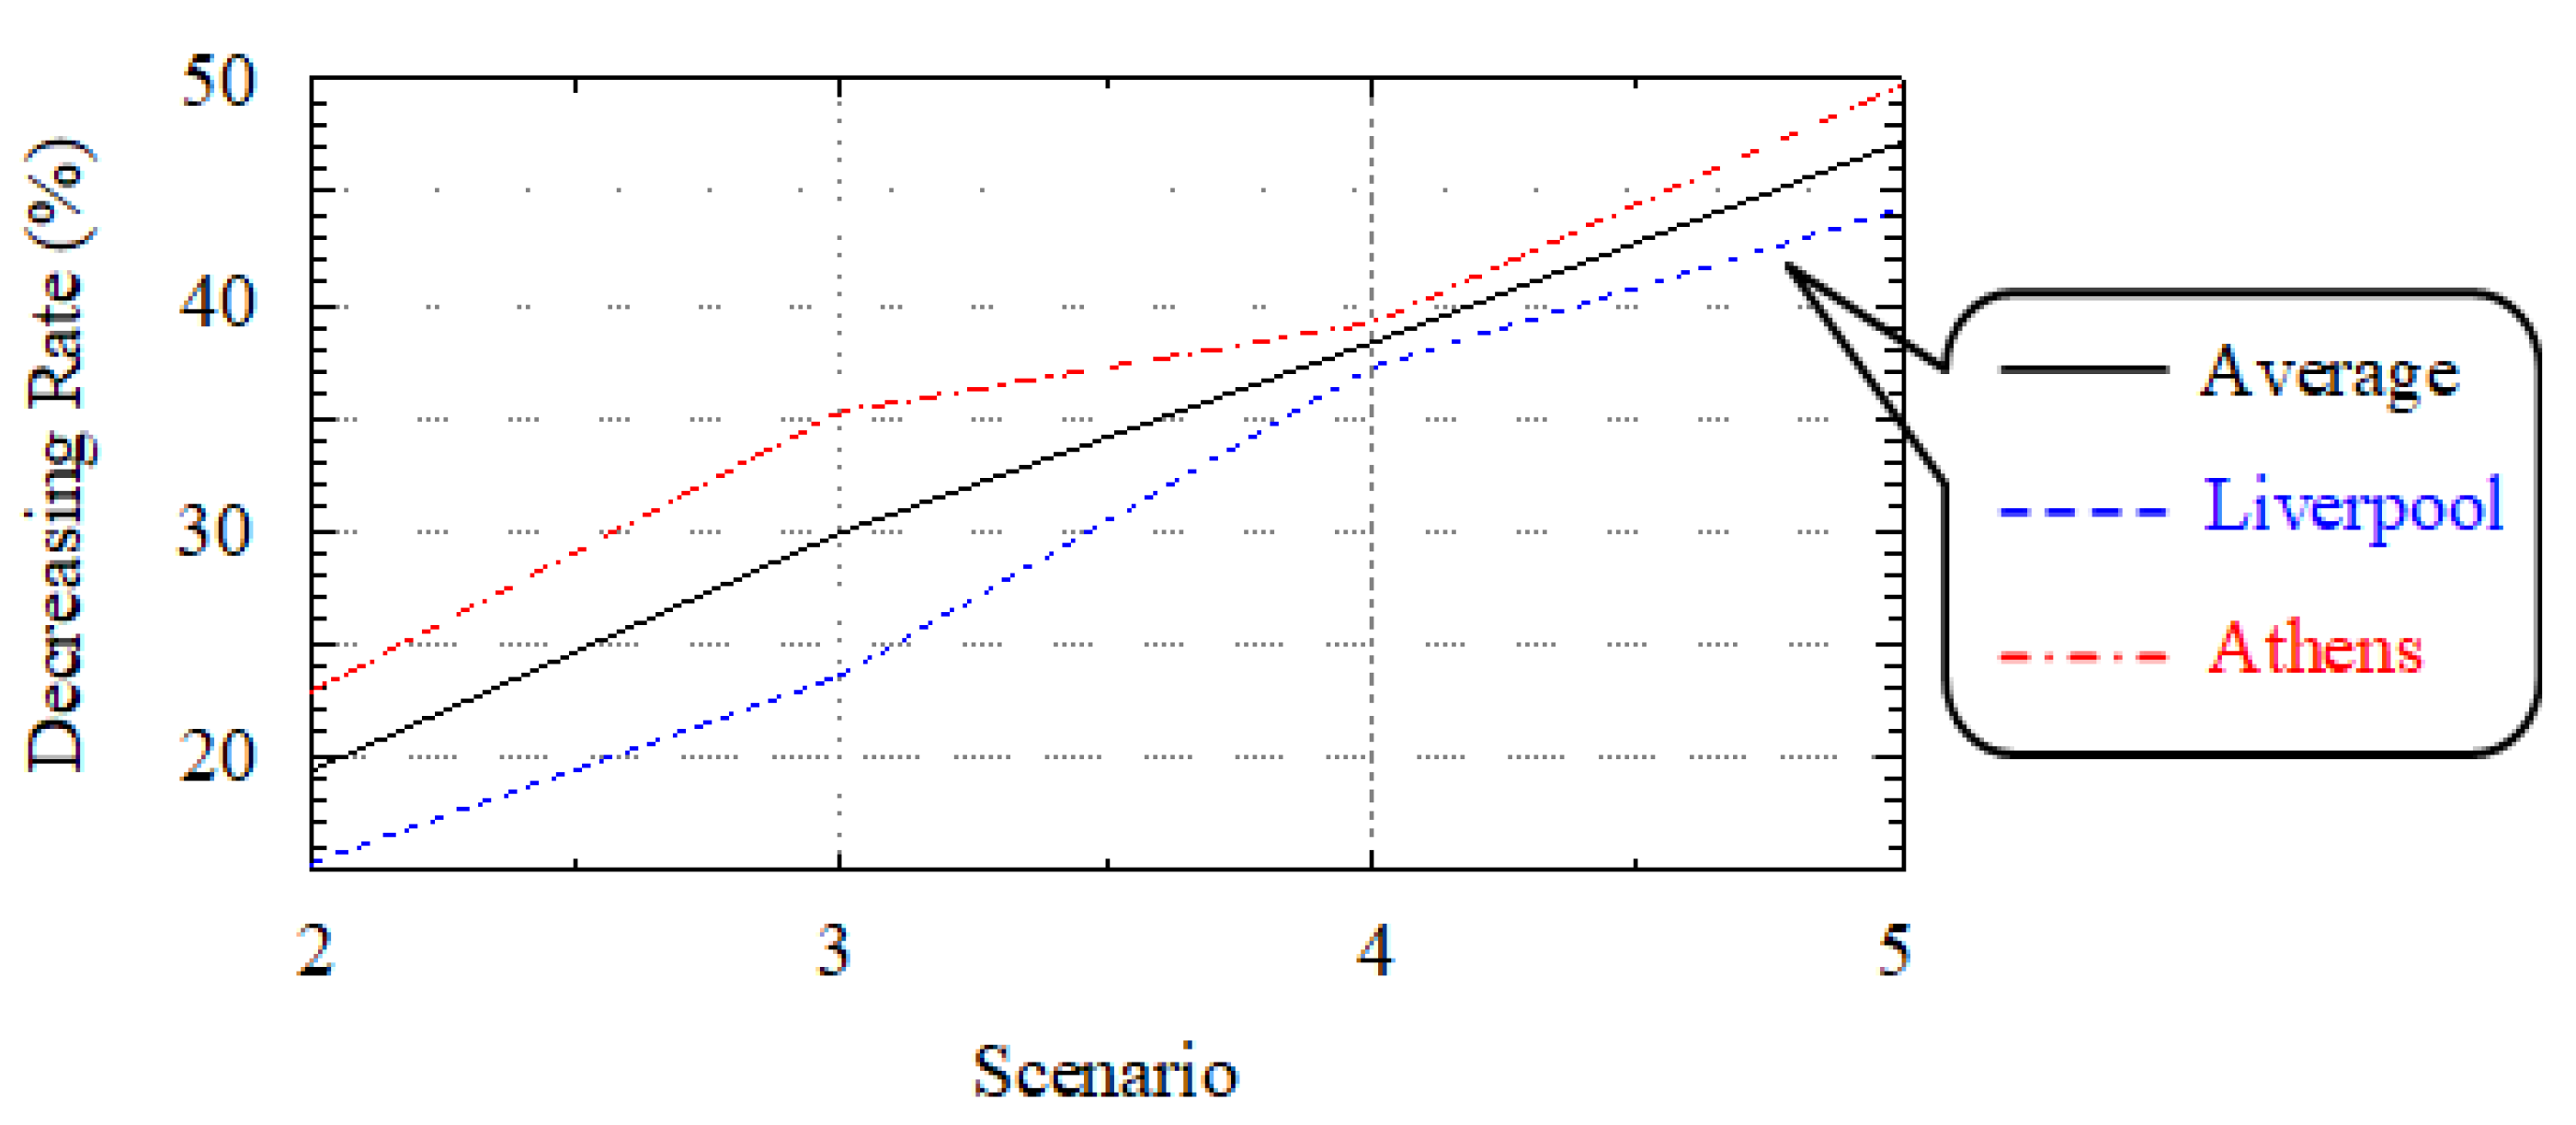
For the CO2 equivalent, the ratios for the Athens case are 66.75%, 60.79%, 56.51%, 64.68%, and 60.21% to the Liverpool case for scenarios 1–5, respectively. This proves again that the CO2 equivalent production from the clinical lab is strongly related to the lab electricity consumption. According to Figure 5 and Figure 6, the decreasing rates of the CO2 equivalent production of the Biochrom 30+ amino acid analyzer physiological system for Scenarios 25 with respect to Scenario 1 are 15.22%, 23.56%, 37.25%, and 44.29% for the Liverpool case, and 22.79%, 35.28%, 39.21% and 49.75% for the Athens case. The trends of decreasing rates of variation of the CO2 equivalent production for the average, Liverpool, and Athens cases are displayed in Figure 7.
From Figure 7, it is observed that with the reduction in the proportion of electricity consumption for the HVAC system, the decreasing rate of CO2 equivalent production when applying Scenarios 2–5 increases.
6. Conclusions
In this paper, the carbon footprint model of a clinical laboratory is established based on the CO2 equivalent production. The contributors to the environmental impacts produced from a clinical lab are the electricity, water, gas consumption, and waste production. According to different operating times and instruments used for different types of tests, the detailed calculation processes for the consumption of energy resources are presented. Two categories of waste are considered, which are the plastics and paper, and the disposal methods are divided into landfill and the other methods. With the environmental effects of the HVAC and lighting systems taken into consideration, the overall CO2 equivalent model is derived. Moreover, the indoor environment is modeled. A case study for the Biochrom 30+ amino acid analyzer physiological system in Alder Hey Children’s Hospital is carried out, and the numerical results demonstrate that the overall environmental impact can be reduced by approximately 50% by fully optimizing the operation of the clinical lab instruments and basic facilities simultaneously. Furthermore, the climate data in Liverpool and Athens in October are used to investigate the effects of climate on the energy behavior of the clinical lab, and it was found that the CO2 equivalent production decreasing rate by applying Scenarios 2–5 can be increased if the proportion of electricity consumption for the HVAC system is reduced.
Author Contributions
Conceptualization, Y.H., X.Y. and H.S.A.; methodology, K.N. and H.S.A.; software, K.N.; validation, Y.H., X.Y., H.S.A. and P.G.; formal analysis, K.N. and X.Y.; investigation, K.N.; resources, X.Y., H.S.A. and P.G.; data curation, H.S.A and P.G.; writing—original draft preparation, K.N.; writing—review and editing, K.N., X.Y., H.S.A. and M.A.; visualization, K.N. and X.Y.; supervision, Y.H., X.Y. and H.S.A.; project administration, Y.H. and H.S.A.; funding acquisition, Y.H. and P.G.
Funding
This research was funded by The Low Carbon Eco-Innovatory (LCEI), grant number UoL-LCEI-045.
Acknowledgments
The authors would like to thank Alder Hey Children’s Hospital in Liverpool for answering the questionnaire on the clinical lab experiment process and the parameters for lab instruments.
Conflicts of Interest
The authors declare no conflict of interest.
Nomenclature
| P | Electricity consumption rate |
| G | Gas consumption rate |
| W | Water consumption rate |
| t | Operating time |
| R | Ratio |
| PL | Tonnes of disposable production for plastics |
| PA | Tonnes of disposable production for paper |
| OL | Open-loop |
| CL | Closed-loop |
| CB | Combustion |
| LF | Landfill |
| CP | Composting |
| C | Common value |
| l | Number of test types |
| d | Times of implementing each type of test |
| n | Categories of clinical lab instruments |
| m | Number of a particular kind of instrument |
| c | Variables related to clinical lab instruments |
| b | Variables related to basic lab infrastructures |
| CC | Cooling coil |
| HC | Heating coil |
| FAU | Fresh air unit |
| FCU | Fan coil unit |
| L | Light |
| CO | Computer |
| T | Temperature |
| H | Humidity |
| CO2 | Indoor CO2 concentration |
| I | Illuminance |
| O | Number of occupants in the lab |
| Q | Heat generation |
| A | Contacting area |
| Cp | Air specific heat |
| F | Air flow rate |
| fa | Fresh air |
| nv | Natural ventilation |
References
- Lopez, J.B.; Jackson, D.; Gammie, A.; Badrick, T. Reducing the Environmental Impact of Clinical Laboratories. Clin. Biochem. Rev. 2017, 38, 3–11. [Google Scholar] [PubMed]
- Lopez, J.B.; Badrick, T. Proposals for the mitigation of the environmental impact of clinical laboratories. Clin. Chem. Lab. Med. 2012, 50, 1559–1564. [Google Scholar] [CrossRef] [PubMed]
- Kadı, D.; Kuvvetli, Y.; Çolak, S. Performance analysis of a university hospital blood laboratory via discrete event simulation. Simulation 2016, 92, 473–484. [Google Scholar] [CrossRef]
- Lopez, J.B.; Hoyaranda, E.; Priatman, I. The first green diagnostic centre and laboratory building in Indonesia. J. Int. Fed. Clin. Chem. Lab. Med. 2016, 27, 84–87. [Google Scholar]
- MEDYA DIAGNOSTIC CENTER Clinical Laboratory Test List 2015-2016. Available online: http://medyadc.com/Docs/MDC%20public%20test%20list%202015-2016.pdf (accessed on 9 November 2018).
- Du, Y.F.; Jiang, L.; Duan, C.; Li, Y.Z.; Smith, J.S. Energy Consumption Scheduling of HVAC Considering Weather Forecast Error Through the Distributionally Robust Approach. IEEE Trans. Ind. Inf. 2018, 14, 846–857. [Google Scholar] [CrossRef]
- Khan, Y.; Khare, V.R.; Mathur, J.; Bhandari, M. Performance evaluation of radiant cooling system integrated with air system under different operational strategies. Energy Build. 2015, 97, 118–128. [Google Scholar] [CrossRef] [Green Version]
- Afroz, Z.; Shafiullah, G.M.; Urmee, T.; Higgins, G. Modeling techniques used in building HVAC control systems: A review. Renew. Sustain. Energy Rev. 2018, 83, 64–84. [Google Scholar] [CrossRef]
- Sun, B.; Luh, P.B.; Jia, Q.S.; Jiang, Z.; Wang, F.; Song, C. Building Energy Management: Integrated Control of Active and Passive Heating, Cooling, Lighting, Shading, and Ventilation Systems. IEEE Trans. Autom. Sci. Eng. 2013, 10, 588–602. [Google Scholar]
- Berardi, U.; Anaraki, H.K. The benefits of light shelves over the daylight illuminance in office buildings in Toronto. Indoor Built Environ. 2016, 27, 244–262. [Google Scholar] [CrossRef]
- Jia, H.; Pang, X.; Haves, P. Experimentally-determined characteristics of radiant systems for office buildings. Appl. Energy 2018, 221, 41–54. [Google Scholar] [CrossRef]
- Al-Masrani, S.M.; Al-Obaidi, K.M.; Zalin, N.A.; Isma, M.A. Design optimisation of solar shading systems for tropical office buildings: Challenges and future trends. Sol. Energy 2018, 170, 849–872. [Google Scholar] [CrossRef]
- Oldewurtel, F.; Sturzenegger, D.; Morari, M. Importance of occupancy information for building climate control. Appl. Energy 2013, 101, 521–532. [Google Scholar] [CrossRef]
- Fanger, P.O. Thermal Comfort, Analysis and Applications in Environmental Engineering; Danish Technical Press: Copenhagen, Denmark, 1970. [Google Scholar]
- Fanger, P.O. Assessment of man’s thermal comfort in practice. Br. J. Ind. Med. 1973, 30, 313–324. [Google Scholar] [CrossRef] [PubMed]
- Fanger, P.O.; Ipsen, B.M.; Langkilde, G.; Olessen, B.W.; Christensen, N.K.; Tanabe, S. Comfort Limits for Asymmetric Thermal Radiation. Energy Build. 1985, 8, 225–236. [Google Scholar] [CrossRef]
- Fanger, P.O.; Toftum, J. Extension of the PMV model to non-air-conditioned buildings in warm climates. Energy Build. 2002, 34, 533–536. [Google Scholar] [CrossRef]
- Wang, Y.; Kuckelkorn, J.; Zhao, F.Y.; Liu, D.; Kirschbaum, A.; Zhang, J.L. Evaluation on classroom thermal comfort and energy performance of passive school building by optimizing HVAC control systems. Build. Environ. 2015, 89, 86–106. [Google Scholar] [CrossRef]
- Esmaeilzadeh, A.; Zakerzadeh, M.R.; Koma, A.Y. The comparison of some advanced control methods for energy optimization and comfort management in buildings. Sustain. Cities Soc. 2018, 43, 601–623. [Google Scholar] [CrossRef]
- Fang, J.; Feng, Z.; Cao, S.J.; Deng, Y. The impact of ventilation parameters on thermal comfort and energy-efficient control of the ground-source heat pump system. Energy Build. 2018, 179, 324–332. [Google Scholar] [CrossRef]
- Satyavada, H.; Baldi, S. An integrated control-oriented modelling for HVAC performance benchmarking. J. Build. Eng. 2016, 6, 262–273. [Google Scholar] [CrossRef] [Green Version]
- Government, U. Greenhouse Gas Reporting: Conversion Factors 2017. 2017. Available online: https://www.gov.uk/government/publications/greenhouse-gas-reporting-conversion-factors-2017 (accessed on 8 August 2018).
- Alder Hey Children’s NHS Foundation Trust. Available online: https://alderhey.nhs.uk/ (accessed on 26 August 2018).
- Biochrom. Biochrom 30+ Series of Amino Acid Analyzers—Biochrom 30+ Amino Acid Analyzer Physiological System. 2018. Available online: http://www.biochrom.co.uk/product/5/biochrom-30+-amino-acid-analyzer-physiological-system-.html (accessed on 26 August 2018).
- Knight, I. Power demands of heating, ventilation and air conditioning components in EU Buildings. REHVA J. 2014, 20–23. [Google Scholar]
- Einsporn, J.A.; Zhou, A.F. The “Green Lab”: Power Consumption by Commercial Light Bulbs. Phys. Teach. 2011, 49, 365–367. [Google Scholar] [CrossRef]
- Tulla, A. Design Clinic: Three Ways to Light a Laboratory. 2015. Available online: http://luxreview.com/design-clinic/2015/06/three-ways-to-light-laboratories (accessed on 26 August 2018).
- Climate & Weather Averages in Liverpool, England, United Kingdom. 2018. Available online: https://www.timeanddate.com/weather/uk/liverpool/climate (accessed on 31 October 2018).
- Climate & Weather Averages in Athens, Greece. 2018. Available online: https://www.timeanddate.com/weather/greece/athens/climate (accessed on 31 October 2018).
Figure 1.
The relationship between clinical lab testing process and the CO2 equivalent.

Figure 2.
Electricity consumption of the Biochrom 30+ amino acid analyzer physiological system with the average HVAC system power rating.
Figure 2.
Electricity consumption of the Biochrom 30+ amino acid analyzer physiological system with the average HVAC system power rating.

Figure 3.
The CO2 equivalent production of the Biochrom 30+ amino acid analyzer physiological system with the average HVAC system power rating.
Figure 3.
The CO2 equivalent production of the Biochrom 30+ amino acid analyzer physiological system with the average HVAC system power rating.

Figure 4.
Decreasing rates of electricity consumption and CO2 equivalent production for different scenarios to scenario 1.
Figure 4.
Decreasing rates of electricity consumption and CO2 equivalent production for different scenarios to scenario 1.

Figure 5.
Electricity consumption of the Biochrom 30+ amino acid analyzer physiological system with the HVAC system power ratings for Liverpool and Athens in October.
Figure 5.
Electricity consumption of the Biochrom 30+ amino acid analyzer physiological system with the HVAC system power ratings for Liverpool and Athens in October.

Figure 6.
The CO2 equivalent production of the Biochrom 30+ amino acid analyzer physiological system with the HVAC system power ratings for Liverpool and Athens in October.
Figure 6.
The CO2 equivalent production of the Biochrom 30+ amino acid analyzer physiological system with the HVAC system power ratings for Liverpool and Athens in October.

Figure 7.
Decreasing rates of CO2 equivalent production for different scenarios to scenario 1 for the average, Liverpool, and Athens cases.
Figure 7.
Decreasing rates of CO2 equivalent production for different scenarios to scenario 1 for the average, Liverpool, and Athens cases.


Table 1.
Details of Biochrom 30+ amino acid analyzer physiological system.
| Instrument Type | Biochrom 30+ Amino Acid Analyzer |
| Instrument Vendor | Biochrom |
| Model | Biochrom 30+ |
| Age in years: | 3 |
| Instrument Control Software (Name and Version) | BioSys v3.0 |
| Data Analysis Software (Name and Version) | EZChrom Elite |
| Instrument connected to the host system (LIMS) | No |
| Biochrom 30+ Amino Acid Analyzer | |
| Module | Specification |
| Detector | 2x UV/vis (440 nm and 570 nm) |
| Pump | Dual Piston Pump (2x) |
| Column | PEEK |
| Oven | Peltier Heating and Cooling |
| Autosampler | 84 position autosampler |
| PC and Monitor | |
| Printer | |
Table 2.
Power ratings of the modules in Biochrom 30+ amino acid analyzer physiological system.
| Module | Power Rating (W) |
|---|---|
| Analyzer | 300 |
| Desktop PC | 100 |
| Monitor | 72 |
| Printer | 600 |
| Autosampler | 250 |
| Freezer | 400 |
| Centrifuge | 300 |
© 2018 by the authors. Licensee MDPI, Basel, Switzerland. This article is an open access article distributed under the terms and conditions of the Creative Commons Attribution (CC BY) license (http://creativecommons.org/licenses/by/4.0/).
Share and Cite
MDPI and ACS Style
Ni, K.; Hu, Y.; Ye, X.; AlZubi, H.S.; Goddard, P.; Alkahtani, M. Carbon Footprint Modeling of a Clinical Lab. Energies 2018, 11, 3105. https://doi.org/10.3390/en11113105
AMA Style
Ni K, Hu Y, Ye X, AlZubi HS, Goddard P, Alkahtani M. Carbon Footprint Modeling of a Clinical Lab. Energies. 2018; 11(11):3105. https://doi.org/10.3390/en11113105
Chicago/Turabian StyleNi, Kai, Yihua Hu, Xianming Ye, Hamzah S AlZubi, Phil Goddard, and Mohammed Alkahtani. 2018. "Carbon Footprint Modeling of a Clinical Lab" Energies 11, no. 11: 3105. https://doi.org/10.3390/en11113105
Note that from the first issue of 2016, this journal uses article numbers instead of page numbers. See further details here.