On the Use of LoRa Technology for Logic Selectivity in MV Distribution Networks
by
 , , and
Leopoldo Angrisani
1,† ,
,
Francesco Bonavolontà
1,†,
Annalisa Liccardo
1,*,† and
Rosario Schiano Lo Moriello
2,† 1
Dipartimento di Ingegneria Elettrica e delle Tecnologie dell’Informazione, Università di Napoli Federico II, 80125 Naples, Italy
2
Dipartimento di Ingegneria Industriale, Università di Napoli Federico II, 80125 Naples, Italy
*
Author to whom correspondence should be addressed.
†
These authors contributed equally to this work.
Energies 2018, 11(11), 3079; https://doi.org/10.3390/en11113079
Submission received: 27 October 2018
/
Revised: 4 November 2018
/
Accepted: 6 November 2018
/
Published: 8 November 2018
(This article belongs to the Section F: Electrical Engineering)
Abstract
:In this paper, a logic selectivity system based on Long Range (LoRa) technology for the protection of medium-voltage (MV) networks is proposed. The development of relays that communicate with each other using LoRa allows for the combination of the cost-effectiveness and ease of installation of wireless networks with long-range coverage and reliability. The realized demonstrator to assess the proposed system is also presented in the paper; based on different types of faults and different locations, the times needed for clearing a fault and restoring the network were estimated from repeated experiments. The obtained results confirm that, with an optimized design of transmitted packets and of protocol characteristics, LoRa communication grants fault management that meets the criteria of logic selectivity, with fault isolation occurring within the maximum allowed time.
1. Introduction
Continuity of service, i.e., the lack of interruption in supply, is one of the most important performance indicators of electricity supply service. This is particularly crucial for medium-voltage (MV) networks, which feed industrial users that, in cases of interrupted power supply, can suffer considerable damages, such as production downtime, waste of material, and dead times required for the restoration of plant machinery [1,2].
Some actions taken by electricity distributors to increase the quality of their service involve selectivity [3]. Selectivity is the coordination between the protections of an electric line, designed to ensure that, in the event of a fault on the line, the shortest possible piece of line is powered down, limiting the number of users affected by the disservice. In MV networks, typically, selectivity is based on time lag criteria [4]. This time management implies that the fault current remains in the line for a time equal to the intervention time of the protection nearest to the fault; in the worst case, this time can be up to 20 s (the intervention time of the breaker of the primary station high-voltage (HV)/MV).
Logic selectivity, also called zone selectivity, is a selectivity approach that has been introduced in recent years with the advent of digital protections [5]. In particular, the term logic selectivity defines a system in which, in the event of a fault on the line, the coordination between protections is achieved through their communication to autonomously recognize the intervention to be carried out in order to both reduce the time necessary to eliminate the failure and minimize the portion of the electrical line to isolate the fault.
In the past, the MV grid communication infrastructure was implemented and exploited only for remote monitoring purposes; low-cost installation and low-speed solutions, such as GSM, were thus preferred. To implement logic selectivity, infrastructures able to guarantee shorter transmission times must be employed. In some areas, the electrical network is being equipped with optical fiber, which guarantees very high communication speeds, but, on the other hand, it is characterized by high installation costs.
To overcome this limitation, in this paper, the authors start from their knowledge on electrical systems [6,7,8] and analyze the possibility of using a communication platform based on LoRa technology. The term LoRa stands for Long Range and refers to a wireless communication system that combines the simplicity of installation, which is typical of wireless networks, with a high coverage range and adequate transmission speed in areas where the installation of optical fiber is inconvenient from an economic point of view [9].
The paper is organized as follows. In Section 2, the theoretical fundamentals of logic selectivity are given. In Section 4, the constraints imposed by logic selectivity approach are examined, together with the limitations of the existing communication technologies. In Section 3, the characteristics of LoRa technology are presented, and in Section 5, the feasibility of implementing logic selectivity exploiting LoRa is discussed. The demonstrator realized for the experimental assessment is presented in Section 6. In Section 7, the experimental tests carried out, according to different types of faults and different locations, and the their results are reported. Concluding remarks are discussed, finally, in Section 8.
2. Basic Concept of Logic Selectivity
Logic selectivity (or zone selectivity) is based on the interconnection and the direct exchange of messages between the protections placed along a transmission line in order to identify and isolate only the segment affected by the fault [10,11,12]. In particular, a defined number of circuit breakers (CBs) are mounted on the MV network; each CB is controlled by a protection relay (PR) which communicates with the other PRs. According to logic selectivity, each PR that detects the fault sends a blocking signal, namely, Blind, to the upstream protection, inhibiting its intervention [13].
The PR immediately upstream of the fault will not receive any blocking signals from the PR downstream of the fault, because the latter does not detect the overcurrent. Once a defined time has elapsed—referred to as the Maximum Blind Waiting time, , in the following—the PR commands the tripping of its circuit breaker and selectively isolates the faulty section. If the network topology permits the connection of the MV line to another feeder, the PR that has commanded the CB tripping also must send a Trip signal to the downstream PR and a Close signal to the breaker to establish the interconnection. This way, the powered-off section is minimized, because the line downstream of the fault is supplied by another feeder.
For the sake of clarity, Figure 1 shows the operations sequence of an example of an MV transmission network. In this section and in the rest of the paper, the devices involved in this scenario are those described in Table 1.
The network involves two radial lines, which can be interconnected through the interconnection breaker (IB), controlled by the Tie recloser (TR). On each of the two radial lines, there is a primary HV/MV substation, protected by the SR that controls the substation breaker (SB). The PRs control the CBs along the MV line. The fault management is performed according to the following steps:
- Fault detection. A fault (for example, a short circuit) in the section between PR2 and PR3 is now considered. After the detection time, SR, PR1, and PR2 recognize the fault. Without a selective protection mechanism, SR, PR1, and PR2 would command the tripping of their breakers, leaving the entire distribution line without power supply. On the contrary, according to the logic selectivity approach, SR, PR1, and PR2 do not immediately control the breaker, but they wait for the duration of the Maximum Blind Waiting time.
- Blind transmission (Figure 1b). Each PR that senses the short circuit current and detects the faulty condition sends the Blind message to the protection that is immediately upstream. So, PR1 sends the Blind message to SR and, at the same time, PR2 sends the Blind message to PR1 to prevent the tripping of the CBs.
- Tripping upstream of the fault (Figure 1c). The relays that receive the Blind message before the expiration of their Maximum Blind Waiting time (SR and PR1) leave their breakers closed. PR2 does not receive a Blind signal from PR3, which, in fact, does not detect the fault. At the end of its Maximum Blind Waiting time, PR2 commands the trip of its breaker, CB2.
- Tripping downstream of the fault (Figure 1c). PR2 also sends the Trip message to the downstream relay PR3, which commands the tripping of its breaker CB3 so that the fault is isolated. The line section from the HV/MV station up to CB2 remains powered.
- Interconnection closure (Figure 1d). PR3 sends the Close message to the boundary TR in order to close the interconnection breaker. Now the section downstream of CB3 is also powered, as it is supplied by the other HV/MV substation.
The time it takes to clear the fault depends only on the communication between two successive PRs, so it will always be the same, regardless of the section of line in which the fault occurs.
3. LoRa Technology
3.1. LoRa Bit Rate and Sensitivity
The capability of a communication system modeled as a channel corrupted by additive white Gaussian noise (AWGN) can be expressed by the parameter channel capacity C, given by:
where B is the bandwidth and S/N is the signal-to-noise ratio at the receiver. Equation (1) shows that communication reliability can be achieved, even with extremely low values of the signal-to-noise ratio, by increasing the bandwidth. This characteristic is the basis of spreading techniques, which enable the spectral density of the transmitted signal power to be brought down to below the noise floor through an enlargement of its bandwidth without power variation. The spread spectrum techniques yield different advantages, such as signal protection with respect to narrowband interference, multiple channel access, and coexistence with existing systems.
LoRa technology is based on a special spreading technique called chirp spread spectrum (CSS), which encodes the digital information of the narrowband signal to be transmitted in the phase variation of an up-chirp signal, thus generating a broadband signal [14,15]. This spreading technique is particularly efficient and simplifies the realization of the receiver; in fact, upon reception, the narrowband signal is recovered by multiplying the received broadband signal by a down-chirp, allowing demodulation with a low bit error rate (BER) and with very low signal-to-noise ratios [16,17]. This allows LoRa technology to span very high communication distances that range from 2 km in a densely populated urban environment to over 15 km in a rural environment.
In a chirp, the information of a symbol is encoded, and the number of bits that constitutes the encoded symbol is the spreading factor (SF). According to the specifications of the technology, the SF can assume integer values from 7 to 12 and, therefore, as a symbol, it can be encoded as information using a number between 7 and 12 bits. The duration of the chirp coincides with the time symbol [18]. The levels (chips) that can be distinguished in a single chirp are:
and the chips resolution is given by:
where bandwidth (BW) can be assumed to have a value equal to 150, 250, or 500 kHz. Therefore, the time symbol is:
Considering that SF bits are encoded by one symbol, then the bit rate is equal to:
Equations (5) and (6) highlight that the increase in BW causes the doubling of the bit rate , while the increment of a bit of the symbol and therefore of one unit of the SF results in its halving.
The technology allows for different combinations of SF and BW, some of which determine the pseudo-orthogonality conditions between signals [19], i.e., chirps that have different slopes in the time–frequency representation and can be transmitted simultaneously in the channel without interference. The receiver must be set to the same SF and BW values as the transmitter in order to generate the down-chirp signal that allows the extraction of the narrowband signal from the received noisy wideband signal.
LoRa modulation introduces redundancy bits that improve the robustness of the transmitted signal at the expense of the bit rate, which decreases further. So, the bit rate becomes:
where CR is the code rate and can assume an integer value ranging from 1 to 4.
In Table 2, the values of the bit rate depend on BW and SF, with CR = 1, are reported.
The lower bound of the signal-to-noise ratio (SNR) at the receiver, at which it is still possible to demodulate the LoRa signal, depends on the SF, according to the values reported in Table 3; the greater the SF, the lower the signal-to-noise ratio that must be guaranteed for reliable communications.
From the lower bound of the SNR and from the BW, the receiver sensitivity (S), expressed in dBm, can be estimated as:
where −174 is the noise floor, BW is the bandwidth, NF is the noise figure and is equal to 6 dB, and SNR is the signal-to-noise ratio limit for the specified SF. As an example, some values of sensitivity based on the values of BW and SF, with CR = 1, are reported in Table 4.
The larger the distance between the transmitter and the receiver, the smaller the signal level will be at the receiver due to the degradation of the signal in the channel; if the signal level is lower than the sensitivity S reported in Table 3, it cannot be detected by the receiver. Equation (8) shows that also the bandwidth influences the sensitivity. Therefore, as the distance between the transmitter and the receiver increases, the SF must be increased and the BW reduced to ensure suitable receiver sensitivity to obtain a reliable communication. Therefore, it can be stated that with low values of SF and maximum BW values, greater values of the bit rate, lower sensitivities, and, thus, lower achievable ranges are obtained.
As an example, a sensitivity as low as −137 dBm and an output power, , of +17 dBm results in a link budget of more than 154 dB, since the link budget (L), expressed in dB, is:
LoRa modulation is a physical layer implementation that provides significant improvement to the link budget compared to conventional narrowband modulation.
In general, the technology penalizes the throughput to obtain an advantage in terms of robustness and presents an optimal trade-off between transmission speed and communication distance.
3.2. LoRa Packet Structure
A LoRa packet consists of three elements: a preamble, an optional header, and a payload [20]. The preamble is used to allow the receiver to identify the beginning of a packet and synchronize with the transmitted data. The header provides information on the payload: its length expressed in bytes, the forward error correction code rate, and the presence of an additional 16 optional CRC (cyclic redundancy check) bits. It is worth noting that the header is optional and, in some scenarios where payload, coding rate, and CRC configuration are known, it is advantageous to eliminate it in order to reduce the transmission times.
For a given combination of SF, coding rate CR and signal bandwidth BW, the total transmission time of the LoRa packet, called , is given by:
where is the programmable length of the preamble and is given by the following formula:
where (i) PL is the length, in bytes, of the payload, (ii) IH is equal to 1 if the header is implicit, 0 otherwise, (iii) DE is set to 1 if the low data rate optimization is used, 0 otherwise, and (iv) CRC is 1 if the CRC for the payload is enabled, 0 otherwise.
As an example, in Table 5 values are shown based on values of BW and SF, with a preamble of 8.25 bytes, explicit header, CR equal to 1, a payload of 10 bytes, and enabled CRC.
As it can be easily noted, the transmission time can vary considerably from a configuration with SF = 7 and BW = 500 kHz ( = 9.28 ms) to a configuration with SF = 12 and BW = 125 kHz, characterized by transmission times of almost 1 s ( = 860.16 ms).
It is evident that this feature, which also outlines the limitations of LoRa technology [21], has a crucial impact on the design of a logic selectivity system.
4. Enabling Technologies for Logic Selectivity
As stated in the previous section, in order to make the logic selectivity work, the Blind message has to be received before the Maximum Blind Waiting time expires.
It has to be considered that, from the fault occurrence to the fault clearing, the protection requires some delays to perform its operations, and these have to be taken into account. In particular, when a fault occurs, the protection requires a time interval to detect the fault, typically equal to (i) 27 ms for unidirectional faults and (ii) 57 ms for directional faults [22,23]. Furthermore, an MV circuit breaker takes about 60 ms to open the circuit [24].
As an example, the timing of the operations sequence of the protections PR1 and PR2 for the considered fault is reported in Figure 2. A maximum allowed fault clearing time of 500 ms is hypothesized.
Both the protections recognize the fault after a delay of , representing the detection time. In the figure, the fault detection is highlighted by the rising edge of the signal FAULT DETECTED. As soon as the fault is detected, PR2 sends the Blind message to PR1; this event is displayed by a pulse of the signal TX BLIND. The protection PR1 waits for the Blind message, but it has to guarantee that the circuit is opened before that the maximum allowed time for fault clearing of 500 ms expires. Considering that from the tripping command to the effective tripping of the circuit breaker a time delay is required, PR1 waits for the Blind message for a Maximum Blind Waiting time equal to --. In the hypothesis that the fault is unidirectional, = 27 ms, so each protection awaits the blind message for about ms. In the example in Figure 2, PR1 receives the Blind message (event shown with the pulse of the signal RX BLIND) after a delay time of less than . So, PR1 inhibits the operation of its circuit breaker, which remains closed, as can be noted by the level of the signal CB1 STATUS remaining low. Similarly, PR2 waits for a Blind message from PR3; when the of 413 ms expires and the Blind message has not been received, PR2 commands its circuit breaker to trip. In the figure, this event is shown by the level of the signal CB2 STATUS becoming high.
Therefore, logic selectivity requires adherence to the precise constraints of communication times. This involves a series of issues concerning the design of a suitable network infrastructure that is able to guarantee fast and reliable communications and that must connect electrical devices to each other that may be a few kilometers away.
Various enabling technologies [25], both wired and wireless, have been taken into consideration by researchers and operators in the sector [26]. Inside the primary substation, the devices are connected in a local network through an optical fiber which ensures message exchange with a latency below 1 ms [23,27]. Outside the primary substation, the optical fiber is not available everywhere because of the costs related to building the infrastructure. In some cases, in the presence of overhead power distribution lines, some pilot projects have foreseen the installation of the optical fiber under the guard wire. However, this solution is expensive and presents a problem if the support of the overhead power line falls; in such a case, the fiber is unusable and can be damaged, requiring a replacement of the cable. Different wired solutions, Ethernet cable, for example, are characterized by the same installation problems [28].
An alternative that reduces installation costs is represented by the Power Line Communication (PLC) technology which allows the message exchange to occur using the same cables that carry electricity. However, the communication ranges of the PLC are limited to 400 m for high transmission speeds and 800 m for low speeds; so, for secondary substations placed at greater distances, it is necessary to provide an apparatus that acts as bridge [29]. In regard to transformers and circuit breakers that can isolate sections of line or entire zones, it is necessary to install bypass devices that assure a continuity in communication service [30]. Moreover, in a modern smart grid, this communication technology could be undermined by changes in the network topology [31].
To overcome the problems related to the installation of wired communication networks, some researchers have moved toward wireless communication technologies. In this case, there are different technological solutions operating in either licensed or free frequency bands [32]. In the first case, the network infrastructure is owned by telecommunications companies, and the electricity companies must not incur any costs for its construction and maintenance. In fact, taking advantage of the mobile phone network to make connections between the electrical substations, only the costs related to the purchase of wireless devices and those of subscription to the offered services should be supported, the amount of which depends on GSM, 3G, 4G, or LTE-M adopted technology. However, in this scenario, the communication network will never be owned by the electricity company and the availability of the service depends on the quality guaranteed by telephone companies, signal coverage, mobile traffic, etc. The other solution is instead to use the free communication frequencies in the Industrial, Scientific, and Medical (ISM) band to create a proprietary wireless communication network between electrical substations. These include the application of extended WiFi, which is part of the Wireless Local Area Network (WLAN) technology, offering a communication range limited to a few hundred meters. In addition, the typical consumption of WiFi devices requires a mains power supply, so, in the event of a failure, a backup power supply must be guaranteed. In [33], the results obtained by adopting this technology for the transmission of messages compliant with the IEC 61850 standard [34], limited to two apparatuses placed only 75 m apart from each other, are presented.
Recently, a new communication technology, referred to as LoRa (Long Range), has been introduced. LoRa operates in the free band [35] and is rapidly spreading as an enabling technology for the Internet of Things (IoT). LoRa technology allows considerable communication distances (up to 15 km in rural environments) to be reached with very low power consumption and is, therefore, particularly suitable for use in embedded sensor networks where low bit rates are sufficient, hardware resources are limited, and battery saving is required. Examples of applications of LoRa technology can now be found in industry, logistics, environmental monitoring, smart city applications, smart agriculture, etc. [36]. Due to its intrinsic characteristics, therefore, LoRa technology could be used to achieve logic selectivity since: (i) it overcomes the problems that arise from wired communications; (ii) it does not require third-party network infrastructure as required for GSM/3G/4G/LTE-M devices, but only the creation of a wireless link between substations in a Machine2Machine (M2M) connection framework; (iii) it reaches transmission ranges considerably greater than those guaranteed by WLAN networks with embedded battery-saving systems that can operate autonomously for more than 10 years; and (iv) it is suitable for providing automation and intelligence to the existing power grid infrastructure.
Therefore, the authors’ goal is to verify that LoRa technology can be effectively used as a communication system and the technology enabling logic selectivity as an alternative to the technologies previously proposed and analyzed in the literature.
5. LoRa Technology for Logic Selectivity Implementation
According to the constraints highlighted in Section 4, Blind messages have to reach the upstream protections before the expiration of the Maximum Blind Waiting time to reliably implement the logic selectivity. The following relationship thus has to be verified:
is determined by , which is in turn imposed by the network operator and depends on the considered fault, and, in some cases, it may vary with the characteristics of the MV line.
The depends on several parameters, but once the length of the preamble is fixed and the header, CR, and CRC are set, doubles if the SF is increased by one unit or if the bandwidth is halved.
As an example, if a fault current greater than 600 A is considered, the fault has to be cleared in 500 ms; with a detection time of 27 ms and a trip time of 60 ms, a equal to 413 ms is obtained. If the LoRa configurations presented in Table 5 are considered, it can be noticed that not all the combination of SF and BW are feasible. In Table 6, in fact, the values highlighted in red are not compliant with the allowed and, so, the associated SF and BW combinations are not suitable for logic selectivity.
The values of receiver sensitivity, shown in Table 7, also depend on the combination of SF and BW, according to Equation (8). The achievement of the condition in Equation (12) indirectly imposes a limit on the minimum receiver sensitivity and, consequently, on the maximum communication range that can be assured under these conditions. The minimum value of receiver sensitivity, equal to −132 dBm, can be obtained (highlighted in bold in the table) with SF equal to 10 and BW of 125 kHz. Even lower values and, therefore, greater distances would be obtained with the SF and BW pairs that are not allowed and for which the condition in Equation (12) would not be fulfilled. These values are highlighted in red.
In theory, however, it is possible to optimize the Lora packet to reduce the transmission time and further improve receiver sensitivity. As stated above, in LoRa technology, the header is, in fact, optional and can be eliminated to reduce transmission times. The CRC can also be disabled in order to reduce the . Even though the elimination of the CRC eliminates the check on the integrity of the sent bits, this does not represent a particular problem in the implementation of logic selectivity, because if an invalid or corrupt message is received, in most cases, there is not enough time to request and wait for data retransmission.
As an example, Table 8 shows the obtained in the same LoRa configurations as in Table 5, but with CRC disabled. In this case, only the configuration with BW equal to 125 kHz and SF equal to 12 results in a time greater than . It is also possible to choose the configuration with SF equal to 11 and a BW of 125 kHz and obtain a sensitivity of −134.5 dB, thus assuring a wider coverage range.
The design of a LoRa-based logic selectivity system can be, then, summarized as follows:
- the type of failure for which the logic selectivity is developed imposes the maximum fault clearing time and, consequently, the Maximum Blind Waiting time ;
- the possible configurations of the LoRa packet that ensure a transmission time lower than can now be examined;
- among all the possible configurations of the packet, the one characterized by the maximum value of SF and the minimum possible BW value should be chosen to ensure the minimum theoretical value of receiver sensitivity and, therefore, maximum reliability of communication;
- finally, it must be verified whether, based on the characteristics of the environment, rural, urban, etc., the values obtained are sufficient to cover the distance between the protections.
6. Realized Demonstrator
A demonstrator was realized in the laboratory in order to carry out preliminary tests of the feasibility, functionality, and reliability of the proposed solution. The demonstrator, shown in Figure 3, emulates a medium-voltage distribution radial line where there is a primary station protected by the substation breaker SB and controlled by the substation relay SR. The MV line is protected by three circuit breakers, CB1, CB2, and CB3, respectively controlled by three protection relays, PR1, PR2, and PR3. At the line boundary, the interconnection breaker IB is controlled by the Tie recloser TR.
The digital protections should consist of the sensing element that continuously monitors the electrical quantities of the line to detect a fault; the sensing element is associated with the wireless network sensor node in LoRa technology and enables the exchange of information between the various protections. For the sake of simplicity and safety in the laboratory, and considering that the research activity aimed to demonstrate the effectiveness of the adoption of LoRa technology for the implementation of logic selectivity, in the realized demonstrator, the sensing element of the protection was not present, and only the nodes of the wireless network were considered and distributed. To assure the possibility of carrying out automatic tests on the system, fault detection was emulated by means of the output digital lines of a circuit controller that was mandated to transmit the fault occurrence to the selected wireless nodes.
To realize the sensor nodes in LoRa technology, the components shown in Figure 4 were exploited. I-NUCLEO-SX1272D (by STMicroelectronics, Geneva, Switzerland) extension boards were used, which integrate a LoRa SX1272 transceiver, (Semtech, Camarillo, CA, USA) controlled by a NUCLEO-L073RZ (STMicroelectronics, Geneva, Switzerland), based on a 32-bit ultralow-power microprocessor STM32L0 ARM (ARM Holding, Cambridge, UK) Cortex, which operates at a frequency of 32 MHz. Through Arduino-compatible connectors, the extension board was mounted on the L073 demo board, and a hardware stack was thus formed that allows physically connecting the microcontroller with the LoRa transceiver.
In particular, several digital lines of the connector are used for the following tasks:
- serial SPI communication for the transfer of the payload of the LoRa packets from the microcontroller to the transceiver and vice versa;
- control of the transmission and reception commands sent from the microcontroller to the receiver;
- control of the transmission and reception state sent from the receiver to the microcontroller to report the successful transmission or reception of a LoRa package.
Therefore, the firmware running on the microcontroller of the sensor node first configures the transceiver with the desired LoRa communication parameters and, subsequently, thanks to the implementation of an appropriate state machine, realizes the logic selectivity, managing the different PR phases in collaboration with the other nodes of the network.
6.1. Node State Machine
In Figure 5, the state machine implemented on the microcontroller of the sensor node associated with a PR is reported. After start-up, in normal operating conditions, the node enters an IDLE state, where the closed state of the breaker is emulated by an illuminated green LED, and the transceiver is in continuous reception mode. The circuit controller, through the high logic level of the line connected to the pin PA11, sends the fault signal. This pin is associated with an interrupt, so when a fault is detected, the microcontroller jumps to the relative Interrupt Service Routine (ISR). The ISR includes the following steps: (i) a red LED is turned on to signal the presence of the fault on the network; (ii) the timer that has to measure the Maximum Blind Waiting time of the PR is started; (iii) the transceiver switches from the continuous receive condition (RX continuous mode) to the transmit condition (Tx) to send the BLIND command to the protection immediately upstream; (iv) the value of the status variable is changed from IDLE to FAULT.
In the FAULT state, two different events can happen: a Blind message from the protection immediately downstream is received before the expiration of , or elapses but the PR has not received any Blind message. When a generic message is received, the transceiver generates an external interrupt to the microcontroller (RxDone) and the microcontroller picks up the received message from the FIFO queue of the LoRa transceiver. If the message is recognized as Blind, then: (i) the timer for measuring is stopped; (ii) the yellow LED is turned on to signal the Blind message reception; (iii) the status variable passes from the FAULT state to the BLIND state. On the contrary, if expires, the firmware performs the following: (i) tripping the breaker CB, which, in the demonstrator, is emulated by turning the green LED off; (ii) transmitting the tripping command to the downstream protection to isolate the section of the line affected by the fault; (iii) changing the value of the status variable from the FAULT condition to the BREAKER TRIPPED condition.
It is possible to return to the IDLE condition and, therefore, to normal operation (from both the BLIND and BREAKER TRIPPED states) if the distribution line is restored; in the demonstrator, this event is emulated through a RESET signal provided externally by the circuit controller to the node.
In the IDLE condition, even though no fault is detected, a PR can trip its CB if a Trip message is received from the PR placed immediately upstream. In this case, once the message is received and acknowledged by the microcontroller: (i) the yellow LED is turned on to signal the reception of a valid message and the green LED is turned off, emulating the tripping of the breaker; (ii) the status of the LoRa transceiver is changed from the Rx continuous reception mode to Tx transmission to transmit the Close message to the boundary Tie recloser TR.
6.2. Solution for Full-Duplex LoRa Communication
Unfortunately, a serious technical limitation lies in the fact that the LoRa SX1272 transceiver only allows communication on a single channel at a time (single-band operation, programmable in the 860–1020 MHz range). In other words, only half-duplex communication can be realized by means of this hardware configuration, and it is not possible to transmit and receive simultaneously, as required in logic selectivity when a PR has to transmit a Blind message to the PR upstream and, simultaneously, has to receive the potential Blind message from the PR downstream.
To overcome this limitation, two Nucleo-L073 boards plus expansion boards with SX1272 transceivers were used for each PR (as shown in Figure 6), in a master-slave architecture. One transceiver is exploited to communicate between a PR and the upstream protection on a defined channel, while the other transceiver is used to exchange messages between the same PR and the downstream protection on another channel. Master and slave communicate with one another through three dedicated digital lines. In Figure 7, an image of the realized prototype is shown.
In this case, the main firmware that controls the state machine is loaded on the microcontroller of the board master and directly controls the transceiver for communication with the PR upstream, while the microcontroller of the slave card is connected to the transceiver for communication with the PR downstream.
Initially, the transceivers are both configured to receive and continuously search for a preamble on the respective communication channel. Only the master can detect a fault and, when this occurs, it changes the status of its transceiver from Rx continuous mode to Tx and transmits the Blind message to the upstream PR. While the Blind transmission takes place, the transceiver connected to the slave remains in Rx continuous mode in search of a possible preamble relative to the same Blind message coming from the downstream PR.
In this way, all the PRs that detect the fault can send and receive Blind messages simultaneously, as schematized in Figure 8), without the interference and overlapping of LoRa signals.
If a Blind message is received from the slave transceiver, the latter alerts its master by raising the line connected to pin PA12 (input for the master and output for the slave), from low to high logic level. This event generates an interrupt of the master microcontroller that stops the measurement, turns on the yellow LED to signal the reception of the Blind message, and maintains the controlled CB in a closed state (green LED on) despite the presence of the fault, in accordance with the logic selectivity criteria.
On the other hand, if the slave does not signal the reception of a Blind message to the master, at the expiration of , the master commands the tripping of the CB (turning off the green LED) and communicates to the slave to transmit a Trip message to the downstream PR for isolating the faulty line section. In this case, the master sets the PC6 pin to the high logic level. This event generates an interrupt on the slave, whose ISR modifies the transceiver from the RX mode to the TX mode and starts the transmission of the Trip message.
As mentioned above, under normal operating conditions, the master transceiver, which is in charge of communication with the upstream PR, is also in continuous reception mode. This allows the master to always be aware of a Trip message from the upstream PR. When a Trip message is received, the master turns on the yellow LED to signal the reception of the message and turns off the green LED to signal the tripping of its CB. In addition, the master sets the PC8 pin to the high logic level, which is output for the master and input for the slave. This transition also generates an interrupt of the slave, which changes the status of its LoRa transceiver from Rx continuous mode to Tx in order to transmit the Close message to the boundary TR. If downstream there is a further PR, then the Close message is forwarded from the master to the slave, again setting the PC8 pin to a high logic level; if the TR is present, it will receive the Close message and close the IB.
As can be presumed, the SR and TR do not need a master-slave architecture, since the TR has to communicate only with the downstream PR, and the TR has only to receive Close messages from the upstream PR.
6.3. Discussion on LoRa Communication Channels
LoRa technology uses orthogonal configurations, and this should allow the transmission of signals with different SFs in the same frequency channel simultaneously, without interference. In fact, signals with an SF different from that of the receiver appear to the latter as noise. One could, therefore, hypothesize using different SFs to make connections between the different PRs and guarantee the simultaneous transmission of Blind messages.
However, signals with different SFs are not strictly orthogonal, but rather pseudo-orthogonal, that is, the correlation function does not return exactly zero. Consequently, a packet sent with a defined SF to be correctly demodulated must exhibit a signal-to-interference-plus-noise ratio (SINR), expressed in dB, that is sufficiently high if compared to an interfering packet that has a different SF value.
In Ref. [19], a table is given that expresses the value of the minimum required SINR, which is dependent on the SF of sent and interfering packets. The minimum SINR that must be guaranteed decreases as the overlapping time decreases. The authors took the worst case into account, since, in the case of logic selectivity, the Blind messages have to be transmitted simultaneously. The solution based on the use of different SFs appears, however, to not be feasible. In fact, if a PR has to both transfer and receive a Blind message, inevitably the transmitter will interfere with the receiver because of their physical proximity, even if a different SF was used for the transmitter and the receiver. In other words, it is not possible to guarantee an adequate SINR unless using antennas that transmit in one direction, replacing the omnidirectional ones used for the realization of the prototypes.
In order to overcome this limitation, a frequency division approach has therefore been used for transmissions, choosing a different central frequency for each of the communication channels that must be guaranteed according to the provisions in [40]. As an example, the sensor node in the primary station and the master of the PR1 will communicate with a central frequency of 868 MHz; the slave of the PR1 and the master of the PR2 at 867 MHz and so on, without interference [41].
7. Experimental Tests
The experimental tests were conducted with the aim of demonstrating the feasibility of LoRa technology to fulfill logic selectivity on medium-voltage distribution lines.
The designed demonstrator was used with two different types of fault. With regard to the case studies, the authors referred to Table 9, taken from the Italian Standard [42] that regulates the connection of users to the MV network. In particular, this standard specifies the maximum fault clearing time that the user’s protection must comply with. Depending on the type of fault, the protection is identified by a unique code. The two cases taken into consideration were: 50.S3 poly-phase short circuit (with current threshold of 600 A) and 67N.S1 single-phase to earth fault with compensated neutral. The fault case 50.S3 is the worst case since the time required to clear the fault is equal to 120 ms, while this time for fault case 67N.S1 is equal to 450 ms.
For each considered fault, two conditions were emulated: a fault between the protection of the primary substation SR and the first protection PR1, and fault in the line section between PR2 and PR3.
7.1. Measurement Setup
To carry out the tests, an automatic measurement station was created in the National Instruments LabVIEWTM environment, which allows: (i) the performance of repeated tests, (ii) the recording of the results of each test, and (iii) the determination of the average and standard deviation of the time intervals of interest for each case study. At the end of the programmed tests, a report file is released.
Before starting the tests on the particular selected case study, some operations have to be performed on each PR: (1) adjusting the timer of the board master with the Maximum Blind Waiting time , as determined in Table 9; (2) configuring the sensor node board with the LoRa transmission parameters appropriate to guarantee a nominal time for transmitting the Blind message that is less than ; (3) connecting the pin used by the circuit controller that generates the fault event so that, during the test, all the PRs detect the presence of the fault in the same instant. Items 1 and 2 are strictly connected to the type of fault. Item 3 is instead dependent on the desired position of the fault in the line. In particular, pin PA2 of the circuit controller has to be connected to pin PA11 of all the PRs that have to sense the fault (i.e., the boards emulating the PRs upstream of the fault); for the other boards (emulating the PRs downstream of the fault), pin PA11 has to be referred to ground.
The tests can be started from the control panel created in LabVIEWTM (National Instruments, Austin, TX, USA). At power-up, all the boards are kept in reset status by the circuit controller. The command to start a new test is sent from the automatic measurement station to the circuit controller via USB cable. After 1 s, the circuit controller releases the reset lines and all the boards enter the normal operating condition. In this state, the green LEDs of both SR and the masters of PR1, PR2, and PR3 are turned on to emulate the closed state of the respective CB and the supply of the entire MV line up to the boundary TR, which, instead, has the green LED off to emulate the breaker in the open state. After another second, the fault event is generated by raising the PA2 line of the circuit controller. All the boards that revealed the fault can then identify it and start the planned actions. The test ends when the reconfiguration of the line is terminated with the isolation of the fault and the closure of the interconnection breaker.
All the digital signals of interest are sampled with a rate of 100 kS/s and recorded through the digital I/O lines of a National Instruments data acquisition board NI-USB 6343. In particular, for each MASTER, the acquired signals are:
- the control signal of the yellow LED, which indicates the arrival of a message that can be a Blind from a downstream protection, a Trip from an upstream protection, or a Close message for the TR from an upstream protection;
- the control signal of the green LED, which indicates the status of the circuit breaker (high level means LED on, i.e., breaker closed);
- the TxRxDone signals that indicate a transition when a LoRa package transmission or reception is completed.
Once the test is complete and the signals are acquired, the LabVIEWTM software calculates the time intervals of interest. For each case, 1000 repeated trials were performed in order to estimate the mean values and standard deviations of the quantity of interest.
7.2. 50.S3 Poly-Phase Short Circuit (Threshold 600 A)
According to Table 9, the maximum clearing time for the non-directional short-circuit fault 50.S3 is 120 ms. Consequently, considering a fault detection time of 27 ms and a trip time of 60 ms, there is a maximum time interval of 33 ms, after which the PR has to command the tripping of the CB if it has not received a Blind message. Therefore, in this case, the timer associated with the protection relay can be set to 33 ms to take advantage of all the useful time.
The time sets a constraint on the maximum of the LoRa package and, as stated above, the larger the , the greater the allowed SF, which implies a better receiver sensitivity and a wider communication range.
For the considered case, the associated with the Blind message, together with the processing time, must not exceed 33 ms. Since, as described in Section 5, depends on numerous parameters, for all the tests considered, only the parameters BW and SF were varied. The parameters that have no direct influence on the receiver sensitivity values and link budget were set to the typical values of the LoRa transmission. In particular, the authors chose the following configuration:
- CR = 1,
- PL = 4 bytes,
- Total preamble of 12.25 symbols,
- header explicit,
- CRC enabled.
According to these parameters, different combinations of BW and SF leads to the values shown in Table 10.
All the values highlighted in green are lower than 33 ms, and the corresponding SF and BW configuration can be used for the 50.S3 fault. The unacceptable times, corresponding to the configurations to be discarded, are highlighted in red. It can be noticed that the pairs of SF and BW equal to (7;125), (8;250), and (9;500) result in a of 30.98 ms. Even if this time interval is lower than the allowable , these configurations leave a margin of only 2 ms to perform all other necessary processing (apart from eventual deviation of the actual from the nominal value); so, these pairs of SF and BW were discarded. The configurations that guarantee the correct functioning of the logic are those obtained with the pair (7;500), which returns a nominal of 7.74 ms, and the pairs (7;250) and (8;500) that give a nominal of 15.49 ms. The latter are those that give a receiver sensitivity of −120 dBm and thus ensure the highest possible link budget for this type of fault. The configuration (7;500), instead, provides a higher receiver sensitivity, −117 dBm, and, therefore, a reduced link budget. This means that the SF and BW pairs (7;250) and (8;500) allow for longer distance coverage.
As a case study for performing the tests regarding the fault 50.S3, the values SF = 7 and BW = 250 were set. As an example, Figure 9 shows the time–frequency diagram obtained by acquiring one of the LoRa packets through the Tektronix real-time spectrum analyzer RSA 3408A.
7.2.1. Fault 50.S3 between SR and PR1
According to the selected configuration, the correct functioning of the proposed logic selectivity system was first verified with the assumption of a fault positioned between the substation relay SR and the PR nearest to the substation, referred to as PR1. In this case, only SR detects the fault, and Figure 10 shows the message exchange between the different protections.
In Figure 11, the digital signals acquired during one of the 1000 repeated trials are reported.
The following events can be observed:
- After about 33 ms from the fault event (identified by the low-high transition of the FAULT signal occurring at the time instant ), the SR commands the trip of its CB to isolate the fault (high-low transition of the signal SR_CB at the instant ) and sends the Trip message to PR1, since no Blind message has been received (SR_RxDone always low).
- PR1 receives the Trip message (low-high transition of the signal PR1_RxDone at the instant ), and immediately commands the trip of its CB (high-low transition of PR1_CB at the instant ); moreover, PR1 transmits to PR2 the Close request for the boundary TR (low-high transition of the signal PR2_RxDone at the instant ).
- PR2 leaves its CB closed (PR2_CB remains high) and forwards the Close request to PR3, which, in turn, transmits it to the TR, which commands the closing of its breaker (low-high transition of TR_IB signal at the instant ).
At the end of the operations, the section between SR and PR1 affected by the fault is isolated, but the section downstream PR1 is still supplied since it is connected to the lower radial network. The powered section of the MV network is highlighted by the green arrow in Figure 10.
The evaluation of the differences between the instants identified by the edges of the acquired digital signals provided the mean values of the time intervals of interest, which are reported in Table 11.
The standard deviation of the 1000 repeated trials confirmed that the uncertainty is mainly determined by the resolution of 10 s of the data acquisition board, adopted for acquiring the digital signals, as would be expected considering the resolution of the ST microcontroller peripheral TIMER2 and what was reported in [40].
As it is possible to observe, the fault is cleared in the requested time considering that from the moment in which the fault is detected to the moment in which the trip command is sent to the circuit breaker immediately upstream of the fault, the elapsed time is = 0.03297 s, which is lower than 0.03300 s. The power supply of the network downstream of the fault is restored, i.e., the Close message is transmitted to the TR within a time interval of = 0.10796 from the fault detection.
7.2.2. Fault 50.S3 between PR2 and PR3
The proposed system was assessed also with a fault located between PR2 and PR3, as schematized in Figure 12. In this case, the fault is detected by the protection relay in PR2, as well as by the relay in SR and PR1.
In Figure 13, the recorded digital signals acquired during one of the 1000 repeated trials are reported.
The following steps can be recognized:
- As soon as the fault event is detected, PR1 transmits a Blind message to the SR and, at the same time, PR2 transmits the Blind message to PR1.
- SR and PR1 receive the Blind message after about 18 ms (low-high transition of the SR_RxDone and PR1_RxDone signals, respectively, at the instants and ).
- After about 33 ms from the fault event, PR2, which has not received any Blind messages (PR2_RxDone always low), commands the trip of its CB (high-low transition of the signal PR2_CB at the instant ) and sends the Trip message to PR3.
- PR3, once it has received the Trip message (low-high transition of the signal PR3_RxDone at the instant ), also commands the trip of its breaker (high-low transition PR3_CB at instant ), isolating the faulty line section. PR3, moreover, transmits the Close request to the TR, which then commands its IB (low-high transition of TR_IB signal at the instant ).
As a final result, the line section between PR2 and PR3 (i.e., the section affected by the fault) is isolated, the section between SR and PR2 is supplied by the upper primary substation, and the section between PR3 and TR is fed by the lower primary substation. In Figure 12, the powered sections are highlighted by green arrows.
The measured time intervals are reported in Table 12.
As it can be appreciated, the fault is cleared before the time limit expires, considering that from the moment in which the fault is detected to the moment in which the circuit breaker immediately upstream of the fault is commanded, the time elapsed is = 0.03296 s, which is lower than 0.03300 s. The Close message is, instead, transmitted to the TR within a time interval equal to 0.07085 s after the fault detection.
Table 13 summarizes the interval values measured in the two cases taken into account.
As it can be seen from Table 13, the experimental results meet the theoretical assumptions. In particular, the two considered cases highlight the main advantage of the logic selectivity approach: the time required for fault clearing is always the same and does not depend on the position of the fault.
On the other hand, the position of the fault influences the time required for closing the Tie recloser. Since the Close message starts from the PR immediately downstream of the fault and is forwarded up to the TR, the time required for repowering the healthy line downstream of the fault is dependent on the fault position.
7.3. 67N.S1 One-Phase to Ground with Compensated Neutral
For the fault protection 67N.S1, single-phase to ground with compensated neutral, a maximum fault clearing time of 450 ms is imposed. Consequently, considering a fault detection time of 57 ms and a 60 ms breaker trip time, there is a Maximum Blind Waiting time of 333 ms within which the PR can wait for a Blind message before tripping its CB. This time interval is much greater than that required in the case of fault 50.S3; thus, it is possible to relax the stringent constraints on the design of the LoRa packet. In other words, with fault 67N.S1, it is possible to adopt larger values and use higher SF values that considerably improve the receiver sensitivity and link budget.
In Table 14, the nominal time duration of reported in Table 10 are again considered and compared with the Maximum Blind Waiting time of the fault 67N.S1. In particular, it can be observed that by choosing the SF and BW pairs (10;125), (11;250), and (12;500) for the configuration of the LoRa transmission packet, a maximum of 209.85 ms is obtained, which is lower than the Maximum Blind Waiting time required for fault 67N.S1. The SF and BW pairs (10;125), (11;250), and (12;500) correspond to receiver sensitivities, respectively, of: −132, −131.5, and −131 dBm. The configuration that allows for the best receiver sensitivity and the greatest link budget is the one with the SF and BW pair (10;125), which was chosen for the subsequent tests.
Figure 14 shows the time–frequency diagram of one of the LoRa packages, with a nominal duration of 209.85 ms, SF = 10, and BW = 12, obtained through the real-time spectrum analyzer Tektronix RSA 3408A.
7.3.1. Fault 67N.S1 between SR and PR1
In this instance, only the protection relay SR detects the fault, and the operating steps performed by the SR are the same as those described in Section 7.2.1. The recorded digital signals acquired during one of the 1000 repeated trials are shown in Figure 15.
In also this type of fault, the final result after the fault clearing is the isolation of the line section between SR and PR1; the healthy section between PR1 and the boundary TR is supplied by the lower primary substation, as already seen in the scheme in Figure 10.
The time intervals measured with this setup are reported in Table 15.
As can be observed, the fault is cleared within the maximum time allowed; from the moment in which the fault is detected to the moment in which the circuit breaker immediately upstream of the fault is commanded, a time of = 0.32839 s elapses.
The closing command is instead transmitted to the border TR within a time of = 1.19899 s from fault detection.
7.3.2. Fault 67N.S1 between PR2 and PR3
According to the same configuration which determines a duration of the LoRa packet equal to 209.85 ms, the system was assessed with the 67N.S1 fault located between PR2 and PR3. The fault is detected by the protections SR, PR1, and PR2, as seen in the scheme in Figure 12. The corresponding recorded signals are shown in Figure 16.
As seen for the fault 50.S3, at the end of operations, the fault section is isolated, the line between SR and PR2 is powered by the upper primary substation PS1, and the line between PR3 and the TR is supplied by the lower primary substation, as indicated by the green arrows in Figure 12.
The mean values of the time intervals of interests are reported in Table 16.
As can be noticed, the fault is cleared within the maximum allowable time, considering that from the moment in which the fault is detected to the moment when the circuit breaker is commanded, a time of = 0.32957 s elapses.
The Close command is instead transmitted to the border TR within a time of = 0.76248 s from fault detection.
By comparing the two considered fault position, the values reported in Table 17 are observed.
As determined in the previous sections, the tripping time and, therefore, the clearing of this fault are the same and do not depend on the position of the fault. The position of the fault, however, influences the reclosing time and, thus, the time required for restoring the network downstream of the fault.
7.4. Constraint due to Reclosing in 1 s
In order to improve the quality parameters of their service, electrical distributors require themselves to close the tie recloser within 1 s from the occurrence of the fault (so that the interruption, for users connected to the healthy section of the line, is classified as transitory and subjected to lower penalties [43]). This condition is met in all the considered case studies except in the third case, i.e., the fault 67N.S1 between SR and PR1, when the IB is actually commanded after 1.19899 s. This additional constraint was thus added during the design of the logic selectivity system.
The largest that allows the boundary to close in less than 1 s is that with a duration of 103.42 ms, which can be obtained with the pairs of SF and BW equal to (9;125), (10;250), and (11;500), to which, respectively, correspond receiver sensitivity values of −129, −129 and 128.5 dBm. Therefore, in order to always guarantee the best receiver sensitivity and link budget, values of SF equal to 9 and BW equal to 125 kHz were set to configure the LoRa package during the tests.
In Figure 17, a time–frequency diagram of a LoRa package with a nominal duration of 103.42 ms, acquired with the spectrum analyzer RSA 3408A, is reported.
The acquired digital signals are reported in Figure 18.
The measured time intervals of interest are, then, reported in Table 18.
It can be noticed that this time, is lowered to 0.76795 s, compliant with the considered constraint.
7.5. Example of Fault 50.S3 between PR3 and TR
A particular case occurs when the fault is present downstream of the last PR of the radial line, as shown in the scheme in Figure 19. In this case, in fact, SR, PR1, PR2, and PR3 detect the fault at the same time. However, only the relay in PR3 trips the CB when its Maximum Blind Waiting time expires, because the other PRs receive a Blind message from the protection immediately downstream.
This case is particularly crucial because three Blind messages have to be transmitted contemporaneously and, so, the interference tolerance of the system is specially assessed.
Figure 20 shows the time-frequency representation of the three blind messages that have been acquired with the real time spectrum analyzer. It is possible to appreciate the different central frequency of the three communications:
- 868 MHz for the communication link between the node in SR and PR1;
- 868.6 MHz for the communication link between the node in PR1 and PR2;
- 869 MHz for the communication link between the node in PR2 and PR3.
The recorded digital signals are reported in Figure 21.
The measured time intervals of interest are reported in Table 19.
As can be appreciated from Table 19, the obtained results concur with the expected ones. In particular, the three Blind signals arrive at the same time instantaneously without interference. In also this case, the tripping time and, therefore, the clearing of the fault are the same as those observed in the previous 50.S3 cases and do not depend on the position of the fault.
7.6. Tolerance to Connection Problems
In the event that, for any reason, the Blind or Trip messages do not reach their destination, for example, due to interference in the channel or fault in the communication infrastructure, the logic selectivity will not work. The scenario that must be avoided, however, is one in which a fault is supplied by the network for a time exceeding the limits reported in Table 9, as this can lead to damages to the distribution network.
The designed logic selectivity system is, in this regard, tolerant. The firmware of each PR, in fact, was developed in such a way as that if a fault is detected and neither a Blind nor a Trip message is received within the Maximum Blind Waiting time, the PR commands the tripping of the circuit breaker anyway. Therefore, the fault is correctly powered off even if connection problems of the PRs are experienced.
To emulate this situation, a test with the fault 67N.S1 was set up, wherein the fault was located between PR2 and PR3 and with a configuration of SF = 12 and BW = 250 kHz. The SF and BW pair corresponds to a of 413.7 ms, which is much greater than the Maximum Blind Waiting time for this type of fault (330 ms).
In this case, the relays SR, PR1, PR2, when not receiving the Blind signal in time, will command the opening of the circuit breaker together, as shown in the scheme in Figure 22.
Since the SR and PRs commanded their breakers at the same time, all the breakers upstream of the fault are tripped. The selectivity, in this instance, is not fulfilled, because the entire radial network, from SR to TR, suffers from the power outage, but the fault is not further supplied, preventing damages to the network.
8. Conclusions
The suitability of LoRa technology as communication media for logic selectivity is reported in the paper. In particular, protective relay prototypes were realized that are capable of exchanging messages with each other. In order to assess the reliability and response times of the proposed solution, a laboratory demonstrator was created, with which two types of faults were emulated: (1) the poly-phase short circuit with current exceeding 600 A, for which it is necessary to clear the fault within 120 ms and is, therefore, the most critical to be managed and (2) the single-phase to earth fault, for which it is necessary to clear the fault within 450 ms. For both types of fault, tests were performed for different fault locations along the MV line.
The experimental results show that for all of the types of faults examined, the system is able to isolate the faulty section of the network within the maximum allowed times. Moreover, the system is characterized by its robustness against possible communication problems, because even when the messages do not reach the relays, the fault is isolated within the established times.
The laboratory assessment, thus, proved that LoRa technology seems to be suitable for achieving logic selectivity in all those cases in which optical fiber installation is not convenient from a cost point of view.
It has to be noted that in wireless communication through LoRa technology, whenever the preamble, payload, SF, BW, and CR parameters are fixed and known for both the transmitter and the receiver, it is possible to remove the header from the message by disabling the implicit header mode and by reducing the value of to the SF and BW parity. This optimization allows for increasing the time symbol by setting a higher SF or a lower BW. For example, the 30.98 ms duration packet obtained with SF = 8, BW = 250 kHz, and an explicit header mode is reduced to a nominal duration of 25.86 ms by switching to the implicit header mode and leaving all the other parameters unaltered. In the case of failure 50.S3, this would mean that the spreading factor can be changed from 7 to 8 with a notable improvement in the receiver sensitivity and link budget.
The ongoing research activity is focused on the optimization of packet transmission. Further tests, moreover, are going to be carried out in order to add to the indoor laboratory tests by conducting outdoor field trials. It is necessary, in fact, to assess the robustness of LoRa communication technology with respect to disturbances caused by the MV network. The use of a wireless system allows for the isolation of the path for data transmission from the path for power transmission. However, the LoRa transceivers can suffer from electromagnetic interference (EMI) caused by the corona effect [44]; in particular, EMI could deteriorate the signal-to-noise ratio and, thus, a different optimization of the LoRa packet parameters could be required to achieve the aim of increasing the receiver sensitivity.
Author Contributions
Conceptualization, A.L.; Data curation, F.B. and R.S.L.M.; Methodology, A.L., F.B. and R.S.L.M.; Supervision, L.A. and A.L.; Validation, A.L., F.B. and R.S.L.M.; Writing—original draft, F.B.; and Writing—review and editing, L.A., A.L. and R.S.L.M.
Funding
This research received no external funding.
Acknowledgments
The authors wish to thank Prof. Massimo D’Apuzzo for his scientific contribution and his precious suggestions. The authors wish to thanks A. Smith, S. Cannavacciuolo and Mauro D’Angelo from ST Microelectronics at Arzano (Italy) for both the offered opportunity of testing the proposed transmission system on their STM32 microcontrollers and the technical support during the execution of the laboratory tests.
Conflicts of Interest
The authors declare no conflicts of interest.
References
- Calderaro, V.; Galdi, V.; Lamberti, F.; Piccolo, A. A Smart Strategy for Voltage Control Ancillary Service in Distribution Networks. IEEE Trans. Power Syst. 2015, 30, 494–502. [Google Scholar] [CrossRef]
- Nikander, A. Development of Modern Phase Earthing System for Improving Quality of Supply in the MV Network. IEEE Trans. Power Deliv. 2017, 32, 1228–1235. [Google Scholar] [CrossRef]
- Valdes, M.E.; Dougherty, J.J. Advances in Protective Device Interlocking for Improved Protection and Selectivity. IEEE Trans. Ind. Appl. 2014, 50, 1639–1648. [Google Scholar] [CrossRef]
- Elkalashy, N.I.; Elhaffar, A.M.; Kawady, T.A.; Tarhuni, N.G.; Lehtonen, M. Bayesian Selectivity Technique for Earth Fault Protection in Medium-Voltage Networks. IEEE Trans. Power Deliv. 2010, 25, 2234–2245. [Google Scholar] [CrossRef]
- Nikander, A. Development and Testing of New Equipment for Faulty Phase Earthing by Applying RTDS. IEEE Trans. Power Deliv. 2017, 32, 1295–1302. [Google Scholar] [CrossRef]
- Angrisani, L.; Bonavolontà, F.; Liccardo, A.; Schiano Lo Moriello, R. Identification and classification of transformers current transients through Huang Hilbert Transform. Measurement 2018, 125, 123–132. [Google Scholar] [CrossRef]
- Bonavolonta, F.; D’Arco, M.; Ianniello, G.; Liccardo, A.; Moriello, R.; Ferrigno, L.; Laracca, M.; Miele, G. On the suitability of compressive sampling for the measurement of electrical power quality. In Proceedings of the 2013 IEEE International Instrumentation and Measurement Technology Conference (I2MTC), Minneapolis, MN, USA, 6–9 May 2013; pp. 126–131. [Google Scholar]
- Bonavolontà, F.; D’Apuzzo, M.; Liccardo, A.; Miele, G. Harmonic and interharmonic measurements through a compressed sampling approach. Measurement 2016, 77, 1–15. [Google Scholar] [CrossRef]
- Tocchi, A.; Roca, V.; Angrisani, L.; Bonavolontà, F.; Moriello, R.S.L. First step towards an IoT implementation of a wireless sensors network for environmental radiation monitoring. In Proceedings of the 2017 IEEE International Instrumentation and Measurement Technology Conference (I2MTC), Turin, Italy, 22–25 May 2017; pp. 1–6. [Google Scholar]
- D’adamo, C.; Valtorta, G.; Consiglio, L.; Cerretti, A.; D’orazio, L.; Malerba, A.; Marmeggi, F. Smart fault selection: New operational criteria and challenges for the large-scale deployment in e-distribuzione’s network. CIRED-Open Access Proc. J. 2017, 2017, 1475–1478. [Google Scholar] [CrossRef]
- D’Orazio, L.; Calone, R. Innovative protection system on distribution network. In Proceedings of the 22nd International Conference and Exhibition on Electricity Distribution (CIRED 2013), Stockholm, Sweden, 10–13 June 2013. [Google Scholar]
- Botton, S.; Cavalletto, L.; Marmeggi, F. Schema project-innovative criteria for management and operation of a closed ring MV network. In Proceedings of the 22nd International Conference and Exhibition on Electricity Distribution (CIRED 2013), Stockholm, Sweden, 10–13 June 2013. [Google Scholar]
- Spalding, R.A.; Rosa, L.H.L.; Almeida, C.F.M.; Morais, R.F.; Gouvea, M.R.; Kagan, N.; Mollica, D.; Dominice, A.; Zamboni, L.; Batista, G.H.; et al. Fault Location, Isolation and service restoration (FLISR) functionalities tests in a Smart Grids laboratory for evaluation of the quality of service. In Proceedings of the 2016 17th International Conference on Harmonics and Quality of Power (ICHQP), Belo Horizonte, Brazil, 16–19 October 2016; pp. 879–884. [Google Scholar]
- Angrisani, L.; Arpaia, P.; Bonavolontà, F.; Conti, M.; Liccardo, A. LoRa protocol performance assessment in critical noise conditions. In Proceedings of the 2017 IEEE 3rd International Forum on Research and Technologies for Society and Industry (RTSI), Modena, Italy, 11–13 September 2017; pp. 1–5. [Google Scholar]
- Reynders, B.; Pollin, S. Chirp spread spectrum as a modulation technique for long range communication. In Proceedings of the 2016 IEEE Symposium on Communications and Vehicular Technologies (SCVT), Mons, Belgium, 22 November 2016; pp. 1–5. [Google Scholar]
- Zhu, G.; Liao, C.H.; Suzuki, M.; Narusue, Y.; Morikawa, H. Evaluation of LoRa receiver performance under co-technology interference. In Proceedings of the 2018 15th IEEE Annual Consumer Communications & Networking Conference (CCNC), Las Vegas, NV, USA, 12–15 January 2018; pp. 1–7. [Google Scholar]
- Orfanidis, C.; Feeney, L.M.; Jacobsson, M.; Gunningberg, P. Investigating interference between LoRa and IEEE 802. In 15. 4g networks. In Proceedings of the 2017 IEEEWireless and Mobile Computing, Networking and Communications (WiMob), Rome, Italy, 9–11 October 2017; pp. 1–8. [Google Scholar]
- Semtech. LoRa Modulation Basics; Technical Report; Semtech: Camarillo, CA, USA, 2017. [Google Scholar]
- Magrin, D.; Centenaro, M.; Vangelista, L. Performance evaluation of LoRa networks in a smart city scenario. In Proceedings of the 2017 IEEE International Conference on Communications (ICC), Paris, France, 21–25 May 2017; pp. 1–7. [Google Scholar]
- Semtech. SX1272/73—860 MHz to 1020 MHz Low Power Long Range Transceiver Datasheet; Technical Report; Semtech: Camarillo, CA, USA, 2017. [Google Scholar]
- Adelantado, F.; Vilajosana, X.; Tuset-Peiro, P.; Martinez, B.; Melia-Segui, J.; Watteyne, T. Understanding the limits of LoRaWAN. IEEE Commun. Mag. 2017, 55, 34–40. [Google Scholar] [CrossRef]
- Dedè, A.; Giustina, D.D.; Franzoni, F.; Pegoiani, A. IEC 61850-based logic selectivity scheme for the MV distribution network. In Proceedings of the 2014 IEEE International Workshop on Applied Measurements for Power Systems Proceedings (AMPS), Aachen, Germany, 24–26 September 2014; pp. 1–5. [Google Scholar]
- Giustina, D.D.; Ferrari, P.; Flammini, A.; Rinaldi, S.; Sisinni, E. Automation of Distribution Grids With IEC 61850: A First Approach Using Broadband Power Line Communication. IEEE Trans. Instrum. Meas. 2013, 62, 2372–2383. [Google Scholar] [CrossRef]
- Kay, J.A.; Kumpulainen, L. Maximizing protection by minimizing arcing times in medium-voltage systems. IEEE Trans. Ind. Appl. 2013, 49, 1920–1927. [Google Scholar] [CrossRef]
- Bonavolontà, F.; Tedesco, A.; Moriello, R.S.L.; Tufano, A. Enabling wireless technologies for industry 4.0: State of the art. In Proceedings of the 2017 IEEE International Workshop on Measurement and Networking (M&N), Naples, Italy, 27–29 September 2017; pp. 1–5. [Google Scholar]
- Gore, R.N.; Valsan, S.P. Wireless communication technologies for smart grid (WAMS) deployment. In Proceedings of the 2018 IEEE International Conference on Industrial Technology (ICIT), Lyon, France, 20–22 February 2018; pp. 1326–1331. [Google Scholar]
- Giustina, D.D.; Dedè, A.; Invernizzi, G.; Valle, D.P.; Franzoni, F.; Pegoiani, A.; Cremaschini, L. Smart Grid Automation Based on IEC 61850: An Experimental Characterization. IEEE Trans. Instrum. Meas. 2015, 64, 2055–2063. [Google Scholar] [CrossRef]
- Sauter, T.; Lobashov, M. End-to-End Communication Architecture for Smart Grids. IEEE Trans. Ind. Electron. 2011, 58, 1218–1228. [Google Scholar] [CrossRef]
- Della Giustina, D.; Andersson, L.; Iglesias, G.J.R. Experimental performance characterization of a meshed network for the smart grid. In Proceedings of the 2013 4th IEEE/PES Innovative Smart Grid Technologies Europe (ISGT EUROPE), Lyngby, Denmark, 6–9 October 2013; pp. 1–5. [Google Scholar]
- Cataliotti, A.; Cosentino, V.; Cara, D.D.; Tine, G. Simulation and Laboratory Experimental Tests of a Line to Shield Medium-Voltage Power-Line Communication System. IEEE Trans. Power Deliv. 2011, 26, 2829–2836. [Google Scholar] [CrossRef]
- Chandna, V.K.; Zahida, M. Effect of Varying Topologies on the Performance of Broadband Over Power Line. IEEE Trans. Power Deliv. 2010, 25, 2371–2375. [Google Scholar] [CrossRef]
- Angrisani, L.; Bonavolontà, F.; Tocchi, A.; Moriello, R.S.L. Frequency domain measurement node based on compressive sampling for sensors networks. In Proceedings of the 2015 IEEE International Workshop on Measurements & Networking (M&N), Coimbra, Portugal, 12–13 October 2015; pp. 1–5. [Google Scholar]
- Parikh, P.P.; Sidhu, T.S.; Shami, A. A comprehensive investigation of wireless LAN for IEC 61850–based smart distribution substation applications. IEEE Trans. Ind. Inform. 2013, 9, 1466–1476. [Google Scholar] [CrossRef]
- 61850:2013. Communication Networks and Systems for Power Utility Automation; International Electrotechnical Commission (IEC): Geneva, Switzerland, 2013. [Google Scholar]
- Semtech. LoRa Technology; Technical Report; Semtech: Camarillo, CA, USA, 2017. [Google Scholar]
- Khutsoane, O.; Isong, B.; Abu-Mahfouz, A.M. IoT devices and applications based on LoRa/LoRaWAN. In Proceedings of the IECON 2017—43rd Annual Conference of the IEEE Industrial Electronics Society, Beijing, China, 29 October–1 November 2017; pp. 6107–6112. [Google Scholar]
- Oliveira, R.; Guardalben, L.; Sargento, S. Long range communications in urban and rural environments. In Proceedings of the 2017 IEEE Symposium on Computers and Communications (ISCC), Heraklion, Greece, 3–6 July 2017; pp. 810–817. [Google Scholar]
- Sanchez-Iborra, R.; Sanchez-Gomez, J.; Ballesta-Viñas, J.; Cano, M.D.; Skarmeta, A.F. Performance Evaluation of LoRa Considering Scenario Conditions. Sensors 2018, 18, 772. [Google Scholar] [CrossRef] [PubMed]
- Augustin, A.; Yi, J.; Clausen, T.; Townsley, W.M. A study of LoRa: Long range & low power networks for the internet of things. Sensors 2016, 16, 1466. [Google Scholar]
- Rizzi, M.; Ferrari, P.; Flammini, A.; Sisinni, E. Evaluation of the IoT LoRaWAN solution for distributed measurement applications. IEEE Trans. Instrum. Meas. 2017, 66, 3340–3349. [Google Scholar] [CrossRef]
- CEPT. Recommendation 70-03 Relating to the Use of Short Range Devices (SRD); Technical Report; European Conference of Postal and Telecommunications Administrations (CEPT): Copenhagen, Denmark, 2017. [Google Scholar]
- CEI. Technical Reference Rules for the Users’ Connection to HV and MV Network of Electricity Distributors in Italian; Standard, Italian Electrotechnical Commission (CEI): Rome, Italy, 2014. [Google Scholar]
- CEN. Voltage Characteristics of Electricity Supplied by Public Distribution Networks; Standard European Committee for Standardization (CEN): Bruxelles, Belgium, 2011. [Google Scholar]
- Grigsby, L.L. Electric Power Generation, Transmission, and Distribution; CRC Press: Boca Raton, FL, USA, 2016. [Google Scholar]
Figure 1.
Example of fault management in a medium-voltage (MV) network according to the logic selectivity paradigm. (a) Healthy conditions. (b) Fault between protection relay 2 (PR2) and PR3; transmission of blind signals. (c) Circuit breaker 2 (CB2) tripping, and transmission of the Trip signal to PR3. (d) CB3 tripping and transmission of the Close signal to Tie recloser (TR).

Figure 2.
Timing of the operations of PR1 and PR2 if a fault downstream of PR2 occurs.

Figure 3.
Realized demonstrator for the experimental assessment of the system.

Figure 4.
Microcontroller and transceiver of the realized Long Range (LoRa) node.

Figure 5.
State machine implemented on the microcontroller of a PR.

Figure 6.
Master-slave architecture that allows the PR (i) to simultaneously communicate with the upstream protection PR (i − 1) and the downstream protection PR (i + 1).
Figure 6.
Master-slave architecture that allows the PR (i) to simultaneously communicate with the upstream protection PR (i − 1) and the downstream protection PR (i + 1).

Figure 7.
Image of the realized PR prototype.

Figure 8.
Simultaneous transmission and reception of Blind messages between PRs on different channels.
Figure 8.
Simultaneous transmission and reception of Blind messages between PRs on different channels.

Figure 9.
Time–frequency diagram of a LoRa packet with a duration of 15.46 ms.

Figure 10.
Message exchange between protections during the fault 50.S3 between SR and PR1.

Figure 11.
Digital signals acquired during the fault 50.S3 between SR and PR1.

Figure 12.
Message exchange between protections during the fault 50.S3 between PR2 and PR3.

Figure 13.
Digital signals acquired during the fault 50.S3 between PR2 and PR3.

Figure 14.
Time–frequency diagram of a LoRa packet with a duration of 209.85 ms.

Figure 15.
Digital signals acquired during the fault 67N.S1 between SR and PR1.

Figure 16.
Digital signals acquired during the fault 67N.S1 between PR2 and PR3.

Figure 17.
Time–frequency diagram of a LoRa packet with a duration of 103.42 ms.

Figure 18.
Digital signals acquired during the fault 67N.S1 between SR and PR1, with a LoRa of 103.42 ms.
Figure 18.
Digital signals acquired during the fault 67N.S1 between SR and PR1, with a LoRa of 103.42 ms.

Figure 19.
Messages exchange during a fault 50.S3 between PR3 and TR.

Figure 20.
Acquired Blind messages during a fault between PR3 and TR.

Figure 21.
Acquired digital signals during the fault 50.S3 between PR3 and TR.

Figure 22.
Management of a fault between PR2 and PR3 when a connection problem occurs.


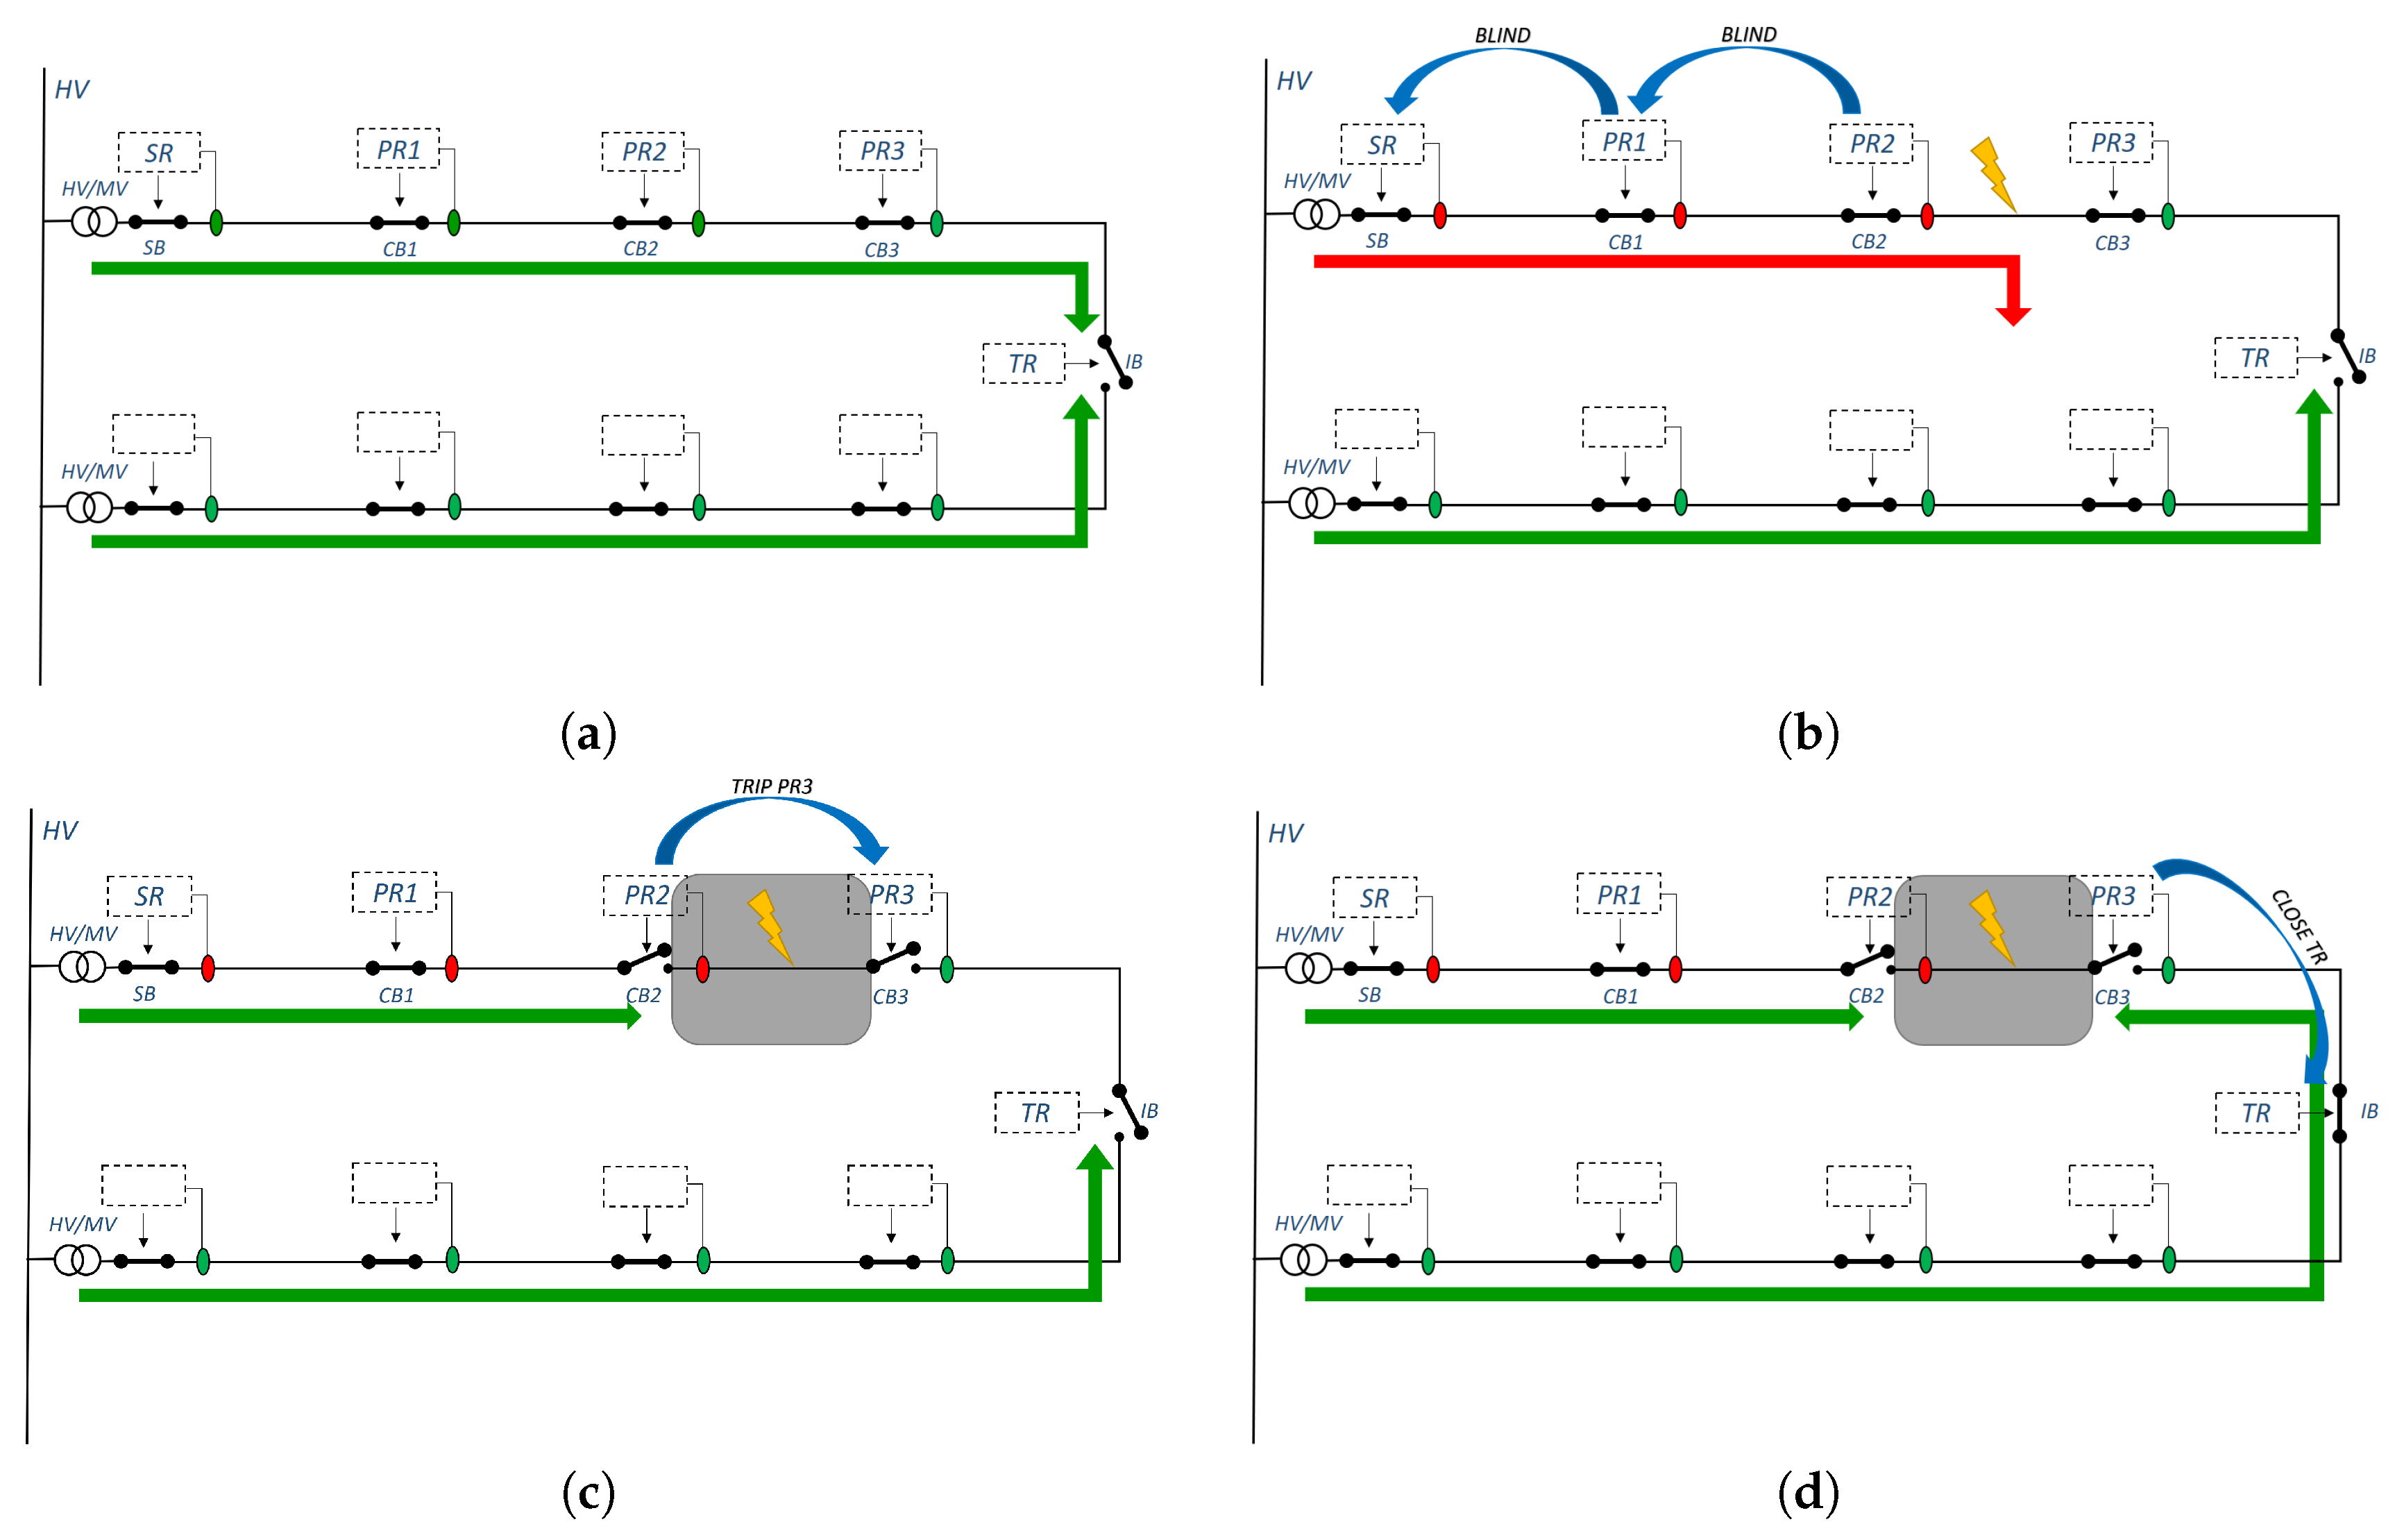
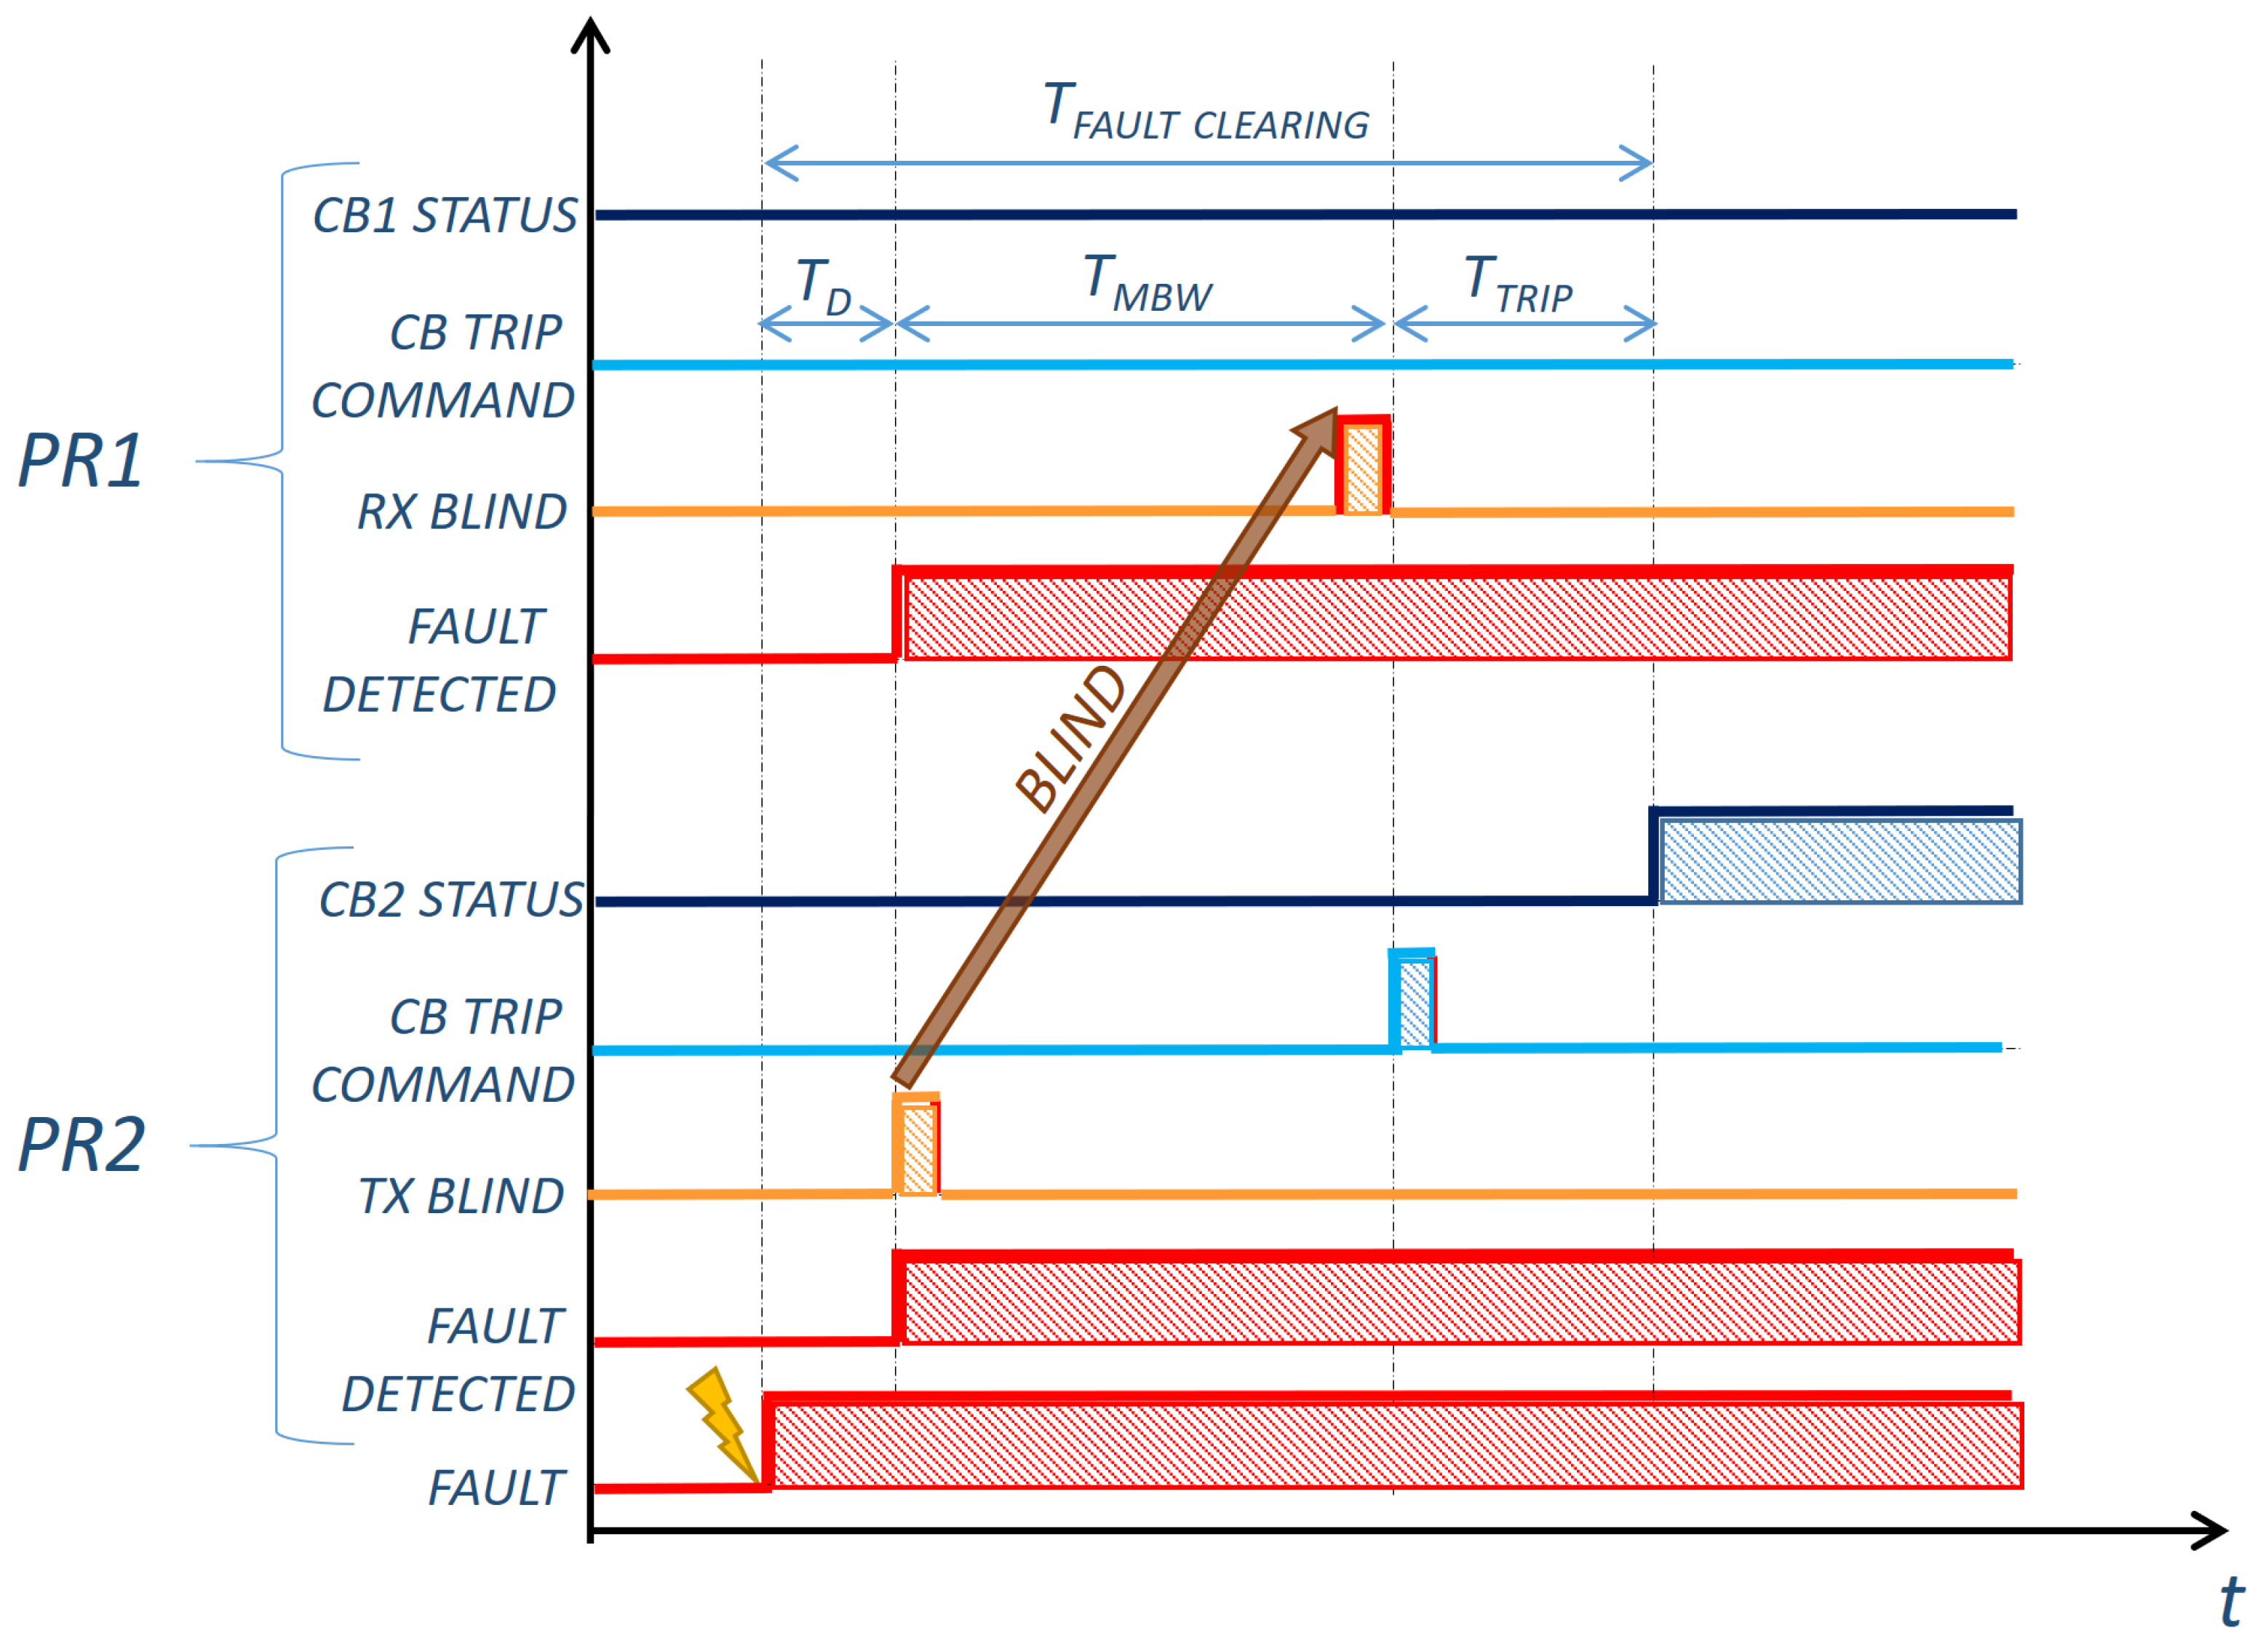
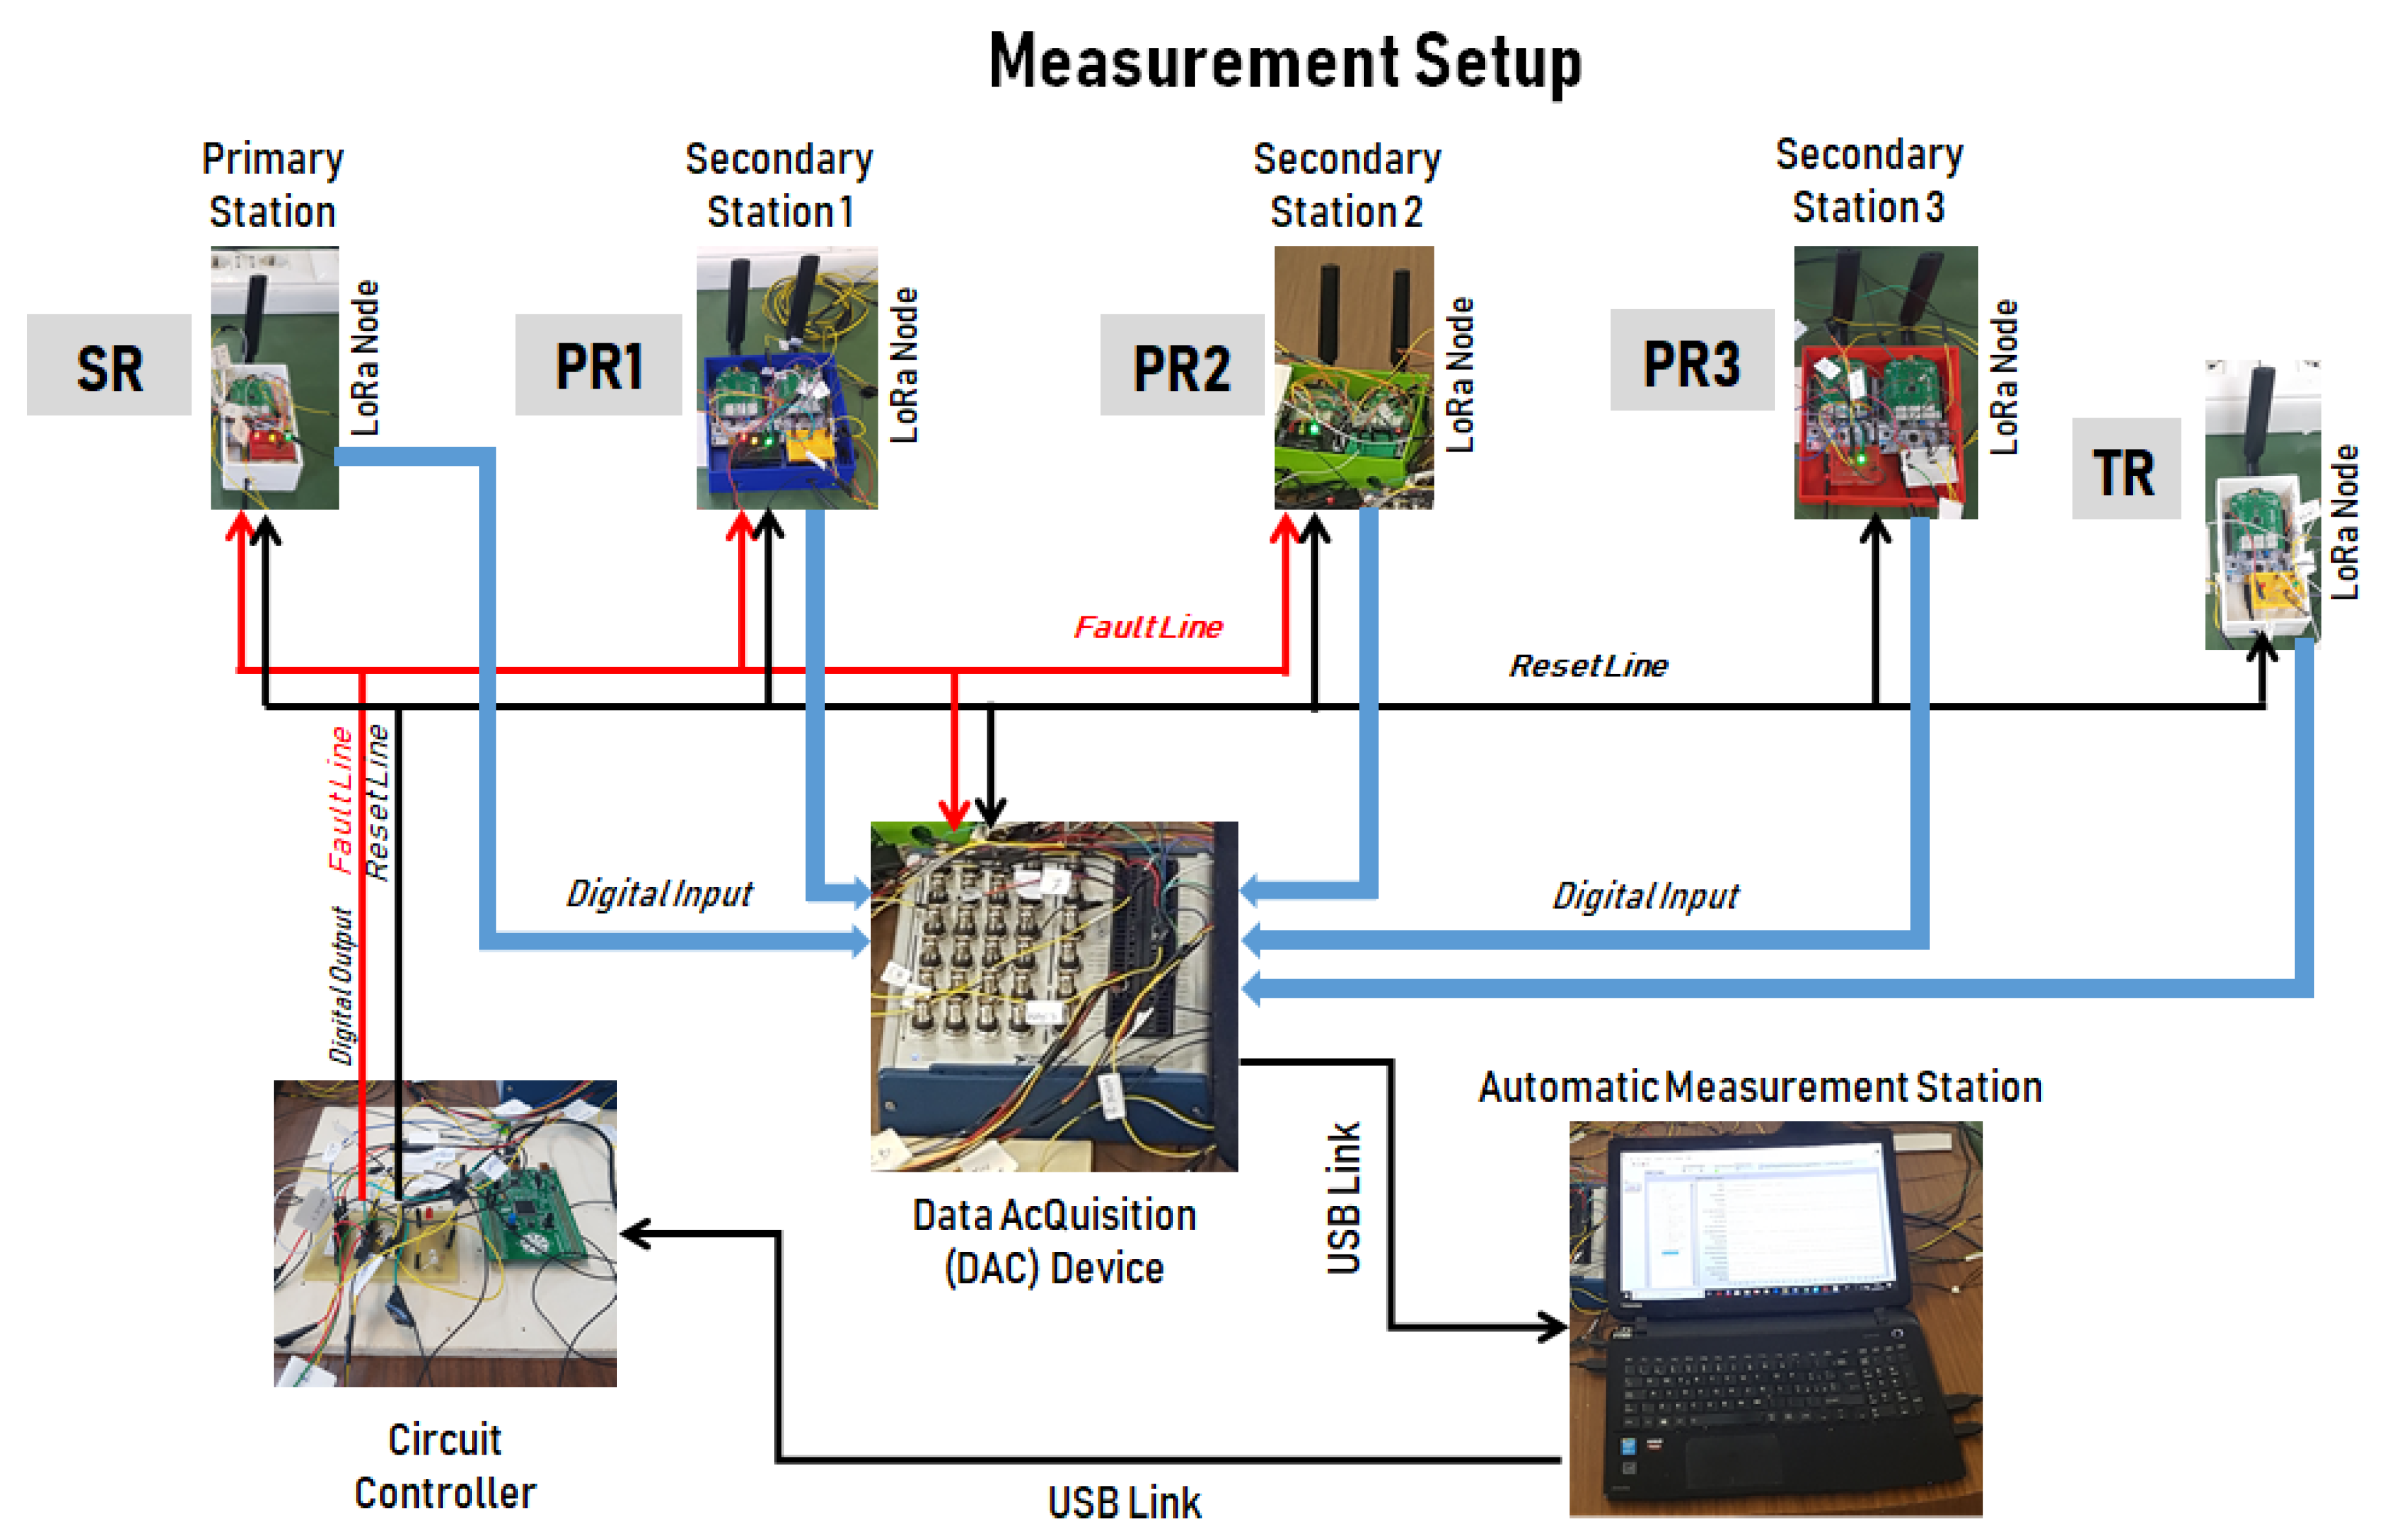
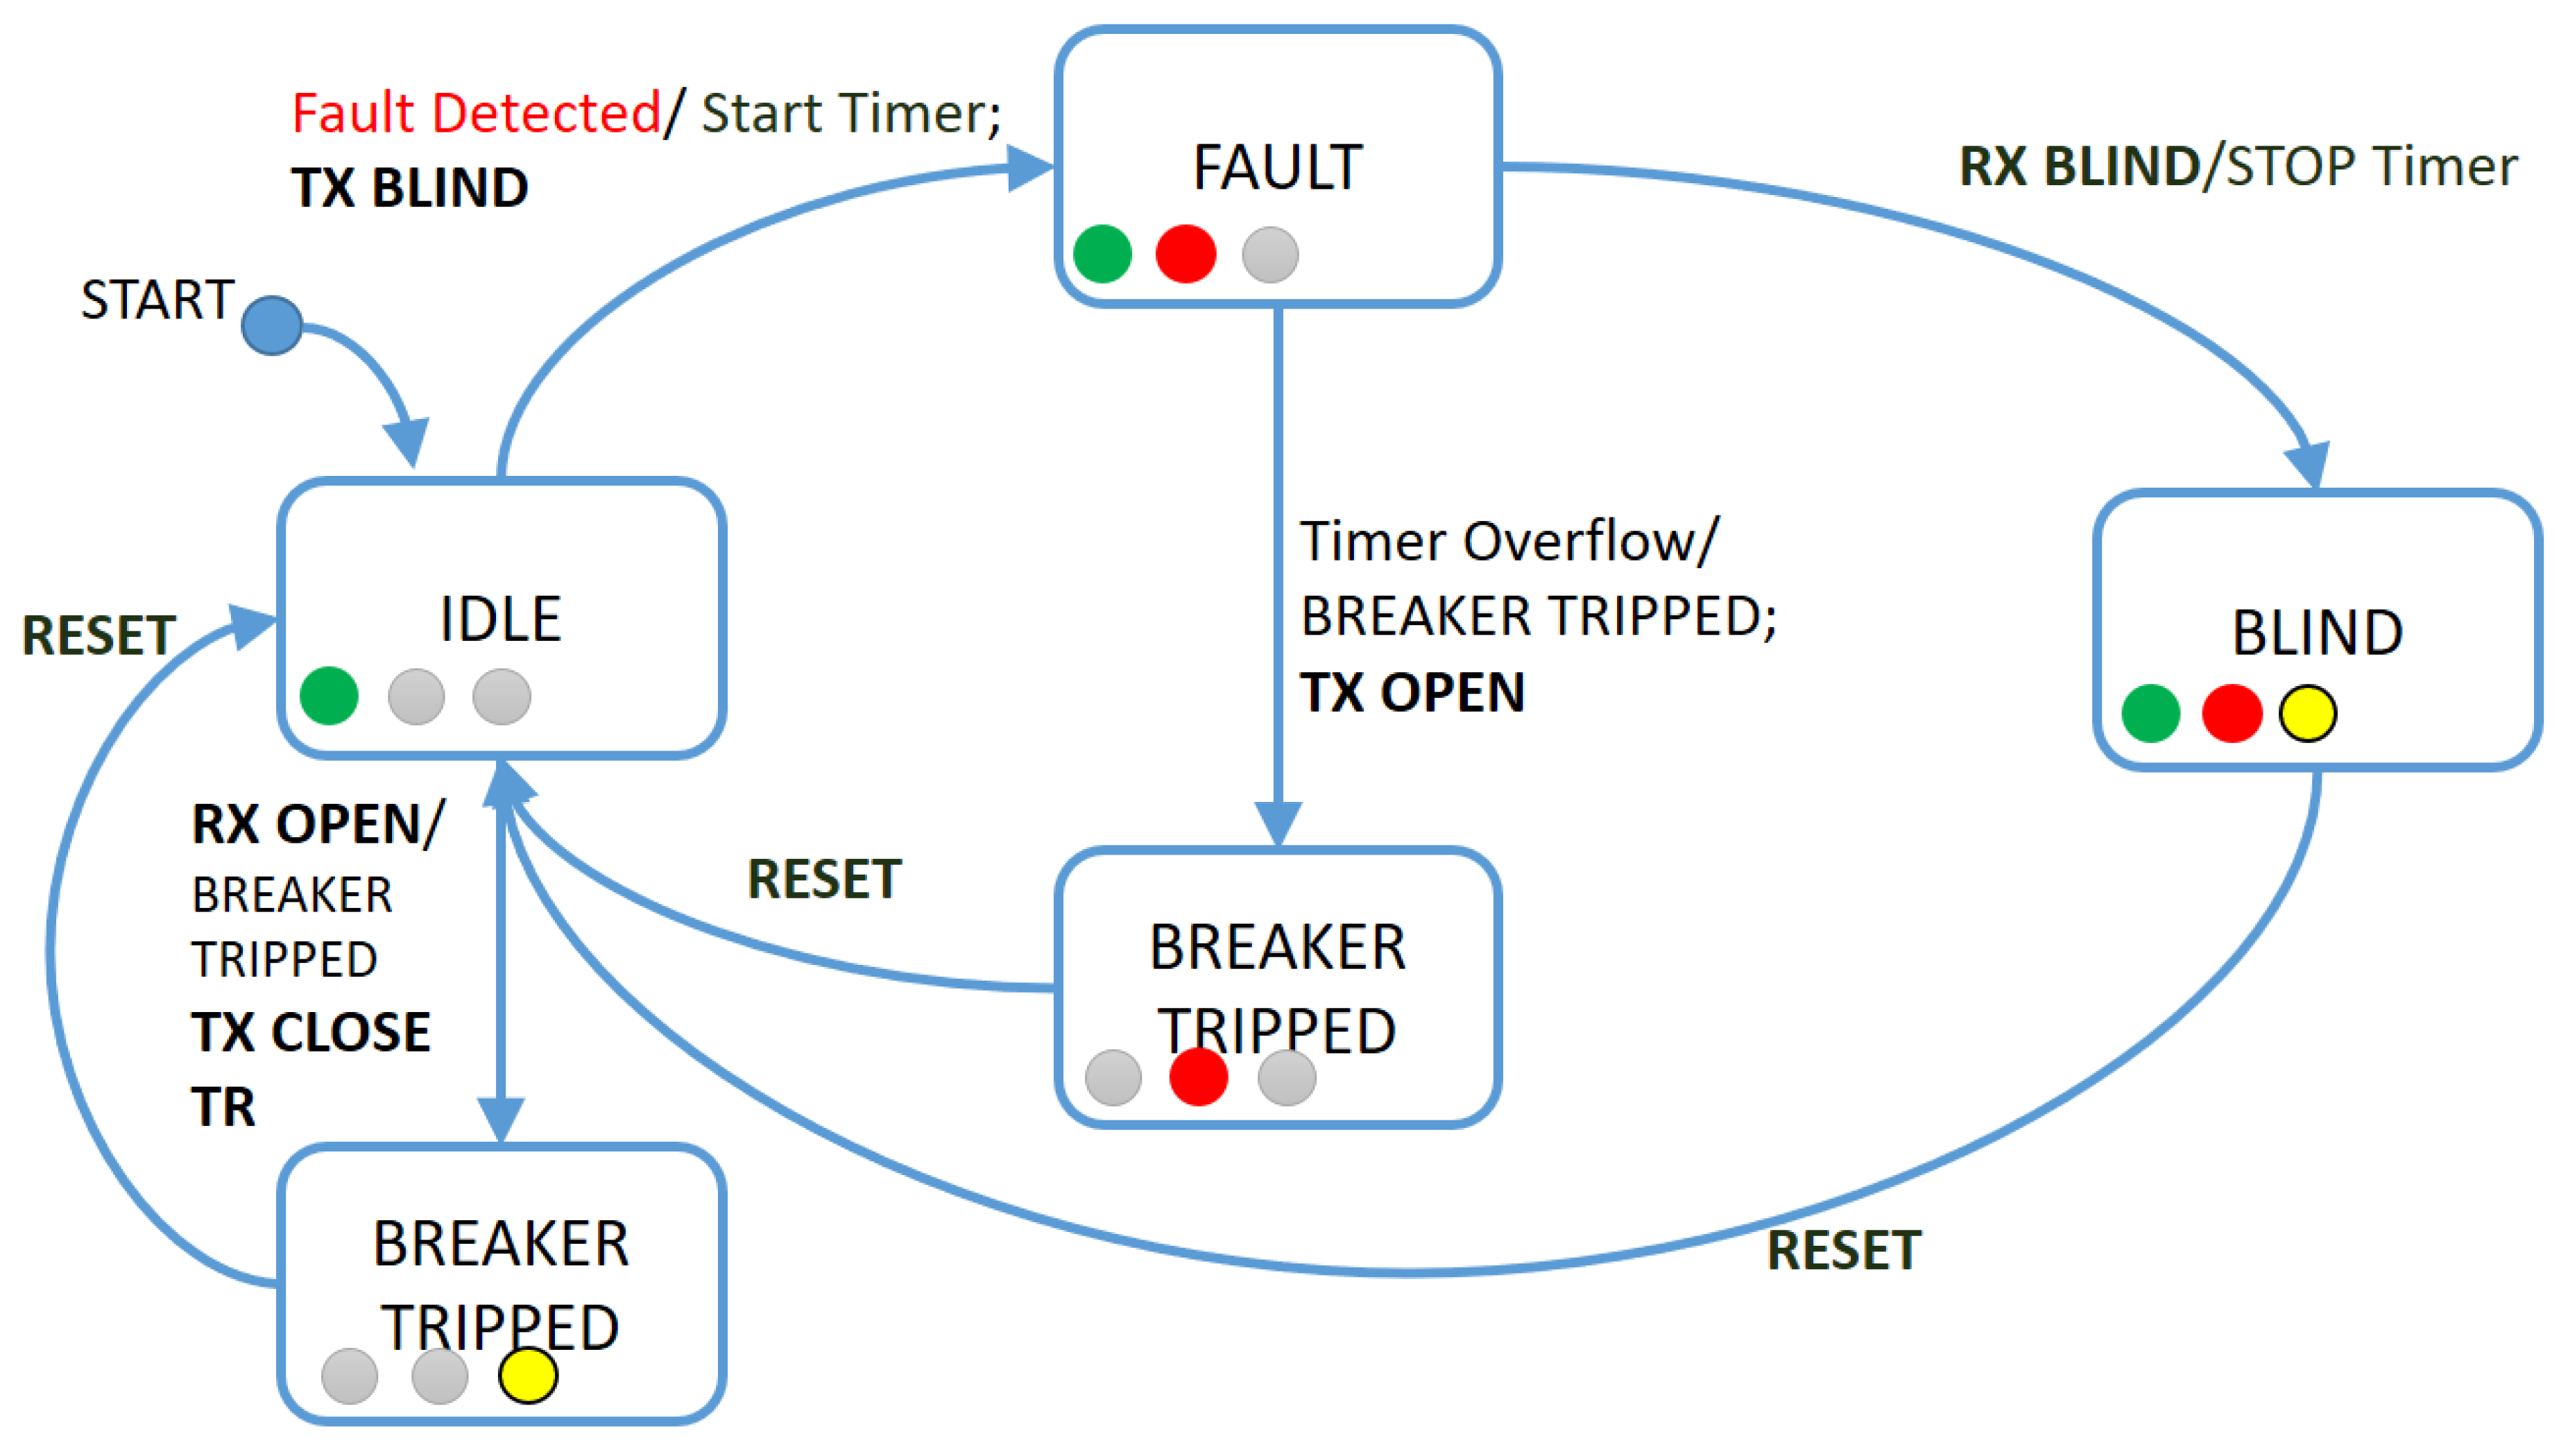
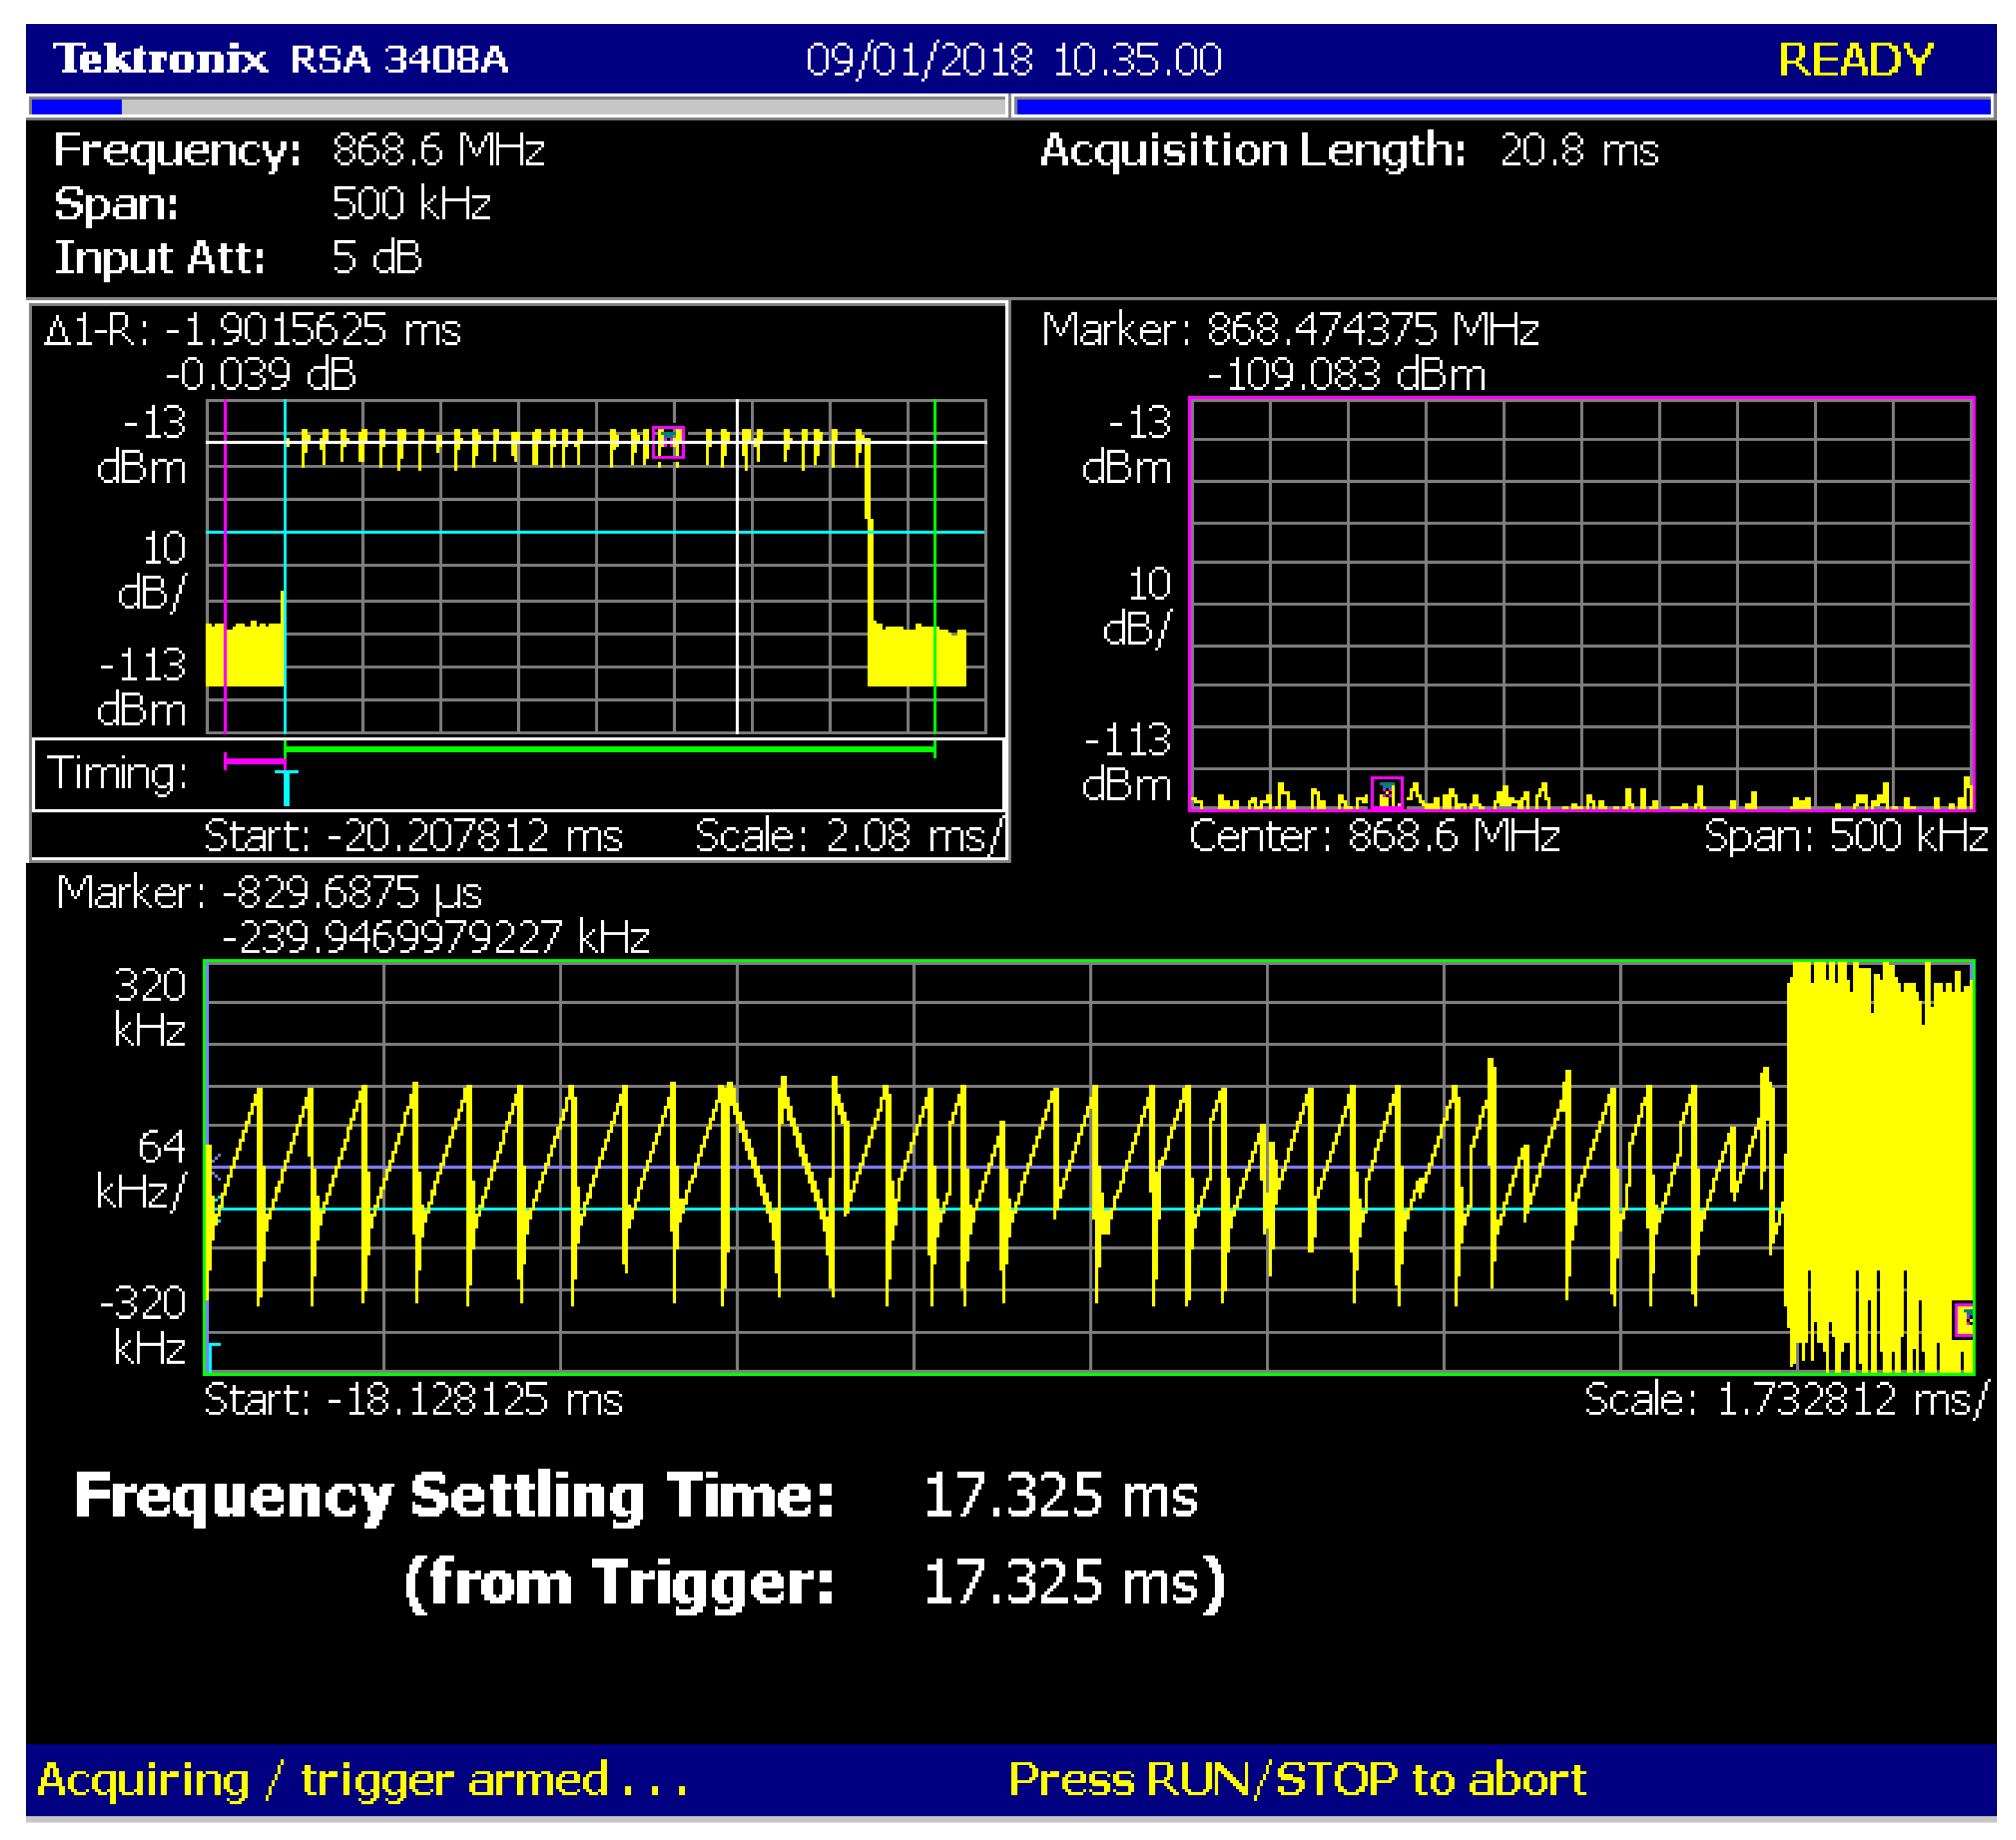
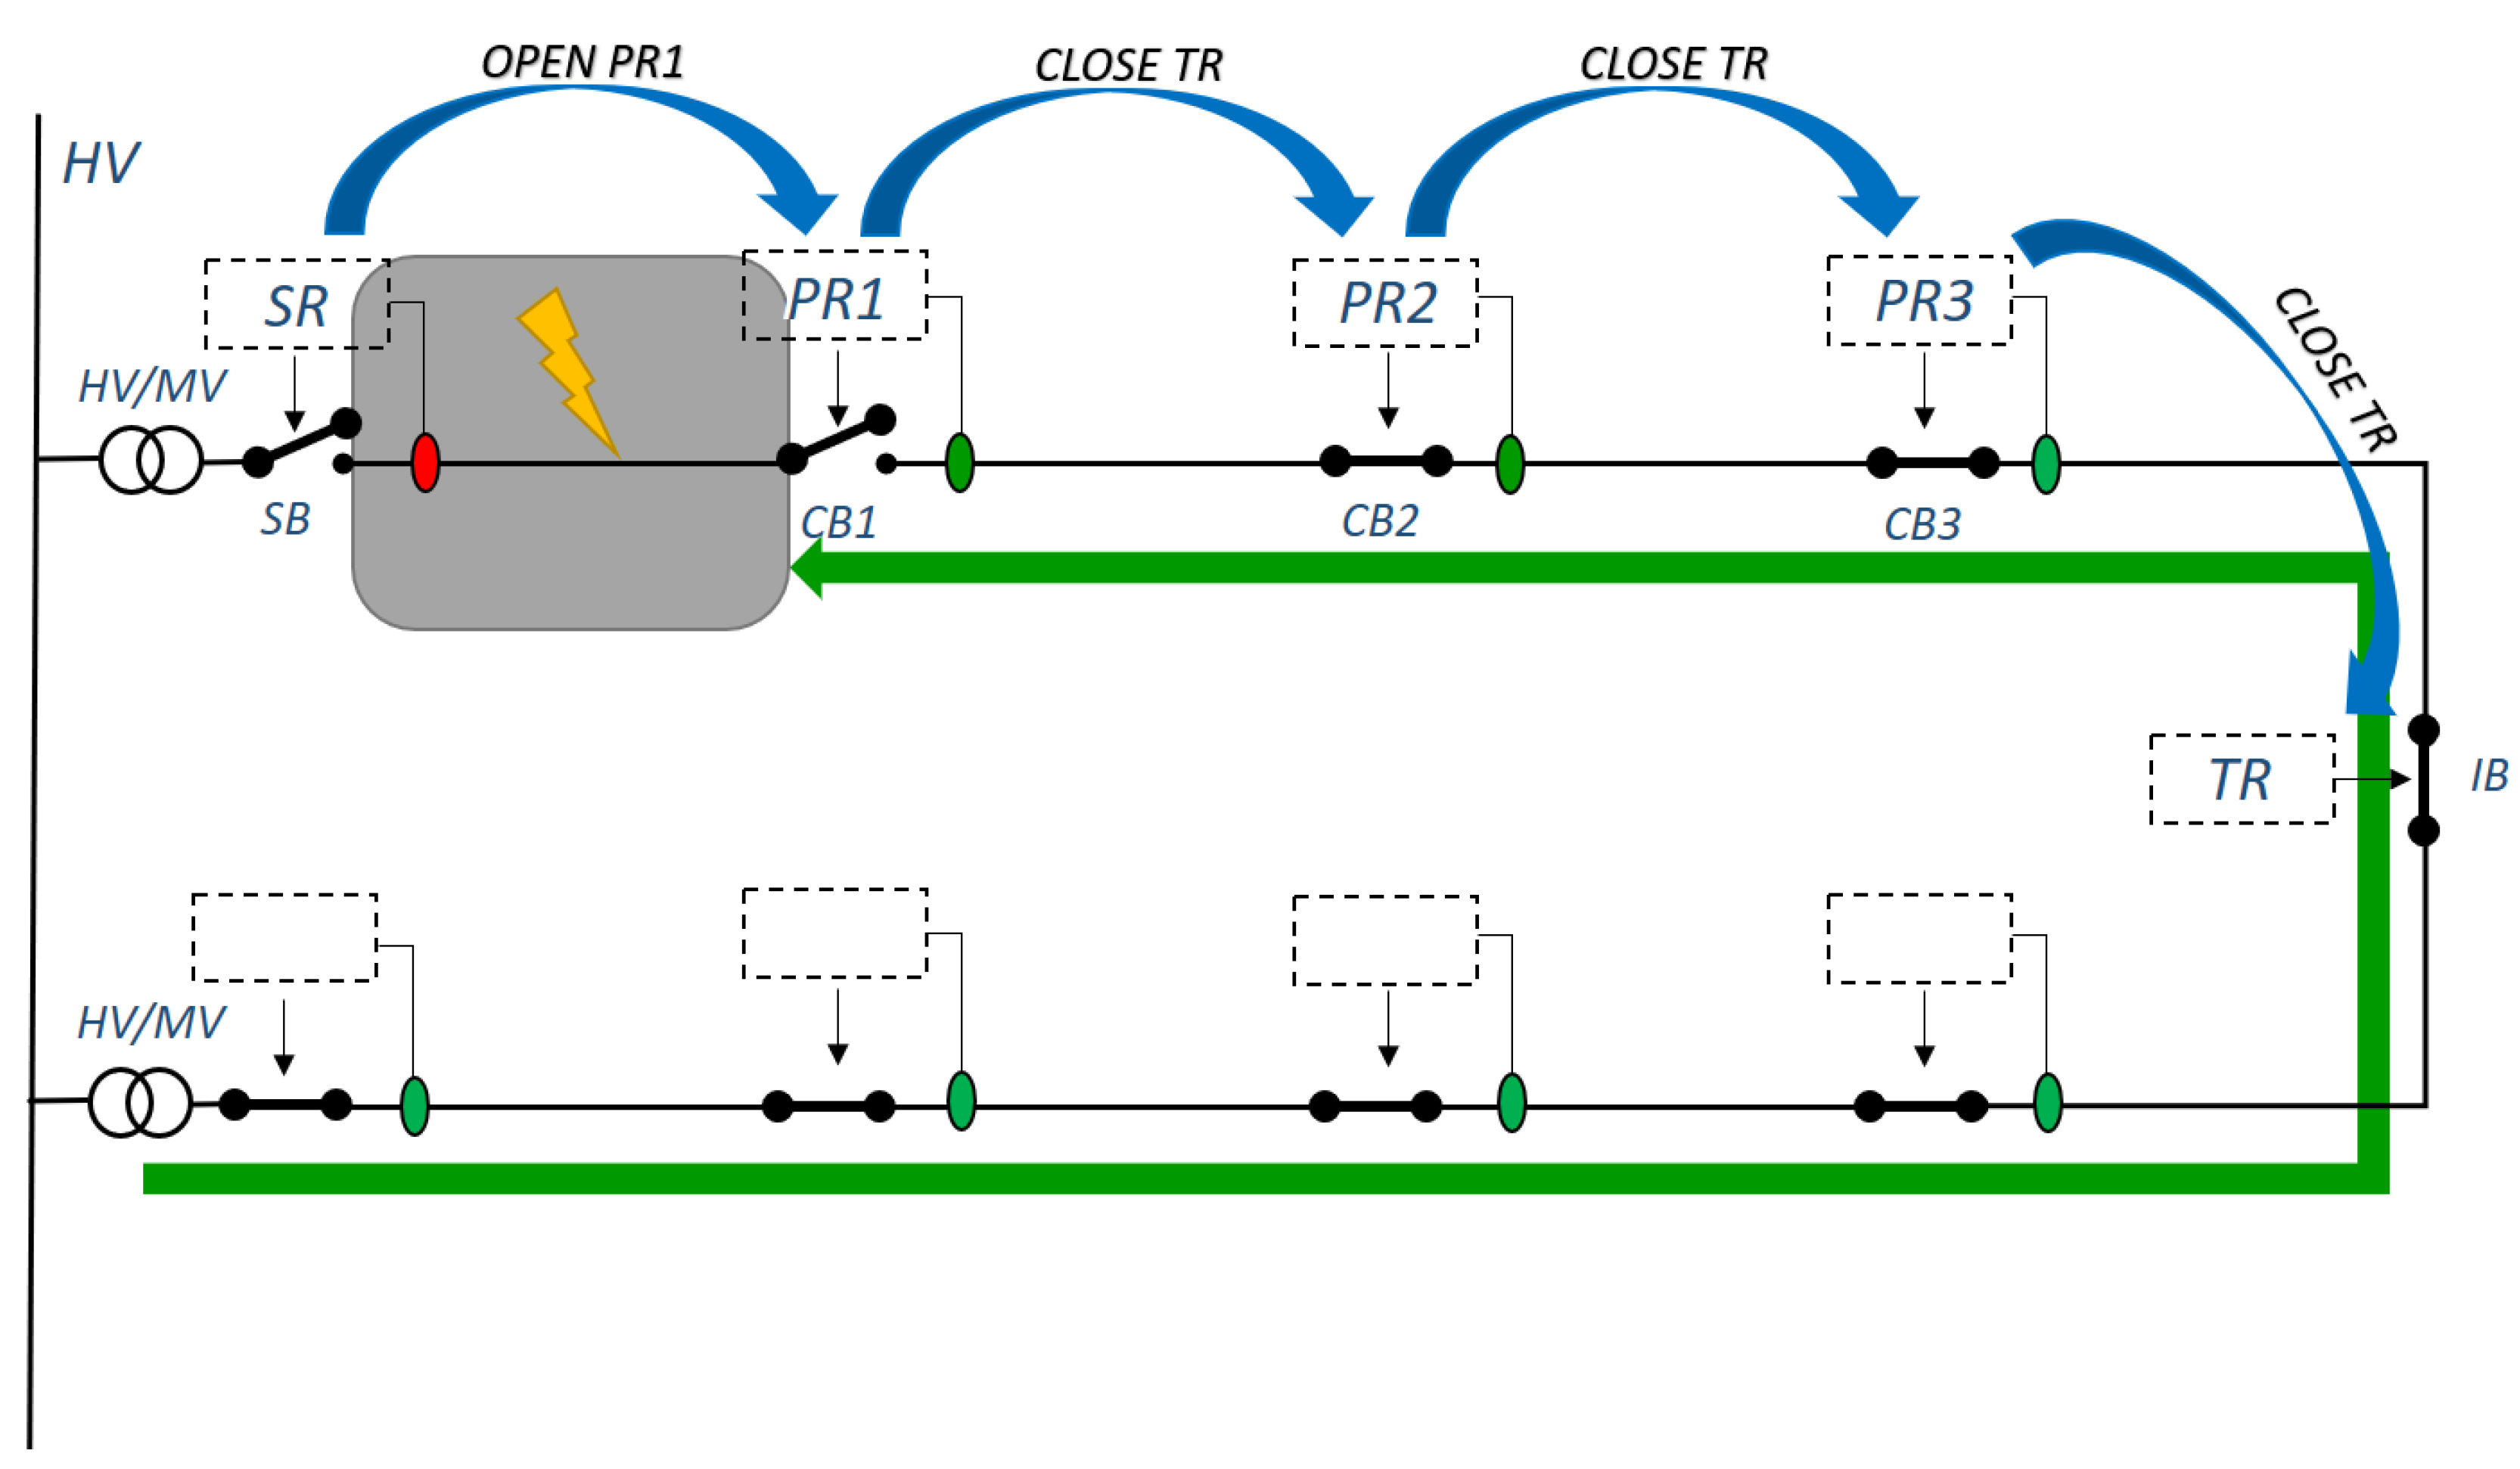
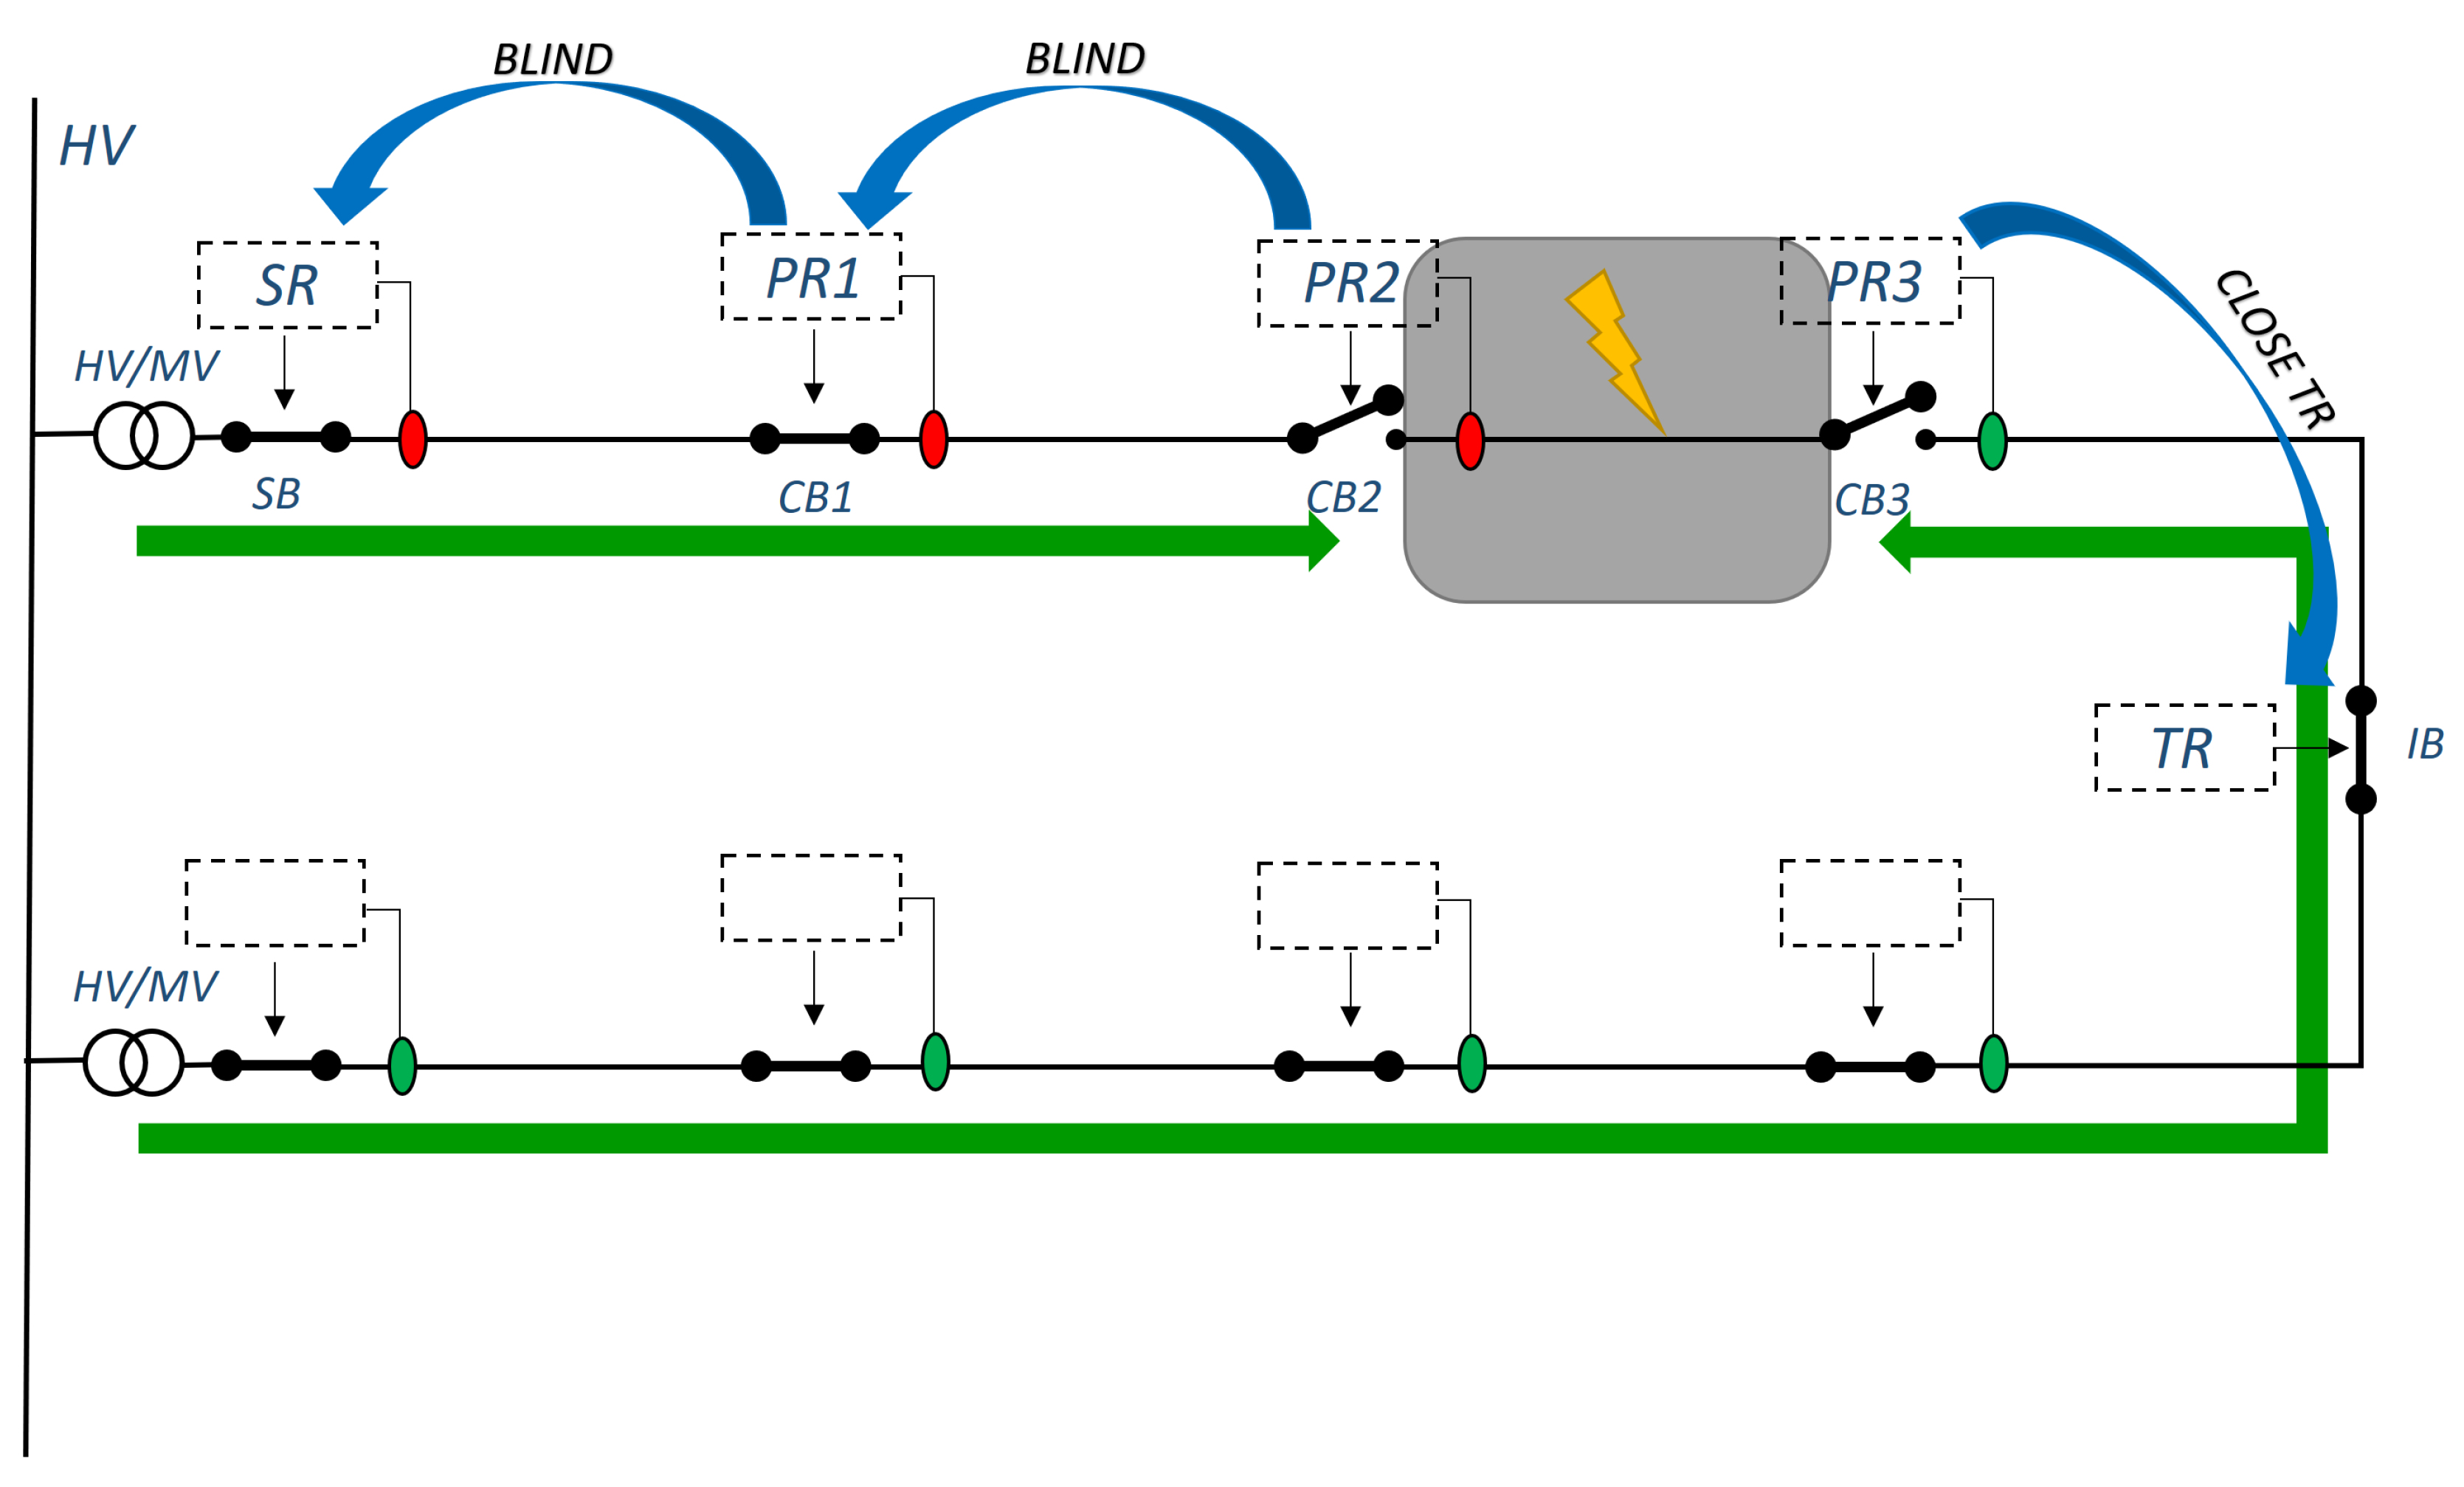
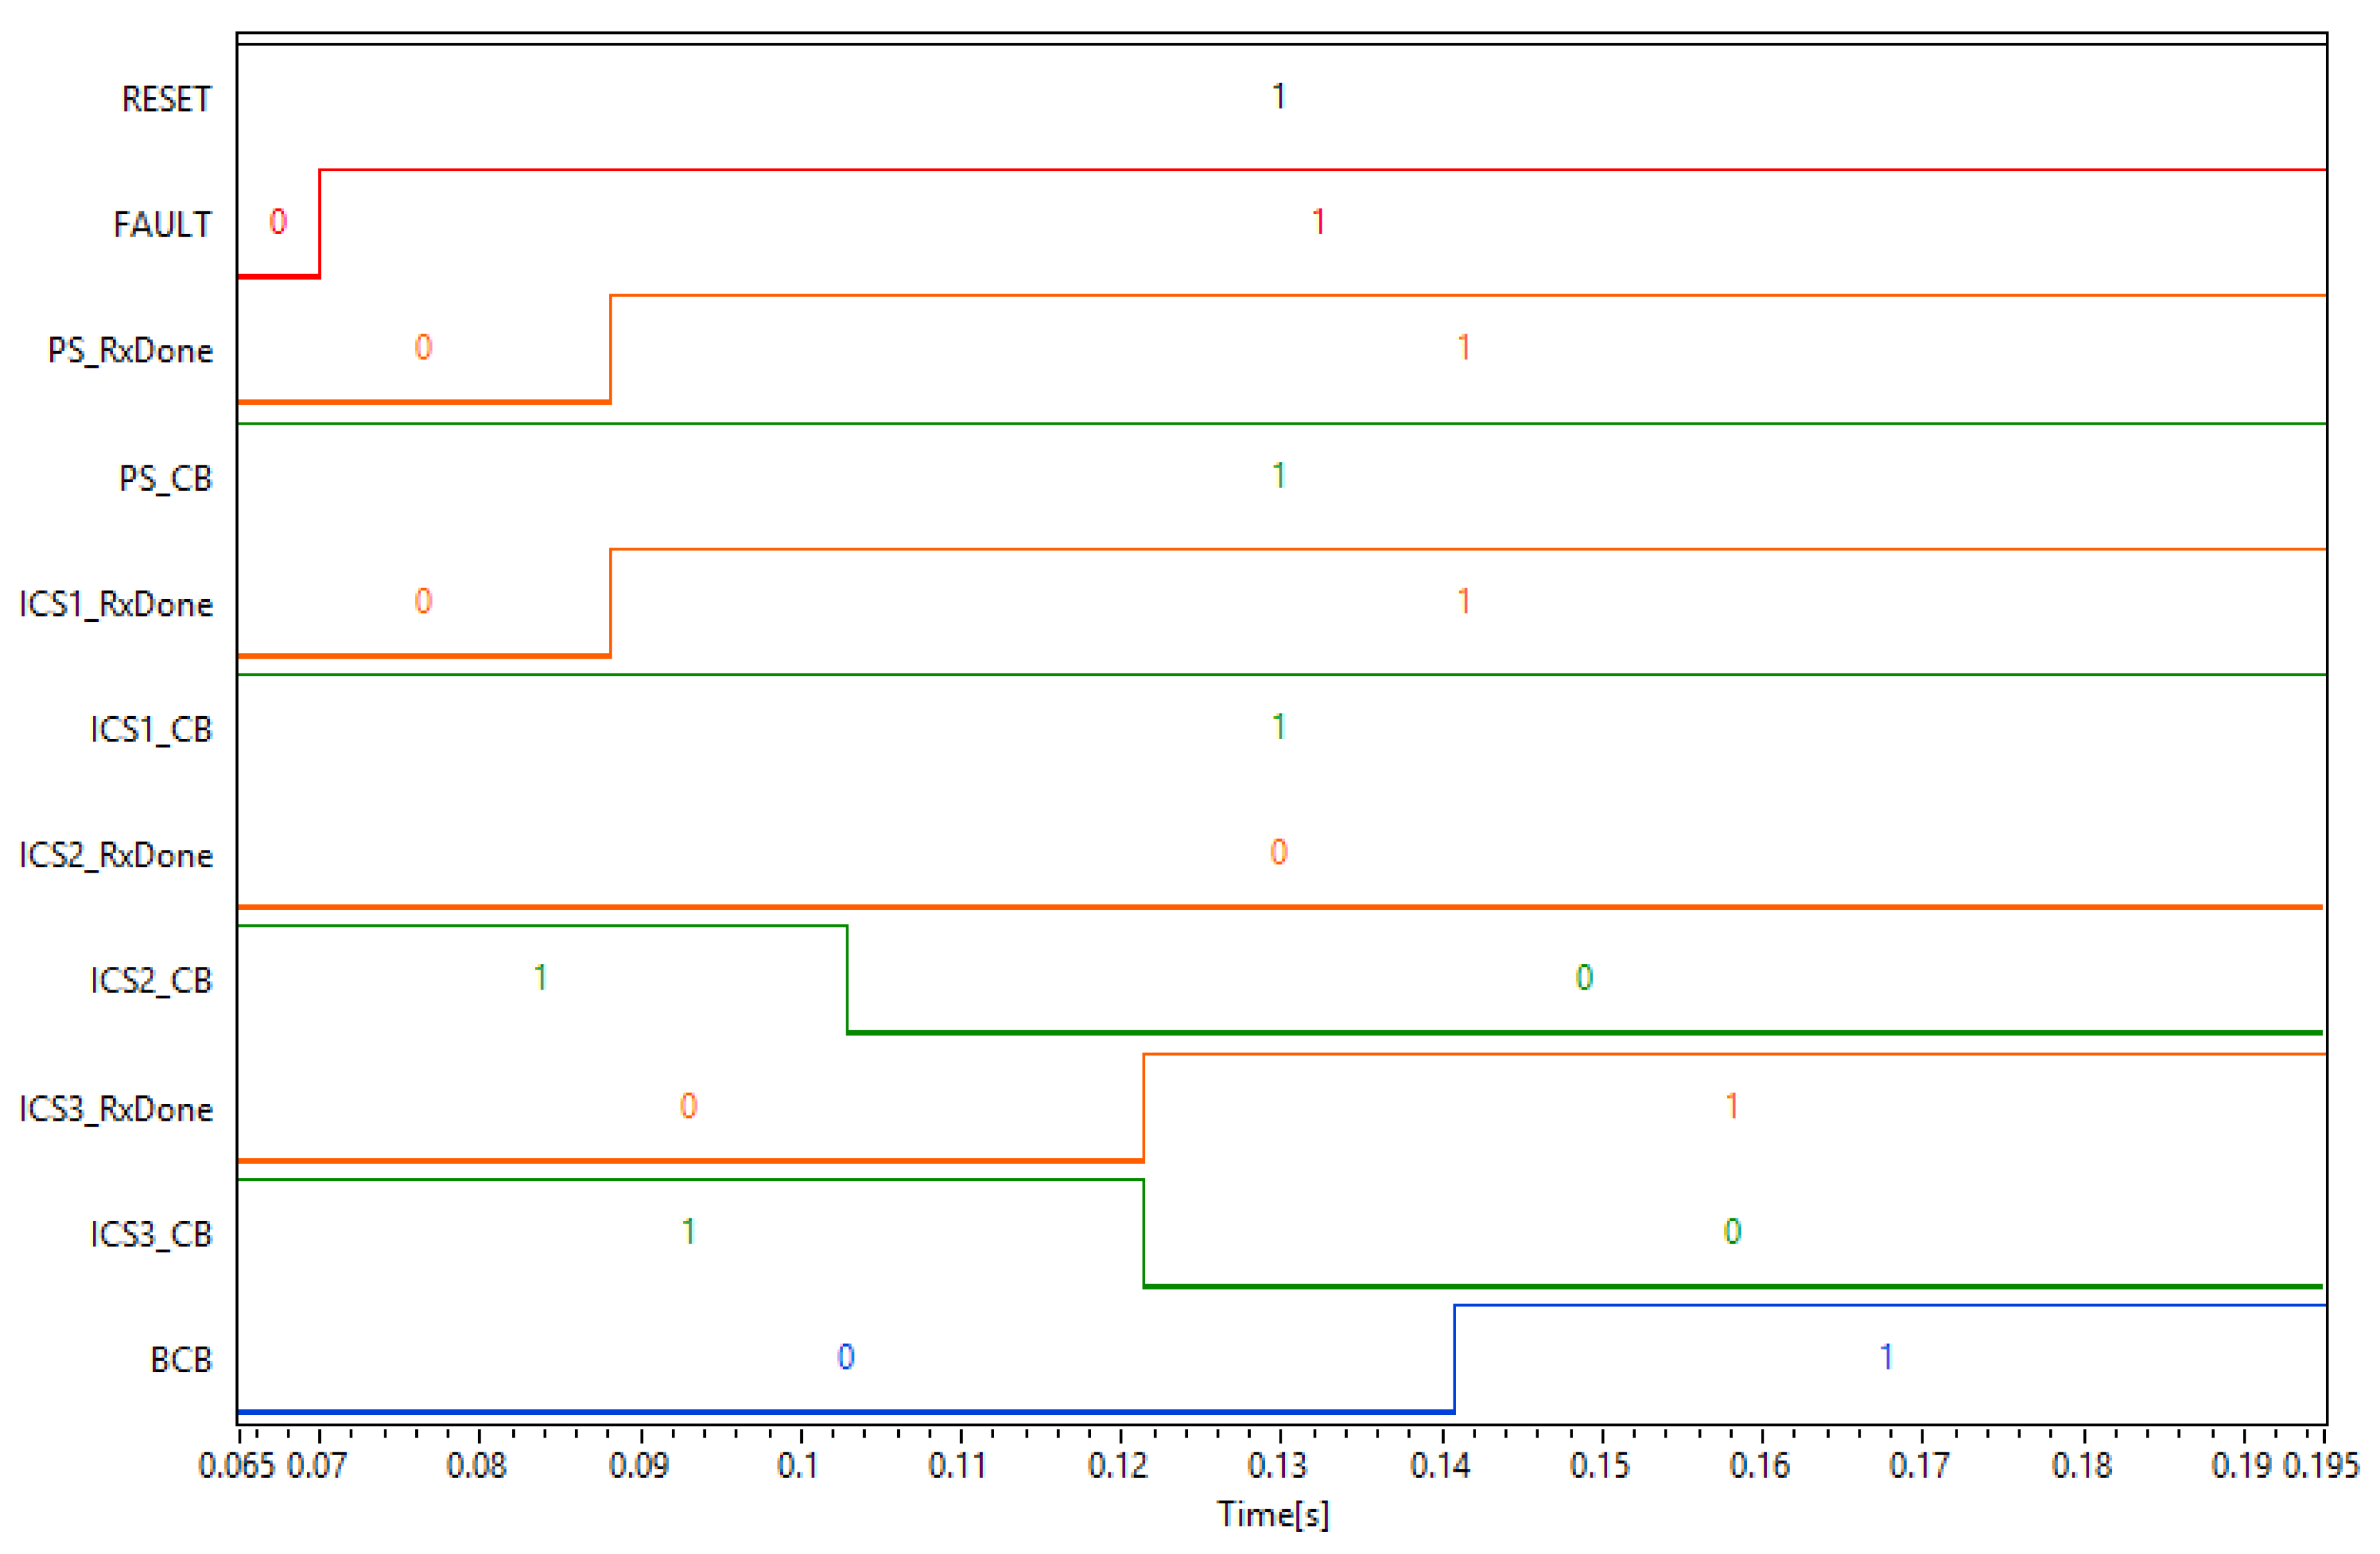
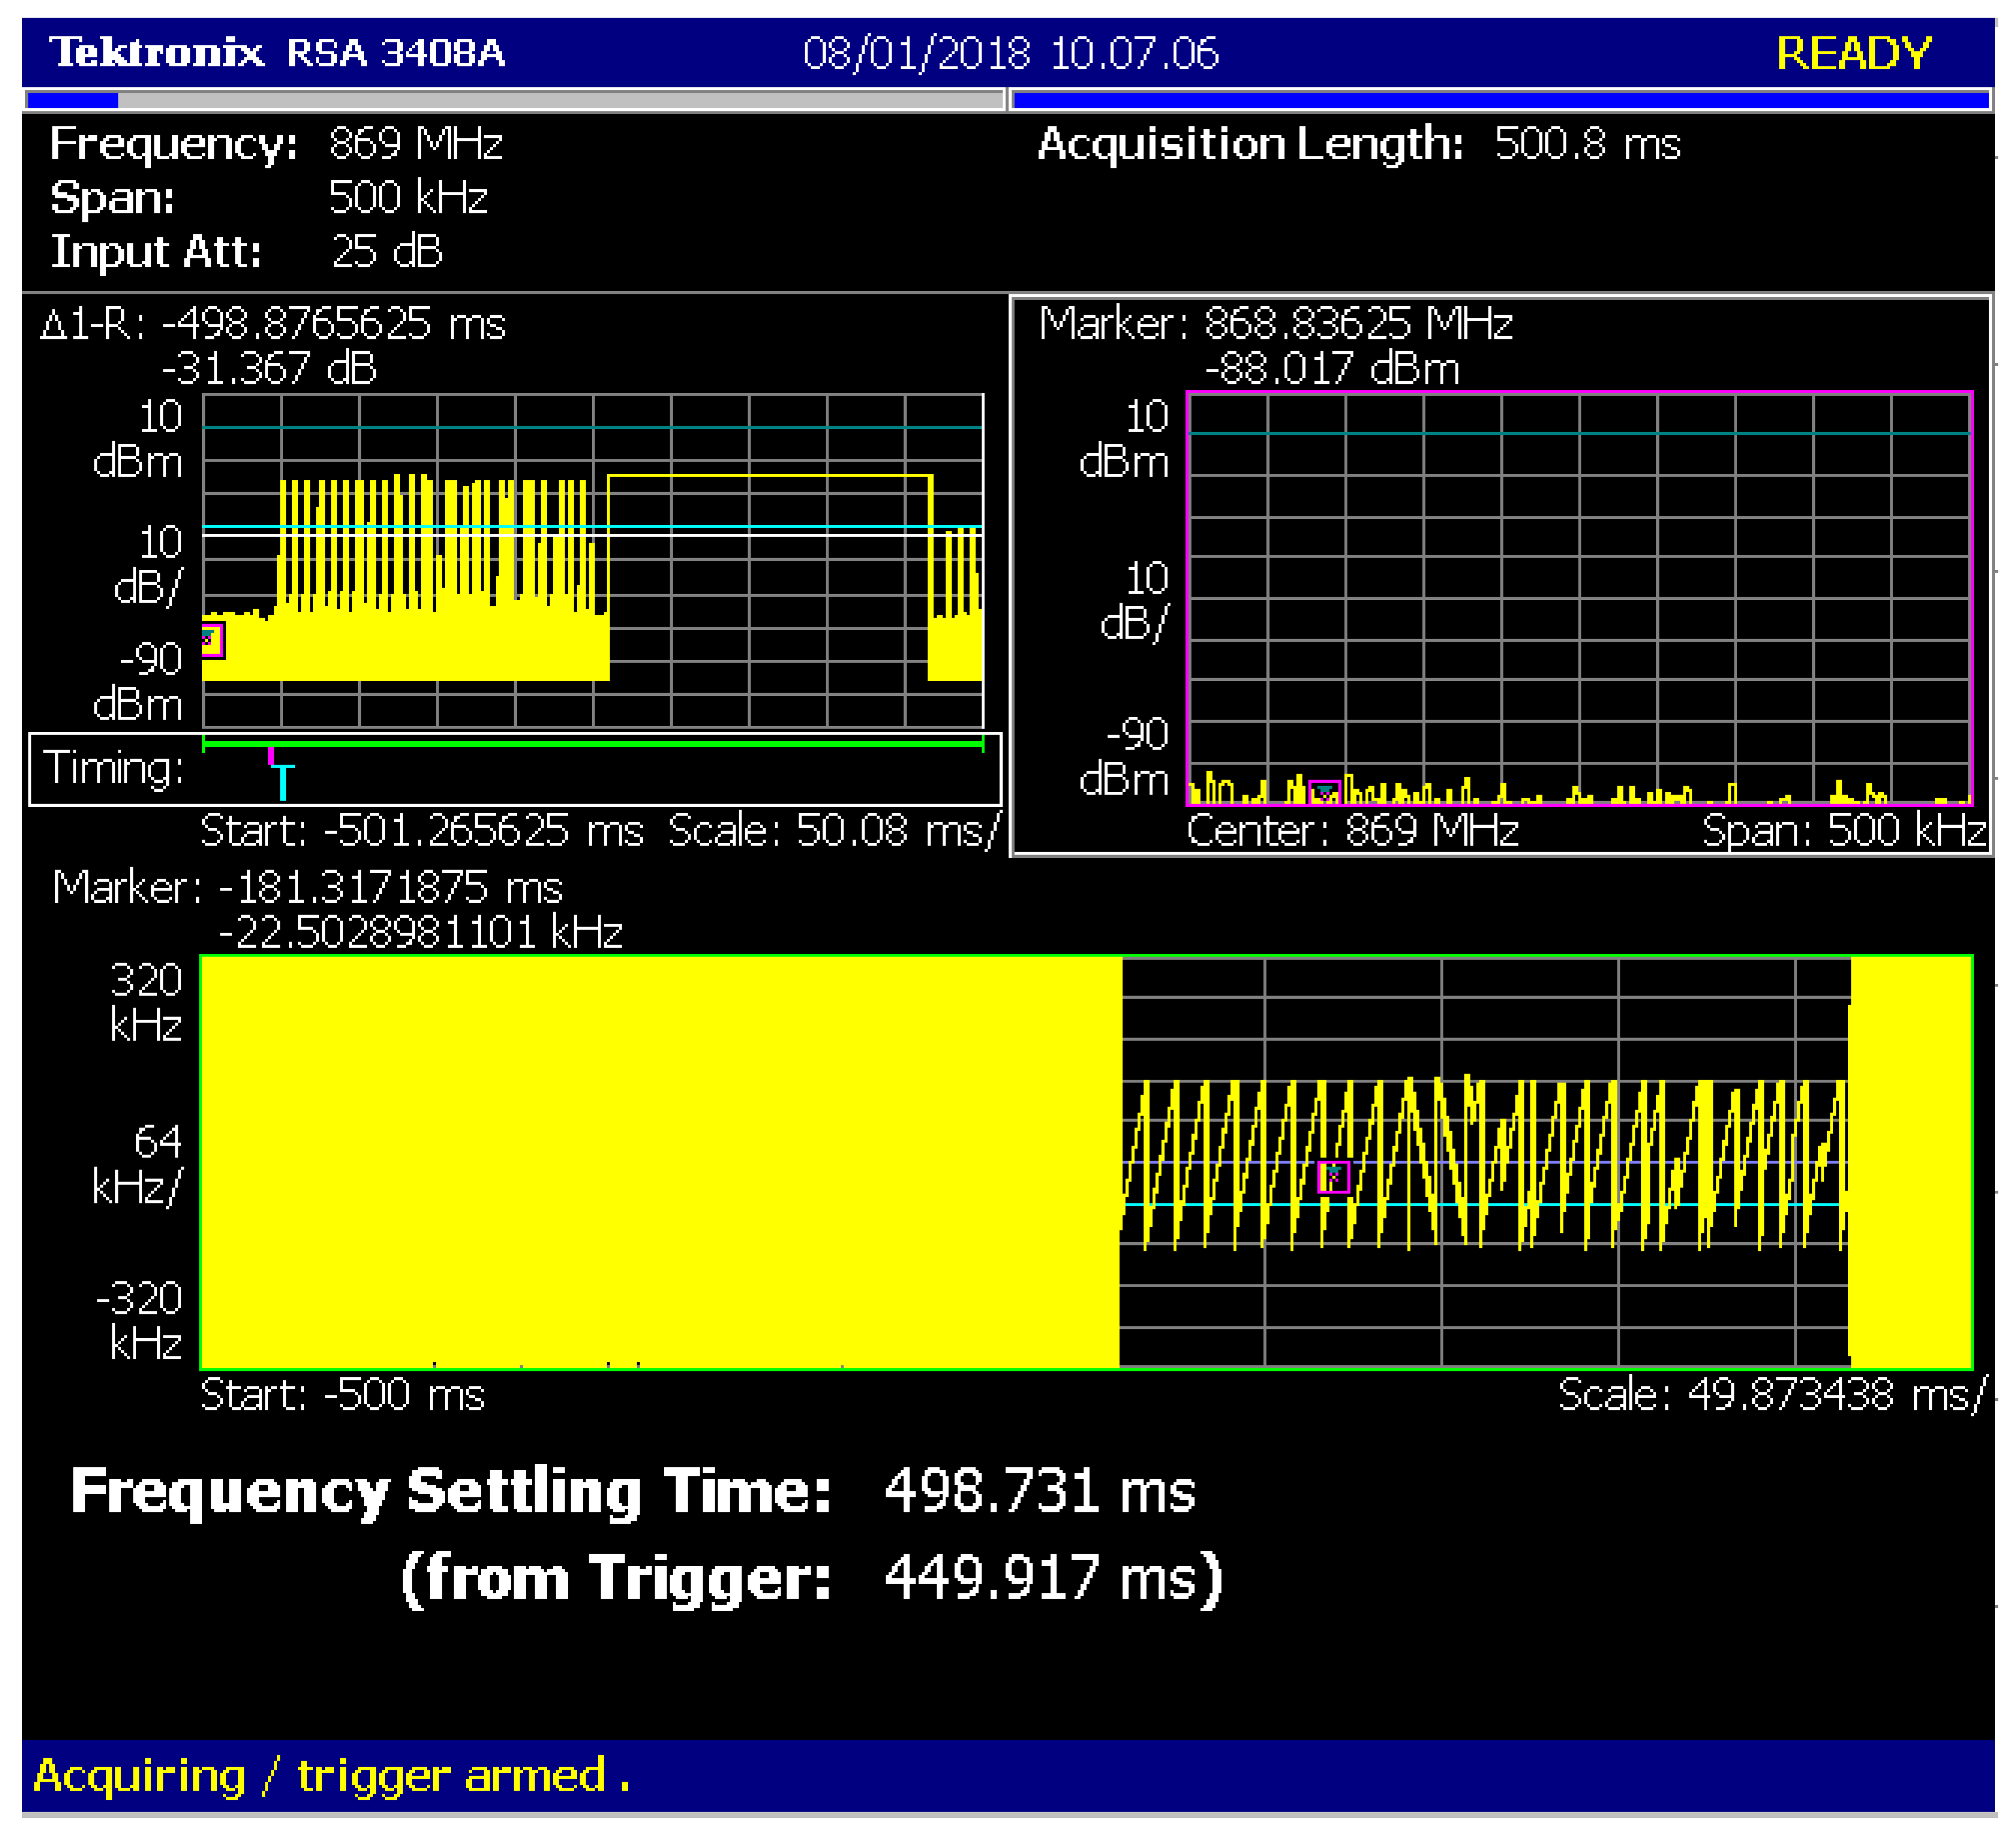
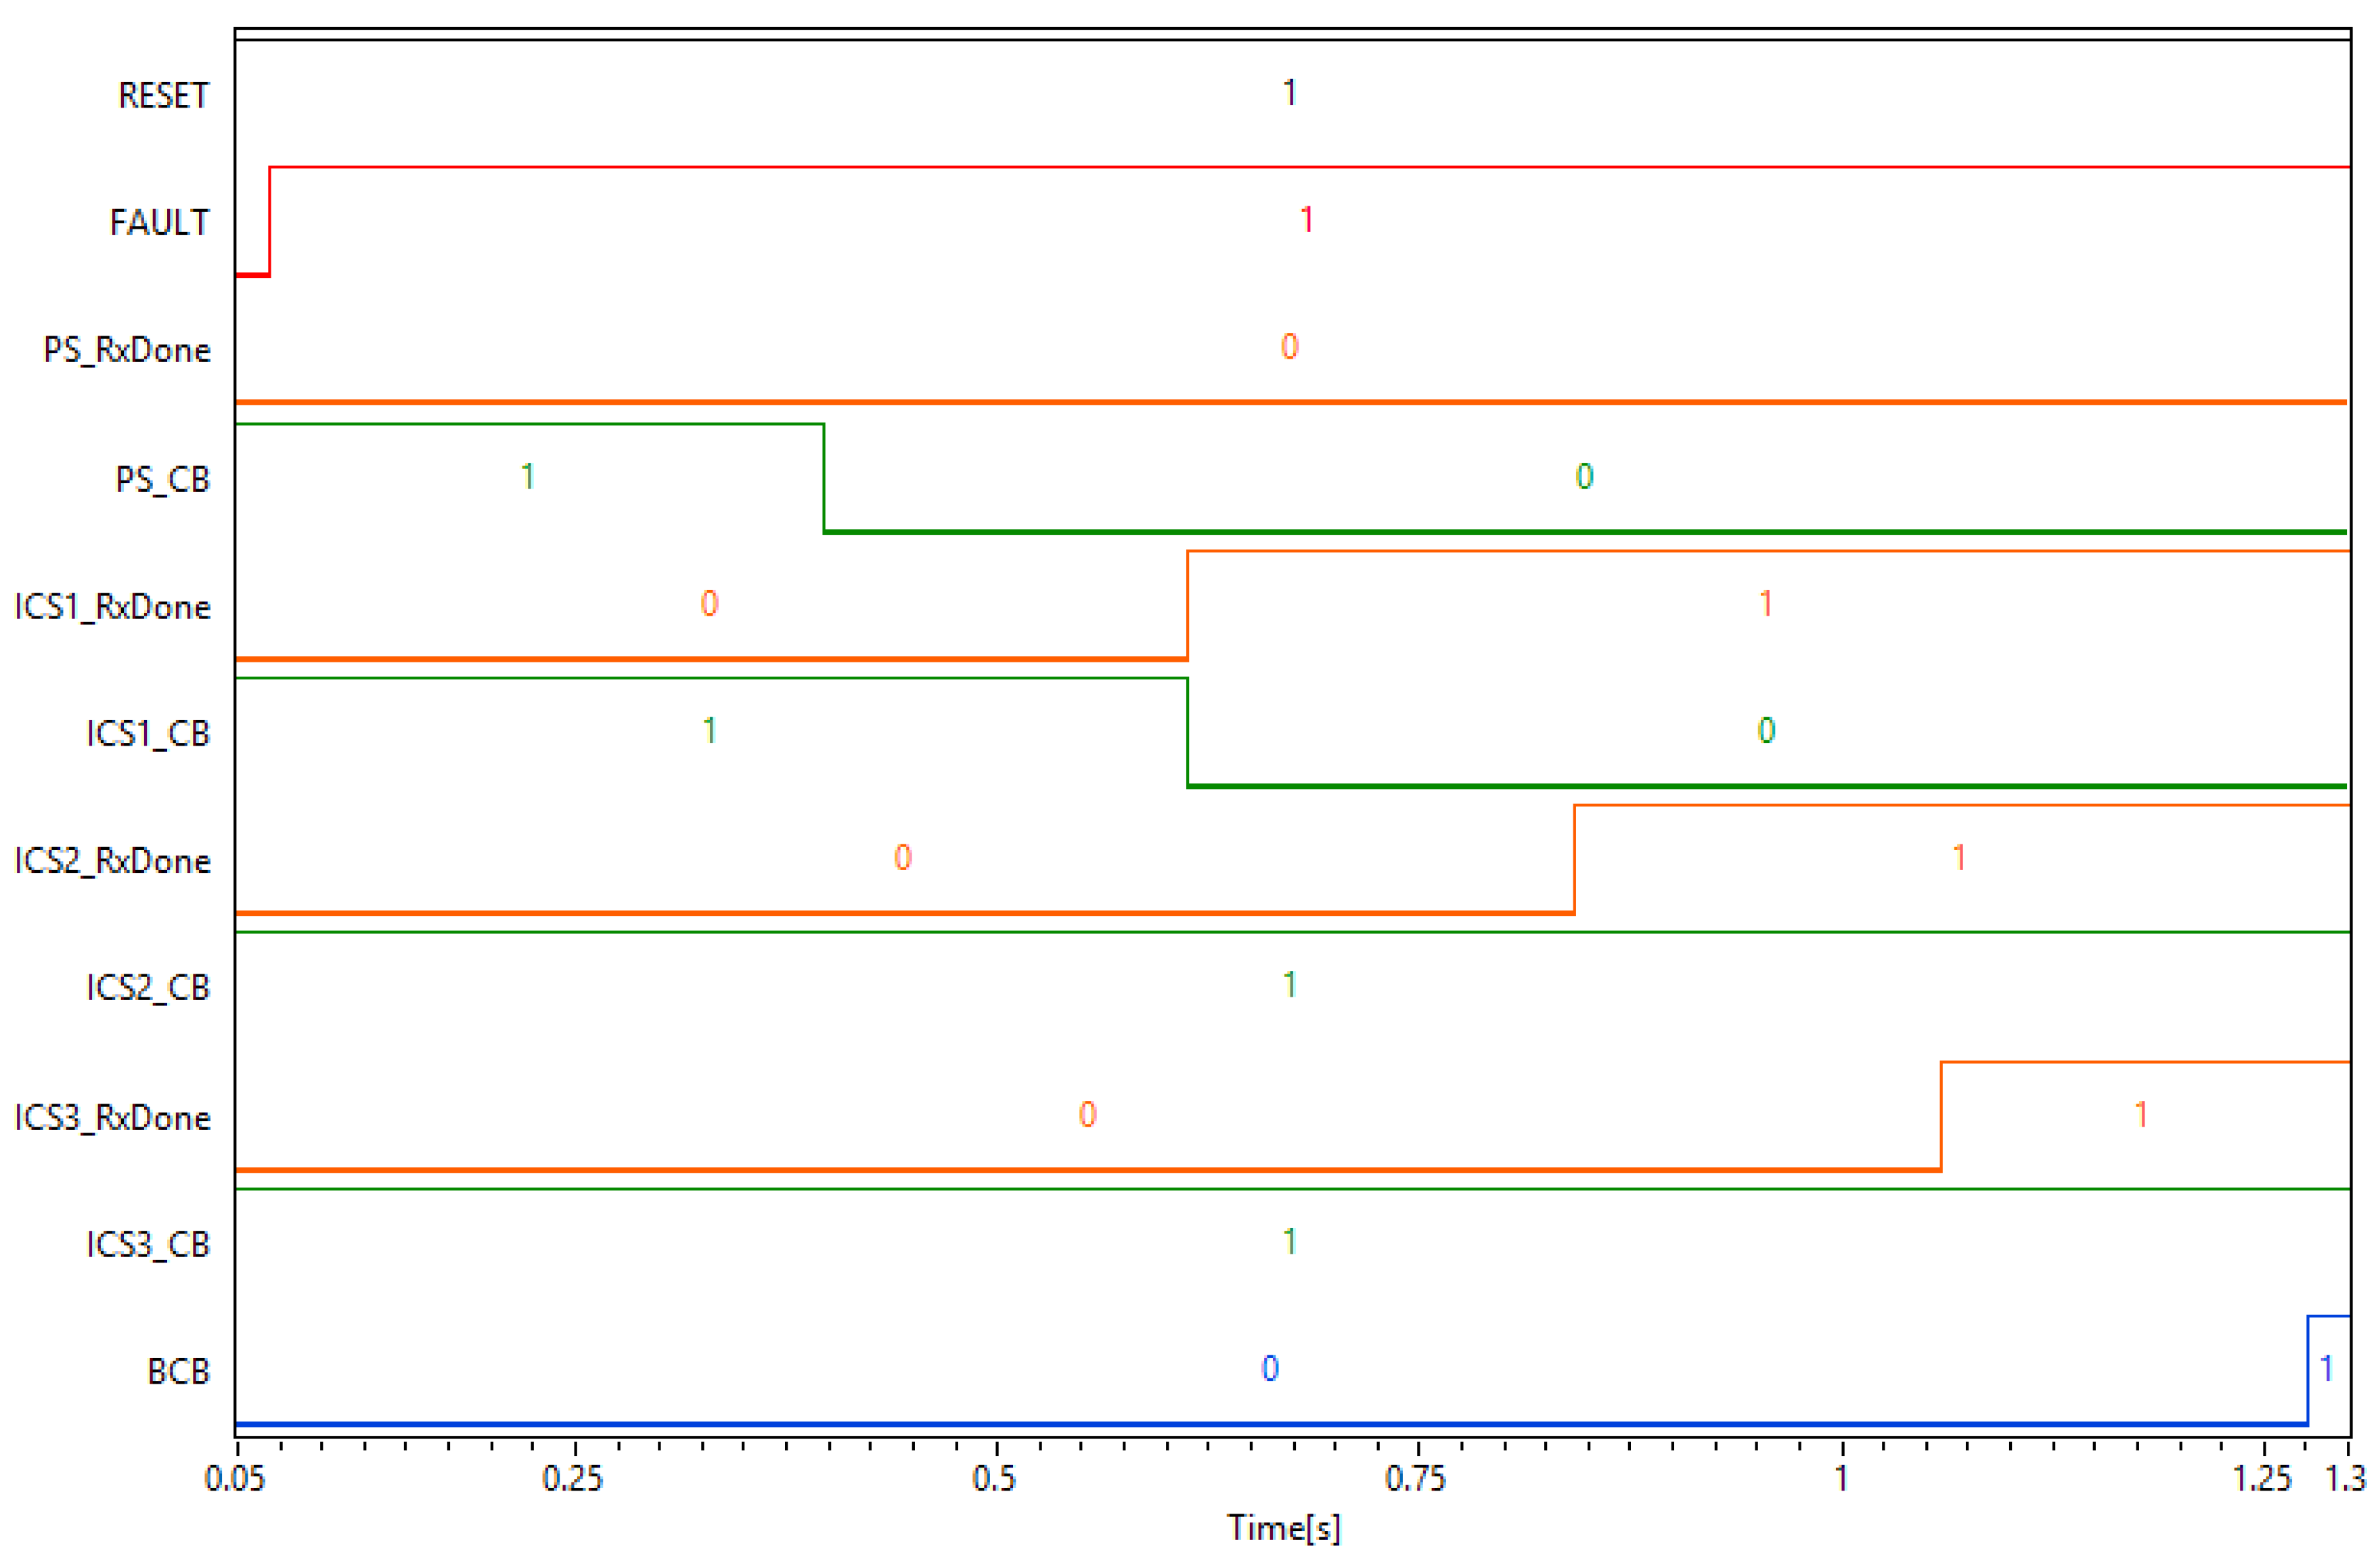
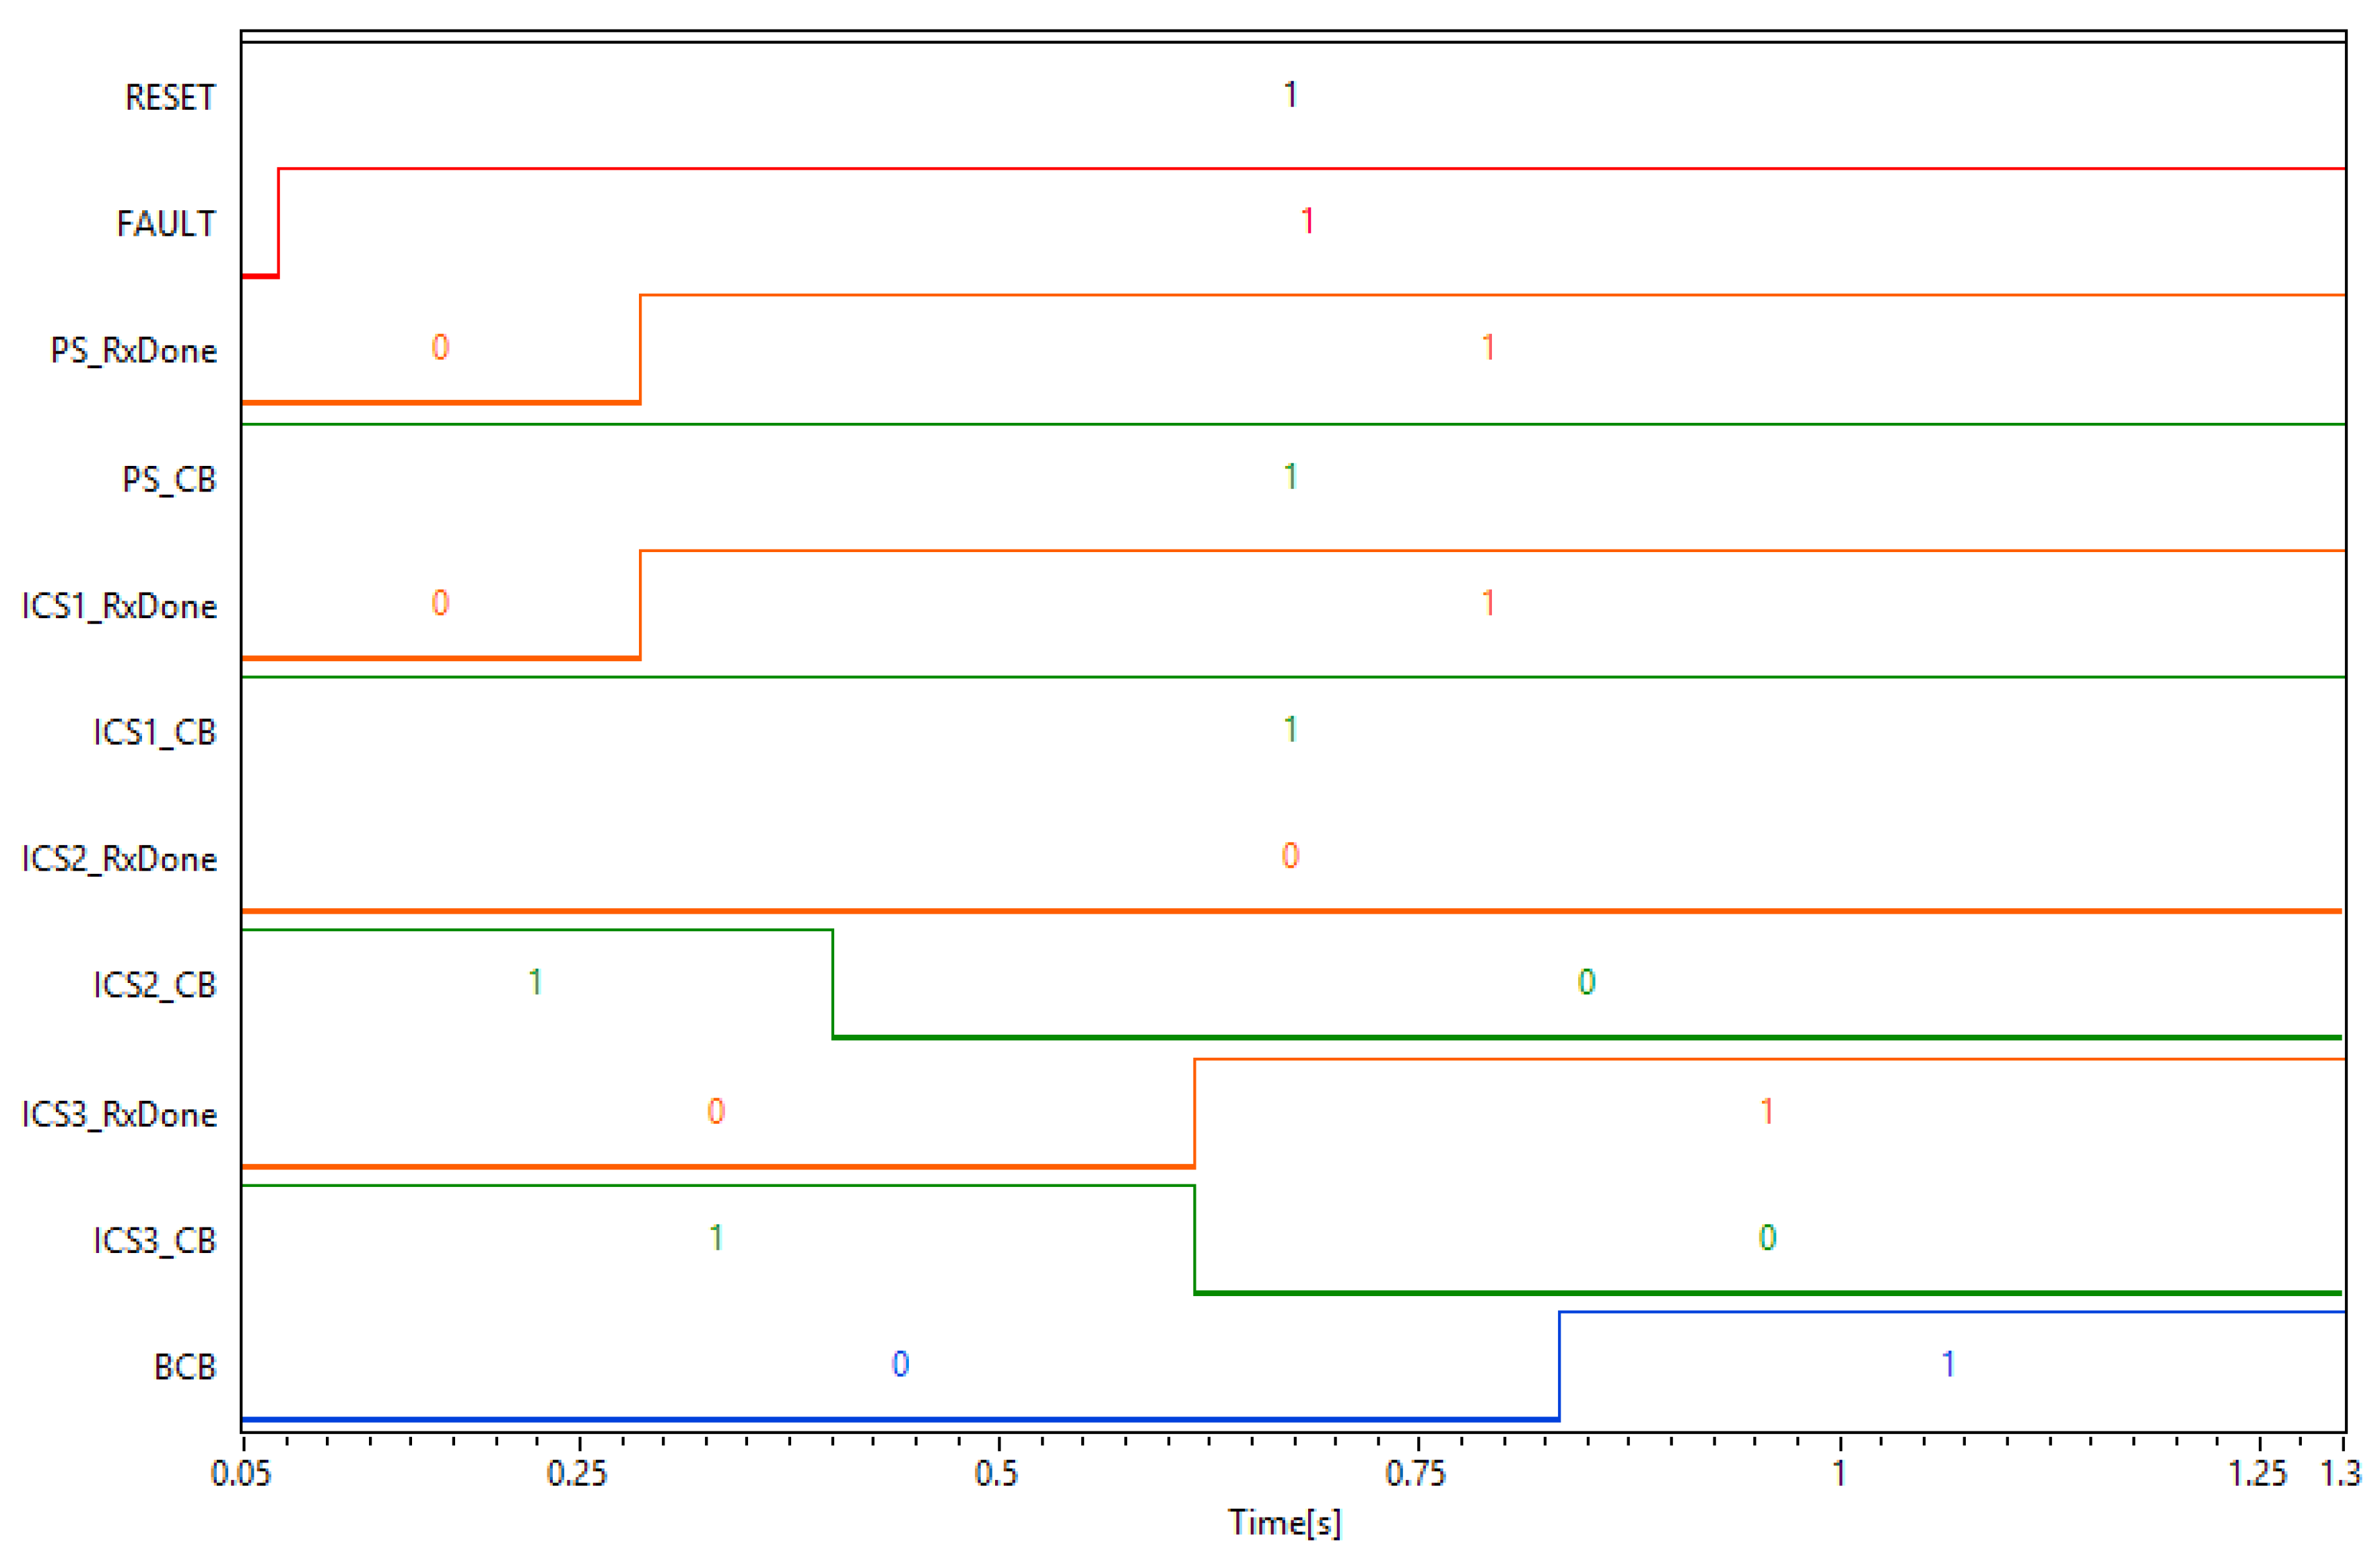
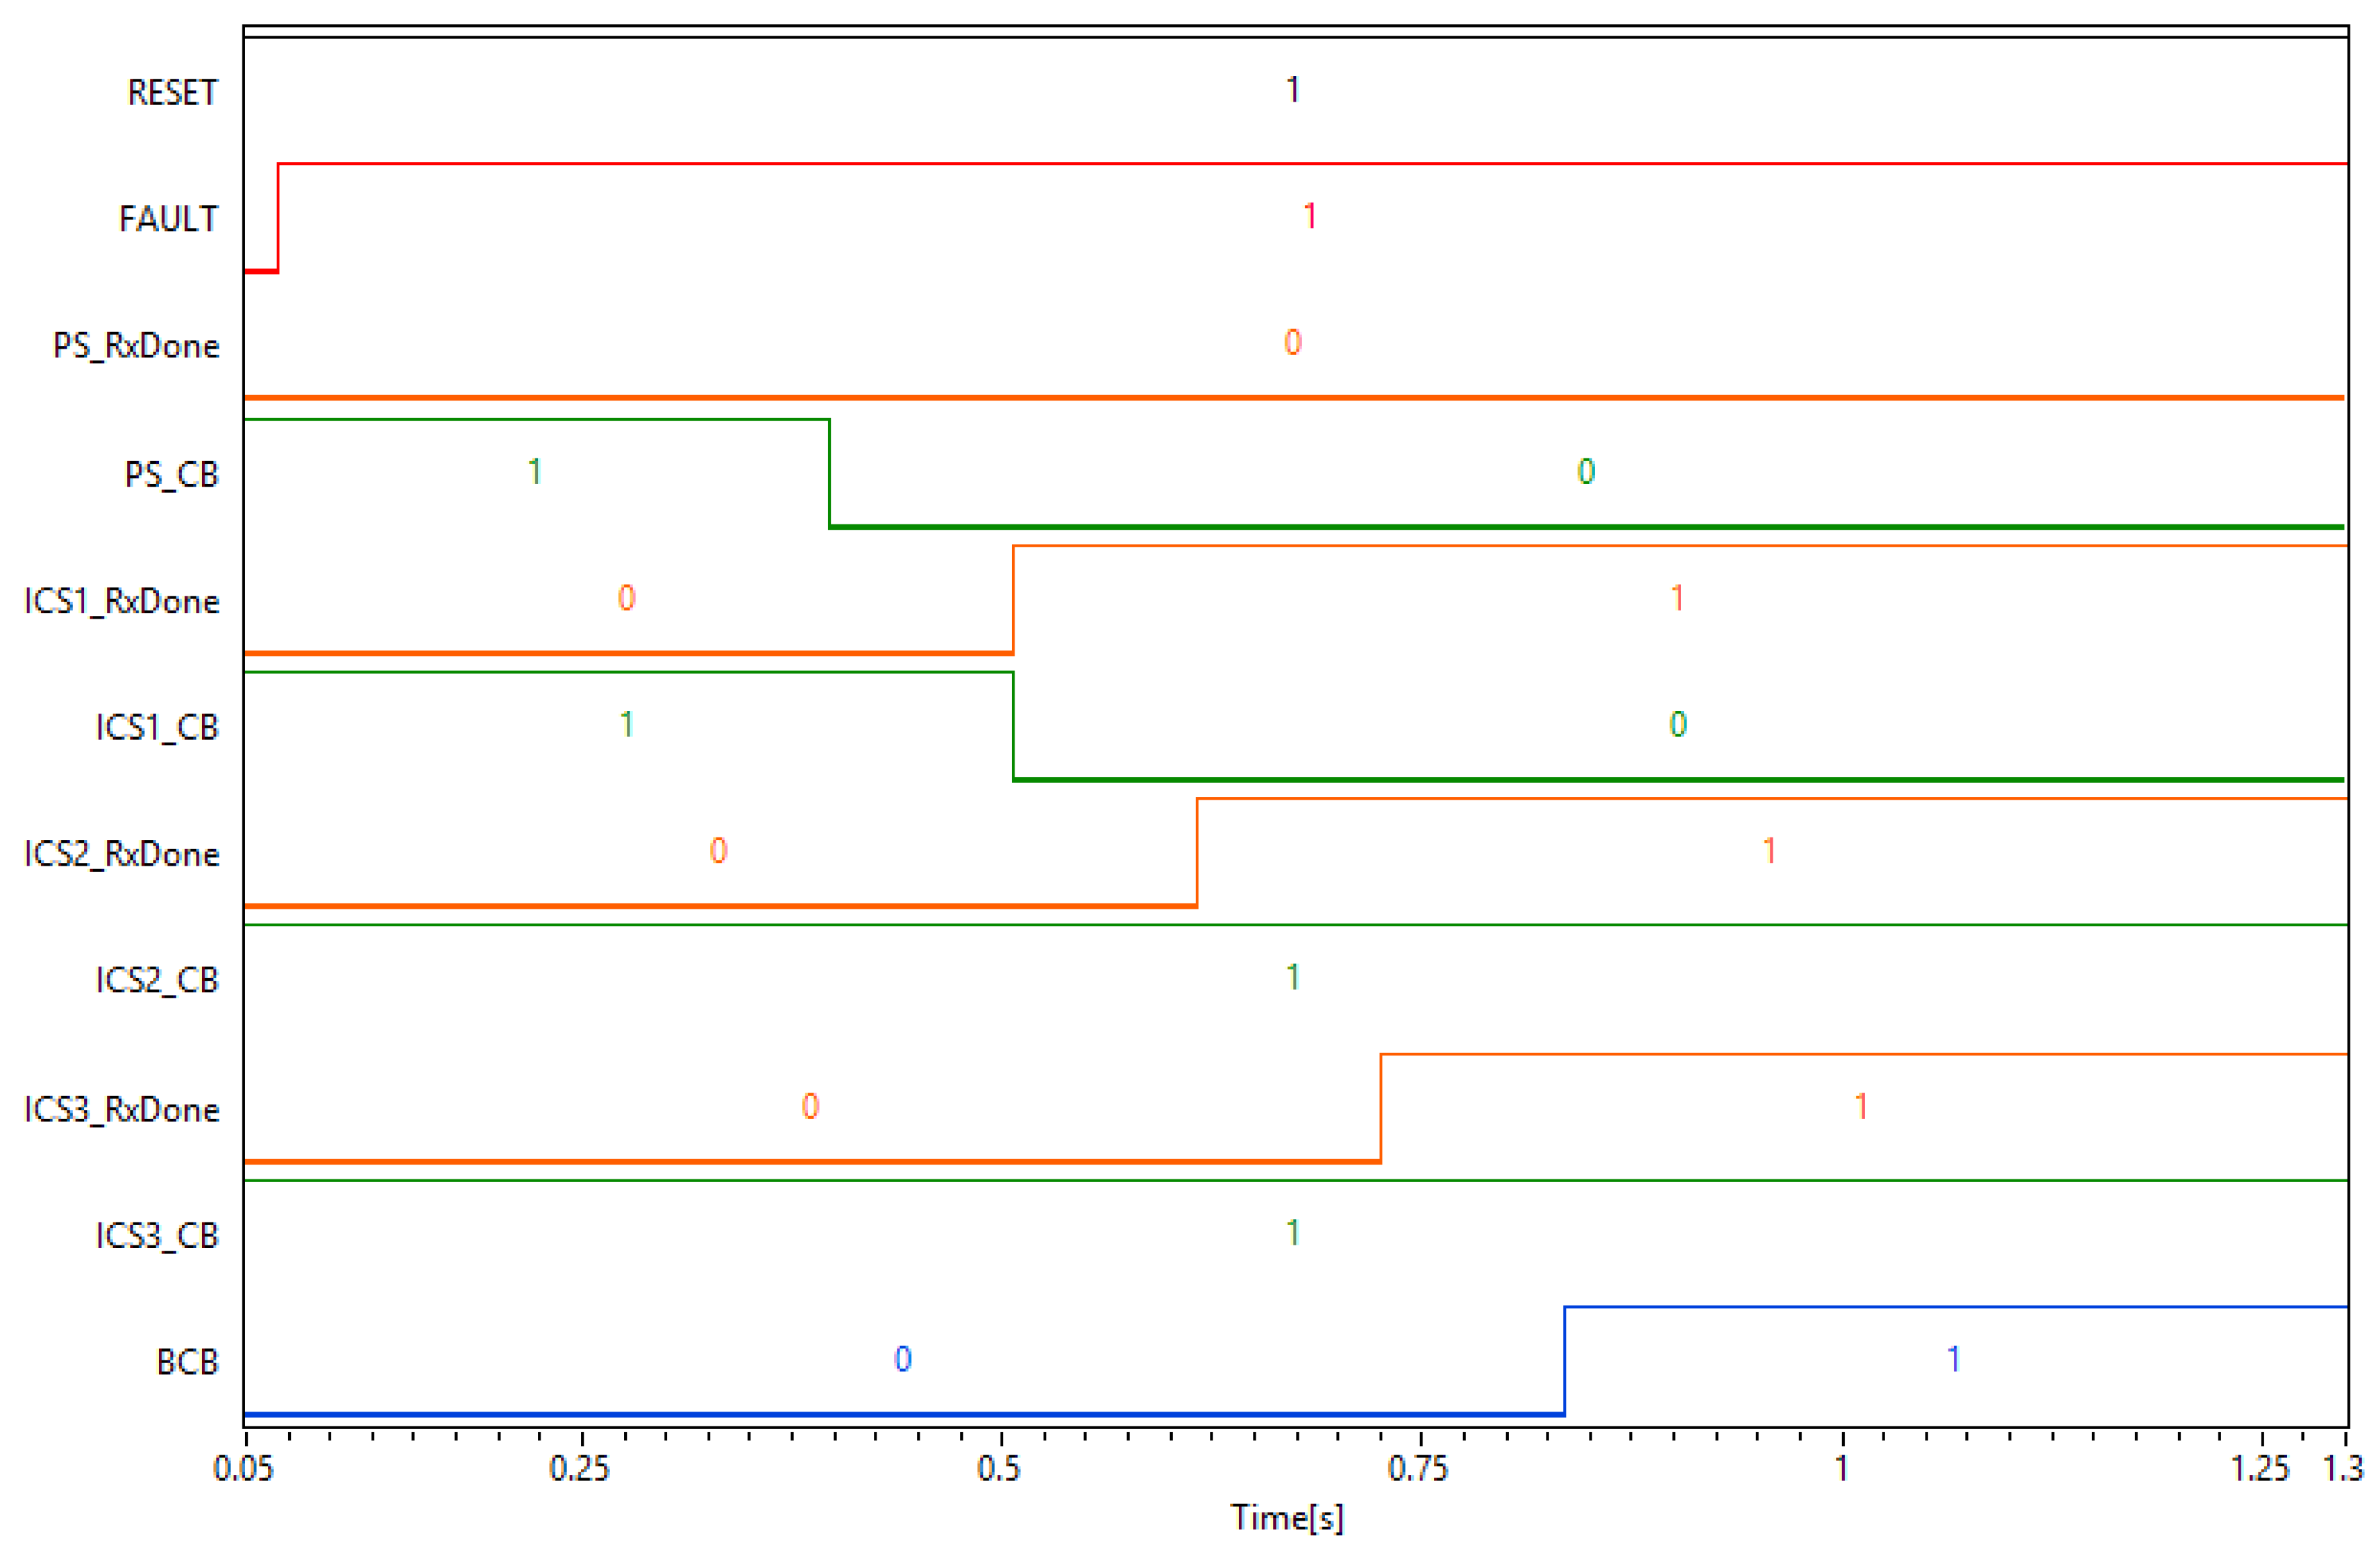
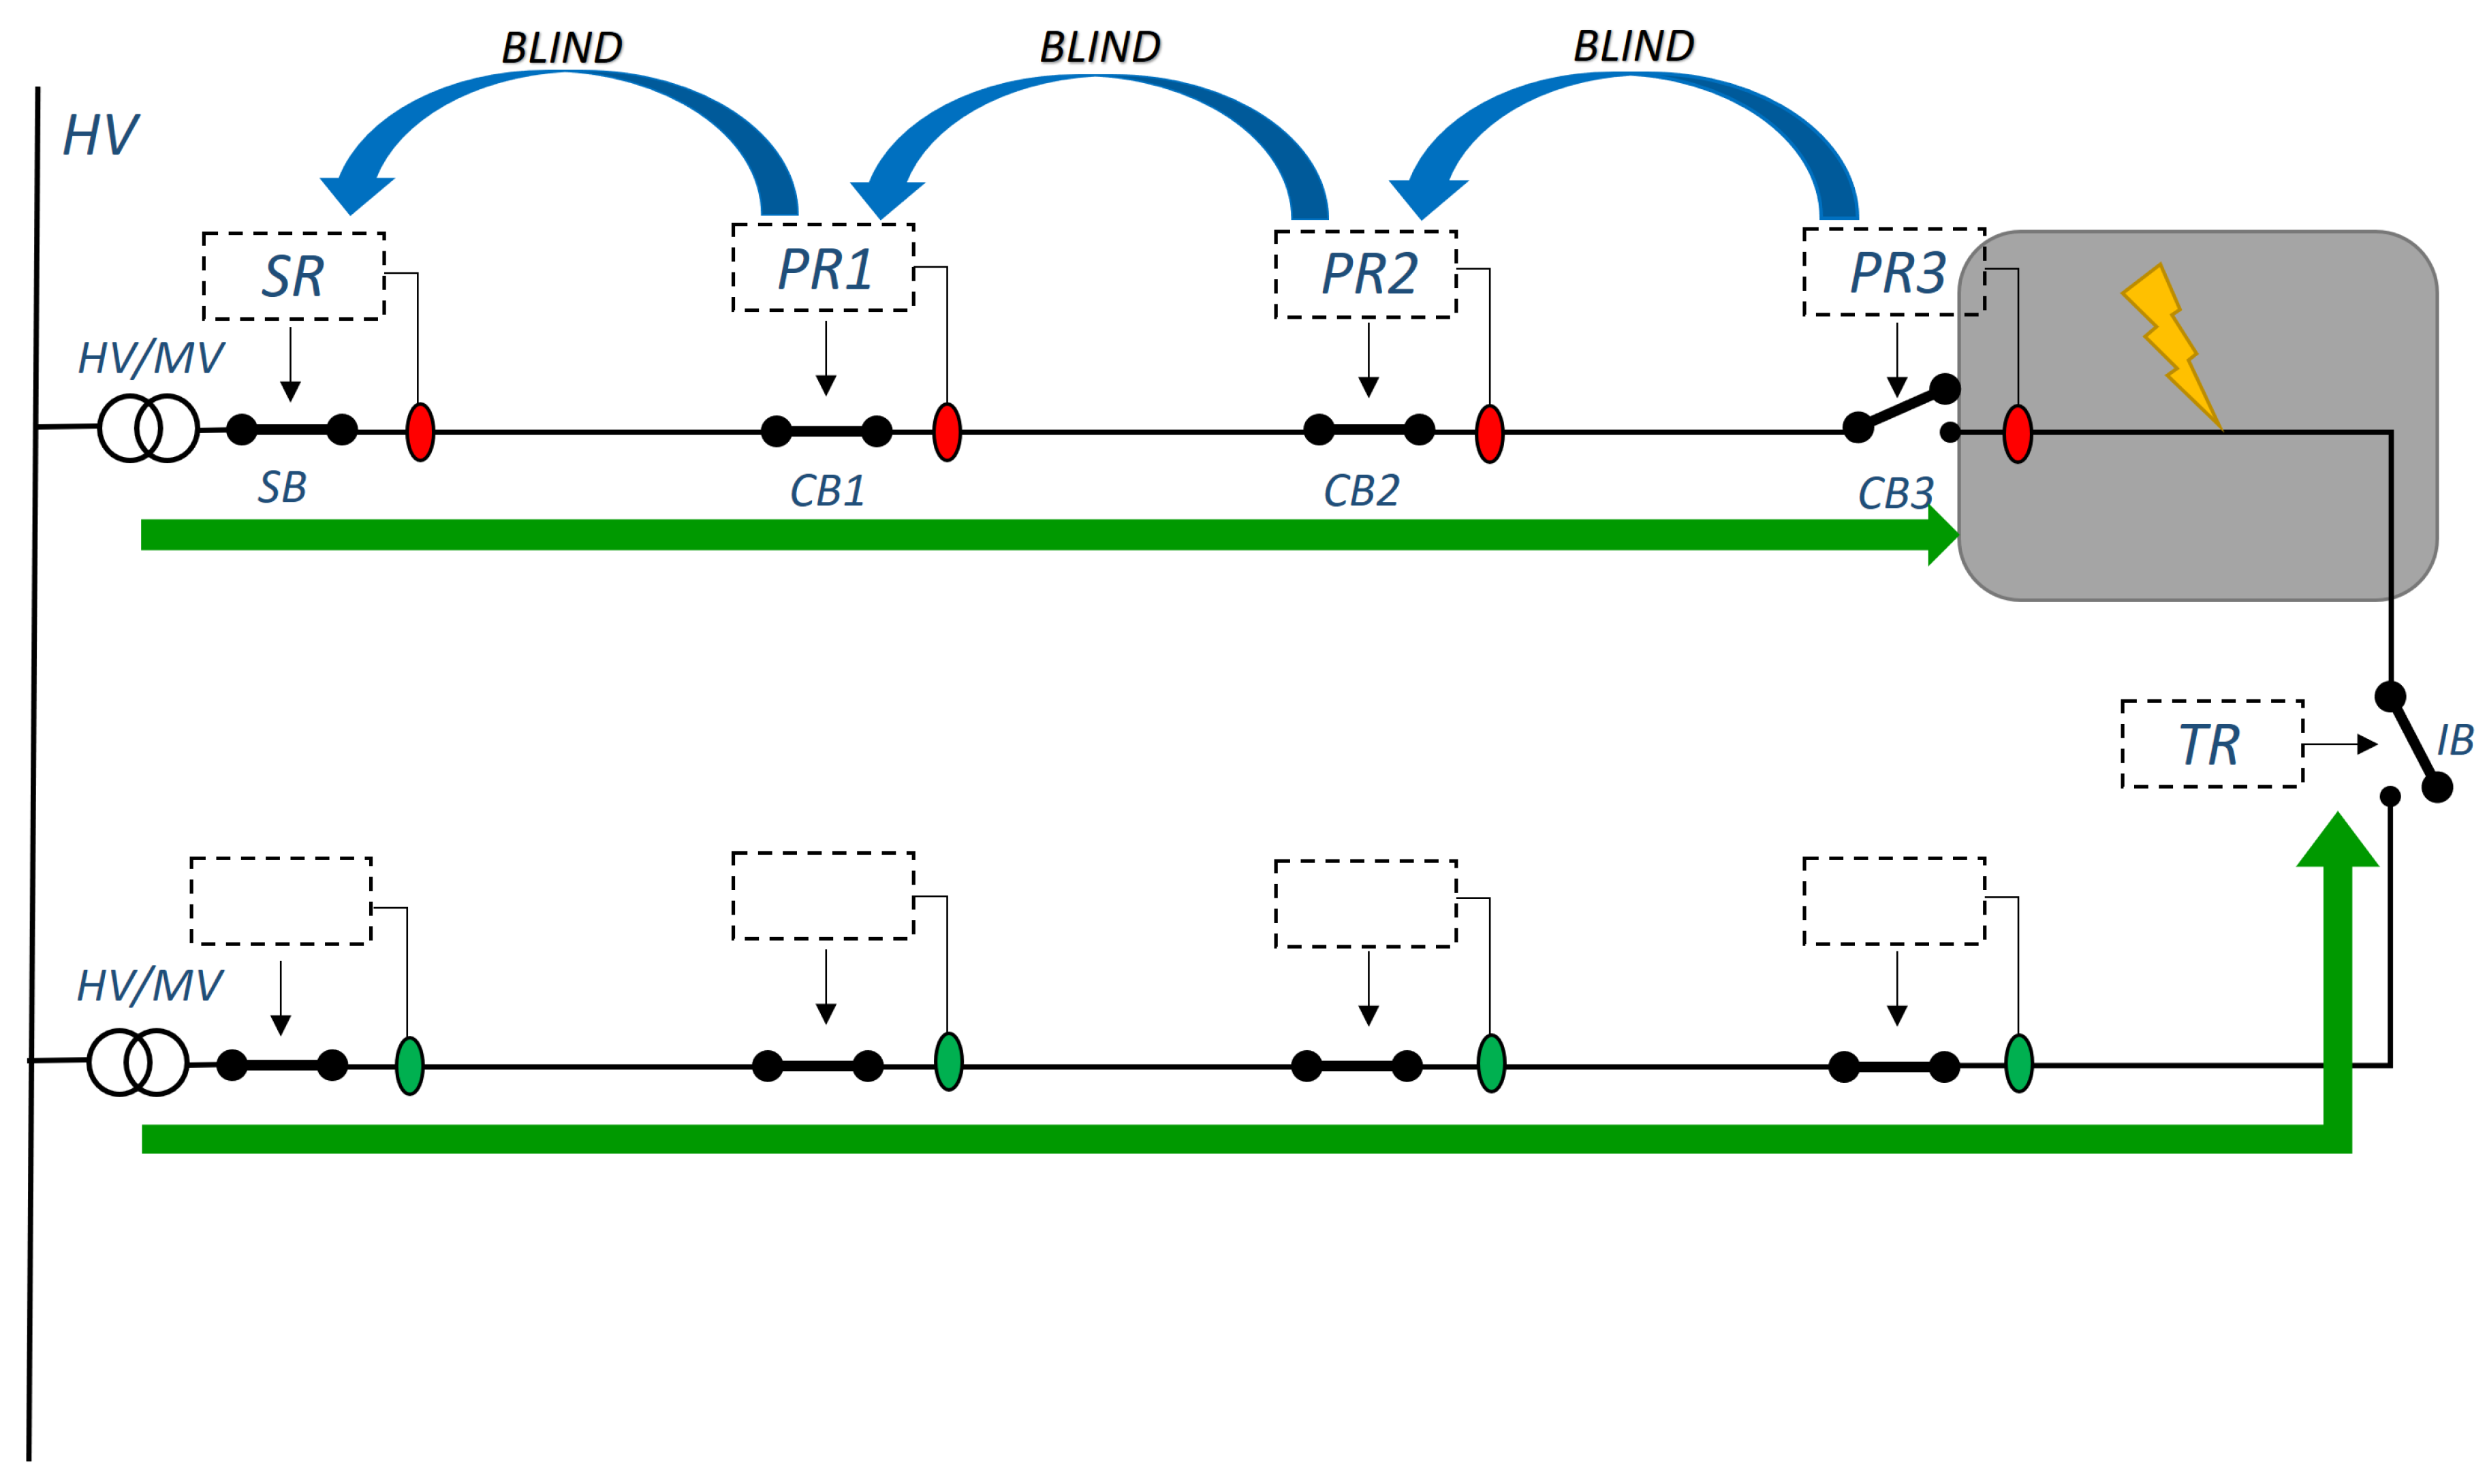
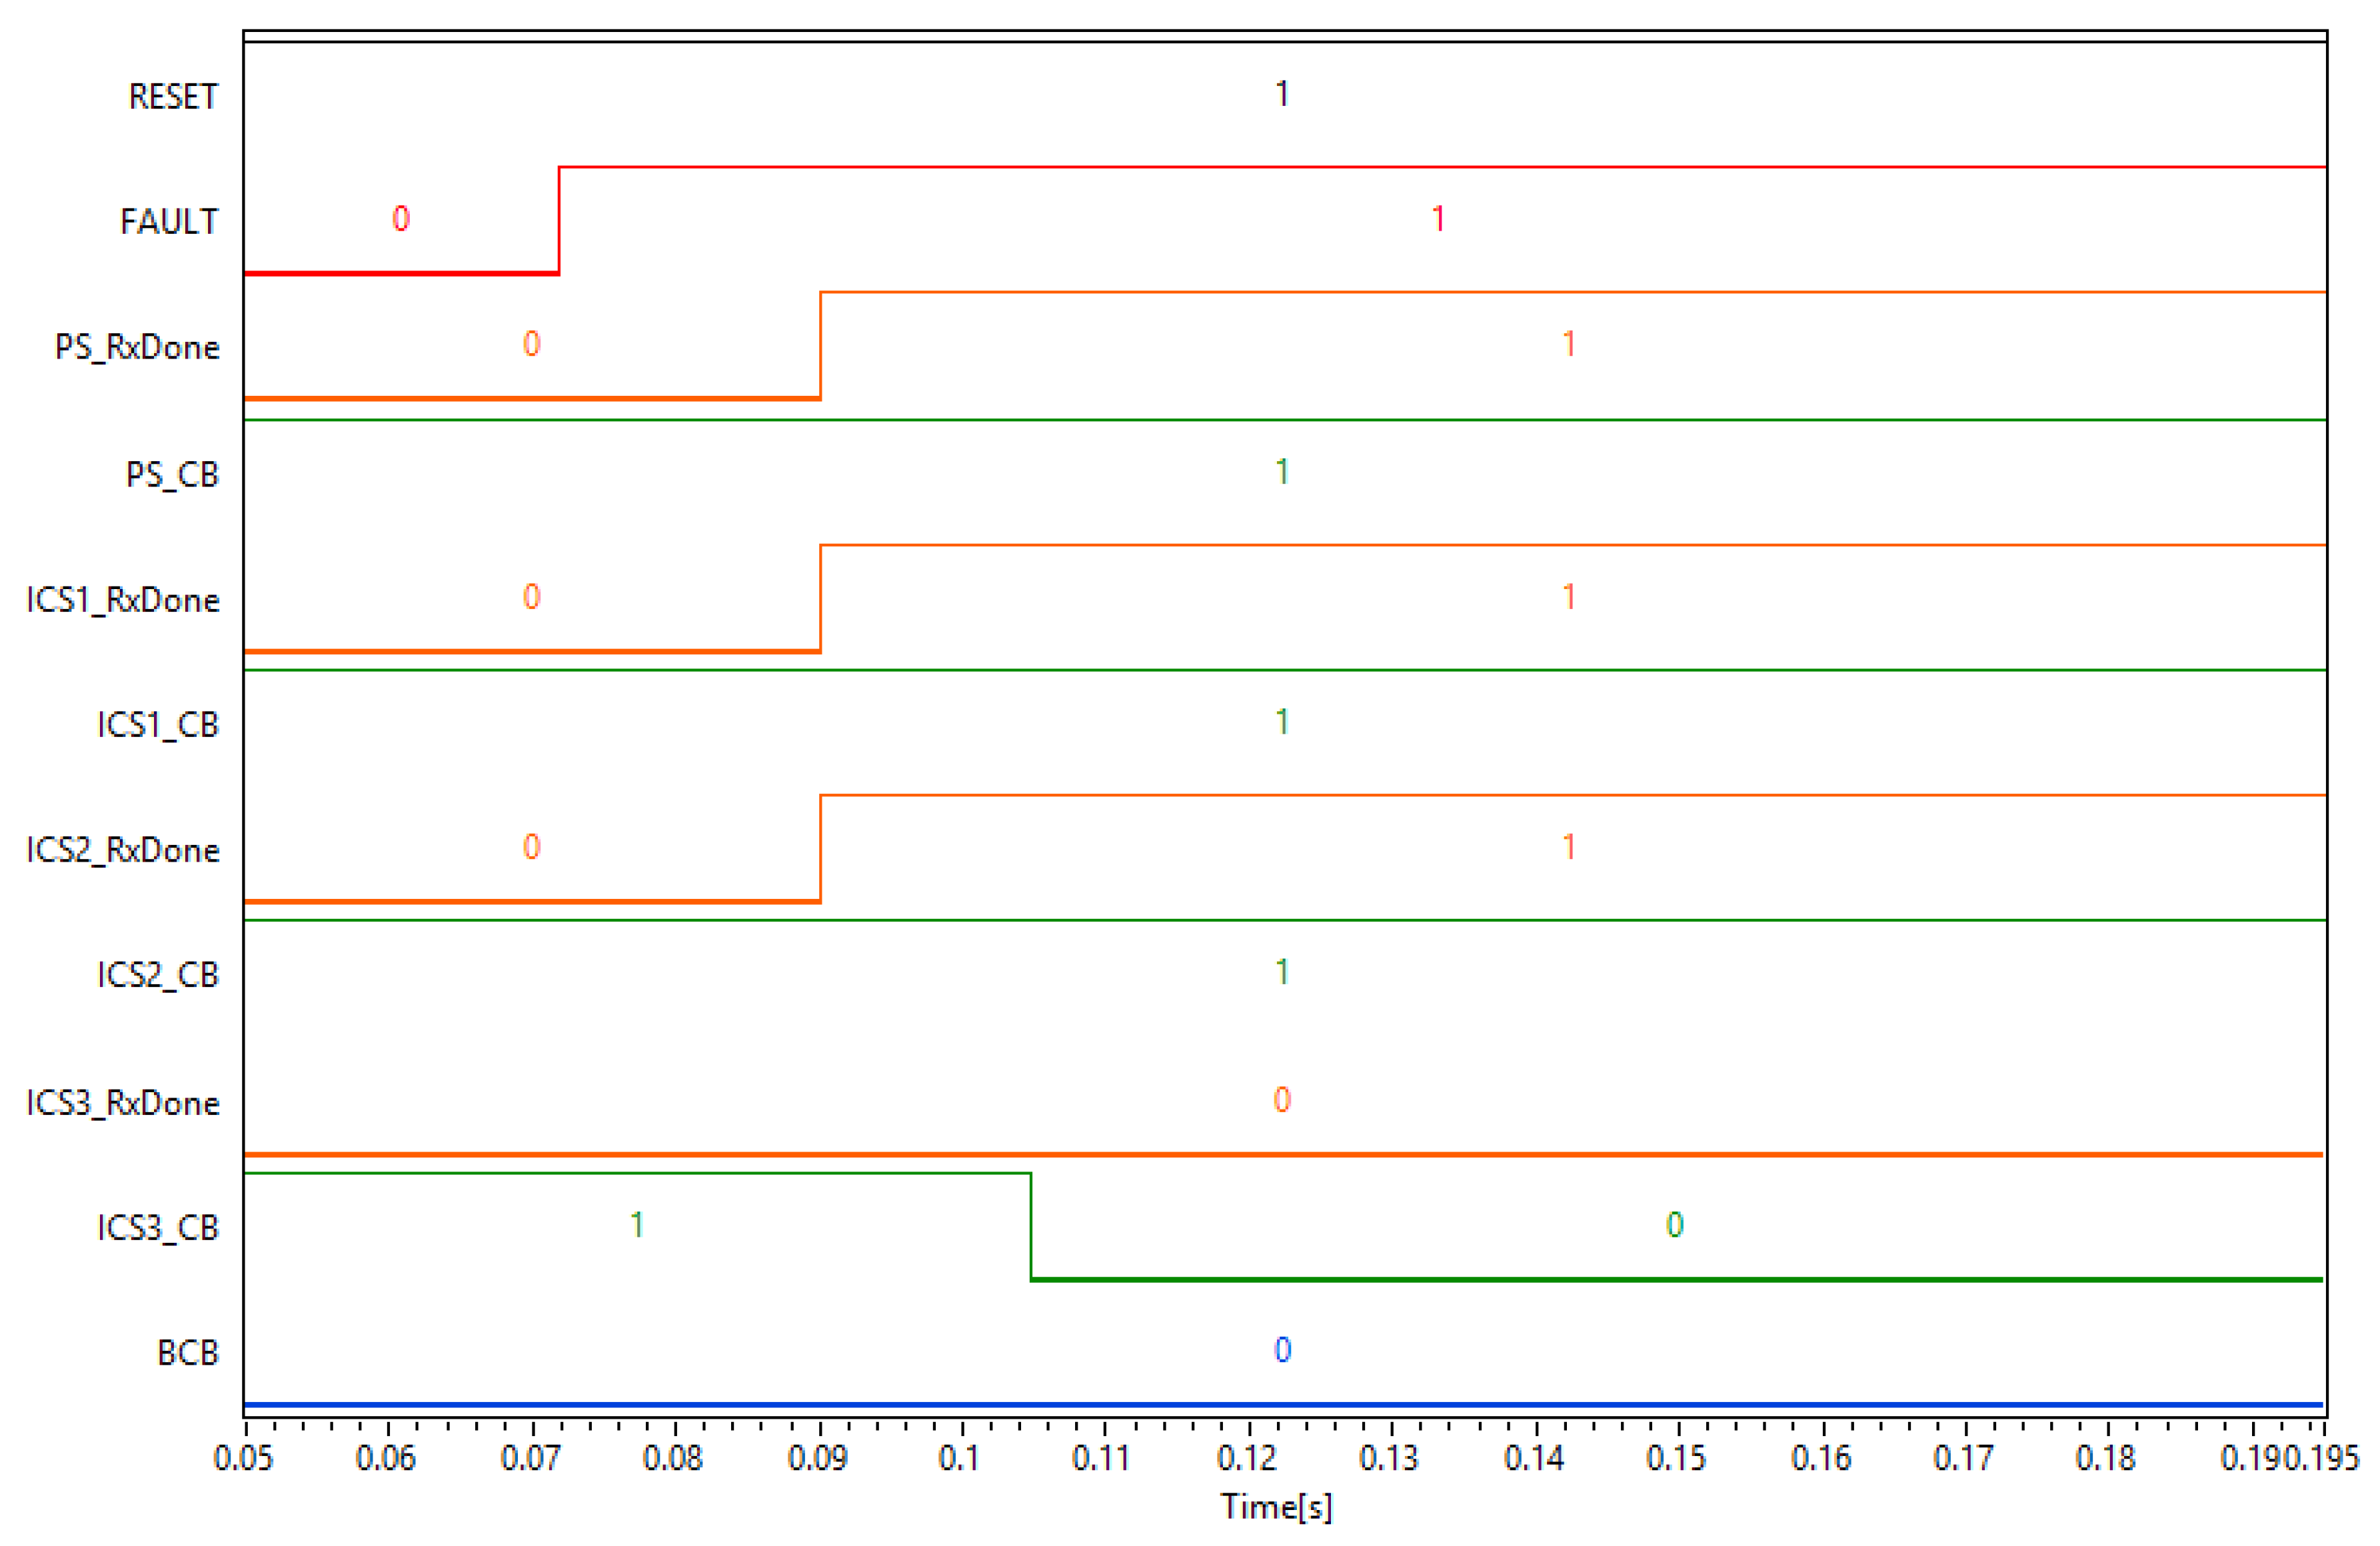
Table 1.
Devices involved in logic selectivity scenario.
| Acronym | Name | Function |
|---|---|---|
| CB | Circuit breaker | Device able to trip the circuit during a fault; its operations are controlled externally by the PR. |
| PR | Protection relay | Device able to: (i) detect faults; (ii) control the respective CB; (iii) exchange messages with the other PRs. |
| SB | Substation breaker | Breaker positioned in the primary substation. |
| SR | Substation relay | Relay controlling the SB |
| IB | Interconnection breaker | Breaker normally open that, if closed, connects the line to other distribution networks. |
| TR | Tie recloser | Relay controlling the IB. |
Table 2.
Bit rate values depending on bandwidth (BW) and spreading factor (SF), with code rate (CR) = 1.
Table 2.
Bit rate values depending on bandwidth (BW) and spreading factor (SF), with code rate (CR) = 1.
| SF | ||||||
|---|---|---|---|---|---|---|
| BW | 7 | 8 | 9 | 10 | 11 | 12 |
| 125 | 5468 | 3125 | 1757 | 977 | 537 | 292 |
| 250 | 10,937 | 6250 | 3515 | 1953 | 1074 | 585 |
| 500 | 21,875 | 12,500 | 7031 | 3906 | 2148 | 1171 |
Table 3.
Minimum signal-to-noise ratio (SNR) to be guaranteed for signal demodulation based on SF values.
Table 3.
Minimum signal-to-noise ratio (SNR) to be guaranteed for signal demodulation based on SF values.
| SF | SNR Limit |
|---|---|
| 7 | −7.5 |
| 8 | −10 |
| 9 | −12.5 |
| 10 | −15 |
| 11 | −17.5 |
| 12 | −20 |
Table 4.
Sensitivity values depending on BW and SF, with CR = 1.
| BW (kHz) | SF | Sensitivity (dBm) |
|---|---|---|
| 125 | 8 | −126 |
| 125 | 10 | −132 |
| 125 | 12 | −137 |
| 250 | 8 | −123 |
| 250 | 10 | −129 |
| 250 | 12 | −134 |
| 500 | 8 | −120 |
| 500 | 10 | −126 |
| 500 | 12 | −131 |
Table 5.
Values of (total transmission time of the LoRa packet), expressed in ms, versus BW and SF, with CR = 1, implicit header (IH = 1), CR = 1, cyclic redundancy check (CRC) = 1, payload of 10 bytes.
Table 5.
Values of (total transmission time of the LoRa packet), expressed in ms, versus BW and SF, with CR = 1, implicit header (IH = 1), CR = 1, cyclic redundancy check (CRC) = 1, payload of 10 bytes.
| SF | ||||||
|---|---|---|---|---|---|---|
| BW | 7 | 8 | 9 | 10 | 11 | 12 |
| 150 | 37.12 | 64 | 128 | 256 | 430.08 | 860.16 |
| 250 | 18.56 | 32 | 64 | 128 | 215.04 | 430.08 |
| 500 | 9.28 | 16 | 32 | 64 | 107.52 | 215.04 |
Table 6.
Values of , in ms, versus BW and SF, with CR = 1. The red color indicates values of the table that are not feasible.
Table 6.
Values of , in ms, versus BW and SF, with CR = 1. The red color indicates values of the table that are not feasible.
| SF | ||||||
|---|---|---|---|---|---|---|
| BW | 7 | 8 | 9 | 10 | 11 | 12 |
| 125 | 37.12 | 64 | 128 | 256 | 30.08 | 860.16 |
| 250 | 18.56 | 32 | 64 | 128 | 215.04 | 430.08 |
| 500 | 9.28 | 16 | 32 | 64 | 107.52 | 215.04 |
Table 7.
Receiver sensitivity in dB. The red color indicates values of the table that are not feasible.
Table 7.
Receiver sensitivity in dB. The red color indicates values of the table that are not feasible.
| SF | ||||||
|---|---|---|---|---|---|---|
| BW | 7 | 8 | 9 | 10 | 11 | 12 |
| 125 | −123 | −126 | −129 | −132 | −134.5 | −137 |
| 250 | −120 | −123 | −126 | −129 | −131.5 | −134 |
| 500 | −117 | −120 | −123 | −126 | −128.5 | −131 |
Table 8.
Values of in ms depending on BW and SF, with CR = 1, CRC disabled, implicit header.
| SF | ||||||
|---|---|---|---|---|---|---|
| BW | 7 | 8 | 9 | 10 | 11 | 12 |
| 125 | 32 | 53.76 | 107.52 | 215.04 | 348.16 | 696.32 |
| 250 | 16 | 26.88 | 53.76 | 107.52 | 174.08 | 348.16 |
| 500 | 8 | 13.44 | 26.88 | 53.76 | 87.04 | 174.08 |
Table 9.
Times for fault clearing, detection, tripping, and blind waiting depending on the fault type.
Table 9.
Times for fault clearing, detection, tripping, and blind waiting depending on the fault type.
| Fault Type | Fault Clearing [ms] | Fault Detection [ms] | Tripping [ms] | Blind Waiting [ms] |
|---|---|---|---|---|
| 50.S3 Poly-phase short circuit (Threshold 600 A) | 120 | 27 | 60 | 33 |
| 51N.S1 Two-phase to ground fault | 170 | 27 | 60 | 83 |
| 67N.S2 One-phase to ground fault with not compensated neutral | 170 | 57 | 60 | 53 |
| 67N.S1 One-phase to ground fault with not compensated neutral | 450 | 57 | 60 | 333 |
| 51.S2 Poly-phase short circuit (Threshold 250 A) | 500 | 57 | 60 | 383 |
Table 10.
Values of in ms depending on BW and SF, with CR = 1, CRC disabled, and implicit header. The red color indicates values of the table that are not feasible. The green color indicates values of the table that are feasible.
Table 10.
Values of in ms depending on BW and SF, with CR = 1, CRC disabled, and implicit header. The red color indicates values of the table that are not feasible. The green color indicates values of the table that are feasible.
| SF | ||||||
|---|---|---|---|---|---|---|
| BW | 7 | 8 | 9 | 10 | 11 | 12 |
| 125 | 30.98 | 51.71 | 103.42 | 209.85 | 413.70 | 827.39 |
| 250 | 15.49 | 30.98 | 51.71 | 103.42 | 209.85 | 413.70 |
| 500 | 7.74 | 15.49 | 30.98 | 51.71 | 103.42 | 209.85 |
Table 11.
Estimated time intervals during the fault 50.S3 between SR and PR1.
| Interval | Measurement Method | Max Value [s] | Measured Value [s] |
|---|---|---|---|
| - | 0.03300 | 0.03297 | |
| - | - | 0.05146 | |
| - | - | 0.06969 | |
| - | - | 0.08824 | |
| - | - | 0.10796 |
Table 12.
Estimated time intervals during the fault 50.S3 between PR2 and PR3.
| Interval | Measurement Method | Max Value [s] | Measured Value [s] |
|---|---|---|---|
| - | 0.03300 | 0.01827 | |
| - | 0.03300 | 0.01827 | |
| - | 0.03300 | 0.03296 | |
| - | - | 0.05149 | |
| - | - | 0.07085 |
Table 13.
Time intervals for fault clearing and interconnection reclosure for the fault 50.S3.
| Case Study | Interval | Measured Value [s] |
|---|---|---|
| Fault clearing time for fault 50.S3 between SR and PR1 | 0.03297 | |
| Fault clearing time for fault 50.S3 between PR2 and PR3 | 0.03296 | |
| Reclosure time for fault 50.S3 between SR and PR1 | 0.10796 | |
| Reclosure time for fault 50.S3 between PR2 and PR3 | 0.07085 |
Table 14.
Values of in ms depending on BW and SF, with CR = 1, CRC disabled, and implicit header. The red color indicates values of the table that are not feasible. The green color indicates values of the table that are feasible.
Table 14.
Values of in ms depending on BW and SF, with CR = 1, CRC disabled, and implicit header. The red color indicates values of the table that are not feasible. The green color indicates values of the table that are feasible.
| SF | ||||||
|---|---|---|---|---|---|---|
| BW | 7 | 8 | 9 | 10 | 11 | 12 |
| 125 | 30.98 | 51.71 | 103.42 | 209.85 | 413.70 | 827.39 |
| 250 | 15.49 | 30.98 | 51.71 | 103.42 | 209.85 | 413.70 |
| 500 | 7.74 | 15.49 | 30.98 | 51.71 | 103.42 | 209.85 |
Table 15.
Estimated time intervals during the fault 67N.S1 between SR and PR1.
| Interval | Measurement Method | Max Value [s] | Measured Value [s] |
|---|---|---|---|
| - | 0.33000 | 0.32839 | |
| - | - | 0.54391 | |
| - | - | 0.76427 | |
| - | - | 0.98106 | |
| - | - | 1.19899 |
Table 16.
Estimated time intervals during the fault 67N.S1 between PR2 and PR3.
| Interval | Measurement Method | Max Value [s] | Measured Value [s] |
|---|---|---|---|
| - | 0.33000 | 0.21579 | |
| - | 0.33000 | 0.21580 | |
| - | 0.33000 | 0.32957 | |
| - | - | 0.54589 | |
| - | - | 0.76248 |
Table 17.
Time intervals for fault clearing and interconnection reclosure for the fault 67N.S1.
| Case Study | Interval | Measured Value [s] |
|---|---|---|
| Fault clearing time for fault 67N.S1 between SR and PR1 | 0.32839 | |
| Fault clearing time for fault 67N.S1 between PR2 and PR3 | 0.32957 | |
| Reclosure time for fault 67N.S1 between SR and PR1 | 1.19899 | |
| Reclosure time for fault 67N.S1 between PR2 and PR3 | 0.76248 |
Table 18.
Estimated time intervals during the fault 67N.S1 between SR and PR1, with a LoRa of 103.42 ms.
Table 18.
Estimated time intervals during the fault 67N.S1 between SR and PR1, with a LoRa of 103.42 ms.
| Interval | Measurement Method | Max Value [s] | Measured Value [s] |
|---|---|---|---|
| - | 0.33000 | 0.32837 | |
| - | - | 0.43706 | |
| - | - | 0.54803 | |
| - | - | 0.65740 | |
| - | - | 0.76795 |
Table 19.
Estimated time intervals during the fault 50.S3 between PR3 and TR.
| Interval | Measurement Method | Max Value [s] | Measured Value [s] |
|---|---|---|---|
| - | 0.033000 | 0.01827 | |
| - | 0.03300 | 0.01828 | |
| - | 0.03300 | 0.01828 | |
| - | 0.03300 | 0.03297 |
© 2018 by the authors. Licensee MDPI, Basel, Switzerland. This article is an open access article distributed under the terms and conditions of the Creative Commons Attribution (CC BY) license (http://creativecommons.org/licenses/by/4.0/).
Share and Cite
MDPI and ACS Style
Angrisani, L.; Bonavolontà, F.; Liccardo, A.; Schiano Lo Moriello, R. On the Use of LoRa Technology for Logic Selectivity in MV Distribution Networks. Energies 2018, 11, 3079. https://doi.org/10.3390/en11113079
AMA Style
Angrisani L, Bonavolontà F, Liccardo A, Schiano Lo Moriello R. On the Use of LoRa Technology for Logic Selectivity in MV Distribution Networks. Energies. 2018; 11(11):3079. https://doi.org/10.3390/en11113079
Chicago/Turabian StyleAngrisani, Leopoldo, Francesco Bonavolontà, Annalisa Liccardo, and Rosario Schiano Lo Moriello. 2018. "On the Use of LoRa Technology for Logic Selectivity in MV Distribution Networks" Energies 11, no. 11: 3079. https://doi.org/10.3390/en11113079
Note that from the first issue of 2016, this journal uses article numbers instead of page numbers. See further details here.