Article

Financing the Renovation of the Cypriot Building Stock: An Assessment of the Energy Saving Potential of Different Policy Scenarios Based on the Invert/EE-Lab Model

1
European Commission, Joint Research Centre, Directorate for Energy, Transport and Climate, Via Enrico Fermi 2749, I, 21027 Ispra, VA, Italy
2
Energy Economics Group, Institute of Energy Systems and Electric Drives, Vienna University of Technology, Gusshausstrasse 25-29/370-3, 1040 Vienna, Austria
*
Author to whom correspondence should be addressed.
Energies 2018, 11(11), 3071; https://doi.org/10.3390/en11113071
Submission received: 9 October 2018 / Revised: 31 October 2018 / Accepted: 3 November 2018 / Published: 7 November 2018
(This article belongs to the Special Issue Building renewable energy and thermal energy storage system 2018)

Abstract

:
Despite various government policies promoting energy efficiency in buildings over the last 15 years, Cyprus is still associated with a large untapped energy efficiency potential in this sector. The impact of different policy scenarios on future energy needs of the building sector in Cyprus is explored by first reviewing the current status of the building stock in Cyprus and existing national landscape of energy efficiency policies. Various new policies are then proposed to complement the existing framework and help exploit further the potential. Using the Invert/EE-Lab model, three policy scenarios extending to 2050 are assessed with the aim to estimate the energy efficiency potential of the Cypriot building sector and identify policy solutions to harness this potential. The energy consumed for heating, cooling, hot water, and lighting in the entire Cypriot building stock is expected to drop by up to 16% in 2050 compared to the baseline scenario. Under the most ambitious scenario, nearly 60% of the building stock in 2050 will be energy efficient, consuming less than half of the energy used by the average building stock in 2012. Taking into account the modelling results, recommendations on how to improve the financial landscape in buildings until 2050 are presented.

1. Introduction

With its energy dependence amounting to 97.7% in 2015, Cyprus ranks among the most energy dependent EU Member States. While the share of renewable energy in gross final energy consumption experienced a three-fold increase over the past 10 years in Cyprus (from 3% in 2004 to 9% in 2015), its energy needs have displayed a rising trend (Figure 1). Following a dip in consumption from 2008 to 2014—largely attributed to the impact of the financial crisis on the real economy as well as energy crisis that hit Cyprus after the destruction of its second-largest power station—the energy consumption of the country has been on an upward trend and is expected to continue to do so under the latest baseline and energy efficiency scenario projections (Figure 1). An integral part to any climate change mitigation strategy, energy efficiency (EE) plays an important role in stabilising these trends and ensuring that future energy and climate targets are met. The building sector, which accounted for 32% of the total final energy consumption in Cyprus in 2015, is associated with a significant energy savings potential and tapping into this potential requires addressing both new and existing buildings.
With the right set of policy tools, it is generally accepted that European governments can play a crucial role in promoting energy efficiency and leveraging more investments in the building sector. In compliance with various EU directives, Cyprus has put in place various policy instruments aimed at reducing energy demand in the building sector. These include the implementation of Directive 2010/31/EU (recast of Directive 2002/91/EC) on Energy Performance of Buildings (EPBD) with the set-up of its energy performance certification scheme, minimum energy performance requirements in new constructions and major renovations, schemes for boilers and/or air conditioning systems, and nearly zero energy standards for new buildings from 2021 onwards. Minimum EE standards and mandatory energy labelling requirements for energy-related products used in, inter alia, buildings have also been set up with the implementation of Directive 2009/125/EC (recast of Directive 32/2005/EC) on eco-design requirements for energy-related products and Directive 2010/30/EU on energy labelling (recast of Directive 75/1992/EC), respectively. Lastly the development of a well-functioning energy services market which inter alia cover the building sector has been driven by Directives 32/2006/EC and 2012/27/EU.
While buildings constructed today are more energy efficient than ever before, the ageing part of the Cypriot stock, which was not built with energy performance in mind, presents a great challenge. Although this theoretically offers an opportunity to incorporate EE measures, actual energy renovations taking place today neither meet the scale nor depth aligned with their full potential. To face this specific challenge, the Energy Efficiency Directive called for Member States to, inter alia, draft long-term strategies for mobilising energy efficiency investments in existing buildings. At the same time, the need for more market action, enhanced private sector involvement and a smooth transition towards mainstream construction and renovation at nearly zero energy level are increasingly highlighted. Cyprus provides an interesting case study as the challenge of its building stock is two-fold: both heating (albeit very moderate compared to other EU countries) and cooling demands exist. Given that energy efficiency solutions in relation to heating needs is widely covered in the literature, the Cypriot case study showcases how specific issues faced by Mediterranean countries can be met, an issue also highlighted by the Energy Performance of Buildings Directive. Cooling needs are likely to rise in the future, and become a more prominent issue around the world.
The aforementioned European Directives require Member States to regularly monitor and report the progress on energy efficiency improvements and renewable energy technology deployment in the building stock. To assess the impact of existing policy measures on the progress made and identify the remaining potential through the implementation of new measures, scientifically-based calculation tools are required to investigate the impact of hypothetical policy scenarios on the energy demand of the building stock.
This paper aims to explore the impact of different policy scenarios on the future energy needs of the building sector in Cyprus. The Invert/EE-Lab model—a vintage building stock model developed to assess the current and future energy needs and final energy consumption for space heating, cooling, domestic hot water, and lighting in buildings—is used to assess the impact of hypothetical policy scenarios in Cyprus from now until 2050. Section 2 provides an overview of the Cypriot building stock and its main characteristics, reviews the current energy efficiency policy framework, and discusses policy gaps and ways on how to address them. Section 3 presents the calculation methodology and the motivation behind the selection of the Invert/EE-Lab model. The definition of the policy scenarios considered in this study is given in Section 4, including the simulation results and main findings. Section 5 draws recommendations and conclusions with the aim to inform policy makers on actions that help unlock the vast energy efficiency potential and ways to reach market transformation from now until 2020 and beyond.

2. Current Context in Cyprus

2.1. Policy Framework on Energy Efficiency

Over the last decade, Cyprus has made significant progress in adopting its energy efficiency legislative framework for the building sector; an important pillar of the overall energy efficiency policy framework (Table 1). A key landmark was the set-up of the first mandatory energy performance requirements in building codes, enacted with the adoption of the 2007 Decree on the Minimum Energy Performance Requirements for Buildings. The Decree 568/2007, which was adopted as a result of the EPBD implementation, introduced prescriptive requirements expressed as minimum heat transfer coefficients for the building envelope for all new buildings and buildings over 1000 m2 undergoing major renovation. Major renovation is defined by Decree 429/2006 as renovation, addition or modification works undertaken in a building whereby the total cost of the works on the building shell and/or technical systems for heating, hot water, air conditioning, ventilation, and lighting is higher than 25% of the value of the building (excluding the value of the land) or in cases where the works cover more than 25% of the building envelope. The minimum requirements were revised in 2009 and in addition to prescriptive requirements such as insulation of building envelope and solar thermal system for domestic hot water in new residential buildings, minimum performance-based requirements in the form of energy class B under the Cypriot energy performance certification (EPC) system were introduced for new buildings and buildings over 1000 m2 undergoing major renovation. Energy class B corresponds to buildings whose primary energy consumption for heating, cooling, domestic hot water, lighting of the building is in the range of 51 to 100% of the equivalent consumption of a reference building, as defined in Cypriot regulation. (The Cyprus energy class scheme for buildings is defined as follows A (0–50%), B (51–100%), C (101–150%), D (151–200%), E (201–250%), F (251–300%), and G (301% and above)). Following a revision in 2013, a new Decree came into force with more stringent heat transfer coefficients (U values were reduced by 15%) as well as additional requirements, such as a requirement for external shading for existing buildings, regardless of their side, and requirements on replaced or retrofitted building elements. Nearly Zero Energy Building (NZEB) requirements have also been defined for new buildings constructed from 2021; these include Energy Class A, maximum primary energy consumption of 100 and 125 kWh/m2 for residential and non-residential buildings, respectively, and a minimum 25% contribution from Renewable Energy Systems (RES). All requirements are presented in Table 2.
Since 2004, financial support for investments in EE and RES technologies has been available to Cypriot households, commercial companies and public sector through various government-supported schemes. The first scheme—a grant scheme offering 30–55% of the purchase and installation costs for various interventions in residential, tertiary, and public buildings—was active in the period 2004 to 2013. The scheme was supported by the Special Fund For Renewable Energy Sources and Energy Conservation established by the 2003 Law on Encouraging and Promoting the Use of Renewable Energy Sources and Energy Saving (Law 33(I)/2003) and a budget of approximately 100 million was allocated for investments in, inter alia, building envelope improvements, technical building systems, renewable heat, and power generation systems in the active period, as shown in Table 3. Based on scheme evaluation data collected by the Cyprus Ministry of Energy, Commerce, Industry, and Tourism, residential buildings formed the main beneficiary of the programme, with 90% of all processed applications corresponding to residential buildings and 52% of disbursed grants allocated for residential buildings. The most popular measures—in terms of accepted applications—have been the installation of insulation in residential buildings in non-mountainous areas followed by solar thermal systems for domestic hot water in residential buildings. Due to the vast popularity of the scheme (nearly 10% of Cypriot residential building stock benefitted from the scheme if it is assumed that one application corresponded to one dwelling), the budget was gradually increased over its implementation period to accommodate the growing interest from the public.
With the end of the popular grant scheme in 2013, a new grant scheme was put in place for the period 2014–2020. The scheme, entitled “I save—I upgrade”, is based on the same financial model: provision of grants for direct investments partly covering the purchase and installation costs of various technologies. The new scheme (cofinanced by the EU Cohesion Fund under the Operational Programme Competitiveness and Sustainable Development and EU European Regional Development Fund) provides financial support for packaged measures that meet certain energy performance requirements, e.g., energy class B or 40% of energy savings after renovation. It requires the assessment of buildings by independent experts, such as energy auditors, qualified energy experts, and inspectors. Support for renovations that reach nearly-zero energy levels is also available and enhanced support is provided to vulnerable consumers (defined as recipients of (a) public assistance, (b) severe motor disability allowance, (c) benefit for low income pensioners, (d) paraplegic and tetraplegic care allowance, and (e) grant to blind as well as large families and low-income families (Decree 218/2013)) through increased grant rates. The Scheme also includes grants for energy audits in cases where the measures recommended by the energy audits are installed. The total budget (public expenditure) in the implementation period 2014 to 2020 amounted to EUR 16.5 million, with an allocated amount of EUR 8 million for the first call.

2.2. Building Stock

In 2015, the residential and services sectors collectively represented the second largest energy consuming sector in Cyprus (after transport) at 317 ktoe and 214 ktoe, respectively. In the bottom-up analysis carried out for the Cyprus residential building stock as part of the TABULA-EPISCOPE project, it was found that the final energy demand for heating and cooling of typical houses could be reduced by up to 84% through ambitions energy renovations [3]. Indeed, statistical data published by the Cyprus Energy Agency (Buildings’ Typology Cyprus, Cyprus Energy Agency, May 2012 (available on TABULA-EPISCOPE website)) show that less than 10% of the residential building stock are equipped with wall, roof, or basement insulation, while over 50% of the buildings have no thermal insulation.
Cyprus has one of the warmest climates in the Mediterranean region. According to Köppen climate classification it falls in categories Csa (Mediterranean) and BSh (semi-arid), while the national classification defines four categories: coastal, low land, semi-mountainous, and mountainous. Passive cooling techniques and efficient cooling equipment are essential for reducing cooling demand which is particularly high in the Cypriot office buildings due to their hot Mediterranean climate. While the extensive usage of solar thermal systems for the production of domestic hot water makes Cyprus one of the worldwide leaders in this area [4], no other renewable energy technologies are widely diffused in the building stock in practice.
To obtain a picture of the national building stock, several data sources are available. These include the Cyprus Statistical Service (CYSTAT), the JRC-IDEES Integrated Database of the European Energy Sector [5], the TABULA-EPISCOPE, and ODYSSEE-MURE databases, the national strategy for encouraging investments in the renovation of buildings submitted by the Cypriot authorities in the framework of the EED Article 4, the calculations carried out by the Cypriot Ministry of Energy, Commerce, Industry, and Tourism to set minimum energy performance requirements at cost optimal levels [6] and other studies or registries of specific building types [7,8,9,10]. Normally the latest year for which data is available is 2013.
A quick overview of the Cypriot residential and non-residential building stock is briefly presented below. Only permanently occupied dwellings are considered within the residential building stock. In total three residential and six non-residential building types are taken into account. Three age bands are considered for residential (before 1981, 1981–2006, and after 2006) and two for non-residential buildings (before 2006 and after 2006). While three age bands were also available for the non-residential buildings, due to computational constraints it was decided to merge the “before 1981” and “1981–2006” bands, in line with the legislative framework (the first mandatory energy performance requirements were introduced in 2007 as shown in Table 2).

2.2.1. Residential Building Stock

In 2013, there were 300 thousand permanently occupied dwellings: approximately 120 thousand single family houses, 65 thousand semidetached and row houses, 110 thousand apartments, and 8 thousand other building types (mainly back-yard houses). The majority of the Cypriot dwelling stock (67%) was owner-occupied, with the largest part (78%) located in the coastal and low land areas. Approximately 40% of the stock was built before 1981 and 54% between 1981 and 2006, before the first normative energy requirements. Details about the floor area of different residential building types are shown in Figure 2.
The average floor area of a single family house ranged from 95 to 191 m2, depending on the construction period and territorial context (urban/rural). Dwellings in apartment blocks were generally smaller with floor area ranging from 63 to 95 m2 on average. As shown in Table 4, space cooling accounted for the largest share of energy needs in most of the territory (represented by the coastal and low land climatic zones). In terms of installed thermal systems, the most commonly used systems were kerosene boilers (especially in single family houses) and room fixed air conditioning units (used both in heating and cooling modes), as shown in Table 5. Room stoves (gas and electric) were also a relatively common heating system, mostly in backyard houses.

2.2.2. Non-Residential Building Stock

In 2013, the permanently occupied non-residential building stock consisted of about 30 thousand buildings with a total floor area greater than 9 Million m2. Office buildings (public and private) represented 39% of the total stock, while the hospitality sector (accommodation, restaurants, and taverns) accounted for 25%. The largest part (83%) was built before the first normative energy requirements (Figure 3). As with the residential building stock, space cooling represented the largest share of energy needs in all building types (Table 6). Kerosene boilers and standard heat pumps were the most common heating systems, while standard heat pumps represented the most common cooling systems (Table 7).

2.3. Discussion

The transposition of European Directives into national law has been a significant milestone in developing the current energy efficiency policy package in Cyprus. The main achievements and areas of concerns identified in the current policy landscape are shown in Table 8. This forms the basis for the definition of policy scenarios used in our modelling exercise (see Section 3).
The incorporation of mandatory energy performance requirements during the design or renovation phase of a building has been a key driver for the uptake of energy efficiency measures in the Cypriot building stock. Focus however could be drawn on increasing the ambition of NZEB levels [3] and strengthening compliance with the minimum energy performance requirements during major renovations. In addition, the role of Energy Performance Certificates as an information tool could be strengthened by establishing independent control systems, creating a publicly available EPC database and putting penalties for noncompliance. Local “one-stop shops” for energy renovation would provide owners with a single contact point for impartial information on how to plan and realise step-by-step energy renovation projects and assess different interventions and technologies, including benefits of various renovation packages and financing options available.
While Cyprus has taken important steps towards creating a comprehensive education, qualification, and training framework for professionals in the industry, there is still a need to improve the vocational education and training system for technical occupations related to the implementation of measures in the building sector. According to the roadmap developed under the “Build Up Skills, Pillar I” initiative, training needs for the construction sector are expected to grow, with estimates indicating that between 2000 and 4500 workers will need training annually in Cyprus until 2020 [11]. The need of workforce with appropriate qualified knowledge, experience, skills, and attitudes is important not only in the building sector but in all sectors related to energy efficiency and renewable energy sources.
Finally, Cyprus largely relies on the provision of government-supported grants to households, businesses, and the public sector. While some shortcomings associated with the first scheme are now addressed through the redesign of the current scheme (for example, the current scheme now provides financing for comprehensive retrofit projects with a wider list of eligible energy efficiency interventions), a transition from grant-based to a more diverse portfolio of economic policy measures including appropriate models that can cover all segments of the building sector is necessary if market transformation is to be achieved. Table 9 shows how the economic policy framework in Cyprus could be transformed to fill existing gaps and offer appropriate sustainable financing methods across the entire building sector. The gradual phase-out of grants could be realised by limiting their access to specific target groups (e.g., vulnerable groups) or specific actions (e.g., ZEB—Zero Energy Buildings or PEB—Positive Energy Buildings). Energy efficiency credit lines for private households and businesses could be developed through a public–private partnership with the backup and support of the government as well as international financial institutions. Financial support in the form of grants can, on the other hand, be tailored only for exemplary ZEB/PEB projects supporting designers and owners to come up with innovative designs that demonstrate the practical application of various affordable ZEB/PEB concepts (exceeding building regulation) suitable for the Cypriot climate.
In addition, the involvement of energy services companies, ESCOs—with a special focus on the non-residential sector—could be in the form of ESCO portfolio guarantees to attract more ESCO companies into this business and to make ESCOs more comfortable by guaranteeing the risk of their clients. On one hand, the adoption of tax credits or deduction to incentivise landlords to engage in energy efficiency upgrades in residential rented buildings would raise tax revenues for government by ensuring that the work is declared to the authorities. Finally, the modification of the current property tax system—to incorporate the efficiency level of the building into property tax paid by owners—could incentivise property owners of very inefficient buildings to invest in energy efficiency upgrades in order to reduce their tax burden.

3. Methods

3.1. About Building Stock Modelling

Several calculation models have been developed, addressing, to a varying extent, different challenges concerning underlying data requirements and data availability. Various top-down and bottom-up approaches have been chosen to overcome these challenges, and models which are either mainly built on statistical data (i.e., econometric models and statistical bottom-up models) or built to describe the underlying processes—technical bottom-up based models such as engineering-based bottom-up models or socioeconomic top-down-based models such as CGE-models—have been proposed. Computable General Equilibrium (CGE) models seek solutions for which all markets (e.g., labour, capital, materials, land, energy (carriers), etc.) of the subsectors of the whole economy are in equilibrium, while partial equilibrium models consider only subsectors of an economy (e.g., housing provision, energy, etc.). In contrast to bottom-up models, top-down models rely rather on an economic approach that puts the macroeconomic relationships and/or input and output production factors (e.g., labour, capital, materials, land, energy (carriers), etc.) in the centre of the model definition.
Numerous bottom-up models with exogenous decision-making (“accounting models”) have been developed in the past 15 years. In accounting models, the modeller typically defines key variables (e.g. refurbishment rates and quality, technology mix of newly installed heating systems exogenously), which do not depend on the model economic or regulatory factors and need to be adopted by the modeller for different scenarios based on expert guesses. Among many more studies, the following analyses applied accounting models to evaluate the future evolution of the built environment and its energy consumption: Cost [12] for Switzerland, Sartori et al. [13] for Norway, Hansen [14] for EU-15, Olobnscheck et al. [15] for Germany, Ó Broin et al. [16] for EU-27, Heeren et al. [17] for the city of Zurich, Mata et al. [18] for Swedish residential building stock, McKenna et al. [19] for Germany, Mattinen et al. [20] for the Kaukajärvi district of the city of Tampere in Finland, Tuominen et al. [21] for Finland, Dascalaki et al. [22] for the Hellenic residential building stock, and Sandberg et al. [23] for the Norwegian residential building stock. However, only a few models can simulate the decision-making processes (normally the decision criteria used by these approaches are economic variables (e.g., capital costs, operating costs, payback time, etc.)). The latter include the National Energy Modelling System for the US-Building stock [24], the AIM [25] for Japan and India, the BLUE model (UK) [26], the CIMS model (Canada) [27], the Forecast-residential model [28,29,30], PRIMES model (EU countries) [31], and the Invert/EE-Lab model (EU countries + four additional European countries) [32,33]. These endogenous models are capable of anticipating the development of technology and energy carrier mix based on economic factors; a more comprehensive comparison of different available building stock models is given by Nabera [34] and Chappin et al. [35].
The Invert/EE-Lab model is applied in this study. As discussed in previous publications [32,33,36], this is a simulation tool with a high degree of endogenously defined variables (Table 10) and can be added to the group of dynamic, (building physics) engineering-based archetypes, hybrid bottom-up models (augmented by statistical bottom-up elements or income and price elasticities, and statistical top-down elements such as cost-resource curves for energy carriers and market diffusion effects), with endogenously modelled construction, renovation, and demolition activities, and endogenously modelled investment decision-making for renovation measures and heating systems replacement, applying a nested logit approach (considering different types diffusion restrictions). A list of important endogenously and exogenously defined input parameter is given in Figure 4.

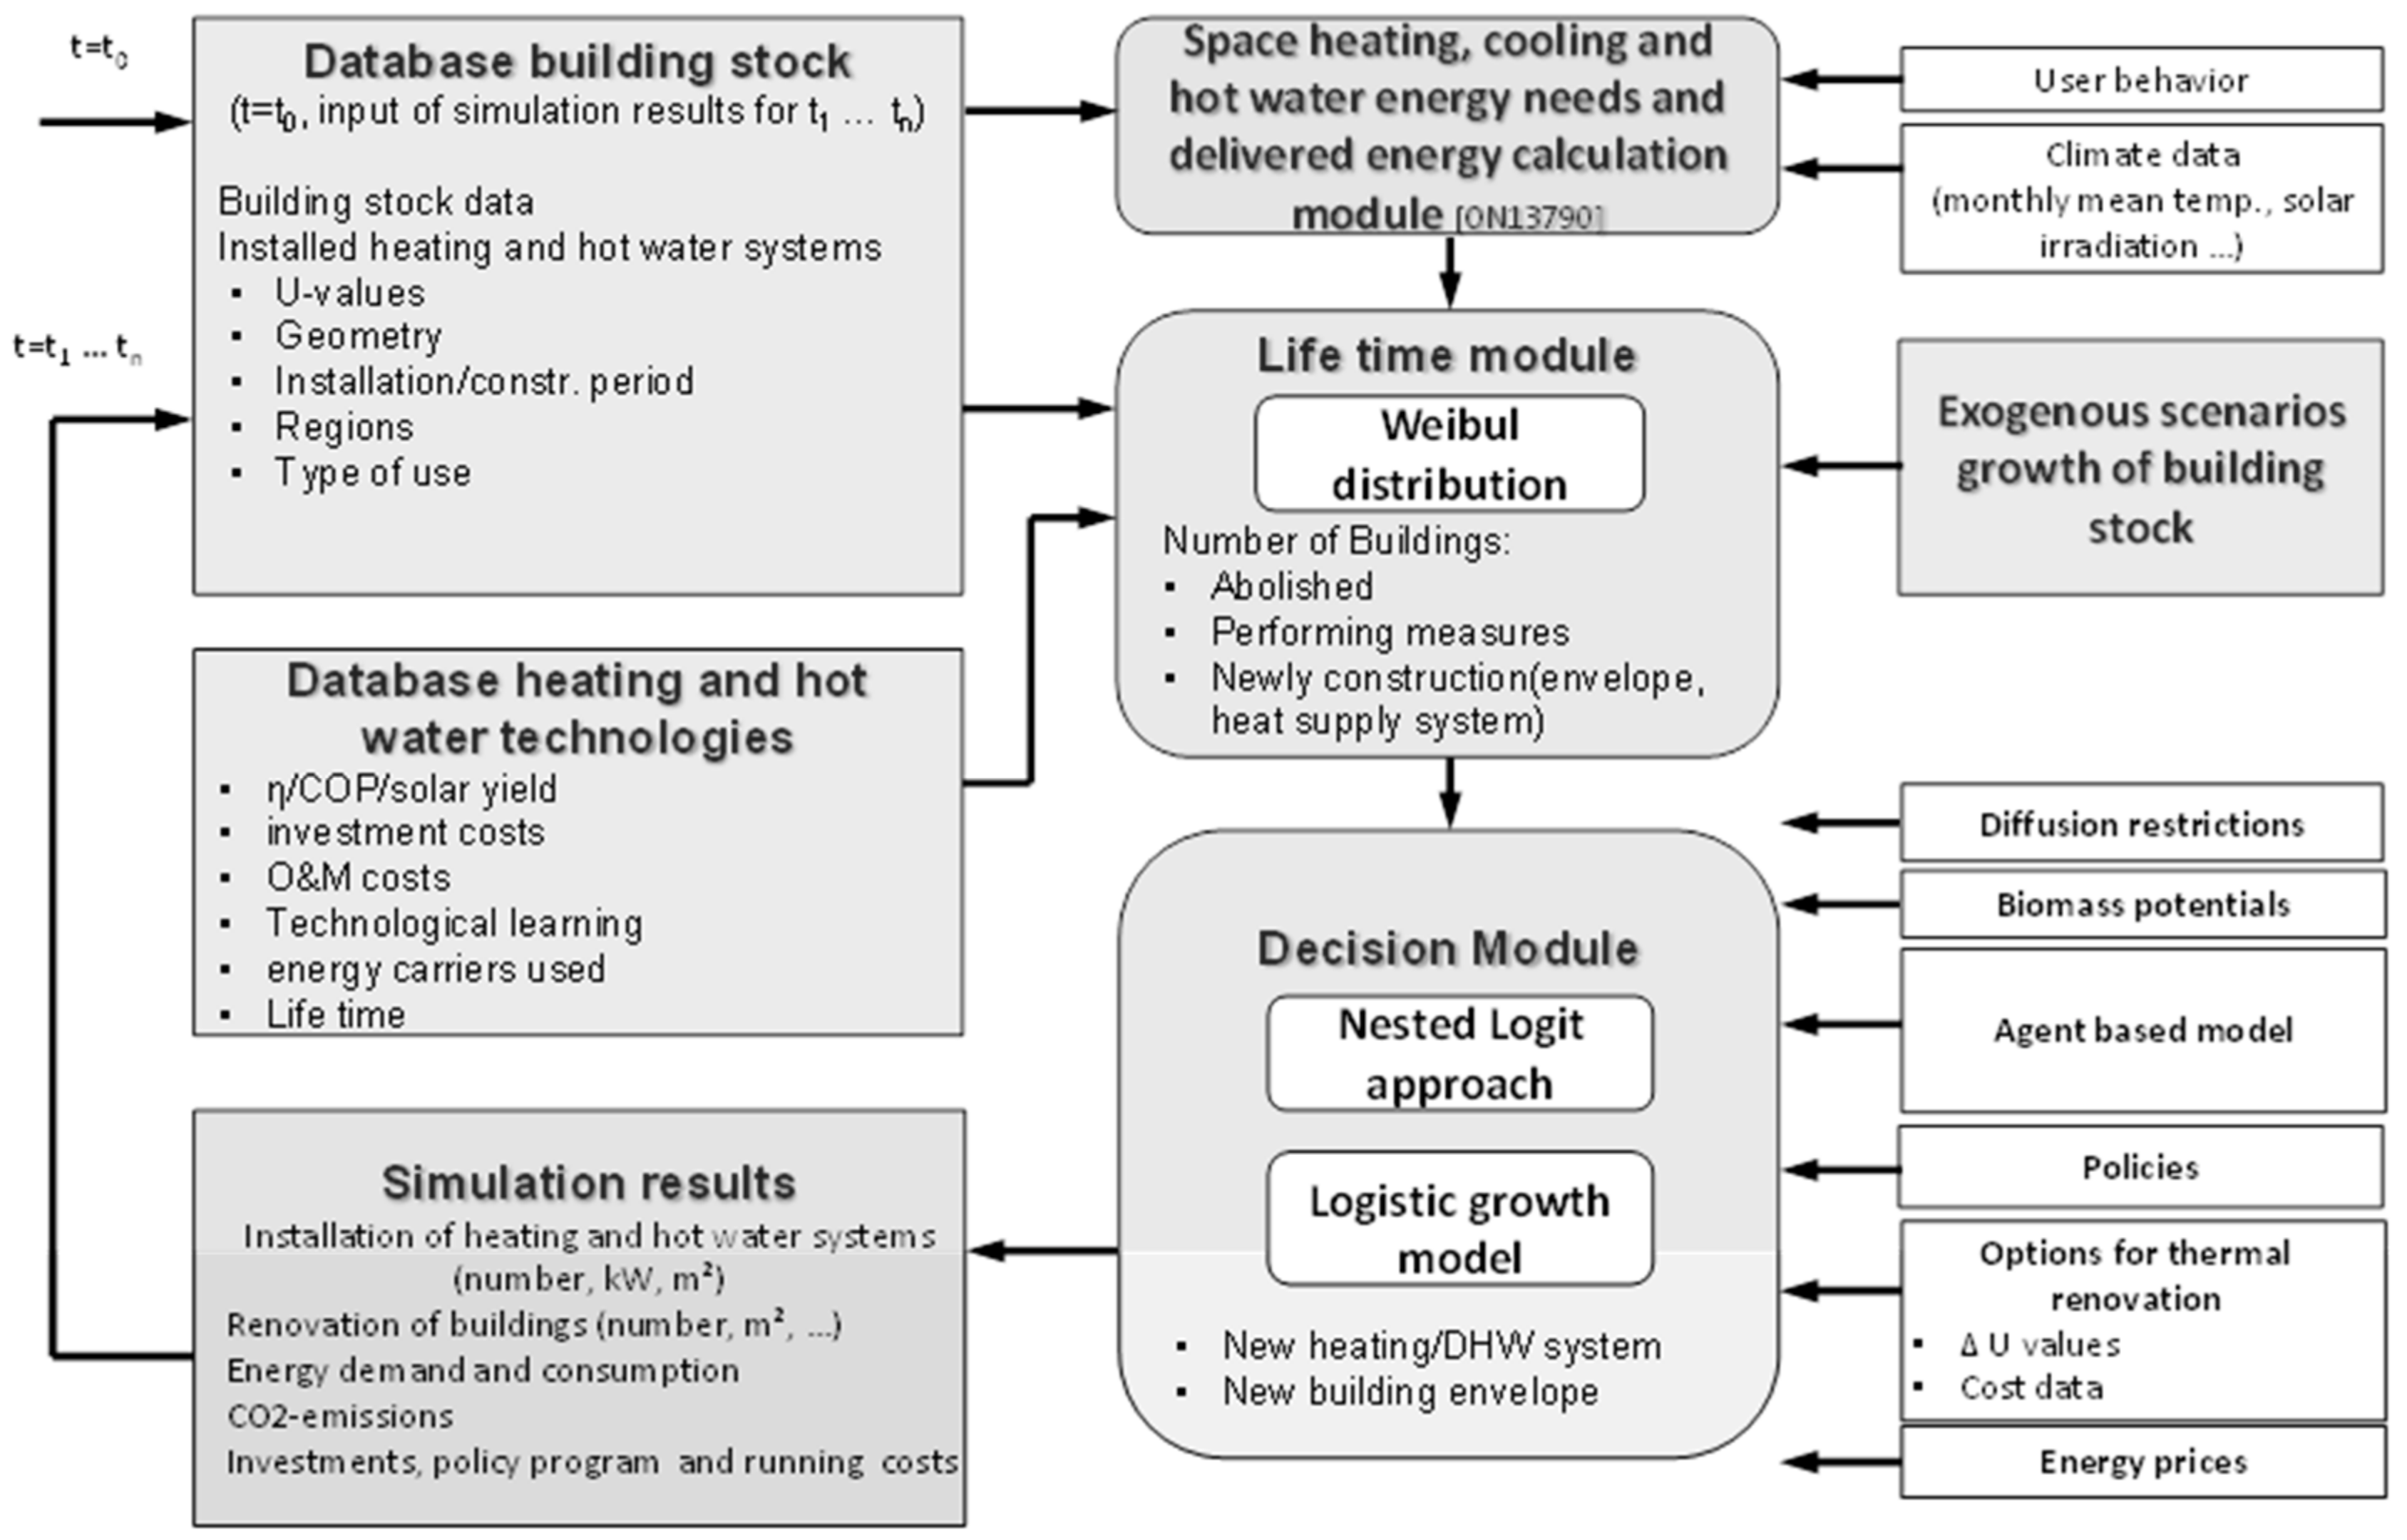
3.2. Application of Invert/EE-Lab Model

The Invert/EE-Lab model is primarily based on a bottom-up approach, although it considers some top-down elements, such as partial market equilibrium at national level for energy prices (mostly important for biomass) and user preferences and behaviours observed at national level. The key idea of the model is to
  • describe the building stock, heating, cooling, and domestic hot water systems on highly disaggregated level;
  • calculate the related energy needs and delivered energy based on technical calculation procedures (Austrian implementation of the EN 13790 and 15603);
  • determine reinvestment cycles for different building components and technologies using Weibull distribution-based survival curves;
  • simulate the decisions of various agents (i.e., owner types) in case that an investment decision is due for a specific building segment.
It should be noted that the national calculation procedure has been enhanced in order to meet the needs of countries with significantly higher outdoor temperatures (e.g., months with an average outdoor temperature that exceeds the indoor set point temperature). A comparison of the model results for different building types and different climate zones against simulations with the EnergyPlus model [37] is given in Zangheri [38].
The endogenous decision simulation is based on a myopical, nested logit approach [39]. This approach optimizes the objectives of “agents” under imperfect information conditions—imperfect knowledge regarding the agents information about available options as well as the modellers information regarding the actual preferences of investors and local barriers and local market costs of technologies—and by that the approach represents the decision-maker concerning building related decisions.
The building stock is defined as an archetype-based vintage model, classifying the building stock according to building type (e.g., single family houses, apartment buildings, etc.), age band, thermal systems (a set of about 30 heating and hot water technologies is available in the model, taking into account different energy carriers and technologies such as local stoves or condensing boilers) and energy performance level, including the segment of the stock that has undergone a thermal renovation. The levels of detail such as number of age bands, etc. depend on the availability and structure of national data. The model benefits from a comprehensive building stock dataset available for EU28, Norway, Switzerland and Iceland.
In accordance with the building segments presented in Section 2, 8 building categories were considered: (1) single family, row houses, and semidetached houses and (2) apartment buildings and other residential units, (3) offices (public and private), (4) wholesale and retail shops, (5) hotels and restaurants, (6) healthcare, (7) education, and (8) others. With respect to renovation measures, the model can simulate the uptake of various building envelope measures (exterior walls, ceiling/roof, floor, and windows), heat distribution measures within the building, ventilation systems, shading technologies, diffusion of efficient heating, hot water, cooling and lighting technologies as well as uptake of on-site PV systems. Two renovation levels are considered: “moderate” and “deep”. Moderate renovations are defined as renovations which reduce building energy needs to the energy performance level of buildings constructed between 2013 and 2016, while deep renovations lead to more ambitious energy performance levels: the average energy needs in kWh/m2 of each renovation level together with the average building stock level of 2012 are shown in Table 11. The total energy needs of the two renovation levels are at least 50% less than the energy needs of the average building stock in 2012.
The development of the energy prices underlining the scenarios is depicted in Figure 5. Compared to 2015 prices, it is assumed that the inflation corrected energy prices for heating oil and LPG will increase by 15% until 2030 and close to 47% until 2050. Energy prices for biogenic energy carriers are considered to increase by 38% until 2030 and 53% until 2050, if the consumption level remains below 250 GWh. If that consumption level is exceeded, energy prices are assumed to increase linearly. The total biomass usage of the sector is limited to 470 GWh, at which energy prices are assumed to have increased by a factor of two compared to the prices shown in Figure 5. The electricity price is considered to drop to 150 €/MWh in 2016 and increases afterwards. In 2030, the price level of 2015 is reached again. In 2050 the electricity price exceeds the 2015 price by 23%. The compensation of electricity produced by building-integrated small-scale PV systems fed into the grid is considered to increase from 90 €/MWh to 105 €/MWh. Considering the lower efficiency of oil- and LPG-based heat production, the small difference between the feed-in tariff and the heating oil/LPG prices makes heat production from surplus PV-electricity (when heat is needed) the economically more viable option compared to feeding the electricity into the grid.

3.3. Policy Scenarios

Based on the Cyprus situation and recommendations discussed in Section 2, three policy scenarios have been defined in our model simulations. The model enables the development of scenarios based on policy measures ranging from minimum energy performance requirements, financial incentives (i.e., investment grant, credit-line, tax income credit, VAT reduction, etc.), and transversal measures such as the energy performance certificates, information campaigns, information centres, workforce education, etc.
To define each policy measure, the following policy parameters are used. Building vintage (new or existing), policy type, implementation period, building type, energy/renovation level (e.g., a specific energy class), and occupant profile. For financial and fiscal measures, annual budget, investment coverage and repayment period (if applicable) are also used. In total, 13 different policies are assessed in the model. “Scenario 0” is defined as the continuation of existing policy measures in force; “Scenario 1” entails a combination of existing, upgraded, and new policy measures, and “Scenario 2” represents the most progressive combination of policies with all 13 policies included in the package.
Scenario 0
The baseline scenario includes two incentive measures with total annual budget of 3 Million €—focusing on existing buildings—and minimum energy performance requirements for new buildings and major renovations of existing buildings. By 31 December 2020, it is foreseen that the NZEB requirement will fully enter in force, and the role of Energy Performance Certificates as an information tool will be through independent control systems, the public EPC database, noncompliance penalties, methodology improvements, and accreditation schemes. Table 12 presents all policy parameters used to define Scenario 0.
Scenario 1
Scenario 1 consists of a total nine policy measures. In particular, the scenario entails the upgrade of two existing measures (Policies 1+ and 2+), continuation of Scenario 0 measures without any changes (Policies 3–5) and introduction of four new policies (Policies 6–9). As shown in Table 13, the ongoing grant initiatives for existing buildings are relaunched with a total budget of 12.5 Million €, of which 2.5 Million € is destined annually to support the renovations of low income households. Among the new measures, a new credit line—with an overall annual budget of 25 Million €, 5 Million € of which are public—offers preferential terms to support energy efficiency improvements including ESCO projects in 2018. The minimum energy performance requirements regarding new buildings and major renovations are not modified, but several information measures (with an annual budget of 850 thousand €) are introduced to increase awareness of benefits associated with energy efficiency as well as the qualification skills of construction workers. The information centres are defined as local energy renovation “one-stop shops” aimed to provide impartial information on how to plan and realise stepwise energy renovation projects.
This policy scenario implies a total public expenditure of 150 Million € over the entire simulation period (2018–2050). This is equivalent to an annual average public expenditure of 4.69 Million €, representing only 1.7% of the public expenditure on housing and communities in Cyprus in 2016 based on Eurostat data.
Scenario 2
As shown in Table 14, Scenario 2 consists of 13 policy measures. It includes the upgrade of three existing measures (Policies 1+, 2+, and 6+), continuation of Policies 3–5, 7–9, and the introduction of four new policies (Policies 10–13). This scenario represents the scenario with the highest commitment to energy efficiency, focusing, in particular, on renovations of the existing stock. In addition to updates in existing measures—namely increased support to investment grants (Policies 1+ and 2+) and credit line (Policy 6+)—new measures are implemented:
  • Tax income credit with which landlords can deduct a share of the cost of acquiring/installing certain EE measures against their income tax (Policy 10).
  • Gradually increasing minimum energy performance requirement (no worse than Class E by 2025 and no worse than Class D by 2030) when a property is rented out (Policy 11).
  • Reduction of VAT rate from 19% to 5% for energy efficiency investments including technologies and labour costs (Policy 12).
  • To demonstrate the feasibility of building designs which are of more ambitious levels than the current NZEB levels, a grant for new ZEB/PEB is introduced (Policy 13).
All these additional measures increase the total public expenditure until 2050 to 225 Million €. This represents 7.03 Million € additional public expenditure per year, which accounts for 2.6% of the public expenditure on housing and communities in Cyprus in 2016 (based on Eurostat data).

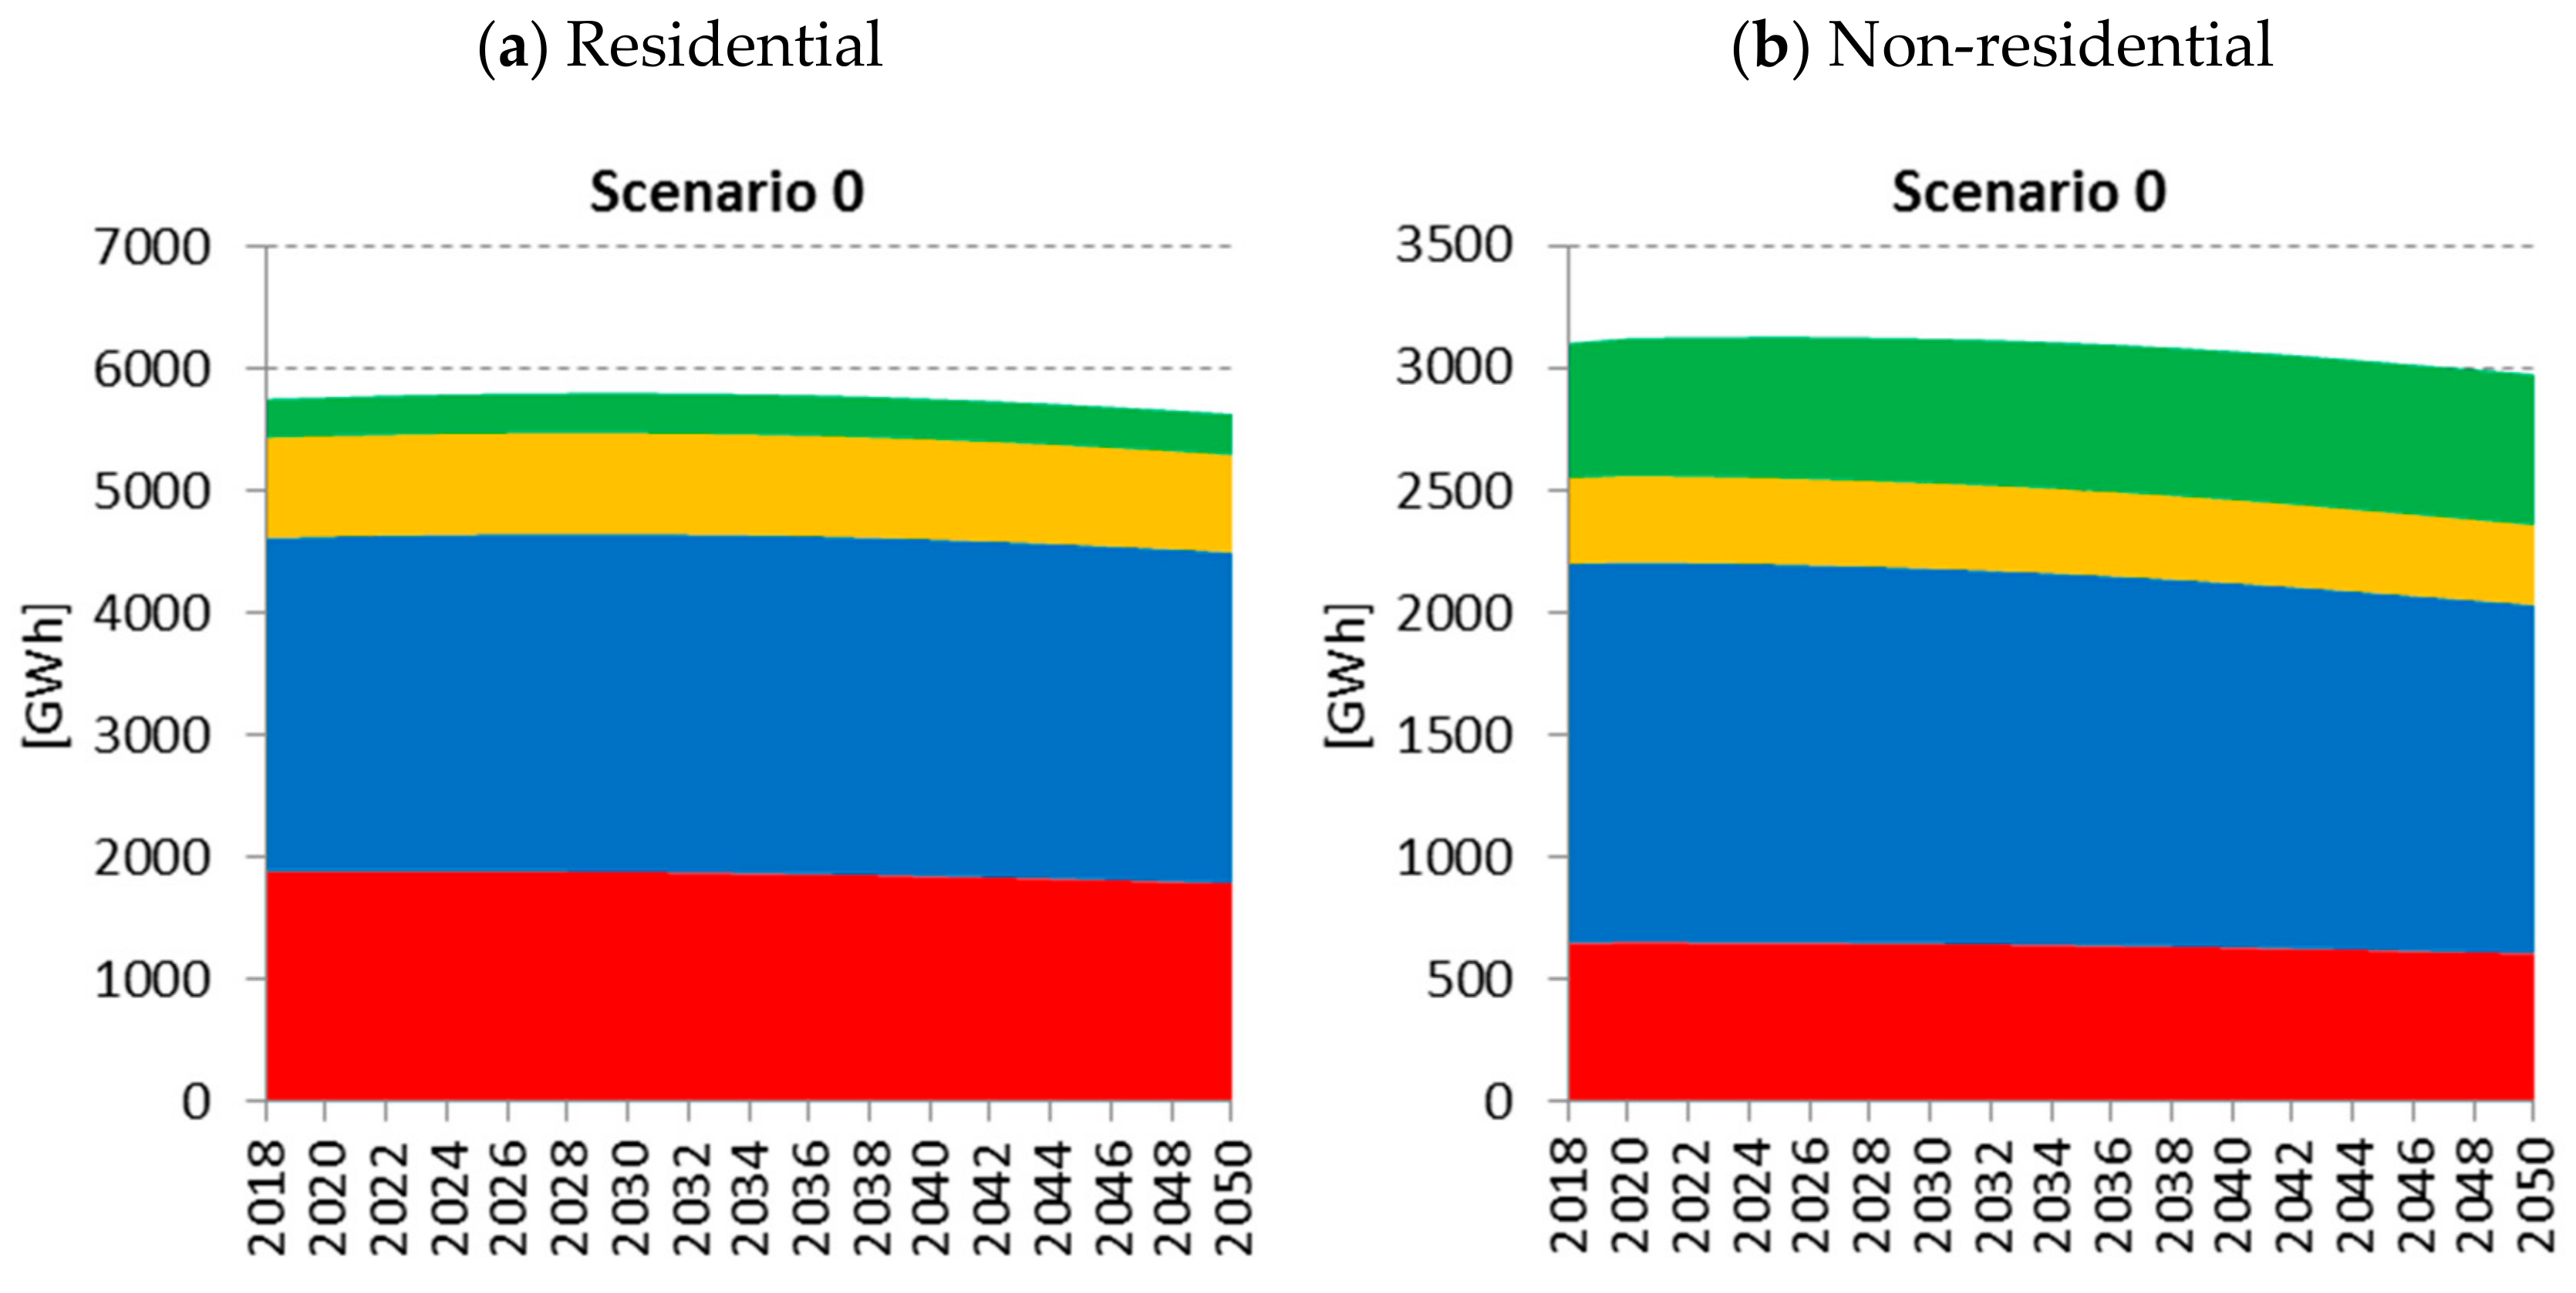
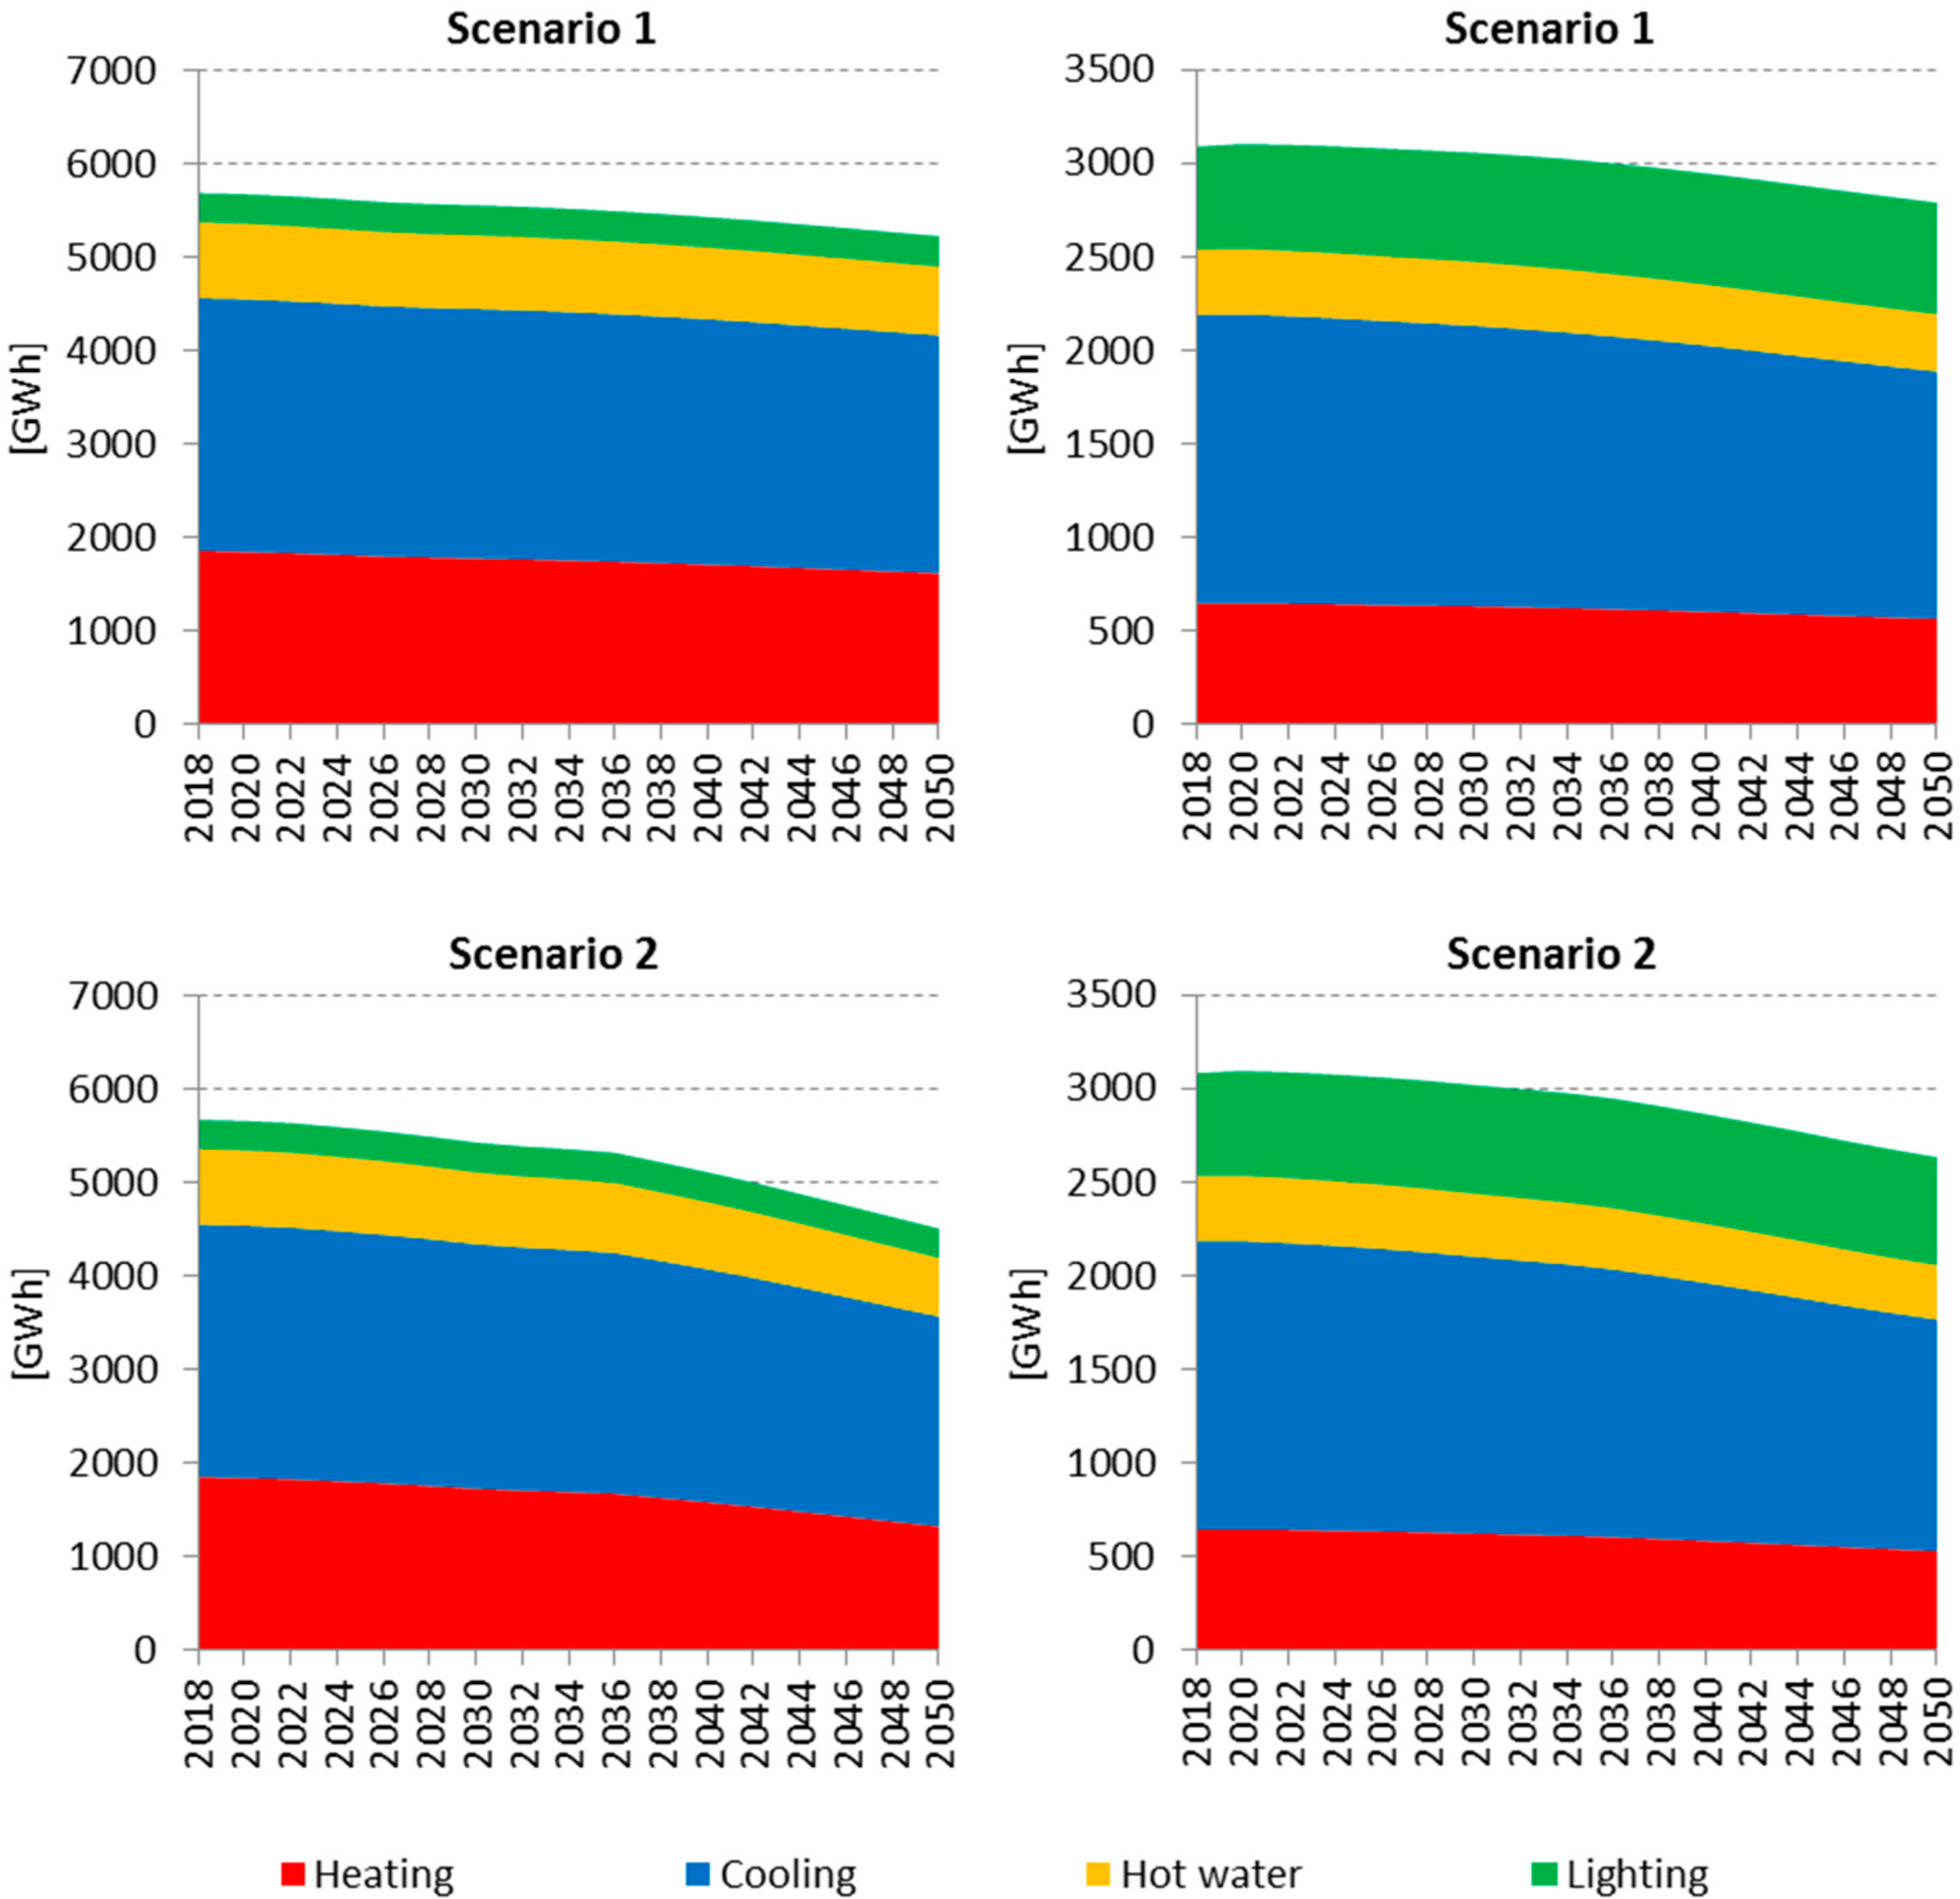
4. Modelling Results

In the following paragraphs, the results of the three scenarios are compared in terms of the building stock evolution and total energy needs for heating, cooling, hot water and lighting.
Building Stock Evolution
Based on the modelling results, it is expected that the floor area of the overall building stock will grow by 15% in 2030 compared to 2012 levels and by 26% in 2050. The growth of the non-residential stock is more substantial than the residential stock as the latter will increase by 16%, while the former by 69% in 2050. Despite this significant growth in the non-residential stock, the non-residential stock in 2050 will account for only 25% of the total stock (as opposed to 19% in 2012). It should be noted that the share of the non-residential stock floor area at EU level in 2013 stands at 25%. The non-residential stock of Cyprus, together with that of Italy, Greece, and Malta (which currently also have a small share of non-residential buildings) is expected to grow in coming years. As shown in Figure 6, over 40% of the building stock in 2050 will be energy efficient under Scenario 1, and nearly 60% under Scenario 2. This energy efficient segment of the building stock will consume at least half of the energy consumed by the building stock average of 2012. Looking at the breakdown of the results, it can be estimated that with respect to the baseline scenario (Scenario 0):
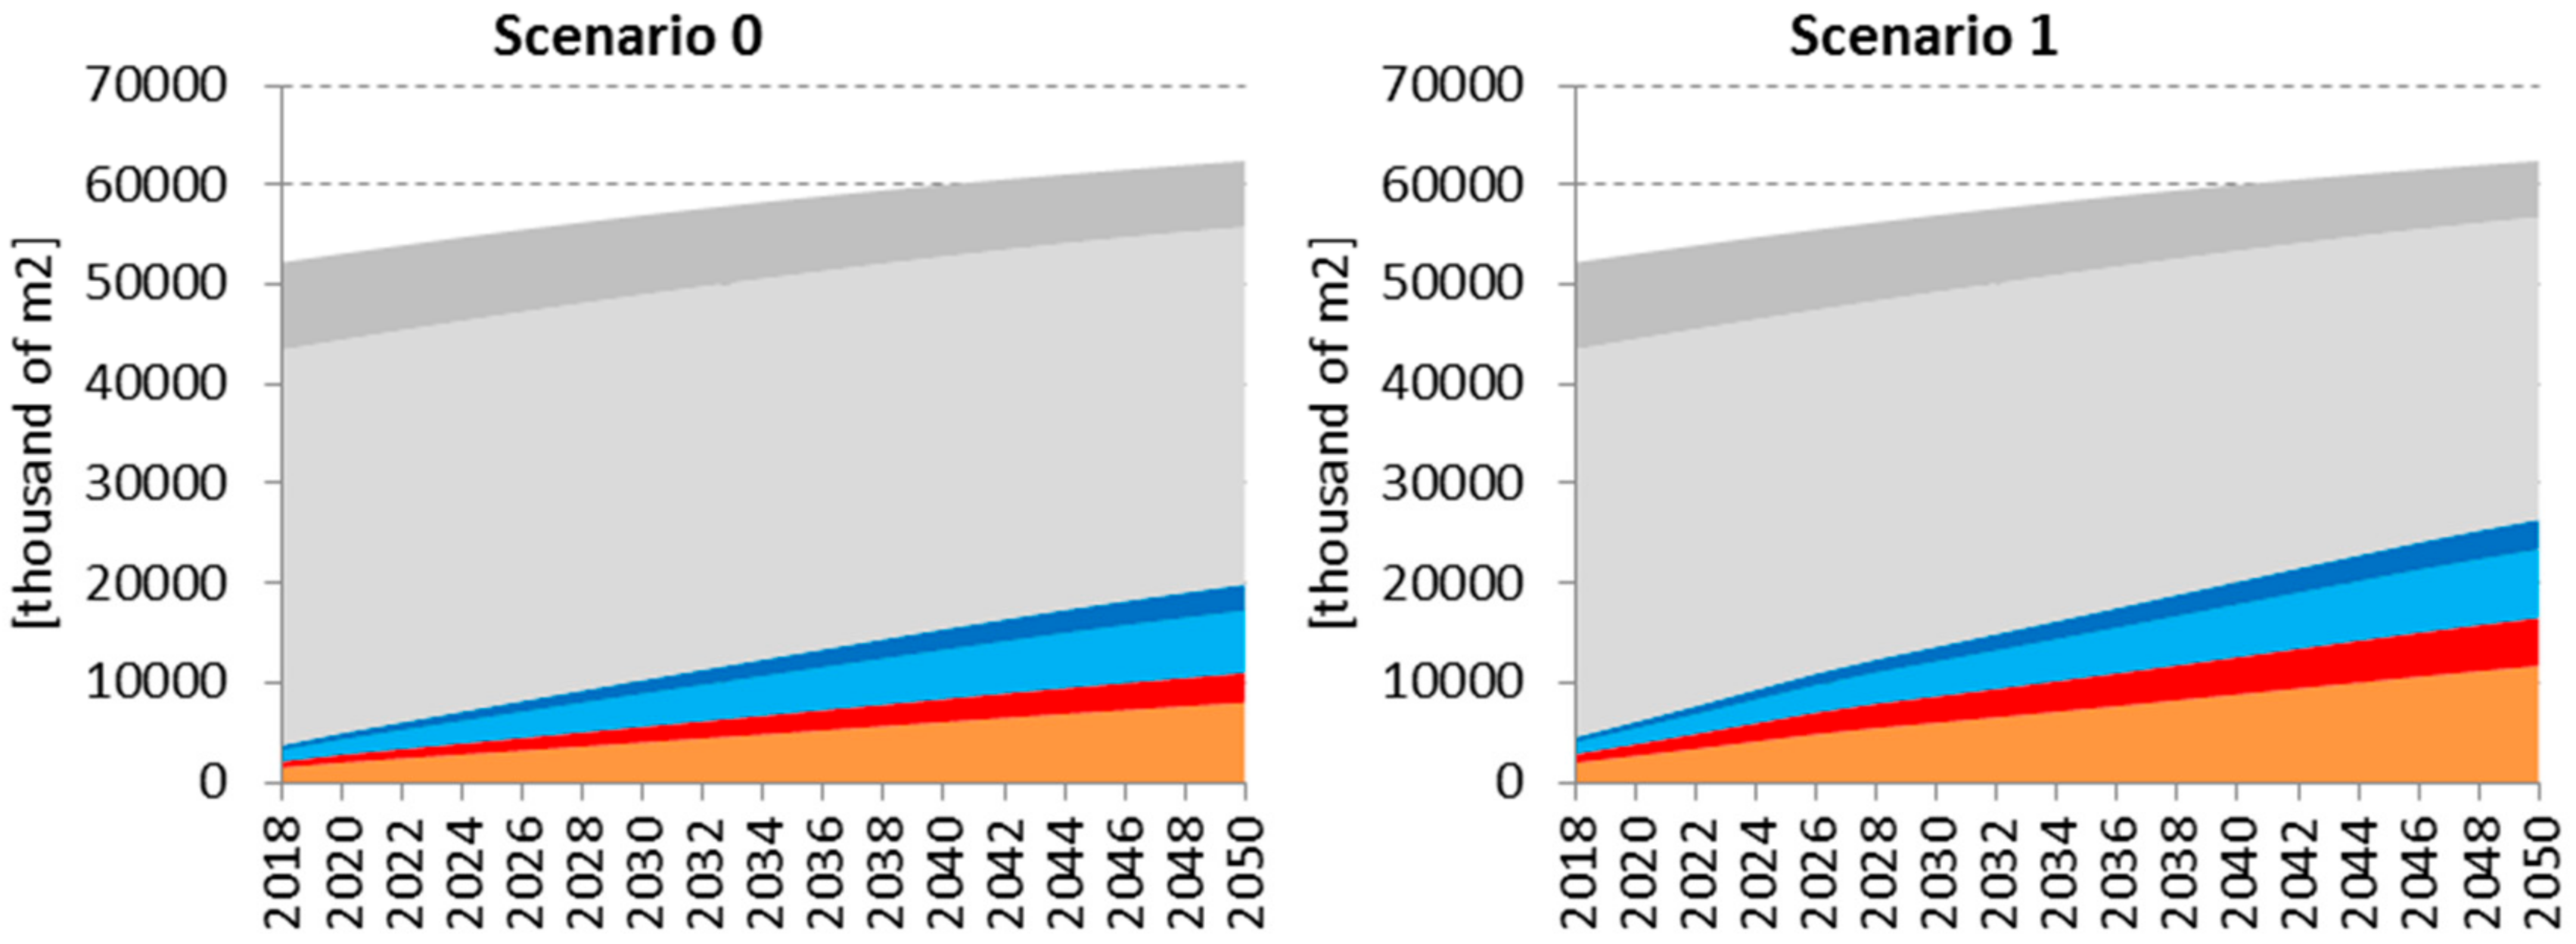
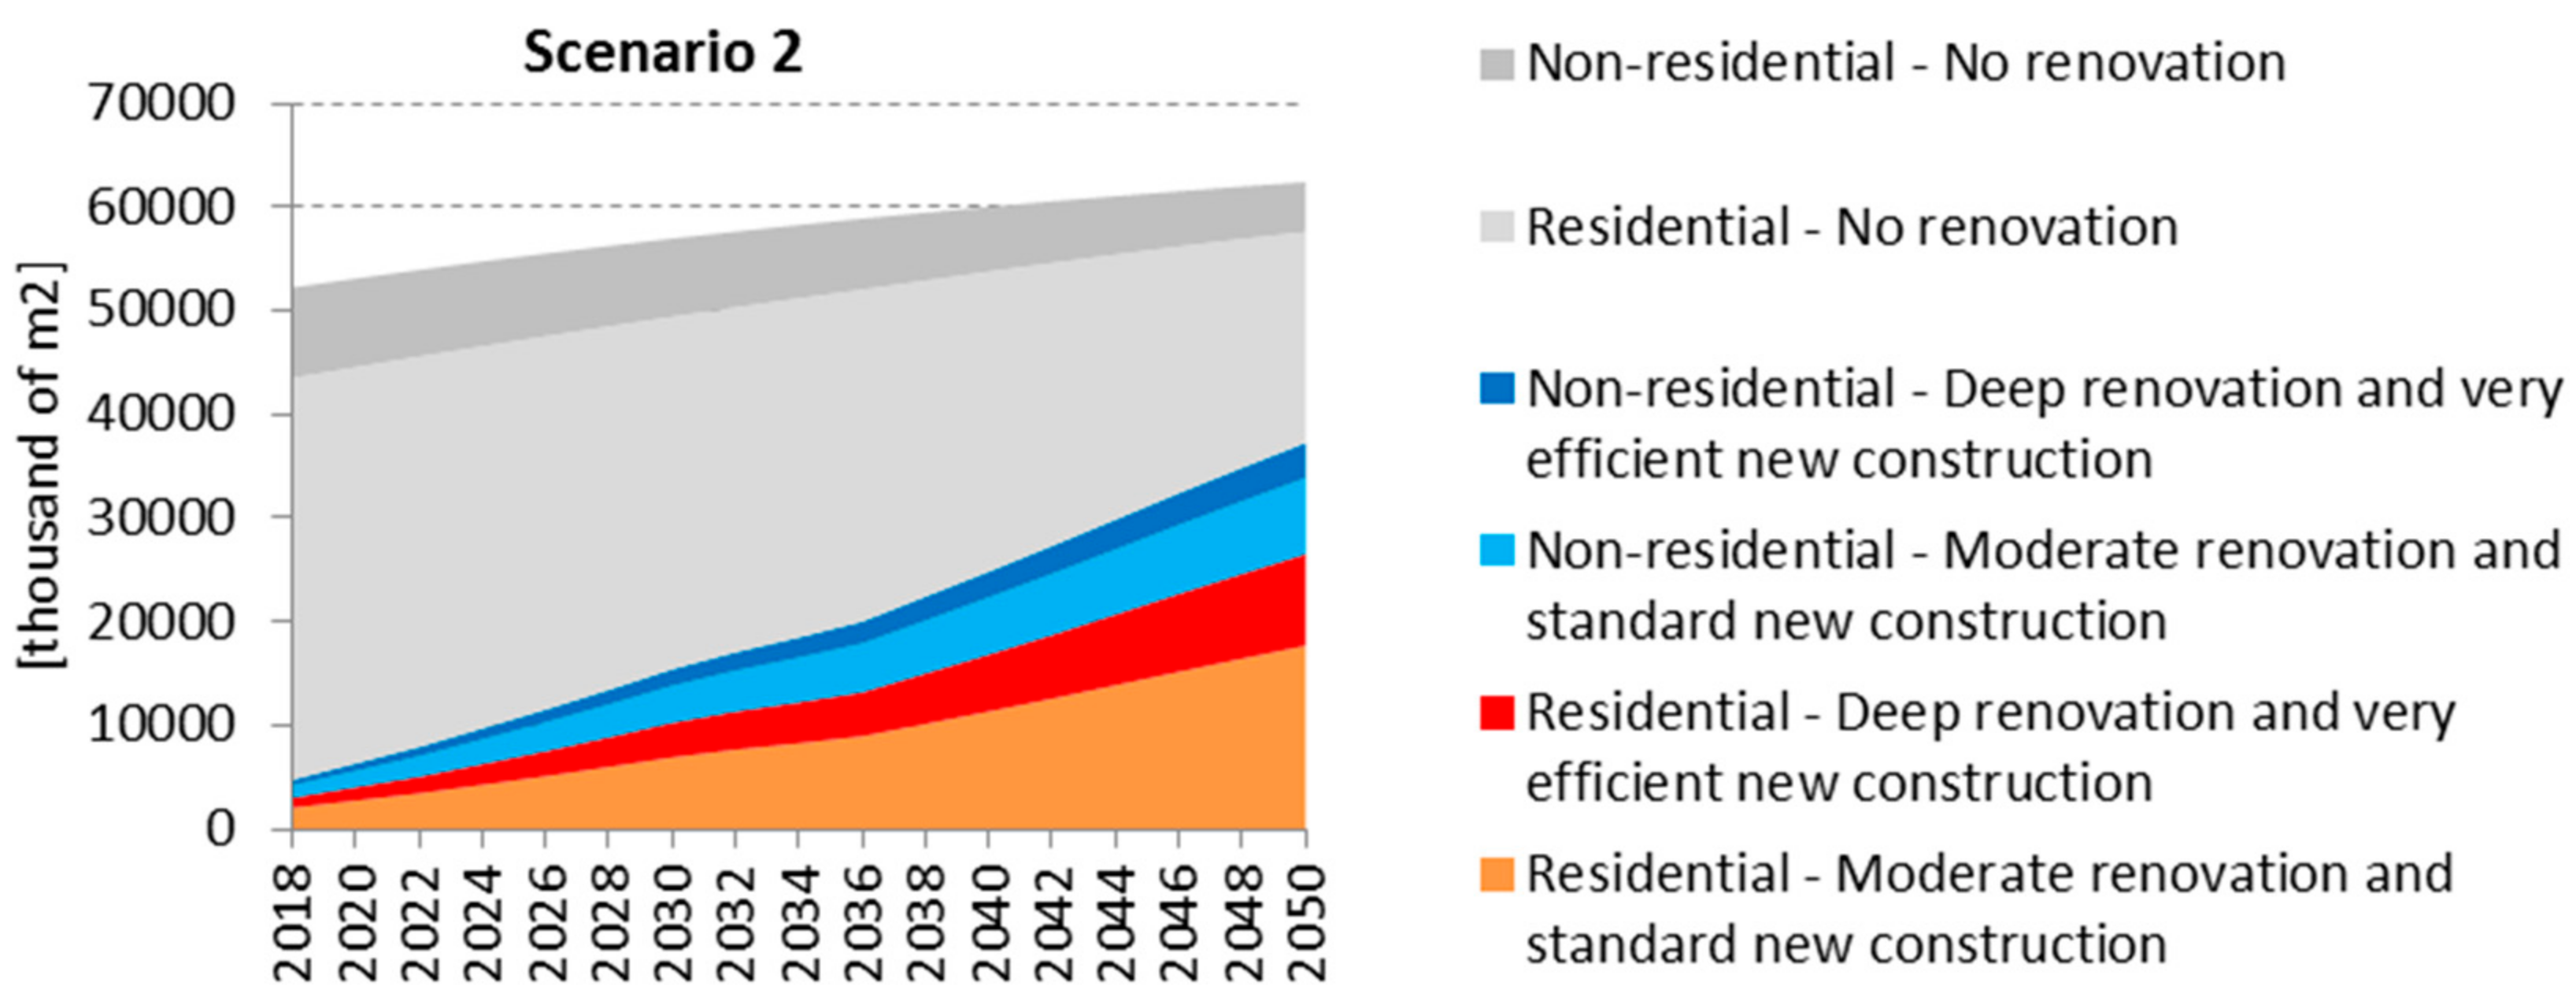
  • Scenario 1 would increase the share of moderately renovated buildings and standard new constructions from 12.7% to 16.5% in 2030 and from 22.6% to 29.4% in 2050;
  • Scenario 1 would increase the share of deeply renovated buildings and very efficient new construction from 5.8% to 7.9% in 2030 and from 10% to 13.5% in 2050;
  • Scenario 2 would increase the share of moderately renovated buildings and standard new constructions to 18.3% in 2030 and to 39.6% in 2050;
  • Scenario 2 would increase the share of deeply renovated buildings and very efficient new constructions to 9.2% in 2030 and to 20.5% in 2050.
The above results translate to an average annual renovation rate (calculated as the average of the yearly renovation rates over the period 2018 to 2020) of 0.4% under Scenario 1 (3-fold increase compared to the equivalent rate of Scenario 0) and 0.9% under Scenario 2 (a nearly 10-fold increase compared to Scenario 0). Under Scenario 0, deep renovations represent 22% of all renovations, and this share increases to 32% under Scenario 1 and 37% under Scenario 2. In terms of new buildings, the average annual construction rate remains at the same levels for all scenarios at around 0.8%. On average, 29% of all new constructions correspond to energy performance levels which go beyond the minimum energy performance standards.
Energy Needs for Heating, Cooling, Domestic Hot Water, and Lighting
The overall energy needs for heating, cooling, domestic hot water, and lighting in the Cypriot building stock (see graphs below), will be reduced to less than 8000 GWh by 2050 under Scenario 1 (corresponding to a reduction of −6% with respect to Scenario 0) and to about 7000 GWh under Scenario 2 (−16%). In the baseline scenario, the average building stock consumption will drop from 176 kWh/m2 in 2012 to 138 kWh/m2 in 2050. Under Scenarios 1 and 2, the 2050 average is estimated as 129 kWh/m2 and 115 kWh/m2, respectively. This is equivalent to a drop of 27% in Scenario 1 and 35% in Scenario 2 compared to the 2012 average level. The non-residential stock will experience the largest drop from 329 kWh/m2 in 2012 to 188 KWh/m2 in 2050 under Scenario 2 (corresponding to a drop of 43%), followed by the residential stock with a drop from 141 kWh/m2 to 111 kWh/m2 (corresponding to a drop of 22%) under the same scenario.
Figure 7 presents the evolution of the energy needs per end use type (heating, cooling, domestic hot water, and lighting) in the residential and non-residential building stock over the examined period. As expected, cooling needs represent the most energy consuming end use in both residential and non-residential buildings in Cyprus due its hot Mediterranean climate. In 2012, cooling accounted for 47% and 50% of the total energy needs in the residential and non-residential stock, respectively. While the share of cooling as part of the total energy needs remains roughly the same in 2050 (48–50% under Scenarios 0, 1, and 2), the absolute cooling needs will drop by 5% for residential and 12% in non-residential buildings in Scenario 1 and 17% in residential and 16% in non-residential in Scenario 2 compared to 2012 levels (in the baseline scenario, this is 1% increase in residential and 4% drop in non-residential). As shown in Figure 8, consumption for heating and domestic hot water follow similar declining trends until 2050. Lighting needs, on the other hand, are expected to slightly increase (e.g., 2% in 2050 compared to 2012 for residential and 11% for non-residential under Scenario 2) due to the moderate energy efficiency gains (see Table 6) and substantial floor area growth of the non-residential stock.

5. Conclusions

The modelling results have shown that the energy consumption covering the heating, cooling, domestic hot water, and lighting needs of the entire Cypriot building stock can be reduced by up to 16% in 2050 compared to the baseline scenario. Moreover, 60% of the building stock in 2050 will be energy efficient, i.e., it will consume less than half of the average energy consumed on average by the building stock in 2012. Based on the above findings, a roadmap laying out recommended actions and respective timelines from now until 2020 and beyond are outlined. While the ultimate goal is to streamline commercial financing into energy efficiency, the energy efficiency market still faces various obstacles, which require further government interventions.
Period to 2020
An exit strategy from grants should be discussed with the aim to gradually phase out grants in 2020 and limit their access to specific target groups (e.g., vulnerable groups) and specific ZEB/PEB actions (in the period 2020 to 2025). The first steps towards the development energy efficiency credit line through a public–private partnership should also be taken by holding a series of preparatory stakeholder meetings to discuss the set-up of a pilot phase of such energy efficiency credit line to be run in the first part of the 2020 to 2025 period. Sharing experiences with the other countries could support Cyprus in preparing a programme tailored to its needs. Beyond financial support measures, focus should also be drawn on efforts to strengthen the current Cypriot energy efficiency regulatory framework. This includes stronger compliance with minimum energy performance requirements, in particular for renovations through the establishment of a well-functioning renovation permit system and strengthening the role of Energy Performance Certificates as an information tool (e.g., by establishing an independent control system, penalties for noncompliance, improvements in the methodological framework, as well as implementation of accreditation schemes for installers and EPC assessors). The roll out of information campaigns to increase awareness of benefits of energy efficiency for households, businesses, and financiers, including the development of a tool quantifying financial savings of various packaged measures, should be considered.
2020–2025
Upon successful completion of the ESCO pilot projects in the public sector, the promotion of ESCOs to increase their involvement in the non-residential sector should be considered. This could be in the form of ESCO portfolio guarantees to attract more ESCOs into the business and guarantee the risk of clients. With the end of the grant scheme, the adoption of tax credit/deduction scheme 22 to familiarise landlords to engage in energy efficiency upgrades in residential rented buildings could be considered. The first results of the pilot credit line programme should be assessed with the view to roll out a full programme from 2025 onwards. Following the ex-post assessment of the practical application of ZEB/PEB constructions in the Cypriot context through its dedicated ZEB/PEB scheme, the NZEB levels should be reviewed in order to examine whether further tightening in building codes would be justifiable in both technical and economic terms. Qualification programmes for construction workers should be put in place with the aim to improve the skillset of the Cypriot workforce and familiarise them with various new technologies, in light of the demand increase for energy efficiency projects and in particular for the construction of NZEBs.
2025–2030
Lessons learned from the pilot phase of the credit line should be drawn in order to improve the bankability of such projects and streamline commercial financing into energy efficiency as well as commercial ESCO financing. Review and redesign of the overall policy package based on the experience gained should be carried out and if necessary, readjustments or use of complementary measures should be considered. For example, gradual introduction of minimum requirements for rented or owner-occupied apartment buildings could be considered, in conjunction with the modification of the current property tax system to incorporate the efficiency level of the building into property tax paid by owners. The latter will incentive property owners of very inefficient buildings to invest in energy efficiency upgrades in order to reduce their tax burden. In terms of information & advice, local “one-stop shops” for energy renovation, providing owners with a single contact point for impartial information on how to plan and realise step-by-step energy renovation projects should be set up. This will help the public assess different interventions and technologies, gather information on the benefits of various renovation packages, and find out about financing options including available public support, information on contractors, and ESCOs.

Author Contributions

Work conceptualisation: M.E., P.Z.; Model and simulations: A.M., L.K.; Analysis of results and discussion: P.Z., M.E.; Writing: M.E., P.Z., A.M.; Revision of the manuscript: M.E.

Funding

This research received no external funding.

Conflicts of Interest

The authors declare no conflicts of interest.

References

  1. Piripitsi, A.; Stougiannis, E.; Chatzinikolaou, N.; Thoma, G.; Ellinopoulos, C.; Kakouris, M.; Ioannou, S.; Kyrizis, K. Fourth National Energy Efficiency Action Plan of Cyprus; Cyprus Ministry of Energy, Commerce, Industry and Tourism: Nicosia, Cyprus, 2017.
  2. Zachariadis, T.; Michopoulos, A.; Vougiouklakis, Y.; Struss, B.; Piripitsi, K.; Ellinopoulos, C. In-Depth Assessment of the Energy Efficiency Potential in Cyprus. Cyprus Econ. Policy Rev. 2017, 11, 86–112. [Google Scholar]
  3. Serghides, D.K.; Dimitriou, S.; Katafygiotou, M.C.; Michaelidou, M. Energy efficient refurbishment towards nearly zero energy houses, for the Mediterranean region. In Proceedings of the 7th International Conference on Sustainability in Energy and Buildings, Lisbon, Portugal, 1–3 July 2015. [Google Scholar]
  4. Panayiotou, G.; Kalogirou, S.; Florides, G.; Maxoulis, C.N.; Papadopoulos, A.M.; Neophytou, M.F.; Georgakis, G. The characteristics and the energy behaviour of the residential building stock of Cyprus in view of Directive 2002/91/EC. Energy Build. 2010, 42, 2083–2089. [Google Scholar] [CrossRef]
  5. Mantzos, L.; Wiesenthal, T.; Matei, N.A.; Tchung-Ming, S.; Rozsai, M. JRC-IDEES: Integrated Database of the European Energy Sector. Methodological Note; EUR 28773 EN, JRC108244; Publications Office of the European Union: Luxembourg, 2017; ISBN 978-92-79-73465-6. [Google Scholar]
  6. Cyprus Ministry of Energy, Commerce, Industry and Tourism. Calculation for Setting the Minimum Energy Performance Requirements at Cost Optimal Levels According to Article 5 of the Directive 2010/31/EE for the Energy Performance of Buildings; Cyprus Ministry of Energy, Commerce, Industry and Tourism: Nicosia, Cyprus, 2013.
  7. Michael, A.; Phocas, M.C. Energy Performance Evaluation and Heat Insulation Measures for Typical Educational Buildings in Cyprus. In Proceedings of the 3rd International Conference on Renewable Energy Sources & Energy Efficiency, Nicosia, Cyprus, 19–20 May 2011; ISBN 978-9963-567-02-7. [Google Scholar]
  8. Cyprus Statistical Service. Health and Hospital Statistics 2012; Cyprus Statistical Service: Nicosia, Cyprus, 2014. [Google Scholar]
  9. Katafygioutou, M.C.; Serghides, D.K. Analysis of structural elements and energy consumption of school building stock in Cyprus: Energy simulations and upgrade scenarios of a typical school. Energy Build. 2014, 72, 8–16. [Google Scholar] [CrossRef]
  10. Cyprus Ministry of Education and Culture. Registry of Private Pre-school, Primary and Secondary Education Facilities; Cyprus Ministry of Energy, Commerce, Industry and Tourism: Nicosia, Cyprus, 2015.
  11. Cyprus Energy Agency. WE-Qualify. Training, Specialization, Certification. Acquiring Knowledge and Skills for the Energy Performance Improvement of Buildings in Cyprus; Final Report; Cyprus Energy Agency: Nicosia, Cyprus, 2016. [Google Scholar]
  12. Cost, M. Langfristige Energieverbrauchs- und CO2-Reduktionspotenziale im Wohngebäudesektor der Schweiz. Ph.D. Thesis, ETH Zürich, Zürich, Switzerland, 2006. [Google Scholar]
  13. Sartori, I.; Wachenfeldt, B.J.; Hestnes, A.G. Energy demand in the Norwegian building stock: Scenarios on potential reduction. Energy Policy 2009, 37, 1614–1627. [Google Scholar] [CrossRef]
  14. Hansen, P. Entwicklung Eines Energetischen Sanierungsmodells für den Europäischen Wohngebäudesektor unter dem Aspekt der Erstellung von Szenarien für Energie- und CO2-Einsparpotenziale bis 2030; Schriften des Forschungszentrums Jülich, Energie Umwelt; Forschungszentrum Jülich GmbH: Jülich, Germany, 2009; Volume 48, ISBN 978-3-89336-590-6. [Google Scholar]
  15. Olonscheck, M.; Holsten, A.; Kropp, J.P. Heating and cooling energy demand and related emissions of the German residential building stock under climate change. Energy Policy 2011, 39, 4795–4806. [Google Scholar] [CrossRef]
  16. Broin, E.Ó.; Mata, É.; Göransson, A.; Johnsson, F. The effect of improved efficiency on energy savings in EU-27 buildings. Energy 2013, 57, 134–148. [Google Scholar] [CrossRef]
  17. Heeren, N.; Jakob, M.; Martius, G.; Gross, N.; Wallbaum, H. A component based bottom-up building stock model for comprehensive environmental impact assessment and target control. Renew. Sustain. Energy Rev. 2013, 20, 45–56. [Google Scholar] [CrossRef]
  18. Mata, E.; Kalagasidis, A.S.; Johnsson, F. A modeling strategy for energy, carbon, and cost assessments of building stocks. Energy Build. 2013, 56, 100–108. [Google Scholar] [CrossRef]
  19. McKenna, R.; Merkel, E.; Fehrenbach, D.; Mehne, S.; Fichtner, W. Energy efficiency in the German residential sector: A bottom-up building-stock-model-based analysis in the context of energy-political targets. Build. Environ. 2013, 62, 77–88. [Google Scholar] [CrossRef]
  20. Mattinen, M.K.; Heljo, J.; Vihola, J.; Kurvinen, A.; Lehtoranta, S.; Nissinen, A. Modeling and visualization of residential sector energy consumption and greenhouse gas emissions. J. Clean. Prod. 2014, 81, 70–80. [Google Scholar] [CrossRef]
  21. Tuominen, P.; Holopainen, R.; Eskola, L.; Jokisalo, J.; Airaksinen, M. Calculation method and tool for assessing energy consumption in the building stock. Build. Environ. 2014, 75, 153–160. [Google Scholar] [CrossRef]
  22. Dascalaki, E.G.; Balaras, C.A.; Kontoyiannidis, S.; Droutsa, K.G. Modeling energy refurbishment scenarios for the Hellenic residential building stock towards the 2020 & 2030 targets. Energy Build. 2016, 132, 74–90. [Google Scholar]
  23. Sandberg, N.H.; Sartori, I.; Vestrum, M.I.; Brattebø, H. Using a segmented dynamic dwelling stock model for scenario analysis of future energy demand: The dwelling stock of Norway 2016–2050. Energy Build. 2017, 146, 220–232. [Google Scholar] [CrossRef]
  24. Wilkerson, J.T.; Cullenward, D.; Davidian, D.; Weyant, J.P. End use technology choice in the National Energy Modeling System (NEMS): An analysis of the residential and commercial building sectors. Energy Econ. 2013, 40, 773–784. [Google Scholar] [CrossRef]
  25. Fujimori, S.; Masui, T.; Yuzuru, M. AIM/CGE [basic] Manual; NIES Discussion Paper Series; Center for Social and Environmental Systems Research, NIES: Tsukuba, Japan, 2012. [Google Scholar]
  26. Li, F.G.N.; Strachan, N. Modelling energy transitions for climate targets under landscape and actor inertia. Environ. Innov. Soc. Trans. 2017, 24, 106–129. [Google Scholar] [CrossRef] [Green Version]
  27. Bataille, C.; Jaccard, M.; Nyboer, J.; Rivers, N. Towards General Equilibrium in a Technology-Rich Model with Empirically Estimated Behavioral Parameters. Energy J. 2006, 27, 93–112. [Google Scholar] [CrossRef]
  28. Elsland, R. Long-Term Energy Demand in the German Residential Sector; Development of an Integrated Modelling Concept to Capture Technological Myopia; Nomos Verlagsgesellschaft: Baden-Baden, Germany, 2016; ISBN 978-3-8487-2631-8. [Google Scholar]
  29. Henkel, J. Modeling the Diffusion of Innovative Heating Systems in Germany—Decision Criteria, Influence of Policy Instruments and Vintage Path Dependencies. Ph.D. Thesis, Technical University of Berlin, Berlin, Germany, 2012. [Google Scholar]
  30. Bauermann, K. German Energiewende and the Heating Market—Impact and Limits of Policy. University of Duisburg-Essen, EWL Working Paper No. [20/2013]. 2013. Available online: http://econpapers.repec.org/paper/duiwpaper/1320.htm (accessed on 20 April 2017).
  31. De Vita, A.; Tasios, N.; Evangelopoulou, S.; Forsell, N.; Fragiadakis, K.; Fragkos, P.; Evangelopoulou, S.; Zampara, M.; Papadopoulos, D.; Nakos, C.; et al. EU Reference Scenario 2016. Energy, Transport and GHG Emissions: Trends to 2050; Publications Office of the European Union: Luxembourg, 2016. [Google Scholar]
  32. Müller, A. Energy Demand Assessment for Space Conditioning and Domestic Hot Water: A Case Study for the Austrian Building Stock. Ph.D. Thesis, Technische Universität Wien, Vienna, Austria, 2015. [Google Scholar]
  33. Steinbach, J. Modellbasierte Untersuchung von Politikinstrumenten zur Förderung erneuerbarer Energien und Energieeffizienz im Gebäudebereich; Fraunhofer Verlag: München, Germany, 2016; ISBN 978-3-8396-0987-3. [Google Scholar]
  34. Nabera, E.; Volka, R.; Schultmann, F. From the building level energy performance assessment to the national level: How are uncertainties handled in building stock models. Procedia Eng. 2017, 180, 1443–1452. [Google Scholar] [CrossRef]
  35. Chappin, E.; Hesselink, L.; Blok, K.; Müller, A.; Fries, B.; Braungardt, S. Changing Energy Efficiency Technology Adoption in Households. Deliverable D3.2 of the CHEETAH Project. Horizon 2020 Project Number. 723716, TU Delft. 2017. Available online: https://www.briskee-cheetah.eu/static/media/uploads/site-3/library/d3.2.cheetah_working_paper_on_modelling_and_survey.pdf (accessed on 19 October 2017).
  36. Kranzl, L.; Hummel, M.; Müller, A.; Steinbach, J. Renewable heating. Perspectives and the impact of policy instruments. Energy Policy 2013, 59, 44–58. [Google Scholar] [CrossRef]
  37. Crawley, D.B.; Lawrie, L.K.; Winkelmann, F.C.; Buhl, W.; Huang, Y.J.; Pedersen, C.O.; Strand, R.K.; Liesen, R.J.; Fisher, D.E.; Witte, M.J.; et al. EnergyPlus: Creating a new-generation building energy simulation program. Energy Build. 2001, 33, 319–331. [Google Scholar] [CrossRef]
  38. Zangheri, P.; Armani, R.; Pietrbon, M.; Pagliano, L.; Boneta, M.F.; Müller, A. Heating and Cooling Energy Demand and Loads for Building Types in Different Countries of the EU. D2.3. of WP2 of the Entranze Project. Available online: http://www.entranze.eu/files/downloads/D2_3/Heating_and_cooling_energy_demand_and_loads_for_building_types_in_different_countries_of_the_EU.pdf (accessed on 23 March 2017).
  39. Williams, H.C.W.L. On the formulation of travel demand models and economic evaluation measures of user benefit. Environ. Plan. A 1977, 9, 285–344. [Google Scholar] [CrossRef]
Figure 1. Cyprus historical (1990–2015) and projected (2016–2020) energy consumption in thousand tonnes of oil equivalent (ktoe). Source: Eurostat and Cyprus National Energy Efficiency Action Plan (NEEAP) 2017 [1,2].
Energies 11 03071 g001
Figure 2. Residential floor area per building type and construction period.
Energies 11 03071 g002
Figure 3. Non-residential floor areas per building type, climate condition, and construction period.
Energies 11 03071 g003
Figure 4. Structure of the Invert/EE-Lab simulation model [32].
Energies 11 03071 g004
Figure 5. Development of energy prices (in Euros at 2015 exchange rates) per MWh considered in the scenarios.
Energies 11 03071 g005
Figure 6. Evolution of the building stock (floor area) over the period 2018 to 2050 estimated for the different policy scenarios.
Energies 11 03071 g006aEnergies 11 03071 g006b
Figure 7. Evolution of the energy needs for heating, cooling, hot water, and lighting over the period 2018 to 2050 for the different policy scenarios.
Energies 11 03071 g007
Figure 8. Evolution of the energy needs of (a) residential and (b) non-residential building stock over the period 2018 to 2050 for the different policy scenarios.
Energies 11 03071 g008aEnergies 11 03071 g008b
Table 1. Overview of current policy package targeting buildings in Cyprus.
DetailsBuilding CodesInformation ToolsFinancial MeasuresEducation & Training
Main policy measuresa. Minimum energy performance requirements in new and existing buildings
b. Nearly Zero Energy Buildings
a. Energy performance certification scheme
b. Energy audits
a. Grants for EE & renewables
b. Grants for PV instalment and NET metering
c. Grants “I save—I upgrade”
a. Qualified energy experts
b. Energy auditors
c. Energy managers
d. Energy service providers
Decree referencesa. 568/2007, 446/2009, 432/2013, 119/2016
b. 366/2014
a. 433/2013, 71/2016
b. 437/2015
-a. 164/2016, 419/2015, 309/2017
b. 184/2012
c. 344/2016
d. 210/2014
Target groupa. New constructions and major renovations
b. New constructions
a. Building owners, tenants, occupants
b. Industry, SME actors
a. Households, companies, public entitiesb. Householdsc. Households, companies, public entitiesa. Licenced engineers/architects with min 3-year work experience
b. Licenced engineers with min 3-year work experience
c. Professionals with relevant experience
d. Energy service companies and other energy-related professionals
Impl. perioda. 2008–
b. 2020–
a. 2013–
b. 2015–
a. 2004–2013
b. 2013–2020
c. 2014–2020
a. 2013–
b. 2012–
c. 2016–
d. 2014–
Table 2. Main energy performance requirements in the building sector for new buildings and major renovations (based on information provided in Decrees 568/2007, 446/2009 and 432/2013, 366/2014, and 119/2016). Legend: “PEC” = Primary Energy Consumption, “RES” = Renewable Energy System, “res” = residential; “n-res” = non-residential.
Requirements20072009201320172020 (NZEB)
Max U-value of walls [W/m2K]0.850.850.720.400.40
Max U-value of roofs [W/m2K]0.750.750.630.400.40
Max U-value of floors [W/m2K]2.002.002.000.400.40
Max U-value of windows [W/m2K]3.83.83.232.92.25
Maximum U-mean [W/m2K]-1.3–1.81.3–1.8 *--
Max window shading coefficient [−]--0.630.63-
Installation provisions-RESRES--
Min share of PEC to be covered by RES--3% (n-res)3–25% (res) *
7% (n-res) *
25% *
Max mean installed lighting power (offices) [W/m2]---10 *10 *
Minimum Energy Class-Class BClass BClass B *Class A *
Max energy demand for heating (res) [kWh/m2]----15 *
Max primary energy consumption [kWh/m2]----100 (res) *
125 (n-res) *
* These requirements apply only to new buildings.
Table 3. Main elements of financial incentive programmes supporting energy efficiency investments in Cyprus.
Main ElementsGrant Scheme 2004–2013Grant Scheme 2014–2020
Funding structureFund financed by a fee of EUR 0.50 c/kWh on electricity consumption for all final consumersCofinanced with EU Structural Funds
Total available fundingEUR 100 million (corresponding to around 10 million/year)EUR 31.8 million (corresponding to around 4–5 million per year)
Targeted buildingsOwner-occupied residential buildings; Public sector buildings that exercise economic activity; Commercial buildings; Buildings of non-for-profit organisationsResidential buildings or building units part of an apartment building; Buildings owned or rented by SMEs
Energy upgrade target-Class B, 40% energy savings, nZEB renovation
Factors determining financial supportTechnology typeHousehold income; Ambition of energy upgrade
Main Intervention measuresResidential: Building envelope insulation; Solar thermal systems; PV systems
Non-residential: Recovery of waste energy; Reduction of non-productive energy consumption and energy losses; Energy management systems; Automation; cogeneration system, Solar thermal systems; PV systems
Residential/Non-residential:
Building envelope insulation; Window replacement; Energy efficiency boilers for space heating/domestic hot water; Geothermal heat pumps; Solar thermal systems; Biomass boilers; Efficient light bulbs; waste energy recovery systems; cogeneration systems; Smart meters; External removable or fixed shading; Energy efficient air conditioning systems (split units)
Implementation bodyCyprus Institute of EnergyMinistry of Energy, Commerce, Industry and Transport
Table 4. Typical energy needs for heating and cooling [kWh/m2] and energy uses for the main residential building typologies. Source: Author elaborations from data provided by Cyprus Statistical Service (CYSTAT), JRC-IDEES, and CY cost-optimal calculations [6].
Building TypeAgeSpace HeatingSpace CoolingWater HeatingLightingAppliancesCooking
[kWh/m2][kWh/m2][kWh/m2][kWh/m2][kWh/m2][kWh/m2]
Single familyBefore 19815472238206
1981–20064054187154
After 20063650156144
Row and SemidetachedBefore 19815958239216
1981–20064344187164
After 20063940156154
ApartmentBefore 198145105238196
1981–20063384186154
After 20063076156134
OtherBefore 1981565323480
1981–2006414118380
After 2006373815370
Table 5. Distribution of residential dwellings (single family, row, semidetached, etc.) according to type of installed heating and cooling system (“HP”: Heat Pump). Source: Author elaborations from CYSTAT data.
Thermal SystemFuelSingle FamilyRow & SemidetachedApartmentOther
HeatingCentral heating (kerosene): standardoil33%32%15%2%
Central heating (kerosene): condensingoil----
Room stoves (kerosene)oil2%2%2%1%
Central heating (gas): standardgas3%1%1%-
Central heating (gas): condensinggas----
Room stoves (gas)gas14%13%1-27%
Central heating (electric): standard HPelectricity3%4%5%1%
Central heating (electric): geothermal HPelectricity----
Room fixed units (hot air): standardelectricity17%22%35%15%
Room fixed units (hot air): efficientelectricity4%5%9%4%
Room stoves (electric)electricity9%1-12%22%
Room storage heaters (EAC)electricity2%3%5%-
Room Fireplacebiomass9%5%1%2%
Room solar heating system----1%
No or other heating facilities-2%2%5%7%
All100%100%100%100%
CoolingCentral cooling (electric): standard HPelectricity3%4%5%1%
Central cooling (electric): geothermal HPelectricity----
Room fixed units (cold air): standardelectricity63%63%62%65%
Room fixed units (cold air): efficientelectricity16%16%15%16%
No or other cooling facilities-18%18%18%18%
All100%100%100%100%
Table 6. Typical energy needs for heating and cooling [kWh/m2] and energy uses for different non-residential building typologies, in coastal and low land climates. Source: Author elaborations from data provided by JRC-IDEES, the CY cost-optimal calculations [6], and specific registries [7,8,9,10].
Building TypeAgeSpace HeatingSpace CoolingWater HeatingLighting
OfficesBefore 200680171544
After 200654117440
Whole and Retail Sails BuildingsBefore 2006373323105
After 2006252262.595
Hotels and RestaurantsBefore 200610417011055
After 2006711167550
Health CareBefore 20069618112170
After 2006661238365
EducationBefore 20063555735
After 20062437530
OthersBefore 200619735813770
After 20061342449365
Table 7. Distribution of non-residential buildings according to type of heat generators installed (“elect.”: electricity, “biom.”: biomass, “Off”: Private offices and public buildings; “SupRet”: Supermarkets, malls and retail shops; “HotRest”: Hotels, other accommodation, restaurants and taverns; “Health”: Health care sector; “Edu”: Education sector; “Other”: Other buildings). Source: Author elaborations from CYSTAT data.
Thermal SystemFuelOffSubRetHotRestHealthEduOther
HeatingCentral heating (kerosene): stand.oil41%11%43%31%86%41%
Central heating (kerosene): conden.oil1%1%1%1%2%1%
Room stoves (kerosene)oil------
Central heating (gas): standardgas4%1%10%4%3%6%
Central heating (gas): condensinggas--1%---
Room stoves (gas)gas------
Central heating (electric): stand. HPelect.44%78%40%61%5%44%
Central heating (electric): geoth. HPelect.1%1%-1%-1%
Room fixed units (hot air): standardelect.6%4%3%-2%4%
Room fixed units (hot air): efficientelect.1%-1%--1%
Room stoves (electric)elect.------
Room storage heaters (EAC)elect.------
Room Fireplacebiom.------
Room solar heating system-------
No or other heating facilities2%3%1%2%2%2%
All100%100%100%100%100%100%
CoolingCentral cooling (electric): stand. HPelect.56%82%61%68%34%59%
Central cooling (electric): geoth. HPelect.1%1%-1%-1%
Room fixed units (cold air): standardelect.20%4%24%9%5%19%
Room fixed units (cold air): efficientelect.3%-4%2%1%3%
No or other cooling facilities20%13%10%20%60%19%
All100%100%100%100%100%100%
Table 8. Main achievements and concerns in current policy framework in Cyprus.
PolicyMain Achievements and Concerns
Building codesMain achievementsMandatory energy performance requirements in building codes have been a significant achievement; gradual tightening of requirements and switch from prescriptive- to performance-based requirements are regarded as positive steps.
ConcernsNZEB levels for 2020 are not ambitious; compliance with requirements in major renovations is an issue
Information toolsMain achievementsAll legislation regarding energy performance certification and energy audits have been put in place.
ConcernsCurrent or potential users are often not informed about energy performance class of their buildings and are unaware of benefits of potential energy efficiency improvements.
Education & trainingMain achievementsA comprehensive framework for education, qualification, and training for energy auditors, specialised experts for energy performance certificates, energy service providers, and energy managers is available
ConcernsNeed to improve the vocational education and training system for technical occupations; training needs in construction sector are expected to grow.
Financial measuresMain achievementsGovernment-supported grants to households, businesses, and public sector have been a major generator of energy savings in the country.
ConcernsTransition from grant-based to a more diverse portfolio of economic policy measures has not yet been made.
Table 9. Proposed portfolio of economic policy instruments in Cyprus. ZEB: Zero-energy building.
TimeframeResidentialNon-Residential
Owner OccupiedApartment BlocksRented BuildingsVulnerable GroupRentedOwned
Existing buildings<2013Grant--Grant-Grant
NowGrant-GrantGrant
ProposedCredit line/Preferential loansTax income for landlordsSpecial grantsCredit line/Preferential loans
ZEB GrantsZEB GrantsESCO portfolio guarantees
New buildingsNow------
ProposedCredit line/Preferential loans-Special grants-ZEB Grants
ZEB GrantsZEB Grants
Table 10. Endogenously and exogenously defined central input parameters of the Invert/EE-Lab model applied in this study.
Endogenously CalculatedExogenously Defined
  • Building demolition and construction rates
  • Renovation rates and replacement rates of heating system
  • Energy need and final energy consumption
  • User behaviour: Deviation between calculated energy needs according to energy performance certificates and observed energy consumption
  • Share of competing refurbishment options
  • Share of competing heat supply options
  • Partly energy price by employing the concept of cost–resource potential curves
  • Geometry of buildings
  • Usage of building
  • Existing building stock
  • Energetic properties of components of existing building stock
  • Reference energy prices and cost–resource potential curves
  • Development of number of buildings per building category, climate region and energy carrier region
  • Available technologies, their energetic properties and costs
  • Income and sectorial value added
  • Climate conditions
  • Availability of energy carriers per region
  • Investor preferences
  • Policy measures: Financial and regulatory instruments
Table 11. Average energy needs/uses [kWh/m2] for the residential and non-residential Cyprus building stock and renovation options.
End-UseResidentialNon-Residential
Building StockRenovation OptionBuilding StockRenovation Option
2012ModerateDeep2012ModerateDeep
[kWh/m2][kWh/m2][kWh/m2][kWh/m2][kWh/m2][kWh/m2]
Space heating471715702621
Domestic hot water20109371813
Space cooling6738341666046
Lighting866563728
Total1427164329141108
Table 12. Definition of policies under Scenario 0.
Policy ElementsPolicy 1Policy 2Policy 3Policy 4Policy 5
Building vintageExistingExistingNew & existingNew & existing-
Policy typeInvestment grants for energy efficiencyInvestment grants for energy efficiencyMinimum energy performance requirementsMinimum energy performance requirementsEnergy performance certificates
Period2014–20202014–20202013–20202021–20502010–2050
Building typeAllResidentialAllAllAll
Energy or renovation levelModerate & deepModerateEPC class BNearly zero energy-
Occupant profileAllLow incomeAllAllAll
Public annual budget2.5 Million €0.5 Million €---
Investment coverage25%25%---
Table 13. Definition of upgraded and additional policies under Scenario 1 (“+” sign denotes upgraded policies, “*” indicate continuation of previously-specified policy parameters).
Policy ElementsPolicy 1+Policy 2+Policy 6Policy 7Policy 8Policy 9
Building vintageExisting *Existing *Existing buildingsAllAllAll
Policy typeInvestment grants for energy efficiency *Investment grants for energy efficiency *Credit line for energy efficiencyRoll out of inform. campaignsInform. centres for energy renovationWorkforce education
Period2014–2020 *2014–2020 *2018–20282018–20502020–20502014–2050
Building typeAll *Residential *AllAllAllAll
Energy or renov. levelModerate & deep *Moderate *Moderate & deep---
Occupant profileAll *Low income *Building ownersAllAll-
Public annual budget10 mill €2.5 mill €5 mill €0.1 mill €0.5 mill €0.25 mill €
Bank annual budget- *- *20 mill €---
Invest. coverage25% *25% *50%---
Repay. period- *- *15 years---
Table 14. Definition of upgraded and additional policies under Scenario 2 (“+” sign denotes upgraded policies, “*” indicate continuation of previously-specified policy parameters).
Policy ElementsPolicy 1+Policy 2+Policy 6+Policy 10Policy 11Policy 12Policy 13
Building vintageExisting *Existing *Existing *ExistingExistingExistingNew
Policy typeInvest. grants energy eff. *Invest. grants energy eff. *Credit line for energy efficiency *Tax income credit for landlordsMin. energy perf. require-ments for rentalsVAT reduction for energy efficiency interventionsGrants for zero energy buildings
Period2014–2020 *2014–2020 *2018–2028 *2018–20252025–20502020–20502020–2022
Building typeAll *Res. *All *AllAllRes.All
Energy or renov. levelModerate & deep *Shall. *Moderate & deep *ModerateModerate & deepModerate & deepZero Energy
Occ. profileAll *Low income *Building owners *Land-lordsLand-lordsAllAll
Public annual budget12 mill €5 mill €7.5 mill €2.5 mill €--2.5 mill €
Bank annual budget- *- *25 mill €----
Invest. cov.25% *25% *75%50%--25%
Repay. period- *- *15 years *10 years---

