Experimental Research on the Structural Behavior of Fractured Coal under Uniaxial Compression
by
 , ,
, ,
Dongjie Xue
1,2,3,* ,
,
Hongwei Zhou
1,
Jianfeng Liu
4,
Jie Zhou
1,
Yintong Liu
1,
Yongwei Zhao
1 and
Liao Zhang
1 1
School of Mechanics and Civil Engineering, China University of Mining and Technology, Beijing 100083, China
2
State Key Laboratory of Coal Mine Disaster Dynamics and Control, Chongqing University, Chongqing 400030, China
3
Key Laboratory of Safety and High-efficiency Coal Mining, Anhui University of Science and Technology, Huainan 232001, China
4
State Key Laboratory of Hydraulics and Mountain River Engineering, Sichuan University, Chengdu 610065, China
*
Author to whom correspondence should be addressed.
Energies 2018, 11(10), 2538; https://doi.org/10.3390/en11102538
Submission received: 19 August 2018
/
Revised: 15 September 2018
/
Accepted: 19 September 2018
/
Published: 23 September 2018
Abstract
:Tests of the effects of uniaxial compression on the structural behavior of fractured coals were conducted. The structural behavior is different from the material behavior of intact samples and the discontinuous behavior based on the block theory. It is a macro response of continuous-discontinuous behavior in coal with varied fracture structure geometry, and includes the material behavior with cracking and contact behavior with sliding. The structural behavior is studied based on the complete stress-strain curve, the material parameters, i.e. elastic modulus, Poisson’s ratio, and compression strength, and the structural integrity parameters, i.e. longitudinal and shear wave velocity, and the physical parameter, i.e. density. All the parameters are compared with the different fracture patterns. Various types of parameter degradation damage are defined to describe the structural characteristics with the different fracture patterns. They shows the effective relation of damage with strength. Furthermore, the mechanisms of the structural modulus degradation, structural failure deformation, and structural strength evolution are discussed. The results show that the post-peak behavior can be defined as the structural behavior. With the structural formation-reloading failure cycle, the mutual conversion changes between structural geometry instability and stability, and the characteristics are stress drops or stress platforms generated by structural rebalance. It is pointed out that the post-peak unloading is a macro response of the structural geometry. It includes the recovery of elastic strain and structural resilience strain, and structural stress drop.
1. Introduction
The fractured or jointed rock nature of excavated coal, the complex composition [1,2] as well as the fracture or crack distribution [3,4,5,6] are all likely to deteriorate its macro- and meso-mechanical behavior. The structural geometry of crack networks may dominate the macro behavior, which cannot be connected to the intact coal without fractures. The real state of fractured coal is in a continuous-discontinuous state. Most studies focus separately on the material behavior with cracking or contact behavior by the block theory with sliding. The structural behavior should consider the coupled effect of cracking material and sliding contact. It is important to directly understand the continuous-discontinuous behavior based on the fractured coal nature. Some important work [7,8] is based on the intact coal only [9], without considering the fractured coal. However, with the evolution of stress fields [10,11], the generation of new fractures will also deteriorate the mechanical behavior [12]. The degradation of surrounding coal plays a role in maintaining the stability of the roadway and working face [13,14]. During the excavation process, coal rarely exists as intact coal [15] but rather forms a structural coal mass by discontinuous geometry cutting [16]. The fracture topology shows complex and diverse geometric patterns [17]. It is also affected by complex geological internal forces, temperature, and human engineering activities [18]. Fractured coal tends to control the mechanical behavior of the regional zone including the material behavior of the intact part and the contact behavior, i.e. the nonlinear sliding of the geometrical structure of the fractures.
In lab, the coal is often processed into an intact cylinder [19,20] for studying the material behavior considering it as a porous medium [21,22]. Fractured cylinders are apt to be discarded because of their broken block composition [23]. Many studies of the macro-nonlinear behavior of fractured rocks are based on the material behavior without considering the structural effects [24,25,26]. Indeed, the material behavior focuses mainly on the continuous responses, and the structural behavior mainly focuses on the interactions between blocks and blocks, blocks and fractures, and fractures and fractures. It depends on the structural elements of fractured geometry, the structural mode, and the structural characteristics, i.e., the permutations and combinations of the discontinuous structural elements. Classical results show that the continuum assumption is applicable to both pre- and post-peak behaviors [27,28,29], but ignore the post-peak structural behavior caused by the failure with newly generated structural elements.
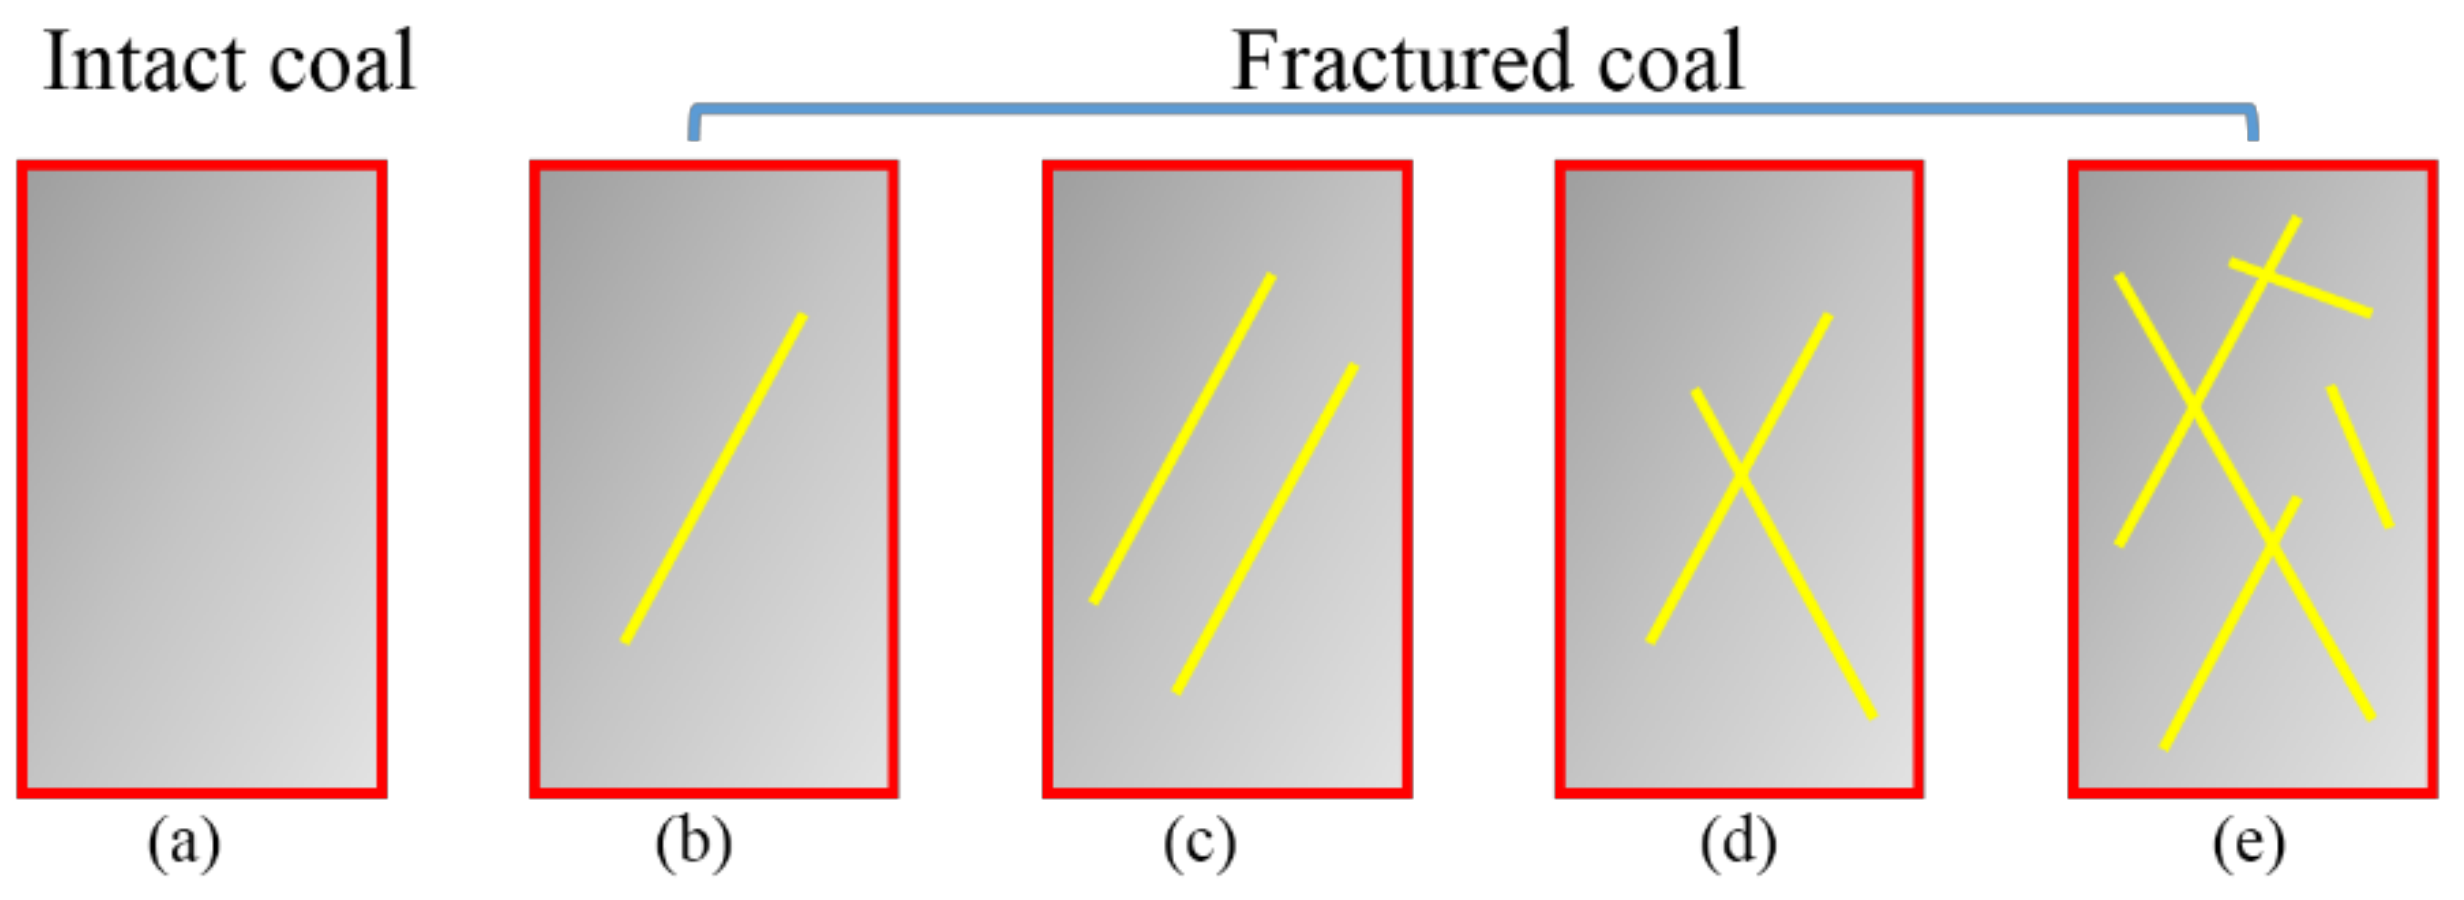
In situ experiments are the most direct forms of studying fractured coal [30,31]. However, there are challenges including the non-universality of the fractures and the experimental difficulty. To overcome the complexity, similar materials are often used. However, this will cause new problems due to the analogy of material parameters. To learn the difference of material behavior and structural behavior, we conducted uniaxial compression tests in the lab using prepared fractured coal. It is difficult to group fractured coal samples into the same class. To simplify the discussion, we have used the following classification, which is not a perfect classification method, but helps us understand the structural behavior. As shown in Figure 1, the fractures can be classified into four typical patterns according to the cutting combination of the backbone fractures: main direction dominated fractures (MDF), simple cross fractures (SCF), complicated distribution fractures (CDF), and parallel direction fractures (PDF) [32]. PDF can be regarded as a complex case of MDF, which is between MDF and SCF. For the macro behavior of fractured coal, the combination that plays a leading role is known as backbone fracture.
2. Fractured Coal Sample Preparation
2.1. Coal Geology and Sample Classification
Coal blocks were collected from the working face of a mine in China at a depth of 705 m. The mining length of the working face is 864 m and the inclination width is 190 m. The thickness is mostly between 3.2–3.9 m with the inclination angle between 17°–25°. The roof and floor are both about 3.0 m thick and constituted by sandy mudstone, which easily swells with water.
Two locations have been chosen for sample collection. The results show these samples have different physical properties. One group (Group 1) has an average density of 1.34 g/cm3 and an average longitudinal wave velocity of 815 m/s. Similarly, the second group (Group 2) has a density of 1.51 g/cm3 and a velocity of 1600.4 m/s. The difference is due to different contents of minerals in the coal. Here, we define Group 1 as weakened coal, and Group 2 as strong coal. It is not an absolute classification, but is can be used to analyze the structural behavior of fractured coal with different physical and mechanical properties.
2.2. Sample Preparation under Various Stress Unloading Paths
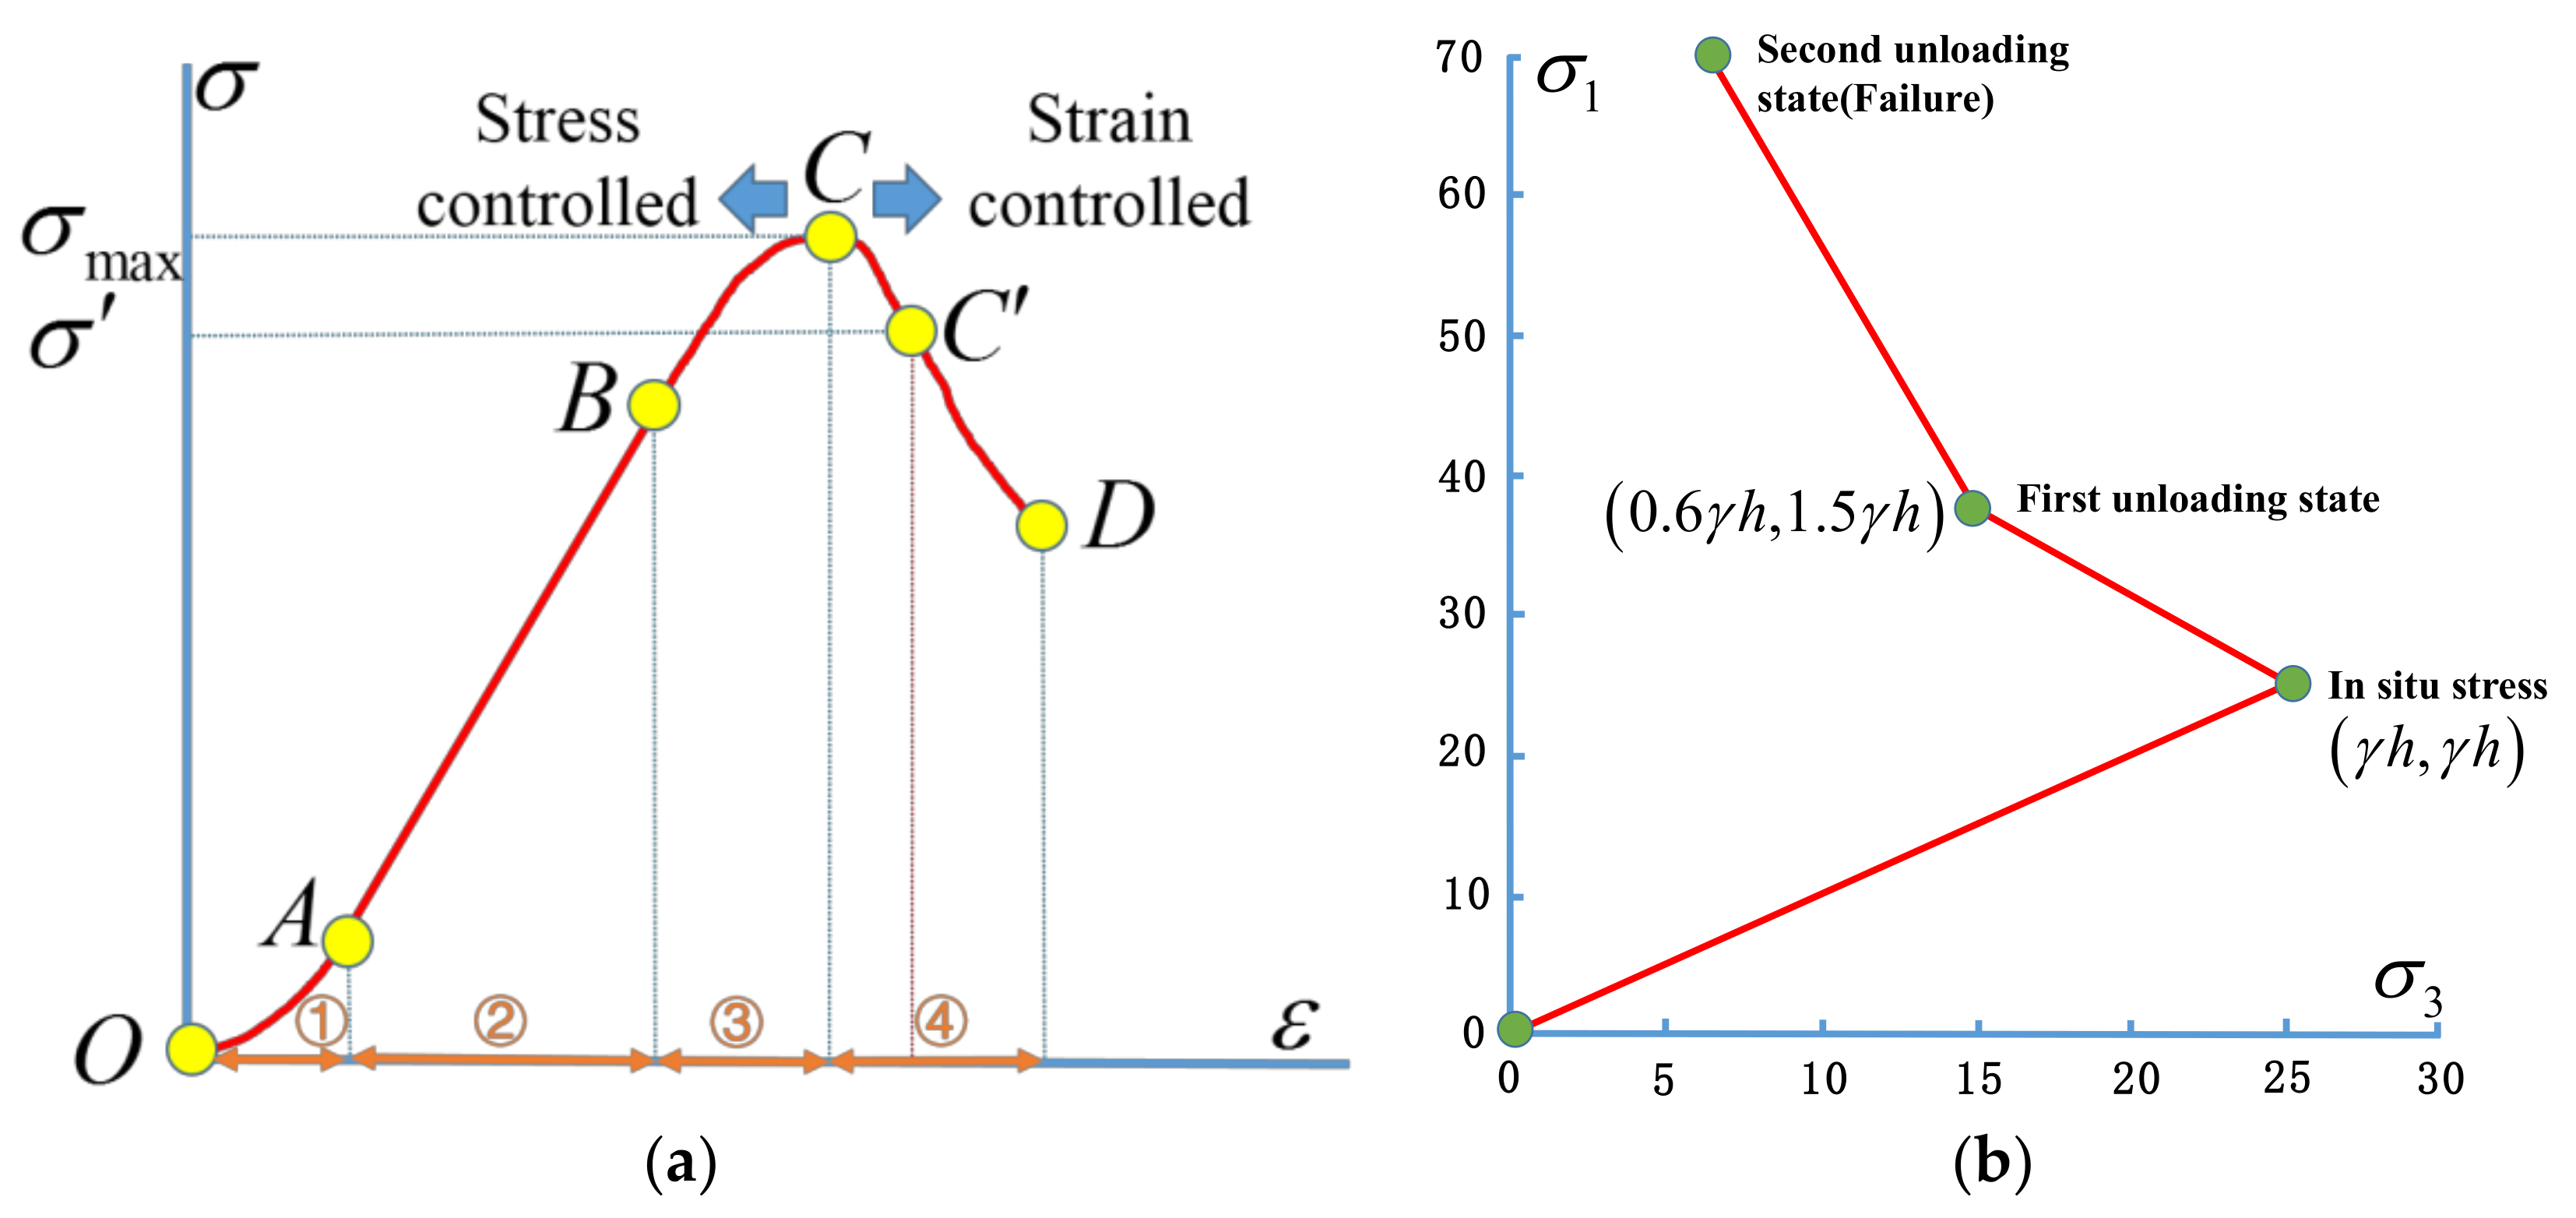
The typical stress-strain curve of intact coal can be easily divided into four stages (Figure 2a): (1) compaction (OA), (2) elastic deformation (AB), (3) plastic deformation (BC), and (4) failure drop (CD). Before the peak stress, the coal shows continuous behavior. After, there is a rapid deformation transition connecting all local damage. Before failure, the fractured coal undergoes a gradually developing process, i.e., from the peak point C to the failure point D. In other words, the fracture connection occurs at the point C’.
The coal samples were processed into cylinders: Ф50 × H100 mm. A MTS815 rock mechanics system with a very high stiffness was adopted due to its excellent control system, which can automatically achieve conversions from stress to strain control. In the complete stress-strain process, stress control is first used to load the intact sample into the vicinity of peak C (), and then strain control is used to unload the stress until it reaches C’ ().
Due to the stress change, different loading and unloading paths will lead to different fractures. Three kinds of designed tests are adopted including the uniaxial compression (UC), conventional triaxial compression (CTC), and mining-induced triaxial compression (MTC). The MDF and PDF are often generated from the UC tests due to radial tensile stress, while the shear stress related fractures (MDF and SCF) can be obtained by the CTC tests. The complex and crossed fractures (SCF and CDF) can be prefabricated by the MTC tests. Three stress paths are described in detail. For UC tests, the axial stress is applied at a rate of 10 kN/min until the peak value is reached. The lateral deformation control is used at the post-peak stage at a rate of 0.02–0.04 mm/min until the axial stress reaches the pre-set stress value (). For CTC test, there are two main stages. First, the confining pressure is loaded at a rate of 3 MPa/min. Then, the axial stress is applied at a rate of 30 kN/min. The post-peak stage has the same method as the UC tests. For MTC test [33], the unloading paths are based on the stress redistribution of surrounding coal in Figure 2b.
3. Experimental Results
3.1. Material Behavior of Intact Coal under Uniaxial Compression
3.1.1. Comparison of Physical and Material Parameters
The results of intact coal in the UC tests are shown in Table 1. The average of physical parameters for Group 1 includes uniaxial compressive strength σc of 5.99 MPa, Poisson’s ratio µ50 of 0.07, µ100 of 0.44 (the subscript 50 of µ50 means the Poisson’s ratio at a compressive strength of 50%, the subscript 100 of µ100 means the Poisson ratio at the peak) and the corresponding elastic moduli E50 and E100 are 1.47 GPa and 1.15 GPa, respectively. For Group 2, the uniaxial compressive strength is 15.82 MPa, Poisson’s ratio µ50 is 0.14, µ100 is 1.08, and the elastic modulus E5 is 2.62 GPa, and E10 is 1.87 GPa.
The average value indicates that the physical parameters of Group 1 are significantly different from those of Group 2. The uniaxial compression strength of Group 2 is 2.64 times greater than that of Group 1, the Poisson’s ratio µ50 of Group 2 coal is twice that of Group 1, while µ100 is 2.45 times bigger, and the elastic modulus E50 of Group 2 is 1.78 times that of Group 1, while E100 is 1.63 times. The density ρ and the longitudinal wave velocity Vp of Group 2 are 1.12 times and 1.96 times more, respectively. For Group 1, µ50/µ100 = 0.16 and E50/E100 = 1.28. For Group 2, µ50/µ100 = 0.13 and E50/E100 = 1.40. For Poisson’s ratio, 0.13 < 1 and 0.16 < 1 indicate a greater deformation at peaks after fracture generation. 0.13 < 0.16 indicates the lateral deformation of the strong coal is smaller than that of the the weakened coal. For elastic modulus, 1.40 >1 and 1.28 > 1 indicate deteriorated stiffness. 1.28 < 1.40 means the decrease of deteriorated stiffness of strong coal is more than that of the weakened coal.
3.1.2. Macro Behavior under Uniaxial Compression
Based on four intact samples, we analyzed the strength and deformation under uniaxial compression, which is strongly dependent on the composition and integrity. The different stages of deformation are clear for the post-peak stage, which shows a class II type with brittle failure [34]. For the four samples, the physical and material properties in average are similar, with density of 1.35 g/cm3 and compressive strength of 6.31 MPa. Figure 3a shows the relationship of . The majority of the four curves overlap before the dilatant volumetric strain, while the axial strain continues to increase after the dilatant point, . A similar relationship of the volumetric strain is also observed. Figure 3b shows the relationship between volumetric strain and longitudinal wave velocity before failure , and the velocity drop . Figure 3c shows the relationship between volumetric strain and shear wave velocity before failure , and the velocity drop . These results suggest that with increasing volumetric strain, the velocities both decrease. However, the drop of the two wave velocities is different. For the longitudinal wave, the larger the volumetric strain the smaller the drop, while for shear wave, the larger the drop. On average, the longitudinal Vp and shear Vs wave velocities decrease by 8% and 14%, respectively.
3.2. Structural Behavior of Fractured Coals under Uniaxial Compression
3.2.1. Differences of Structural Deformation
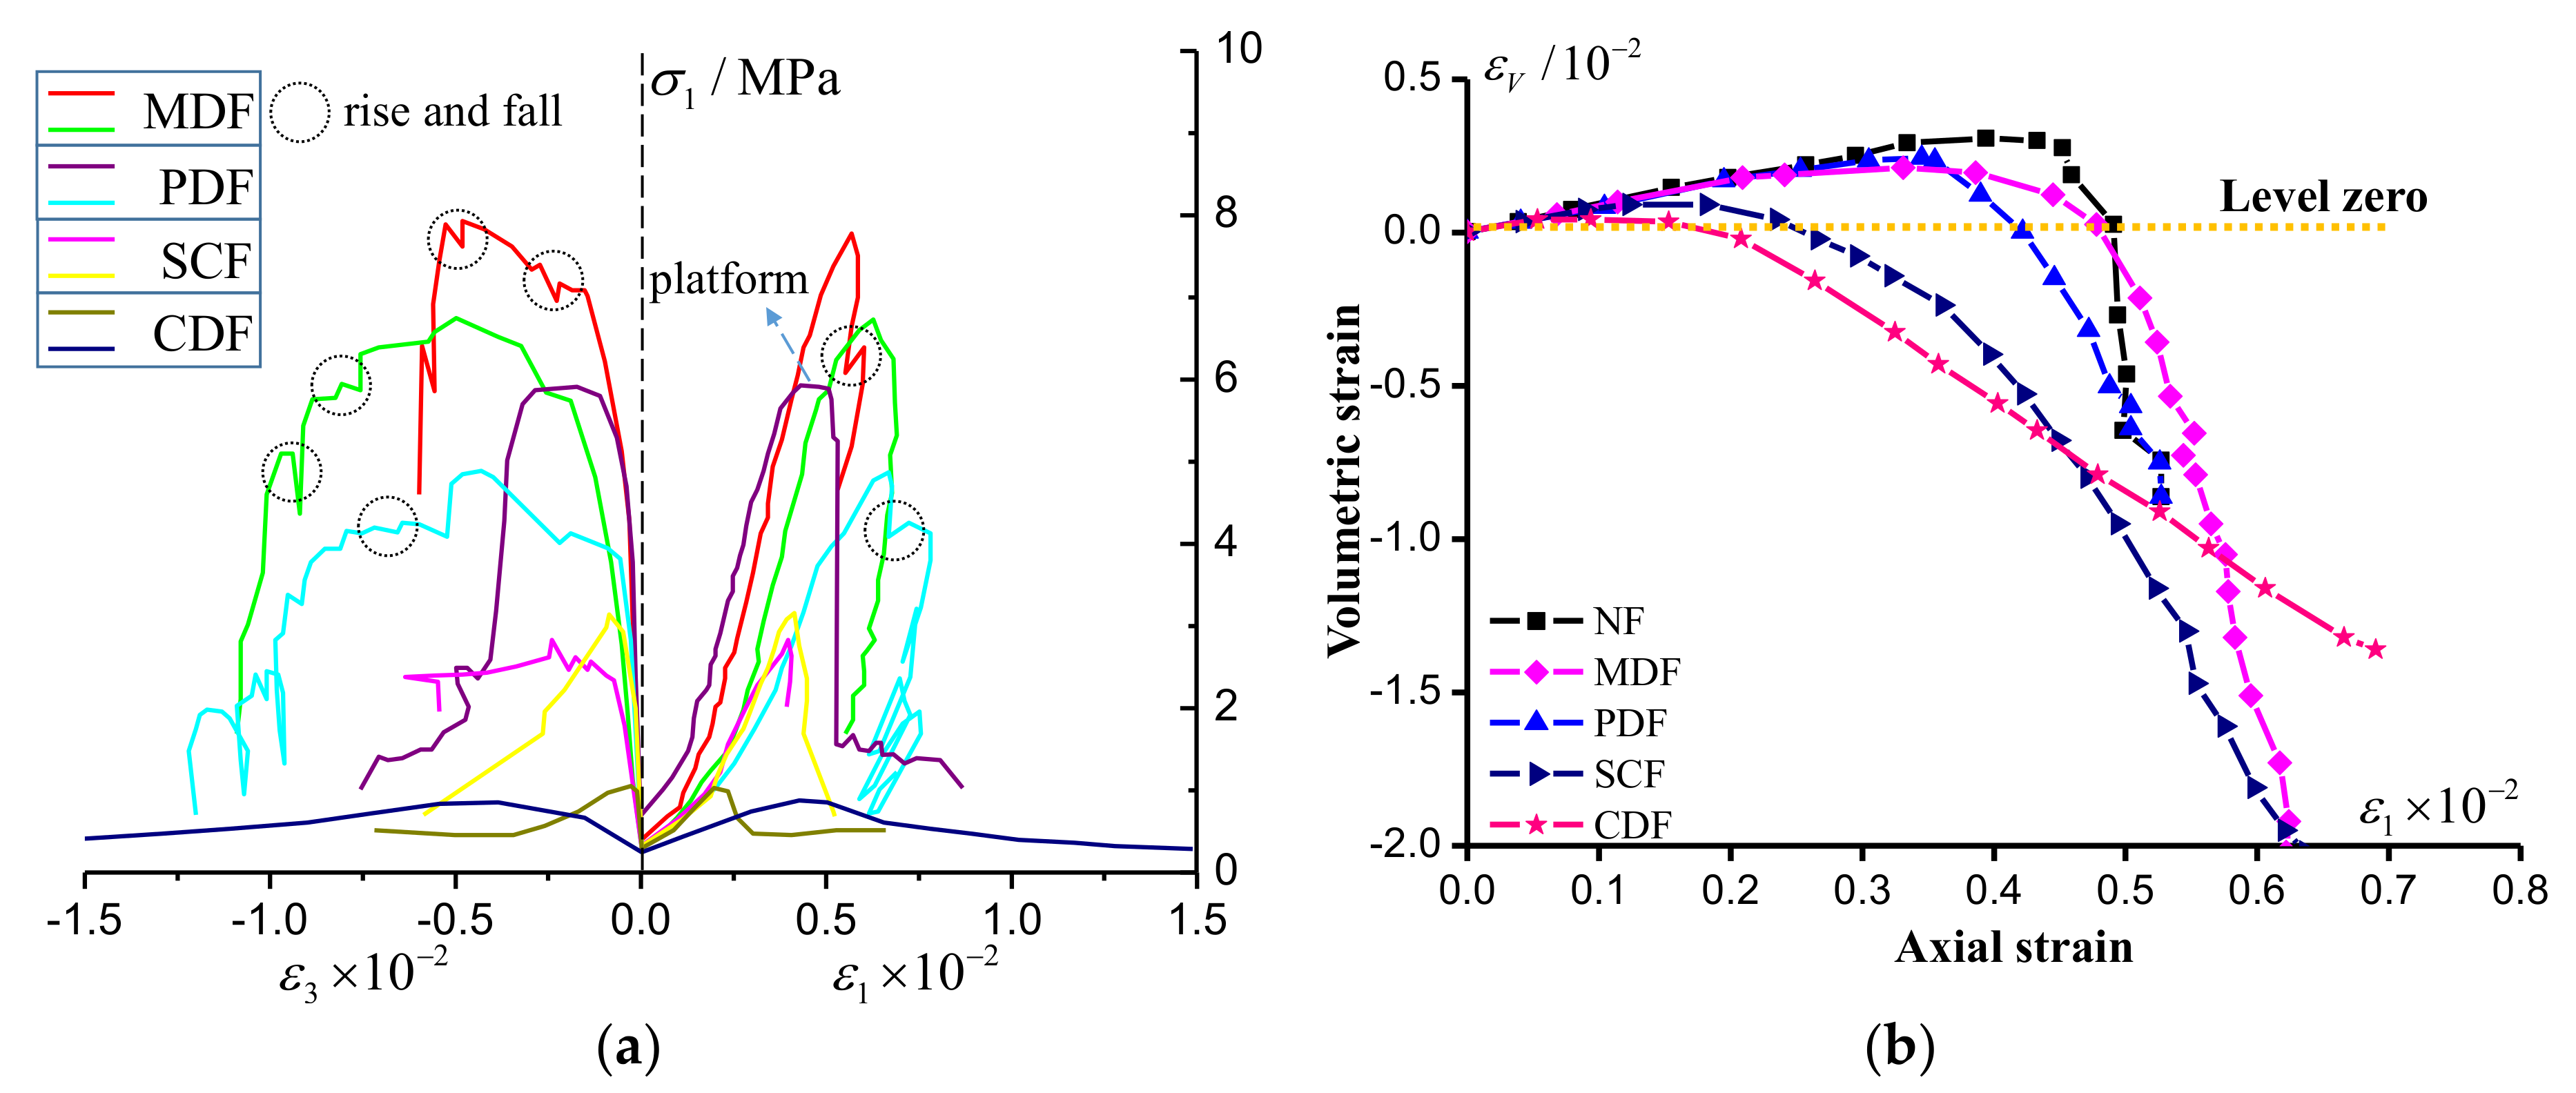
Figure 4a shows the complete stress-strain curve of fractured coal. Two samples for each of the MDF, PDF, SCF, and CDF are selected and the strength decreases significantly. Similar to the intact coal, the stress-strain curve of fractured coal can also be divided into four stages. However, fractured coal has three different properties. First, the loading curve is fluctuating and a dramatic stress drop exists. Second, a peak stress plateau appears. The increasing strain with unchanged stress is mainly due to the structural friction. Third, the post-peak curve is apt to a class I type.
The effect of increasing volume caused by discontinuous sliding can be defined as structural dilatancy. It can describe the dilatant behavior in the post-peak. There are three main characteristics of structural dilatancy (Figure 4b). First, the dilatant rate, i.e., the slope of any point of the axial strain-volumetric strain curves, is positive before the dilatant point. As the complexity of the fractures increase, the dilatant rate decreases and nearly converges to zero at the CDF condition. It indicates that the dilatant point may appear when the axial strain is very small and the volume compression does not necessarily appear before the peak. Second, when εV < 0 the dilatant rate is negative. The more complex distribution of the fractures, the greater the dilatant rate. It leads to more intersections among different curves, while for the intact coal there are almost no intersections among the curves (Figure 3a). Third, when εV < 0, the axial and volumetric strain continues to increase, while the axial strain of the intact coal stops increasing and even decreases.
3.2.2. Distribution of Peak Strength
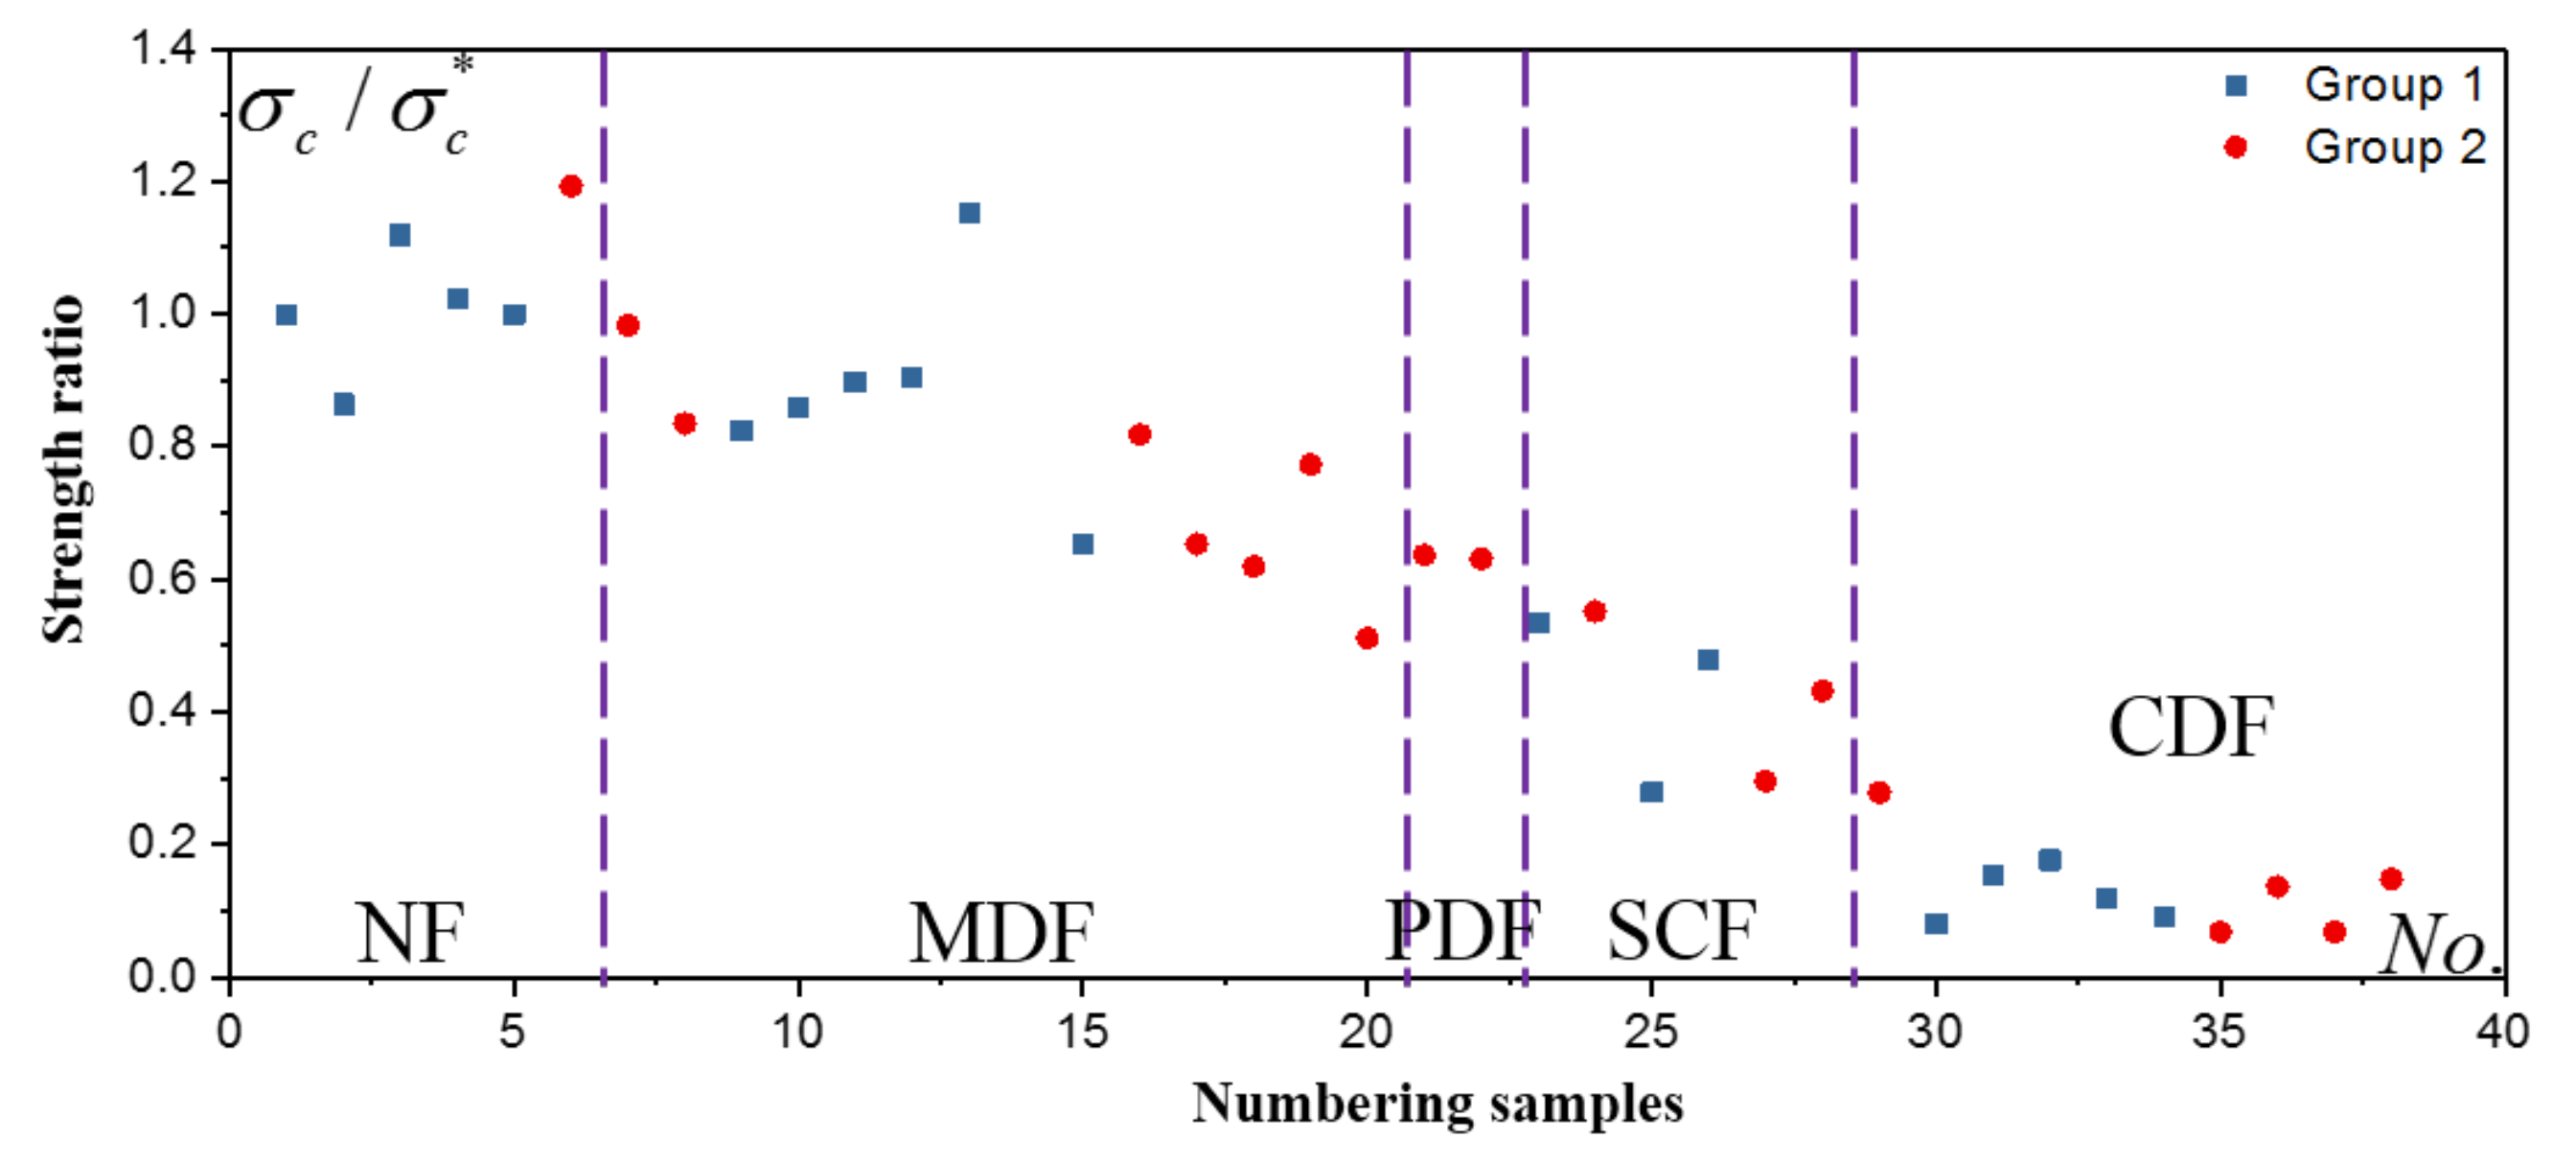
Figure 5 shows the uniaxial compressive strength distribution. represents the strength ratio, where is the uniaxial compressive strength and is the mean value. For intact coal, the average strengths of Groups 1, 2 are 5.99 MPa and 15.82 MPa, respectively. As the fractures evolve from intact to a mixed state, the strength ratio decreases .
The strength is significantly weakened by the connected length of the backbone fracture in Table 2. For MDF coal, the average strengths of Groups 1, 2 are 4.67 MPa and 10.42 MPa, respectively. For the PDF coal, the strengths are 3.18 MPa and 8.72 MPa, respectively. For the SCF coal, the intersected fractures are significant and the strengths of Group 1, 2 are 2.28 MPa and 5.29 MPa, respectively. For the CDF coal, the strength continues to decrease with strength of 0.74 MPa and 1.62 MPa (Table 2) for Group 1 and 2, respectively.
The intact coal mainly behaves with continuous deformation. The fact that the strength of CDF coal is smaller than that of MDF coal indicates that the fracture complexity and distribution gradually dominate the strength. In other words, the structural geometry of fractures plays an important role in strength during the material-structural behavior transition. Compared to intact coal, the strength reduction in fractured coal is significant, and the higher the strength the greater the decrease.
The damage can describe the continuous process before the peak [35]. The damage, Dc, can be defined by strength degradation [36] as follows:
Figure 6 shows the relationship between strength and damage. The strength decreases linearly with increasing damage and the drop of strong coal (Group 2) is significantly larger than that of weakened coal (Group 1).
3.2.3. Distribution of Elastic Parameters
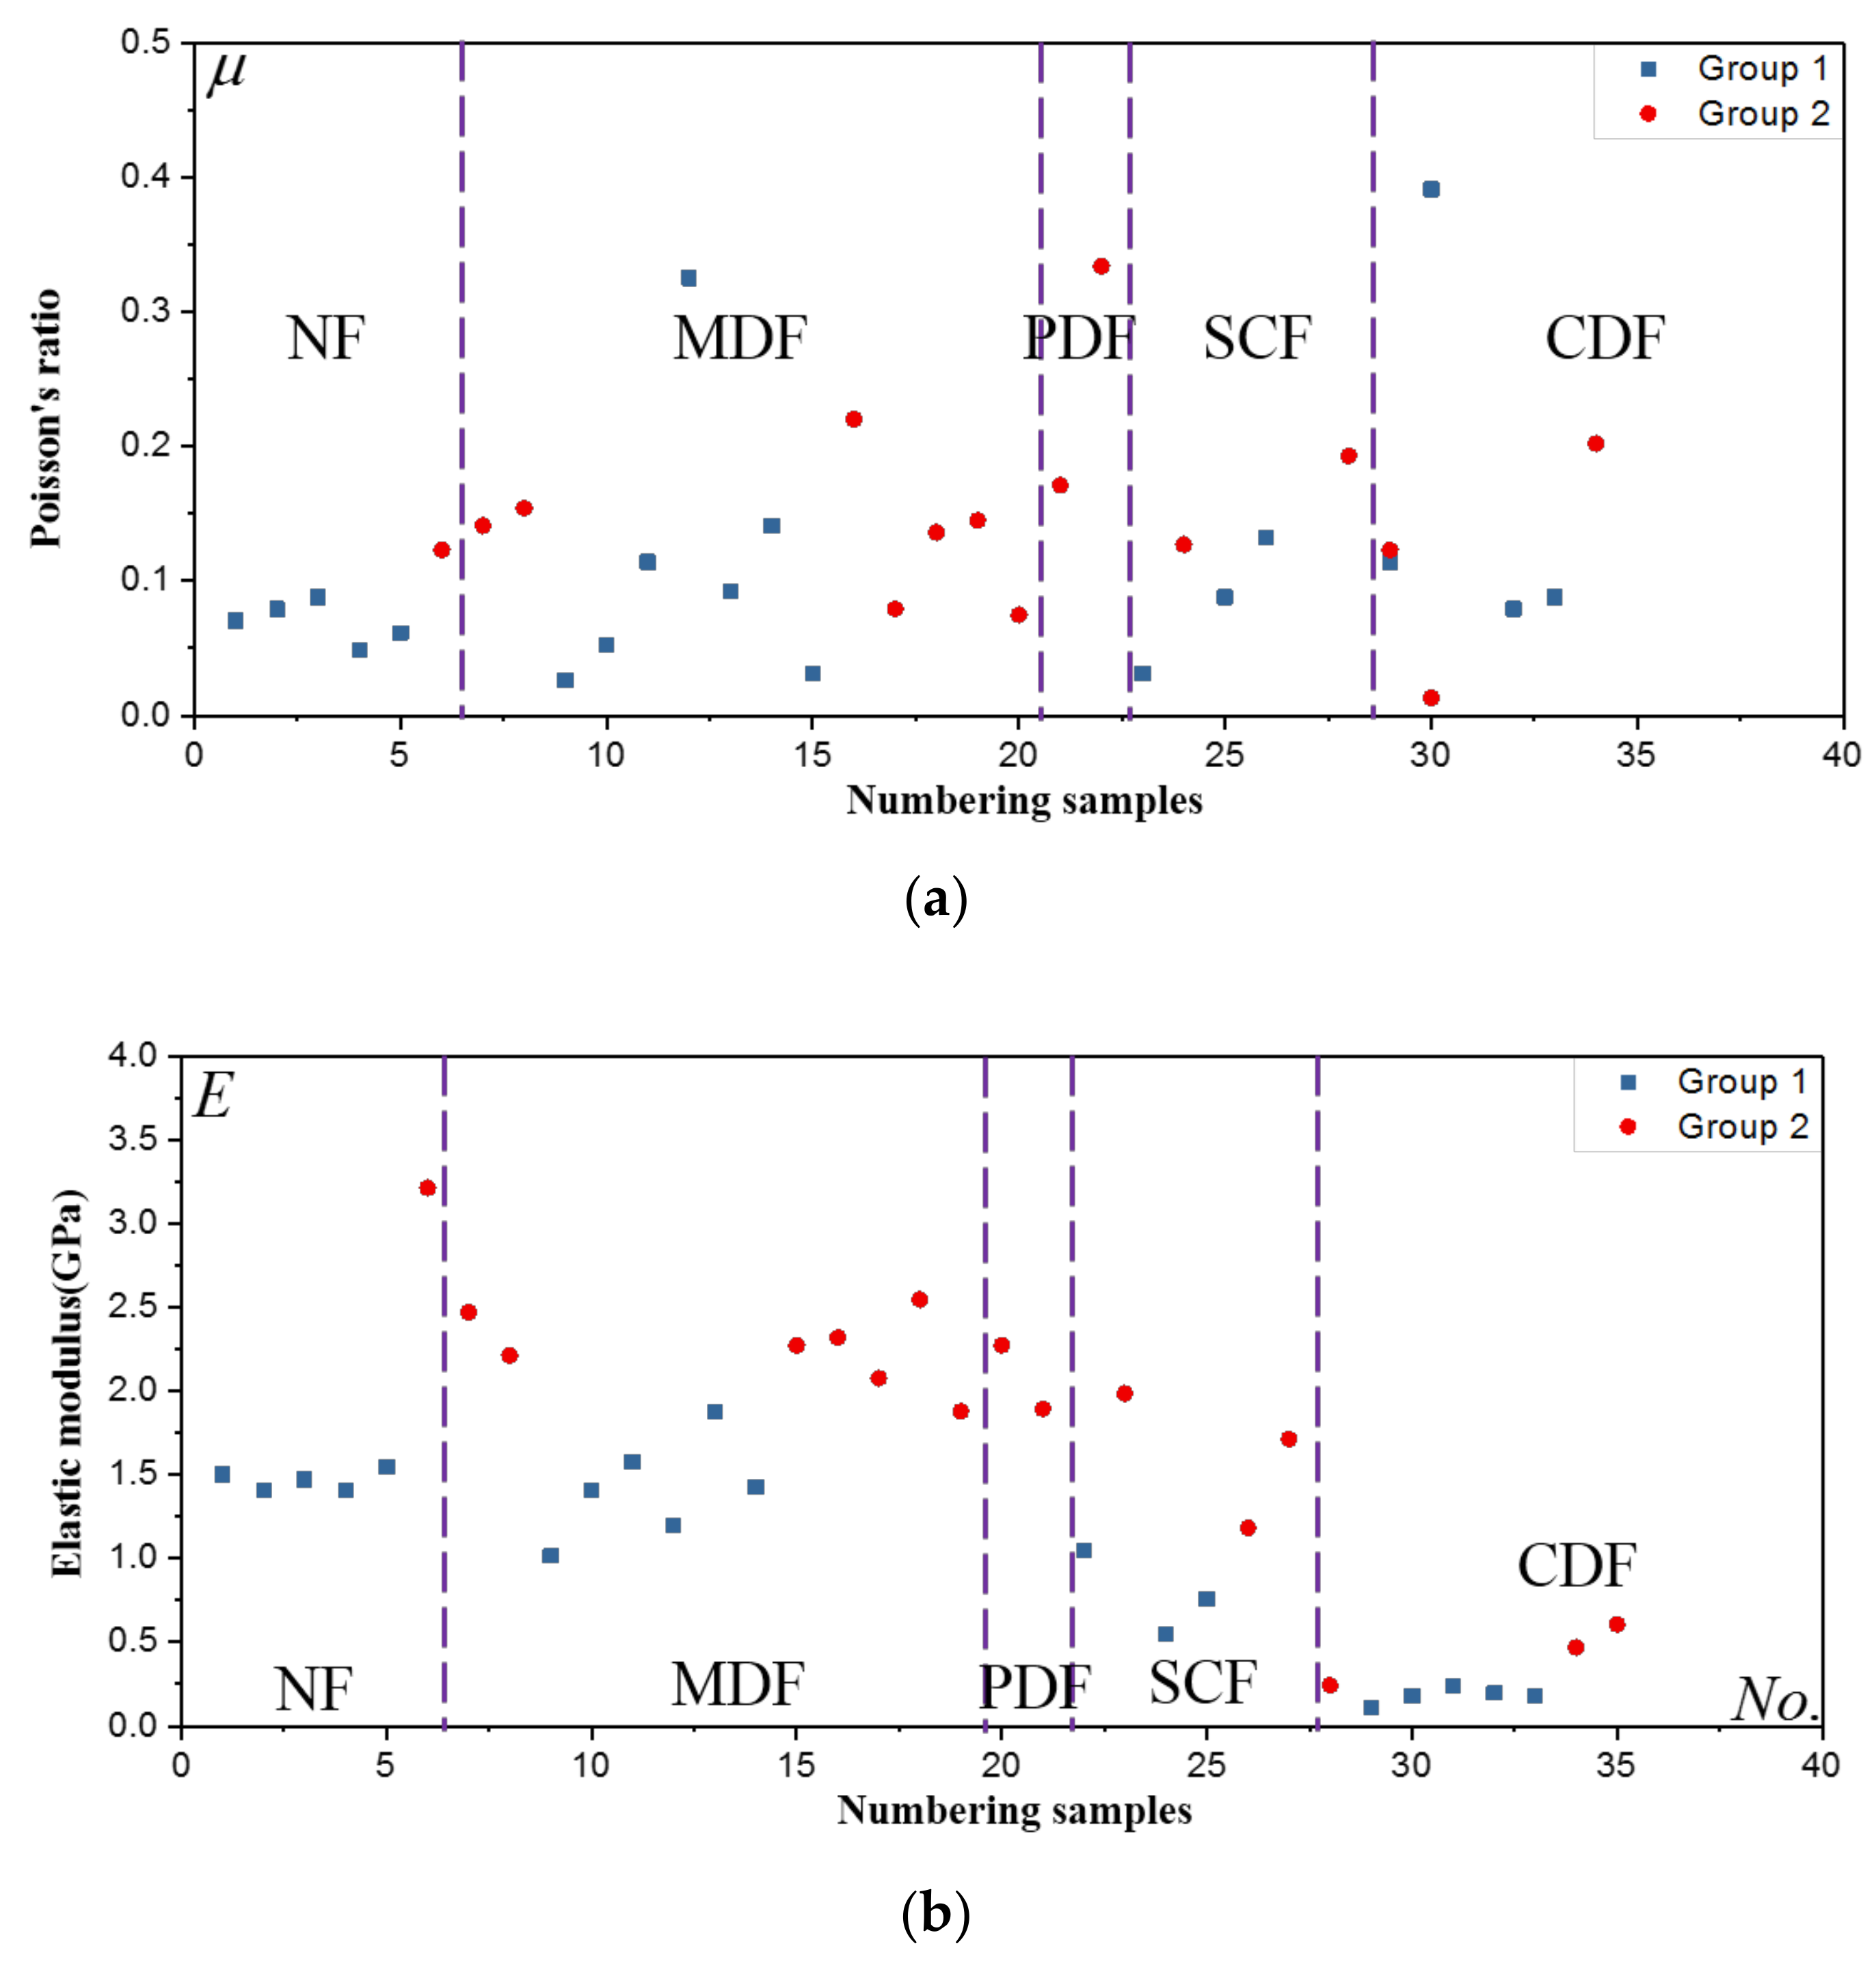
Figure 7a shows the distribution of Poisson’s ratio µ50. In the same group (1 or 2), the distribution is concentrated, while in the different groups (1 and 2) there is a notable difference. With increasing complexity, the discrete degree increases and the deformation becomes more dependent on the structural geometry deformation. The discrepancy of transverse deformation is determined by the complexity. The conventional definition of Poisson’s ratio is based on a continuous concept, which is not effective for describing the structural behavior [37,38].
Figure 7b shows the distribution of elastic modulus. It is similar in the same group and varies between different groups. The higher the modulus, the higher the strength. The elastic modulus decreases with increasing complexity. The impact of the fracture on the modulus is growing, which results in a smaller decrease for MDF coal than CDF coal (Table 3). The elastic modulus is often used to determine the damage DE [39] as follows.
The elastic modulus is analyzed by the average modulus [40]:
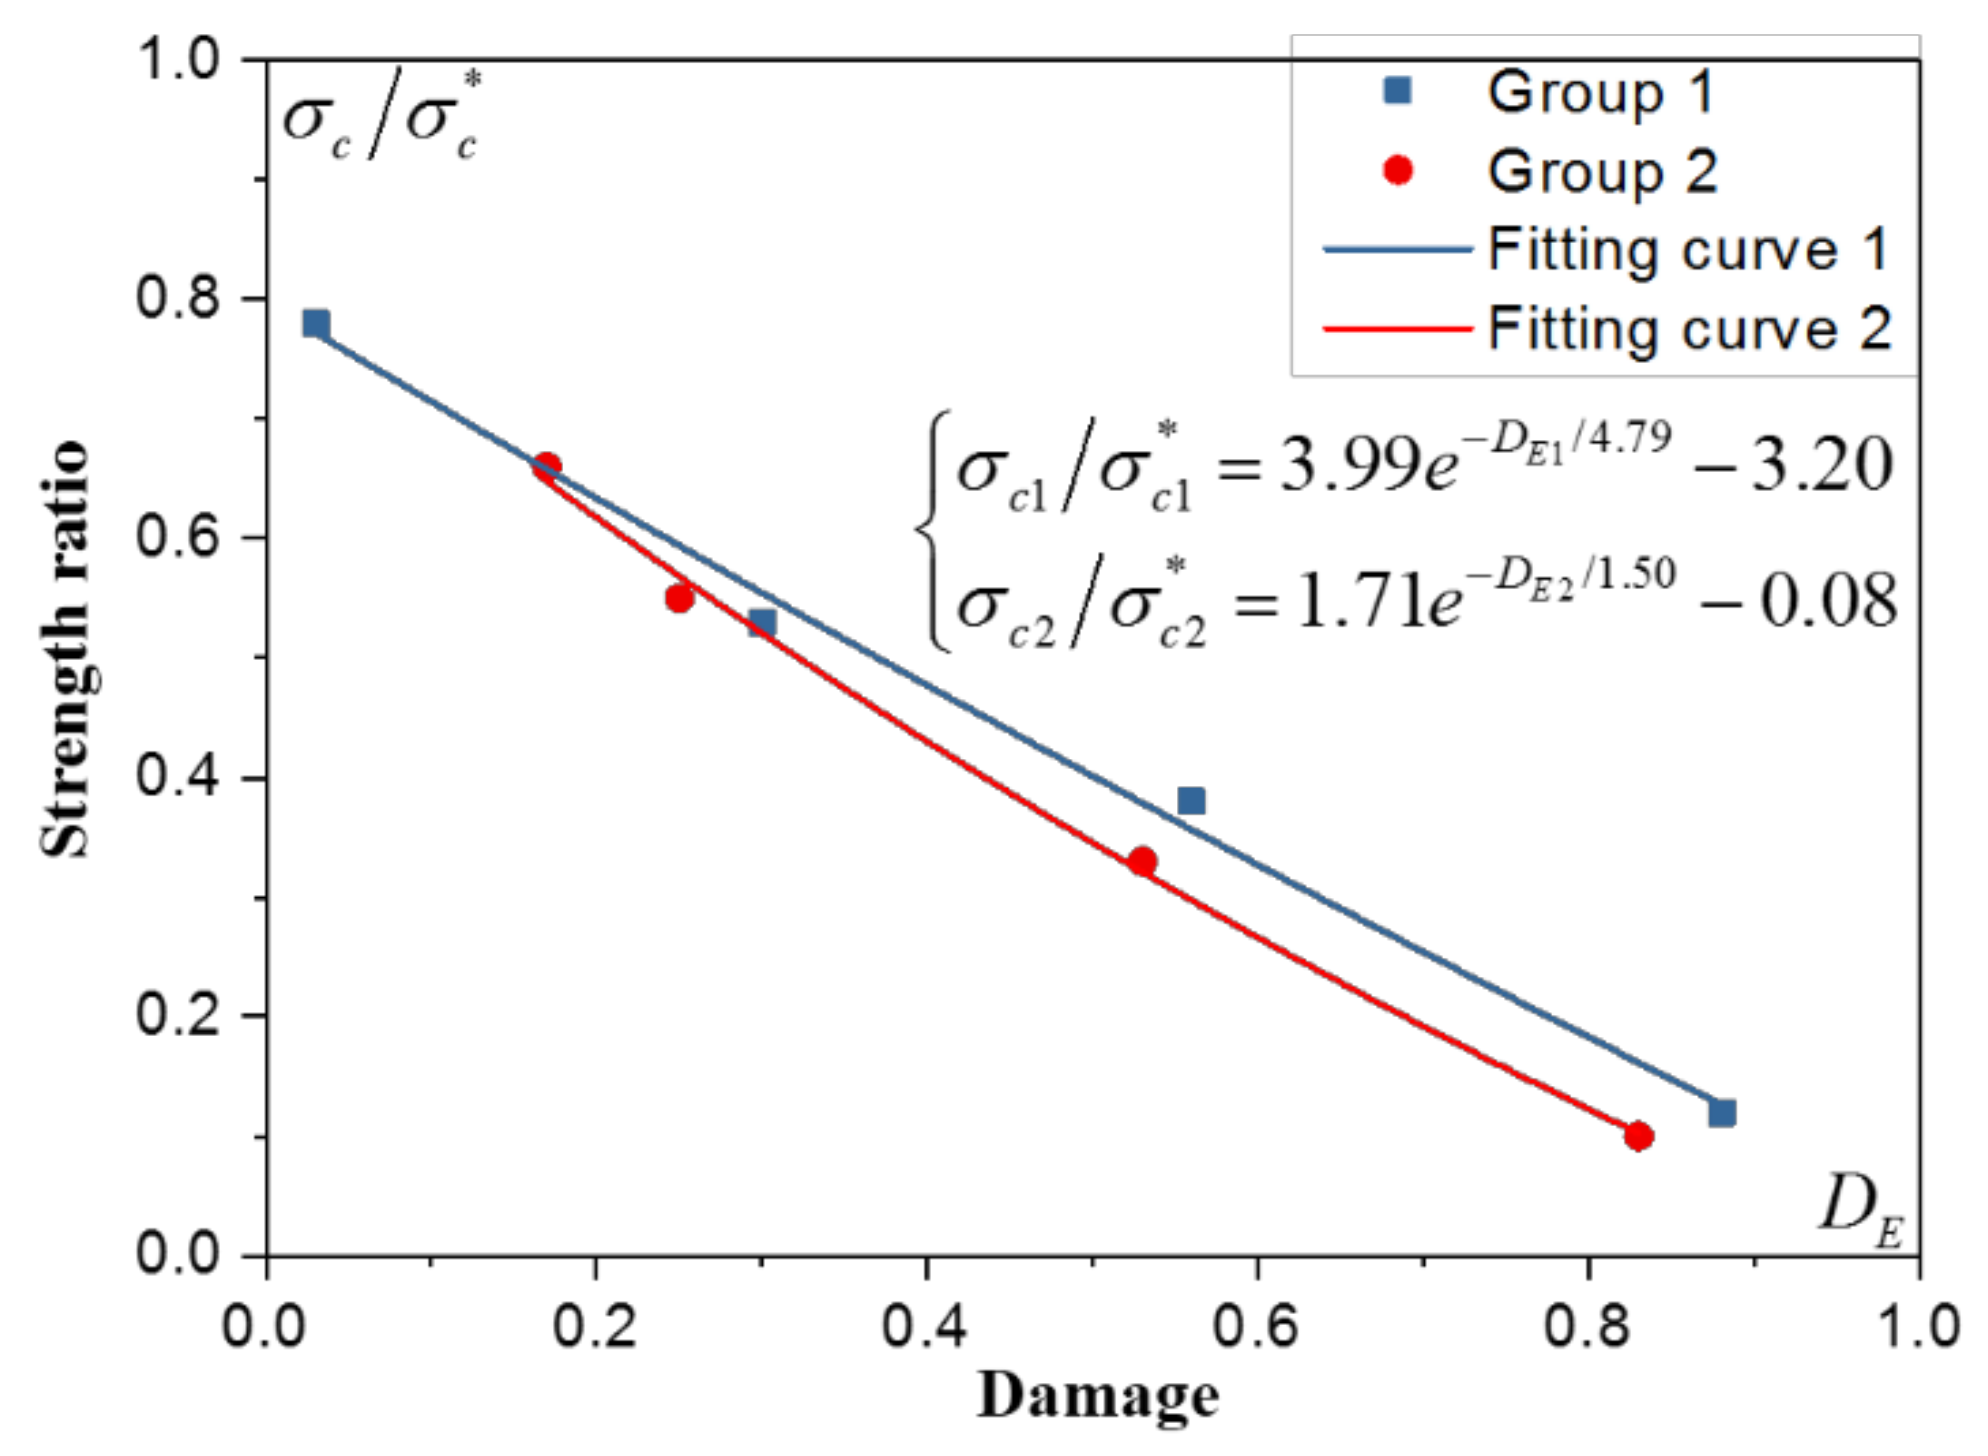
Figure 8 shows the relationship between strength ratio and damage. As the damage increases, the strength ratio decreases exponentially as follows:
The strength ratio of the weakened coal is greater than that of the strong coal. However, the ratio drop of strong coal is more significant than that of the weakened coal. The higher the strength ratio, the more the stress drop.
3.3. Relationship between Strength and Physical Parameters of Fractured Coal
3.3.1. Bulk Density Distribution
The bulk density can indirectly reflect changes of the internal structure. The relationship between the density and strength is shown in Figure 9. The density drop is defined as , where ρ* and ρ represent the density of the intact and fractured coal, respectively.
The density drops of MDF, PDF, SCF, and CDF are 0.21%, 0.365%, 0.623% and 1.884%, and the corresponding strength ratios are 28%, 46%, 64%, and 89%, respectively. The greater the density drop, the more complex and the smaller the strength ratio, suggesting better homogeneity of the fractured coal. The fracture converts from ordered to disordered, but the overall performance of the coal converts from disordered to ordered. This can be explained by the differences in volume dilatation. For example, the fractures in the CDF coal are the most complicated, which corresponds to the highest increase in volume. The density reductions of weak and strong coal are different even if their fracture patterns are the same, e.g., the density decrease of Group 1 is larger than that of Group 2 (Table 4).
3.3.2. Longitudinal Wave Velocity
The longitudinal wave velocity is often used for rock integrity evaluation. The longitudinal wave velocity ratio and the strength ratio distribution are shown in Figure 10. and represent the velocity of fractured and intact coal. For the same fracture patterns, the velocity of Group 2 is greater than that of Group 1. When the velocities of MDF, PDF, SCF, and CDF are reduced by 14%, 20%, 23%, and 42% in Table 4, the corresponding compressive strength decreases by 28%, 46%, 64%, and 89%. The greater the velocity decrease, the greater the strength decrease.
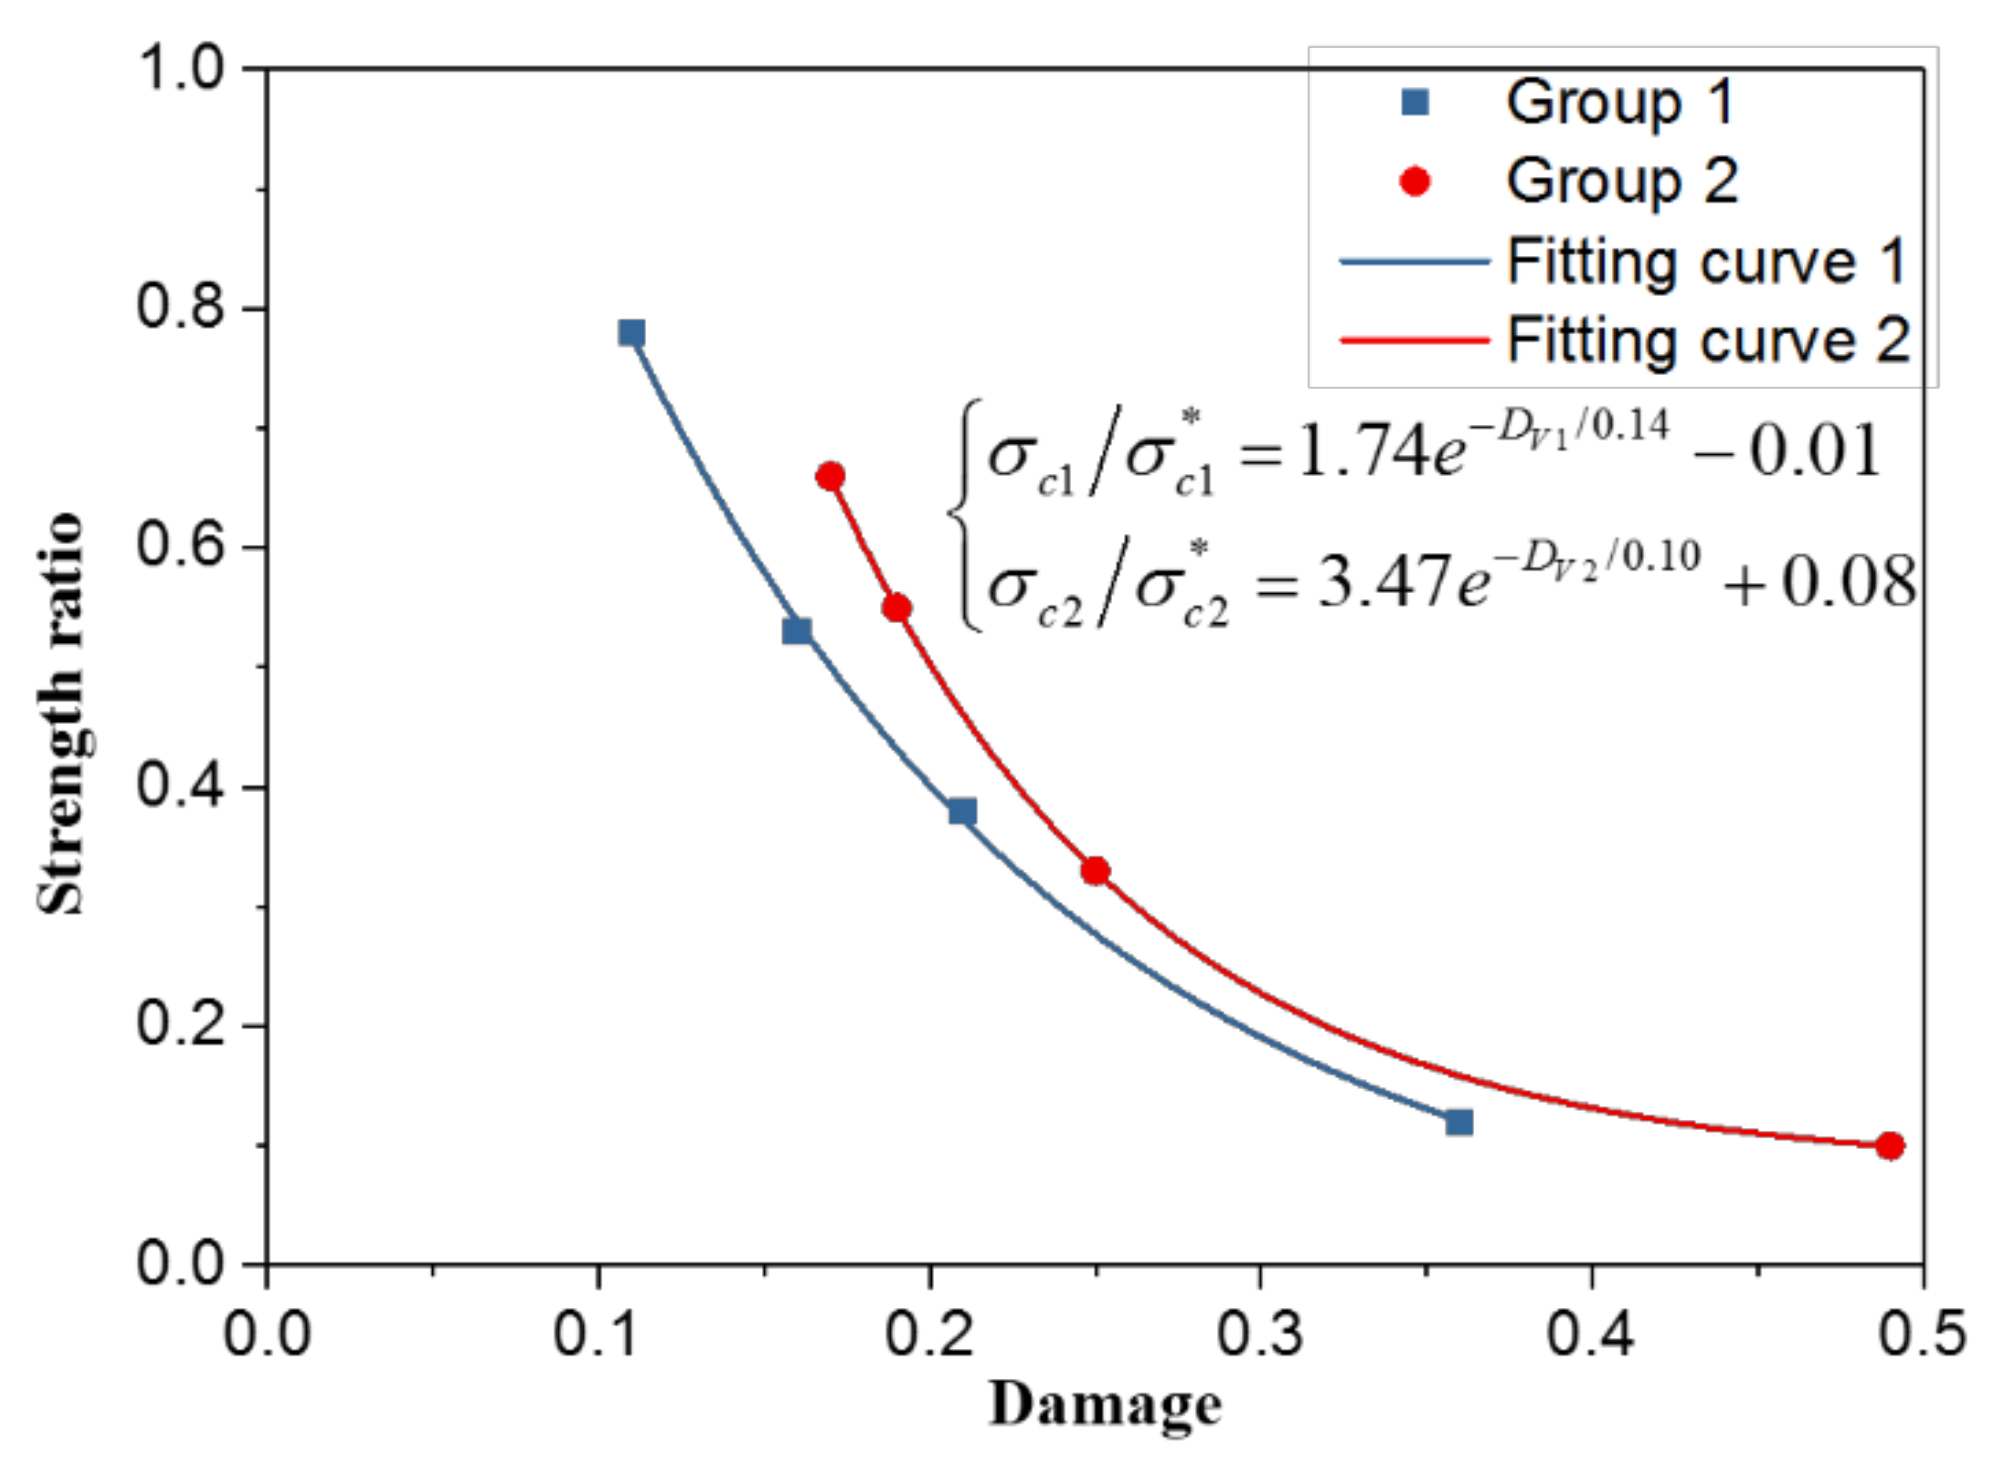
Figure 11 shows the relationship between strength ratio and damage. With an increase in damage, the strength ratio shows an exponential decrease as follows:
The strength ratio of the weak coal is slightly larger than that of the strong coal, but the decreasing strength ratio of the strong coal is significantly greater than that of the weak coal. The higher the strength ratio, the greater the decrease in integrity:
3.3.3. Density Drop and Velocity Drop
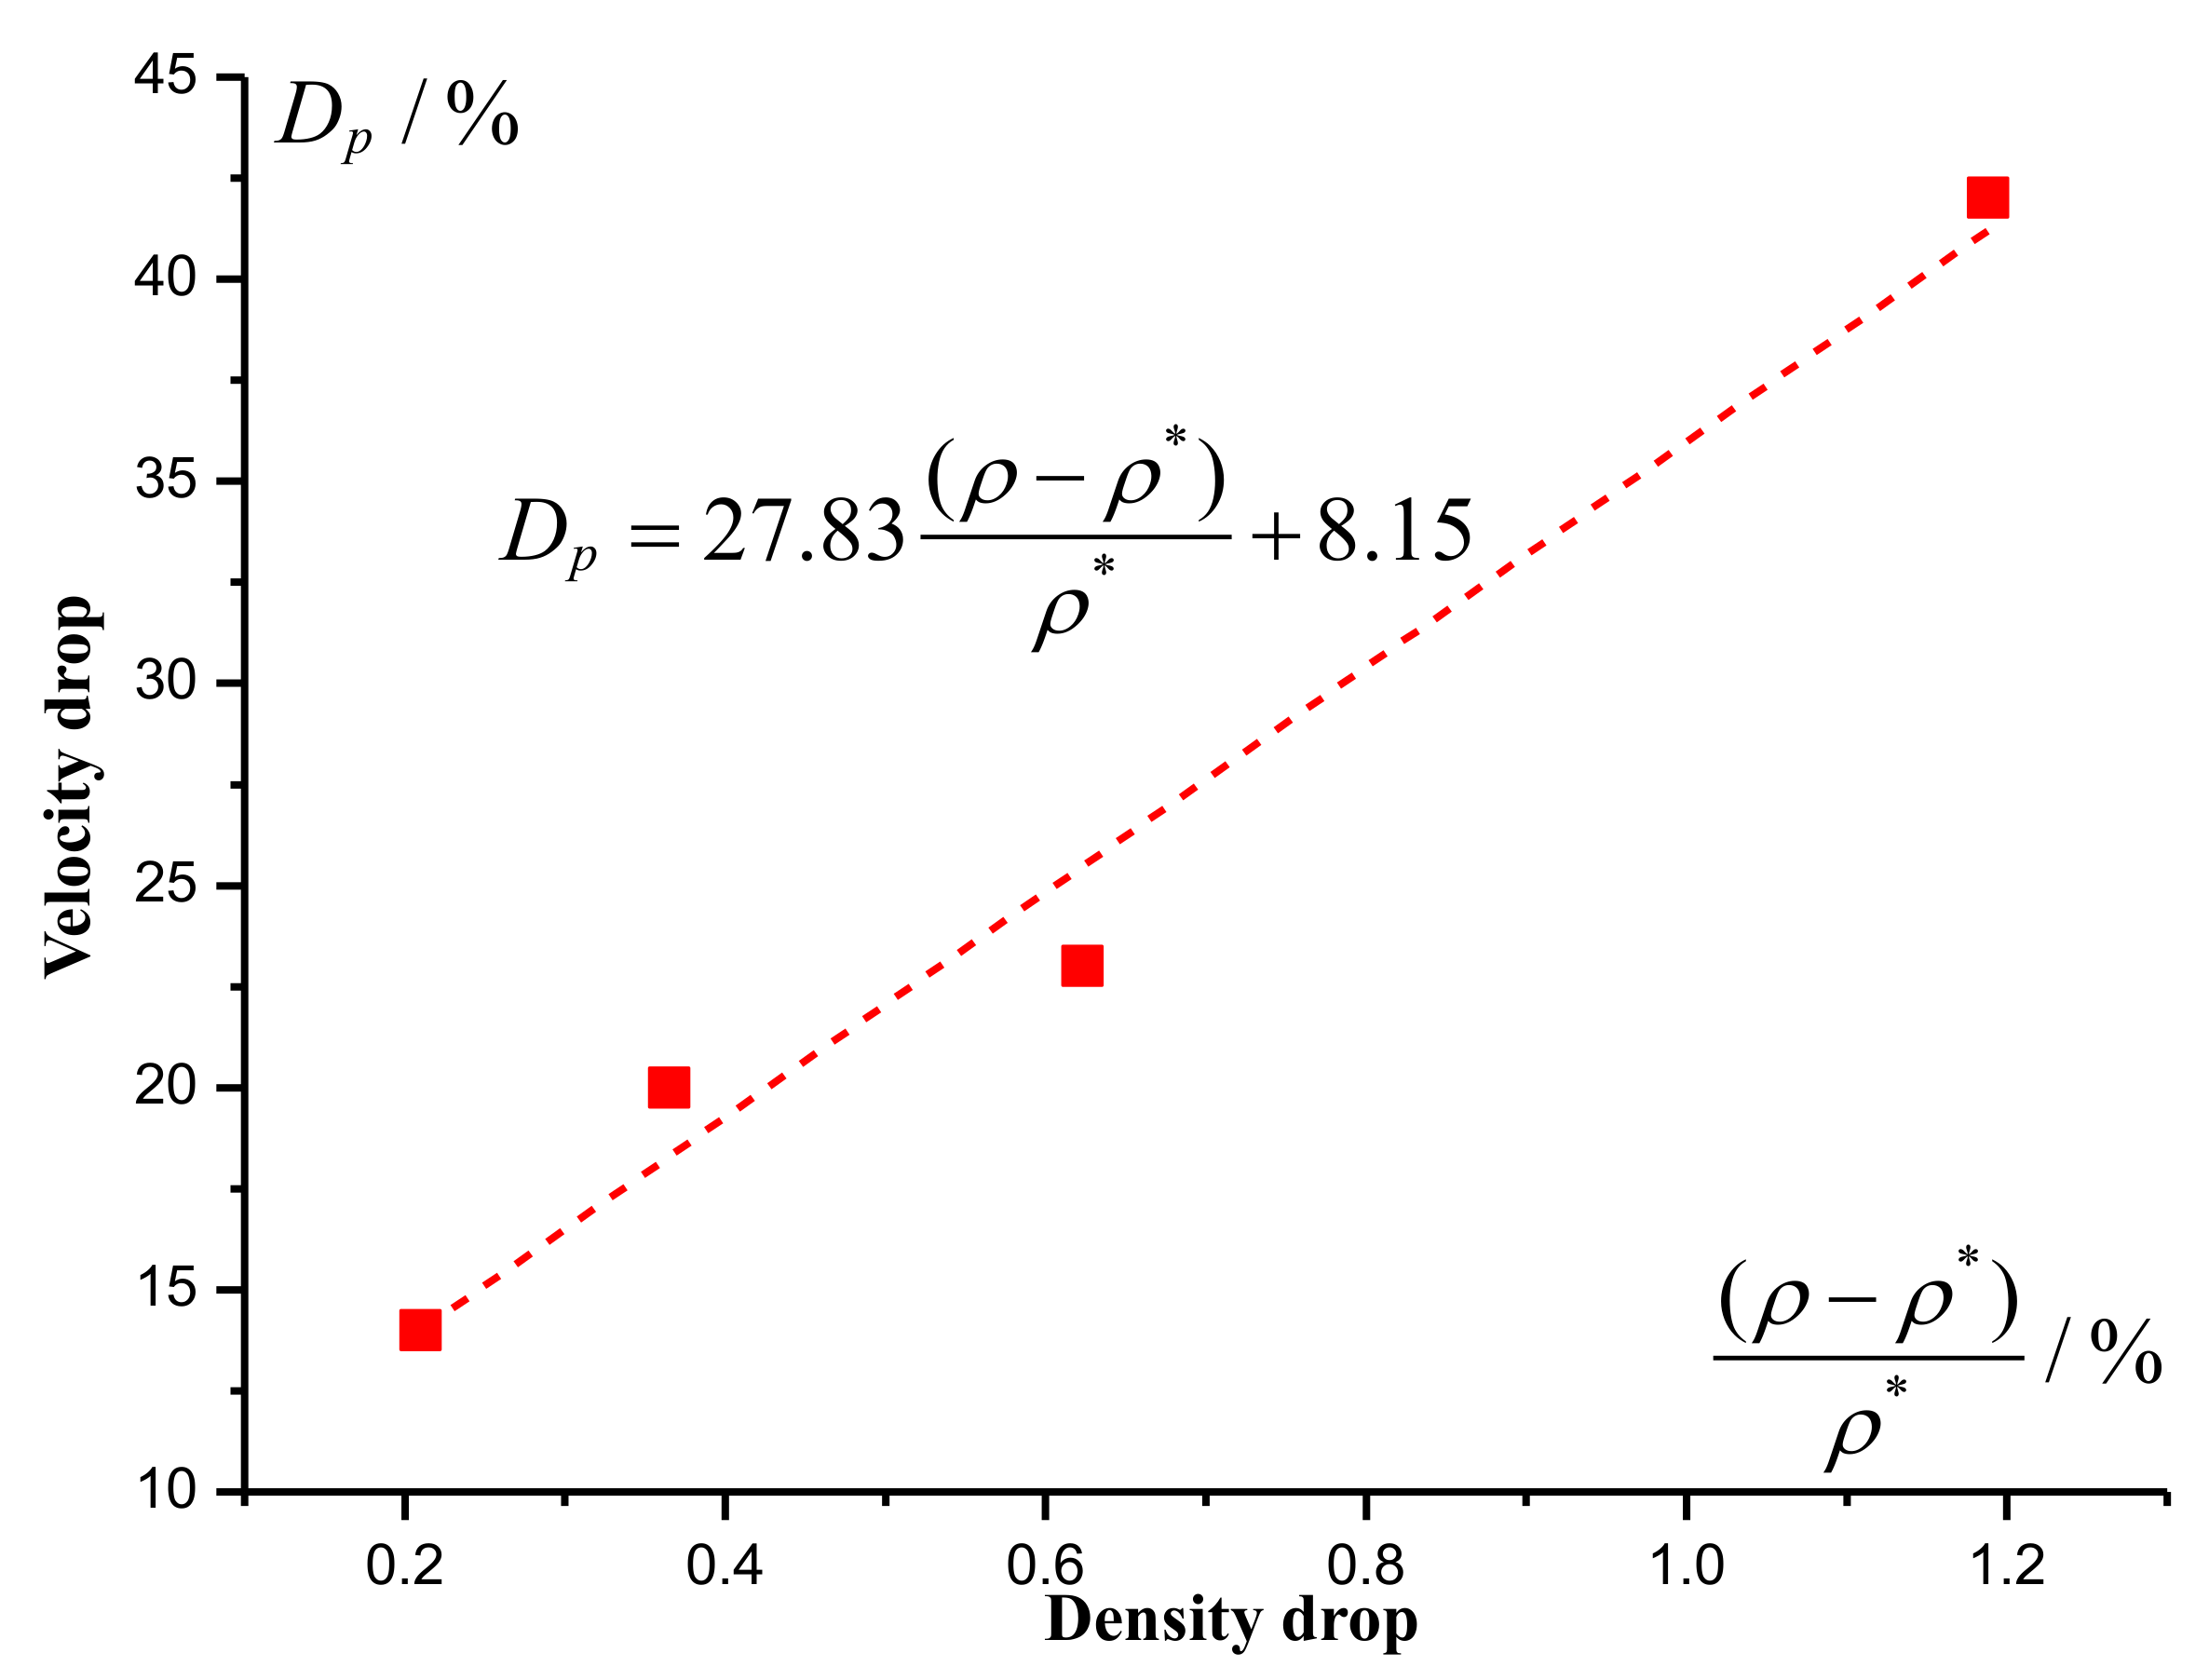
The density drops of MDF, PDF, SCF, and CDF coal are 0.21%, 0.365%, 0.623%, and 1.884%, and the corresponding longitudinal wave damages are 0.14, 0.20, 0.23, and 0.42, respectively. This indicates a linear relationship between velocity drop and density drop (Figure 12).
4. Discussion on Structural Failure Mechanism
4.1. Structural Failure Characteristics
Under uniaxial compression, the intact coal tends to show splitting tension and shear failure. The tension failure and the slippage failure on the fracture surface occurred simultaneously in the MDF and SCF coal, which indicates the transition from material to structural failure. The CDF coal is mainly accompanied by structural failure, rarely with material failure. From NF to CDF coal, the failure mode converts from material failure to structural failure of geometrical fractures. The more complex the fracture distribution, the stronger the structural failure dominance (Table 5).
Fractured coal shows different block sizes, shapes, arrangements of structural planes, i.e., rough surfaces, which dominate the deformation and failure. The fractured coal can be regarded as a structural mass including the block and the fractured surface. The intact part can be analyzed by the continuous medium theory. However, for the fractured part it is difficult to reasonably explain the contact behavior without considering the structural effect.
As a structural mass, fractured coal not only depends on the material behavior from the continuous part, but also contains structural behavior from the discontinuous part. The macro deformation U includes material deformation Um and structural deformation. The material deformation includes elastic deformation, plastic deformation, and viscous deformation, and the structural deformation includes structural plane deformation, open deformation, dislocation deformation, slipping deformation, etc. All deformation is as follows:
Indeed, for brittle structural glass material as well as fractured coal, the observed structural failure mechanism is related to the test data [42]. “Structural” failures are mostly associated to materials in use for civil engineering buildings and applications. In this regard, it would be very helpful and useful to understand the structural effect of discontinuities for the coal mining from artificial material to natural rock.
4.2. Structural Modulus Degradation
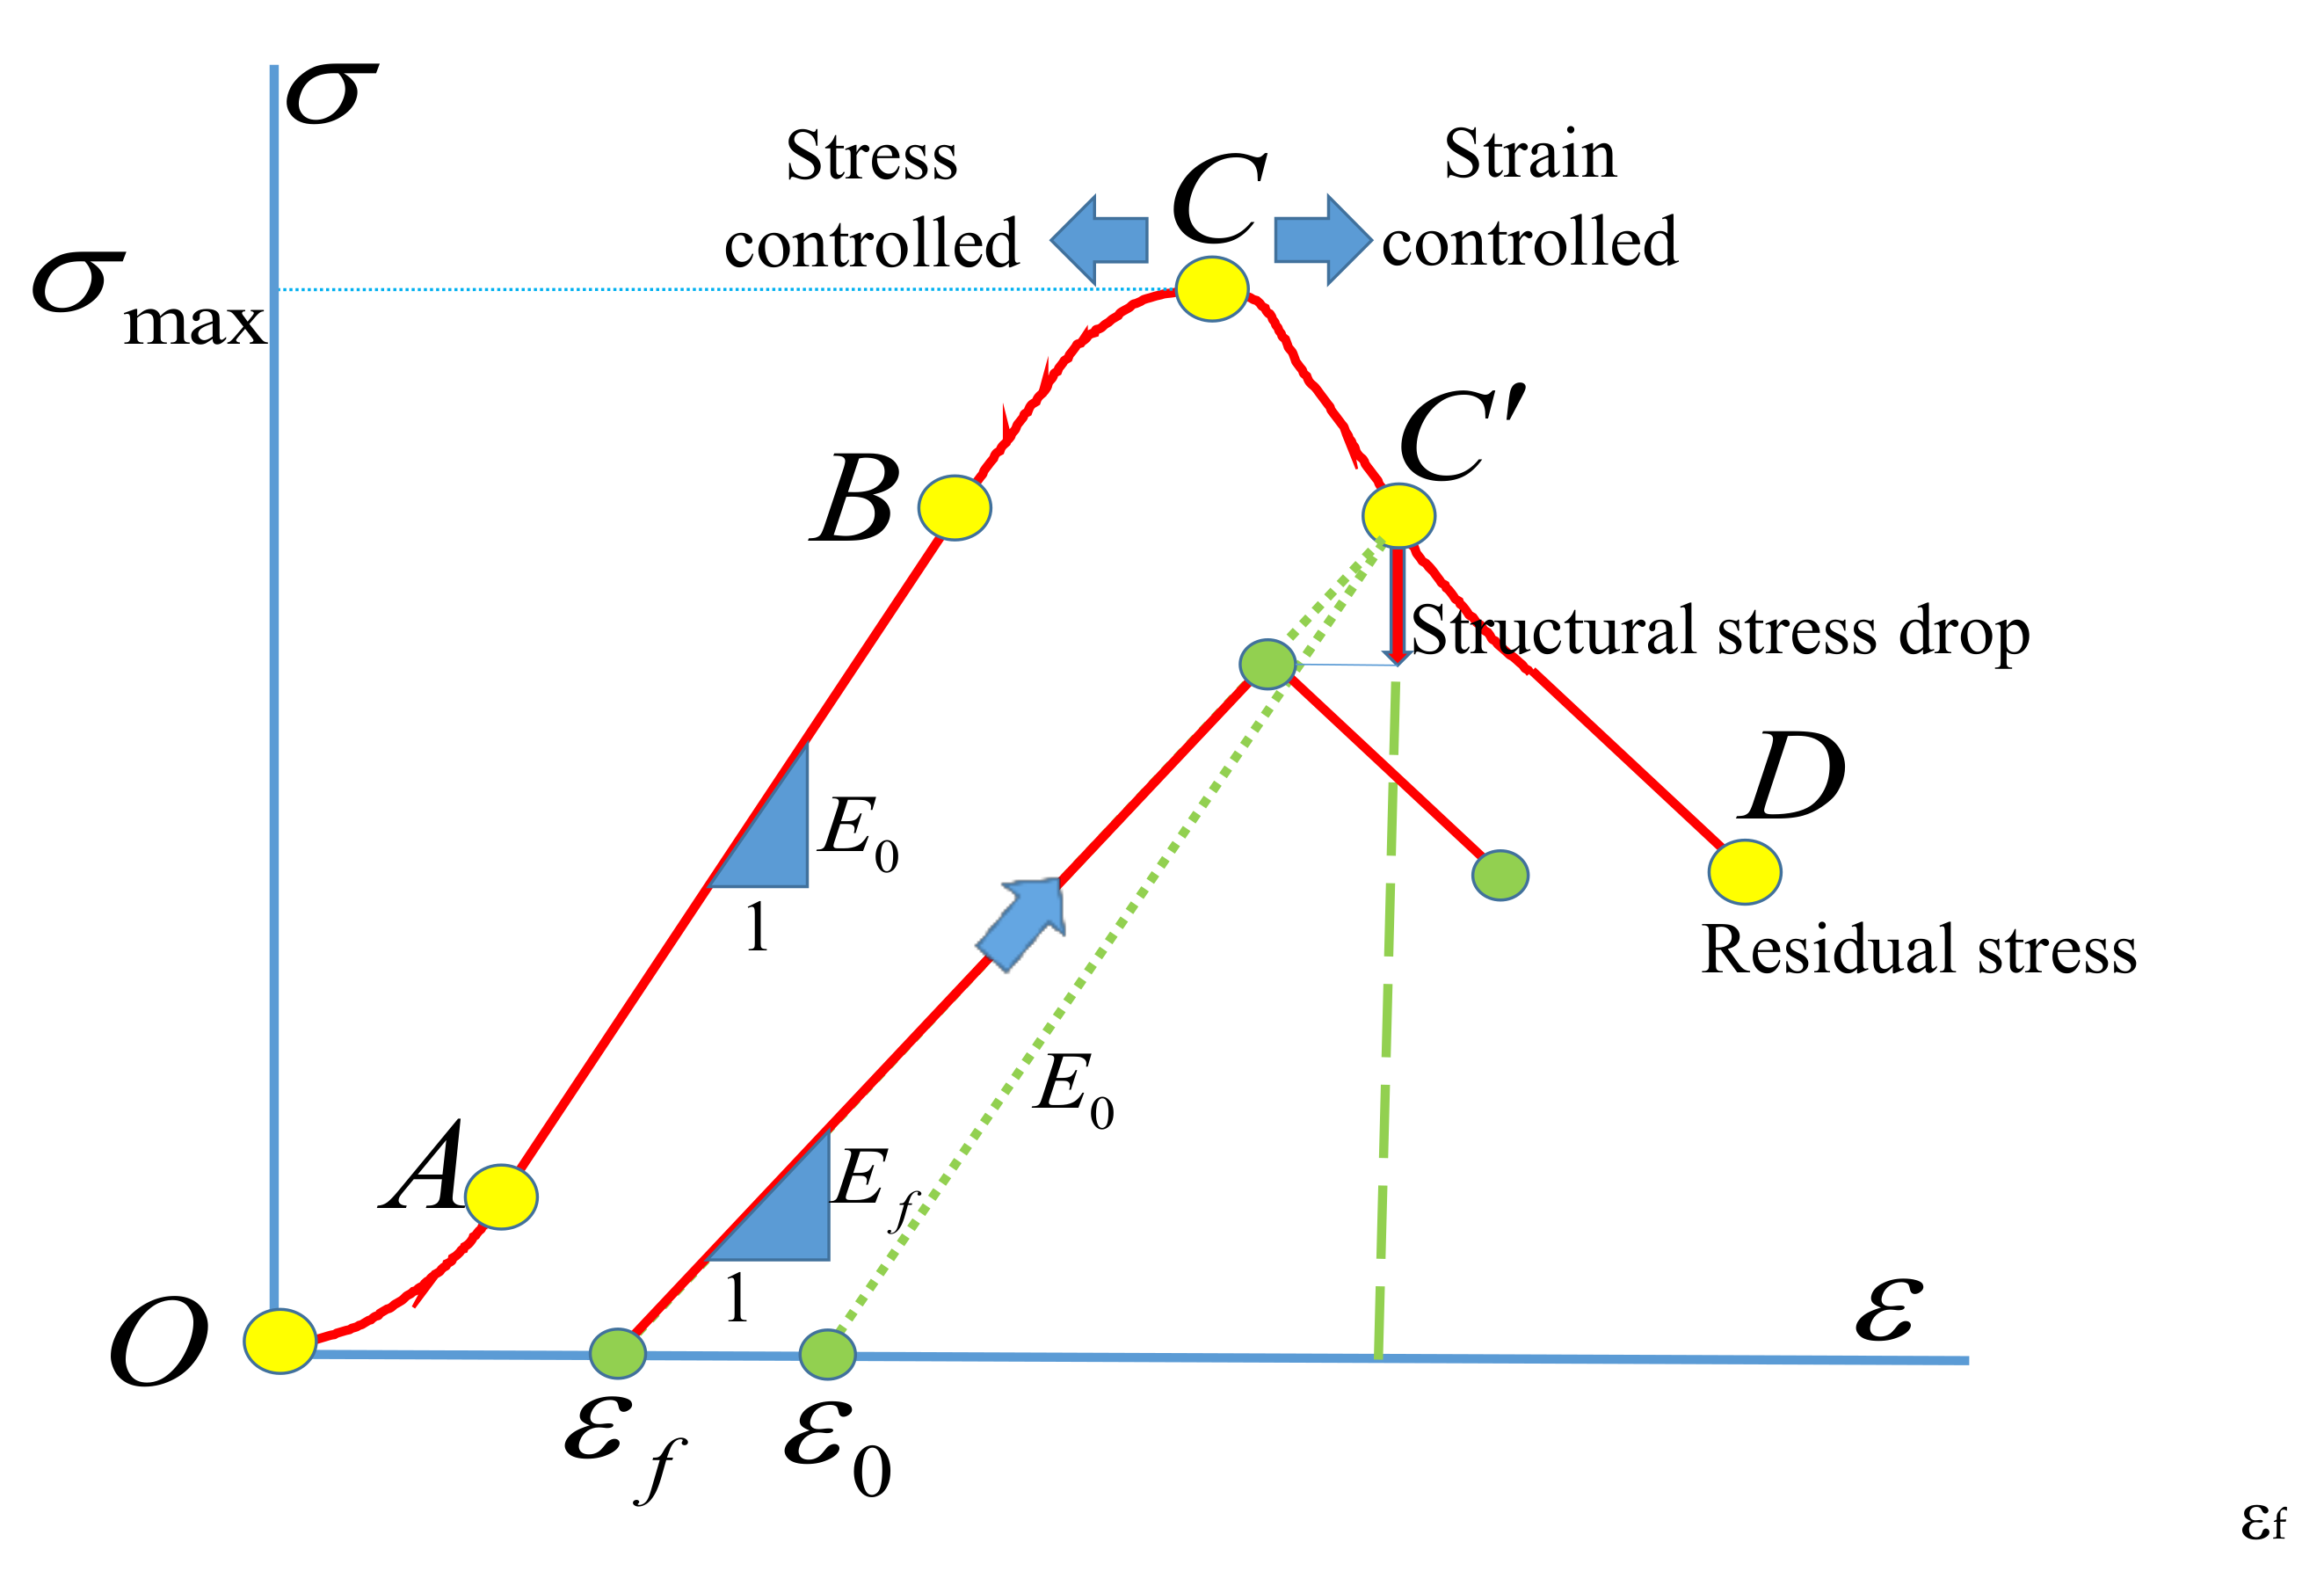
Based on the stress-strain curve, the elastic strain completely rebounds if unloading in the elastic zone. The plastic strain cannot rebound if unloading in the plastic zone. Post-peak unloading is not equal to plastic unloading, which should include structural unloading. The post-peak unloading can be defined as a comprehensive unloading with structural unloading and material unloading.
As shown in Figure 13, if unloading through the elastic modulus E0, the material unloading will be dominant, and the corresponding plastic strain is ε0, but, the unloading curve usually follows Ef. When Ef < E0, the plastic strain decreases to εf, and the increasing strain εs = ε0 −εf is defined as the structural resilience strain. Therefore, the post-peak unloading includes the elastic strain recovery corresponding to material unloading and the resilience strain recovery corresponding to structural unloading. If the energy dissipation of the hysteresis ring is not considered, the loading recovery of fractured coal still goes along with Ef. However, it cannot return to the original strength. It is due to the strength loss caused by structural resilience and the lost stress can be defined as the structural stress drop Δσs.
The modulus Ef reflects the coupling effect of the block cracking and the fracture sliding, which can directly reflect the degradation of the structural effect and is defined as the structural modulus. Ignoring the cracking effect, the structural damage Ds equals to damage based on the degradation of elastic modulus and the normalized fitting curve of the fractured coal strength can be obtained (Figure 14).
4.3. Mechanisms of the Structural Deformation
Fractured coal shows differences in deformation and strength with intact coal [15], which is dependent of the geometry of the fracture structure. The structural deformation includes the continuous deformation of the coal block and the discontinuous deformation of the fracture sliding.
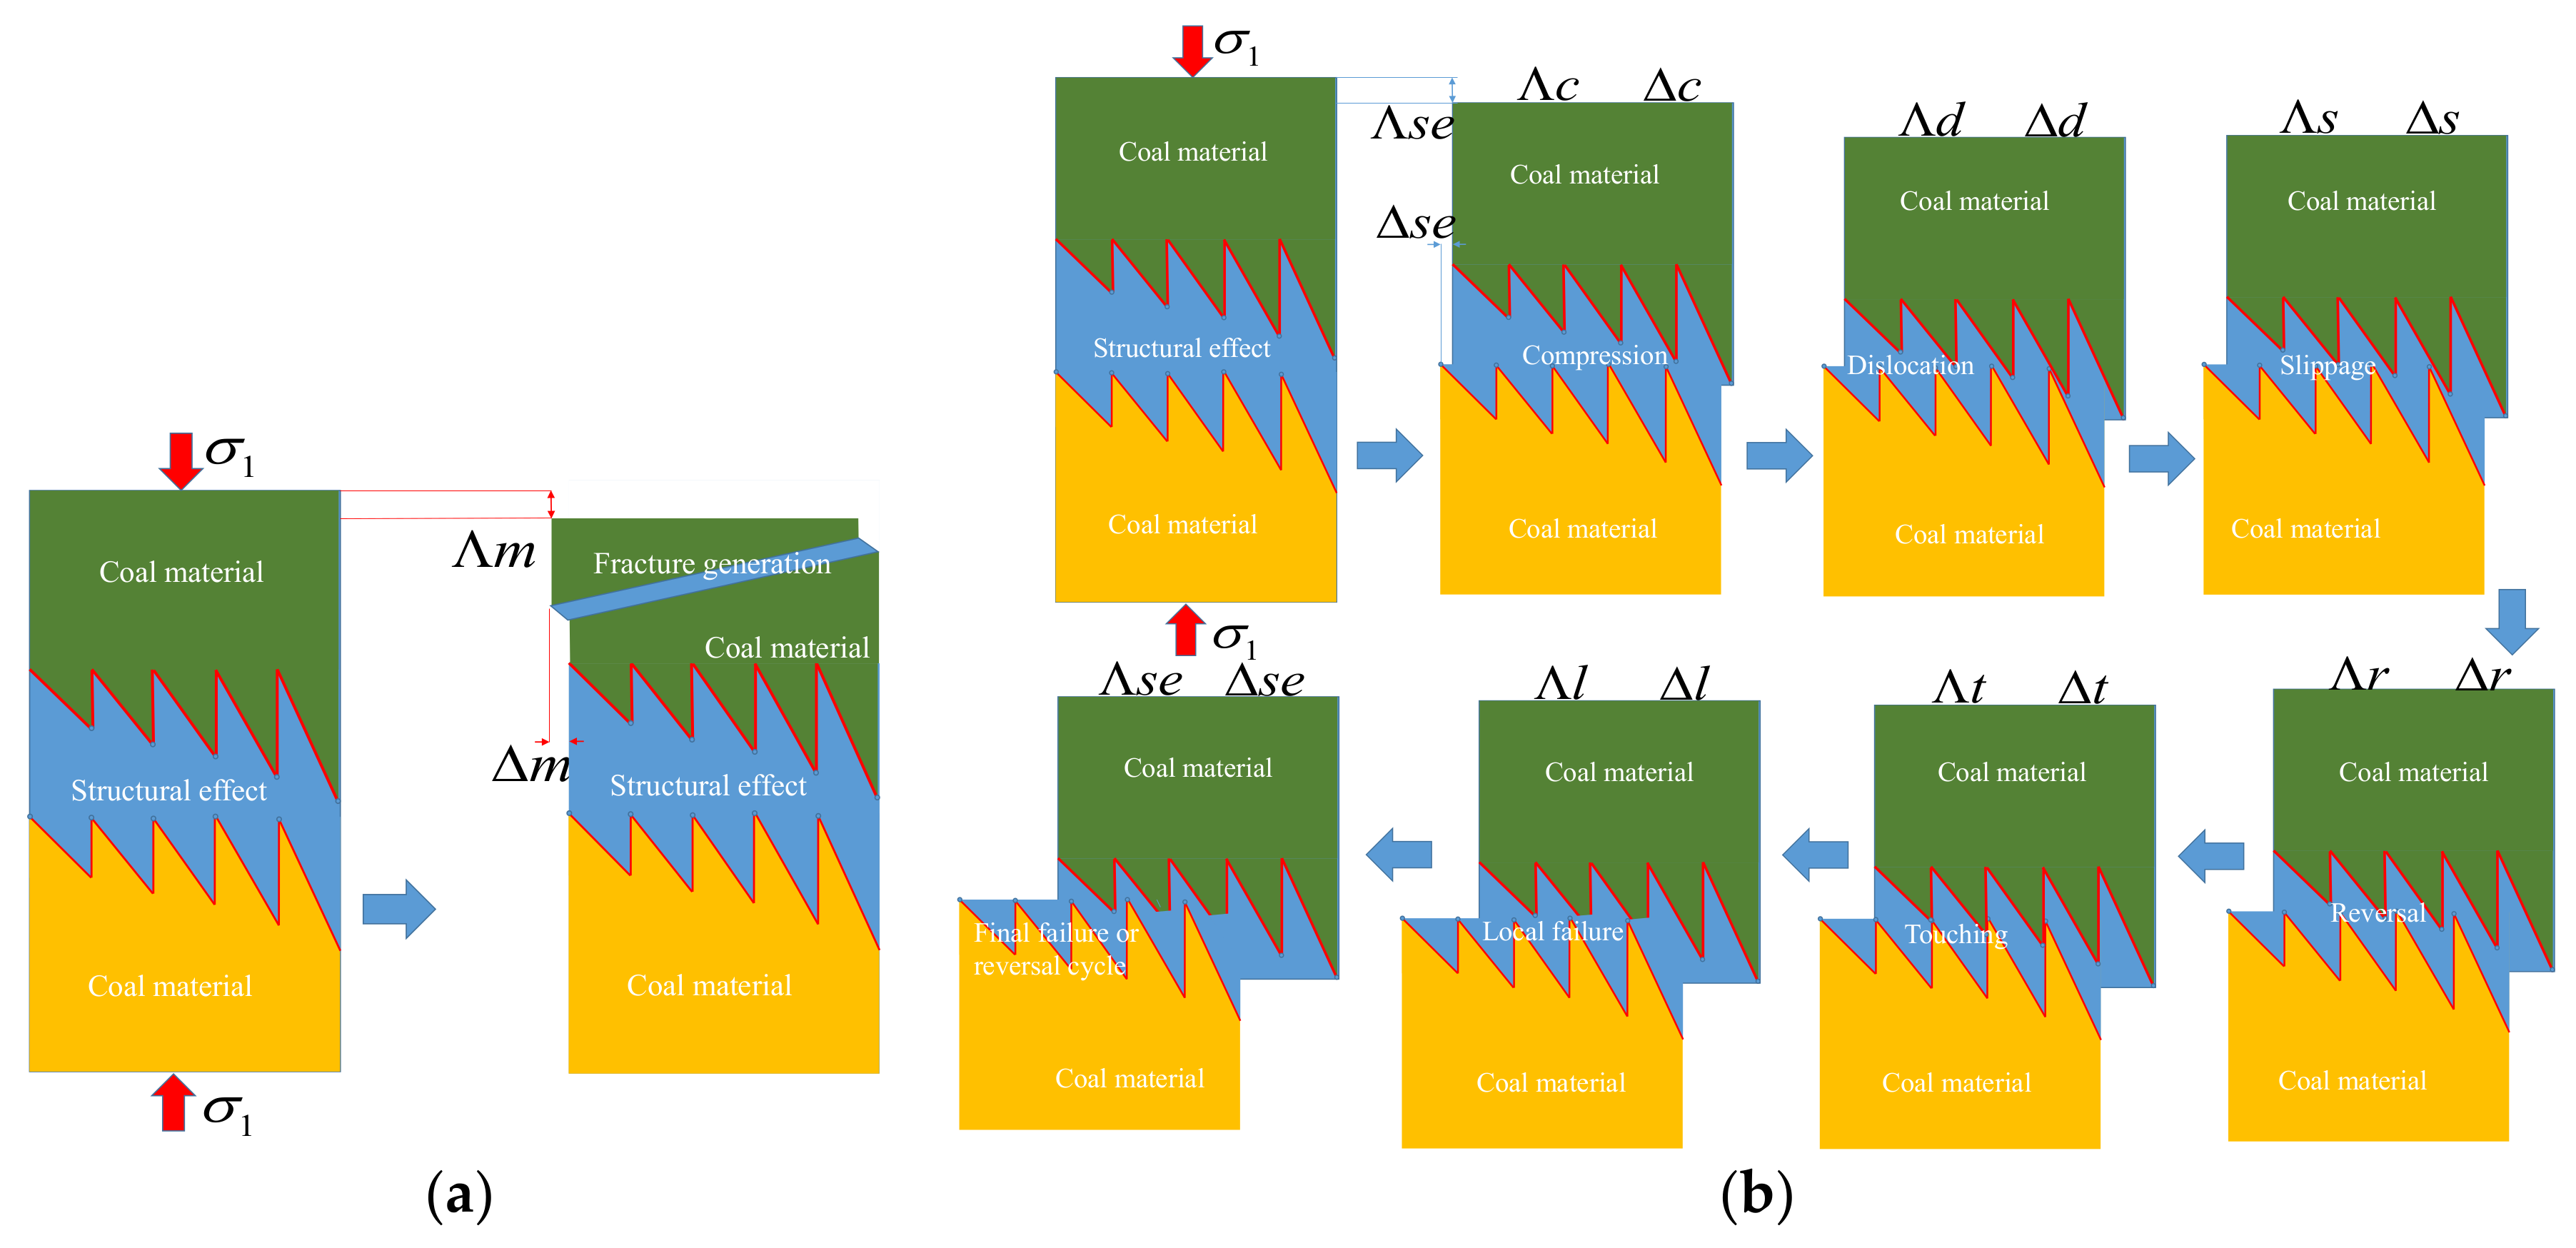
Figure 15 shows the illustration of deformation evolution for fractured coal. The symbols and are used to characterize the increment of axial and lateral deformation, respectively. For the continuous part, the shear-induced matrix deformation and new fracture deformation caused belong to the material deformation. The axial and lateral displacement are Λm and Δm, the lower right superscript “m” represents material (Figure 15a). The material deformation occurs mainly before fractures are fully connected. After, the structural deformation will be dominant.
The structural deformation is caused by the interaction between the discontinuous rough surfaces. There are several main factors influencing the structural effect of stress concentration on the crack front, including structural plane formation, fracture grouping, density, extension scale, topological morphology, openness, volume density, RQD, and connectivity probability, etc. Figure 15b illustrates the structural deformation. The blue part represents the discontinuous rough surfaces, which means the friction effect of the contact surface and the asperity sizes control the strength change due to the decreasing contact area and stiffness difference of various asperities. The aperture and closure easily lead to new structural combination from instability to stability. The occurrence probabilities of different asperities are equal, i.e., the new structure may either have a higher or lower strength in the next transition.
Under the uniaxial compression, the structural deformation mainly includes seven parts. First is compression of the structural body between two rough surfaces, which means surfaces closer in the axial direction. For the lateral direction,there is a beginning deviation of the upper and lower blocks with axial deformation, Λc, and later deformation, Δc. Second is dislocation. When compressed to a certain extent, the surfaces start to contact and due to their different asperity sizes, the contact part cannot be completely engaged. Deformation will be dislocated under increasing stress and the dislocation components are Λd and Δd. Third is slippage. The potential cracking parts begin to generate relative motion and the friction occurs influencing the internal friction angle. The deformation components are Λsl and Δsl. Fourth is reversal. In the absence of the lateral stress, friction cannot be sustained. The fracture geometry is weakened and the contact may turn from one side to the other side with deformation components of Λr and Δr. Fifth is touching. The asperities begin to re-contact with each other, then squeeze and collide with deformation components of Λt and Δt. Sixth is local failure. Under the increasing force, the contact parts produce strong stress concentration causing local failure and the deformation components are Λt and Δt. Seventh is final failure or reversal cycle. The failure continues developing and different asperities cyclically come in contact with the shear failure. The connected fractures are formed from reversal deformation cycles with deformation components of Λs and Δs.
4.4. Mechanism on Structural Strength Evolution
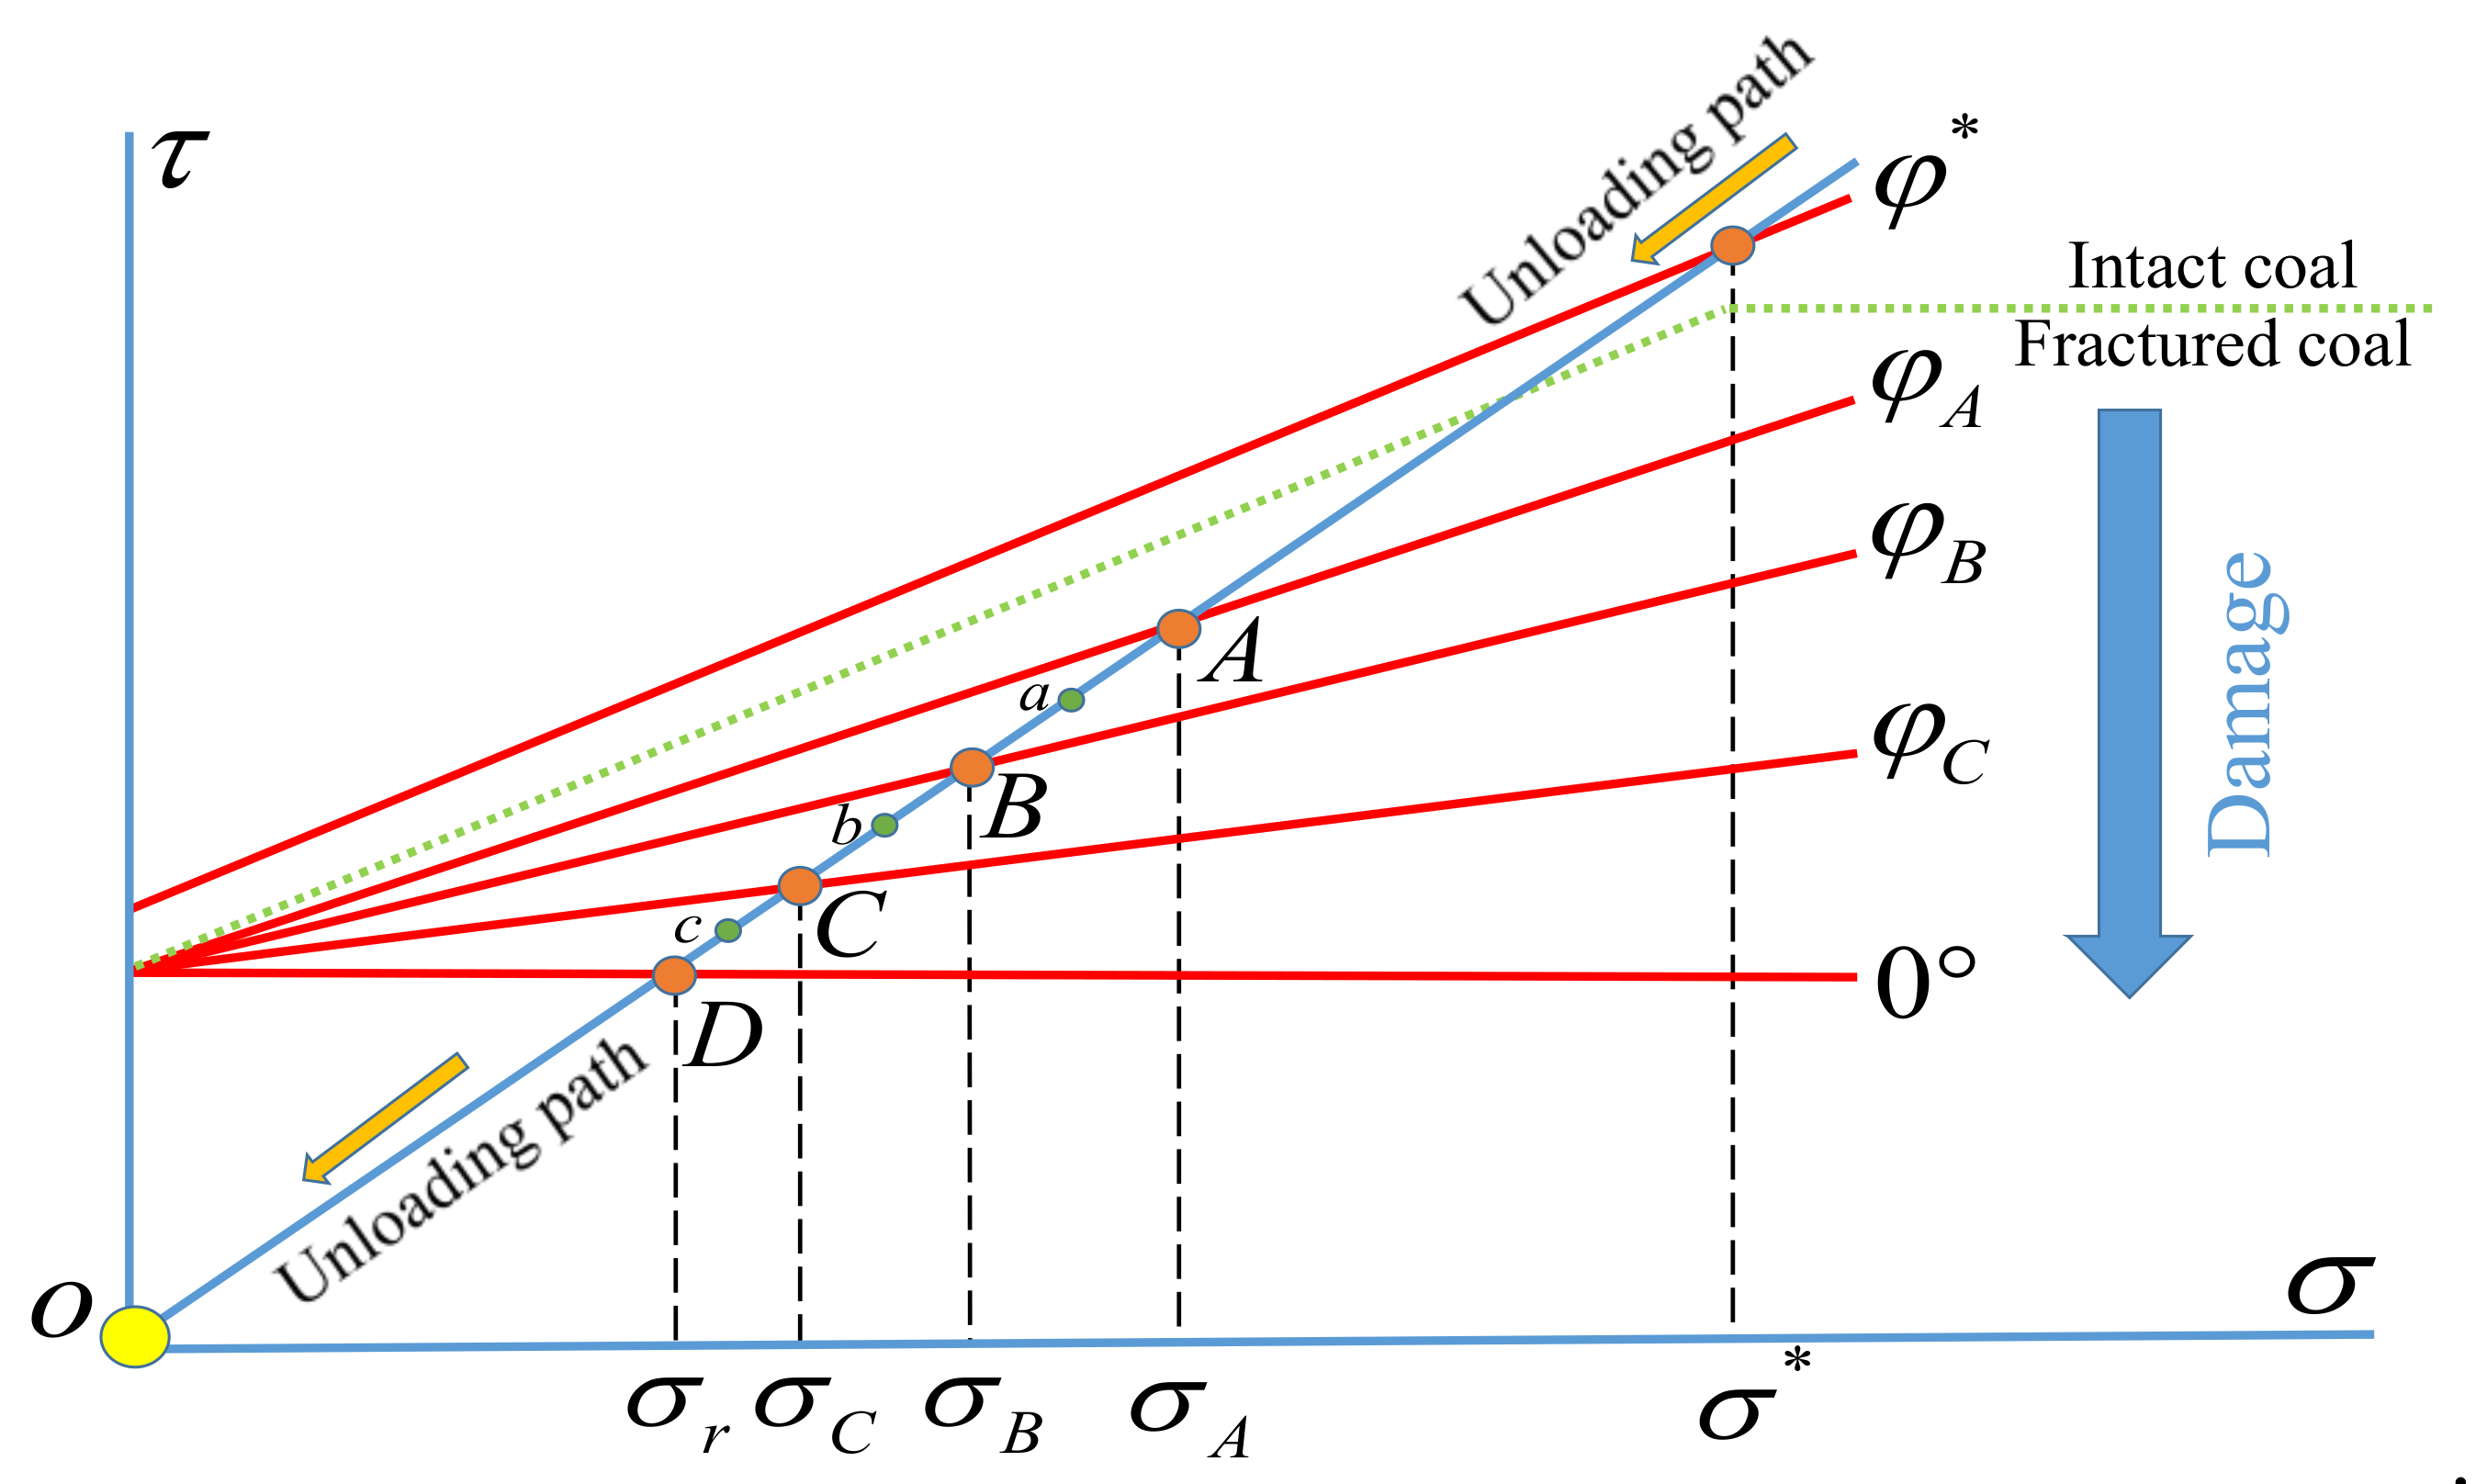
The internal friction angle can illustrate the whole behavior of the coal block and the fracture structure. The dynamic adjustment of the structure will affect the internal friction angle. As shown in Figure 16, when the intact coal reaches the peak stress, the adjustment of the internal structure reaches its limit with internal friction angle of ϕ*. The new fractures terminate the balance of stability. The axial stress and shear stress decrease simultaneously. When the stress drops to point a, the deformation may be one or more combinations of the structural deformation, and the temporary contact deformation forms a new stable geometry structure with new internal friction angle, ϕA.
At this point, the stress has dropped below the yield line, but the unloading is in a passive state and when the stress loading continues to increase, the stiffness of fractured coal will be recovered until it reaches point A. New fractures will occur, disrupting the balance. Then the stress drops to point b, and the new structure formation will be present with reloading failure cycles. Or no new structure, balance will be present. Such repeated cycles are reflected in the fluctuation of the stress-strain curve. There is a limit state with stress drop until the internal friction angle reaches zero. The fractured sample cannot go on carrying and the structure fails with the residual stress, σr.
5. Conclusions
Fractured coal samples with various different fracture patterns were prepared for the uniaxial compression test. The structural behavior influenced by material, physical and mechanical parameters were quantified. The main conclusions drawn are as follows:
- (1)
- The structural behavior of fractured coal with the stress drop fluctuation is different from the material behavior. It is a structural rebalance rather than the ductile mechanism that leads to the stress plateau. Describing the complexity of fractures based on the macroscopic damage is still valid.
- (2)
- The backbone fractures significantly impact the strength as verified by different material and structural parameters. Based on the damage of elastic modulus and longitudinal wave velocity, the strength ratio shows an exponential decrease. The application of Poisson’s ratio for fractured coal is not effective due to the discontinuous effect. The greater the density drop, the lower the strength ratio. There is a linear relationship between drops of wave velocity and density.
- (3)
- There is a transition of failure mode from material failure to structural failure, i.e., continuous to discontinuous failure. It is observed that the post-peak unloading is a coupling of the structural unloading and the material unloading. The post-peak unloading includes the elastic strain recovery and resilience strain recovery. The structural damage defined based on the structural modulus can effectively illustrate the evolution of strength.
- (4)
- A new model is proposed to illustrate coupling material and structural effects. The structural deformation includes compression, dislocation, slippage, touching, local failure, and final failure or reversal cycle. Based on the internal friction angle, a new mechanism on structural strength evolution is suggested to improve the understanding of the falling stress cycles effectively.
Author Contributions
D.X. and H.Z. conceived this model; D.X. and J.L. performed the experiments and wrote the paper; J.Z., Y.L., Y.Z. and L.Z. analyzed the test data.
Funding
The authors gratefully acknowledge the financial support from the National Natural Science Foundation of China (grant Nos. 51504257, 51674266), the Fund of Yueqi Outstanding Scholars from China University of Mining and Technology (Beijing) (grant no. 2017A03 and 2018A06), the State Key Research Development Program of China (grant No. 2016YFC0600704), and Open fund of the State Key Laboratory of Coal Mine Disaster Dynamics and Control at Chongqing University (2011DA105287—FW201604).
Conflicts of Interest
The authors have declared no conflicts of interest.
References
- Hoek, E.; Brown, E.T. Practical estimates of rock mass strength. Int. J. Rock Mech. Min. Sci. 1997, 34, 1165–1186. [Google Scholar] [CrossRef]
- Dia, A.; Gruau, G.; Olivié-Lauquet, G.; Riou, C.; Molénat, J.; Curmi, P. The distribution of rare earth elements in groundwaters: Assessing the role of source-rock composition, redox changes and colloidal particles. Geochim. Cosmochim. Ac. 2000, 64, 4131–4151. [Google Scholar] [CrossRef]
- Goodman, R.E.; Taylor, R.L.; Brekke, T.L. A model for the mechanics of jointed rock. J. Soil Mech. Found. Div. 1968, 94, 637–665. [Google Scholar]
- Einstein, H.H.; Hirschfeld, R.C. Model studies on mechanics of jointed rock. J. Soil Mech. Found. Div. 1973, 99, 229–248. [Google Scholar]
- Barton, N.; Bandis, S. Effects of block size on the shear behavior of jointed rock. In Proceedings of the 23rd US Symposium on Rock Mechanics (USRMS), Berkeley, CA, USA, 25–27 August 1982. [Google Scholar]
- Oda, M. An equivalent continuum model for coupled stress and fluid flow analysis in jointed rock masses. Water Resur. Res. 1986, 22, 1845–1856. [Google Scholar] [CrossRef]
- Bieniawski, Z.T. The geomechanics classification in rock engineering applications. In Proceedings of the 4th International Society for Rock Mechanics (ISRM) Congress, Montreux, Switzerland, 2–8 September 1979. [Google Scholar]
- Bjureland, W.; Spross, J.; Johansson, F.; Prästings, A.; Larsson, S. Challenges in Applying Fixed Partial Factors to Rock Engineering Design. Geo-Risk 2017, 384–393. [Google Scholar] [CrossRef]
- Price, N.J. Fault and Joint Development: In Brittle and Semi-Brittle Rock; Elsevier: London, UK, 2016; pp. 73–79. [Google Scholar]
- Hosseini, N.; Oraee, K.; Shahriar, K.; Goshtasbi, K. Studying the stress redistribution around the longwall mining panel using passive seismic velocity tomography and geostatistical estimation. Arab. J. Geosci. 2013, 6, 1407–1416. [Google Scholar] [CrossRef]
- Konicek, P.; Soucek, K.; Stas, L.; Singh, R. Long-hole destress blasting for rockburst control during deep underground coal mining. Int. J. Rock Mech. Min. Sci. 2013, 61, 141–153. [Google Scholar] [CrossRef]
- Mughieda, O.; Omar, M.T. Stress analysis for rock mass failure with offset joints. Geotech. Geol. Eng. 2008, 26, 543–552. [Google Scholar] [CrossRef]
- Das, A.J.; Mandal, P.K.; Bhattacharjee, R.; Tiwari, S.; Kushwaha, A.; Roy, L.B. Evaluation of stability of underground workings for exploitation of an inclined coal seam by the ubiquitous joint model. Int. J. Rock Mech. Min. Sci. 2017, 93, 101–114. [Google Scholar] [CrossRef]
- Das, A.J.; Mandal, P.K.; Bhattacherjee, R.; Tewari, S.; Kushwaha, A. Effect of Fault on the Stability of Workings Underground Extraction of Coal. NexGen Technologies for Mining and Fuel Industries (Volume I and II); CSIR-Central Institute of Mining and Fuel Research: Dhanb, India, 2017; pp. 155–165. [Google Scholar]
- Medhurst, T.P.; Brown, E.T. A study of the mechanical behaviour of coal for pillar design. Int. J. Rock Mech. Min. Sci. 1998, 35, 1087–1105. [Google Scholar] [CrossRef]
- Scholtès, L.; Donzé, F.V.; Khanal, M. Scale effects on strength of geomaterials, case study: Coal. J. Mech. Phys. Solids 2011, 59, 1131–1146. [Google Scholar] [CrossRef]
- Bahaaddini, M.; Sharrock, G.; Hebblewhite, B.K. Numerical investigation of the effect of joint geometrical parameters on the mechanical properties of a non-persistent jointed rock mass under uniaxial compression. Comput. Geotech. 2013, 49, 206–225. [Google Scholar] [CrossRef]
- Zdravkov, A.; Bechtel, A.; Sachsenhofer, R.F.; Kortenski, J. Palaeoenvironmental implications of coal formation in Dobrudzha Basin, Bulgaria: Insights from organic petrological and geochemical properties. Int. J. Coal. Geol. 2017, 180, 1–17. [Google Scholar] [CrossRef]
- Bieniawski, Z.T.; Bernede, M.J. Suggested methods for determining the uniaxial compressive strength and deformability of rock materials: Part 1. Suggested method for determining deformability of rock materials in uniaxial compression. Int. J. Rock Mech. Min. Sci. Geo. Abs. 1979, 16, 138–140. [Google Scholar] [CrossRef]
- Tsiambaos, G.; Sabatakakis, N. Considerations on strength of intact sedimentary rocks. Eng. Geol. 2004, 72, 261–273. [Google Scholar] [CrossRef]
- Yu, J.; Tahmasebi, A.; Han, Y.; Yin, F.; Li, X. A review on water in low rank coals: The existence, interaction with coal structure and effects on coal utilization. Fuel. Process. Technol. 2013, 106, 9–20. [Google Scholar] [CrossRef]
- Shi, B.; Zhou, F. Impact of heat and mass transfer during the transport of nitrogen in coal porous media on coal mine fires. Sci. World J. 2014. [Google Scholar] [CrossRef] [PubMed]
- Jing, Y.; Armstrong, R.T.; Ramandi, H.L.; Mostaghimi, P. Coal cleat reconstruction using micro-computed tomography imaging. Fuel 2016, 181, 286–299. [Google Scholar] [CrossRef]
- Schiessel, H.; Metzler, R.; Blumen, A.; Nonnenmacher, T.F. Generalized viscoelastic models: Their fractional equations with solutions. J. Phys. A Math. Gen. 1995, 28, 6567–6584. [Google Scholar] [CrossRef]
- Qin, S.J.; Badgwell, T.A. An overview of nonlinear model predictive control applications. Nonlinear Model Predict. Control 2000, 26, 369–392. [Google Scholar]
- Cai, Y.; Liu, D.; Mathews, J.P.; Pan, Z.; Elsworth, D.; Yao, Y.; Guo, X. Permeability evolution in fractured coal—Combining triaxial confinement with X-ray computed tomography, acoustic emission and ultrasonic techniques. Int. J. Coal. Geol. 2014, 122, 91–104. [Google Scholar] [CrossRef]
- Krajcinovic, D.; Fonseka, G.U. The continuous damage theory of brittle materials, part 1: General theory. Int. J. Appl. Mech. 1981, 48, 809–815. [Google Scholar] [CrossRef]
- Krajcinovic, D.; Silva, M.A.G. Statistical aspects of the continuous damage theory. Int. J. Solids. Struct. 1982, 18, 551–562. [Google Scholar] [CrossRef]
- Den Outer, A.; Kaashoek, J.F.; Hack, H.R. Difficulties with using continuous fractal theory for discontinuity surfaces. Int. J. Rock Mech. Min. Sci. Geo. Abs. 1995, 32, 3. [Google Scholar] [CrossRef]
- Zoback, M.D.; Hickman, S. In situ study of the physical mechanisms controlling induced seismicity at Monticello Reservoir, South Carolina. J. Geophys. Res. 1982, 87, 6959–6974. [Google Scholar] [CrossRef] [Green Version]
- Fardin, N.; Feng, Q.; Stephansson, O. Application of a new in situ 3D laser scanner to study the scale effect on the rock joint surface roughness. Int. J. Rock Mech. Min. Sci. 2004, 2, 329–335. [Google Scholar] [CrossRef]
- Yang, X.X.; Jing, H.W.; Tang, C.A.; Yang, S.Q. Effect of parallel joint interaction on mechanical behavior of jointed rock mass models. Int. J. Rock Mech. Min. Sci. 2017, 92, 40–53. [Google Scholar] [CrossRef]
- Zhang, Z.; Zhang, R.; Xie, H.; Gao, M.; Xie, J. Mining-induced coal permeability change under different mining layouts. Rock. Mech. Rock. Eng. 2016, 49, 3753–3768. [Google Scholar] [CrossRef]
- Wawersik, W.R.; Fairhurst, C. A study of brittle rock fracture in laboratory compression experiments. Int. J. Rock Mech. Min. Sci. Geo. Abs. 1970, 7, 561–575. [Google Scholar] [CrossRef]
- Lemaitre, J. How to use damage mechanics. Nucl. Eng. Des. 1984, 80, 233–245. [Google Scholar] [CrossRef]
- Corbin, S.F.; Wilkinson, D.S. Influence of matrix strength and damage accumulation on the mechanical response of a particulate metal matrix composite. Acta Metall. Mater. 1994, 42, 1329–1335. [Google Scholar] [CrossRef]
- Smith, P.A.; Wood, J.R. Poisson’s ratio as a damage parameter in the static tensile loading of simple crossply laminates. Compos. Sci. Technol. 1990, 38, 85–93. [Google Scholar] [CrossRef]
- Gercek, H. Poisson’s ratio values for rocks. Int. J. Rock Mech. Min. Sci. 2007, 44, 1–13. [Google Scholar] [CrossRef]
- Bieniawski, Z.T. Engineering classification of jointed rock masses. Civ. Eng. South Afr. 1973, 15, 335–343. [Google Scholar]
- Lawn, B.R.; Evans, A.G.; Marshall, D.B. Elastic/plastic indentation damage in ceramics: The median/radial crack system. J. Am. Ceram. Soc. 1980, 63, 574–581. [Google Scholar] [CrossRef]
- Choi, H.Y.; Wu, H.Y.T.; Chang, F.K. A new approach toward understanding damage mechanisms and mechanics of laminated composites due to low-velocity impact: Part II—Analysis. J. Compos. Mater. 1991, 25, 1012–1038. [Google Scholar] [CrossRef]
- Kozłowski, M.; Bedon, C.; Honfi, D. Numerical Analysis and 1D/2D Sensitivity Study for Monolithic and Laminated Structural Glass Elements under Thermal Exposure. Materials 2018, 11, 1447. [Google Scholar] [CrossRef] [PubMed]
Figure 1.
Backbone fracture patterns. (a) NF, (b) MDF, (c) PDF, (d) SCF, (e) CDF.

Figure 2.
Stress paths for fractured sample. (a) Typical stress-strain curve. (b) Unloading paths of MTC tests. (Unit of stress: MPa).
Figure 2.
Stress paths for fractured sample. (a) Typical stress-strain curve. (b) Unloading paths of MTC tests. (Unit of stress: MPa).

Figure 3.
Dilatancy and integrity evaluation. (a) Relationship between axial strain and volumetric strain. (b) Longitudinal wave velocity. (c) Shear wave velocity.
Figure 3.
Dilatancy and integrity evaluation. (a) Relationship between axial strain and volumetric strain. (b) Longitudinal wave velocity. (c) Shear wave velocity.
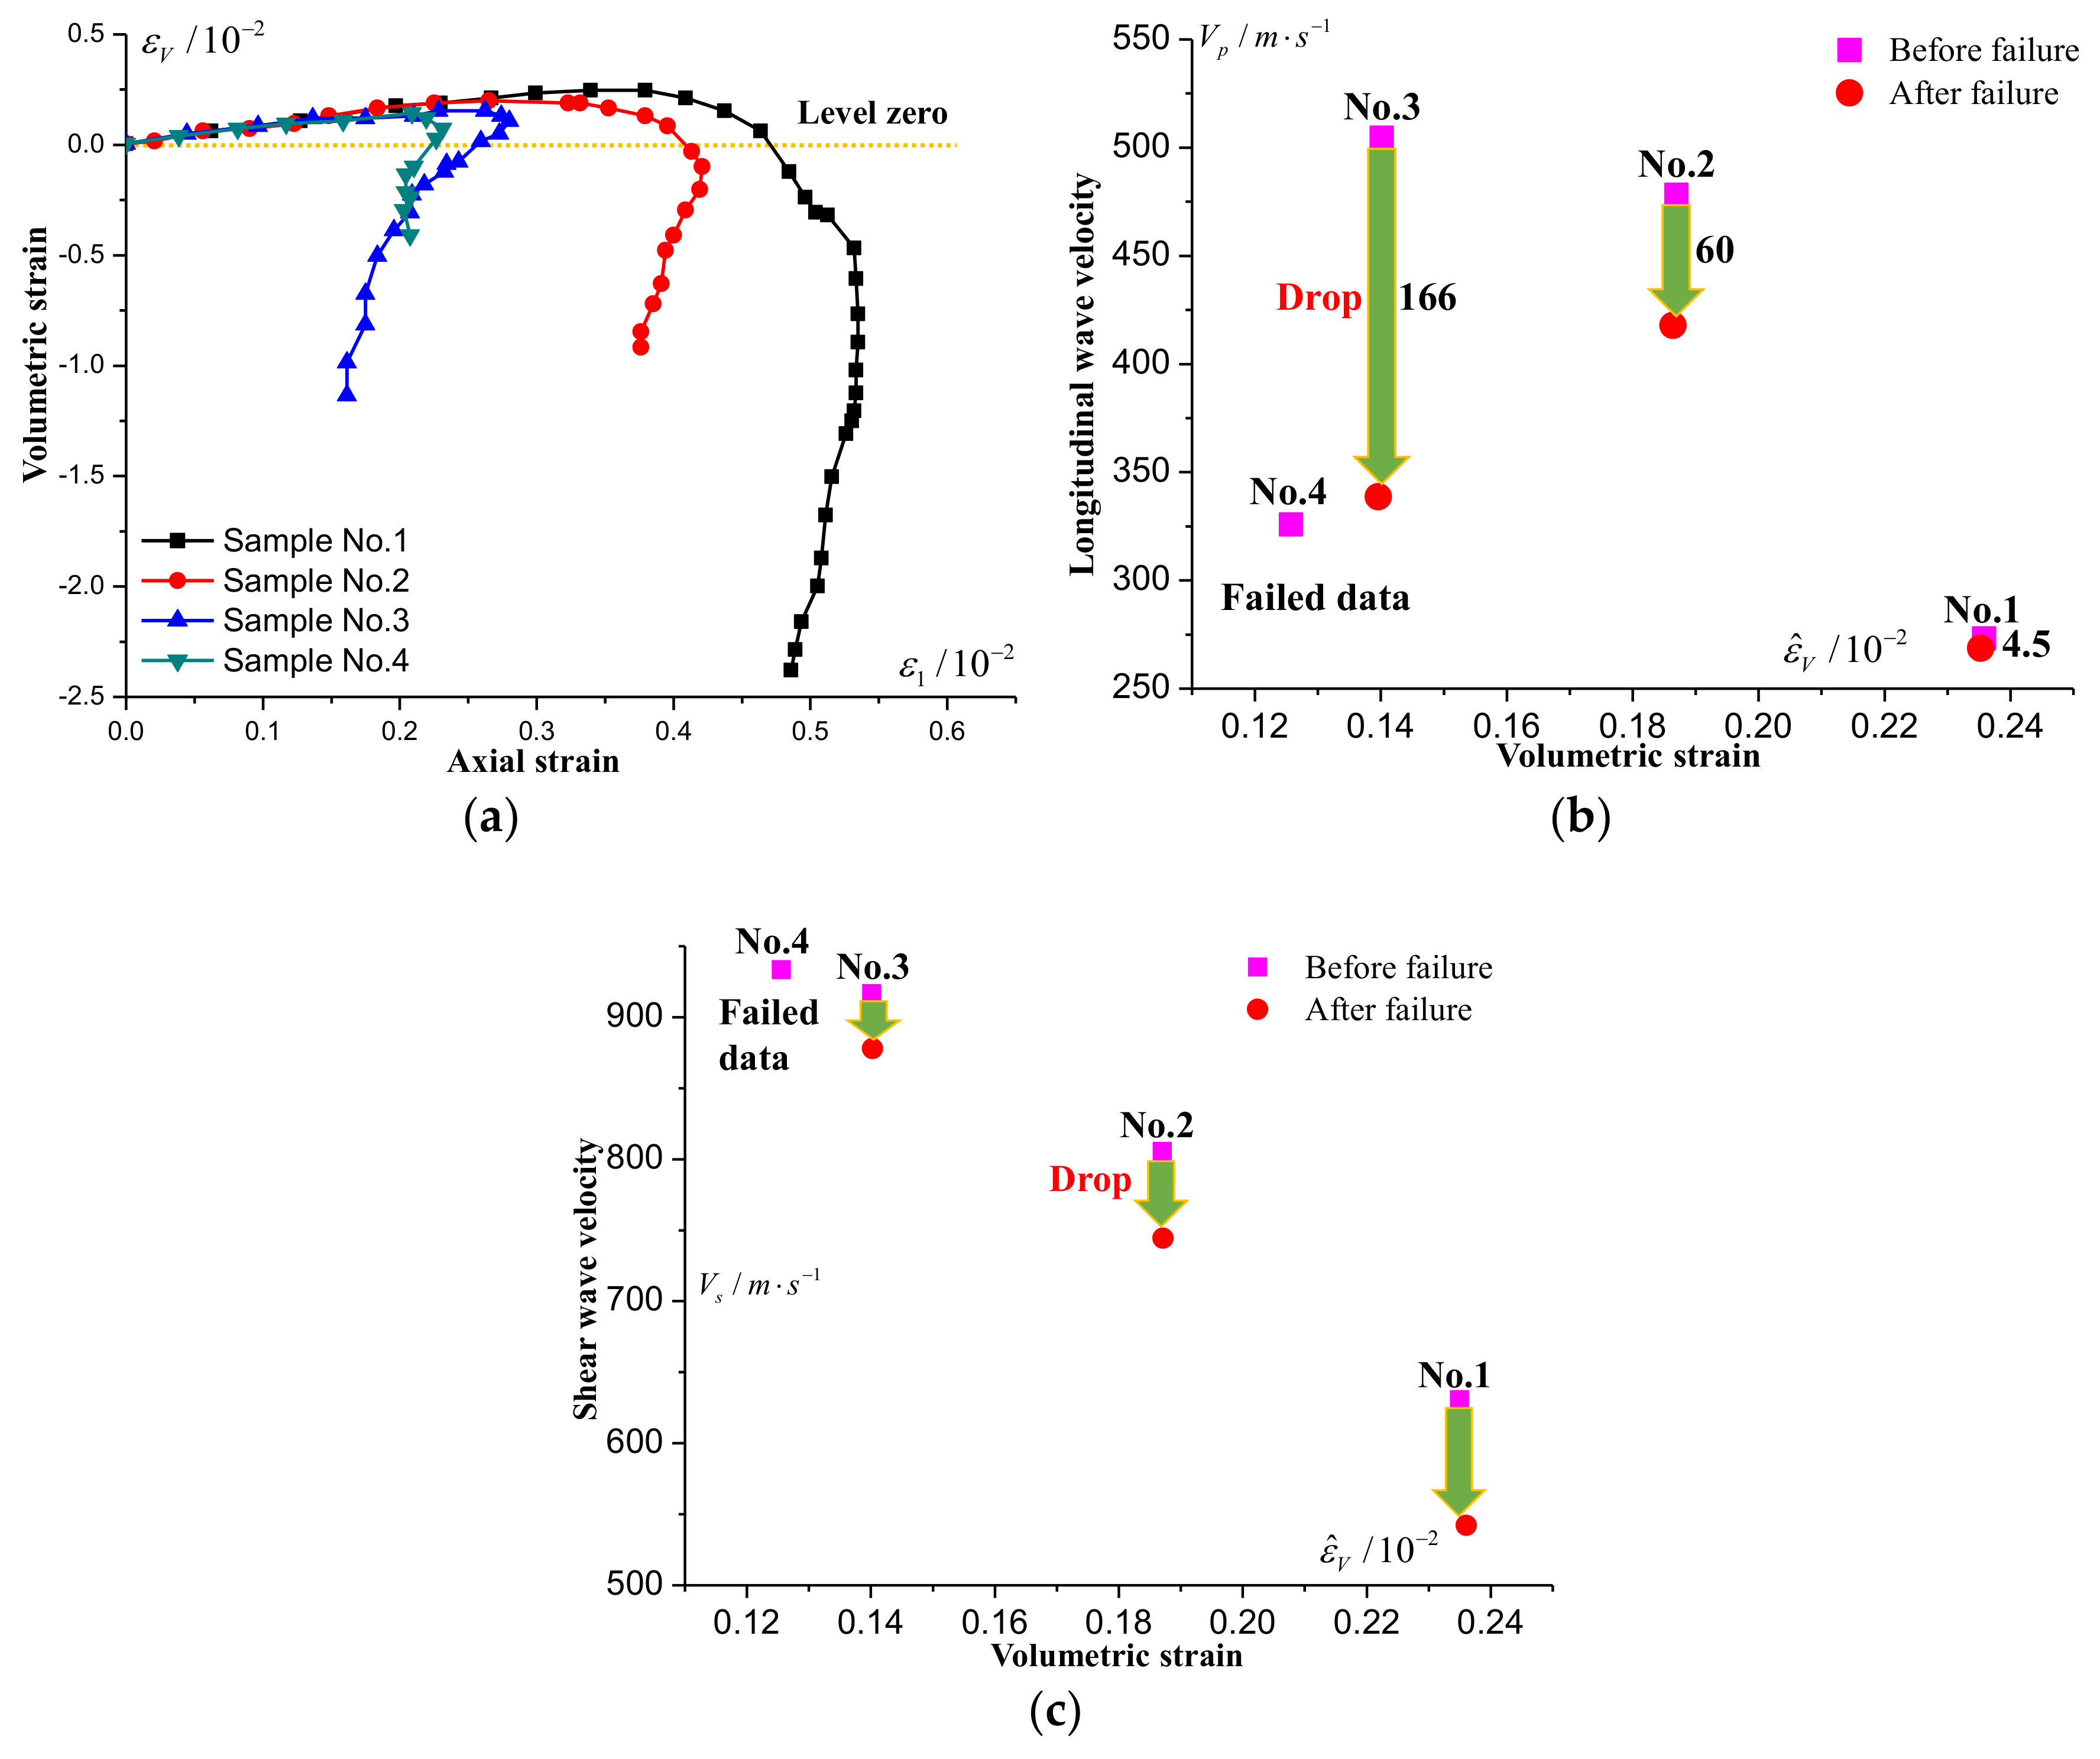
Figure 4.
Deformation of fractured coal. (a) Complete stress-strain curve. (b) Volumetric strain-Axial strain.
Figure 4.
Deformation of fractured coal. (a) Complete stress-strain curve. (b) Volumetric strain-Axial strain.

Figure 5.
Strength distribution.

Figure 6.
Relationship between uniaxial compressive strength and damage.
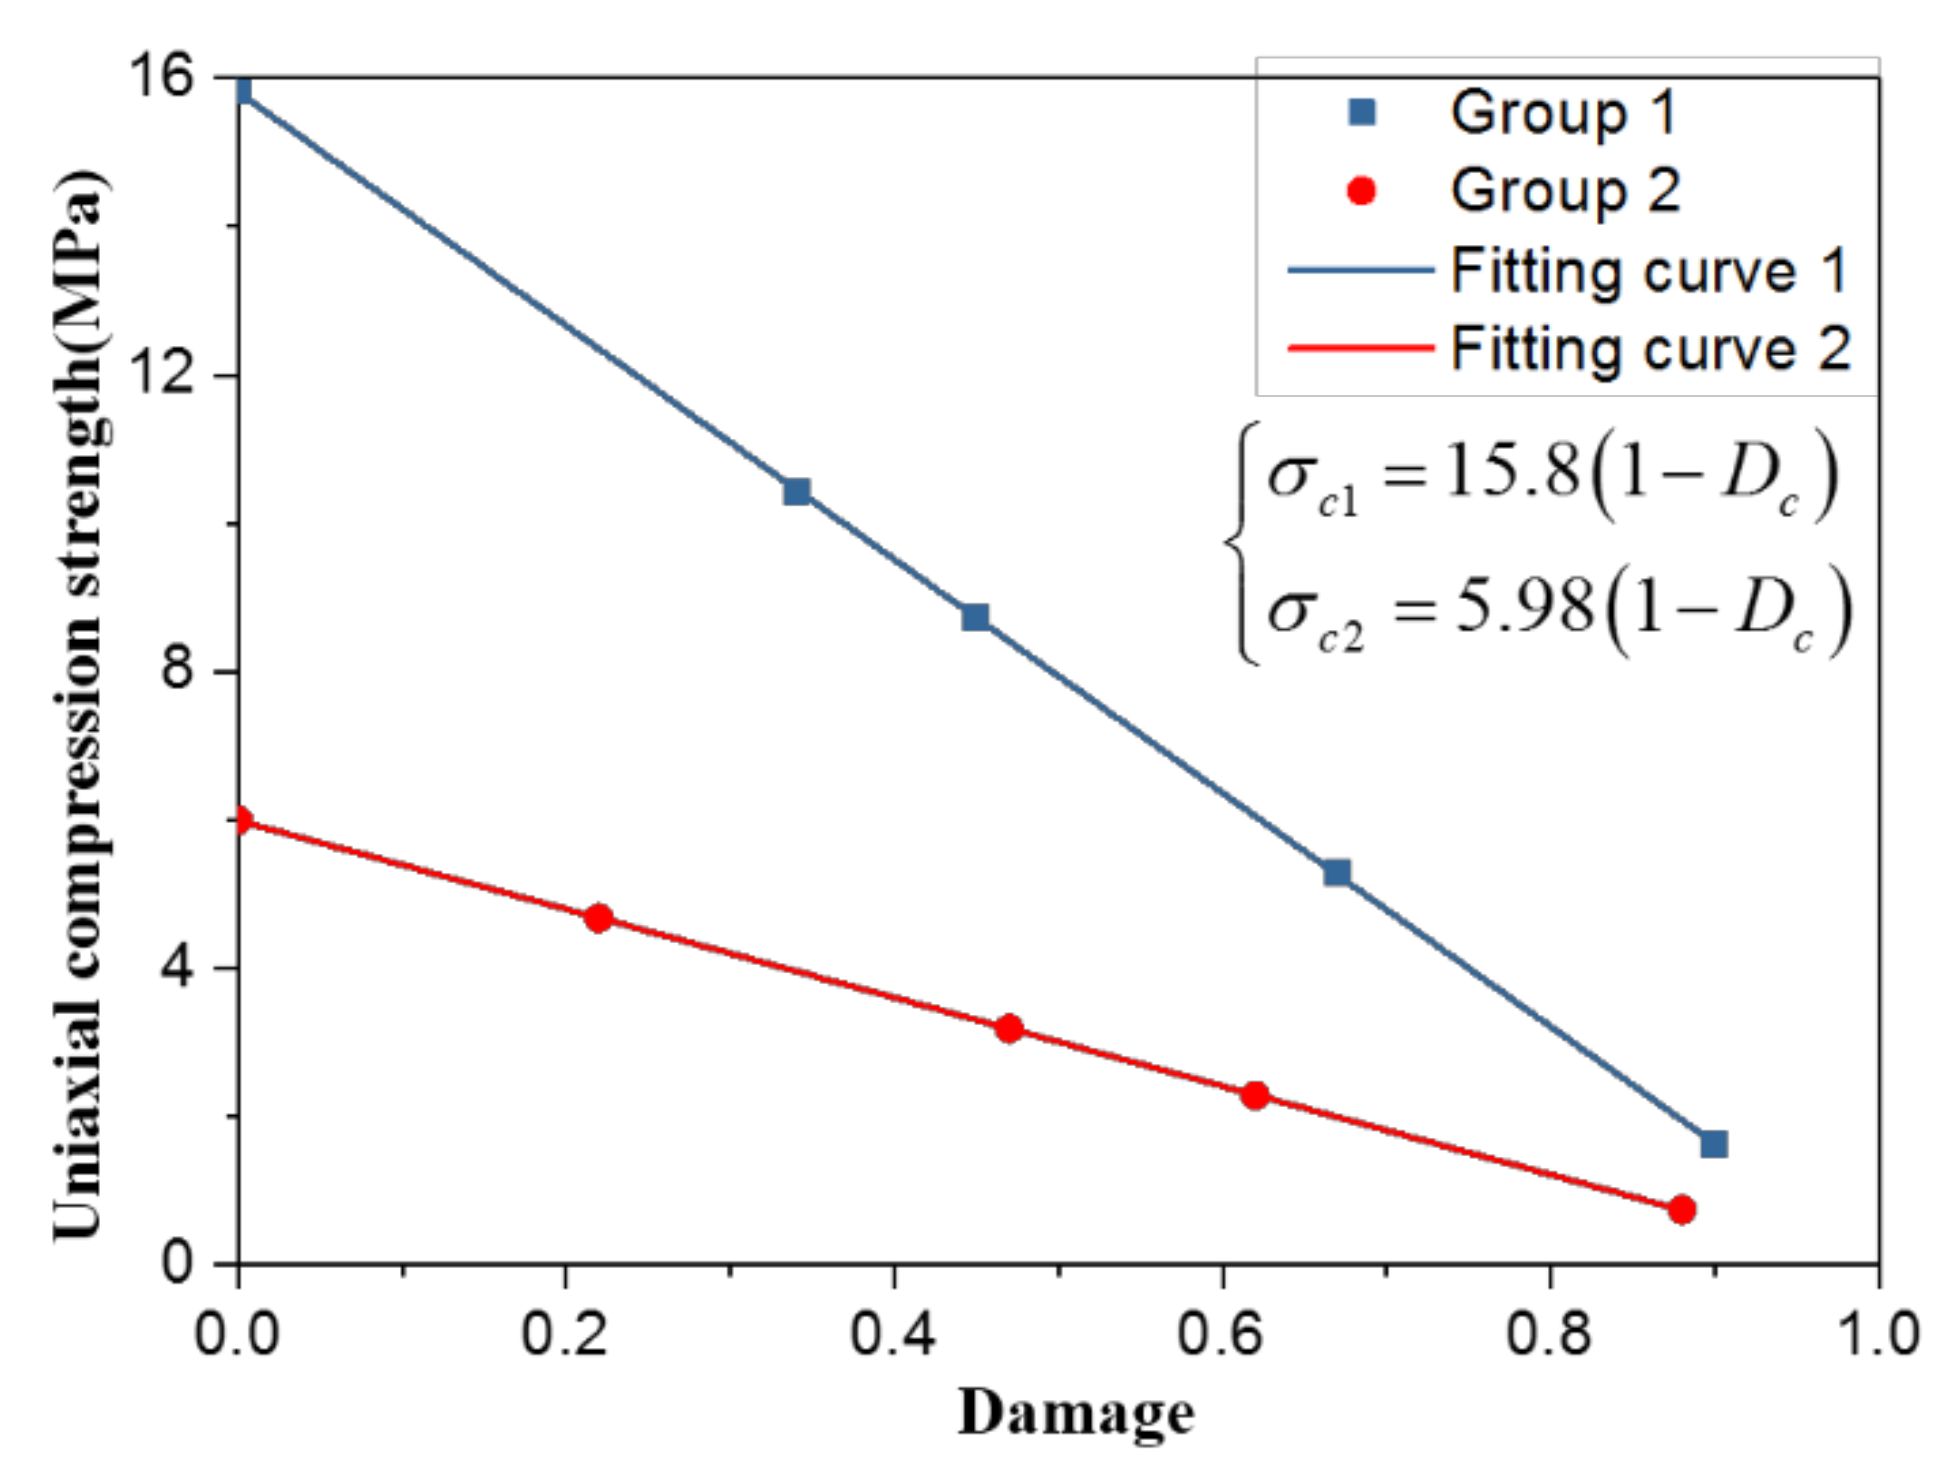
Figure 7.
Distribution of elastic parameters. (a) Poisson’s ratio. (b) Elastic modulus.

Figure 8.
Relationship between strength ratio and damage of elastic modulus.

Figure 9.
Density drop and strength ratio distribution (minus means decrease).
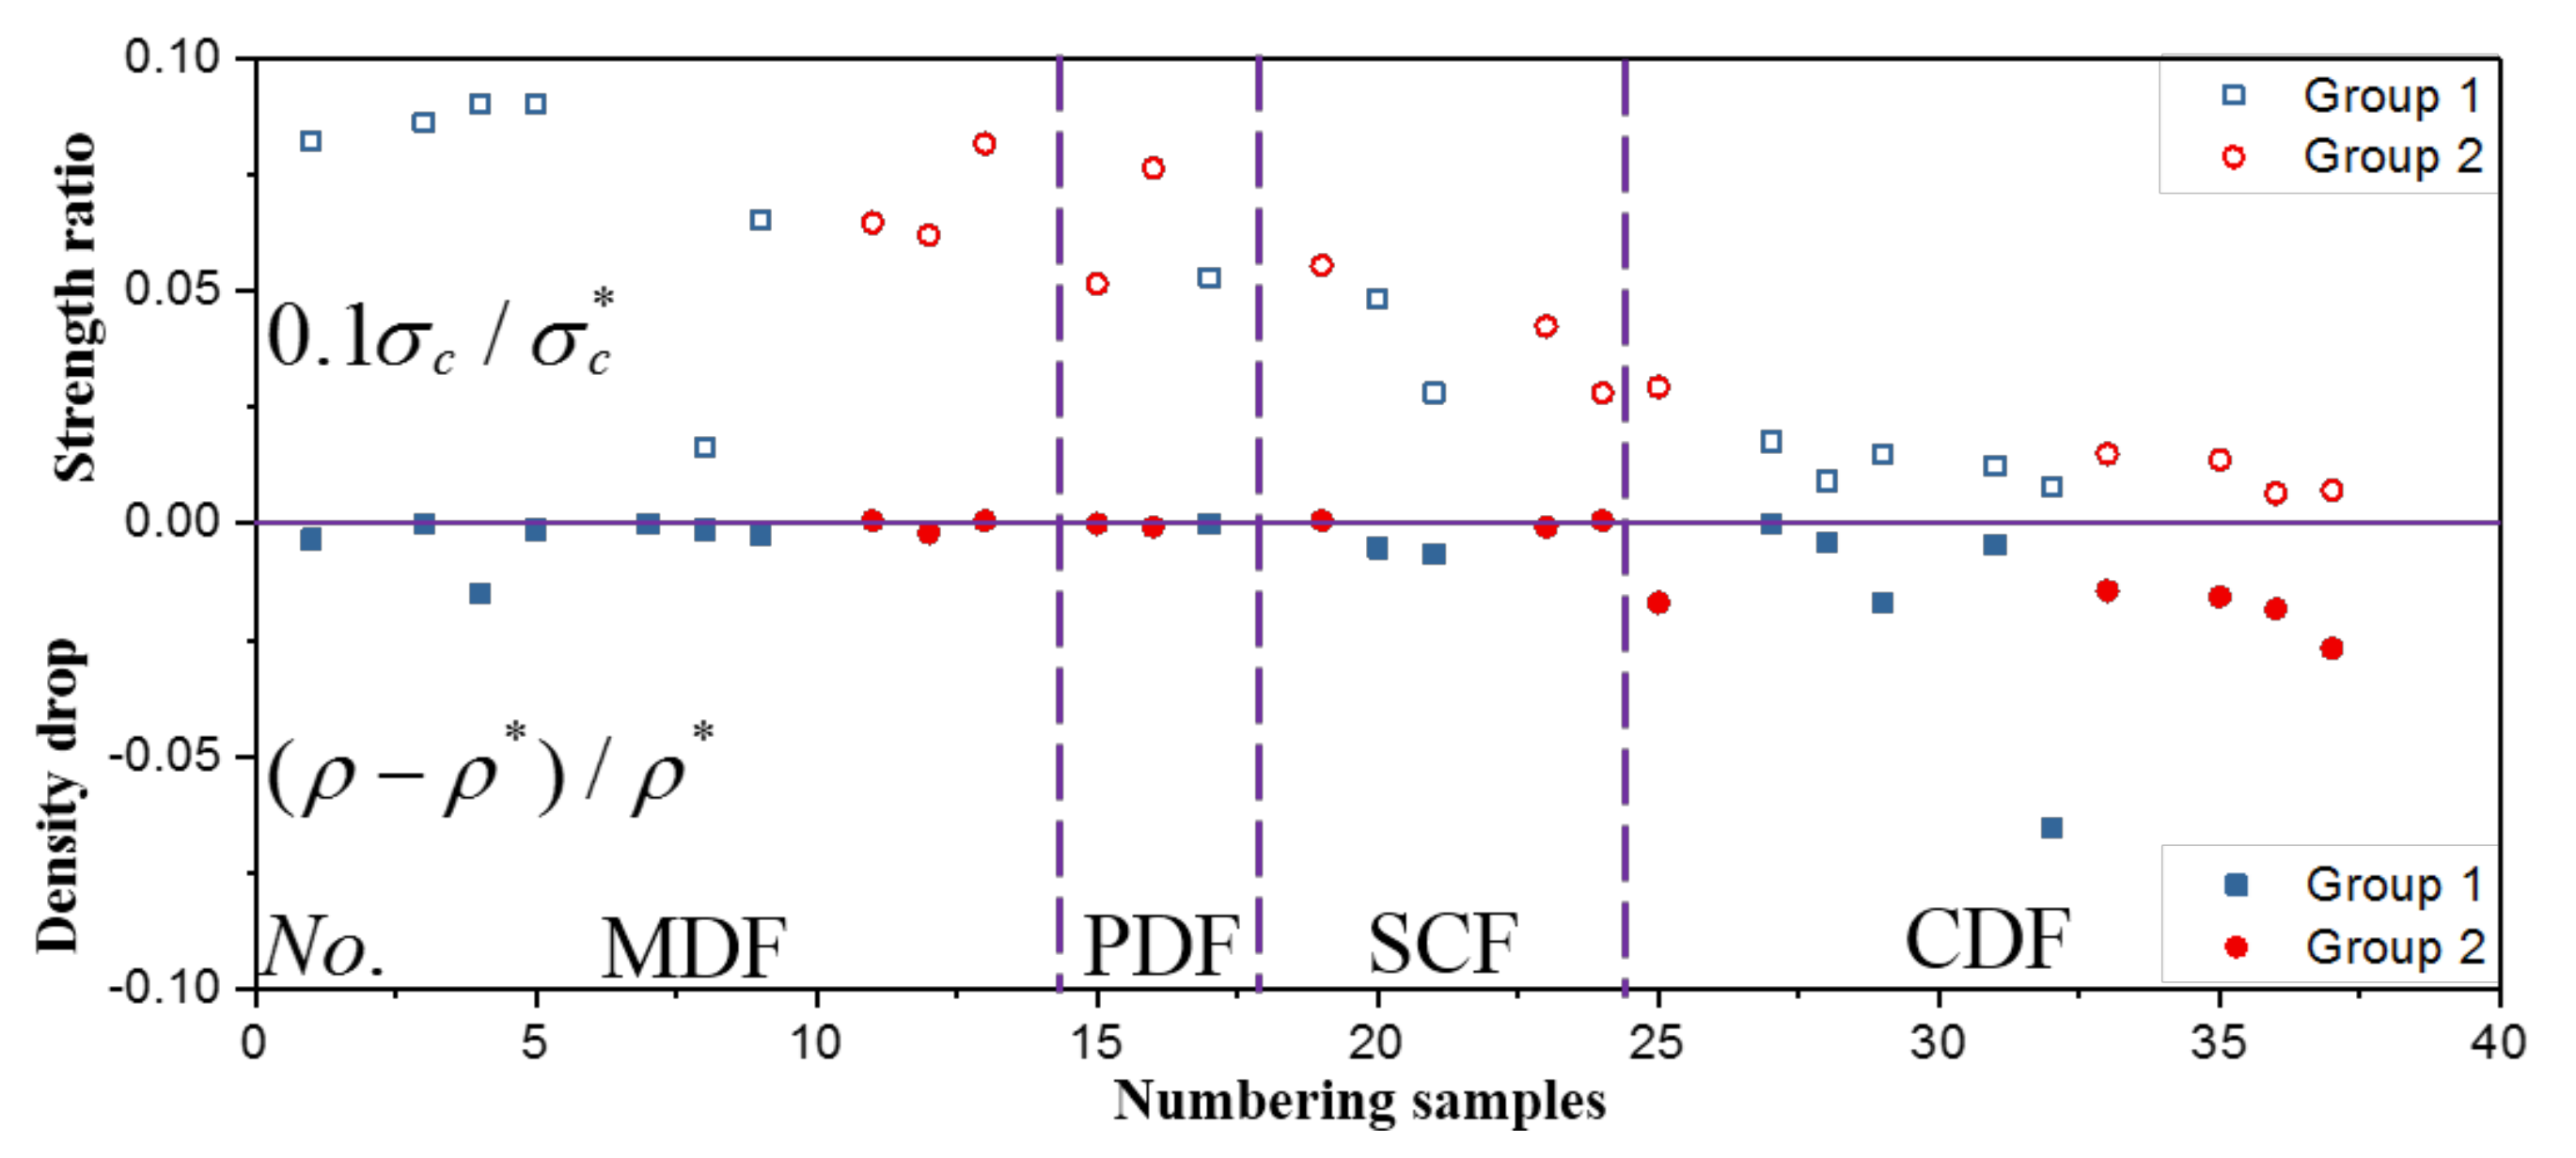
Figure 10.
Distribution of longitudinal wave velocity ratio and strength ratio.
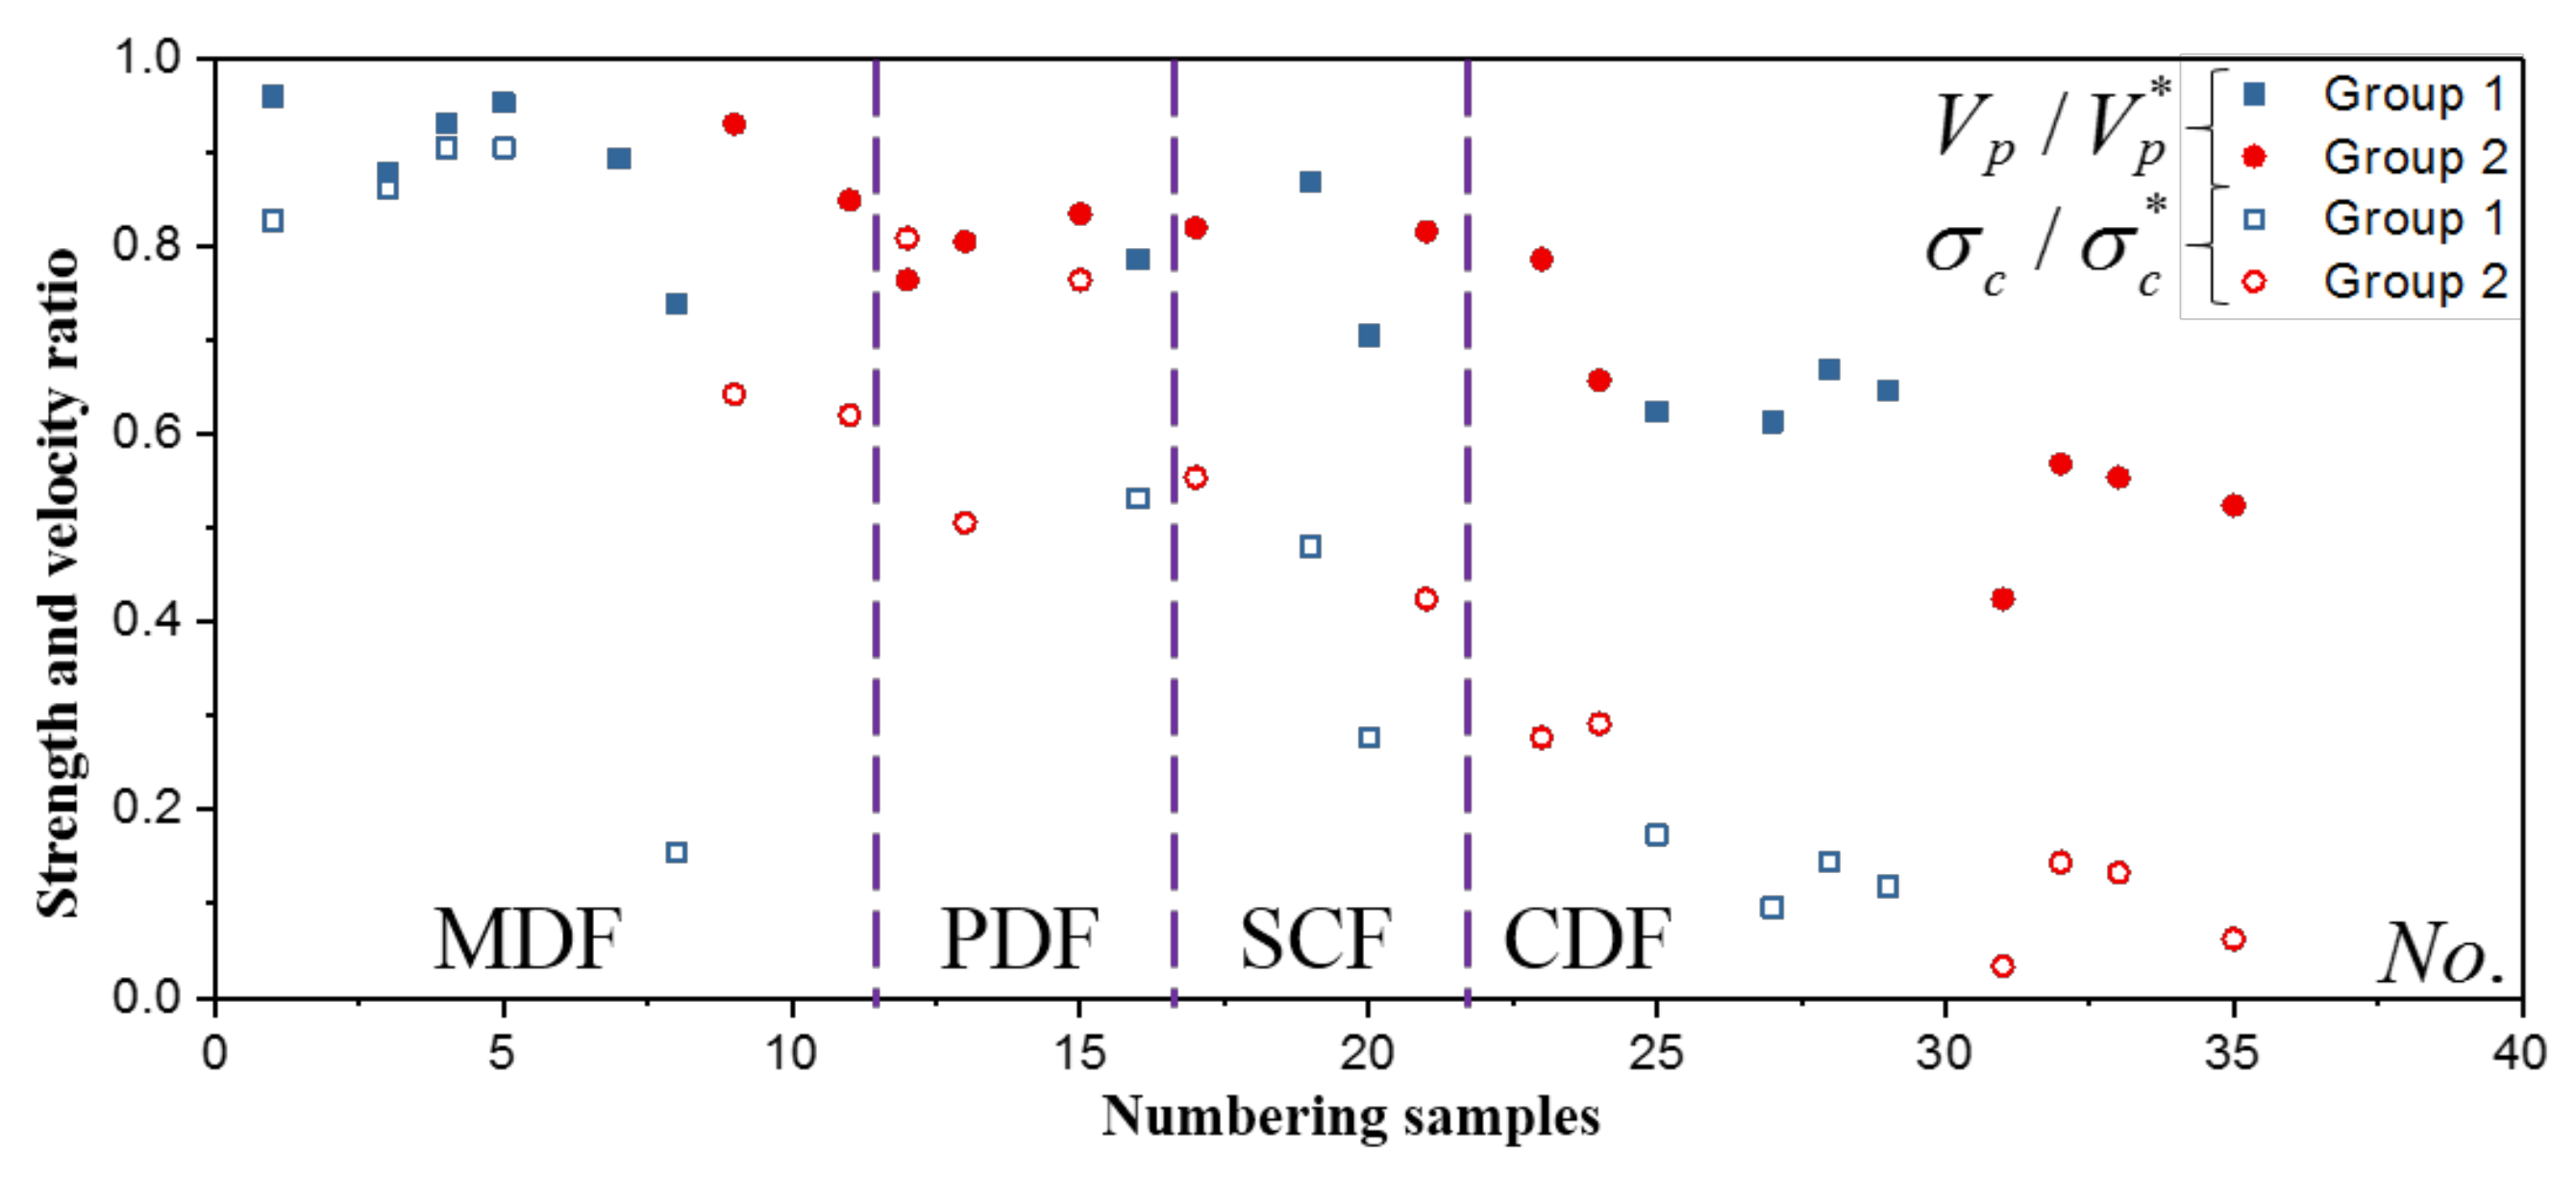
Figure 11.
Strength ratio vs. damage of velocity.

Figure 12.
Relationship between velocity drop and density drop.

Figure 13.
Constitutive law of structural unloading.

Figure 14.
Structural modulus degradation of the test curve.
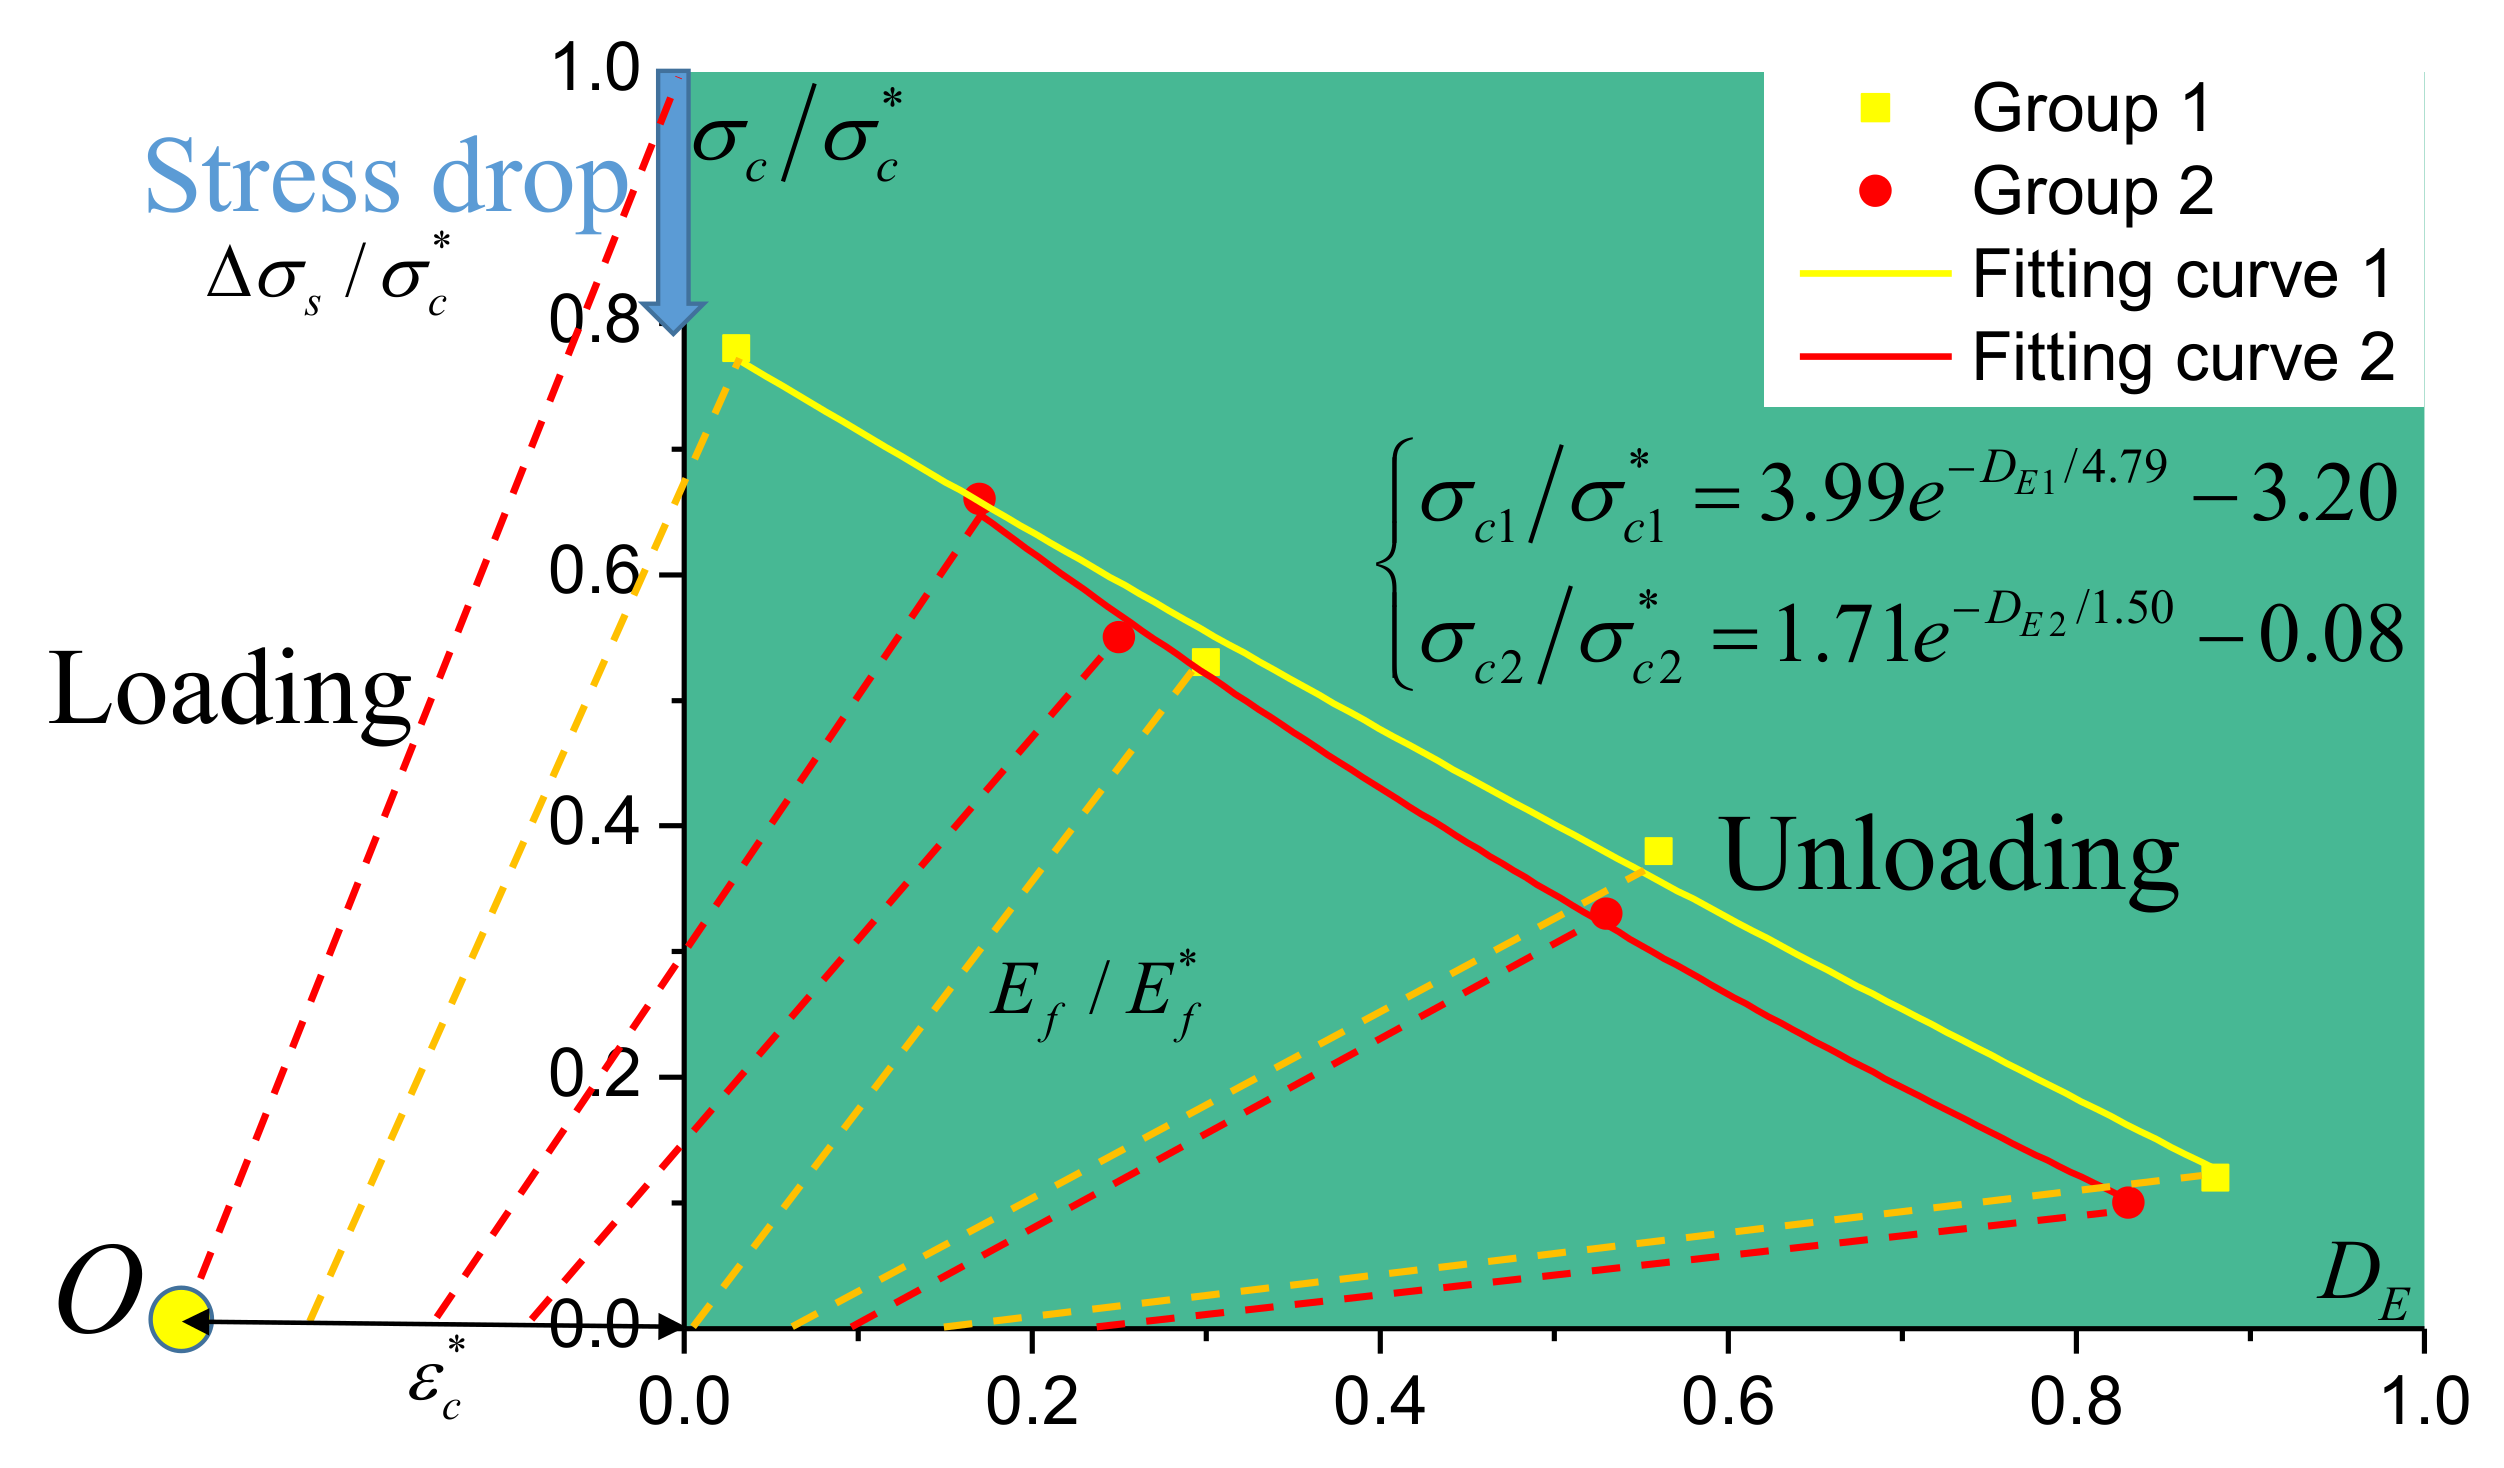
Figure 15.
Deformation of fractured coal. (a) Material deformation. (b) Structural deformation.

Figure 16.
Strength evolution of fractured coal.


Table 1.
Results of intact coal under uniaxial compression.
| Samples | Peak Strength | Poisson’s Ratio | Elastic Modulus | Density | Longitudinal Wave Velocity | |||
|---|---|---|---|---|---|---|---|---|
| σc/MPa | µ50 | µ100 | E50/GPa | E100/GPa | ρ/g⋅cm−3 | Vp/m⋅s−1 | ||
| Group 1 Weakened Coal | 1 | 5.96 | 0.07 | 0.44 | 1.5 | 1.28 | 1.33 | - |
| 2 | 5.18 | 0.08 | 0.31 | 1.39 | 1.16 | 1.36 | 836.03 | |
| 3 | 6.71 | 0.09 | 0.78 | 1.48 | 1.18 | 1.32 | 694.94 | |
| 4 | 6.14 | 0.05 | 0.49 | 1.42 | 0.8 | 1.36 | - | |
| 5 | 5.97 | 0.06 | 0.17 | 1.54 | 1.31 | 1.39 | 916.7 | |
| Means | 5.99 | 0.07 | 0.44 | 1.47 | 1.15 | 1.35 | 815.89 | |
| SD | 0.49 | 0.02 | 0.20 | 0.05 | 0.18 | 0.02 | - | |
| Group 2 Strong Coal | 1 | 18.8 | 0.12 | 0.42 | 3.2 | 2.14 | 1.54 | 1652.8 |
| 2 | 15.5 | 0.14 | 1.53 | 2.46 | 1.99 | 1.52 | 1548 | |
| 3 | 13.16 | 0.15 | 1.28 | 2.2 | 1.49 | 1.46 | - | |
| Means | 15.82 | 0.14 | 1.08 | 2.62 | 1.87 | 1.51 | 1600.4 | |
| SD | 2.31 | 0.02 | 0.48 | 0.42 | 0.28 | 0.03 | - | |
| Times(II/I) | 2.64 | 2.0 | 2.45 | 1.78 | 1.63 | 1.12 | 1.96 | |
Note: SD is the standard deviation.
Table 2.
Compressive strength of intact and fractured coal.
| Fracture Pttern | Mean Strength | Strength Ratio | |||
|---|---|---|---|---|---|
| Group 1 | Group 2 | Group 1 | Group 2 | Mean | |
| NF | 5.99 | 15.82 | 1.00 | 1.00 | 1.00 |
| MDF | 4.67 | 10.42 | 0.78 | 0.66 | 0.72 |
| 3.18 | 8.72 | 0.53 | 0.55 | 0.54 | |
| SCF | 2.28 | 5.29 | 0.38 | 0.33 | 0.36 |
| CDF | 0.74 | 1.62 | 0.12 | 0.10 | 0.11 |
Table 3.
Elastic modulus of intact and fractured coal samples.
| Fracture Pattern | Elastic Modulus | Modulus Ratio | |||
|---|---|---|---|---|---|
| Group 1 | Group 2 | Group 1 | Group 2 | Mean | |
| NF | 1.47 | 2.62 | 1.00 | 1.00 | 1.00 |
| MDF | 1.42 | 2.17 | 0.97 | 0.83 | 0.90 |
| 1.03 | 1.97 | 0.70 | 0.75 | 0.73 | |
| SCF | 0.65 | 1.23 | 0.44 | 0.47 | 0.46 |
| CDF | 0.18 | 0.44 | 0.12 | 0.17 | 0.15 |
Table 4.
Density drop and longitudinal wave velocity ratio.
| Fracture Pattern | Density Drop | Velocity Ratio | ||||
|---|---|---|---|---|---|---|
| Group 1 | Group 2 | Mean | Group 1 | Group 2 | Mean | |
| MDF | 0.33 | 0.09 | 0.21 | 0.89 | 0.83 | 0.86 |
| 0.47 | 0.26 | 0.365 | 0.84 | 0.81 | 0.80 | |
| SCF | 0.647 | 0.599 | 0.623 | 0.79 | 0.75 | 0.77 |
| CDF | 1.829 | 1.939 | 1.884 | 0.64 | 0.51 | 0.58 |
Table 5.
Failure conversion.
| Fracture Pattern | Compressive Strength | Failure Conversion | ||
|---|---|---|---|---|
| Trend | Failure Mechanism | Structural Failure | ||
| NF | 1.00 |  | Tension and shear failures |  |
| MDF | 0.72 | Tension material failure; Slippage structural failure | ||
| 0.54 | Material and structural failures co-influence | |||
| SCF | 0.36 | Tension material failure, slippage, tension structural failure | ||
| CDF | 0.11 | Slippage, expansion structural failure, rarely in material failure | ||
© 2018 by the authors. Licensee MDPI, Basel, Switzerland. This article is an open access article distributed under the terms and conditions of the Creative Commons Attribution (CC BY) license (http://creativecommons.org/licenses/by/4.0/).
Share and Cite
MDPI and ACS Style
Xue, D.; Zhou, H.; Liu, J.; Zhou, J.; Liu, Y.; Zhao, Y.; Zhang, L. Experimental Research on the Structural Behavior of Fractured Coal under Uniaxial Compression. Energies 2018, 11, 2538. https://doi.org/10.3390/en11102538
AMA Style
Xue D, Zhou H, Liu J, Zhou J, Liu Y, Zhao Y, Zhang L. Experimental Research on the Structural Behavior of Fractured Coal under Uniaxial Compression. Energies. 2018; 11(10):2538. https://doi.org/10.3390/en11102538
Chicago/Turabian StyleXue, Dongjie, Hongwei Zhou, Jianfeng Liu, Jie Zhou, Yintong Liu, Yongwei Zhao, and Liao Zhang. 2018. "Experimental Research on the Structural Behavior of Fractured Coal under Uniaxial Compression" Energies 11, no. 10: 2538. https://doi.org/10.3390/en11102538
Note that from the first issue of 2016, this journal uses article numbers instead of page numbers. See further details here.