Renewable Energy Assisted Traffic Aware Cellular Base Station Energy Cooperation
by
Faran Ahmed
1, 
Muhammad Naeem
1,
Waleed Ejaz
2,*,
Muhammad Iqbal
1,
Alagan Anpalagan
2 and
Hyung Seok Kim
3,* 1
Department of Electrical Engineering, COMSATS Institute of Information Technology, Wah 47040, Pakistan
2
Department of Electrical and Computer Engineering, Ryerson University, Toronto, ON M5B 2K3, Canada
3
Department of Information and Communication Engineering, Sejong University, Seoul 05006, Korea
*
Authors to whom correspondence should be addressed.
Energies 2018, 11(1), 99; https://doi.org/10.3390/en11010099
Submission received: 6 November 2017
/
Revised: 27 December 2017
/
Accepted: 28 December 2017
/
Published: 2 January 2018
(This article belongs to the Section L: Energy Sources)
Abstract
:With global concern for climate change, and for cutting down the energy cost, especially in off grid areas, use of renewable energy has been gaining widespread attention in many areas including cellular communication. The base station (BS) has emerged as a strong candidate for the integration of renewable energy sources (RES), particularly solar and wind. The incorporation of renewable energy opens many possibilities for energy conservation through strategies such as energy cooperation between BSs during the off-peak hours, when the energy harvested from renewable energy sources may become surplus. In this paper, we present the case for cellular BSs enabled with renewable energy sources (RES) to have an arrangement in which the BS provide surplus energy to a neighboring BS, thus minimizing the use of conventional energy. A realistic objective is developed for northern region of Pakistan, which entails modeling of solar panels and wind-turbine according to the average solar irradiation and wind speed of the region. We also model the dynamic load of the BS, which depicts temporal fluctuations with traffic variations. Based on these models we initiate an energy cooperation scheme between the BS in which an energy cost minimization framework is mathematically modeled and solved through the interior point method algorithm. Results are obtained for different times of the year for different number of base stations showing respective energy cost savings.
1. Introduction
The phenomenal growth of information and communication technologies (ICTs) has led to an increased energy consumption and resultant greenhouse gas (GHGs) emissions. It is estimated that the global contribution of ICT industry towards CO emissions is approximately five percent but expected to grow as global demand for broadband services and computers rises. Amongst all its components, cellular communication is the fastest growing component of the ICT sector. A base station is the most energy consuming element in a cellular network and consumes up to 60% of the network’s energy [1,2]. Keeping the current trend, the global number of base stations (BSs) is expected to increase from present (2014) figure of 7.6 million to 11.2 million by year 2020 [1]. In consequence the annual power consumption of cellular BSs will also grow from 84 TWh to 98 TWh by 2020, with business as usual estimates.
The cellular BSs deployed in remote/rural areas resort to expensive diesel generators for meeting their energy needs. An alternate to these conventional energy sources, which are the main cause of harmful GHG emissions, are the renewable energy sources (RES) such as solar and wind energy, which are not only clean but also sustainable [2,3]. A number of feasibilities for RES enabled BS have been prepared using factual site data, as well as simulated data, to configure the size and capacity of wind turbines and photovoltaic (PV) panels [4,5,6,7]. These studies strongly recommend the use of RES enabled BS due to economical levelized cost and zero GHG emissions. In [8,9], authors provide a design and optimization framework for green energy enabled mobile networks to reduce the carbon footprint. Renewable energy assisted base station off-loading mechanism with multi-cell cooperation is investigated in [10]. A hybrid energy assisted green multi-cell cooperation is proposed in [11]. The authors propose a greedy decomposition heuristic to reduce grid energy consumption in multi-cell heterogeneous cellular networks. In [12], authors proposed a Markovian model to improve the interaction of a renewable energy assisted green wireless communication network for smart grid applications. A minimum cost solution for solar power assisted LTE macro base station is investigated in [13]. The authors apply CPLEX toolbox to get optimal solution. Modeling of base stations equipped with solar energy and storage units is shown in [14]. In [15], authors analyze the dimensioning of the solar PV panel and energy storage of a grid tied solar assisted hybrid base station. Based on traffic load, authors minimize the total capital and operational cost. In [16], the authors present adaptive algorithms for radio resource management based on traffic forecast in green cellular network. A sleep mode and traffic-based radio resource management scheme for cellular network is investigated in [17].
A BS is well suited for incorporating RES because power generation, storage batteries and the load are all located at one place with minimal transmission losses. Especially for remote sites that enjoy good sunshine and windy conditions, RES offer a good alternative to diesel generators, economically and environmentally. The advancement in technologies related to rechargeable batteries, maximum power point tracker and inverters etc. make it viable to design robust hybrid energy systems [18]. In [5], authors analyzed the feasibility of renewable energy assisted stand alone hybrid GSM BS with diesel generator as a backup. The authors state that a properly designed autonomous wind-solar hybrid system in good sunny and windy location pays off in two to four years, considering the operating and maintenance cost. For a stand alone BS, the solar and wind hybrid system can provide the optimal mix of renewable and non-renewable energy sources. The design of hybrid energy systems that harvest energy from renewable sources depend on different factors, which are:
- The amount of natural energy such as solar-irradiation and wind-speed available at site.
- The availability of conventional sources such as diesel generator and grid.
- The energy consumption of the system over a period of time.
- The energy storage capacity or the size of the battery bank.
A smart grid (SG) offers the inherent advantage of enabling energy cooperation and distributed generation of energy as demonstrated in [19], due to the bidirectional flow of energy and information. In conventional grids, a mechanism can be established whereby ‘net metering’ is incorporated for energy buy-back by utility. A number of on-line and off-line energy management schemes for networks in smart/conventional grid have been proposed in [20,21,22,23,24,25,26]. In [20], the authors investigate a number of real time energy management schemes. These schemes minimize the cost of a system with optimal scheduling of battery charging and optimal integration of renewable energy. In [22], authors investigate a centralized on-line algorithm for energy cooperation among different BSs. The authors show that with intelligent cooperation, the BSs can significantly reduce energy consumption from utility. In [27,28], authors presented grid tied renewable energy assisted energy consumption model for mixed-traffic cellular network. An overview of classification and optimization objectives for renewable energy assisted cellular network is highlighted in [29]. Energy cooperation between two BSs has been shown to improve overall power efficiency in both BSs, for RES enabled [23] as well as conventional [26] base stations. A methodology for on-line energy trading is proposed in [24], which investigates a data aware algorithm for on-line energy management, and decides about energy allocation for BS traffic and energy transfer in real time. The authors in [23] propose both online and off-line energy cooperation schemes, and their hybrid, to optimally utilize available energy based on the energy state information of the network. Their model considers bi-directional energy flow between BSs and uni-directional flow from BS to SG. In another two cell network model of cellular BSs, the direction and quantum of energy to be transferred is determined in order to maximize the sum-rate over all users in both cells [25]. In literature we also find application of game theoretic approach to optimize the allocation of resources in scenarios similar to energy cooperation in cellular base stations [30,31].
To the best of the knowledge of the authors, this is the first time in the literature that traffic aware renewable energy assisted BS cooperation is proposed, based on derived models of renewable energy systems (solar and wind). In the proposed framework, smart grid net metering concept is used that facilitates the local energy producer (BS) to sell the surplus energy to the utility. The proposed framework first trades/cooperates the energy between BSs and after satisfying the demand of each BS, the surplus energy is sold to utility. The proposed framework also takes care of the load shedding related issues. The main contributions of this work are:
- We propose a framework for energy cooperation between N number of green cellular BSs, equipped with different configurations of RES, as well as conventional sources of energy. The framework is very flexible and can accommodate different configurations.
- The energy cooperation scenario is based on realistic energy harvesting models and is yet not fixed. The wind turbine and the PV array is modeled for the northern region of Pakistan, considering the wind speed and solar irradiation data for Islamabad. The simulation shows the results of energy cooperation between our modeled green BS.
- A constrained optimization problem is formulated for energy cooperation. The proposed mathematical optimization is bi-linear and non-convex. We propose McCormick linear envelopes to reformulate the bi-linear non-convex problem as a linear optimization problem. The linear optimization problem is then solved with interior point method.
The rest of the paper is organized as follows. In Section 2, calculations for daily BS energy consumption, and sizing of the PV panels and wind turbine is carried out. Section 3 describes the problem formulation and solution approach and finally the simulation/ results are discussed in Section 4. The paper is concluded in Section 5.
2. System Model
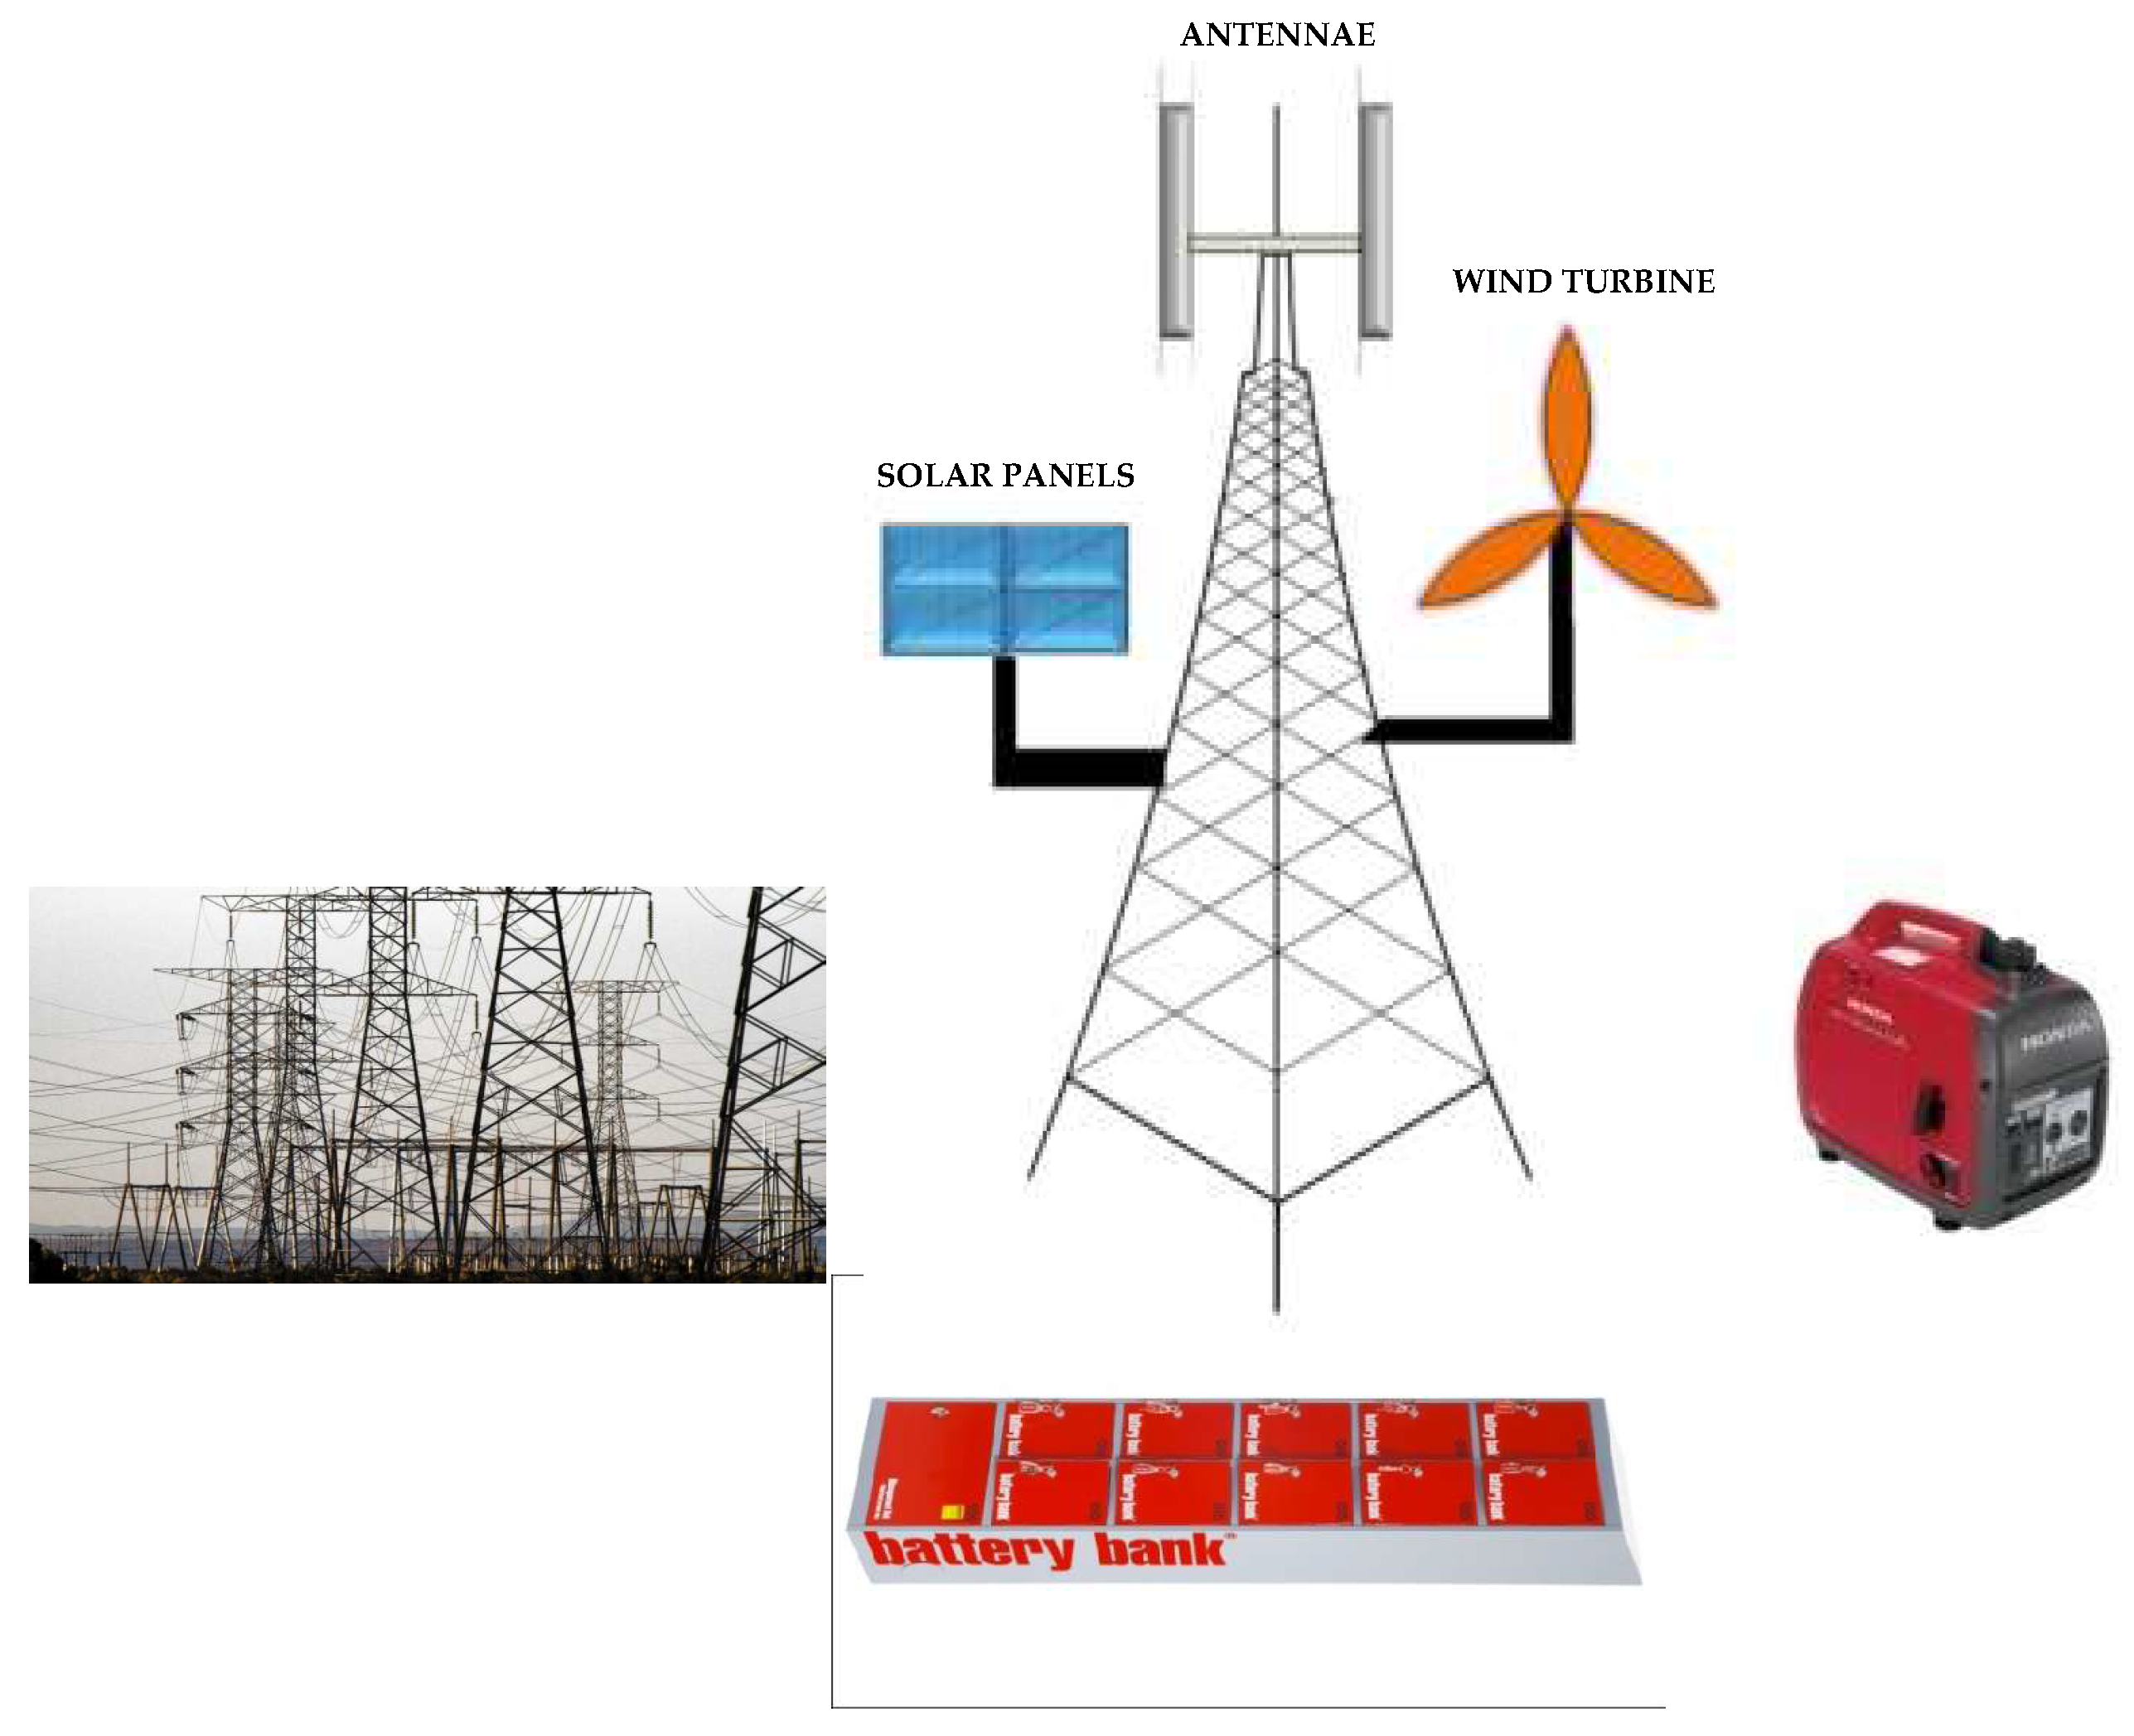
We consider N LTE macro BSs, known as eNBs, powered with conventional as well as renewable energy sources, collocated and operated by different network operators, as shown in Figure 1. We also consider unavailability of utility for long hours due to load shedding, thereby relying on on-site sources such as diesel generator (DG) most of the time. Due to the uncertain nature of the renewable energy sources, power is regulated through a battery bank. In order to ascertain the appropriate size of sources, the foremost requirement is to ascertain the power consumption of the BS. Accordingly, the battery bank capacity is estimated, and the number of solar panels and size of turbine is calculated. There is a possibility that one cannot install required number of solar panels or wind turbines due to limited space allocated for a BS site.
2.1. Energy Consumption Model of a BS
New LTE base stations (eNBs) require relatively less energy than their predecessors [32]. The tri-sectoral BS can cover an area of about 0.66 km having a range of 500 m. In suburban/rural areas this coverage may grow to 7.8 km [19]. The power required is typically few kilo Watts that varies with BS types. The EARTH project has quantified the power consumption of different types of BSs [32] such as macro, micro, pico and femto. According to EARTH report, the power consumption of a BS is on account of power consumed by the power amplifier (PA), the radio frequency (RF) module and the baseband (BB) unit as well as the losses incurred in feeder, DC power supplies, mains and cooling. A BS’ power consumption grows proportionally with the number of transceiver chains , and may be expressed by the following expression.
where is the power consumption of the power amplifier, which is equal to the ratio of power out of the antenna feeder to PA efficiency plus feeder loss (). At maximum load, the LTE power consumption is shown to be 1350 W for three sectoral coverage each having two transceivers in MIMO configuration. The power consumption figures for various types of cellular BSs are shown in Table 1. The power consumption for each element of a single transceiver chain is depicted against each BS type. The power consumption incurred in DC-DC power supply, cooling and mains is shown as a percentage of overall power consumption. The last column shows the total power consumption, which is equal to power consumption of a single transceiver chain times the total number of transceivers.
The power consumption of a BS is described in terms of ’static’ and ’dynamic’ power consumption. The latter varies with traffic-load and the number of transceivers deployed, while the former remains fixed. The EARTH report also gives useful insight into the dynamic and static power consumption of a BS. Given the fact that power amplifier consumes fifty five to sixty percent of the total power, and that this consumption increases linearly with traffic, the total power consumption will, therefore, increases or decreases with traffic. The BS power consumption , as a function of traffic-load/transceivers, is given as:
where maximum number of transceivers can be six (3 × 2), and is the slope of the load dependent power consumption given as 4.7 in the said report. is the static power and is the dynamic power, which fluctuates between 0 and . For given as 20 W per transceiver, we can thus find the maximum value of to be 1344 W at full traffic load and minimum of 780 W for no traffic. We may add another 1 kW to these figures for air conditioner, given the hot climate of the region. The BS power consumption, therefore, fluctuates between 2.35 kW for maximum load and 1.8 kW at no traffic load. These basic estimates provide the figures for energy consumption assessment for a cellular BS. With a BS load figure of 2.35 kW, the daily energy consumption is approximately 56 kWh for our model.
2.2. Spatial and Temporal Load Variations
The traffic load associated with a BS can be modeled for any given area having population . The number of network operators in the area may be given as . Then the number of subscribers available to a BS is proportional to the population and the number of operators in that area i.e., . Ideally every network operator should get equal share, but realistically the share is unequally distributed, with some having more subscribers than others, which results in spatial load variations.
The power consumption of a BS (), estimated above, comprises of two types of power consumptions as stated above. The static power consumption, independent of the traffic load, is on account of baseband unit and other components, whereas, the dynamic power consumption is related to the traffic load that increases linearly with the allocation of resource blocks to active traffic, which keeps varying throughout the day. This temporal variation in load forms the basis of our energy cooperation model. One BS with lean traffic at any instant may have surplus harvested energy that can be given to a BS having higher traffic and thus more load.
2.3. Modeling Energy Sources for Powering a BS
To power the BS with RES, we need to know the daily average energy consumption of the BS. Based on this requirement, and the yield of solar and wind energy at site, we can decide on the size of PV array and wind turbine (WT) to be installed. The power consumption of a BS is met from on site energy sources, and our preference is to use the harvested energy as much as possible, which is stored in a battery bank for a regulated supply. In case the harvested energy is not enough to charge the batteries to their required level, the power is provided from utility or a stand-by diesel generator. On the other hand, if batteries are fully charged and harvested energy is surplus, we may share this energy with a neighboring BS. An energy management unit with the proposed algorithm performs this function of monitoring and balancing the energy sources.
2.3.1. Modeling Solar Energy
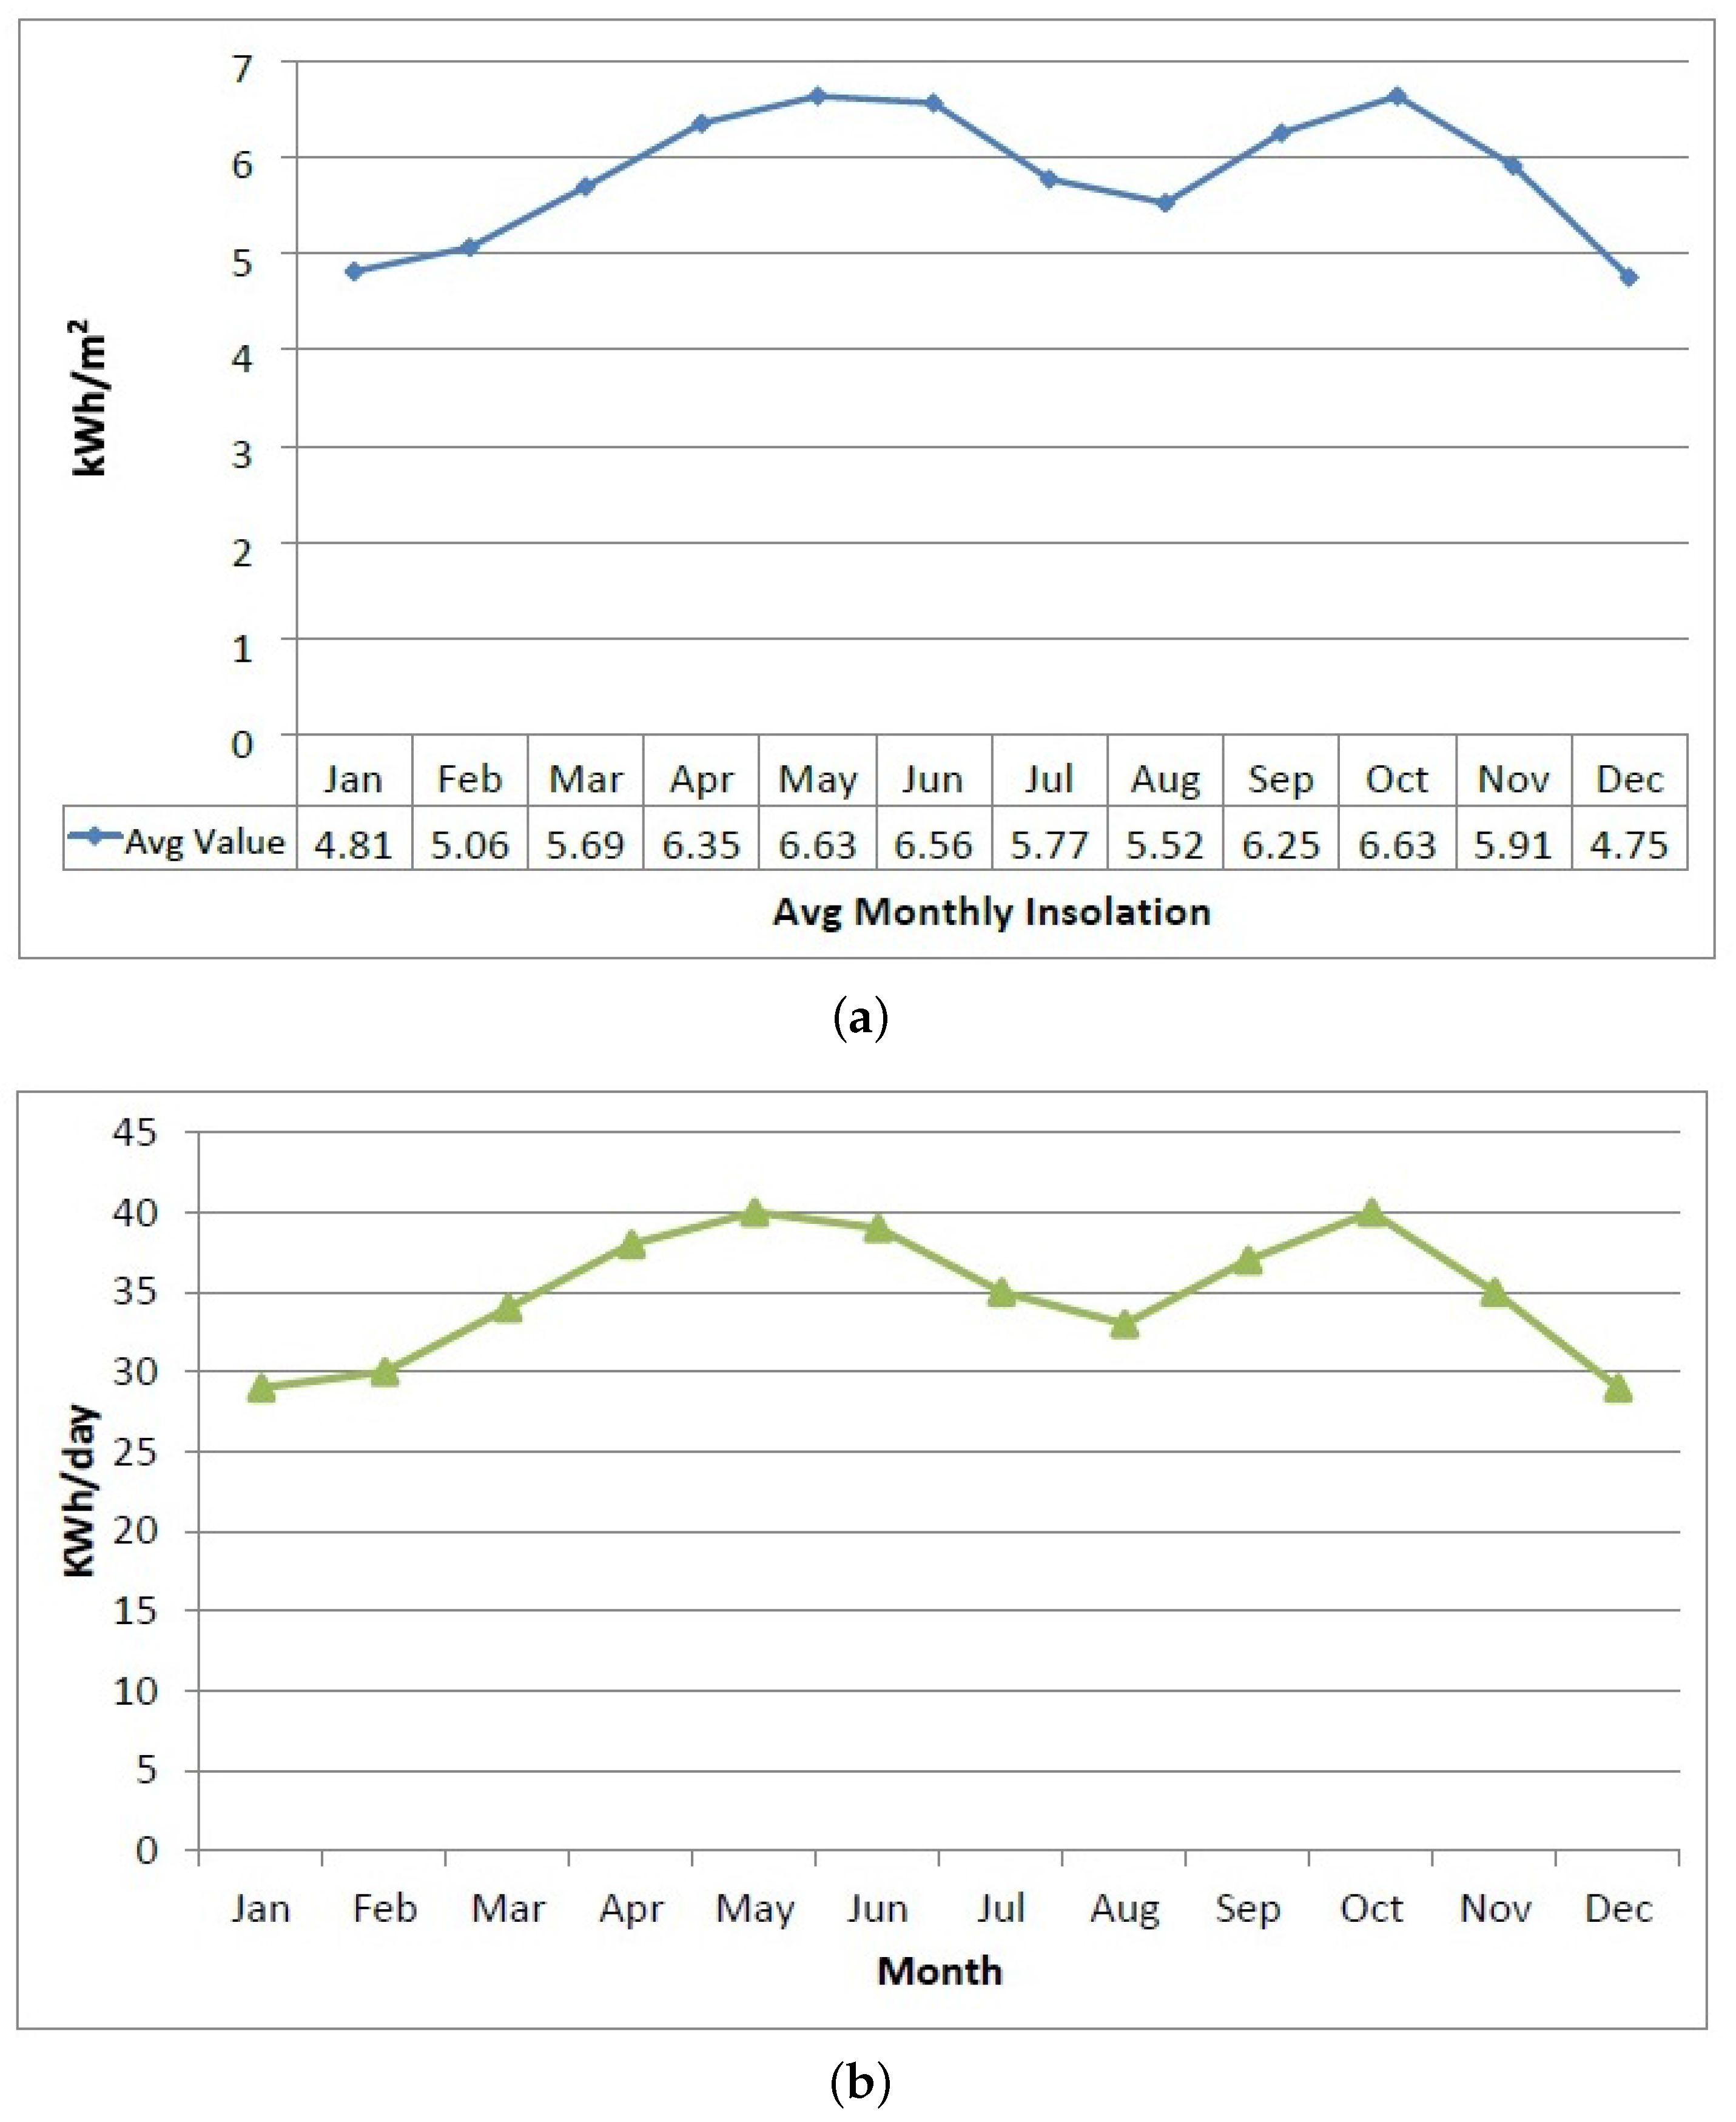
The solar insolation data for Islamabad is shown in Figure 2a. The average daily insolation for each month is shown in kWh/m. In Pakistan, it is lowest in the month of December (4.79 kWh/m) and maximum in the month of May (6.63 kWh/m). As an approximation, the PV panel size of 5 m provides for 1 kW of energy, which translates to a PV array of 50 m for 10 kW of energy [34,35]. The total electrical energy produced for a day, by the solar panels of certain size, is a function of (i) daily solar insolation (I), given in kWh/m per day; (ii) area of the panels (A) in m; (iii) photovoltaic (PV) module efficiency or solar yield (); and (iv) the performance ratio or coefficient for losses (taken as 0.75). The electrical energy generated in kWh from PV modules is then given by the following formula [34].
where is in kW and the solar yield is given as the ratio of power (in kW) and the area (in m) of the panel, which is 0.26/1.63 in our case i.e., 0.16 . Thus for an average daily insolation of 4.79 kWh/m per day in December, the electrical energy yield of a 50 m panel comes out to be 29 kWh per day approximately. Whereas, for the month of May this figure is 40 kWh per day. The average daily energy available from the stated panel size is shown for each month, for Islamabad, in Figure 2b, which can be seen to be ranging between 30 to 40 kWh per day, approximately. Thus, given the size of one panel as 1.63 m the total number of panels required is 30 (connected in series parallel) to cover 50 m. With 260 W power out put (24 V nominal voltage), a total wattage of 7.8 kW peak and 5.85 KW () nominal is available.
The minimum solar energy yield is 29 kWh per day in the month of December. In order to power the above stated load of 56 kWh with solar panels only, we need to almost double the size of solar panels, so that enough power is generated to charge the batteries fully and subsequently power the BS. However, instead of making the panels unreasonably large, we can also make use of a wind turbine. A WT will be a good addition because it is also a clean source of energy and available at night, unlike solar. However, wind is more unpredictable than solar energy.
2.3.2. Modeling of Wind Energy
There are multiple wind corridors in Pakistan where one can install a BS with wind turbines. Although wind energy is available throughout the day, unlike solar energy, wind speed can be highly uncertain. There are different methods of calculating the annual energy output of a wind turbine, such as (i) swept area method (ii) manufacturers estimates (iii) and power curve method. The wind turbine is described by its power curve showing output power vs wind speed [34]. Other factors describing a wind turbine are peak power (e.g., 1800 W) and rated power (e.g., 1000 W), which is given at a rated wind speed (e.g., 8 m/s), and rated turbine speed in RPM. The problem however is that a wind turbine operates at the rated power for a low percentile due to large variations in wind speed. Wind is empirically known to follow a Weibull probability distribution. The wind speed probability distribution is given by the spread of Weibull curve given by its shape parameter k, and the average wind speed. Figure 3 shows the energy data for Islamabad region while Figure 4 shows the combined average daily yield of the 7.8 kW PV panels and 7.5 kW wind turbine at BS site for Islamabad.
The Weibull distribution of wind for the Islamabad region of Pakistan having an average yearly wind speed of 5 m/s with the shape parameter k equal to 1.80 is shown in Figure 3a [37]. Based on this probability distribution, we can generate hourly wind generation for a day. Consequently, we can have the electrical energy available on an hourly basis from a wind turbine of our choice. The electrical energy generated by a wind turbine is primarily determined by the area A, in m, swept by its blades. Other factors are wind speed v, air density and turbine efficiency coefficient . The generated energy is given as [5]:
According to the above Equation (4), adjusted by the manufacturer of the turbine (BWC-Excel-R/48), the average power output of the wind turbine, for an average wind velocity of 5 m/s, a site elevation of 500 m with shape parameter k of 1.8, comes out to be 1.71 kW, and daily energy output of 41 kWh. This figure goes up to 66 kWh daily if the average wind speed increases to 7 m/s. Thus we get lot of power variation for the same wind turbine with variation in wind speed. Based on the average monthly wind data for Islamabad, and other parameters for our site area, the daily average energy output for all months is shown in Figure 3b.
2.3.3. Battery Bank
A battery bank is invariably used with communication systems to ensure 100% reliability of the system. Ideally, one would like to have a battery bank large enough to power the BS for considerable time/hours in case of power outage. The size of the battery bank is a function of two main factors; how much is the load? and, how long do you want to power it? Thus for a given load (2.35 kWs in our case) the size will depend on how long we want the backup. Of course, the longer the battery backup, the larger the size and higher the cost. Other than cost, housing is also an issue in confined places like a cellular base station. Another important aspect to note is that it would take longer to charge a larger bank then a smaller one. These factors determine the impact that size would have on the system and therefore have to be kept in mind while sizing the battery bank.
Based on the calculations made in Section 2.1, the maximum energy consumption figure for the a macro BS is approximately 56 kWh daily [33]. Considering a 48 V DC system powering the system, the size requirement for the battery bank is 56 kWh/48 V = 1175 Ah. However, the batteries are not to be discharged below 50% of their maximum state of charge to preserve their life. Therefore, the battery bank should have double the capacity or 2350 ampere hour (Ah) to power the BS for 24 h. The main consideration in prolonging the battery life is to safeguard it from over charging and over discharging. If discharged below a certain level, its life deteriorates fast. As a rule of thumb, it is considered that a battery may not be discharged below 50% of its capacity. Thus 50% is the limit selected in this paper for the depth of discharge, after which it should start charging. Different types of batteries are evolving, however, we consider lead-acid battery, which is widely used and cheaply available in developing countries like Pakistan. The lifetime of a battery depends upon its charging/discharging cycles and is different for different types of batteries. It is reasonable to have a standby power for 12 h, thus our load can be halved back to 1175 Ah. In order to generate this much backup capacity for a BS, we require a total of quantity 24 (8 × 3) 6 V/390 Ah batteries connected in series parallel configuration i.e., three parallel sets of eight batteries connected in series for 48 V output. The combined output of such a battery bank would be 48 V × 1170 Ah or 56 kWh per day. The energy flow w.r.t batteries state of charge (SOC) can be investigated for different cases such as (i) fully charged (ii) below threshold and (iii) in-between threshold and full capacity. We are not modeling the various states of battery bank here and assume a simple linear input-output relationship between harvested energy and battery back-up capacity. That means when harvested energy is more than the BS load it is considered surplus.
In good windy and sunny conditions, a battery bank would be amply recharged to provide regulated power to the BS. However, in night time, with no wind, the battery would start depleting. We have restricted backup to 12 h, because as the size of the bank increases so does the cost. In our model, a total of 24 batteries in series-parallel combination is considered () each of 6 volts and 250 Ah to cater for the load of 56 kWh. Depending on the site—we have an average wind of 5 m/s, which is sufficient to run the wind turbine—total outage of renewable sources should not prevail for long. Therefore, 12 h backup is considered. If the outage is more, a standby diesel generator would be turned on.
3. Problem Formulation and Solution Approach
We consider an area serviced by N different cellular BSs, with uniform distribution of subscribers. The BSs are interconnected through the local grid station, which enables energy flow from one BS to other. Each BS has its own traffic profile described by the user activity that varies from its neighboring BS. Other than the conventional source of utility and a diesel generator, a solar panel array and a wind turbine is installed at some sites to power the BS with clean and green energy. The BSs can also sell back surplus energy to the utility through net metering. The key elements of our system model are the following.
- Energy harvesting BSs through solar and wind energy.
- A battery bank to store energy being harvested from the RES.
- Inter-connectivity between the BSs through micro grid/smart grid.
- Central controller at grid station for enabling energy transfer.
- Net metering for energy buy back by the utility.
3.1. Traffic Pattern Based BS Load
In order to know the fluctuations in the load or power consumption of a BS, we need to determine its traffic profile. It was discussed in Section 2.1 that the instantaneous power consumption of a BS is directly proportional to its traffic. The variation in power consumption of is defined by in Equation (2) indicating the dynamic part of . Consequently, the energy consumption of a BS keeps varying according to the temporal fluctuations in the user traffic. The traffic pattern is, therefore, determined by (i) the minimum and maximum values of and (ii) the peak and lean traffic hours. Using these values, we can generate the sinusoidal curve representing traffic of a BS as per the expression described in [39], as follows:
where and are the maximum and minimum traffic loads of a BS, which in our case have been computed in Section 2.1. As per those estimates, = 2.35 kW and = 1.78 kW. is the hight of the sinusoidal traffic wave and is the DC offset. t is the present time slot and is the peak traffic hour time slot. T is the finite period or total number of time slots, which is equal to 24 in this case. Consequently, we approximate traffic pattern for the BSs deployed in a particular region based on the variables described above. The twenty four hour traffic profile of different locations is shown in Figure 5, which has been generated by using Equation (5) for six different sites.
The cellular BS is designed to handle peak traffic that occurs at a particular time of the day, depending on area. There is also a corresponding lean time with least traffic load and in between the traffic load is either decreasing or increasing. Thus it is appropriate to model traffic load as sinusoidal variation. The BS traffic profile generated on the basis of empirical data in [40] also shows the same and is very close to our traffic load pattern in Figure 5 . Furthermore, since the Poisson model is the most widely used model to describe the user traffic arrival in cellular base stations [33,41], we apply Poisson probability distribution to the basic pattern generated above to have varying patterns for different BSs. is Poisson distributed traffic with mean . The energy consumption profile varies with user traffic throughout the day between the following two states of energy consumption—i.e., high activity state during peak hours of the day, consuming maximum energy and low activity state during off-peak hours, having surplus energy.
The power consumption of a BS, shown here in terms of its traffic-load, varies throughout the day. Similarly, the power generated by the installed RES such as wind-turbine and PV-panels also varies throughout the day as the intensity of wind and solar energy varies. Consequently, we can have a traffic-load profile and a power-generation profile for every BS, which may vary form BS to BS. These profiles are generated for a finite horizon time period, which can be a day, a week or any fixed period. The above stated scenario builds up the possibility where one BS may be having surplus harvested energy, whereas another BS is deficient in same. This provides an opportunity of energy sharing between the base stations that we call ‘energy cooperation’. Energy cooperation between renewable energy harvesting BS is mathematically modeled in the next section and is shown to result in energy cost savings in the network through our proposed model. The maximization of renewable energy usage leads to reduction of harmful GHG emissions.
3.2. Problem Statement and Linear Transformation
Our objective is to minimize the energy cost of the network through energy cooperation between BSs as well as to maximize the use of green energy. Tariff for renewable and non-renewable sources is assigned by the operators, which gives us the basis for cost analysis and energy buying/selling. While assigning tariff to different sources arbitrarily only one condition is maintained that tariff of non-renewable sources is higher than the tariff of RES, i.e., . This gives the incentive for a BS to borrow cheaper energy form another BS rather than turning on the expensive generator. The energy cost minimization optimization problem with energy cooperation is stated as follows:
Given:
- The total number of BSs in the network.
- The 24 h traffic profile of each BS.
- The 24 h energy generation profile of each BS.
- The total energy cost of the network.
Determine for each time period t of a time horizon T = 24 h:
- The energy surplus, if any, in time slot t, at a BS.
- The energy deficiency of harvested energy at a BS.
- The amount of energy to be transferred from BS n to BS m.
- The net cost savings due to energy cooperation.
Mathematically, for each BS the objective is to minimize the energy procurement cost while maximizing the energy sold cost, as depicted in the following expression.
where are the nth BS electricity generated from renewable energy sources, from diesel generator, electricity purchased from utility, electricity sell back to the utility, electricity purchased from the mth BS and electricity sell to the mth BS respectively.
The mathematical formulation of the problem can be written as follows:
where is the load of the nth BS at the tth time slot. shows energy flow from BS m to n in slot t.
The first and second constraints are box constraints. The constraint states that a BS can either sell energy or buy it at any given time slot. The fourth constraint gives the energy balance equation for energy available and energy consumed or given out at BS n. The fifth constraint states that a BS cannot sell energy to itself. The problem in (7) is a non-convex bi-linear problem due to constraint C3. In this paper, we reformulate the problem (7) as linear optimization problem using McCormick envelopes. Constraint C3 from (7) is the bi-linear function for energy. Function in the form is a simple bi-linear function. constraint C3 as a bi-linear function is written as = . For bi-linear products that can be positive or negative, McCormick envelopes are commonly used in research for convex relaxation [42]. C3 is the positive bi-linear product and its McCormick envelopes can be written as:
where and are the lower and upper bounds of energy flow from BS m to n and vice versa, respectively, and is convex envelope coefficient. Now the problem has become a linear problem that can be solved using simplex or interior point method [43]. and are the lower and upper bounds of energy flow from BS m to n and vice versa respectively, and is convex envelope coefficient. In a similar way, we can write the McCormick envelope of constraint C4. The linear programming transformation over convex polyhedron using McCormick envelopes can be efficiently solved using average scale linear programming interior point solvers with guaranteed convergence [43].
4. Simulation and Results
In this section, we provide simulation results for energy cooperation among six BSs. First the traffic-load profiles of all the BS are determined using Equation (5), which depicts the instantaneous energy demand of each BS. Then we simulate the energy generated at each BS from its own RES (solar + wind). Finally, based on the ’traffic-load’ versus ’energy harvested’ profiles, the overall energy cooperation, i.e., energy buying/selling between the BSs and between BS and utility is determined by our proposed algorithm. The energy demand and generation graphs as well as the results of energy cooperation are described in the proceeding paragraphs. There are thus three parameters that determine the energy state of a BS at any given time.
- The instantaneous user/data traffic of the BS.
- The radio system (transceivers) configuration of the BS.
- The power generation (solar/wind) capacity at the RES.
As discussed earlier, the energy demand at a BS at any given time t is directly proportional to the user traffic. The traffic arrival at a BS is given by Poisson distribution and varies from each other due to their spatial diversity e.g. city center, residential complex and university campus etc and the number of subscribers. Using an appropriate value for the peak time , we can generate different traffic profiles for each of the BS via (5). Using these parameters and a predetermined static load for every BS, the dynamic load for each of the six BSs is shown in Figure 5.
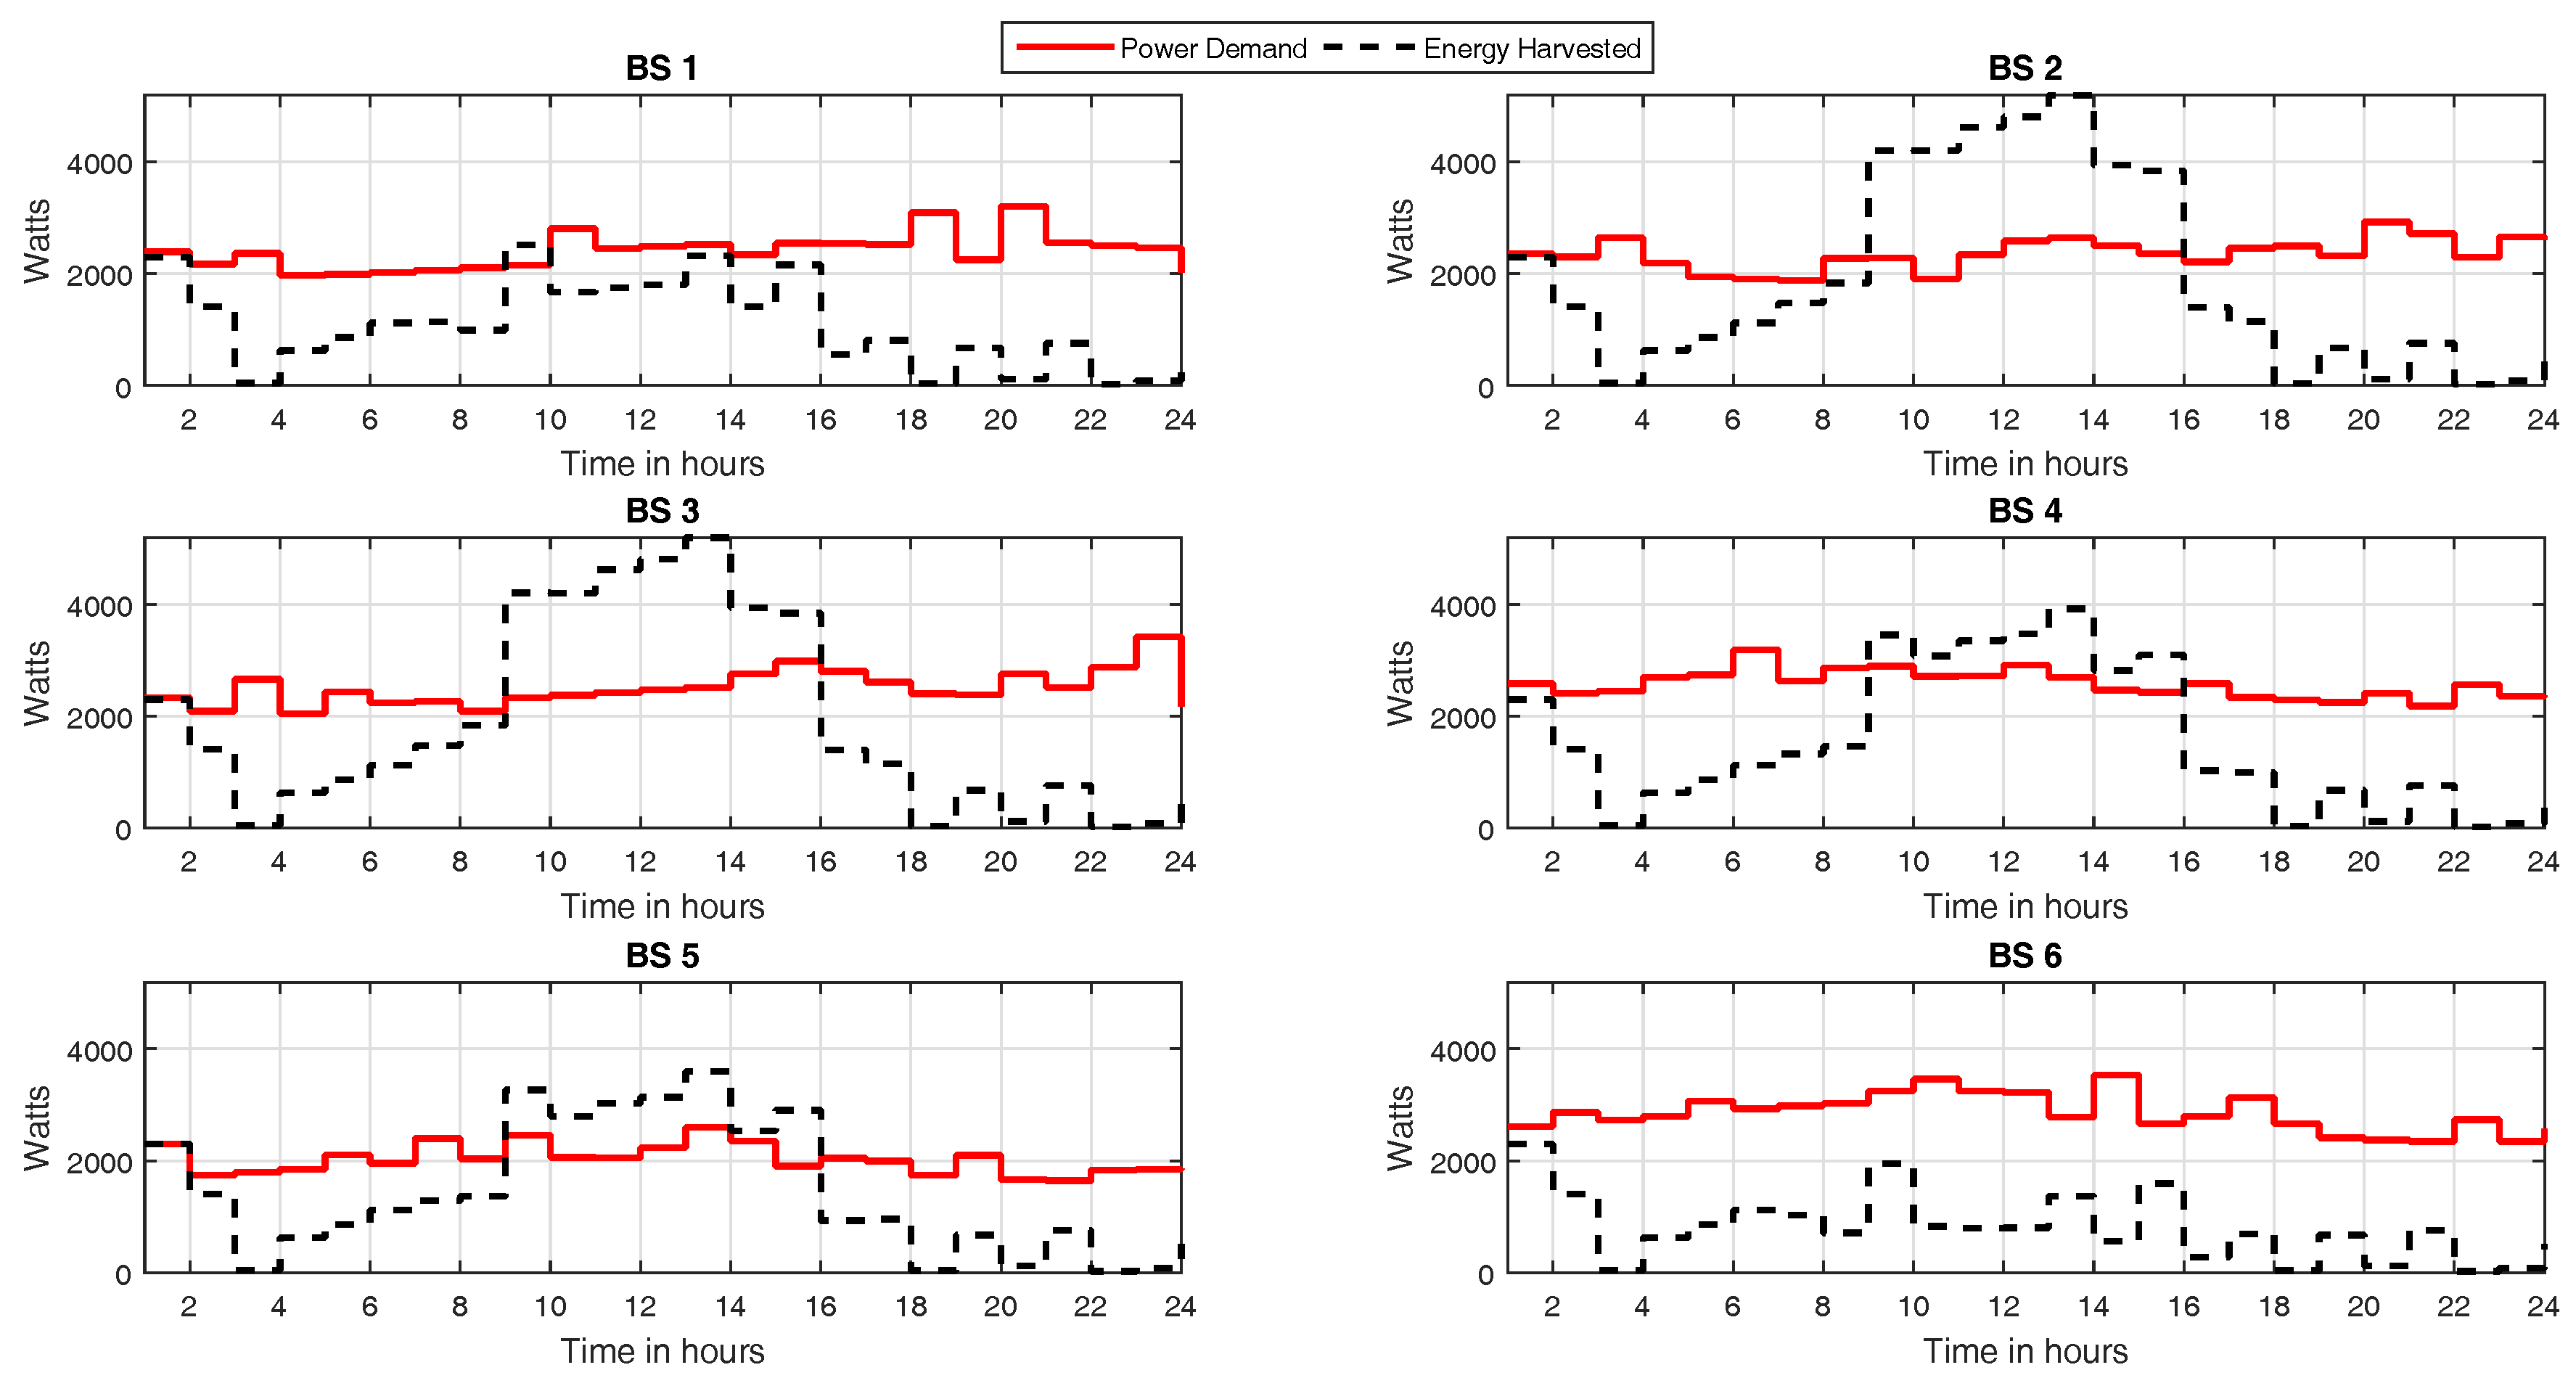
The solar and wind energy generated may vary for all BSs since the size of WT and PV-panels varies. We generated the values for 24 h harvested energy from both solar and wind for each of the BS as depicted in Figure 6. The 24 h time slot covers the whole day which provides cyclic repetition of parameters. The hourly slot is considered mainly because it is small enough to capture the variations in traffic as well as energy, in sufficient detail, and large enough to make the computations easy. Further amplification of time can be done, e.g., every minute or every 5 min. However, that would not make any special bearing on result as prime focus of the paper is on energy cost saving through energy cooperation by sharing the surplus energy, which is effectively shown in the results. The variation in wind energy generation is given by the Weibull distribution and the total hourly generation is shown in the said figure. Due to the combined yield in daylight hours, the generation is relatively more in day time. Separate generation figures for each month can be shown but the paper concerns primarily with the energy cooperation scenario for RES enabled BS.
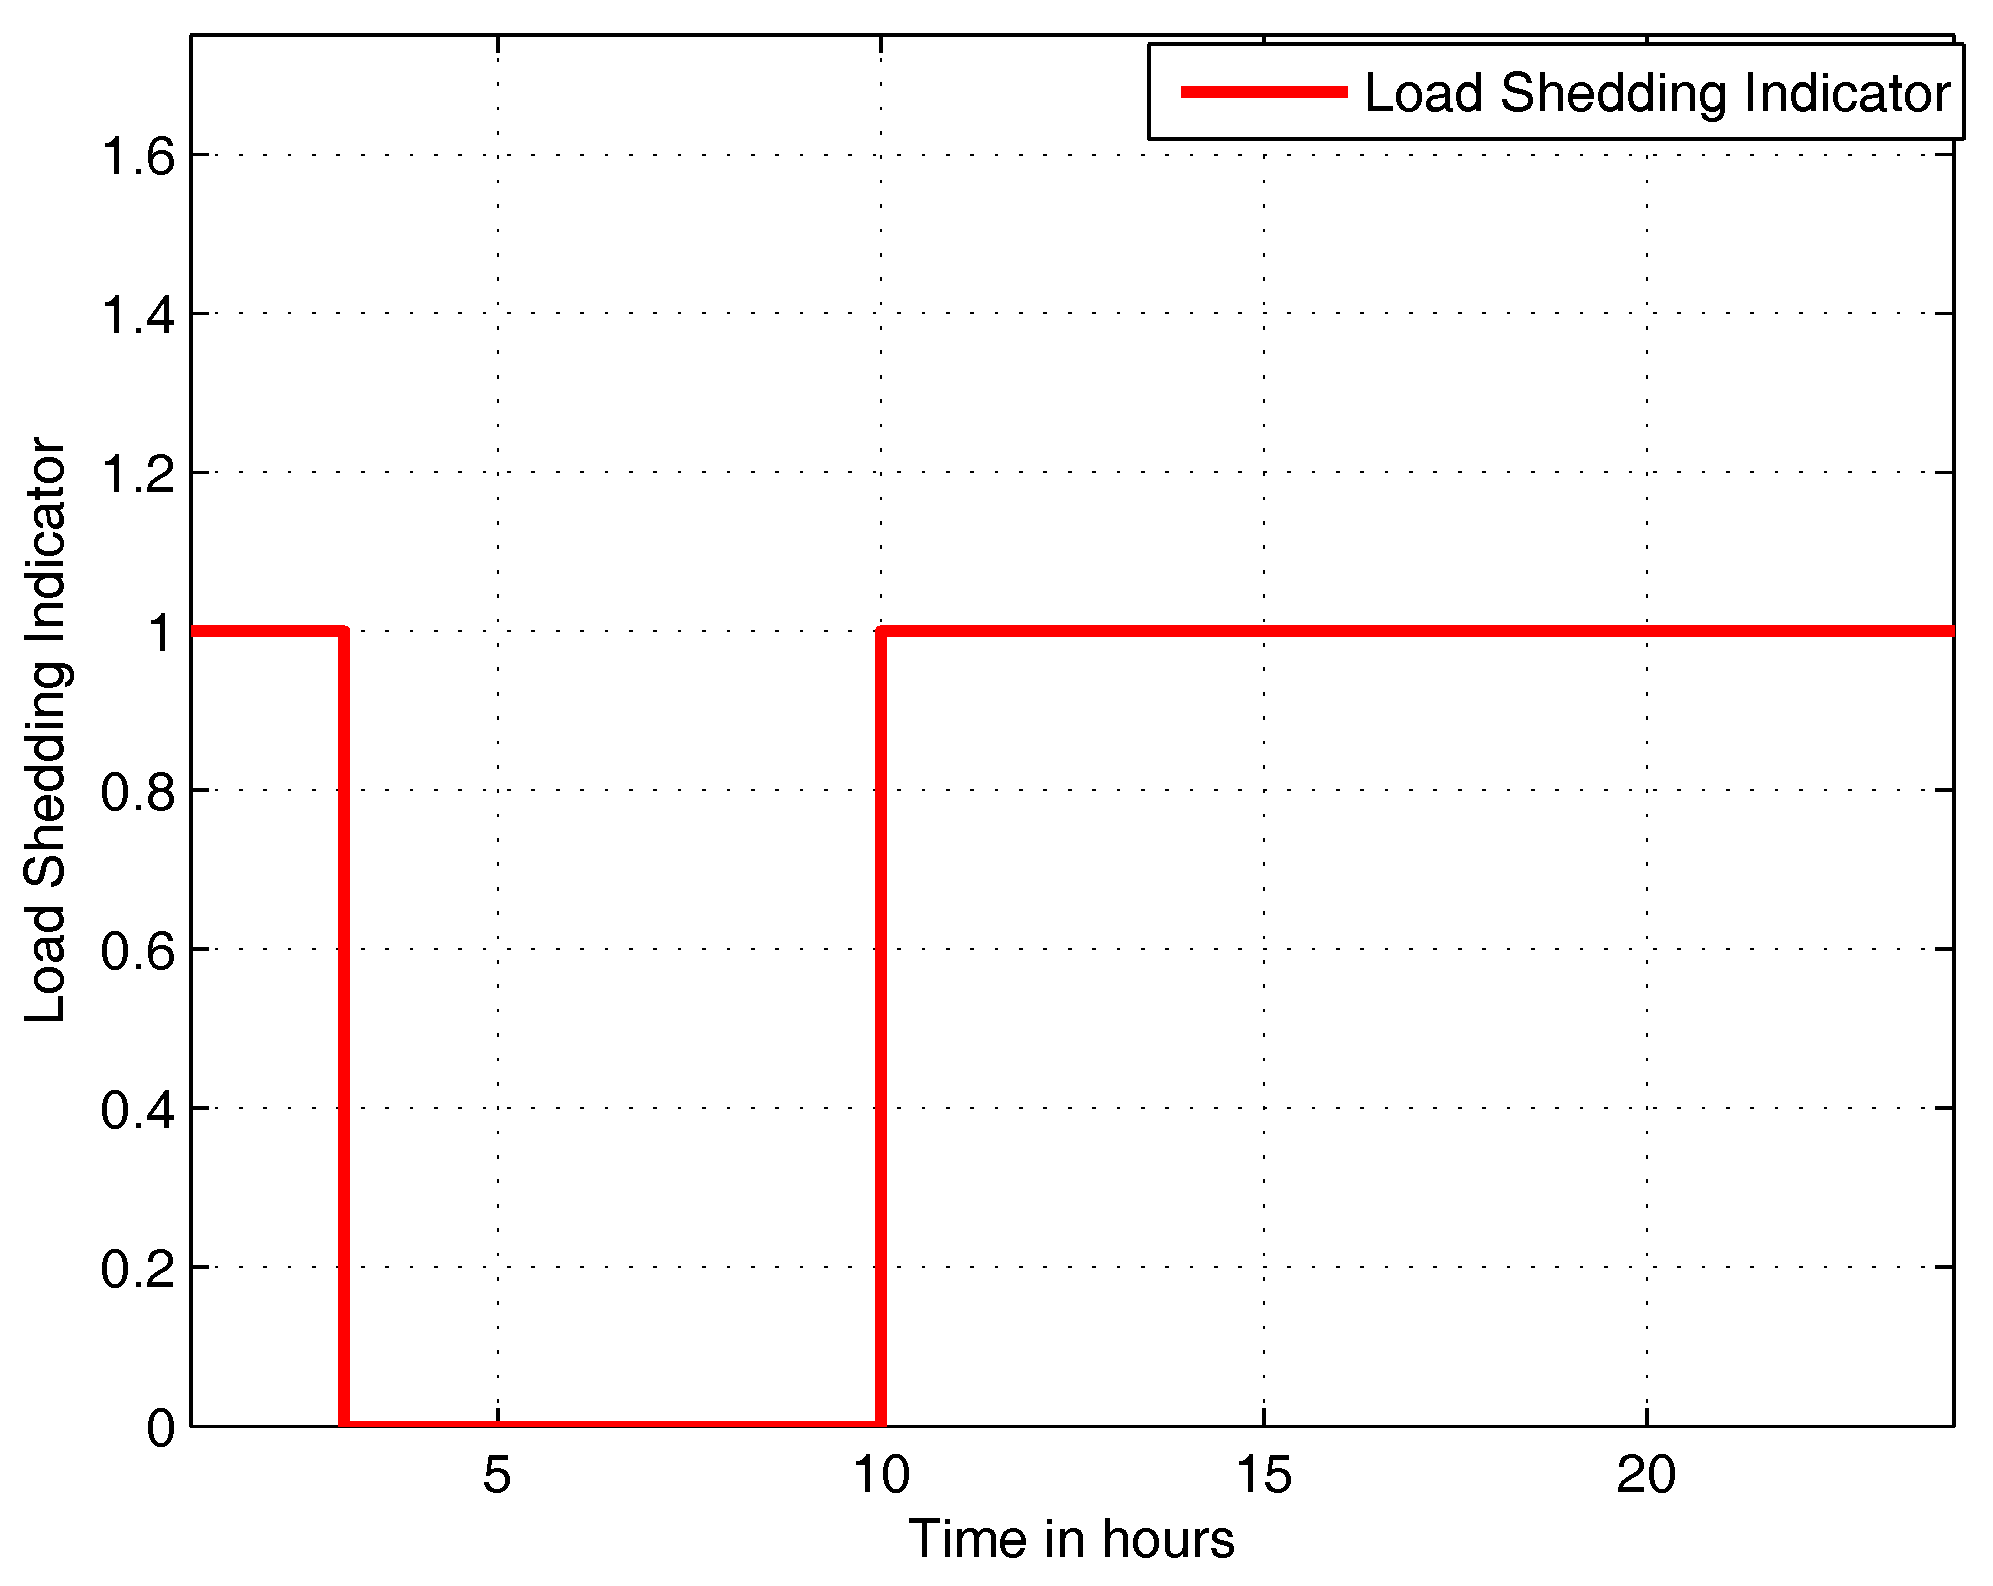
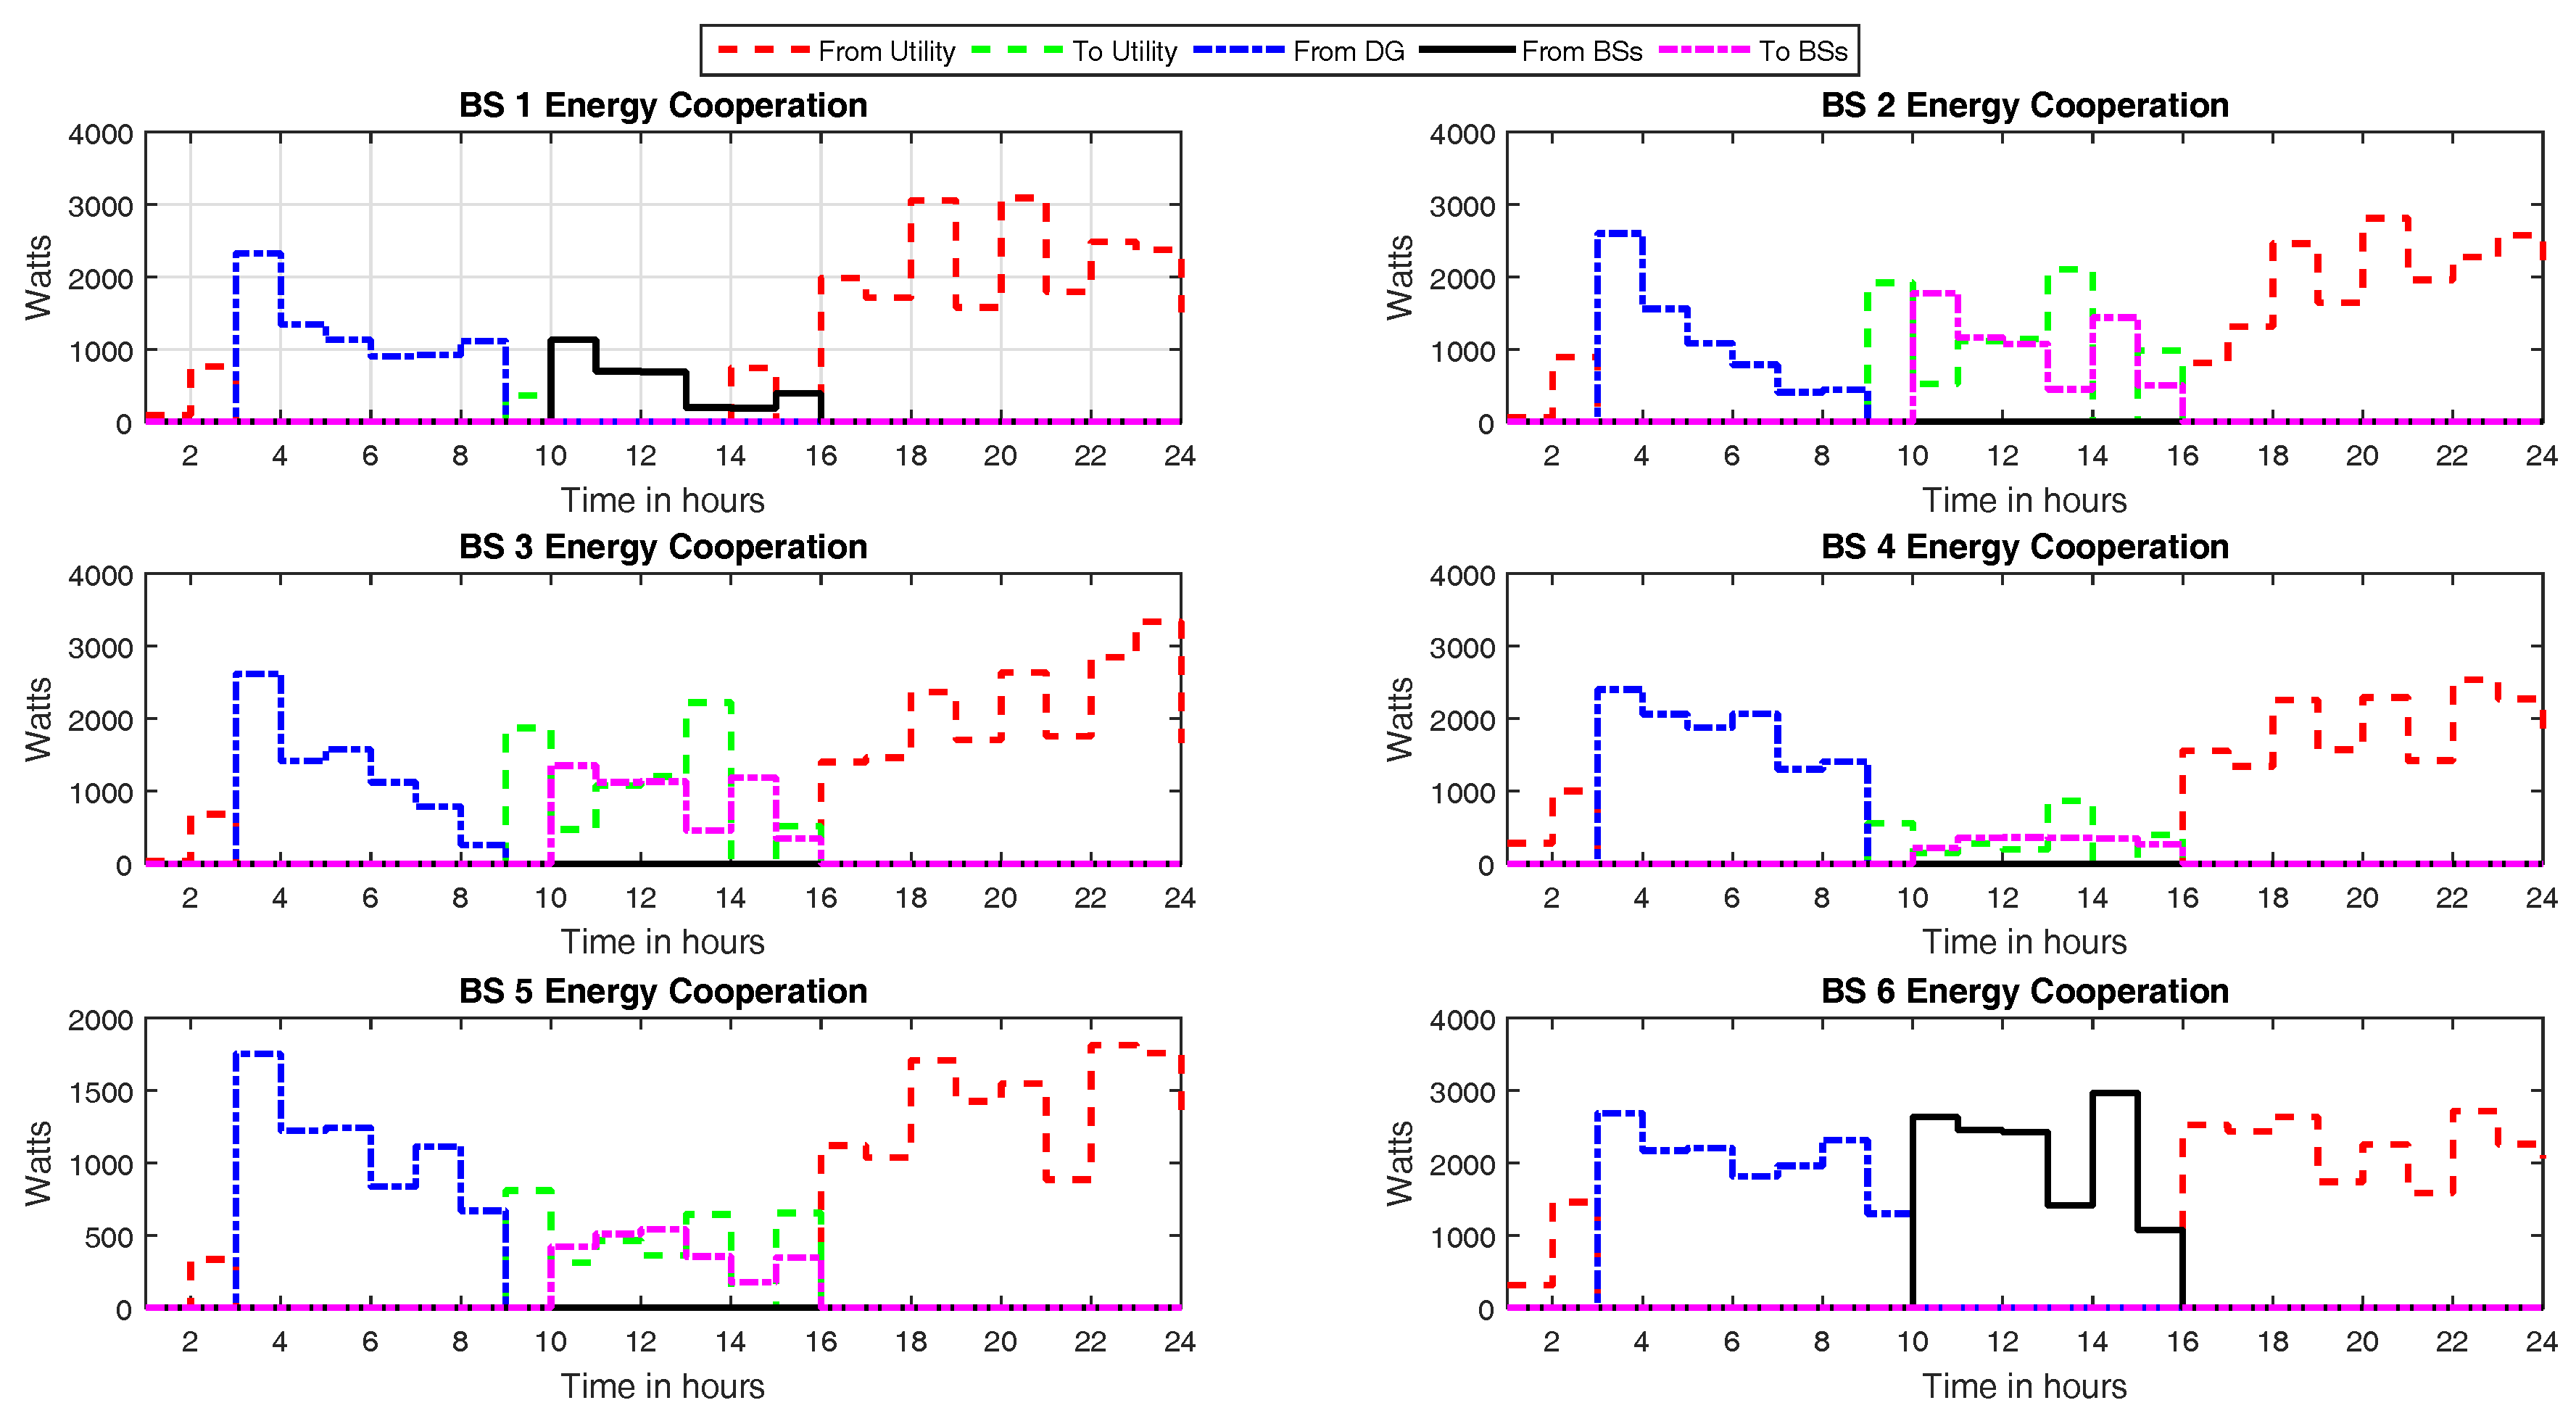
Given the electricity tariff for each BS, the traffic-load profile and the RES generation profile of a BS (Figure 6), the algorithm finds the quantum and direction of energy exchange that can take place between the nodes. When a BS is unable to meet its energy demand from own its RES or from a neighboring BS, the deficiency is met from a non-renewable source. We have also incorporated considerable load shedding, as shown in Figure 7. When the level is ‘0’, it means grid outage or load-shedding, and when it is ‘1’, it means grid power is available. During these electricity outage hours the BSs are allowed to sell their surplus energy to utility through net metering. The difference in energy consumption level and the harvested energy level leads to scenarios where a BS is able to purchase/sell energy from/to a neighboring BS. Based on the instantaneous energy state of each BS i.e., its load and generation, shown in Figure 6, the net energy purchased/sold by each BS, through our energy cooperation model, is depicted in Figure 8. Each BS is shown as selling-off or purchasing energy in accordance with its own state. The DG is only employed when no energy is available either from any of the RES and utility. The net cost savings are taken where the BS is able to generate energy from own green sources or borrow it from a neighbor BS, minimizing the usage of utility.
Impact of Energy Cooperation Model
To analyze the impact of base station energy cooperation, we generated Poisson distributed traffic scenarios for base stations and applied the Monte Carlo simulation technique. Traffic instances on each base station are generated randomly using Poisson distribution. The base station’s dynamic load depends on the traffic. We use Pakistan’s capital Islamabad area’s average data of wind speed and solar insolation for analysis as discussed in Section 2. The results are simulated for two scenarios, (a) with base station energy cooperation as mentioned in (7) and (b) without base station energy cooperation as mentioned in (9) below. The comparison of these two scenarios, one with cooperation and other without cooperation, allows us to estimate the net energy savings, and thus know the impact of our model. When there is no cooperation, all energy over and above the harvested energy is met from utility or generator. However, under cooperation, the surplus harvested energy at any BS is used before utility/generator due to the cheaper cost assigned to RES. We have assigned a tariff of 2.5 cents/kWh for RES, 4 cents/kWh for utility and 6 cents/kWh for generator. Thus, network energy cost is saved when green energy is shared between the BSs and use of utility is minimized.
where
The results are presented in Table 2. The results analyze energy cost savings of a network comprising {4, 8, 12, 16} BS, respectively, for every month. In each case, the average daily cost is presented with non-cooperation scenario followed by energy cooperation scenario. In all cases, it can be seen that the energy cost is more in former scheme and less in the latter scheme. This is because under non-cooperation, utility (which is more expensive than RES) is the only alternative available if harvested energy is not enough. Whereas, under energy-cooperation, the surplus harvested energy from another BS is procured, if available, which is cheaper than the utility. Consequently, the energy mix determines the energy cost of the network, which is determined by the cost of each energy type and defined below for the two scenarios:
- Non-cooperation scenario: Own harvested energy (cheaper) plus utility (expensive), with generator as standby.
- Energy-cooperation scenario: Own harvested energy (cheaper) plus surplus harvested energy from neighbor BS (cheaper) plus utility (expensive), with generator as standby.
Table 2 depicts results in terms of percentage usage of harvested energy for each scenario, averaged over 1000 iterations. In summer period, with more sunlight and wind speed, the relative usage of RES is more. From the results, we can conclude that there is approximately 70% percent ‘RES cooperation factor’ on average, due to base station energy cooperation. The statistical analysis shows that standard deviation among these random scenarios is very small which verifies the robustness of the proposed solution.
5. Conclusions and Future Work
Green wireless communication can be described as a set of concepts and frameworks put together to improve the energy efficiency of wireless systems. Renewable energy sources can be effectively integrated into a BS to supplement its energy requirements, especially for off-grid BSs. In powering a BS with RES, the capacity of solar-panels and wind-turbine is significantly higher than the BS’s load to cater for the variance in wind speed and limited solar hours. The harvested energy, therefore, becomes surplus during off-peak hours, which can be shared through energy cooperation strategy, as demonstrated in this paper. Such energy cooperation can be effectively used in hilly areas, highways and remote towns where different network operators are collocated. They mostly rely on diesel generator for power and can significantly benefit by installing RES as well as incorporating energy cooperation among the co-located sites. However, the unstable nature of renewable sources such as wind and solar energy call for efficient energy storage and diffusion solutions. Smart grids can facilitate power sharing in the cellular networks thereby decreasing the energy cost and reducing the harmful greenhouse gases. In future, we intend to model the battery bank’s state of charge to make the scenario more comprehensive. Detailed operational and capital cost analysis on renewable energy sources may be performed in future to get comparative cost calculations. A game theoretic approach for resource allocation in the cellular network also seems promising and is intended by the authors as future work in this direction.
Acknowledgments
This work is supported by the National Research Foundation of Korea (NRF) through its grant funded by the Korea government (MSIP) (2016R1A2B4008457).
Author Contributions
Faran Ahmed and Muhammad Naeem conceived idea. Mathematical modeling was done jointly by Faran Ahmed, Muhammad Naeem, Waleed Ejaz, Muhammad Iqbal, Alagan Anpalagan and and Hyung Seok Kim. Data for simulation results was collected by Faran Ahmed, Muhammad Naeem and Muhammad Iqbal. The solution mechanism including transformation from bilinear to linear transform is done with consultation of Muhammad Naeem, Waleed Ejaz, Alagan Anpalagan and Hyung Seok Kim. Simulation and results are prepared by Faran Ahmed and Muhammad Naeem and Waleed Ejaz. Finally Muhammad Iqbal, Alagan Anpalagan and Hyung Seok Kim reviewed, checked, correct and commented on the manuscript.
Conflicts of Interest
The authors declare no conflict of interest.
References
- Fehske, A.; Fettweis, G.; Malmodin, J.; Biczok, G. The global footprint of mobile communications: The ecological and economic perspective. IEEE Commun. Mag. 2011, 49, 55–62. [Google Scholar] [CrossRef]
- Bian, S.; Wang, X.; Congiatu, M. An OFF-GRID Base Station Powered By Sun Wind, and Water. In Proceedings of the 35th International Telecommunications Energy Conference’Smart Power and Efficiency’(INTELEC), Hamburg, Germany, 13–17 October 2013; pp. 1–5. [Google Scholar]
- Aris, A.M.; Shabani, B. Sustainable power supply solutions for off-grid base stations. Energies 2015, 8, 10904–10941. [Google Scholar] [CrossRef]
- Hashimoto, S.; Yachi, T.; Tani, T. A new stand-alone hybrid power system with wind generator and photovoltaic modules for a radio base station. In Proceedings of the 26th Annual International Telecommunications Energy Conference, Chicago, IL, USA, 19–23 September 2004; pp. 254–259. [Google Scholar]
- Nema, P.; Rangnekar, S.; Nema, R. Pre-feasibility study of PV-solar/Wind Hybrid Energy System for GSM type mobile telephony base station in Central India. In Proceedings of the 2nd International Conference Computer and Automation Engineering (ICCAE), Singapore, 26–28 February 2010; pp. 152–156. [Google Scholar]
- Lee, B.M.; Kim, Y. Design of an Energy Efficient Future Base Station with Large-Scale Antenna System. Energies 2016, 9, 1083. [Google Scholar] [CrossRef]
- Chiaraviglio, L.; Listanti, M.; Manzia, E. Life is Short: The Impact of Power States on Base Station Lifetime. Energies 2015, 8, 14407–14426. [Google Scholar] [CrossRef]
- Han, T.; Ansari, N. Powering mobile networks with green energy. IEEE Wirel. Commun. 2014, 21, 90–96. [Google Scholar] [CrossRef]
- Han, T.; Ansari, N. On optimizing green energy utilization for cellular networks with hybrid energy supplies. IEEE Trans. Wirel. Commun. 2013, 12, 3872–3882. [Google Scholar] [CrossRef]
- Han, T.; Ansari, N. On greening cellular networks via multicell cooperation. IEEE Wirel. Commun. 2013, 20, 82–89. [Google Scholar] [CrossRef]
- Chiang, Y.H.; Liao, W. Green Multicell Cooperation in Heterogeneous Networks with Hybrid Energy Sources. IEEE Trans. Wirel. Commun. 2016, 15, 7911–7925. [Google Scholar] [CrossRef]
- Renga, D.; Hassan, H.A.H.; Meo, M.; Nuaymi, L. Improving the interaction of a green mobile network with the smart grid. In Proceedings of the IEEE International Conference on Communications (ICC), Paris, France, 21–25 May 2017; pp. 1–7. [Google Scholar]
- Zhang, Y.; Meo, M.; Gerboni, R.; Marsan, M.A. Minimum cost solar power systems for LTE macro base stations. Comput. Netw. 2017, 112, 12–23. [Google Scholar] [CrossRef]
- Renga, D.; Meo, M. Modeling renewable energy production for base stations power supply. In Proceedings of the IEEE International Conference on Smart Grid Communications (SmartGridComm), Sydney, Australia, 6–9 November 2016; pp. 716–722. [Google Scholar]
- Meo, M.; Zhang, Y.; Gerboni, R.; Marsan, M.A. Dimensioning the power supply of a LTE macro BS connected to a PV panel and the power grid. In Proceedings of the IEEE International Conference on Communications (ICC), London, UK, 8–12 June 2015; pp. 178–184. [Google Scholar]
- Morosi, S.; Del Re, E.; Piunti, P. Traffic based energy saving strategies for green cellular networks. In Proceedings of the 18th European Wireless Conference (European Wireless), Poznan, Poland, 18–20 April 2012; pp. 1–6. [Google Scholar]
- Morosi, S.; Piunti, P.; Re, E.D. Sleep mode management in cellular networks: A traffic based technique enabling energy saving. Trans. Emerg. Telecommun. Technol. 2013, 24, 331–341. [Google Scholar] [CrossRef]
- Ahmed, N.A.; Miyatake, M. A stand-alone hybrid generation system combining solar photovoltaic and wind turbine with simple maximum power point tracking control. In Proceedings of the IEEE 5th International Power Electronics and Motion Control Conference, Shanghai, China, 14–16 August 2006; Volume 1, pp. 1–7. [Google Scholar]
- Kwasinski, A. Architecture for green mobile network powered from renewable energy in microgrid configuration. In Proceedings of the Wireless Communications and Networking Conference (WCNC), Shanghai, China, 7–10 April 2013; pp. 1273–1278. [Google Scholar]
- Leithon, J.; Lim, T.J.; Sun, S. Online energy management strategies for base stations powered by the smart grid. In Proceedings of the IEEE International Conference on Smart Grid Communications (SmartGridComm), Vancouver, BC, Canada, 21–24 October 2013; pp. 199–204. [Google Scholar]
- Leithon, J.; Sun, S.; Lim, T.J. Energy management strategies for base stations powered by the smart grid. In Proceedings of the IEEE Conference on Global Communications Conference (GLOBECOM), Atlanta, GA, USA, 9–13 December 2013; pp. 2635–2640. [Google Scholar]
- Reyhanian, N.; Shah-Mansouri, V.; Maham, B.; Yuen, C. Renewable energy distribution in cooperative cellular networks with energy harvesting. In Proceedings of the IEEE Conference on 26th Annual International Symposium, Personal, Indoor, and Mobile Radio Communications (PIMRC), Hong Kong, China, 30 August–2 September 2015; pp. 1617–1621. [Google Scholar]
- Chia, Y.K.; Sun, S.; Zhang, R. Energy cooperation in cellular networks with renewable powered base stations. In Proceedings of the IEEE Wireless Communications and Networking Conference (WCNC), Shanghai, China, 7–10 April 2013; pp. 2542–2547. [Google Scholar]
- Hu, C.; Zhang, X.; Zhou, S.; Niu, Z. Utility optimal scheduling in energy cooperation networks powered by renewable energy. In Proceedings of the 19th Asia-Pacific Conference on Communications (APCC), Denpasar, Indonesia, 29–31 August 2013; pp. 403–408. [Google Scholar]
- Guo, Z.; Lim, T.J.; Motani, M. Base station energy cooperation in green cellular networks. In Proceedings of the Global Conference on Signal and Information Processing (GlobalSIP), Austin, TX, USA, 3–5 December 2013; pp. 349–352. [Google Scholar]
- Guo, Y.; Xu, J.; Duan, L.; Zhang, R. Joint Energy and Spectrum Cooperation for Cellular Communication Systems. arXiv, 2013; arXiv:1312.1756. [Google Scholar]
- Hassan, H.A.H.; Singh, K.D.; Nuaymi, L. Grid energy consumption of mixed-traffic cellular networks with renewable energy sources. In Proceedings of the IEEE Online Conference on Green Communications (OnlineGreenComm), Piscataway, NJ, USA, 14 November–17 December 2016; pp. 1–6. [Google Scholar]
- Carreno, M.; Nuaymi, L. Renewable energy use in cellular networks. In Proceedings of the 77th Vehicular Technology Conference (VTC Spring), Dresden, Germany, 2–5 June 2013; pp. 1–6. [Google Scholar]
- Hassan, H.A.H.; Nuaymi, L.; Pelov, A. Classification of renewable energy scenarios and objectives for cellular networks. In Proceedings of the 24th International Symposium on Personal Indoor and Mobile Radio Communications (PIMRC), London, UK, 8–11 September 2013; pp. 2967–2972. [Google Scholar]
- Liu, Y.; Zhang, L.; Tao, F.; Wang, L. Resource service sharing in cloud manufacturing based on the Gale–Shapley algorithm: advantages and challenge. Int. J. Comput. Integr. Manuf. 2017, 30, 420–432. [Google Scholar] [CrossRef]
- Renna, P.; Argoneto, P. A game theoretic coordination for trading capacity in multisite factory environment. Int. J. Adv. Manuf. Technol. 2010, 47, 1241–1252. [Google Scholar] [CrossRef]
- Auer, G.; Blume, O.; Giannini, V.; Godor, I.; Imran, M.A.; Jading, Y.; Katranaras, E.; Olsson, M.; Sabella, D.; Skillermark, P.; et al. D2. 3: Energy efficiency analysis of the reference systems, areas of improvements and target breakdown. EARTH 2010, 20, 1–68. [Google Scholar]
- Auer, G.; Giannini, V.; Desset, C.; Godor, I.; Skillermark, P.; Olsson, M.; Imran, M.A.; Sabella, D.; Gonzalez, M.J.; Blume, O.; et al. How much energy is needed to run a wireless network? IEEE Wirel. Commun. 2011, 18, 40–49. [Google Scholar] [CrossRef]
- Theo, W.L.; Lim, J.S.; Ho, W.S.; Hashim, H.; Lee, C.T. Review of distributed generation (DG) system planning and optimisation techniques: Comparison of numerical and mathematical modelling methods. Renew. Sustain. Energy Rev. 2017, 67, 531–573. [Google Scholar] [CrossRef]
- Diaf, S.; Diaf, D.; Belhamel, M.; Haddadi, M.; Louche, A. A methodology for optimal sizing of autonomous hybrid PV/wind system. Energy Policy 2007, 35, 5708–5718. [Google Scholar] [CrossRef]
- Solar Electricity Handbook. Available online: www.solarelectricityhandbook.com/solar-irradiance.html (accessed on 29 December 2017).
- Mirza, I.; Khalil, M. Renewable energy in Pakistan: Opportunities and challenges. Sci. Vis. 2011, 16, 13–20. [Google Scholar]
- Wind Finder. Available online: www.windfinder.com/windstatistics/islamabad-rawalpindi-airport (accessed on 29 December 2017).
- Yigitel, M.A.; Incel, O.D.; Ersoy, C. QoS vs. energy: A traffic-aware topology management scheme for green heterogeneous networks. Comput. Netw. 2015, 78, 130–139. [Google Scholar] [CrossRef]
- Willkomm, D.; Machiraju, S.; Bolot, J.; Wolisz, A. Primary users in cellular networks: A large-scale measurement study. In Proceedings of the 3rd IEEE Symposium on New Frontiers in Dynamic Spectrum Access Networks, Chicago, IL, USA, 14–17 October 2008; pp. 1–11. [Google Scholar]
- Chandrasekaran, B. Survey of Network Traffic Models; Waschington University: St. Louis, MO, USA, 2009; Volume 567. [Google Scholar]
- Mitsos, A.; Chachuat, B.; Barton, P.I. McCormick-based relaxations of algorithms. SIAM J. Optim. 2009, 20, 573–601. [Google Scholar] [CrossRef]
- Boyd, S.; Vandenberghe, L. Convex Optimization; Cambridge University Press: Cambridge, UK, 2004. [Google Scholar]
Figure 1.
A base station powered by Renewable Energy Sources (RES), in addition to the conventional grid and generator, can use the clean and sustainable energy from sun and wind to cut down on the GHG (greenhouse gas) emitting sources.
Figure 1.
A base station powered by Renewable Energy Sources (RES), in addition to the conventional grid and generator, can use the clean and sustainable energy from sun and wind to cut down on the GHG (greenhouse gas) emitting sources.

Figure 2.
Solar energy data for Islamabad area. (a) Average solar insolation figures for Islamabad, measured at 56 deg for best year round performance [36]; (b) Electrical energy yield for the day calculated for a PV panel array of 50 m having a capacity of 7.8 kWp.
Figure 2.
Solar energy data for Islamabad area. (a) Average solar insolation figures for Islamabad, measured at 56 deg for best year round performance [36]; (b) Electrical energy yield for the day calculated for a PV panel array of 50 m having a capacity of 7.8 kWp.

Figure 3.
Wind energy data for Islamabad region. (a) Average monthly wind speed data for Islamabad. (source: Islamabad meteorological department [38]); (b) Average daily electrical energy yield from the 7.5 kW BWC-Excel-R/48 wind turbine.
Figure 3.
Wind energy data for Islamabad region. (a) Average monthly wind speed data for Islamabad. (source: Islamabad meteorological department [38]); (b) Average daily electrical energy yield from the 7.5 kW BWC-Excel-R/48 wind turbine.
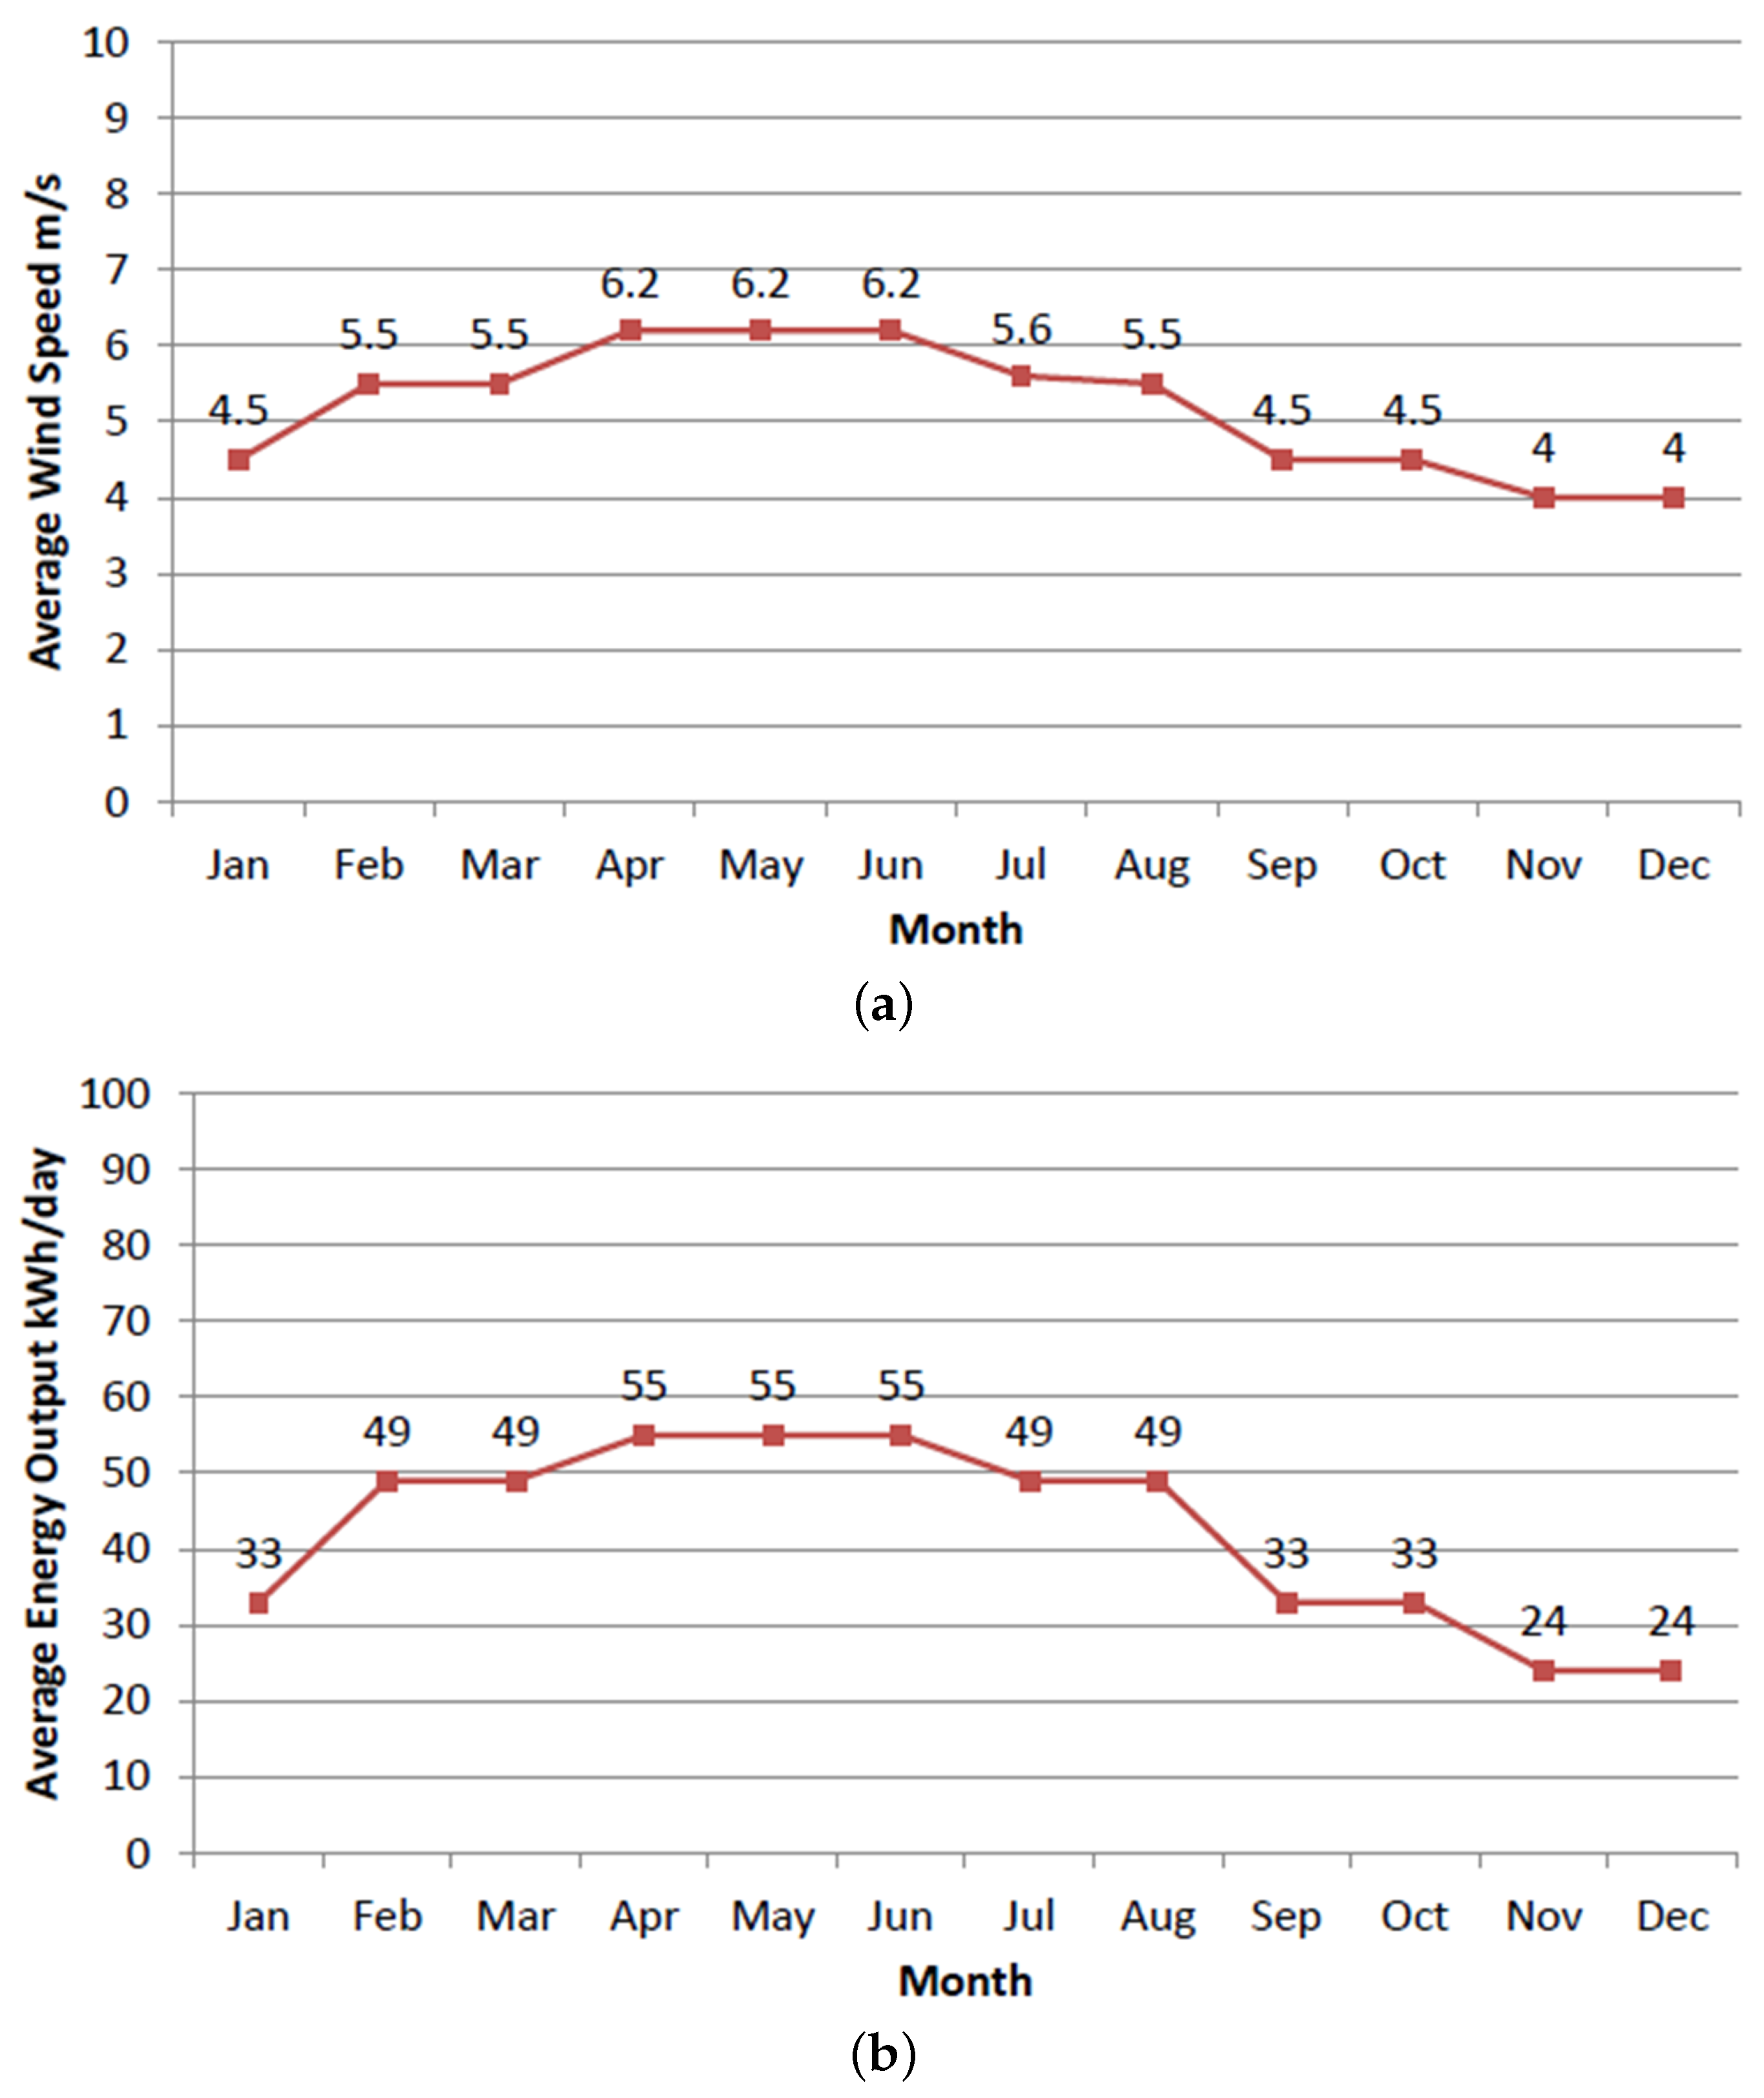
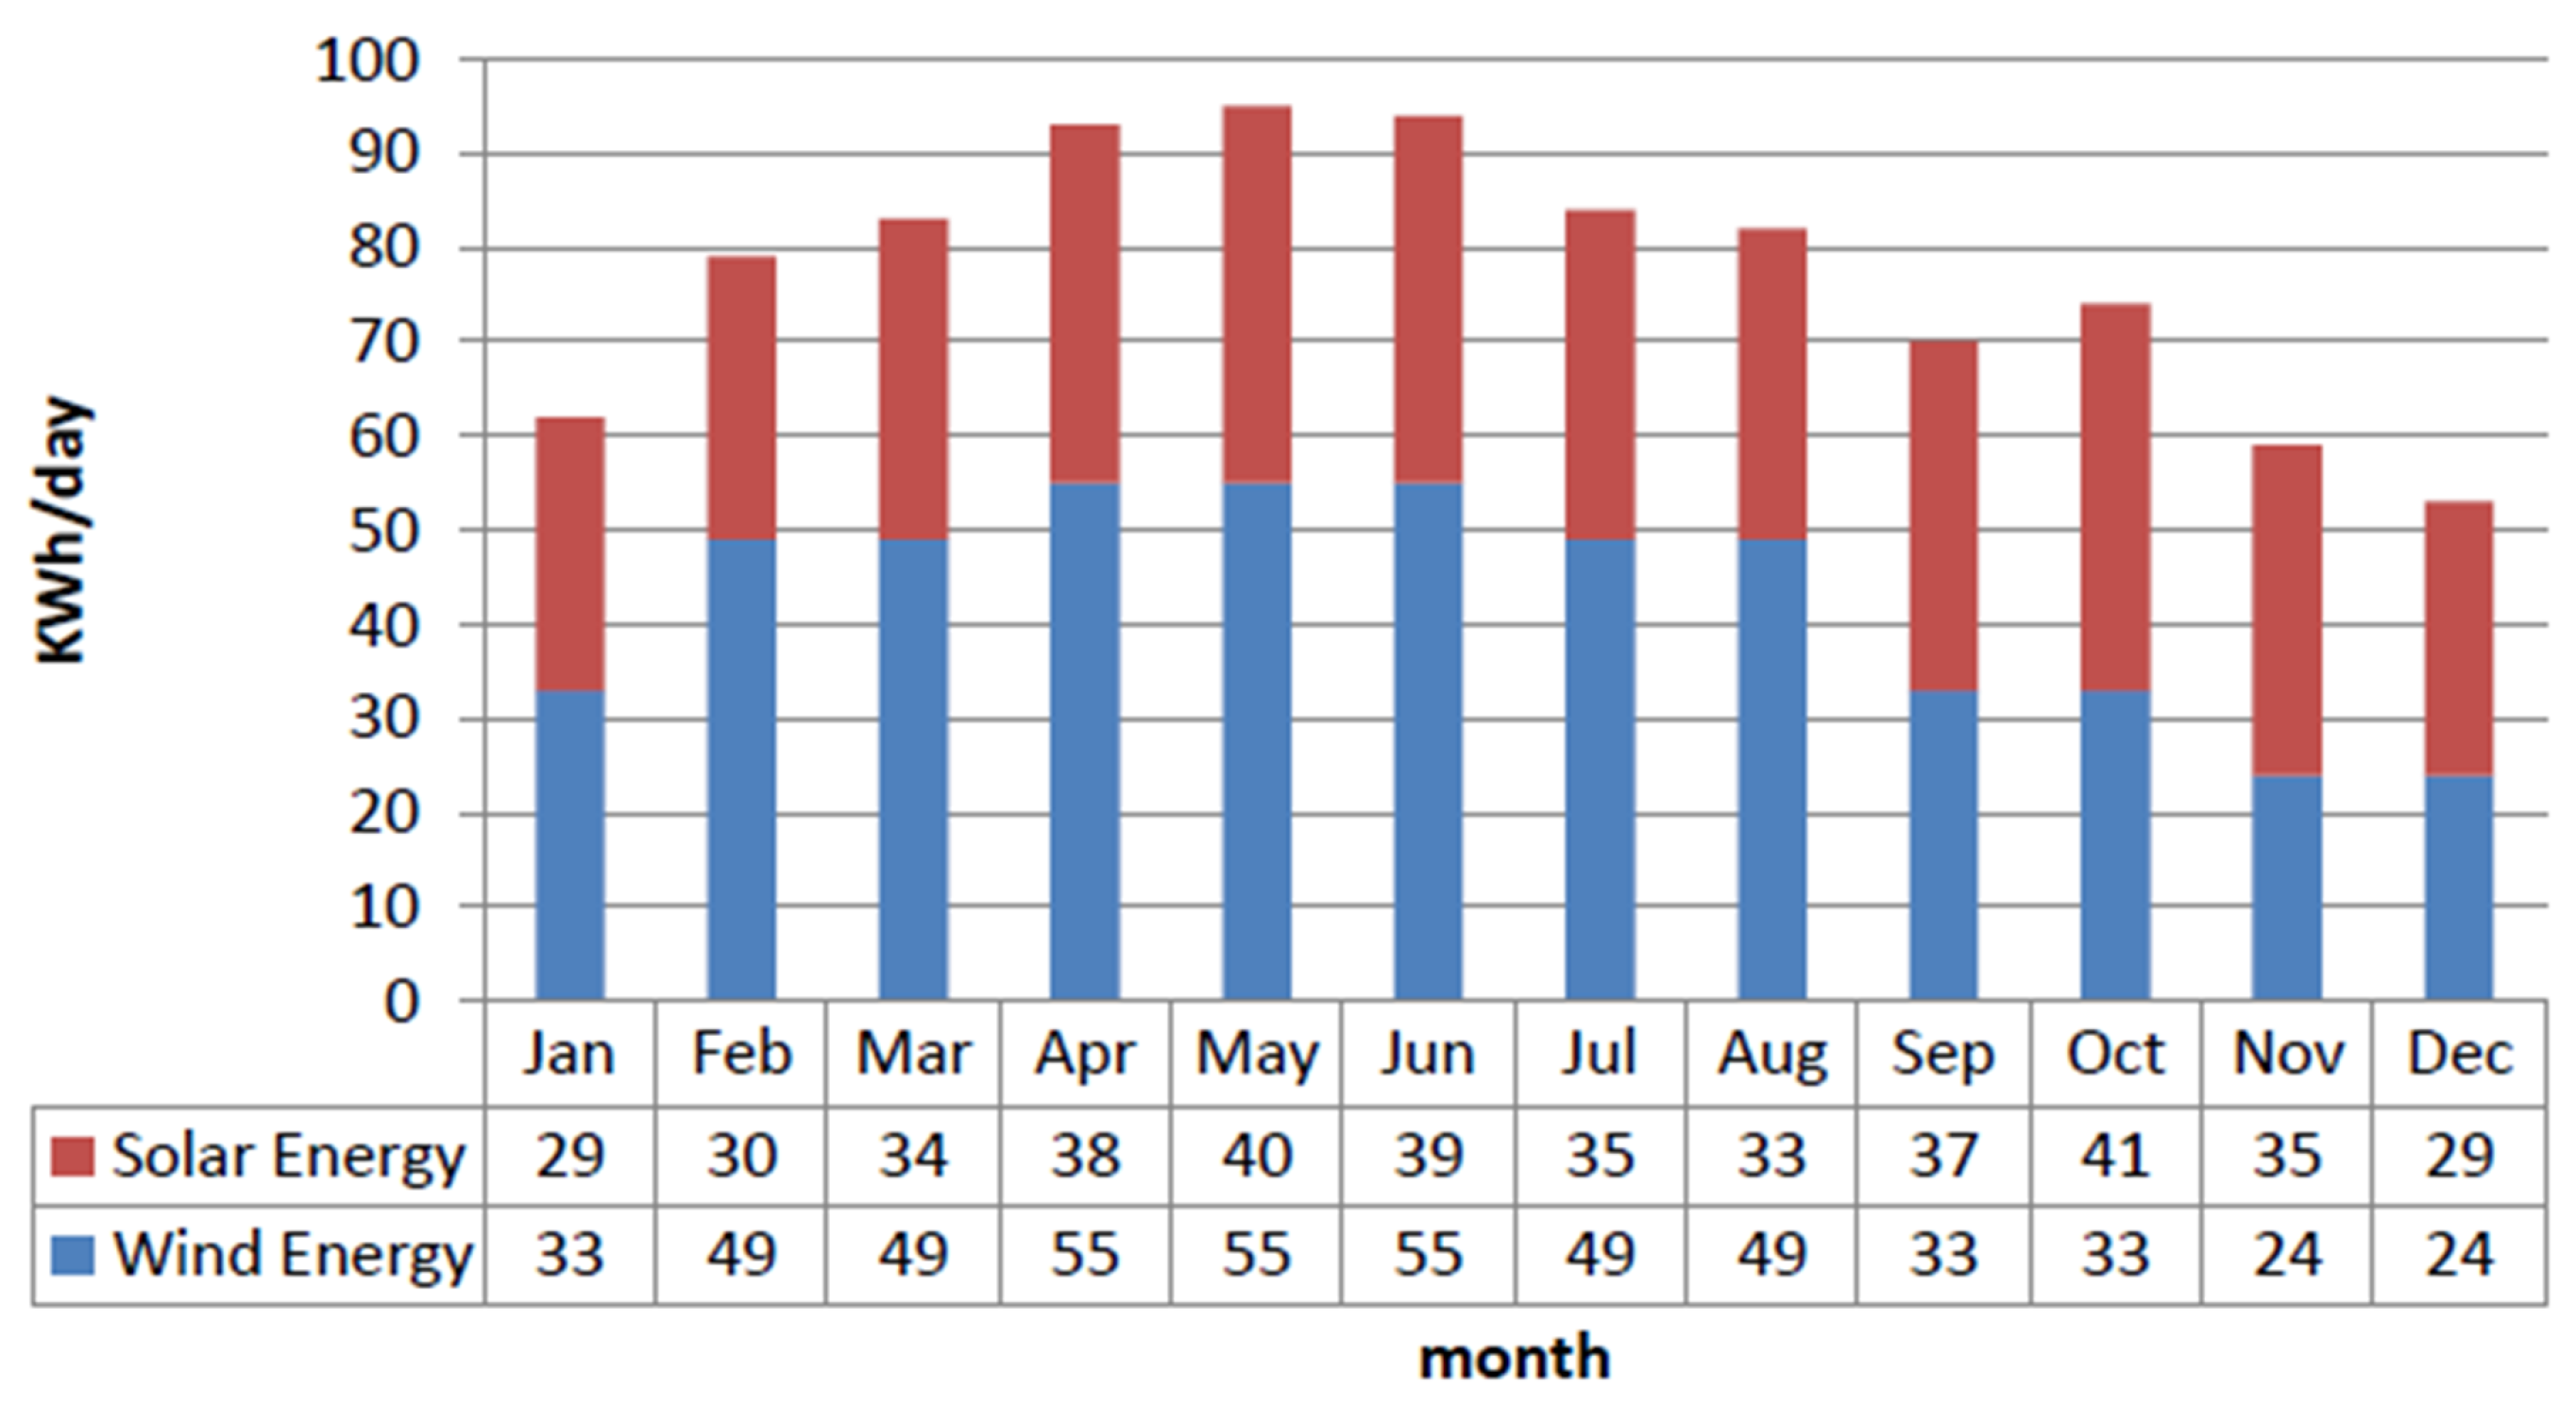
Figure 4.
Combined average daily yield of the 7.8 kW PV panels and 7.5 kW wind turbine at BS site for Islamabad.
Figure 4.
Combined average daily yield of the 7.8 kW PV panels and 7.5 kW wind turbine at BS site for Islamabad.

Figure 5.
Traffic aware dynamic power (load) requirement of BSs. Total load of each BS will be sum of static load and dynamic load.
Figure 5.
Traffic aware dynamic power (load) requirement of BSs. Total load of each BS will be sum of static load and dynamic load.
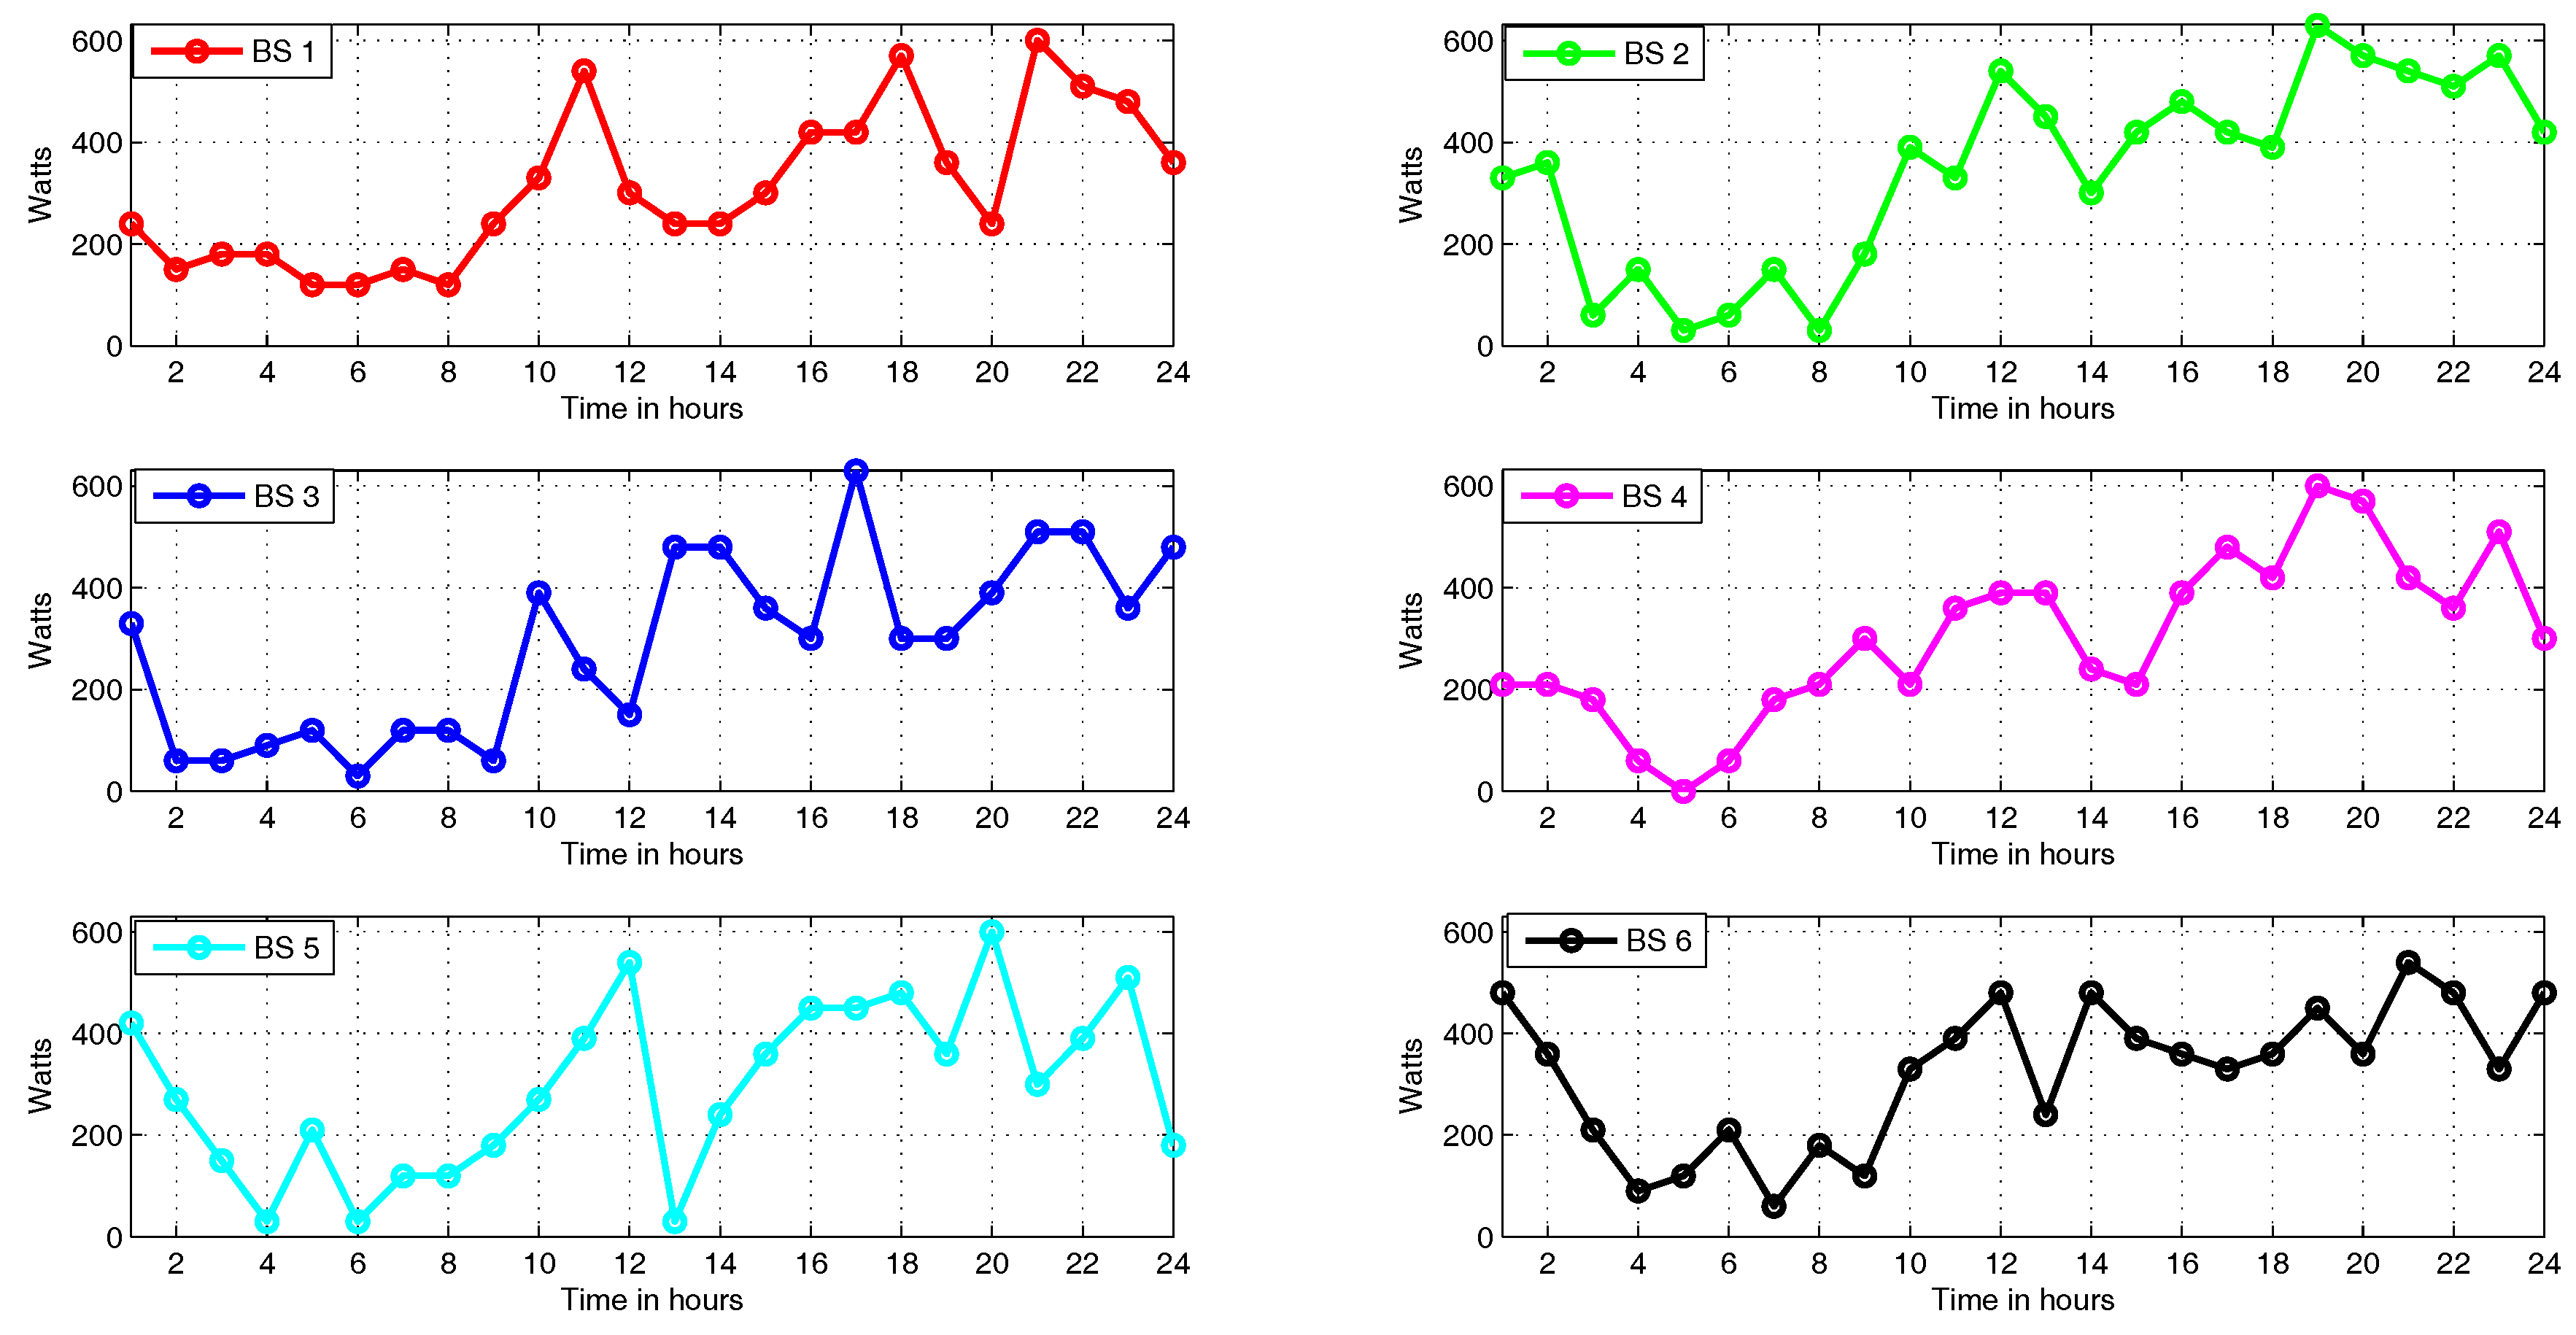
Figure 6.
BS energy demand versus the energy harvested from solar and wind sources for a day.

Figure 7.
Load Shedding Scenario.

Figure 8.
Energy cooperation algorithm showing buying/selling for each BS. A BS buys energy from utility or another BS. Where none is available from either source, the diesel generator is turned on.
Figure 8.
Energy cooperation algorithm showing buying/selling for each BS. A BS buys energy from utility or another BS. Where none is available from either source, the diesel generator is turned on.


Table 1.
Power consumption breakdown for different types of BSs [33].
Table 1.
Power consumption breakdown for different types of BSs [33].
| BS Type | PA (W) | RF (W) | BB (W) | DC-DC (%) | Cooling (%) | Mains (%) | Total per Trx | Total for | |
|---|---|---|---|---|---|---|---|---|---|
| Macro | 6 | 128.2 | 12.9 | 29.6 | 7.5 | 10.0 | 9.0 | 225.0 W | 1350 W |
| RRH | 6 | 64.4 | 12.9 | 29.6 | 7.5 | 0.0 | 9.0 | 125.8 W | 754.8 W |
| Micro | 2 | 6.3 | 54 | 2.6 | 39.0 | 0.0 | 9.0 | 72.3 W | 144.6 W |
| Pico | 2 | 0.13 | 6.8 | 4.0 | 4.3 | 0.0 | 11.0 | 7.3 W | 14.7 W |
| Femto | 2 | 1.1 | 0.6 | 2.5 | 9.0 | 0.0 | 11.0 | 5.2 W | 10.4 W |
Table 2.
Percentage decrease in the cost due to cooperation in base stations.
| Number of Base Stations | |||||||||||||
|---|---|---|---|---|---|---|---|---|---|---|---|---|---|
| N = 4 | N = 8 | N = 12 | N = 16 | ||||||||||
| $ w/o Coop | $ Coop | % Coop | $ w/o Coop | $ Coop | % Coop | $ w/o Coop | $ Coop | % Coop | $ w/o Coop | $ Coop | % Coop | ||
| January | Mean | 7.2313 | 4.9599 | 68.5893 | 14.4681 | 9.922 | 68.5783 | 21.6978 | 14.8798 | 68.5778 | 28.9241 | 19.8366 | 68.5817 |
| Std | 0.0354 | 0.0227 | 0.538 | 0.0346 | 0.0627 | 0.0397 | 0.053 | 0.0444 | |||||
| February | Mean | 6.7245 | 4.7906 | 71.2413 | 13.4545 | 9.5822 | 71.2193 | 20.1774 | 14.3657 | 71.1974 | 26.8969 | 19.1501 | 71.1984 |
| Std | 0.0358 | 0.0252 | 0.456 | 0.0386 | 0.05175 | 0.043 | 0.621 | 0.0517 | |||||
| March | Mean | 6.6855 | 4.7842 | 71.5614 | 13.3764 | 9.5694 | 71.5392 | 20.0603 | 14.3465 | 71.5173 | 26.7407 | 19.1245 | 71.5183 |
| Std | 0.04 | 0.0252 | 0.359 | 0.0386 | 0.0443 | 0.043 | 0.598 | 0.0517 | |||||
| April | Mean | 6.2345 | 4.5522 | 73.0157 | 12.4746 | 9.104 | 72.9801 | 18.7075 | 13.6441 | 72.934 | 24.937 | 18.182 | 72.9118 |
| Std | 0.0358 | 0.0264 | 0.538 | 0.0397 | 0.0627 | 0.0458 | 0.0825 | 0.0609 | |||||
| May | Mean | 6.2053 | 4.5474 | 73.2828 | 12.4161 | 9.0944 | 73.2469 | 18.6197 | 13.6297 | 73.2006 | 24.8199 | 18.1628 | 73.1784 |
| Std | 0.0358 | 0.0264 | 0.42 | 0.0397 | 0.0443 | 0.0458 | 0.0665 | 0.0609 | |||||
| June | Mean | 6.215 | 4.549 | 73.1935 | 12.4356 | 9.0976 | 73.1577 | 18.6489 | 13.6345 | 73.1115 | 24.859 | 18.1692 | 73.0893 |
| Std | 0.36 | 0.0264 | 0.538 | 0.0397 | 0.0443 | 0.043 | 0.0665 | 0.0609 | |||||
| July | Mean | 6.6464 | 4.7778 | 71.8854 | 13.2984 | 9.5566 | 71.8628 | 19.9432 | 14.3273 | 71.8408 | 26.5846 | 19.0989 | 71.842 |
| Std | 0.39 | 0.0252 | 0.538 | 0.0386 | 0.0437 | 0.043 | 0.069 | 0.0517 | |||||
| August | Mean | 6.6659 | 4.781 | 71.7229 | 13.3374 | 9.563 | 71.7006 | 20.0017 | 14.3369 | 71.6786 | 26.6627 | 19.1117 | 71.6797 |
| Std | 0.0358 | 0.0252 | 0.39 | 0.0386 | 0.0627 | 0.0397 | 0.069 | 0.0517 | |||||
| September | Mean | 7.1727 | 4.9589 | 69.1351 | 14.351 | 9.92 | 69.1238 | 21.5221 | 14.8768 | 69.1234 | 28.6899 | 19.8326 | 69.1274 |
| Std | 0.0358 | 0.0227 | 0.538 | 0.0346 | 0.0437 | 0.0397 | 0.0544 | 0.0444 | |||||
| October | Mean | 7.1571 | 4.9586 | 69.2822 | 14.3198 | 9.9194 | 69.2708 | 21.4753 | 14.876 | 69.2704 | 28.6274 | 19.8315 | 69.2745 |
| Std | 0.037 | 0.0227 | 0.538 | 0.0346 | 0.0437 | 0.0392 | 0.0568 | 0.0444 | |||||
| November | Mean | 7.4028 | 5.0016 | 67.5629 | 14.8112 | 10.0069 | 67.563 | 22.2124 | 15.0077 | 67.5649 | 29.6102 | 20.0064 | 67.5659 |
| Std | 0.0358 | 0.0227 | 0.39 | 0.0337 | 0.0437 | 0.0392 | 0.0523 | 0.0437 | |||||
| December | Mean | 7.4126 | 5.0015 | 67.4733 | 14.8307 | 10.0069 | 67.4743 | 22.2416 | 15.0077 | 67.476 | 29.6492 | 20.0064 | 67.477 |
| Std | 0.0358 | 0.0227 | 0.538 | 0.0336 | 0.0627 | 0.0392 | 0.0652 | 0.0437 | |||||
© 2018 by the authors. Licensee MDPI, Basel, Switzerland. This article is an open access article distributed under the terms and conditions of the Creative Commons Attribution (CC BY) license (http://creativecommons.org/licenses/by/4.0/).
Share and Cite
MDPI and ACS Style
Ahmed, F.; Naeem, M.; Ejaz, W.; Iqbal, M.; Anpalagan, A.; Kim, H.S. Renewable Energy Assisted Traffic Aware Cellular Base Station Energy Cooperation. Energies 2018, 11, 99. https://doi.org/10.3390/en11010099
AMA Style
Ahmed F, Naeem M, Ejaz W, Iqbal M, Anpalagan A, Kim HS. Renewable Energy Assisted Traffic Aware Cellular Base Station Energy Cooperation. Energies. 2018; 11(1):99. https://doi.org/10.3390/en11010099
Chicago/Turabian StyleAhmed, Faran, Muhammad Naeem, Waleed Ejaz, Muhammad Iqbal, Alagan Anpalagan, and Hyung Seok Kim. 2018. "Renewable Energy Assisted Traffic Aware Cellular Base Station Energy Cooperation" Energies 11, no. 1: 99. https://doi.org/10.3390/en11010099
Note that from the first issue of 2016, this journal uses article numbers instead of page numbers. See further details here.