Thermodynamic and Environmental Analysis of Scaling up Cogeneration Units Driven by Sugarcane Biomass to Enhance Power Exports


Chemical Engineering Department, Polytechnic School of the University of São Paulo, Avenida Professor Lineu Prestes, 580, Bloco 18—Conjunto das Químicas, São Paulo 05508-000, SP, Brazil
*
Author to whom correspondence should be addressed.
Energies 2018, 11(1), 73; https://doi.org/10.3390/en11010073
Submission received: 21 November 2017
/
Revised: 13 December 2017
/
Accepted: 21 December 2017
/
Published: 1 January 2018
(This article belongs to the Special Issue Sustainable and Renewable Energy Systems)
Abstract
:When manual harvesting of sugarcane was discontinued in many regions of Brazil, interest in power generation by burning the bagasse and straw in cogeneration units rose. Exergy analysis is often applied to increase the thermodynamic yield of these plants by identifying irreversibility and work availability. Conversely, pressure for adopting clean energy requires these systems to be evaluated for suitable environmental performance. This study identified and discussed the thermodynamic and environmental effects of scaling up systems that operate according Rankine cycle with reheating. Ten scenarios have been designed considering different levels of steam pressure and addition rates of straw remaining in the sugarcane cultivation. The thermodynamic analysis revealed a 37% improvement in the exergy efficiency and 63% of increasing in power generation to raise the steam pressure from 20 to 100 bar. Moreover, the use of 50% of residual straw into units operating at 100 bar can more than double the amount of electricity exported. If addressed considering a life cycle perspective, the use of straw improves the environmental performance of the cogeneration for Climate Change and Particle Matter Formation but provides additional impacts in terms of Water and Fossil resources depletions.
1. Introduction
Sugar and alcohol production stands out as one of Brazil’s main productive activities. The sector has expanded since the international market opened to this fuel and mechanisms to commercialize surplus electricity for the production network have been created [1,2]. As a result, the companies of the internal sugar-alcohol sector have been seeking to raise competitiveness by improving agricultural productivity and industrial income, and by reducing losses along the production chain. In this second branch of actions, the reuse of agricultural wastes mostly in the form of bagasse and straw, is particularly noteworthy.
No longer merely a complementary source of ethanol production, these sources of biomass are used in the cogeneration cycles, with the purpose of increasing the supply of electric energy and then exporting it to the grid [1,3]. An expressive trend of expansion in this field is expected in the next few years. This is because: (i) Brazil still falls short of fully exploring its energy potential in sugarcane biomass [1,4,5]; (ii) the installed capacity for cogeneration from biomass is 143 GW, representing 9.3% of the domestic energy supply in 2014, and the national commitment is to increase this contribution to 23% by 2030 [6]; (iii) the country has signed international agreements aimed at sustainable development and reduction of greenhouse gas (GHG) [7] and cogeneration from biomass is one of the most promising options of the Brazilian strategy for accomplishing these goals [8].
Another reason for expanding the so-called ‘bioelectricity’ refers to the increasing availability of plant material that supplies the process. Straw offers are increasing due to the Agro-environmental Protocol, an agreement established in 2007 between the main internal producers of sugarcane, the União da Agroindústria Canavieira (UNICA), the sugarcane producers’ guild, and the Government of the State of São Paulo. According to the agreement, since 2014 there can be no clearing of cultivated areas by burning biomass in sites that can be mechanically harvested, and in areas where there is no appropriate technology for mechanization, and sugarcane burning was scheduled to stop at the beginning of 2017 [9,10,11,12], as actually happened.
Even with so many benefits, the use of renewable sources in cogeneration plants can be improved in terms of the simultaneous generation of electricity and heat [13]. The exergy analysis, an approach based on the 2nd Law of Thermodynamics, has been used for this purpose, obtaining expressive results as compared to the classical analysis, restricted to the 1st Law [14]. Exergy analysis allows to identify the main irreversibility sources in a thermal power system (i.e., its inefficiencies) [15,16].
A survey of technical literature on the subject shows the existence of many recent works about the thermodynamic assessment of cogeneration systems. Dewulf et al. [16] and Torchio [17] analyzed the advantages of using exergy analysis in the selection of technical performance indicators in cogeneration systems. Similarly, Ensinas et al. [18] and Dias et al. [19] applied an exergoeconomic indicator to assess the thermodynamic performance of processing sugarcane ethanol, with a view to identifying opportunities to lower irreversibility associated to this process. It must be noted, however, that all these surveys are limited to using the sugarcane bagasse as cogeneration cycle fuel.
The recent higher demands for ethanol and electrical power have led some authors to look into the thermodynamic behavior of modern cogeneration technologies (i.e., substituting backpressure steam turbines for condensing extraction steam turbines) able to operate under severe conditions of pressure and temperature. Pellegrini and Oliveira Jr. [20] approached the issue by verifying the energetic performance of cogeneration units installed in ethanol plants whose boiler exit steam pressure ranges from 21 to 120 bar. Similar analyses have also been carried out by Bechara et al. [21], Colombo et al. [22], Dias et al. [23] and by Oliverio and Ferreira [24].
Even though the increase in straw availability is a predictable corollary from the termination of burning techniques [3,12,25,26], the implications of using this biomass, e.g., associated with the bagasse, over the thermodynamic performance of cogeneration systems are still insufficiently understood [5,27]. Alves et al. [1] and Cardoso et al. [4] assessed the export potential of Rankine cycle electricity supplied with different additional rates of bagasse and straw. Following different approaches, these authors reached the conclusion that the electrical efficacy of cogeneration varies linearly with the increase of straw for specific levels of system operation. Menandro et al. [5] have pointed out how important it is to keep an amount of straw in the field so as to recycle nutrients and regulate the humidity of the soil. The recovery of straw also was the subject of exergy analyses carried out by Palacios-Bereche et al. [28], Bechara et al. [21] and Modesto et al. [29]. It is revealed to be a promising alternative with potential yet be still explored.
The aforementioned studies are restricted, however, to industrial processes and operations. Contrary to such a perspective Dewulf et al. [16] and Murphy et al. [30] adopt scopes based on the concept of life cycle in order to assess energetic systems. Gil et al. [31], Moya et al. [32], Nogueira et al. [33], and Ometto and Roma [34] have all applied systemic approaches to assess the conversion of heat into work in the sugar and alcohol industry. Kadyala et al. [35] and Shen et al. [36] resorted to an extensive domain in order to quantify the environmental impact of the generation of electricity out of different biomass sources, but the thermodynamic analysis was only focused on counting Cumulated Exergy Demand. Guerra et al. [37] and Silva et al. [38] employed stringent Life Cycle Assessment (LCA) and exergy analysis in the investigation of environmental and thermodynamic positive aspects of cogeneration through biomass, but their surveys are narrowed to the use of bagasse as the only energy source.
To the best of our knowledge, no research verifying concurrently the thermodynamic and environmental consequences of cogeneration using both bagasse and straw for different operation conditions of the system has been carried out. This study proposes a contribution to the topic by addressing such effects from the increased scale of production of cogeneration systems operated with sugarcane biomass. Hence, scenarios with different process conditions have been designed and modeled. The option for the reheating technique on Rankine cycle is another unique feature of the research, as this approach is typical of thermoelectric plants [39] and only recently has been tested in conditions such as that one. We expect this initiative to provide elements for designing technically efficient and less environmentally aggressive cogeneration units, and for subsidizing public policies oriented toward energy management and planning in Brazil.
2. Agricultural Process Description
Agricultural production of sugarcane was based on the technology most frequently used in the state of Sao Paulo, Brazil’s main producer, in recent years. In the period between 2005 and 2014, the crops grown in the region recorded an average agricultural productivity of 82 t/ha [40]. Chemical fertilizers—potassium chloride (KCl), single superphosphate (SSP), and urea—are used to meet the sugarcane nutritional needs. Vinasse, filter cake, and ashes from the industrial stage are also applied to the soil as complementary sources of macro and micronutrients. Moreover, adjusting the soil acidity by liming and the use of agrochemicals—carbofuran, diuron, glyphosate, hexazinone, and tebuthiuron—for pest control are often necessary practices [41]. Mechanized harvesting in the region accounted for over 95% of the total [42].
After being transported to the industrial unit, the sugarcane is washed, chopped and shredded before grinding. Wet route juice extraction (imbibing 46%) provides bagasse. Prior to fermentation, the sugar juice is heated and purified in a rotating filter (which generates filter cake), and concentrated in set of evaporators of indirect contact [33].
An average industrial productivity of 83 L C2H6O/t sugarcane can be obtained by using Saccharomyces cerevisiae for the alcoholic fermentation of the sugar juice. The process is carried out in batch reactors at controlled temperatures, acidity levels, and oxygen concentrations. Fractional distillation takes place at atmospheric pressure before reaching azeotrope point. The anhydrous form of the alcohol (99.5% v/v) is obtained only after the hydrated solution (95% v/v) is subjected to a rectification column. Vinasse is generated during the operations of ethanol distillation and rectification, at a ratio of 10–13 L/L anhydrous ethanol [34,43].
3. Industrial System Description
Most Brazilian cogeneration plants run on Rankine cycles without reheating. The novelty of applying the reheating technique on cogeneration plant is described in Figure 1. The theoretical basis for proposing this approach derived from previous initiatives described by Moran and Shapiro [39], regarding efficiency improvement in similar thermoelectric plants.
Reheating consists of extracting superheated steam after its expansion through the first stage of the backpressure turbine and reheating it on the steam generator prior to reinjecting it into the second stage of the turbine. The so-called optimum extraction pressure ranges from 20 to 25 bar, depending on the thermodynamic properties of the high-pressure steam in each scenario [44]. After reheating, the steam flow is reinjected into the second stage of the turbine and expands through this equipment until the condenser pressure is reached. A generator converts the mechanical energy generated by the steam expansion into electricity. The energy efficiency of this operation is approximately 95% [38].
Dry saturated steam is extracted from the turbine at about 2.5 bar in order to supply the thermal demand of the distillery and for reaching the deaeration set point (110 °C) [37]. The boiler feedwater pump pressure is designed to overcome the maximum possible fluid flow at the maximum design operating condition. For each scenario, a discharge pressure 20% higher than the boiler pressure was considered, to overcome drum operating pressure, pressure drop in tubes and in order to include a safety margin. This correction factor is usually applied on boiler systems and a feedwater control valve adjusts the flow.
Turbine exhaust steam feeds a condenser unit at about 0.1 bar of pressure. The liquid fraction also passes through the deaerator prior to being reintroduced into the boiler, closing the cycle [37,45,46,47].
According to Cortez [48], about 57% of the electric consumption in the distillery is attributed to sugarcane preparation and crushing. The remaining demand triggers ancillary equipment (boiler blowers, pumps, injectors, and stirrers), automation systems, and industrial instrumentation. Electricity surplus is commercialized with the grid owners.
Still in the field, the straw to be used in the cogeneration unit is compressed into rectangular bales (250–500 kg) to be transported to the distillery, where it will be cut and minced by hammer mills [25]. Under these conditions, the biomass can be fed to the boiler with the bagasse.
Table 1 presents the main process parameters of the same system. Such data have also been used to model cogeneration and its interface with the ethanol manufacturing, in order to evaluate both the thermodynamic and environmental profiles of each scenario.
4. Methodology
The methodology established to fulfill the objectives of this study takes into account five steps: (i) formulation of scenarios that represent different operational scales of cogeneration from sugarcane biomass (bagasse and straw); (ii) verification of the thermodynamic performance profile of each scenario from exergy analysis; (iii) use of the LCA technique to examine the performance of scenarios from an environmental perspective; (iv) performing an investigation of the obtained results in order to identify agents causing impacts in both dimensions of the analysis; and (v) verification of the effects stemming from the synergy of thermodynamic and environmental indicators when applied in the scale up analysis of the cogeneration process.
4.1. Case Scenarios Definition
The formulation of scenarios was based on the average technological pattern as practiced at autonomous distilleries located in the state of São Paulo which export electricity to the concessionaire. This geographic coverage was selected because, as mentioned before, the zone leads the production of sugarcane in Brazil, accounting for 61% of all domestic production [49].
The definition of the cogeneration technology standard took into account two criteria: (i) the operational scales of the units; and (ii) the specifications of the thermodynamic cycle. The operational scale was defined by the properties of superheated steam at boiler exit, which ranges from 20 bar up to 100 bar [19]. According to Guerra et al. [37] most cogeneration units located in São Paulo are running the Rankine cycle in this range of pressure without reheating.
The specification of the thermodynamic cycle depends on many parameters but the amount and characteristics of biomass added to the system are amongst the most important. In addition to the whole bagasse produced in sugarcane crushing, high-performance facilities also consume sugarcane straw (leaves and tips) as heat source [38]. Conversely, the use of straw to protect the agricultural soil [2] and the high rates of chlorides and silica associated with it—that may cause, respectively, rupture in the internal tubes and fouling in the boiler [24]—restricted the dosage of this renewable source in the cogeneration system. Under all these circumstances, the study evaluated two conditions in terms of straw utilization: (i) non-consumption; and (ii) use of 50% w/w of the total amount of straw produced in the fields.
Table 2 shows ten realistic scenarios established to support the investigation after the aforementioned conditions were met. The signal (+) indicates presence of straw in the boiler feed and (–) its absence in the same flow. Other stages of the process to produce electricity out of sugarcane biomass are invariable, regardless of the scenario under analysis.
4.2. Thermodynamic Evaluation
Exergy can be understood as the maximum work obtainable from a matter, heat or work flow as it converges to the thermodynamic equilibrium with the components of the environment [50]. The reference environment is in stable equilibrium, whose intensive state of temperature, pressure and chemical composition remains unaltered and where the substances are found in abundance in nature. In the cogeneration system under analysis, the working fluid is water and the reference environment temperature and pressure are respectively 25 °C and 1.0 bar [44].
Thermodynamic analysis comprises an exergy balance that has been specifically carried out for the cogeneration system. This approach was adopted in order to estimate the irreversibility profile distribution (i.e., the exergy destruction) along the Rankine cycle stages: boiler, turbine, condenser, and ancillary equipment.
The scenarios described above, for which the exergy balance has been applied, were represented by using the software Engineering Equation Solver (EES)® (F-Chart Software, Madison, WI, USA) [51]. EES provides thermodynamically robust data and solutions for energy systems, being useful for designing multivariate problems. In this study, EES was employed to develop an analysis that a certain parameter is varying within a suitable range in order to find the optimum result. The algebraic equations used for modeling the thermodynamic behavior at each step of the Rankine cycle follow mass and energy conservation principles [37].
The mass balance equation for a steady-state system can be written in the rate form as shown in Equation (1):
where and represent mass flow rates of the working fluid, respectively, entering and exiting the system. Likewise, energy rate balance regarding a steady-state system was described in Equation (2):
and are energy rates that also enter and exit the system, respectively. The heat rate provided to the system is , whereas the work transfer rate was defined as .
The exergy balance is performed by combining the steady flow mass and energy equations with the expression for the entropy generation (i.e., involving the 1st and 2nd Laws of Thermodynamics). The entropy balance concerning a steady-state system is indicated in Equation (3):
where and are the entropy generation rate and the temperature of the control volume. The parameters si and se are the specific entropy rates of input and output flows circulating throughout the boundaries of the system.
The exergy destruction rate of each single stage of the Rankine cycle has been calculated by applying the exergy rate balance considering the steady-state system (Equation (4)):
is the work transfer rate for each stage of the cycle whereas and refer to exergy rate entering and exiting the system, respectively. The exergy associated with the heat transfer rate has been calculated using Equation (5):
In this case, T0 is the reference environment temperature and Tj is the system boundary temperature.
According to Kotas [50] the general expression of exergy rate is obtained from the sum of four components, i.e., kinetic, potential, chemical and physical (Equation (6)):
The kinetic exergy is related to orderly particle trends, while the potential exergy refers to its elevation. The chemical exergy takes into account differences in concentration and molecular structure [44]. In the present initiative, the kinetic and potential components were omitted due to the negligible effects over each single step under analysis. Since the working fluid is only water, there is no chemical exergy involved, thus the exergy rate associated with a matter stream will be estimated by its physical exergy rate that can be calculated by Equation (7):
The parameters and are, respectively, the specific enthalpy and entropy at the reference environment temperature.
Exergy destruction rates associated to water and condensate pumps, deaerator vessel and desuperheater system were calculated separately, using the Equations (1)–(7). In the present study, this group of single units was generically defined as ancillary equipment.
The thermodynamic analysis has been carried out from process indicators as: (i) Exergy efficiency (expressed as %); (ii) Specific net power output and the amount exported to the grid (kWh/t sugarcane); and (iii) Cooling tower and deionized boiler make-up water consumption (kg/t sugarcane). The exergy efficiency of the system () was assumed as the ratio between the useful exergy it provides (i.e., the exergy content of the thermal energy demanded by the industrial processes and also the net power output from cogeneration) and the total exergy fed to the boiler (Equation (8)) [37]. Eboh et al. [13] agree that is the most suitable parameter for evaluating the thermal system performance:
represents the exergy rate of process steam that is consumed for the production of ethanol (Equation (7)). The refer to, respectively, the cogeneration net power output and fuel exergy rate.
According to Oliveira Jr. [44] the exergy content of the fuel can be estimated by its Lower Heating Value. In the present study, the boiler feed is composed of bagasse and straw. Their exergy rates are assessed by Equation (9) and from data described in Table 1:
The consists of the difference between total power generated and the power consumed by pumping water and condensate within the Rankine cycle. The total power generated by the turbine generator set is calculated by combining the electric generator efficiency (Table 1) and mass and energy balances (Equations (1) and (2)) with isentropic efficiency (), which can be assessed by Equation (10) for each stage of the steam turbine.
The and are actual specific enthalpy entering and exiting the real system, respectively. The specific enthalpy for isentropic process is . For all scenarios, a steam turbine with an isentropic efficiency = 85% was adopted. Likewise, by using isentropic pump efficiency, it is possible to estimate the power consumed by the pumps by combining Equations (1) and (2). The turbine and pumps have been modelled as adiabatic systems.
Net power exported to the Brazilian grid can be understood as the electricity delivered to the electricity supplier, calculated as the difference between the net power output and the power destined for distilling ethanol [37], presented in Table 1.
Besides, the quality of the turbine exhaust steam is assessed by knowing the specific enthalpy and temperature (two independent, intensive thermodynamic properties) using EES database [51]. For all case scenarios, no potential turbine blade erosion problems caused by moisture were found, since the simulations showed minimum exhaust steam quality of 95%. Figure 1 exemplifies results for a scenario in which the boiler is fed only by bagasse and superheated steam leaves the unit at 67 bar and for exhaust steam quality (at the outlet of the turbine) of 95.2% (45.8 °C and 0.1 bar).
The cooling tower and deionized boiler make-up water consumption can be assessed by applying Equations (1) and (2) on the cooling tower, desuperheater and deaerator. Deionized water is used to supply only the desuperheater and deaerator. It was adopted that 90% of total saturated steam used for ethanol production returns as condensate into the deaerator vessel and 5.0% of the cooling tower recirculating water flow is lost to drifting, evaporation, and removal of solids [37].
4.3. Environmental Impacts Assessment
Environmental performance was determined according to the Life Cycle Assessment (LCA) technique. LCA is a diagnostic methodology, evaluating environmental impacts of a product (or process) along its entire life cycle. This approach encompasses all the anthropic interferences over the environment from the extraction of natural resources, which are necessary for its production (or installation), to its final disposal (or decommissioning) [52].
An LCA is comprised of four phases: Goal and Scope definition, Life Cycle Inventory analysis (LCI), Impact assessment (LCIA) and Interpretation [53]. The purpose of the study and some of its structural elements (e.g., the functional unit for the analysis; dimensions of the system; criteria for data collection and data quality; treatment of multifunctional situations; and methods for impact assessment) are established during the Goal and Scope definition phase. LCI identifies and collects data for quantifying environmental aspects, i.e., inputs and output matter and energy flows associated to each stage of the life cycle crossing the boundary defined between the system and the environment. In the LCIA, potential adverse effects over the environment and human health, provided by the environmental aspects, are expressed in terms of descriptors of impacts. This diagnosis is called environmental impact profile of the product (or process) under analysis [52].
The environmental impact profiles for the scenarios defined in this study have been determined by attributional LCA, following a ‘cradle-to-gate’ approach, whereby only the production chain is considered. In general, the product system is composed by two anthropic stages: (i) the sugarcane cultivation; and (ii) the ethanol production, to which the cogeneration is directly associated. Although the focus of this research is the generation of surplus electricity, the main product of the autonomous distillery is anhydrous ethanol. Thus, in order to avoid a possible influence of this parameter on the thermodynamic and environmental analyses, we decided to keep the fuel production rate constant. This simplified the study for: (i) the amount of sugarcane produced in the agricultural stage becomes fixed; and, therefore; (ii) the amount of bagasse generated in the milling is also invariable for all scenarios.
During the LCI phase, environmental aspects have been estimated according to Equation (11). Figure 2 depicts the stages of a generic supply chain.
In that arrangement, the ‘Stage 1’ refers to the industrial ethanol processing and ‘Stage n’ the very first anthropic action performed in order to extract material and energy resources from the environment:
is the sum of occurrences of a certain environmental aspect (i) throughout the supply chain; is the environmental aspect (i) due to a certain stage (s) of the supply chain, and represents the amount of product obtained in the same stage (s). The factor refers to the ratio between the consumed inputs (I) and the product (P) in a certain stage of the supply chain.
Once each environmental aspect has been estimated, the LCIA phase performs the calculation of the category indicators of environmental impact by using Equation (12):
is the indicator for a certain environmental impact category (c) and is the impact factor (or the characterization factor) to be applied in order to describe the total contribution of certain amount of an environmental aspect () in terms of an impact category associated to it.
4.4. Effect of Synergy between Thermodynamic and Environmental Indicators within the Scale up Process
In the final stage of the study, the thermodynamic and environmental dimensions were associated for a coordinated, or synergetic, verification of the trends of the cogeneration scale up. As suggested by standard ISO [53] for similar cases, the development took place out of normalized and dimensionless indicators of each strand, obtained from Equations (13) and (14):
is the normalized exergy destruction indicator for scenario (j). This value is obtained from the ratio between the quotient of —the total exergy destruction by the cogeneration cycle of (j)—and , and the maximum exergy destruction among all scenarios.
Likewise, represents the normalized indicator for a certain impact category (c) under the assumptions considered for each scenario (j), whereas refers to the maximum value of the indicators regarding environmental impact (c) considering all scenarios. The combined indicator for scenario (j) can be calculated by taking into account both normalized indicators as described in Equation (15):
Be it noted that the value of was determined for each situation by the simple product among the normalized indicators. This decision was made to avoid possible distortions deriving from the use of coefficients or even of mathematical operators, due to the overlap of one dimension of analysis over the other.
4.5. Life-Cycle Modelling
This study followed the ISO 14044 standard guidelines [53]. The software SimaPro 8—version 8.1.1.16 (PRé Consultants BV, Amersfoort, The Netherlands) was applied in order to prepare the LCI and to perform the LCIA. The calculations performed for every scenario were based on technological and operative requirements of a typical autonomous distillery of anhydrous ethanol (Table 1). The Functional Unit (FU) (i.e., a calculation basis for which resource consumption and emissions occurring along to the life cycle under analysis are related) established to this LCA was ‘to provide 1.0 MWh of electricity to the Brazilian electric grid from cogeneration using sugarcane as biomass in a Rankine cycle with reheating of high pressure steam’.
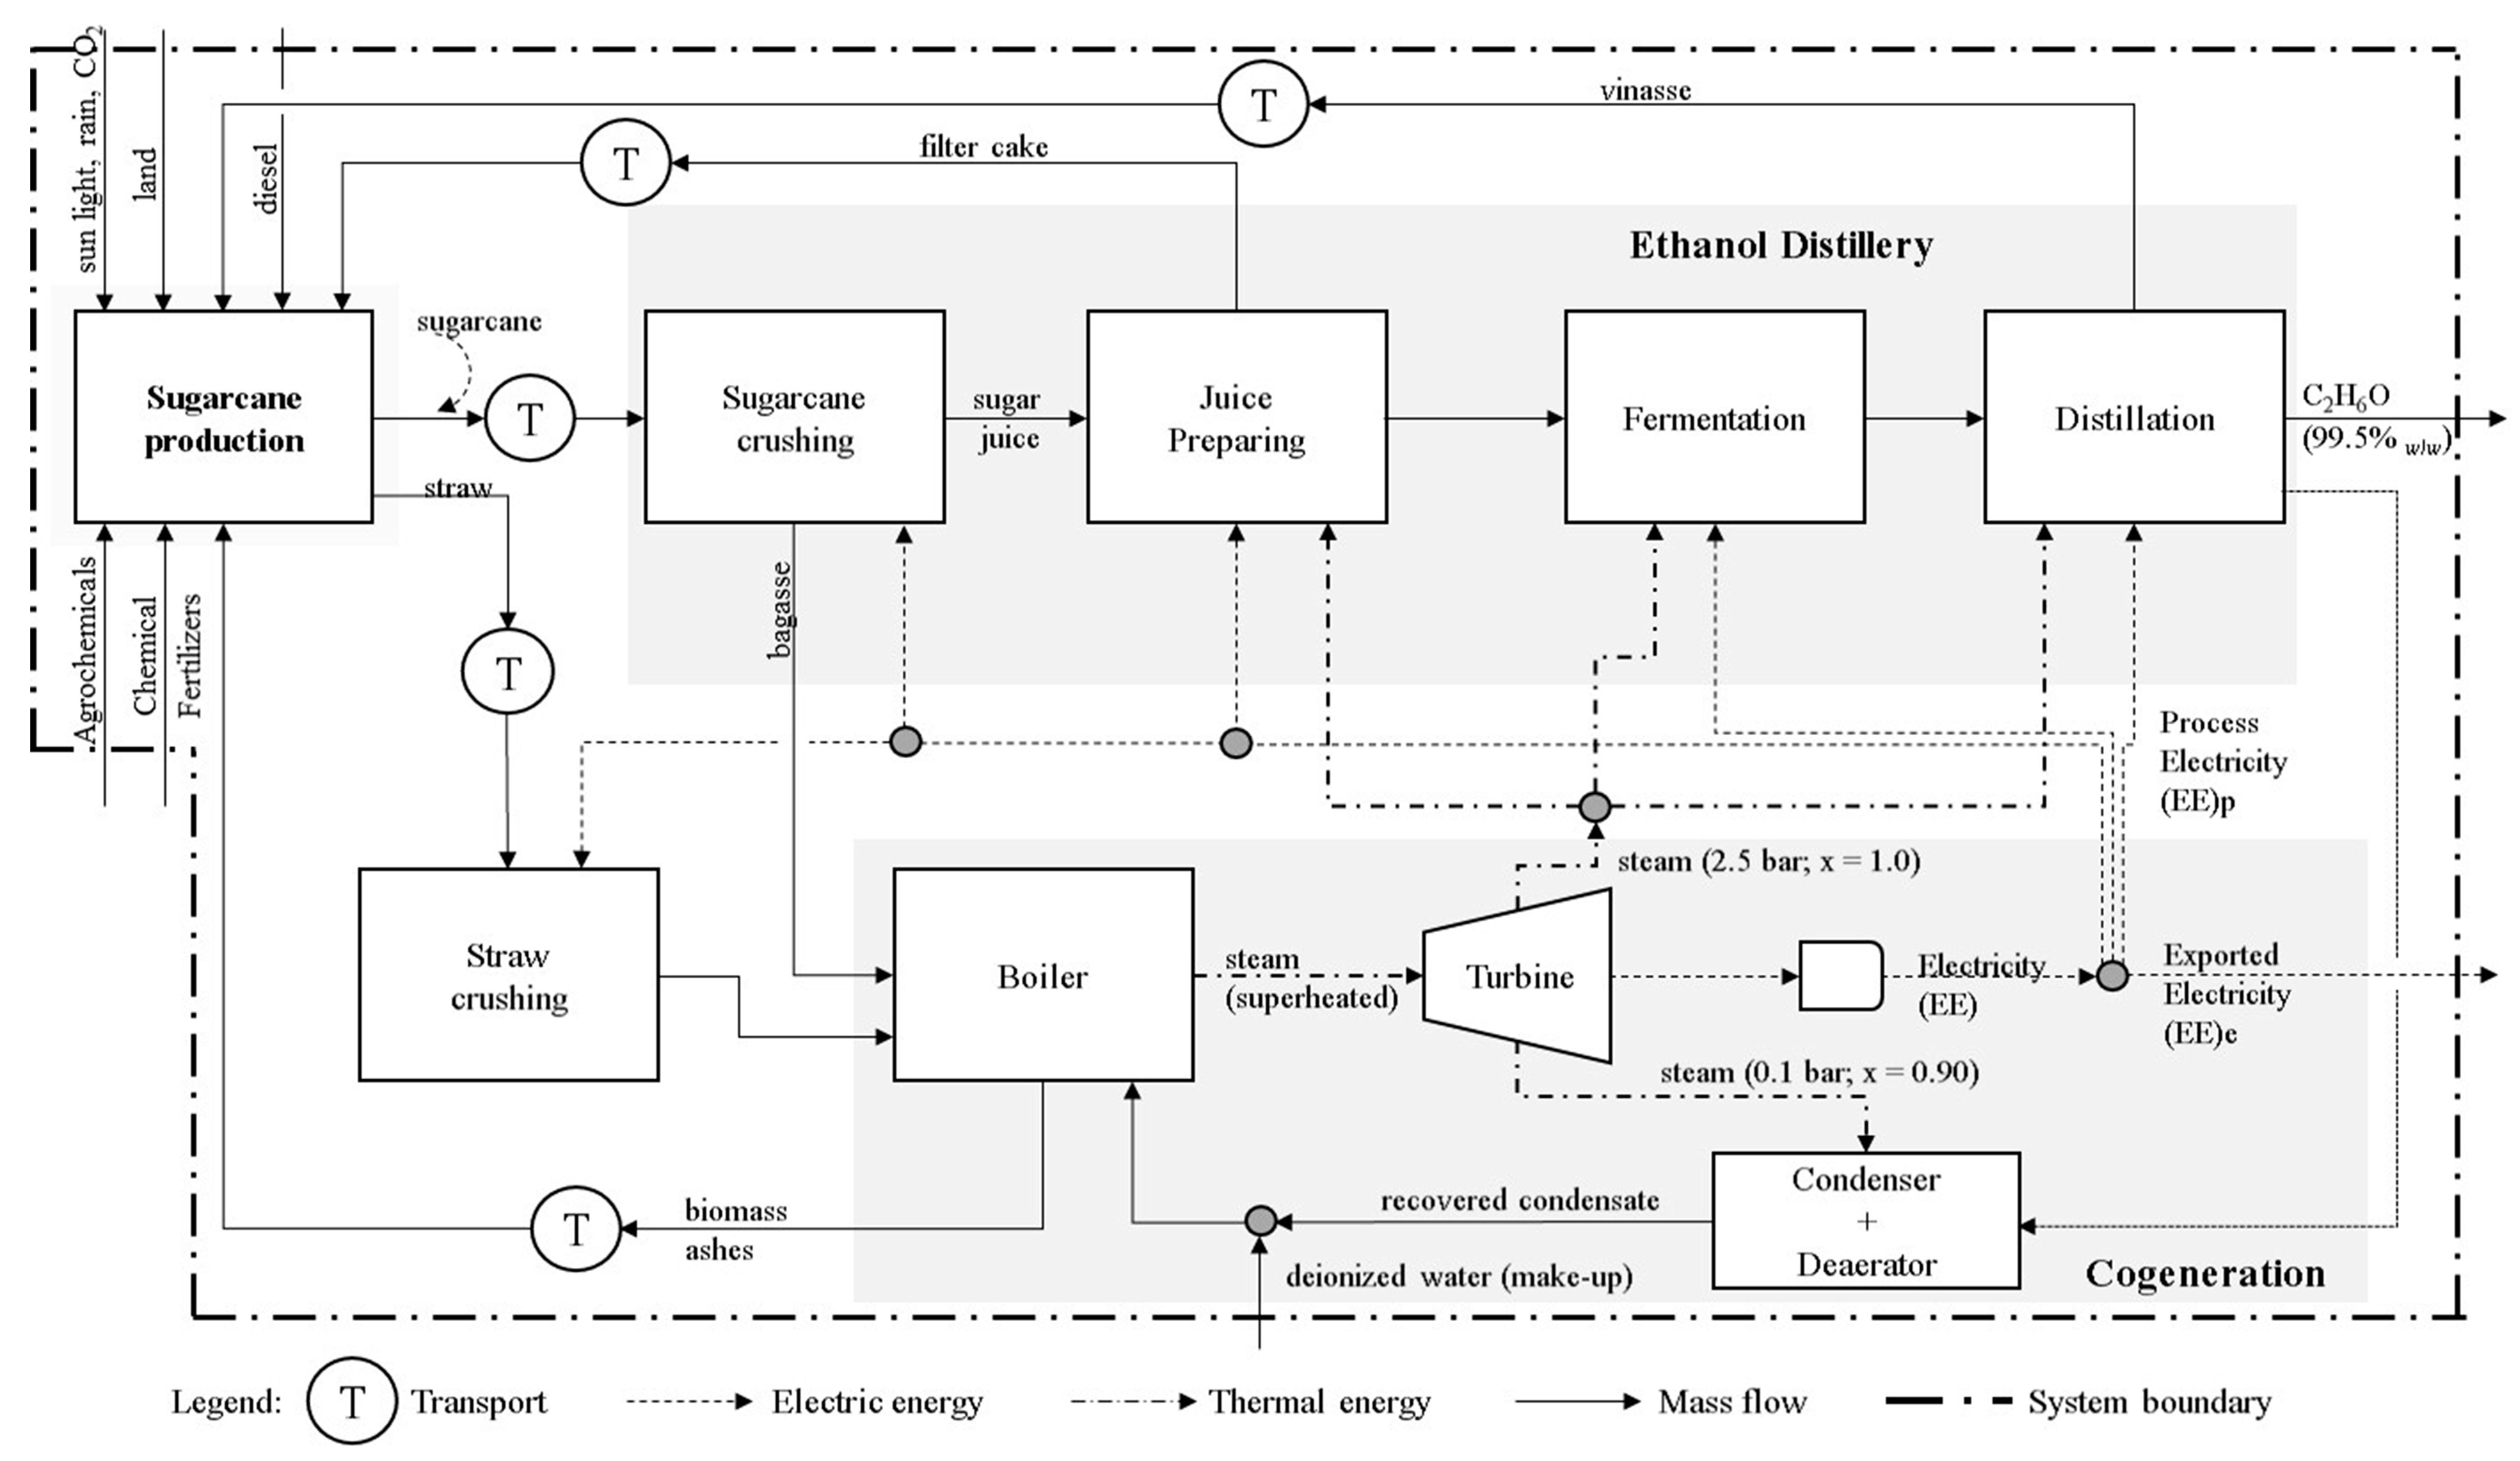
The Product System (Figure 3) includes the agricultural stage of sugarcane cultivation, and the industrial subsystems of synthesis of C2H6O (99.5% v/v) and cogeneration of heat and electricity. The sugarcane and straw transportation from the fields to the industrial facility is also a stage of the same arrangement, as well as the returning of vinasse, filter cake, and distillery ashes to the farms.
Regarding data sources, secondary data were collected to model most of the stages included in the product systems. The LCI built up for the agricultural stage considered data obtained from [37,54,55,56,57,58,59,60,61,62,63].
The manufacturing of urea, SSP, and KCl was adapted from the datasets “Urea, as N, at regional storehouse/RER U”, “Single superphosphate, as P2O5, at regional storehouse/RER U”, and “Potassium chloride, as K2O, at regional storehouse/RER U” from the Ecoinvent database [55].
The syntheses of agrochemicals were addressed by a similar approach: carbofuran: “Carbofuran, at regional storehouse/RER U”; diuron: “Diuron, at regional storehouse/RER U”; and glyphosate: “Glyphosate, at regional storehouse/RER U” are datasets also available in Ecoinvent [55]. In contrast, the manufactures of hexazinone and tebuthiuron were modeled from the generic inventory “Pesticides unspecified, at regional storehouse/RER U.” Moreover, the datasets “Limestone, milled, loose, at plant/CH U” (Ecoinvent) and “Diesel, at refinery/I/US” (from the U.S. Life Cycle Inventory Database—USLCI) have also been adapted in order to represent inputs and outputs associated to the production of those ancillary materials in Brazil [49].
Chemical fertilizers and other inputs transportation was modeled after considering average distance values. Regarding transoceanic displacements, as it occurs with KCl, data from SeaRates© (SeaRates LP, Edinburgh, UK) [64] were used. Finally, the modeling of the electricity generation considered data from [65], adjusted for the Brazilian 2015 grid [49,66].
The stages of ethanol production and cogeneration received a different treatment, being modeled from primary data, obtained from a distillery whose operational conditions satisfactorily matched the technological pattern of most similar plants located in the State of Sao Paulo. These datasets were checked against typical indicators of the sugarcane sector, obtained from [18,36,61,62,63,67,68] for reliability. Infrastructure elements and capital goods were disregarded after a screening analysis indicated that those issues had negligible influence on the environmental performance.
In terms of data quality, the Temporal Coverage for data collection comprised the period 2013–2015. Due to the reasons already mentioned, the Geographical Coverage included the state of São Paulo, and Technological Coverage represents the technical and operative status presented before in Section 3. An average distance of 32 km between the cultivation areas and the industrial facility has been defined, based on surveys conducted by Sugawara [60] for productive units located in the zone. This specification was evenly adopted for modelling every road transportation in the system (sugarcane, straw, vinasse, filter cake, and ashes). We excluded from the environmental analysis any flow whose cumulative contribution was less than 2.0% of the total amount of mass (or energy) entering or leaving any stage of the life cycle. Environmental significance was also applied as a cut-off criterion for system modeling, as specified in ISO 14044 [53].
The multifunctional situations identified in the product system were dealt with by allocation procedures [53]. For scenarios IV–X, the allocation of the environmental loads generated in the agricultural stage of sugarcane and straw occurred by mass criterion, resulting in a partition of [92.4: 7.60]. Mass allocation was also applied to sugarcane milling and, thus, the environmental loads accumulated in this stage were divided between bagasse and sugar juice in the ratio [21.5: 78.5]. The approach for distillery products (ethanol, vinasse, and filter cake) was slightly different. Because of the high market interest in C2H6O, the loads totaled up to that stage were fully attributed to it. As for cogeneration, we decided that allocation should follow an energy criterion. For this reason, the load sharing factors among surplus electricity, electricity consumed at the distillery, and process steam were specifically determined for each scenario, ranging from (16.8–40.4), (7.60–9.20) to (51.9–74.0), respectively. Considering the criterion used, there was no attribution of environmental loads to the ashes.
Potential environmental impacts due to emissions occurring throughout the product system were calculated by the method ReCiPe—midpoint (H) version 1.11 [69] considering the impact categories of Climate Change (CC), Particulate Matter Formation (PMF), Water Depletion (WD), and Fossil Depletion (FD).
The absence of impact assessment methods focusing specifically the Brazilian biomes [70] motivated a survey regarding such topic and the methodological approach provided by ReCiPe was consistent with the expectations of this investigation. Moreover, the selected impact categories are coherent with a processual arrangement which associates transformations in the agricultural and industrial domains, as it is the case with cogeneration in an autonomous ethanol distillery.
5. Results and Discussion
5.1. Thermodynamic Analysis
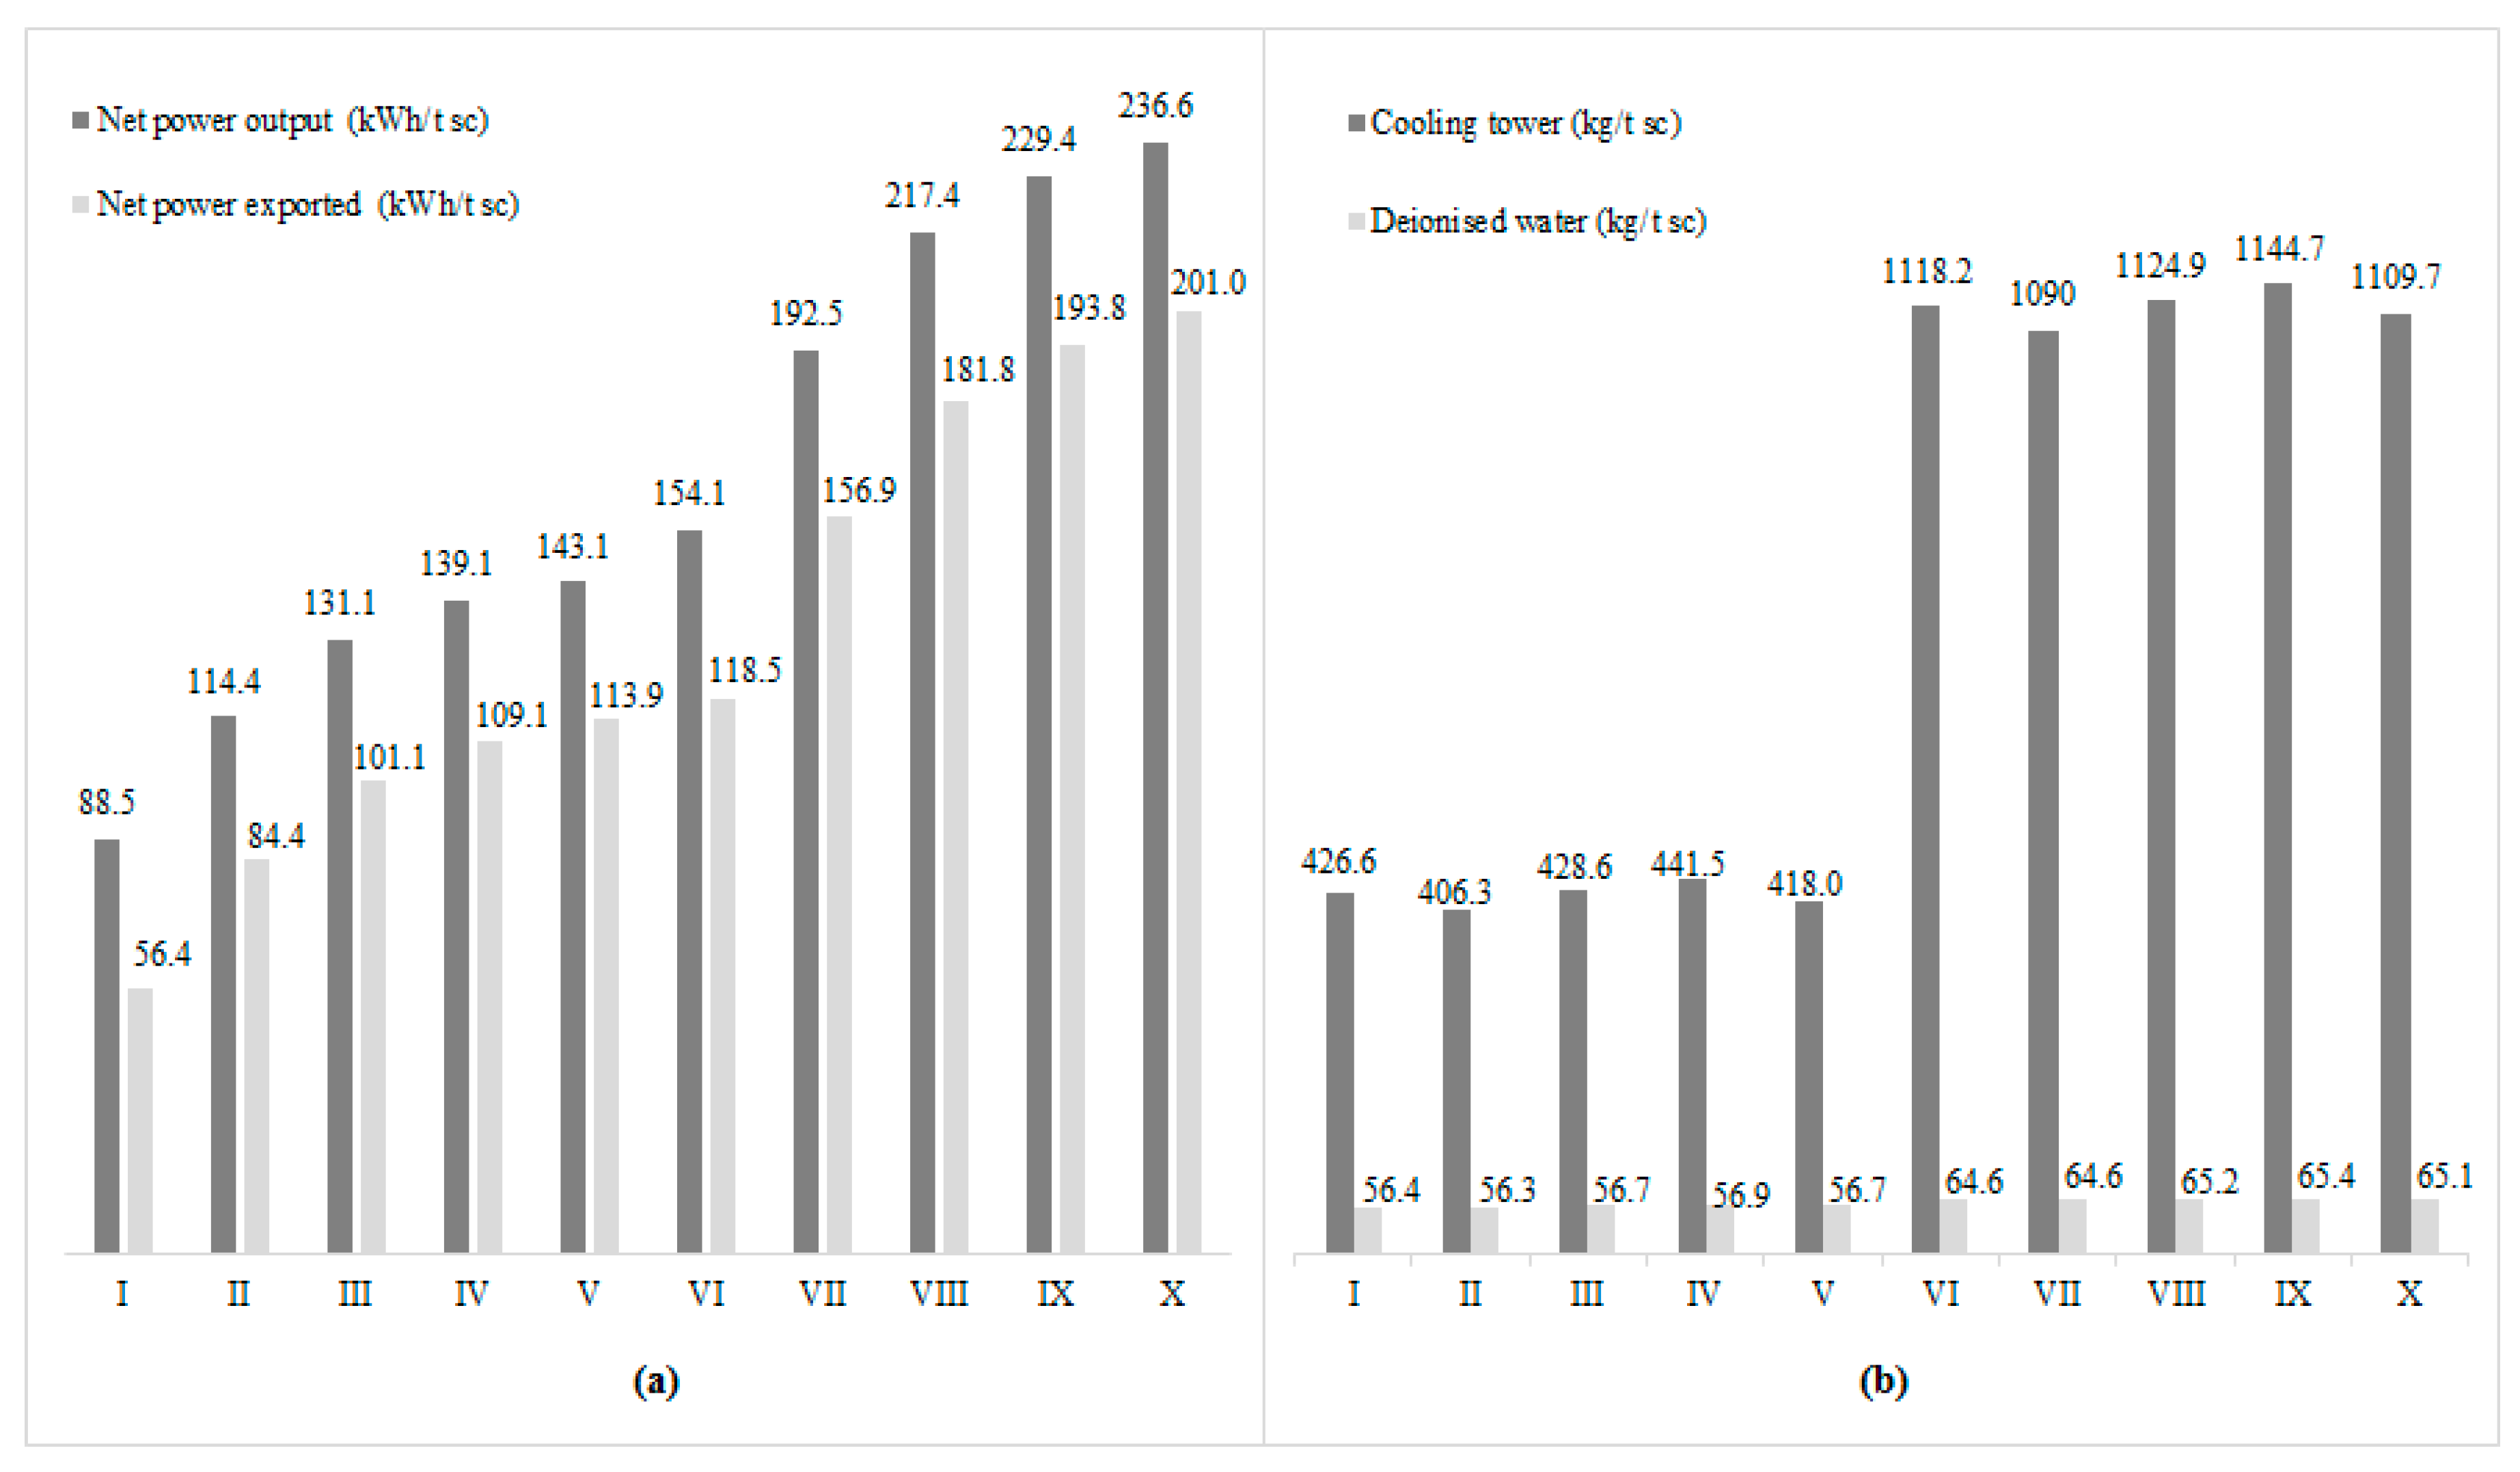
Figure 4 depicts results of thermodynamic indicators for each analyzed scenario. Regardless whether or not straw is being burned in the boiler, both the exergy efficiency and the net power output tend to increase as the steam extraction pressure rises. An increment of steam pressure conditions in the Rankine reheating systems can reflect in an exergy efficiency improvement of up to 37% for scenarios with no added straw (I–V). Moreover, the total electricity generated at the maximum operating pressure of the boiler, 100 bar in scenario V, reached 144 kWh/tsc, a growth of about 63% in relation to scenario I in which steam exits the boiler at 20 bar. These findings can be explained by the exergy diagnostic to be described and discussed below.
In terms of net power exported, when the specific consumption of the distillery is deducted from the total electricity produced, the difference between V and I is even more remarkable, reaching 102%. For scenarios in which bagasse is fed to the boiler together with 50% w/w of the straw generated by the agricultural stage (VI–X), the specific production rates of total and exported electricity are naturally higher than those on the previous set. This finding comes from the direct comparison between scenarios with identical conditions of pressure and temperature for the extracted steam. In terms of power output, the addition of straw was converted in increases ranging from 65 (scenarios IV→IX and V→X) to 74% (I→VI), whereas for power exported to the grid, benefits ranged from 76 (V→X) to 110% (I→VI).
Conversely, when incorporating straw to the biomass to feed the cogeneration, the energy gains between extreme pressures (VI and X), of 54% to net power output and 69% to exported electricity, are lessened in comparison to the counterparts operating exclusively with bagasse (I and V). These findings encourage further studies to estimate the rate of return on investments made in cogeneration systems with reheating, which were designed to operate at high pressures.
In terms of water consumption, there was no significant trend from varying the boiler pressure design. A reduction in water consumption for the cooling tower would only occur by increasing the exergy efficiency of the Rankine cycle that depends on the heat rejection in the tower-condenser assembly.
The phenomenon occurs because of the increase of thermal transfer from the biomass to the cycle working fluid as the boiler pressure and its thermal efficiency rise. It is worth mentioning that increases in energy transfer and boiler efficiency boost the electricity generation, but they also raise the rates of heat rejection, thus predisposing that more water is consumed to replace the losses in the tower to evaporation, drag and purge [44].
In contrast, the addition of straw to the system significantly affects water consumption. When compared to their counterparts (I–V), the VI–X scenarios showed 15% increases in deionized water demand, and approximately 2.6 times make-up water expenditure in the cooling tower. This effect does not come as a surprise since the additional energy provided by the straw was used for the production of power output in the cycle, with the steam circulating through the stages of the turbine and rejecting the heat via the condenser and evaporative tower assembly, causing an expected increase of make-up water supply.
In fact, an additional source of energy in the boiler results in a greater thermal energy transfer from biomass to working fluid and consequently increases the electricity generation. Nevertheless, once again it causes more heat rejection and, then, more make-up water is needed to supply the losses in the cooling tower [15,71]. Table 3 details the exergy destruction for each proposed scenario based on exergy balances applied on every single step of the Rankine cycle and on the overall cogeneration unit.
The highest exergy destruction derives from the boiler, mostly due to the irreversibility generated by thermal transfer and the intrinsic nature of the combustion process, which is carried out into the furnace. If such irreversibility cannot be eliminated since the combustion process is associated to an increase of entropy, it would be at least be possible to reduce it by implementing three actions: (i) improving operational control (in terms of proper purge rate control); (ii) adjustment of the air-fuel ratio; and (iii) review of the technological concept adopted for the configuration working pressure–insulation. Most of these practices are currently applied on high pressure boilers, which rely on advanced technological concepts during their project design and operation. This results in lower energy losses and better thermal efficiencies as it was noted in the data collected by Guerra et al. [37]. These conclusions help explain the decrease of boiler exergy destruction in high-pressure cogeneration systems.
All these options can reduce losses in terms of convection and radiation, which occur both in the pressure vessel and pipes [13,72]. According to Oliveira Jr. [44], an increase of the steam’s working pressure, combined with the concept currently adopted for construction of high-pressure boilers, would also reduce energy losses and irreversibility. The result justifies the decreases regarding the total exergy introduced by the biomass from 69 to 58% as the boiler pressure rises, both from scenario I–V, and from VI–X.
For scenarios I–V, the exergy destruction in the turbine increased 63% (1.90%→3.10%). This rise is associated with greater energy conversion over the turbine stages due to the increase of steam flow that generates more shaft work. A similar behavior was noticed in the turbine with added straw, with a 54% increase in the exergy depletion taking place from VI→X. Figure 5 consolidates the exergy diagnostic presented in Table 3. The exergy contributions related to the condenser were not indicated in this picture. Nevertheless, these values can be estimated by difference in relation to the totality.
The overall exergy efficiency of the system rises with increasing boiler pressure, regardless of whether or not the straw is incorporated into the biomass. However, for similar conditions of pressure and temperature, the exergy efficiency with a mixture of bagasse and straw was always lower than that obtained only with bagasse. This occurs because the estimate of these parameters depends on the balance between energy sources, heat (as steam to process) and electricity, in the power generator.
Thus, under the same operating conditions, the higher the fraction of energy used in the form of steam, the greater the efficiency of the Rankine cycle of cogeneration. In the case of cogeneration, steam is a final product; when it is extracted from the turbine to be used in the distillery, it no longer participates in the conversion processes in the turbine and generator, in which there are associated irreversibility and significant rates of exergy destruction.
In this study, steam consumption for ethanol production was the same for all scenarios (400 kg/tsc). The additional thermal energy in the boiler from straw burning was largely transferred to the working fluid, converted into mechanical energy in the turbine, and, then, into electricity in the power generator. Every single step in this arrangement causes an additional irreversibility to the process. Examining this approach, comparisons between exergy efficiencies for cogeneration systems become more reasonable when analyzing scenarios with the same thermal energy feed in the boiler and steam consumption in the process.
No significant fluctuations of exergy destruction in the condenser have been noticed when pressure and temperature in the boiler were increased. The parameter remained stable around 1.10% for scenarios I–V and of about 2.00% for VI–X. The results indicate that the losses occurred in the condenser are of “low quality energy” and, hence, have little potential to bring about change. This energy is, therefore, in thermodynamic and chemical conditions, quite close to the form of energy environment, almost reaching the ‘dead state’. Based on this diagnosis, recovering the energy lost in the condenser would not be recommended. Finally, for all scenarios assessed, the exergy destruction in the ancillary equipment rose gradually as the boiler pressure increased.
As mentioned before, boosting the working pressure and improving the boiler technological concept provide greater heat transfer to the working fluid. Thus, there is considerable capacity for work fluid recirculation and, consequently, more work is consumed by the condensate pumps and feed pumps, resulting in an important rate of exergy destruction. Although we noted that the greater the operating pressure, the greater exergy destruction rate in the turbine and ancillary equipment, the global energy balance to the cogeneration system is positive. Additionally, an improvement on cycle exergy efficiency is projected, offset by the lower exergy destruction rate in the steam generator.
5.2. Environmental Analysis
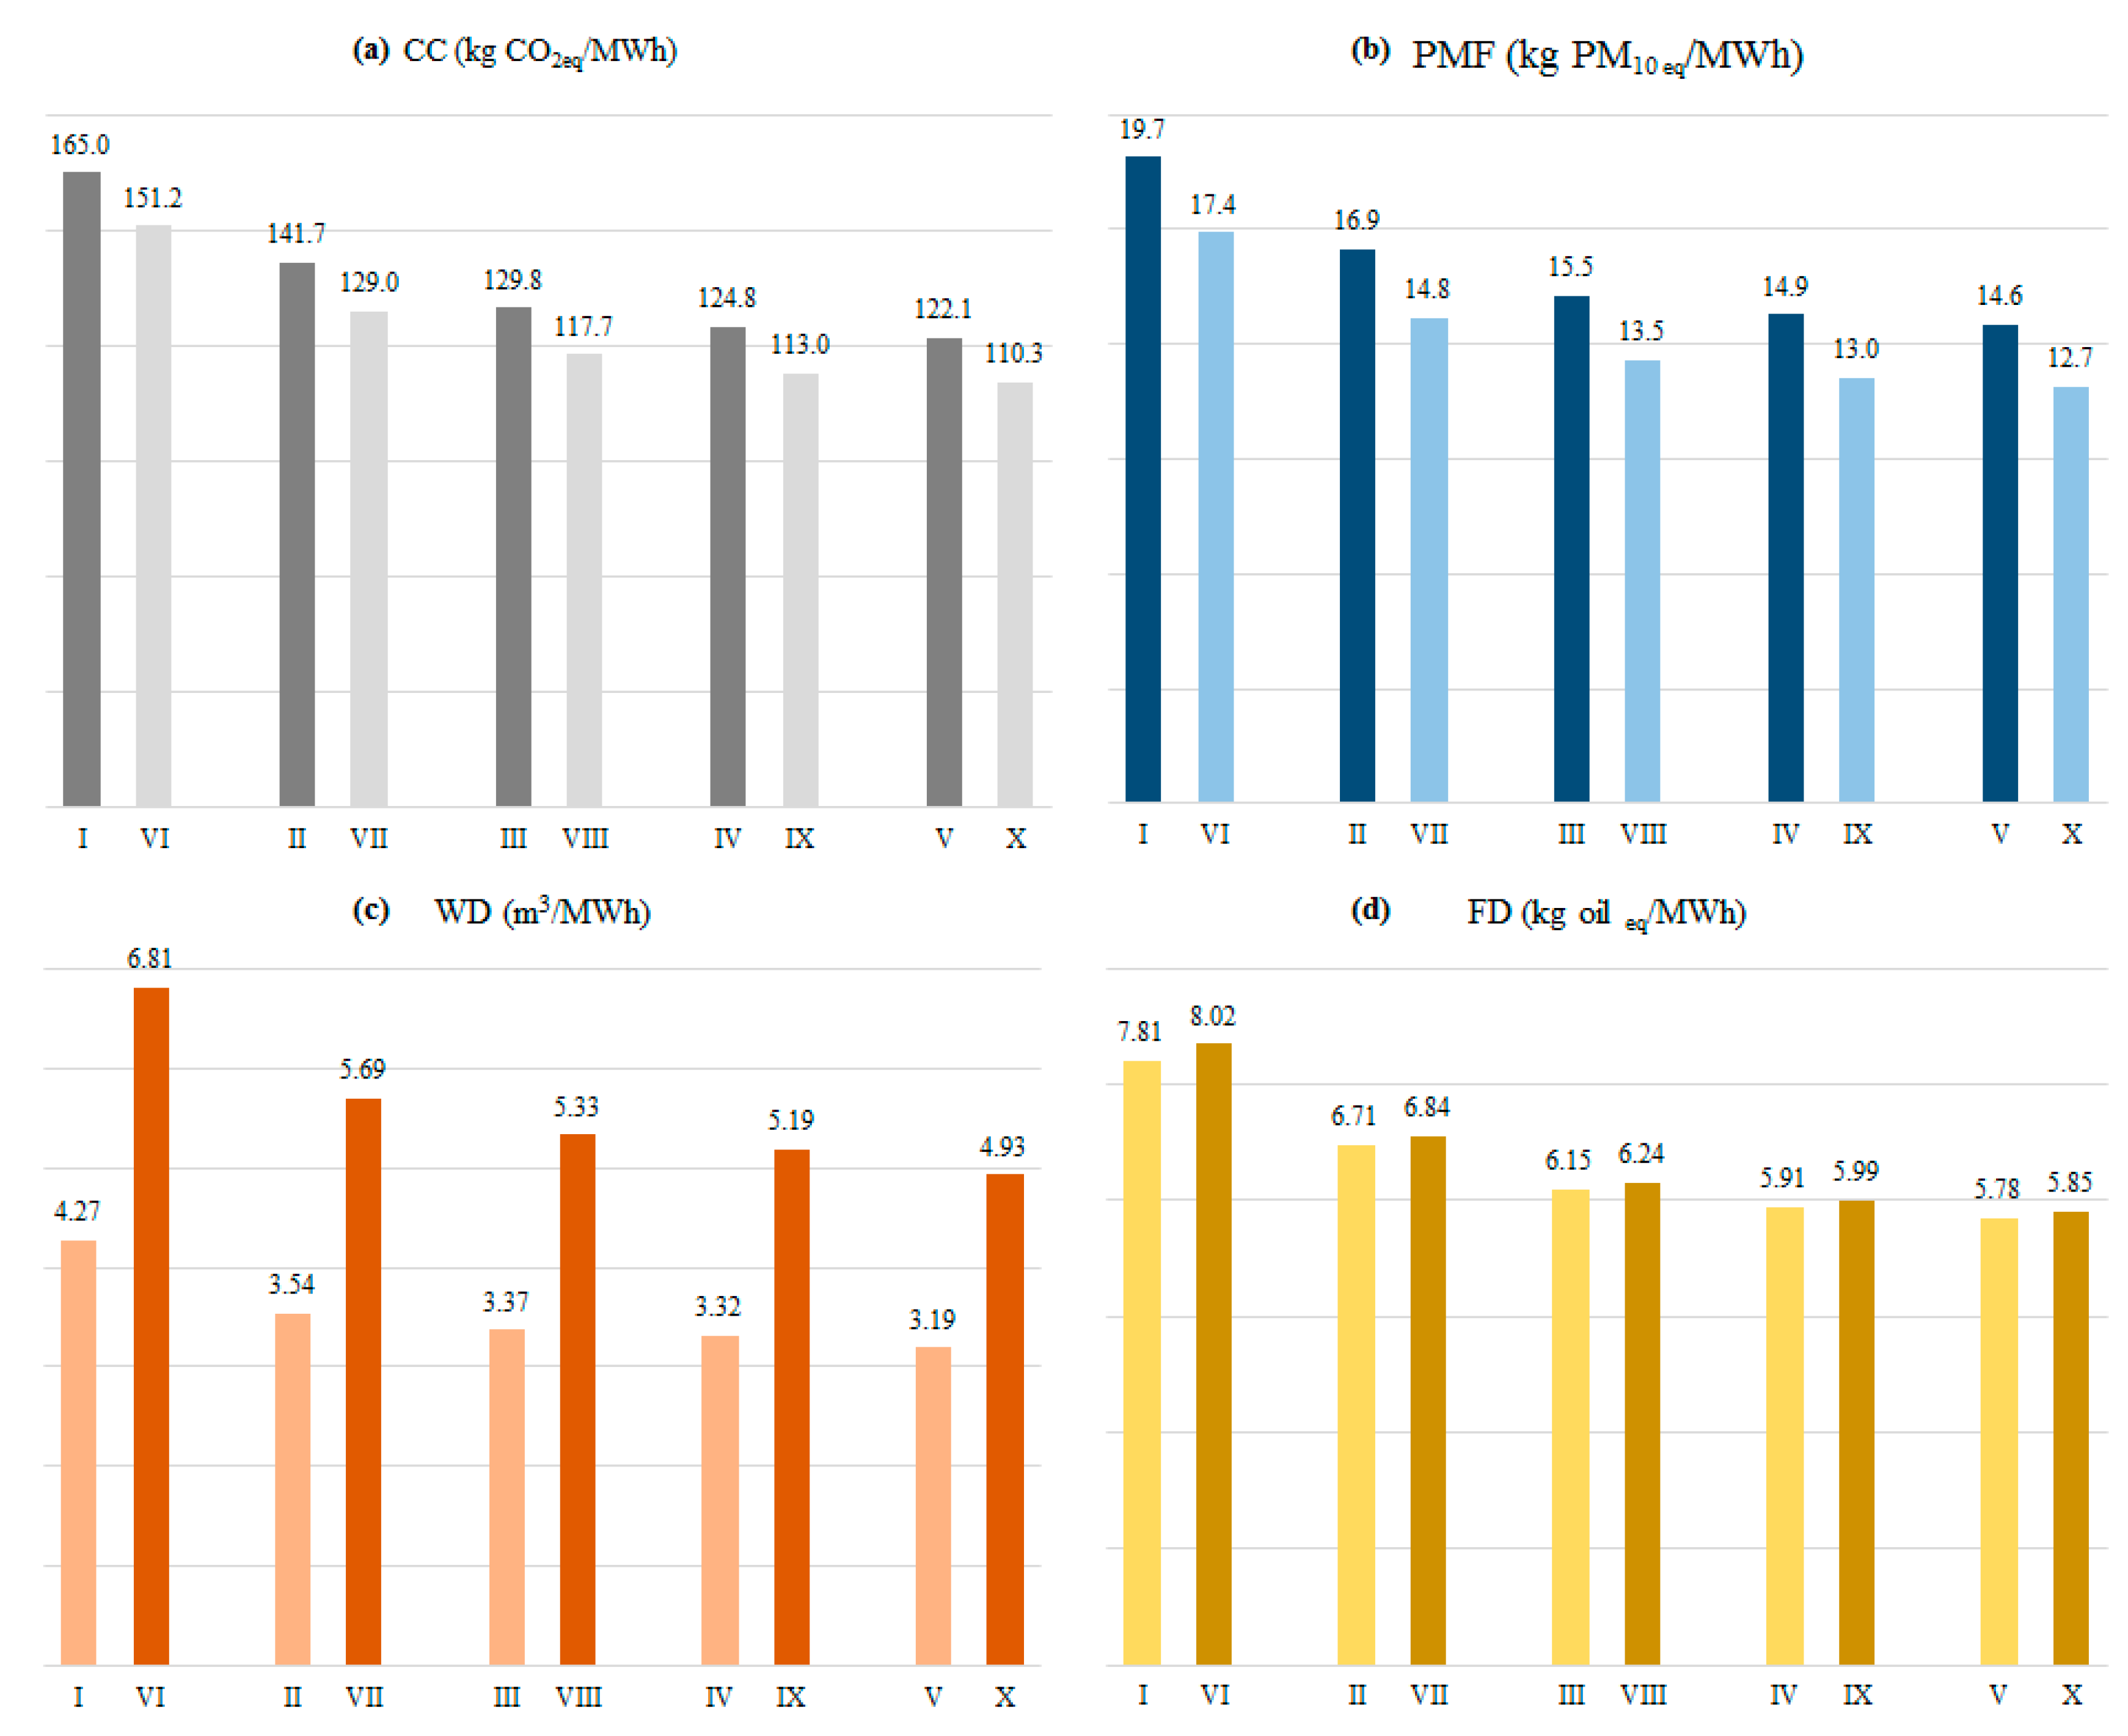
The LCA carried out in this investigation allows the identification of both the stages of the life cycle with major contribution on environmental impacts and the most impactful substances. Table 4 displays an overview of the environmental performance profiles for generating 1.0 MWh of electricity along the different scenarios under analysis. Figure 6 rearranges this data in order to highlight the consequences of incorporating straw to the biomass. Generally, a steam pressure output increase is accompanied by environmental impacts reduction with respect to all evaluated categories. Despite the inclusion of straw as a supplier of energy, the impact reductions ranged from 26 (I–V) to 27% (VI–X) for all analyzed categories.
The decrease in systemic impact can be explained by the exergy analysis presented in Section 5.1. As discussed before, the higher pressure provided an overall reduction of irreversibility of the cycle and consequently an improvement on exergy efficiency. This enabled an increased surplus electricity to be exported to the concessionaire from the same consumption of energy inputs.
Still in this preliminary approach, it is important to observe how the results from Table 4 strongly depend on the allocation criteria adopted for the treatment of multifunctional situations. As the steam and electricity consumptions in the distillery are the same for every scenario because the production of ethanol was established as a modeling assumption, the environmental loads associated with those flows will be lower as the generation of surplus electricity increases.
When comparing the results obtained with and without straw, there were different behaviors in each impact category (Figure 6). Regarding CC, the use of straw reduced the emissions of GHG for all pressure conditions. These effects were even strengthened according to the increase in pressure (I→V and VI→X). Thus, the performance comparison when the system operates at 20 bar (I vs. VI) projected an impact reduction of 8.4% from the straw addition, whereas at 100 bar (V vs. X) this depletion was 9.7%. This occurs because there is no longer burning sugarcane straw in the fields, and part of it is used in the boiler under controlled conditions to convert thermal energy into useful work in the cogeneration system.
The process of manual sugarcane harvesting includes a prior cleaning of the field. This takes place by burning straw, and is justified by several reasons, including: (i) to cause an increase in soluble solids (° Brix) and plant fiber due to the drying of the stalks; and (ii) to facilitate harvesting and making it less costly [48]. The conditions under which straw burning is carried out in the field favor the formation of reduced carbon compounds, also of biogenic origin, in particular non-methane volatile organic compounds (NMVOCb), carbon monoxide (COb), and methane (CH4,b)—the latter being a gas that integrates the cast of CC precursors.
In contrast, when straw burning occurs in the boiler, it improves emissions of biogenic carbon dioxide (CO2,b), formed from carbon fixed taken from the atmosphere (CO2,air) by means of sugarcane photosynthesis. The method used by the IPCC for quantification of CC does not acknowledge CO2,b as a precursor of CC, considering its emission rate in equilibrium with that of CO2,air [54]. Finally, it should be highlighted that the benefits provided by straw burning in the boiler surpass the additional impacts caused by its baling, transporting, and milling.
The agricultural stage, the cogeneration, and sugarcane transportation were responsible for the impacts of CC with respective contributions of 72%, 16%, and 5.4%, for scenarios I–V. When straw is consumed in the process (VI–X), a decrease (to 68%) in the contribution of the agricultural stage is confirmed, at the same time that increases in cogeneration (19%) and transport (5.7%) occur. Lastly, straw baling accounted for 1.3% of impacts for CC.
The most important precursor of CC for all the scenarios was CO2 from land transformation, contributing to 51% of the total impact. There are also air emissions of dinitrogen monoxide (N2O) due to the oxidation of N-fertilizers because of the sugarcane burning, vinasse and filter cake application, and the diesel combustion in agricultural machinery, accounting for 22% of the category impact. They are followed by emissions of fossil CO2 (19%) from diesel combustion in machinery, application of urea, and lime. Finally, air emissions of CH4,b, which in scenarios I–V are due to the burning of sugarcane crops, add up to 3.3% of CC impacts.
Regarding PMF, the use of straw in the boiler provided better results in all pressure conditions. The reductions of 12% from I vs. IV, and 13% for V vs. X are mainly related to the controlled conditions in which the intrinsic energy of straw is converted into useful work in the steam generator. The precursors of PMF are concentrated both in the agricultural stage and the cogeneration system. In the set I–V, these processes accounted for 90% and 9.4%, respectively, and in VI–X, the agricultural stage participated with 88%, whereas the contribution of the cogeneration reached almost 12%.
Releases of particulate matter with diameter Φ < 2.5 μm (PM < 2.5) provided the greatest inputs for PMF impacts for all the assessed scenarios. These pollutants represented 89% of the impacts in I–V, and 91% in VI–X. Straw burning for manual harvesting and combustion of diesel in agricultural machines were responsible for 97% and 96% of emissions in each case. Cogeneration contributed with 3.2% in I–V, and 3.8% in VI–X, respectively. If straw is used in the boiler, emissions were lower because of the combustion control. In this case, the emission of particulate with diameter Φ < 10 μm (PM < 10), typical for the cogeneration, falls from 9.2 to 6.9%. Nitrogen oxide emissions (NOx) accounted for 1.7% and 1.6% of impacts, respectively, in I–V and VI–X. The results suggest (i) low contribution of NOx for PMF; and (ii) a small influence of straw in the emission of this pollutant.
Using straw in cogeneration resulted in significant reductions of the impacts for CC and PMF. However, Figure 6 shows that this option worsened the impacts for WD and FD. Regarding WD, there was an average increase of 59% in water consumption as 1.0 MWh of electricity is exported to the concessionaire. This effect is mainly associated with the cogeneration system, and can be explained through the thermodynamic analysis.
As discussed in Section 5.1, the additional heat transfer from biomass (bagasse + straw) to the working fluid raises the net power output but also increases the rate of heat rejected in the condenser. Consequently, a higher flow of water make-up to replace losses in the cooling tower is needed. WD was based on consumption of water from river (91%) to meet the demand of the cooling tower.
In terms of FD, the use of straw did not cause a substantial increase on environmental impacts. We estimate impacts of 7.81 and 8.02 kg oileq/MWh of surplus electricity for scenarios I and VI, respectively. The small difference, 2.6%, between these results is not so significant. Furthermore, by raising the working pressure, the impacts of FD tend to approximate. The exergy analysis clearly explains this issue, since the increase in overall exergy efficiency leads to greater generation of electricity, which compensates the additional fossil consumptions caused by the steps of baling, transporting, and milling the straw. Therefore, and as one might expect, in scenarios V and X, the gap of impact for FD resulted in an even smaller increase (1.1%).
From a process perspective, the expenditure of fossil fuels in scenarios I–V is concentrated on the agricultural stage (73%) and the transport of sugarcane (27%). Conversely, in VI–X there is an increase in absolute consumption figures, due to the processual arrangement introduced by straw in the product system. For this reason, the contribution of the agricultural stage is then reduced to 69% and the transport of sugarcane dropped to 25%. The additional steps of baling, transporting, and milling straw now represent 2.6%, 2.1%, and 0.7%, respectively. The main natural resource associated with this category is crude oil (99%), from the diesel used in agricultural machinery and trucks.
5.3. Combined Thermo-Environmental Analysis
Table 5 shows results of the combined indicator (), obtained from the correlation between normalized environmental indicators of each analyzed impact category (NCC, NPMF, NWD and NFD), and its homologue related to the energetic dimension (NExD), for scenarios I–X.
A primary observation of the data reveals that CIc,j decreased as the pressure of the steam leaving the boiler increased, regardless of adding straw. This trend is confirmed for any of the impact categories analyzed. Therefore, each series worst synergetic performances are obtained when the Rankine cycles operates at 20 bar (I and VI).
Performance gains are more noted when moving from 20 bar to 45 bar (I→II and VI→VII). From 45 upwards, CIc,j = f (ΔP) oscillations become increasingly smaller, tending towards constant values.
A great similarity is observed between the results of CIc,j derived from the synergy between NExD and NCC, NPMF and NFD for scenarios I–V. This suggests that the normalized values of those environmental indicators are in fact quite similar. The same trend is manifested between NCC and NPMF, and NWD and NFD for scenarios VI–X.
The indicator describing synergy between exergy destruction and WD shows a behavior which is distinct from the others. In this case, a gradual increase of the values is observed for the same pressure, due to the addition of straw, which ranges from 21 (I vs. VI) to 38% (V vs. X). For this indicator, the improvement observed in terms of increasing energetic efficacy was not enough to compensate the greater demand of cooling water.
6. Conclusions
This study intended to verify the thermodynamic and environmental performance caused by an increased scale of production on electricity cogeneration systems powered by biomass and sugarcane. Scenarios were elaborated from different boiler operating pressures. The effect of using cane straw as an additional source of biomass for the system was also examined.
The thermodynamic analysis indicated that increasing pressure and temperature conditions in the Rankine reheating systems can mean an exergy efficiency improvement of up to 37% in the highest pressure scenarios. Moreover, these results show a direct impact on the thermal energy conversion of fuels into useful work, resulting in an improvement of up to 63% over the net power output for the same heat source.
The improvement of thermodynamic performance associated to the system operating at higher pressures also meant reduced environmental impacts in all categories analyzed. For high pressures, the analysis shows a potential reduction of up to 27%.
Regarding the use of straw, the thermodynamic analysis identified that the incorporation of 50% of the straw generated in the field into the biomass used in the cogeneration has the potential to double the surplus electricity if the system operates at pressures close to 100 bar.
The environmental analysis revealed positive and negative impacts in relation to the use of straw: by adopting this source of renewable energy, it is possible to expect reductions of impacts for Climate Change (CC) and Particulate Matter Formation (PMF), but it increases negative effects for Water and Fossil Depletions (WD and FD). If the system operates at 100 bar, the reductions of impact for CC and PMF reach 9.7% and 13%, respectively. For the same operational condition, however, there were increases in terms of environmental damage of 58% and 1.1% for WD and FD, respectively. Therefore, when comparing the environmental performance of the cogeneration scenarios with or without straw, one should consider the impact categories to be prioritized prior to project design.
The evaluation of the proposed case scenarios from an environmental perspective provided a different and systemic perception to the analysis. From the diagnosis provided by the LCA, it is possible to realize that the implementation of effective process improvement measures, even if limited to specific stages of the life cycle of a certain product, can lead to systemic reductions of adverse outcomes caused by anthropogenic activities. For this specific case, the results also revealed potential environmental improvements over the ethanol production.
Acknowledgments
Alex Nogueira would like to thank the Coordination for the Improvement of Higher Education Personnel (CAPES) for a doctoral scholarship. Luiz Kulay also would like to thank CAPES for the financial support granted to conduct this study, provided through the project CAPES/FCT 2012—No. 350/13.
Author Contributions
Luiz Kulay conceived and designed the experiments; Fernando Henrique Cardoso collected and validated data; João Paulo Guerra created the computational code; Alex Nogueira performed the calculations; All the authors analyzed results and carried out the discussion; João Paulo Guerra and Luiz Kulay wrote the paper with contributions and final review of Fernando Henrique Cardoso and Alex Nogueira.
Conflicts of Interest
The authors declare no conflict of interest.
References
- Alves, M.; Ponce, G.H.S.F.; Silva, M.A.; Ensinas, A.V. Surplus electricity production in sugarcane mills using residual bagasse and straw as fuel. Energy 2015, 91, 751–757. [Google Scholar] [CrossRef]
- Seabra, J.E.A.; Macedo, I.C. Comparative analysis for Power generation and ethanol production from sugarcane residual biomass in Brazil. Energy Policy 2011, 39, 421–428. [Google Scholar] [CrossRef]
- Cardoso, T.F.; Cavalett, O.; Chagas, M.F.; Morais, E.R.; Carvalho, J.L.N.; Franco, H.C.J.; Galdos, M.V.; Scarpare, F.V.; Braunbeck, O.A.; Cortez, L.A.B.; et al. A technical and economic assessment of trash recovery in the sugarcane bioenergy production system. Sci. Agric. 2013, 70, 353–360. [Google Scholar] [CrossRef]
- Cardoso, T.F.; Chagas, M.F.; Rivera, E.C.; Cavalett, O.; Morais, E.R.; Geraldo, V.C.; Braunbeck, O.; Cunha, M.P.; Cortez, L.A.B.; Bonomi, A. A vertical integration simplified model for straw recovery as feedstock in sugarcane biorefineries. Biomass Bioenergy 2015, 81, 216–223. [Google Scholar] [CrossRef]
- Menandro, L.M.S.; Cantarella, H.; Franco, H.C.J.; Kölln, O.T.; Pimenta, M.T.B.; Sanches, G.M.; Rabelo, S.C.; Carvalho, J.L.N. Comprehensive assessment of sugarcane straw: Implications for biomass and bioenergy production. Biofuels Bioprod. Biorefin. 2017, 11, 488–504. [Google Scholar] [CrossRef]
- EPE—Energy Research Enterprise. Brazilian Energy Balance 2014; Year 2015 CDU 620.9:553.04; Ministry of Mines and Energy: Brasília, Brazil, 2015. Available online: https://ben.epe.gov.br (accessed on 30 April 2017). (In Portuguese)
- Castilla, L.R.C. Bioeletricidade como fonte de energia no Brasil. In Proceedings of the XVIII ENGEMA—Encontro Internacional sobre Gestão Empresarial e Meio Ambiente, São Paulo, Brazil, 28–29 November 2016; Available online: http://engemausp.submissao.com.br/18/anais/arquivos/31.pdf (accessed on 8 June 2017).
- Moore, C.C.S.; Rego, E.E.; Kulay, L. The Brazilian Electricity Supply for 2030: A Projection Based on Economic, Environmental and Technical Criteria. Environ. Nat. Resour. Res. 2017, 7, 17–29. [Google Scholar] [CrossRef]
- Torquato, S.A.; Ramos, R.C. Protocolo Agroambiental do Setor Sucroalcooleiro Paulista: Ações Visando a Preservação Ambiental. Análise e Indicadores do Agronegócio 2012, 7, 1–5. [Google Scholar]
- Torquato, S.A.; Ramos, R.C. Biomassa da cana-de-açúcar e a geração de bioeletricidade em São Paulo: Usinas signatárias ao Protocolo Agroambiental Paulista. Inf. Econ. 2013, 43, 59–68. [Google Scholar]
- Ramos, R.C.; Nachiluk, K. Geração de Bioenergia de Biomassa da Cana-de-açúcar nas Usinas Signatárias ao Protocolo Agroambiental Paulista, Safra 2015/2016. Análise e Indicadores do Agronegócio 2017, 12, 1–5. [Google Scholar]
- Lisboa, I.P.; Cherubin, M.R.; Cerri, C.C.; Cerri, D.G.P.; Cerri, C.E.P. Guidelines for the recovery of sugarcane straw from the field during harvesting. Biomass Bioenergy 2017, 96, 69–74. [Google Scholar] [CrossRef]
- Eboh, F.C.; Ahlström, P.; Richards, T. Exergy Analysis of Solid Fuel-Fired Heat and Power Plants: A Review. Energies 2017, 10, 165. [Google Scholar] [CrossRef]
- Gupta, M.K.; Kaushik, S.C.; Ranjan, K.R.; Panwar, N.L.; Reddy, V.S.; Tyagi, S.K. Thermodynamic performance evaluation of solar and other thermal power generation systems: A review. Renew. Sustain. Energy Rev. 2015, 50, 567–582. [Google Scholar] [CrossRef]
- Dincer, I.; Rosen, M.A. Exergy: Energy, Environment and Sustainable Development, 2nd ed.; Elsevier Science: Oxford, UK, 2013; 576p. [Google Scholar]
- Dewulf, J.; van Langenhove, H.; Muys, B.; Bruers, S.; Bakshi, B.R.; Grubb, G.F.; Paulus, D.M.; Sciuba, E. Exergy: Its Potential and Limitations in Environmental Science and Technology. Environ. Sci. Technol. 2008, 42, 2221–2232. [Google Scholar] [CrossRef] [PubMed]
- Torchio, M.F. Energy-Exergy, Environmental and Economic Criteria in Combined Heat and Power (CHP) Plants: Indexes for the Evaluation of the Cogeneration Potential. Energies 2013, 6, 2686–2708. [Google Scholar] [CrossRef]
- Ensinas, A.V.; Modesto, M.; Nebra, S.A.; Serra, L.M. Reduction of irreversibility generation in sugar and ethanol production from sugarcane. Energy 2009, 34, 680–688. [Google Scholar] [CrossRef]
- Dias, M.O.S.; Modesto, M.; Ensinas, A.V.; Nebra, S.A.; Maciel Filho, R.; Rossel, C.E.V. Improving bioethanol production from sugarcane: Evaluation of distillation, thermal integration and cogeneration systems. Energy 2011, 36, 3691–3703. [Google Scholar] [CrossRef]
- Pellegrini, L.F.; Oliveira, S., Jr. Combined production of sugar, ethanol and electricity: Thermoeconomic and environmental analysis and optimization. Energy 2011, 36, 3704–3715. [Google Scholar] [CrossRef]
- Bechara, R.; Gomez, A.; Saint-Antonin, V.; Schweitzer, J.M.; Marechal, F. Methodology for the optimal design of an integrated sugarcane distillery and cogeneration process for ethanol and power production. Energy 2016, 117, 540–549. [Google Scholar] [CrossRef]
- Colombo, G.; Ocampo-Duque, W.; Rinaldi, F. Challenges in Bioenergy Production from Sugarcane Mills in Developing Countries: A Case Study. Energies 2014, 7, 5874–5898. [Google Scholar] [CrossRef]
- Dias, M.O.S.; Junqueira, T.L.; Cavalett, O.; Cunha, M.P.; Jesus, C.D.F.; Mantelatto, P.E.; Carlos, E.V.; Rossell, C.E.V.; Maciel Filho, R.; Bonomi, A. Cogeneration in integrated first and second generation ethanol from sugarcane. Chem. Eng. Res. Des. 2013, 91, 1411–1417. [Google Scholar] [CrossRef]
- Olivério, J.L.; Ferreira, F.M. Cogeneration—A new source of income for sugar and ethanol mills or bioelectricity—A new business. Proc. Int. Soc. Sugar Cane Technol. 2010, 27, 1–12. [Google Scholar]
- Hassuani, S.J.; Leal, M.R.L.V.; Macedo, I.C. Biomass Power Generation: Sugar Cane Bagasse and Trash, 1st ed.; United Nations Development Programme (UNDP) Centro de Tecnologia Canavieira (CTC): Piracicaba, Brazil, 2005; 217p. [Google Scholar]
- Sartori, M.M.P.; Florentino, H.O. Energy balance optimization of sugarcane crop residual biomass. Energy 2007, 32, 1745–1748. [Google Scholar] [CrossRef]
- Leal, M.R.L.V.; Galdos, M.V.; Scarpare, F.V.; Seabra, J.E.A.; Walter, A.; Oliveira, C.O.F. Sugarcane straw availability, quality, recovery and energy use: A literature review. Biomass Bioenergy 2013, 53, 11–19. [Google Scholar] [CrossRef]
- Palacios-Bereche, R.; Mosqueira-Salazar, B.K.J.; Modesto, M.; Ensinas, A.V.; Nebra, S.A.; Serra, L.M.; Lozano, M.A. Exergetic analysis of the integrated first- and second-generation ethanol production from sugarcane. Energy 2013, 62, 46–61. [Google Scholar] [CrossRef]
- Modesto, M.; Aoki, A.; Lodi, A.; Pina, E. Assessment of the potential to increase electricity generation from sugarcane straw in Brazilian sugarcane cogeneration plants. Chem. Eng. Trans. 2016, 50, 193–198. [Google Scholar] [CrossRef]
- Murphy, D.J.; Carbajales-Dale, M.; Moeller, D. Comparing Apples to Apples: Why the Net Energy Analysis Community Needs to Adopt the Life-Cycle Analysis Framework. Energies 2016, 9, 917–931. [Google Scholar] [CrossRef]
- Gil, M.; Moya, A.M.C.; Domínguez, E.R. Life cycle assessment of the cogeneration processes in the Cuban sugar industry. J. Clean. Prod. 2013, 41, 222–231. [Google Scholar] [CrossRef]
- Moya, A.M.C.; Van Langenhove, H.; Herrero, S.; Gil, P.; Ledón, C.; Dewulf, J. Exergetic analysis in cane sugar production in combination with Life Cycle Assessment. J. Clean. Prod. 2013, 59, 43–50. [Google Scholar] [CrossRef]
- Nogueira, A.R.; Donke, A.C.G.; Matsuura, M.I.S.F.; Matai, P.H.L.S.; Kulay, L. Use of Environmental and Thermodynamic Indicators to Assess the Performance of an Integrated Process for Ethanol Production. Environ. Nat. Resour. Res. 2014, 4, 59–74. [Google Scholar] [CrossRef]
- Ometto, A.R.; Roma, W.N.L. Atmospheric impacts of the life cycle emissions of fuel ethanol in Brazil: Based on chemical exergy. J. Clean. Prod. 2010, 18, 71–76. [Google Scholar] [CrossRef]
- Kadiyala, A.; Kommalapati, R.; Huque, Z. Evaluation of the Life Cycle Greenhouse Gas Emissions from Different Biomass Feedstock Electricity Generation Systems. Sustainability 2016, 8, 1181. [Google Scholar] [CrossRef]
- Shen, X.; Kommalapati, R.R.; Huque, Z. The Comparative Life Cycle Assessment of Power Generation from Lignocellulosic Biomass. Sustainability 2015, 7, 12974–12987. [Google Scholar] [CrossRef]
- Guerra, J.P.; Coleta, J.R., Jr.; Arruda, L.C.M.; Silva, G.A.; Kulay, L. Comparative analysis of electricity cogeneration scenarios in sugarcane production by LCA. Int. J. Life Cycle Assess. 2014, 19, 814–825. [Google Scholar] [CrossRef]
- Silva, D.A.L.; Delai, I.; Montes, M.L.D.; Ometto, A.R. Life cycle assessment of the sugarcane bagasse electricity generation in Brazil. Renew. Sustain. Energy Rev. 2014, 32, 532–547. [Google Scholar] [CrossRef]
- Moran, J.; Shapiro, N. Fundamentals of Engineering Thermodynamics, 6th ed.; John Wiley & Sons: New York, NY, USA, 2008. [Google Scholar]
- MAPA (Ministry of Agriculture, Livestock and Supply). Statistical Yearbook of Agrienergy 2014; CDU 633.61; Secretariat of Production and Agrienergy: Brasília, Brazil, 2015. Available online: http://www.agricultura.gov.br/assuntos/sustentabilidade/agroenergia/pasta-anuario-estatistico-da-agroenergia/anuario-estatistico-da-agroenergia-2014.pdf/view (accessed on 13 April 2017). (In Portuguese)
- Rodrigues, B.N.; Almeida, F.S. Guia de Herbicidas, 6th ed.; Livroceres: Londrina, Brazil, 2011; 697p. (In Portuguese) [Google Scholar]
- Fredo, C.E.; Olivette, M.P.A.; Caser, D.V.; Veiga Filho, A.A.; Roque, A.A.O. Mecanização na Colheita Da Cana-De-Açúcar Paulista Supera 80% na Safra 2012/13; Análises e Indicadores do Agronegócio: São Paulo, Brazil, 2014; Volume 9. Available online: http://www.iea.sp.gov.br/out/LerTexto.php?codTexto=13463 (accessed on 24 May 2017). (In Portuguese)
- Kosaric, N.; Duvnjak, Z.; Farkas, A.; Sahm, H.; Bringer-Meyer, S.; Goebel, O.; Mayer, D. Ethanol. In Dithiocarbamic Acid and Derivatives to Ethanol, Volume A9, Ullmann's Encyclopedia of Industrial Chemistry, 5th ed.; Gerhartz, W., Ed.; Wiley-VCH: Weinheim, Germany, 2005; pp. 8762–8817. [Google Scholar]
- Oliveira, S., Jr. Exergy: Production, Cost and Renewability, 1st ed.; Springer: London, UK, 2013; 338p. [Google Scholar]
- Dias, M.O.S.; Ensinas, A.V.; Nebra, S.A.; Maciel Filho, R.; Rossell, C.E.V.; Maciel, M.R.W. Production of bioethanol and other bio-based materials from sugarcane bagasse: Integration to conventional bioethanol production process. Chem. Eng. Res. Des. 2009, 87, 1206–1216. [Google Scholar] [CrossRef]
- Dias, M.O.S.; Cunha, M.P.; Jesus, C.D.; Scandiffio, M.; Rossell, C.E.V.; Maciel Filho, R.; Bonomi, A. Simulation of ethanol production from sugarcane in Brazil: Economic study of an autonomous distillery. In 20th European Symposium on Computer Aided Process Engineering; Elsevier: Amsterdam, The Netherlands, 2010; Volume 28, pp. 733–738. [Google Scholar] [CrossRef]
- Dias, M.O.S.; Cunha, M.P.; Jesus, C.D.F.; Rocha, G.J.M.; Pradella, J.G.C.; Rossell, C.E.V.; Maciel Filho, R.; Bonomi, A. Second generation ethanol in Brazil: Can it compete with electricity production? Bioresour. Technol. 2011, 102, 8964–8971. [Google Scholar] [CrossRef] [PubMed]
- Cortez, L.A.B. Bioetanol de Cana-de-Açúcar: P&D Para a Produtividade e Sustentabilidade, 1st ed.; Blücher: São Paulo, Brazil, 2010; 954p. (In Portuguese) [Google Scholar]
- Moore, C.C.S.; Nogueira, A.R.; Kulay, L. Environmental and energy assessment of the substitution of chemical fertilizers for industrial wastes of ethanol production in sugarcane cultivation in Brazil. Int. J. Life Cycle Assess. 2016, 22, 628–643. [Google Scholar] [CrossRef]
- Kotas, T.J. The Exergy Method of Thermal Plant Analysis, 1st ed.; Exergon Publishing Company: London, UK, 2012; 352p. [Google Scholar]
- Klein, S.A. EES–Engineering Equation Solver. EES® V.10.249. Operation Manual. Available online: http://www.fchart.com/assets/downloads/ees_manual.pdf (accessed on 15 March 2017).
- International Organization for Standardization. ISO 14040, Environmental Management—Life Cycle Assessment—Principles and Framework, 2nd ed.; International Organization for Standardization: Genève, Switzerland, 2006; 20p. [Google Scholar]
- International Organization for Standardization. ISO 14044, Environmental Management—Life Cycle Assessment—Requirements and Guidelines, 1st ed.; International Organization for Standardization: Genève, Switzerland, 2006; 46p. [Google Scholar]
- Intergovernmental Panel on Climate Change (IPCC). Guidelines for National Greenhouse Gas Inventories. Agriculture, Forestry and Other Land Use. 2006, Volume 4. Available online: https://www.ipcc.ch/meetings/session25/doc4a4b/vol4.pdf (accessed on 5 May 2017).
- Nemecek, T.; Kägi, T. Life Cycle Inventories of Swiss and European Agricultural Production System Final Report Ecoinvent v2.0 N15a; Technical Report; Agroscope Reckenholz Taenikon Research Station ART, Swiss Centre for Life Cycle Inventories: Zurich, Switzerland, 2007; Available online: www.ecoinvent.org (accessed on 4 May 2017).
- Ometto, A.R.; Hauschild, M.Z.; Roma, W.N.L. Life cycle assessment of fuel ethanol from sugarcane in Brazil. Int. J. Life Cycle Assess. 2009, 14, 236–247. [Google Scholar] [CrossRef]
- GREET Greenhouse Gases. Regulated Emissions, and Energy Use in Transportation; version 1.8d; Technical Report; Argonne National Laboratory Illinois: Lemont, IL, USA, 2000. Available online: https://greet.es.anl.gov (accessed on 4 May 2017).
- Nemecek, T.; Schnetzer, J. Methods of Assessment of Direct Field Emissions for LCIs of Agricultural Production Systems; Technical Report; Agroscope Reckenholz Tänikon Research Station ART: Zurich, Switzerland, 2011; Available online: www.ecoinvent.org (accessed on 4 May 2017).
- Seabra, J.E.A.; Macedo, I.C.; Chum, H.L.; Faroni, C.E.; Sarto, C.A. Life cycle assessment of Brazilian sugarcane products: GHG emissions and energy use. Biofuels Bioprod. Biorefin. 2011, 5, 519–532. [Google Scholar] [CrossRef]
- Sugawara, E.T. Comparação dos Desempenhos Ambientais do B5 Etílico de Soja e do Óleo Diesel, por Meio da Avaliação do Ciclo de Vida (ACV). Master’s Thesis, University of São Paulo, São Paulo, Brazil, 2012. (In Portuguese). [Google Scholar]
- Bonomi, A. The Virtual Sugarcane Biorefinery (VSB)—Report 2011. CTBE/CNPEM—Brazilian Bioethanol Science and Technology Laboratory/Brazilian Center of Research in Energy and Materials: Campinas, Brazil, 2012. Available online: http://ctbe.cnpem.br/wpcontent/uploads/2014/07/vsbreport2011.pdf (accessed on 1 June 2017).
- Cavalett, O.; Junqueira, T.L.; Dias, M.O.S.; Jesus, C.D.F.; Mantellato, P.E.; Cunha, M.P.; Franco, H.C.J.; Cardoso, T.F.; Maciel Filho, R.; Rossell, C.E.V.; et al. Environmental and economic assessment of sugarcane first generation biorefineries in Brazil. Clean. Technol. Environ. Policy 2012, 14, 399–410. [Google Scholar] [CrossRef]
- Cavalett, O.; Chagas, M.F.; Seabra, J.E.A.; Bonomi, A. Comparative LCA of ethanol versus gasoline in Brazil using different LCIA methods. Int. J. Life Cycle Assess. 2013, 18, 647–658. [Google Scholar] [CrossRef]
- Sea Rates Distance and Time [Map]. Scale Undetermined, Generated by SeaRates LP Using Google Maps. 2016. Available online: http://www.searates.com/reference/portdistance (accessed on 30 May 2017).
- Hansen, A.P.H.; Silva, G.A.; Kulay, L. Evaluation of the environmental performance of alternatives for polystyrene production in Brazil. Sci. Total Environ. 2015, 532, 655–668. [Google Scholar] [CrossRef] [PubMed]
- EPE—Energy Research Enterprise. Brazilian Energy Balance 2015; Year 2016 CDU 620.9:553.04; Ministry of Mines and Energy: Brasília, Brazil, 2016. Available online: https://ben.epe.gov.br (accessed on 30 April 2017). (In Portuguese)
- Pellegrini, L.F.; Oliveira, S., Jr.; Burbano, J.C. Supercritical steam cycles and biomass integrated gasification combined cycles for sugarcane mills. Energy 2010, 35, 1172–1180. [Google Scholar] [CrossRef]
- Ensinas, A.V.; Nebra, S.A.; Lozano, M.A.; Serra, L.M. Analysis of process steam demand reduction and electricity generation in sugar and ethanol production from sugarcane. Energy Convers. Manag. 2007, 48, 2978–2987. [Google Scholar] [CrossRef]
- Goedkoop, M.; Heijungs, R.; Huijbregts, M.; De Schryver, A.; Struijs, J.; van Zelm, R. Description of the ReCiPe Methodology for Life Assessment Impact Assessment. 2013. Available online: http://www.lciarecipe.net (accessed on 7 June 2017).
- Silva, D.A.L.; Pavan, A.L.R.; Oliveira, J.A.; Ometto, A.R. Life cycle assessment of offset paper production in Brazil: Hotspots and cleaner production alternatives. J. Clean. Prod. 2015, 93, 222–233. [Google Scholar] [CrossRef]
- Kamate, S.C.; Gagavati, P.B. Exergy analysis of cogeneration power plants in sugar industries. Appl. Therm. Eng. 2009, 29, 1187–1194. [Google Scholar] [CrossRef]
- Szargut, J. Exergy Method: Technical and Ecological Applications, 1st ed.; WIT Press: Southampton, UK, 2005; 164p. [Google Scholar]
Figure 1.
General scheme of a Rankine cycle with reheating steam for power cogeneration plant.
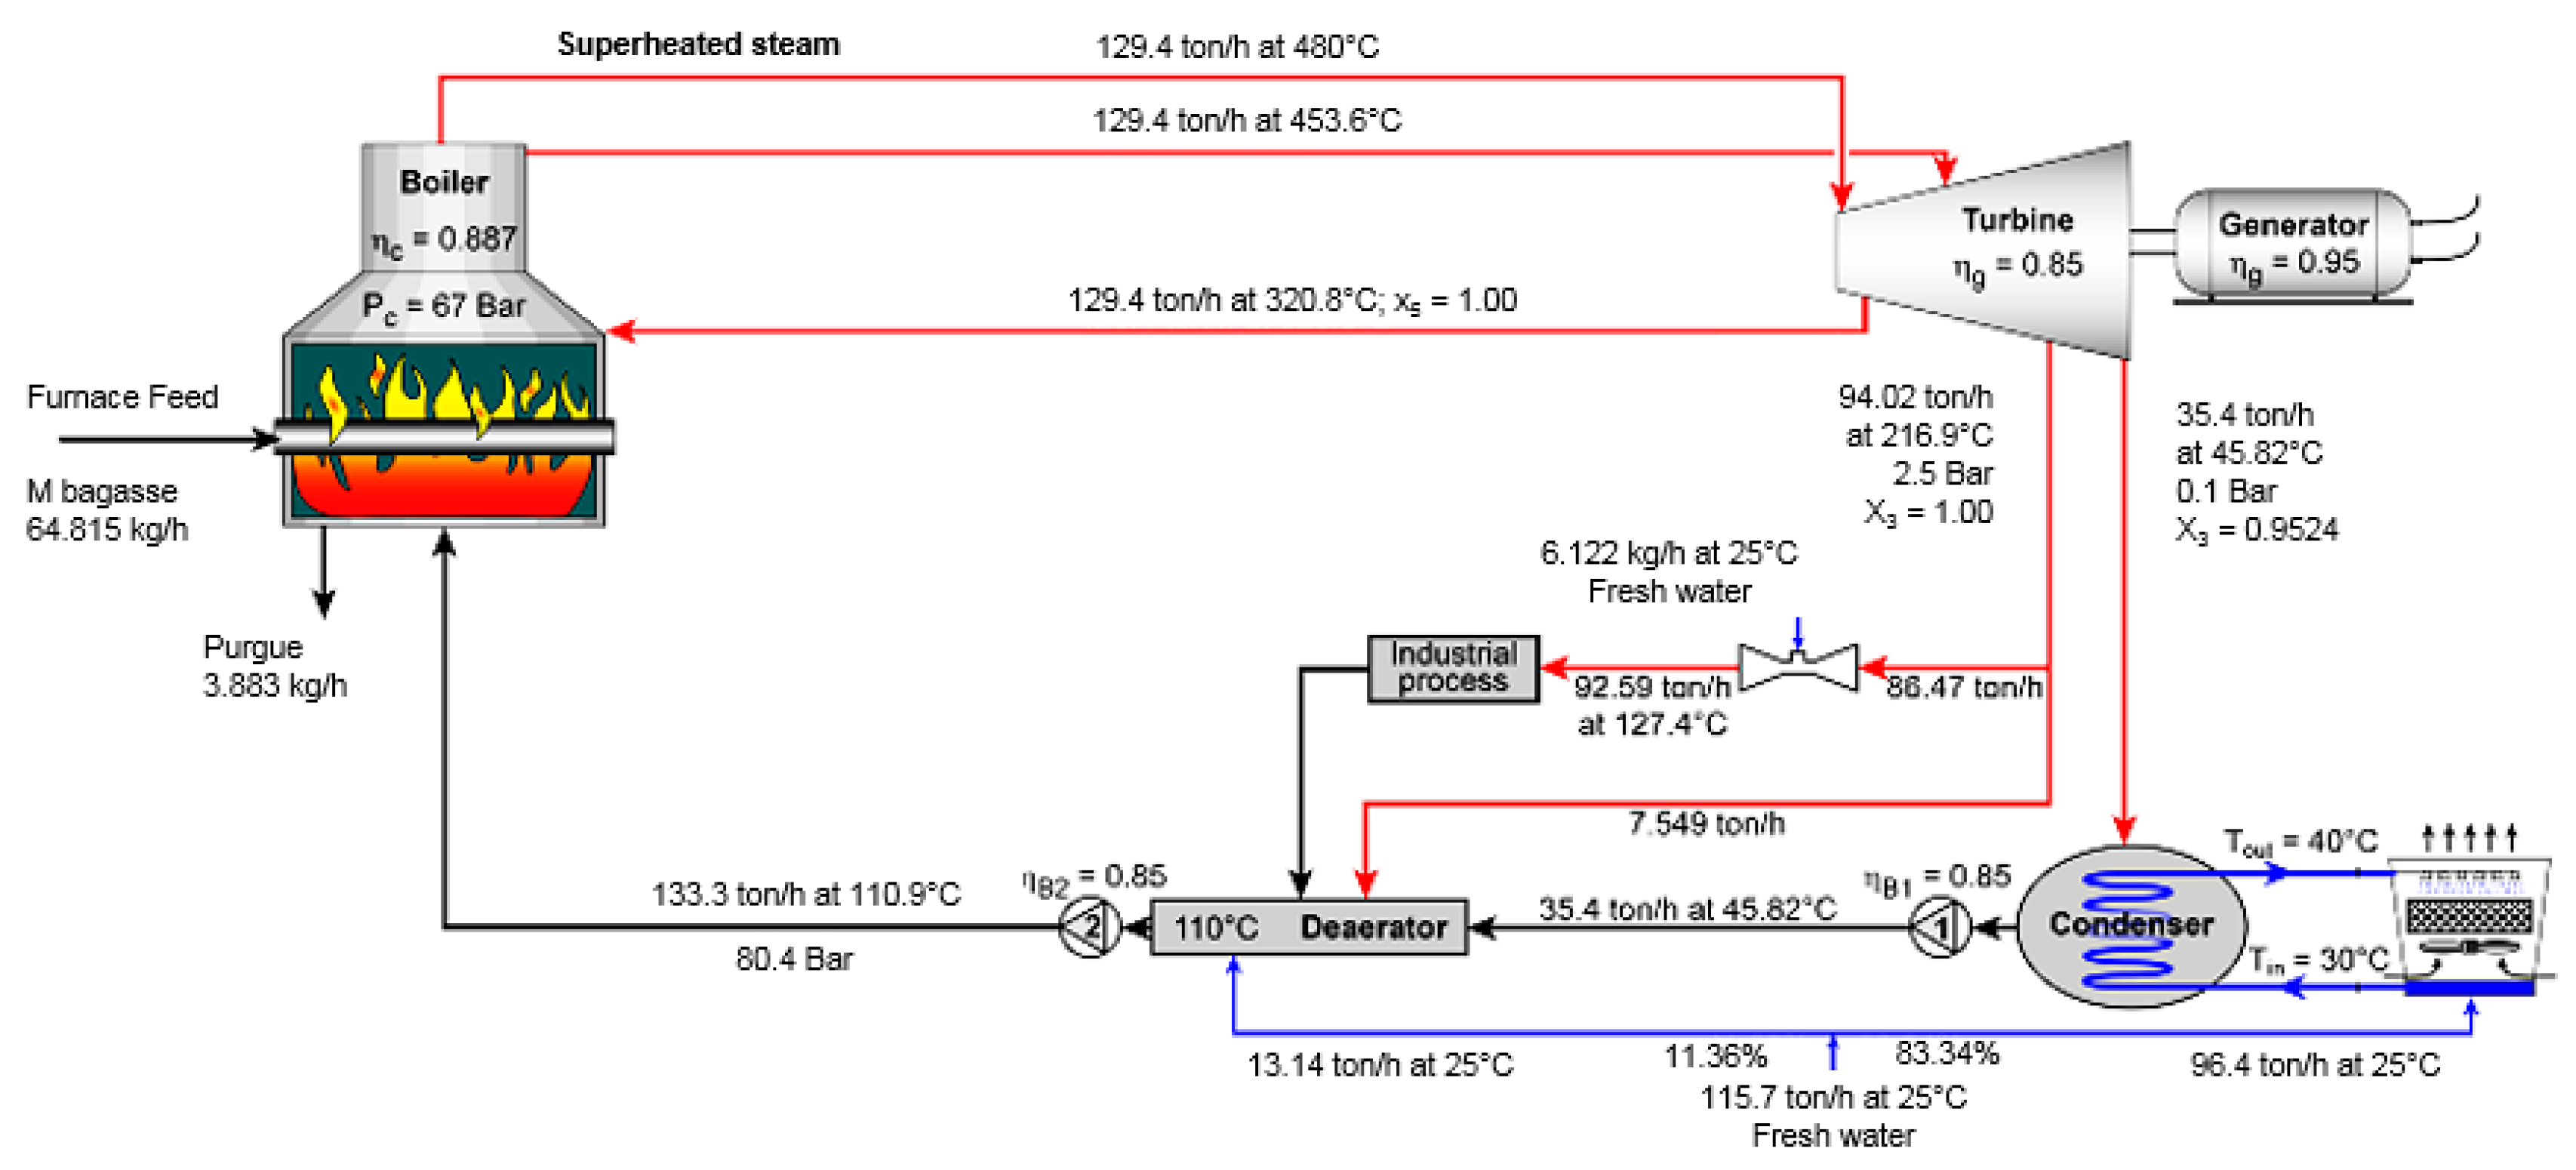
Figure 2.
Generic description of the supply chain of a product.
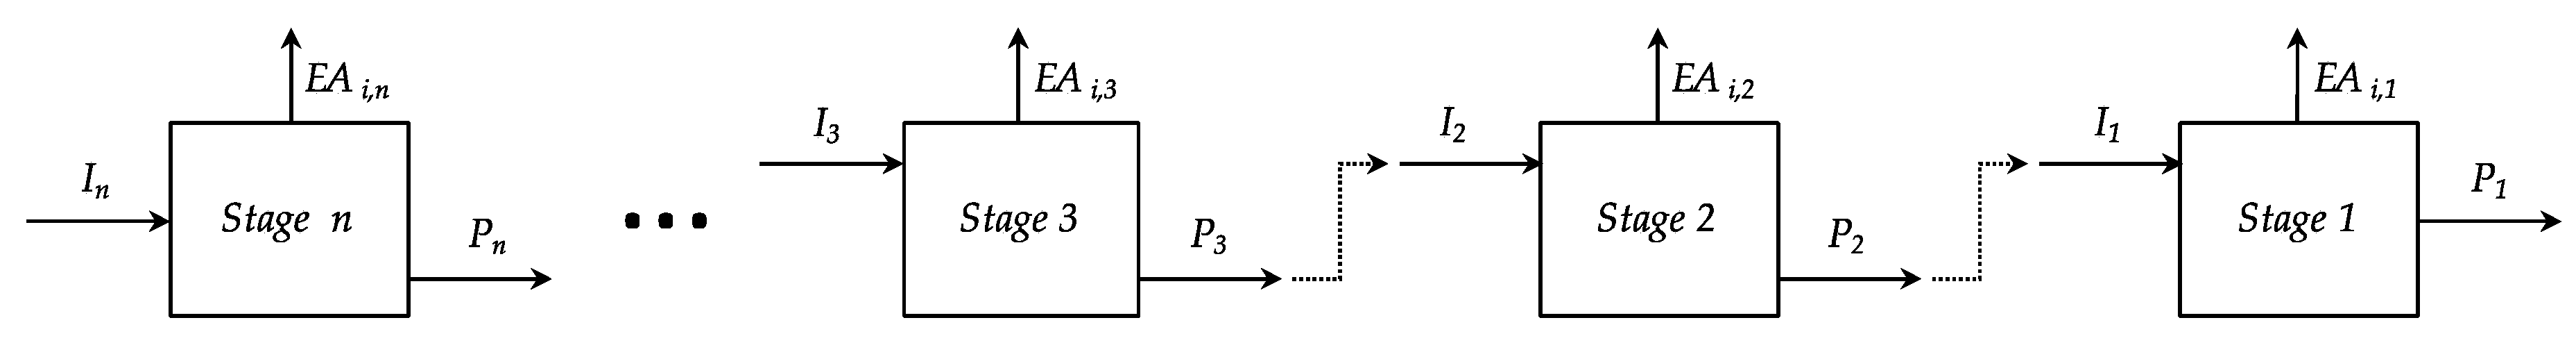
Figure 3.
Schematic description of the Product System under study.

Figure 4.
Thermodynamic indicators results for each process scenario: (a) Net power; (b) Water consumption.
Figure 4.
Thermodynamic indicators results for each process scenario: (a) Net power; (b) Water consumption.

Figure 5.
Consolidated exergy analysis for each case scenario.
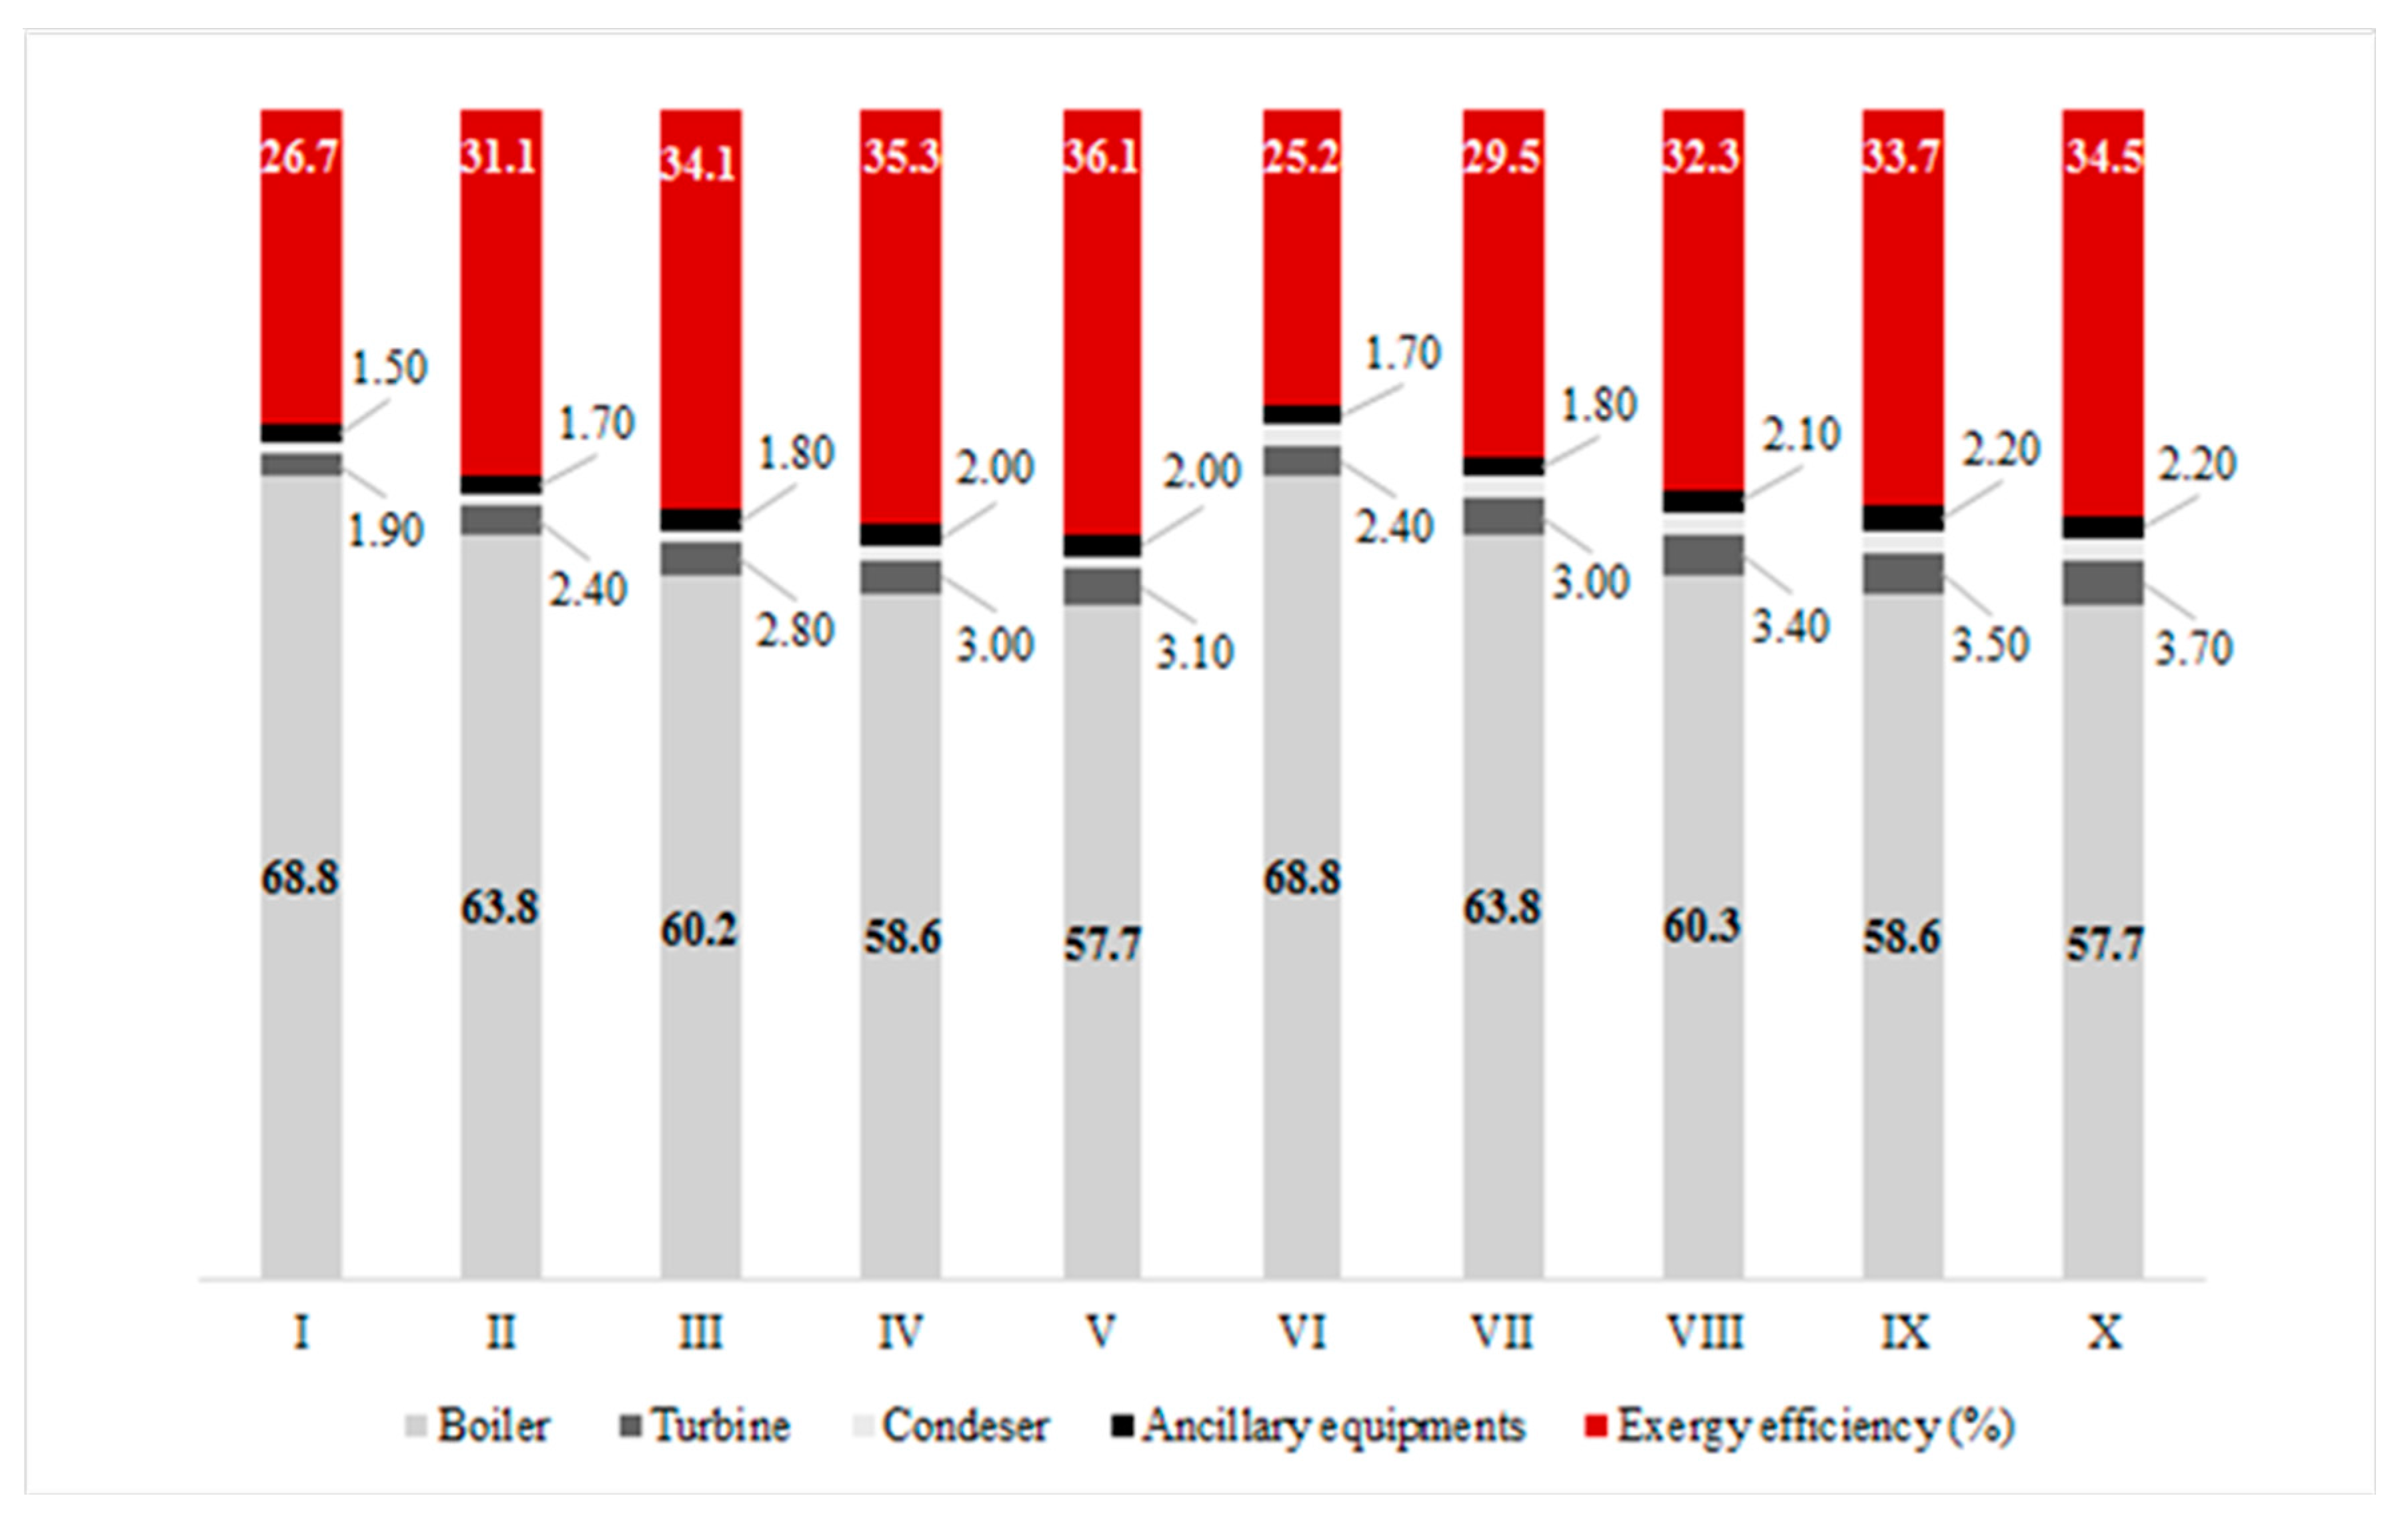
Figure 6.
Comparing the effects of straw use in the cogeneration for equivalent process conditions in terms of: (a) Climate Change (CC); (b) Particulate Matter Formation (PMF); (c) Water Depletion (WD); and (d) Fossil Depletion (FD).
Figure 6.
Comparing the effects of straw use in the cogeneration for equivalent process conditions in terms of: (a) Climate Change (CC); (b) Particulate Matter Formation (PMF); (c) Water Depletion (WD); and (d) Fossil Depletion (FD).


Table 1.
Cogeneration scenarios with different operational scale sources of biomass consumption.
| Process Stage | Parameter (Unit) | Value | |
|---|---|---|---|
| Distillery | Sugarcane crushed per crop (tsc) | 2,000,000 | |
| Distillery operation period per crop (day) | 210 | ||
| Total bagasse produced (wet basis) (kg/tsc) | 280 | ||
| Working day (h) | 24 | ||
| Anhydrous ethanol production (kg/tsc) | 65 | ||
| Moisture of bagasse (%) | 50 | ||
| Bagasse Lower Heating Value (kJ/kg) | 7565 | ||
| Steam consumption (kg/tsc) | 400 | ||
| Electricity consumption (kWh/tsc) | 30 | ||
| Cogeneration system | Bagasse consumption (wet basis) (t/h) | 129 | |
| Straw consumption (a) (wet basis) (t/h) | 38 | ||
| Steam pressure vs. Thermal efficiency (boiler) | P (bar) | ɳ (%) | |
| 20 | 78 | ||
| 45 | 82 | ||
| 67 | 86 | ||
| 80 | 88 | ||
| 100 | 88 | ||
| Efficiency of the electrical generator (b,c) (%) | 95 | ||
| Steam pressure (distillery) (bar) | 2.5 | ||
| Steam pressure (condensation) (bar) | 0.10 | ||
| Condensate temperature in the deaerator (°C) | 110 | ||
| Isentropic pump efficiency (c) (%) | 85 | ||
| Straw production | Total straw produced (wet basis) (kg/tsc) | 165 | |
| Moisture of straw (%) | 15 | ||
| Lower Heating Value (b) (kJ/kg) | 12,960 | ||
| Electricity consumption (kWh/tsc) | 5.6 | ||
Table 2.
Cogeneration scenarios with different operational scale sources of biomass consumption.
| Scenario | Straw Used as Heat Source | High Pressure Steam State Functions | |
|---|---|---|---|
| P (bar) | T (°C) | ||
| I | – | 20 | 412 |
| II | – | 45 | 457 |
| III | – | 67 | 483 |
| IV | – | 80 | 495 |
| V | – | 100 | 511 |
| VI | + | 20 | 412 |
| VII | + | 45 | 457 |
| VIII | + | 67 | 483 |
| IX | + | 80 | 495 |
| X | + | 100 | 511 |
Table 3.
Exergy destruction of each stage of the cogeneration cycle.
| Exergy Destruction (kWh/tsc) | Scenarios | |||||||||
|---|---|---|---|---|---|---|---|---|---|---|
| I | II | III | IV | V | VI | VII | VIII | IX | X | |
| Boiler | 405 | 376 | 355.1 | 345 | 340 | 609 | 565 | 534 | 519 | 511 |
| Turbine | 11.2 | 14.1 | 16.5 | 17.7 | 18.3 | 21.3 | 26.6 | 30.1 | 31.0 | 32.8 |
| Condenser | 6.51 | 5.90 | 6.48 | 6.49 | 6.52 | 16.8 | 16.8 | 16.8 | 17.7 | 16.8 |
| Ancillary equipments | 8.82 | 10.0 | 10.6 | 11.8 | 11.8 | 15.1 | 15.9 | 18.6 | 19.5 | 19.5 |
| Useful exergy | 157 | 183 | 200 | 208 | 213 | 223 | 261 | 286 | 298 | 306 |
Table 4.
Environmental performance profiles for the assessed scenarios.
| Impact Category | Unit | Scenarios | |||||||||
|---|---|---|---|---|---|---|---|---|---|---|---|
| I | II | III | IV | V | VI | VII | VIII | IX | X | ||
| CC | kg CO2eq | 165 | 142 | 130 | 125 | 122 | 151 | 129 | 118 | 113 | 110 |
| PMF | kg PM10eq | 19.7 | 16.9 | 15.5 | 14.9 | 14.6 | 17.4 | 14.8 | 13.5 | 13.0 | 12.7 |
| WD | m3 | 4.27 | 3.54 | 3.37 | 3.37 | 3.12 | 6.81 | 5.69 | 5.33 | 5.19 | 4.93 |
| FD | kg oileq | 7.81 | 6.71 | 6.15 | 5.91 | 5.78 | 8.02 | 6.84 | 6.24 | 5.99 | 5.88 |
Table 5.
Combined indicator for scenarios I–X.
| Scenarios | ||||||||||
|---|---|---|---|---|---|---|---|---|---|---|
| I | II | III | IV | V | VI | VII | VIII | IX | X | |
| NCC × NExD | 1.000 | 0.561 | 0.410 | 0.359 | 0.331 | 0.693 | 0.422 | 0.320 | 0.281 | 0.261 |
| NPMF × NExD | 1.000 | 0.559 | 0.410 | 0.358 | 0.332 | 0.669 | 0.405 | 0.306 | 0.271 | 0.252 |
| NWD × NExD | 0.627 | 0.339 | 0.258 | 0.234 | 0.205 | 0.758 | 0.451 | 0.350 | 0.313 | 0.283 |
| NFD × NExD | 0.974 | 0.545 | 0.400 | 0.349 | 0.323 | 0.758 | 0.460 | 0.348 | 0.307 | 0.287 |
© 2018 by the authors. Licensee MDPI, Basel, Switzerland. This article is an open access article distributed under the terms and conditions of the Creative Commons Attribution (CC BY) license (http://creativecommons.org/licenses/by/4.0/).
Share and Cite
MDPI and ACS Style
Guerra, J.P.; Cardoso, F.H.; Nogueira, A.; Kulay, L. Thermodynamic and Environmental Analysis of Scaling up Cogeneration Units Driven by Sugarcane Biomass to Enhance Power Exports. Energies 2018, 11, 73. https://doi.org/10.3390/en11010073
AMA Style
Guerra JP, Cardoso FH, Nogueira A, Kulay L. Thermodynamic and Environmental Analysis of Scaling up Cogeneration Units Driven by Sugarcane Biomass to Enhance Power Exports. Energies. 2018; 11(1):73. https://doi.org/10.3390/en11010073
Chicago/Turabian StyleGuerra, João Paulo, Fernando Henrique Cardoso, Alex Nogueira, and Luiz Kulay. 2018. "Thermodynamic and Environmental Analysis of Scaling up Cogeneration Units Driven by Sugarcane Biomass to Enhance Power Exports" Energies 11, no. 1: 73. https://doi.org/10.3390/en11010073
Note that from the first issue of 2016, this journal uses article numbers instead of page numbers. See further details here.