Research on a Novel Hydraulic/Electric Synergy Bus

1
National Local Joint Engineering Laboratory of Automobile Parts Technology, South China University of Technology, Guangzhou 510640, China
2
Department of Mechanical and Mechatronics Engineering, University of Waterloo, Waterloo, ON N2L3G1, Canada
*
Author to whom correspondence should be addressed.
Energies 2018, 11(1), 34; https://doi.org/10.3390/en11010034
Submission received: 17 November 2017
/
Revised: 15 December 2017
/
Accepted: 21 December 2017
/
Published: 24 December 2017
(This article belongs to the Special Issue The International Symposium on Electric Vehicles (ISEV2017))
Abstract
:In recent years, increasing concerns regarding environmental pollution and requirements for lower fossil fuel consumption have increased interest in alternative hybrid powertrains. As a result, this paper presents a novel hydraulic/electric synergy powertrain with multiple working modes. The three energy sources (i.e., engine, battery, and hydraulic accumulator) in this configuration are regulated by a dual planetary gear set to achieve optimal performances. This paper selects the component sizes of a hybrid electric vehicle (HEV), a hydraulic hybrid vehicle (HHV), and a hydraulic/electric synergy vehicle (HESV), based on the dynamic performance of a target vehicle (TV). In addition, this paper develops the forward simulation models of the four aforementioned vehicles in the MATLAB/Simulink/Driveline platform, in which the fuel economy simulations are carried out in relation to the Chinese urban bus cycle. The simulation results show that the fuel consumption of the three hybrid vehicles is similar, but much better than, that of the TV. Finally, based on the operating cost calculations over a five-year working period, the lowest cost ranges of the three hybrid vehicles are determined, which provides a method for choosing the optimal hybrid scheme.
1. Introduction
With stricter regulations on fossil energy consumption and environmental pollution, the conventional internal combustion engine (ICE) should gradually exit from the automobile industry. Pure electric vehicles are ideal solutions, but they cannot completely replace the conventional vehicles in the short-term due to the limitation of battery technology. The hybridization of the powertrain system is a synergy technique through the proper arrangement and cooperation of components, which can take full advantage of each component. Hybrid electric vehicles (HEVs), which combine the merits of conventional vehicles and pure electric vehicles, have significant improvements in fuel consumption and emissions. Nowadays, HEVs have achieved great market success, and hydraulic hybrids [1,2], fuel cell-battery hybrids [3,4], battery-supercapacitor hybrids [5], etc., are still the focus of active research.
The battery has been widely used in the HEVs/EVs because of features such as its large storage capacity [6]. However, its shortcomings, such as the relatively low power density and limited lifespan, hinder its extensive application as a sole energy source [5]. The hydraulic hybrid system is another type of hybrid technology, which has the advantage of high power density and the ability to be charged and discharged at high rates and high frequencies [7]. With these features, hydraulic hybrid powertrains are typically used in heavy vehicles such as buses or trucks. However, the relatively low energy density of the hydraulic accumulator makes it difficult to act as a sole energy source, too. Sun [8] proposed a hydraulic accumulator/battery synergy system to overcome the drawbacks of single-energy storage sources, and proved that the system can effectively prolong the lifespan of battery. Therefore, the hybridization of these energy sources is a straightforward and feasible way to solve the problems associated with each of them.
The power-split powertrain with multiple energy sources is presently the most advanced hybrid configuration, where a two-degree-of-freedom planetary gear set plays the role of a continuously variable transmission (CVT) [9]. The Toyota hybrid system (THS) is the typical powertrain, with the single power-split mode. However, the THS shows a low efficiency in the high-speed range because of the power circulation [10]. To improve the THS, numerous dual-mode power-split transmission schemes have been proposed. Grewe et al. [11] proposed a novel two-mode electrically variable transmission (EVT), which is composed of three planetary gear sets and two clutches. The two-mode EVT can work in input-split mode or compound-split mode, and it is already successful in bus applications. In order to meet the requirements of a full-size sport utility vehicle (SUV), two clutches are added to the two-mode EVT, which brings four additional fixed-gear modes. The addition of fixed gear ratios allows the system to achieve better fuel economy. Mashadi et al. [12] also put forward an innovative power-split device, which consists of two planetary gear sets and two clutches. The powertrain can work in two different power-split modes by locking/unlocking the two clutches. Although the efficiency of the aforementioned dual-mode power-split transmissions is improved to a considerable extent, their structure unavoidably becomes more complex due to an increased number of clutches and planetary gear sets. Therefore, the compromise of efficiency and simplicity should be adopted.
In this paper, a novel hydraulic/electric synergy powertrain featuring double planetary sets and multiple working modes is proposed. In order to present a competitive performance, the novel hydraulic/electric synergy powertrain can work in one power-split mode and two parallel modes with a wide range for the transmission ratio. More importantly, it will take the advantages of both hydraulic and electric hybrid powertrains.
Moreover, the Chinese urban bus cycle (CUBC) [13] requires a low average speed, frequent starts and stops, a large starting acceleration, and long braking/idling time. Thus, the hydraulic /electric synergy bus should be capable of the following:
- (1)
- When the vehicle is running, energy can be converted both from thermal to electric or thermal to hydraulic;
- (2)
- When the vehicle is running, energy can be converted bi-directionally between electric and hydraulic.
With various possibilities for energy transfer, the new powertrain can ensure that the state of charge (SOC) of the battery and the pressure of the hydraulic accumulator are maintained at a reasonable range, which is beneficial to the lifespan of the energy storage components.
This paper is organized as follows: in Section 2, the specific configuration of the novel hydraulic/electric synergy powertrain is presented, and its power flows under common driving conditions are analyzed in detail. In Section 3, based on a target vehicle (TV), the dynamic parameters of the hydraulic hybrid vehicle (HHV), hybrid electric vehicle (HEV), and hydraulic/electric synergy vehicle (HESV) are selected. In Section 4, the models of each component are established. In Section 5, the overall control logic and deterministic rule-based power distribution strategy are introduced. In Section 6, the fuel economy under the CUBC is simulated in MATLAB/Simulink/Driveline. In addition, the total operating costs of the three hybrid vehicles over five years are analyzed and compared. Finally, the conclusion is drawn.
2. The Novel Hydraulic/Electric Synergy Powertrain
The configuration of the novel hydraulic/electric synergy powertrain is shown in Figure 1, consisting of three power sources (i.e., an engine, an electric motor/generator (M/G), and a hydraulic pump/motor (P/M)), and a double-planetary gear mechanism with three friction clutches and a friction brake. Figure 2 is the specific structure of the hybrid vehicle with the novel hydraulic/electric synergy powertrain, where the hydraulic accumulator is used to supply energy to the hydraulic P/M and absorb energy from the regenerative braking. The proposed powertrain is able to work in two kinds of parallel modes, and one power-split mode by engaging/disengaging the brake and clutches. Therefore, this powertrain can clearly present more flexible controllability, resulting in a better fuel economy. The working modes and the corresponding states of power sources, clutches, and the brake are shown in Table 1. In parallel mode 1, the engine is switched on and coupled to the wheel only when the maximum torque delivered by the M/G and hydraulic P/M cannot satisfy the driver’s demand. In regeneration modes, the powertrain can be switched between two modes based on a certain speed threshold. Note, in parking modes, the brake needs to be disengaged for the safety of vehicle because there will be torque in the carrier if the brake is still engaged.
2.1. Start-Up Conditions
The HESV works in parallel mode 1 during starting conditions. The hydraulic and electric energy is transformed into mechanical energy for driving the vehicle via the hydraulic P/M, M/G, and the power distributor (PD), as shown by line A and B in Figure 3a. When the demand torque is still greater than the maximum torque provided by both the M/G and hydraulic P/M, the engine starts to assist the other two energy sources and its power flow, as shown by line C in Figure 3a.
2.2. Urban Conditions
As vehicle speed increases to a certain threshold, the powertrain switches from parallel mode 1 to power-split mode. In the power-split mode, the aim is to keep the engine working in the vicinity of the minimum fuel consumption line by adjusting the speed and torque of the M/G. For high-efficiency purposes, the output power of the engine is divided by the power distributor, a part of which is transmitted to drive the vehicle directly, and the remainder is converted into electric energy via the M/G and stored into the battery. The power flows are shown by line C and D in Figure 3b.
2.3. High-Speed Conditions
When the vehicle is running on the freeway/highway, the powertrain should work in parallel mode 2. According to the kinematic equation of a planetary gear set, it is easy to know that the power distributor works as a fixed-ratio gear while clutch 2 is engaged, and thus, the output power of the engine is delivered directly to drive the vehicle, as indicated by line C in Figure 3c. When the required torque of the driver is larger than the maximum torque of the engine, the M/G is activated to supply additional torque to assist the engine for meeting the demand. The power flow is shown by line B in Figure 3c.
2.4. Braking Conditions
When the vehicle is braking, the recovery of kinetic braking energy is first stored into the hydraulic accumulator (as long as it is not full). If the braking torque provided by the hydraulic P/M is insufficient, the M/G is activated to charge the battery. The mechanical brake will compensate the extra braking torque if needed. The power flows are shown by line E and F in Figure 3d.
2.5. Parking Conditions
When the vehicle is at a standstill, the engine can be activated to drive the hydraulic P/M to supply hydraulic energy if the pressure of the hydraulic accumulator is low. In addition, the engine can also supply energy to drive the M/G to charge the battery, which contributes to the global energy balance of the battery. The power flows are shown by line G and H in Figure 3e.
Due to the aforementioned flexibility of switching among various working modes, it is clear that the hydraulic/electric synergy powertrain would be quite suitable for application on buses. In the next section, a target ICE vehicle is selected, and the dynamic parameters of its evolved HHV, HEV, and HESV are introduced and compared.
3. Dynamic Parameter Matching
3.1. Target Vehicle
The target vehicle is a 15 t urban bus with a 199 kW diesel engine, and its key parameters are reported in Table 2 [14,15].
The driving resistance without considering the grade resistance and the accelerating resistance can be represented by the following equations [15]:
where m is the mass of the vehicle, kg; g is the gravity acceleration, m/s2; is the equivalent road resistance coefficient with polynomial fit parameters b2 = 6.6295406 × 10⁻³, b1 = 1.96293 × 10⁻⁴, b0 = 4.80351 × 10⁻⁷; and ua is the vehicle speed, in km/h.
3.2. Hydraulic Hybrid Vehicle
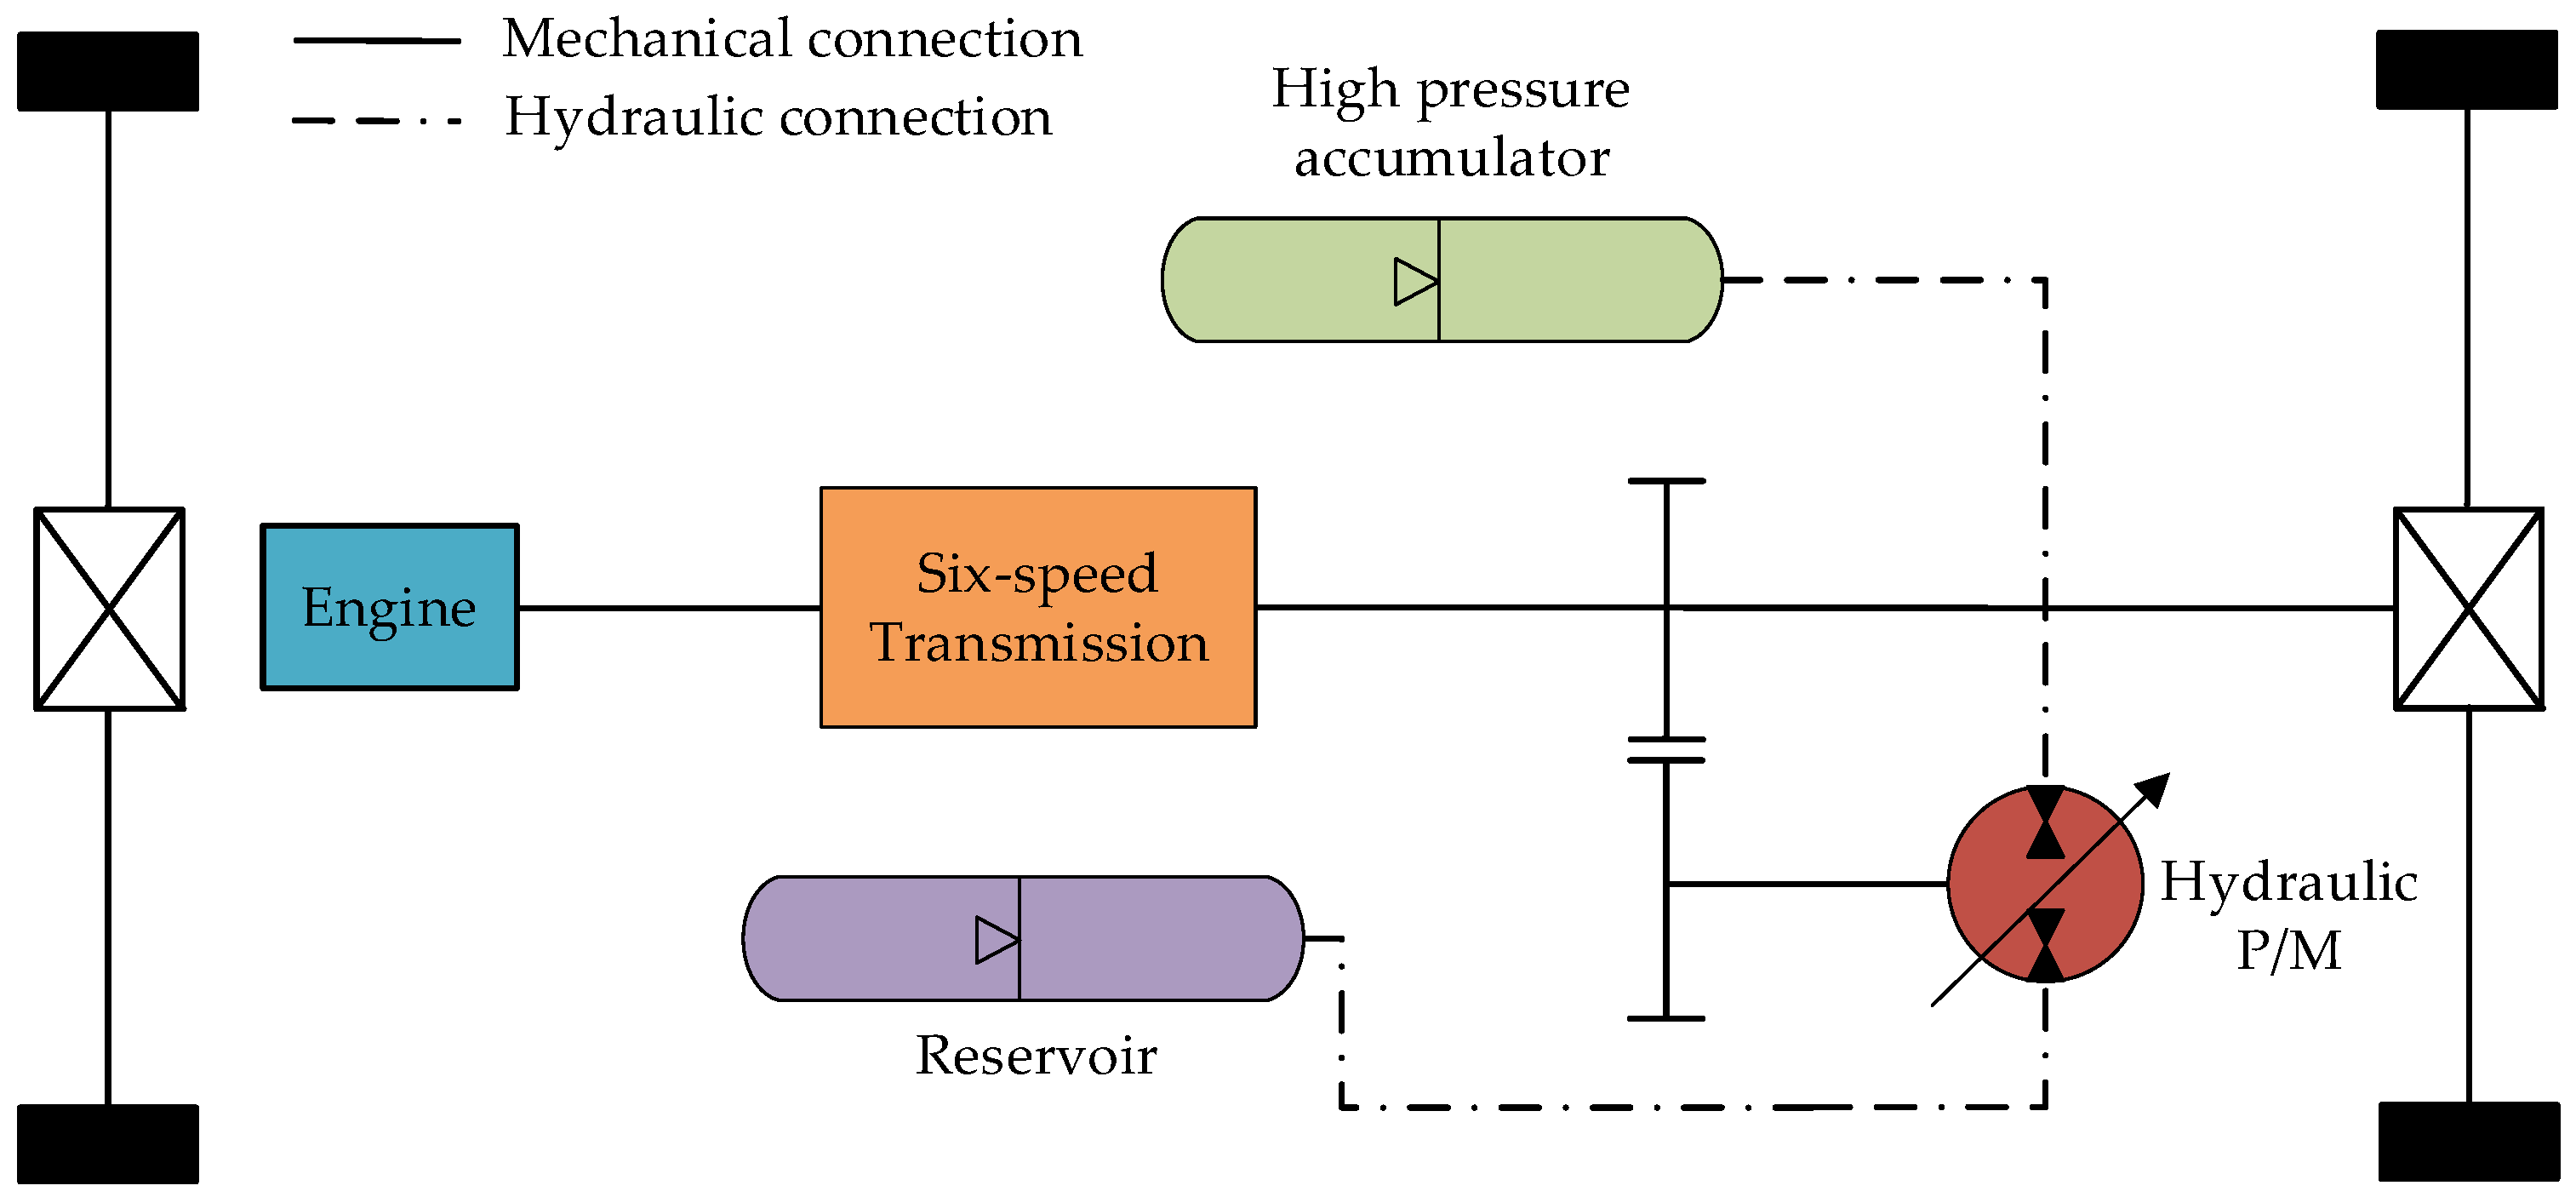
In addition to components within the TV, the HHV also has a power coupling component, a hydraulic accumulator, a reservoir, and a hydraulic P/M, as shown in Figure 4. Since the hydraulic accumulator features a low energy density, the same engine as that of the TV is adopted here to prevent any negative effects on vehicle drivability, especially when the hydraulic accumulator is empty [2]. The same six-speed transmission is equipped in the HHV. The hydraulic P/M is arranged at the rear of the transmission and coupled to the drive shaft through the power coupling component (i.e., a fixed-ratio gear).
In terms of better fuel economy, the size of hydraulic components is configured to absorb sufficient braking energy [2]. Basing the calculation on the CUBC, a 222 kW hydraulic P/M is selected in the HHV, and its rated torque is 642 N·m. The average efficiency of the hydraulic accumulator is 96%, and the key specifications of the hydraulic accumulator are also scaled up and shown as follows [2]: Fluid Capacity: 63.5 L; Maximum Gas Volume: 127 L; Minimum Gas Volume: 63.5 L; Pre-charge Pressure: 125 bar; Maximum Pressure: ≤360 bar.
3.3. Hybrid Electric Vehicle
In addition to the components within the TV, a M/G and a lithium-ion battery are introduced to the HEV. Since the battery is added, the engine can be downsized. However, the maximum power of the engine should meet the instantaneous demand power of driving conditions to ensure drivability. By calculation, the maximum instantaneous power requirement of a 15 t bus on the CUBC is about 137.1 kW. Therefore, the maximum power of the engine is downsized to 150 kW. In order to ensure the dynamic performance of the HEV, its parameters, such as the maximum climbing degree (15 km/h), the acceleration time (0–40 km/h) and the maximum speed, should not be less than those of the TV. Based on these dynamic performance indices, a 111 kW M/G is selected, and its rated torque is 642 N·m.
The same six-speed transmission as the TV is selected. The M/G is arranged at the rear of the transmission and coupled to the drive shaft through the power coupling component (i.e., a fixed-ratio gear). The open circuit voltage of the battery is 600 V, and considering the maximum discharge rate of 10 C, the battery capacity is taken as 10 kW·h.
3.4. Hydraulic/Electric Synergy Vehicle
The configuration of the HESV is shown in Figure 2. The engine is downsized and the maximum power of the engine is also 150 kW. In order to be comparable to the other three vehicles, the hydraulic components (i.e., the reservoir, hydraulic accumulator, and hydraulic P/M) and the electric components (i.e., the battery and M/G) are both downsized by half. The characteristic parameters of the planetary gear set 1 and planetary gear set 2 are 2.6 and 1.35, respectively. In addition, both of the speed ratios of the gear pairs that are shown in Figure 2 are 1.
3.5. Comparison of Dynamic Performance
The dynamic performances of the four buses with different configurations are depicted in Table 3. The TV performs at the lowest level among those buses. The HHV’s performance is the best, but it will downgrade when the hydraulic accumulator is empty. Therefore, the conclusion can be drawn that the three hybrid vehicles have a similar dynamic performance, which is better than that of the TV.
4. Modeling
4.1. Engine
The engine model is based on a look-up table, which outputs a torque as a function of throttle opening and engine speed [16], as shown in the following formula.
where Te represents the output torque of engine, N·m; denotes the engine time constant, s; means the engine speed, rad/s; and indicates the throttle opening.
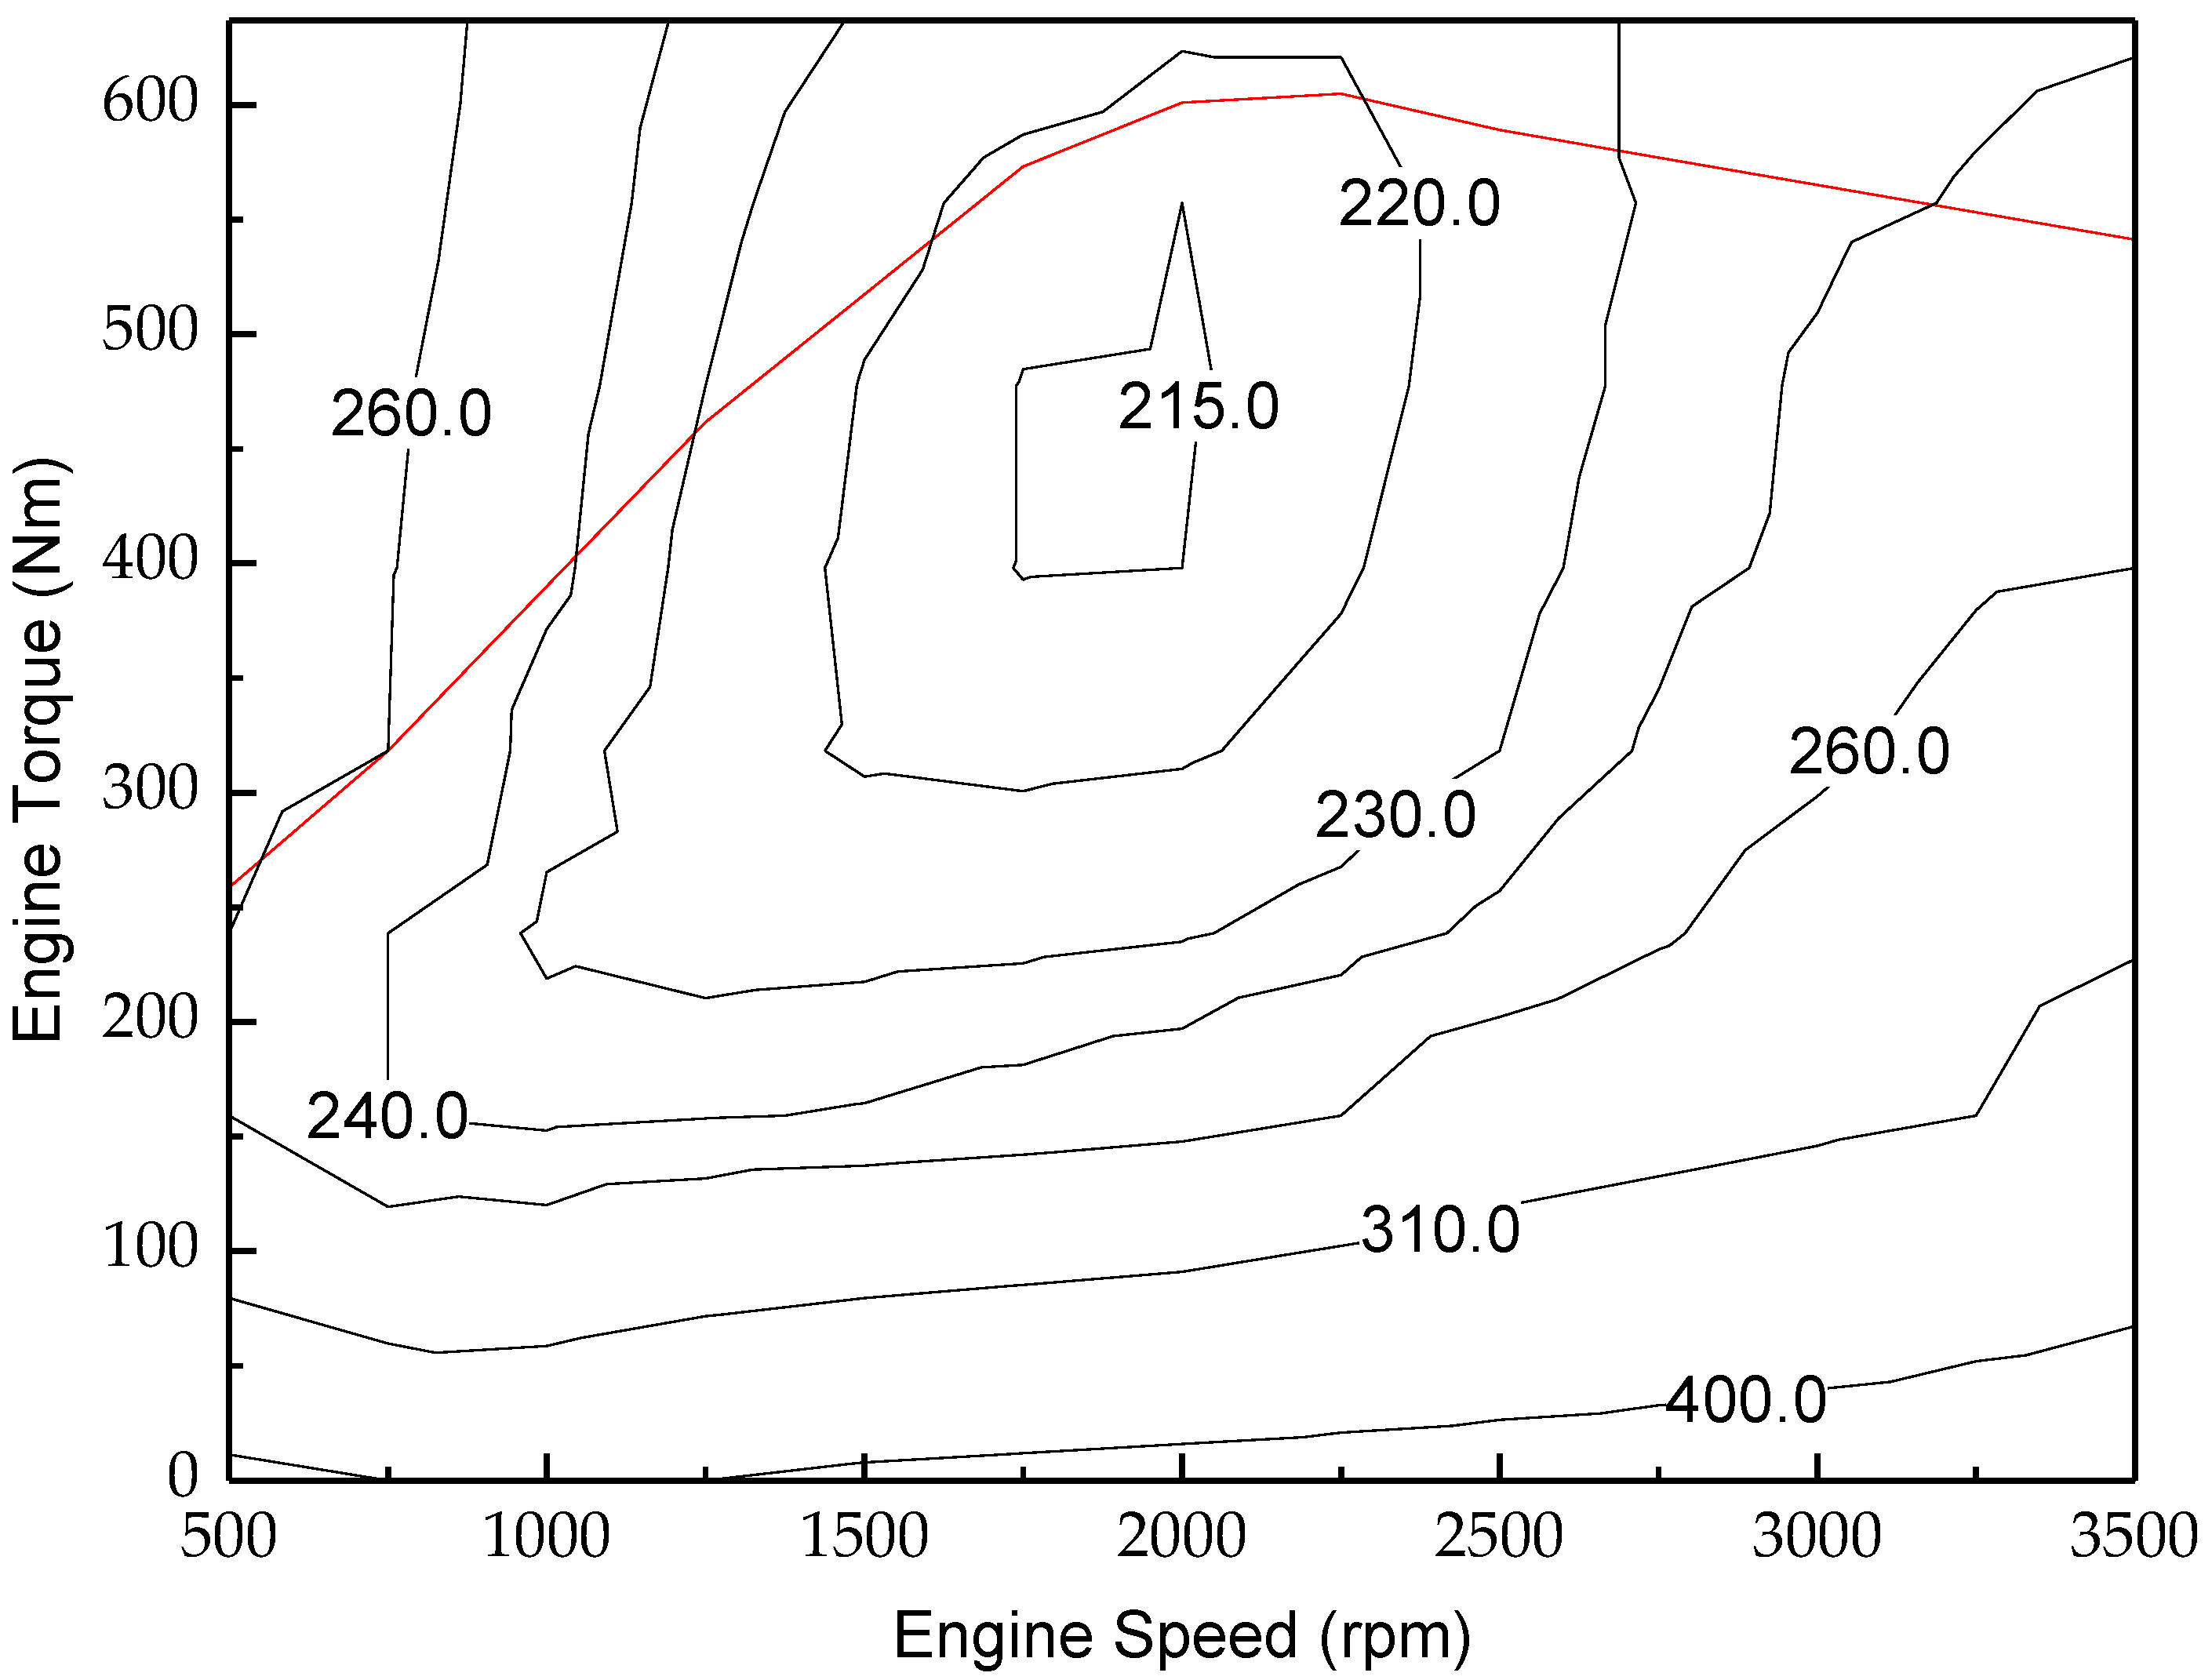
The engine fuel consumption is determined by brake specific fuel consumption (BSFC) in this article, which can be obtained by the known engine speeds and torques using the look-up table method [17]. The BSFC contour diagram for a 199 kW diesel engine is shown in Figure 5 [18], where the red line represents the full load torque of the engine.
4.2. Electric System
The motor/generator is modeled as a two-dimensional (2D) look-up table with the efficiency as a function of torque and speed [19]. Considering the maximum torque limit, the M/G dynamics assume the following form:
where Tm is the M/G torque, N·m; Tm_req is the requested torque, N·m; Tm_max is the maximum torque that M/G can provide at given speed, N·m; is the inverse of M/G time constant, s−1; and is the efficiency of the M/G. The efficiency contour diagram for a 111 kW M/G is shown in Figure 6 [20], where the red lines represent the maximum and minimum torque of the electric motor/generator.
The battery model adopts the generic battery module of Simulink. The detailed discharge/charge model and efficiency model of the battery refer to the literature [21]. The SOC of the battery is calculated by the ampere-hour approach [22]:
where Q0 is the initial capacity of the battery, is the battery’s charge/discharge current, and Qmax is the maximum capacity of the battery.
Since the service life of an urban bus is long, it requires a large number of charges and discharges. However, the life of the current batteries is limited. Thus, the total operating cost of the hybrid vehicle is largely due to the replacement cost of the battery. Therefore, it’s critical to estimate the battery life accurately. A phenomenological battery life estimation based on a damage accumulation model [23] is adopted in this article. It uses the concept of accumulated Ah throughput (i.e., the total amount of electrical charge that can flow through the battery before it reaches the end of life), which depends on the actual operating conditions. To evaluate the actual depletion of the battery charge, the effective Ah throughput is computed as:
which represents the amount of charge that would need to go through the battery using the nominal cycle to have the same aging effect of the actual cycle. The in the equation is called the severity factor, which at the cell level depends on the C-rate (Ic), temperature and depth of discharge (DOD). For charge-sustaining HEVs, the effect of the C-rate is the most important aging factor [23]. Therefore, a simplified severity factor with respect to the C-rate is considered in this paper, as follows.
where C-rate is an index defined as the ratio of the current (in A) to the nominal charge capacity (in Ah), and can be expressed as,
The end of battery life is reached when , where is the total Ah throughput. The quantity is constant for a given battery. According to literature [23] (Serrao et al.) and [24] (Spagnol et al.), the equivalent battery life is represented as:
which represents the number of driving cycles (the CUBC in this article) that the battery can service.
4.3. Hydraulic System
The modeling of hydraulic P/M and accumulator mainly refers to literature [25] (Yang et al.). The torque of the hydraulic P/M can be expressed with the following formula:
where is the pressure difference across the hydraulic P/M, MPa; is the displacement, mL/r; and is the efficiency of hydraulic P/M. The efficiency contour diagrams for a 222-kW hydraulic P/M at five different pressures are shown in Figure 7 [26].
The gas in the hydraulic accumulator is assumed to undergo an adiabatic process and obey the gas state equation:
where n is 1.4 in the adiabatic process; p0 is the pre-charging pressure, Pa; p1 is the minimum working pressure, Pa; p2 is the maximum working pressure, Pa; V0 is the gas volume when the pressure is p0, m3; V1 is the gas volume when the pressure is p1, m3; and V2 is the gas volume when the pressure is p2, m3.
4.4. Transmission Components
The dynamic equation of the planetary gear set can be expressed as [27],
where Ts, Tj, and Tr represent the torque of sun gear, planet carrier, and ring gear, respectively; , , and represent the angular velocity of the sun gear, planet carrier, and ring gear, respectively; , , and represent the moment of inertia of the sun gear, planet carrier, and ring gear, respectively; and k is the eigenvalues of the planetary gear set, which is defined as the ratio of the number of teeth of the ring gear to that of the sun gear.
According to the power transmission state, the operation of the friction clutch is divided into the following three states: separation state, sliding state, and engagement state. In the separation state, no power is transmitted by the clutch; in the engagement state, power is completely transmitted by the clutch; and in the sliding state, the torque transmitted by the clutch can be calculated by the following equation [16],
where means the number of the clutch plate; indicates the dynamic friction coefficient; Ac denotes the effective area of the clutch plate, m2; pc represents the engagement pressure, Pa; and shows the speed difference between the driving part and the driven part, in rpm.
4.5. Vehicle Dynamics
In combination with Equation (1), the driving resistance of the vehicle can be expressed as,
where is road gradient angle, rad; and is a coefficient converting the rotational mass motion of the vehicle to the longitudinal motion. It needs to be pointed out that the increased mass of the hybrid power systems is not considered in this paper.
5. Control Strategy
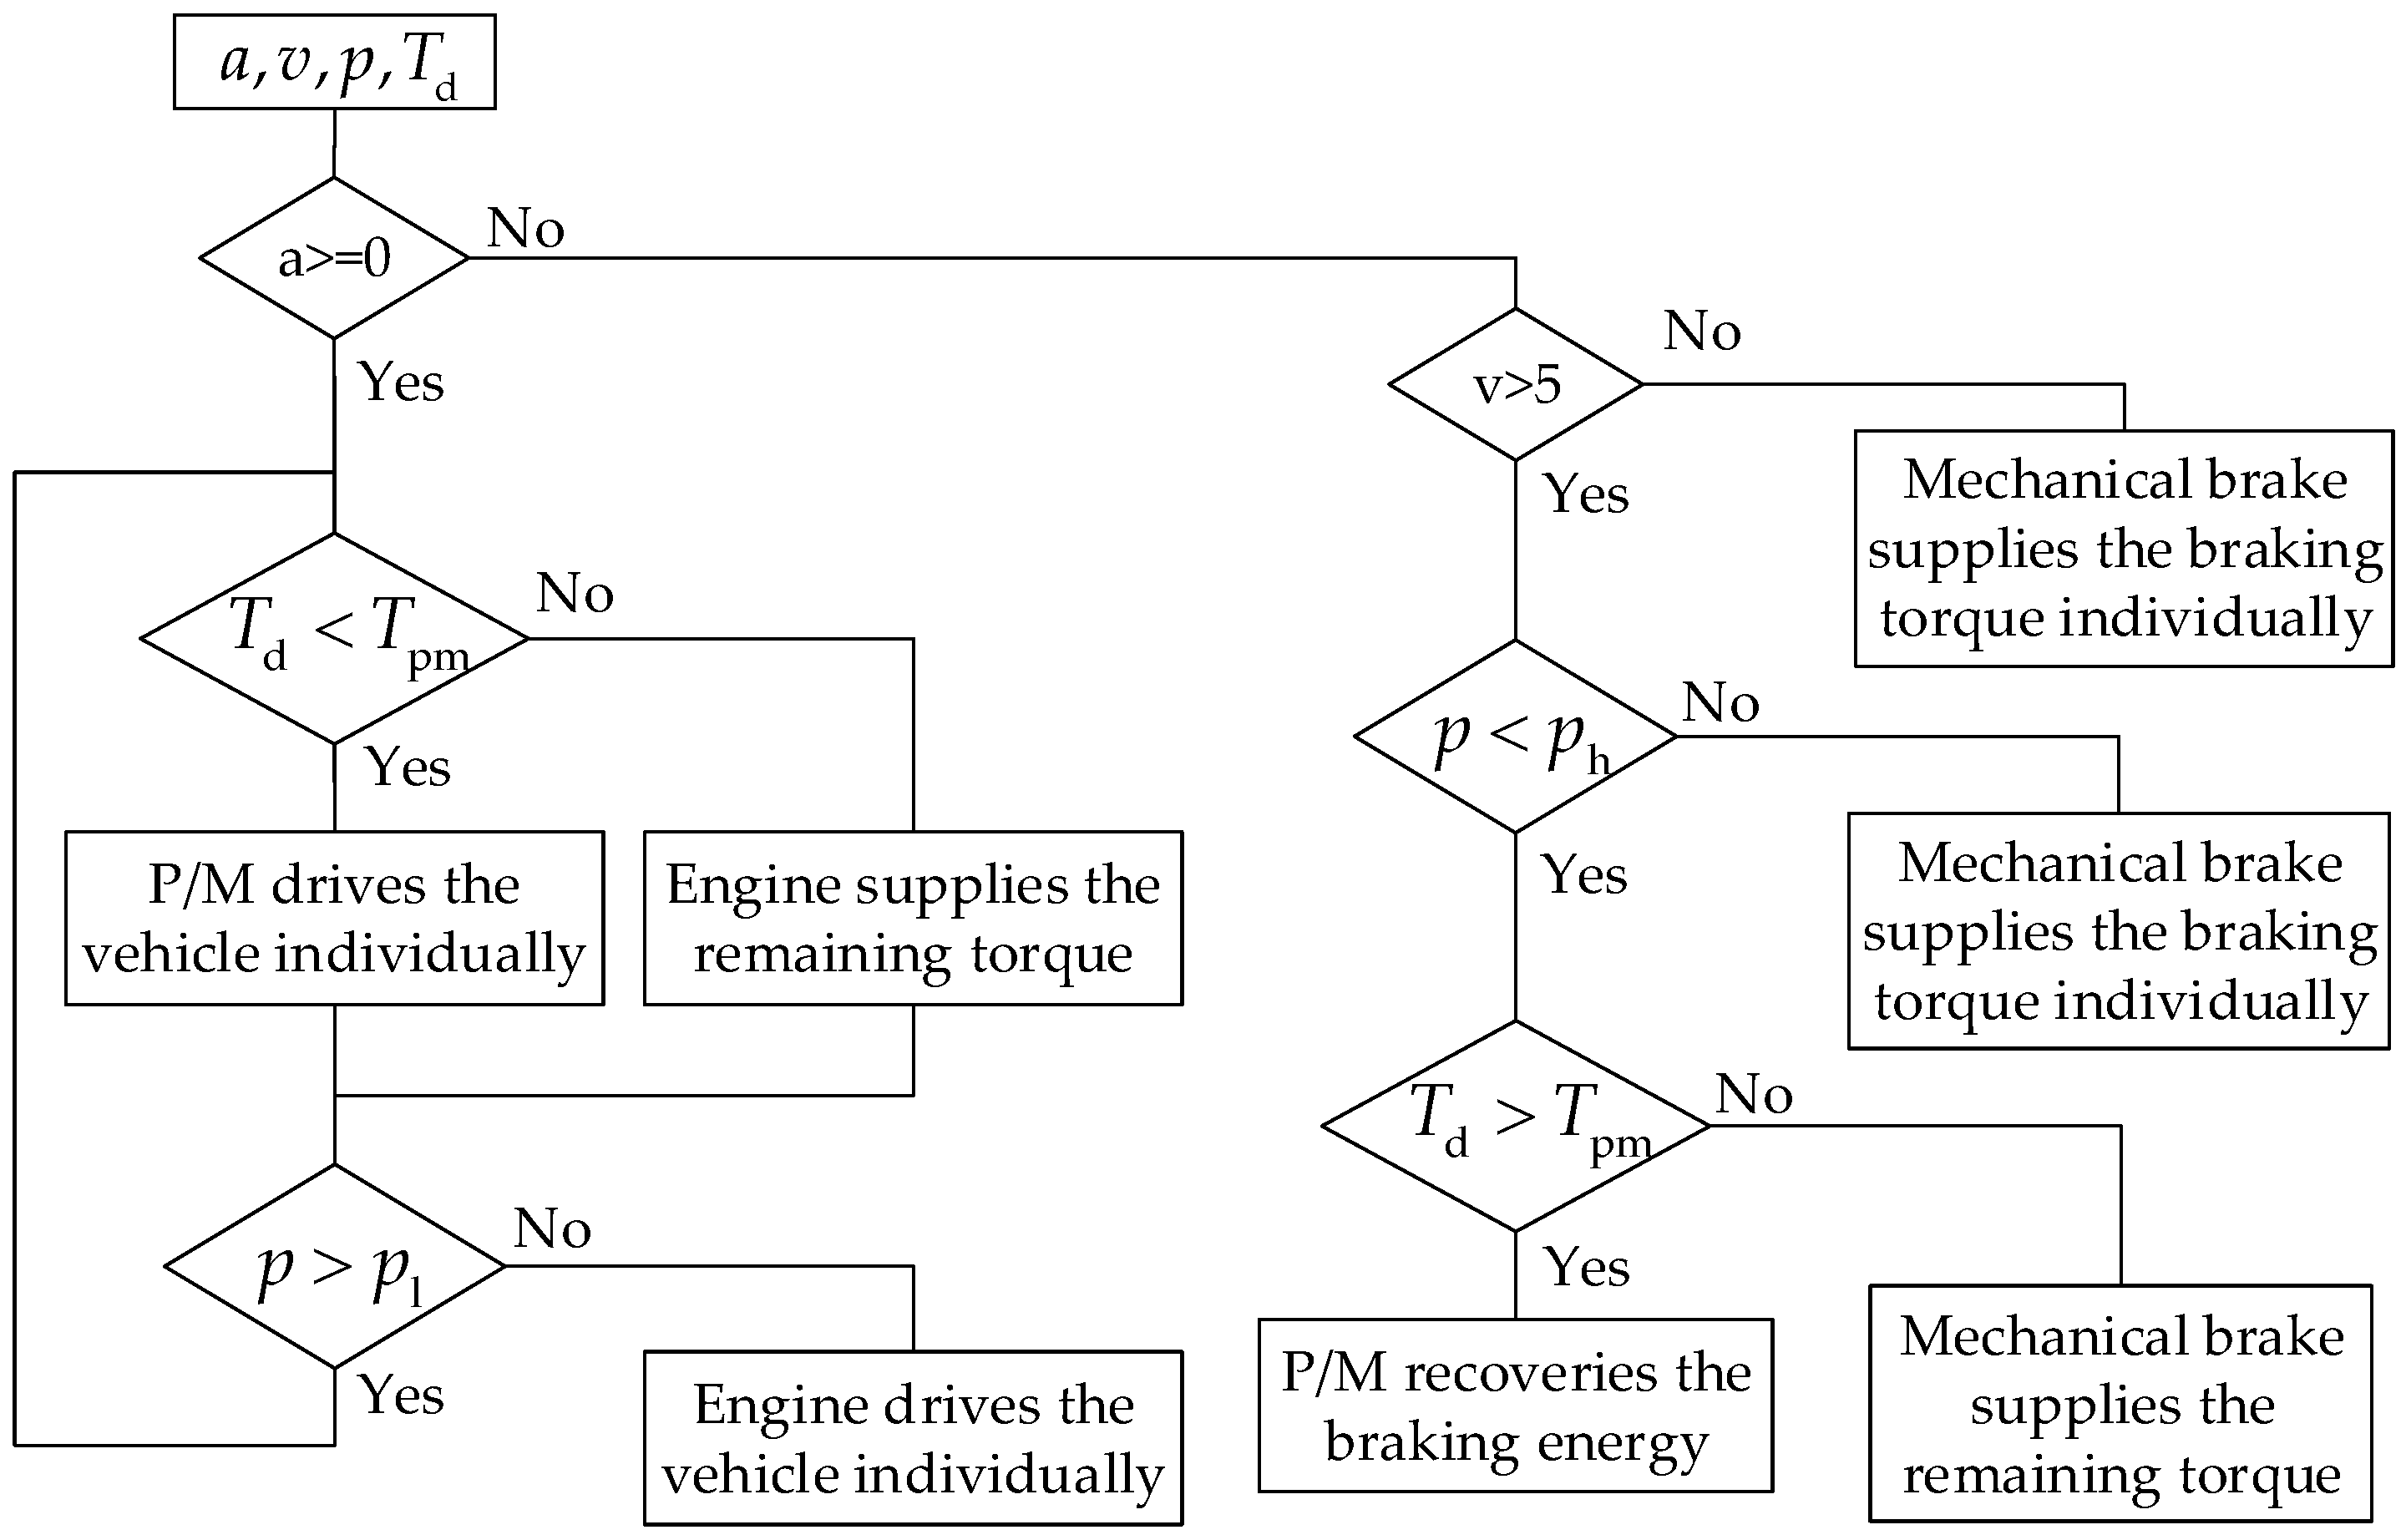
To ensure a fair comparison of fuel economy, the overall control strategy of the HHV and HEV are quite similar to that of the HESV. Figure 8 is the control flow chart of the HESV.
In order to make the actual speed rapidly follow the reference speed, feed-forward control is adopted. Firstly, the difference between the reference speed and the actual speed is input to a PI controller, which will output the deviation torque of the vehicle. Then, the demand torque is attained by adding the deviation torque to the calculated torque, which is determined by the vehicle driving resistance. Finally, the demand torque is inputted to the power management unit, and the unit distributes the demand torque among the engine, M/G, hydraulic P/M, and mechanical brake accordingly.
A torque control strategy is utilized in the engine controller, M/G controller, hydraulic P/M controller, and mechanical brake controller for a better speed follow. However, when the engine clutch is engaging or disengaging, the torque control strategy needs to be switched to a speed control strategy to avoid the case where the engine speed is beyond the upper limit.
For the power management algorithms, these hybrid vehicles all adopt deterministic rule-based strategies [28]. They are described in detail in the following sub-section.
5.1. Power Management Strategy of the HHV
Figure 9 illustrates the power management strategy of the HHV. In the starting conditions, the vehicle is driven only by the hydraulic P/M, so the engine avoids working in a relatively low-efficiency area. However, when the demand torque Td exceeds the maximum torque Tpm provided by the hydraulic P/M, the engine starts to supply the extra torque. As the pressure of the hydraulic accumulator decreases to a certain threshold pl, the hydraulic P/M is switched off, and the vehicle is driven only by the engine. When the vehicle needs to slow down or brake (the demand torque Td is negative), the braking energy is primarily recaptured by the hydraulic P/M and converted into hydraulic energy. If the braking torque provided by the hydraulic P/M is inadequate, the mechanical brake starts to assist. If the pressure of the hydraulic accumulator reaches another threshold ph or the speed is lower than 5 km/h, then the hydraulic P/M is switched off, with the mechanical brake individually delivering the braking torque.
In order to attain an ideal fuel economy, according to the BSFC contour diagram of the engine, the gear-shifting strategy needs to maintain the engine speed at 1500~2500 rpm. Table 4 is the specific gear-shifting rules determined by the engine speed, where GUP and GDN denote the velocities of the up-shifting and down-shifting, respectively.
5.2. Power Management Strategy of the HEV
Figure 10 illustrates the power management strategy of the HEV. In the starting conditions, the vehicle is driven only by the M/G. However, when the demand torque Td exceeds the maximum torque Tmg provided by the M/G, the engine starts to assist the motor. As the speed increases to a certain threshold v0, the M/G is switched off, and the vehicle is driven only by the engine. In high-speed conditions, if the demand power is smaller than a certain threshold P0, the vehicle is driven by the M/G individually; otherwise, the vehicle is driven by the engine with the assistance of the M/G, if needed. When the vehicle needs to slow down or brake (the demand torque Td is negative), the braking energy is first recovered by the M/G, and then converted into electricity to charge the battery. If the braking torque provided by the M/G is insufficient, the mechanical brake starts to work together with the generator. When the speed is lower than 5 km/h, the mechanical brake supplies the braking torque individually. It should be noted that the initial and terminal SOC basically remain the same by adjusting the threshold v0. The gear-shifting strategy of the HEV is the same as that of the HHV.
5.3. Power Management Strategy of the HESV
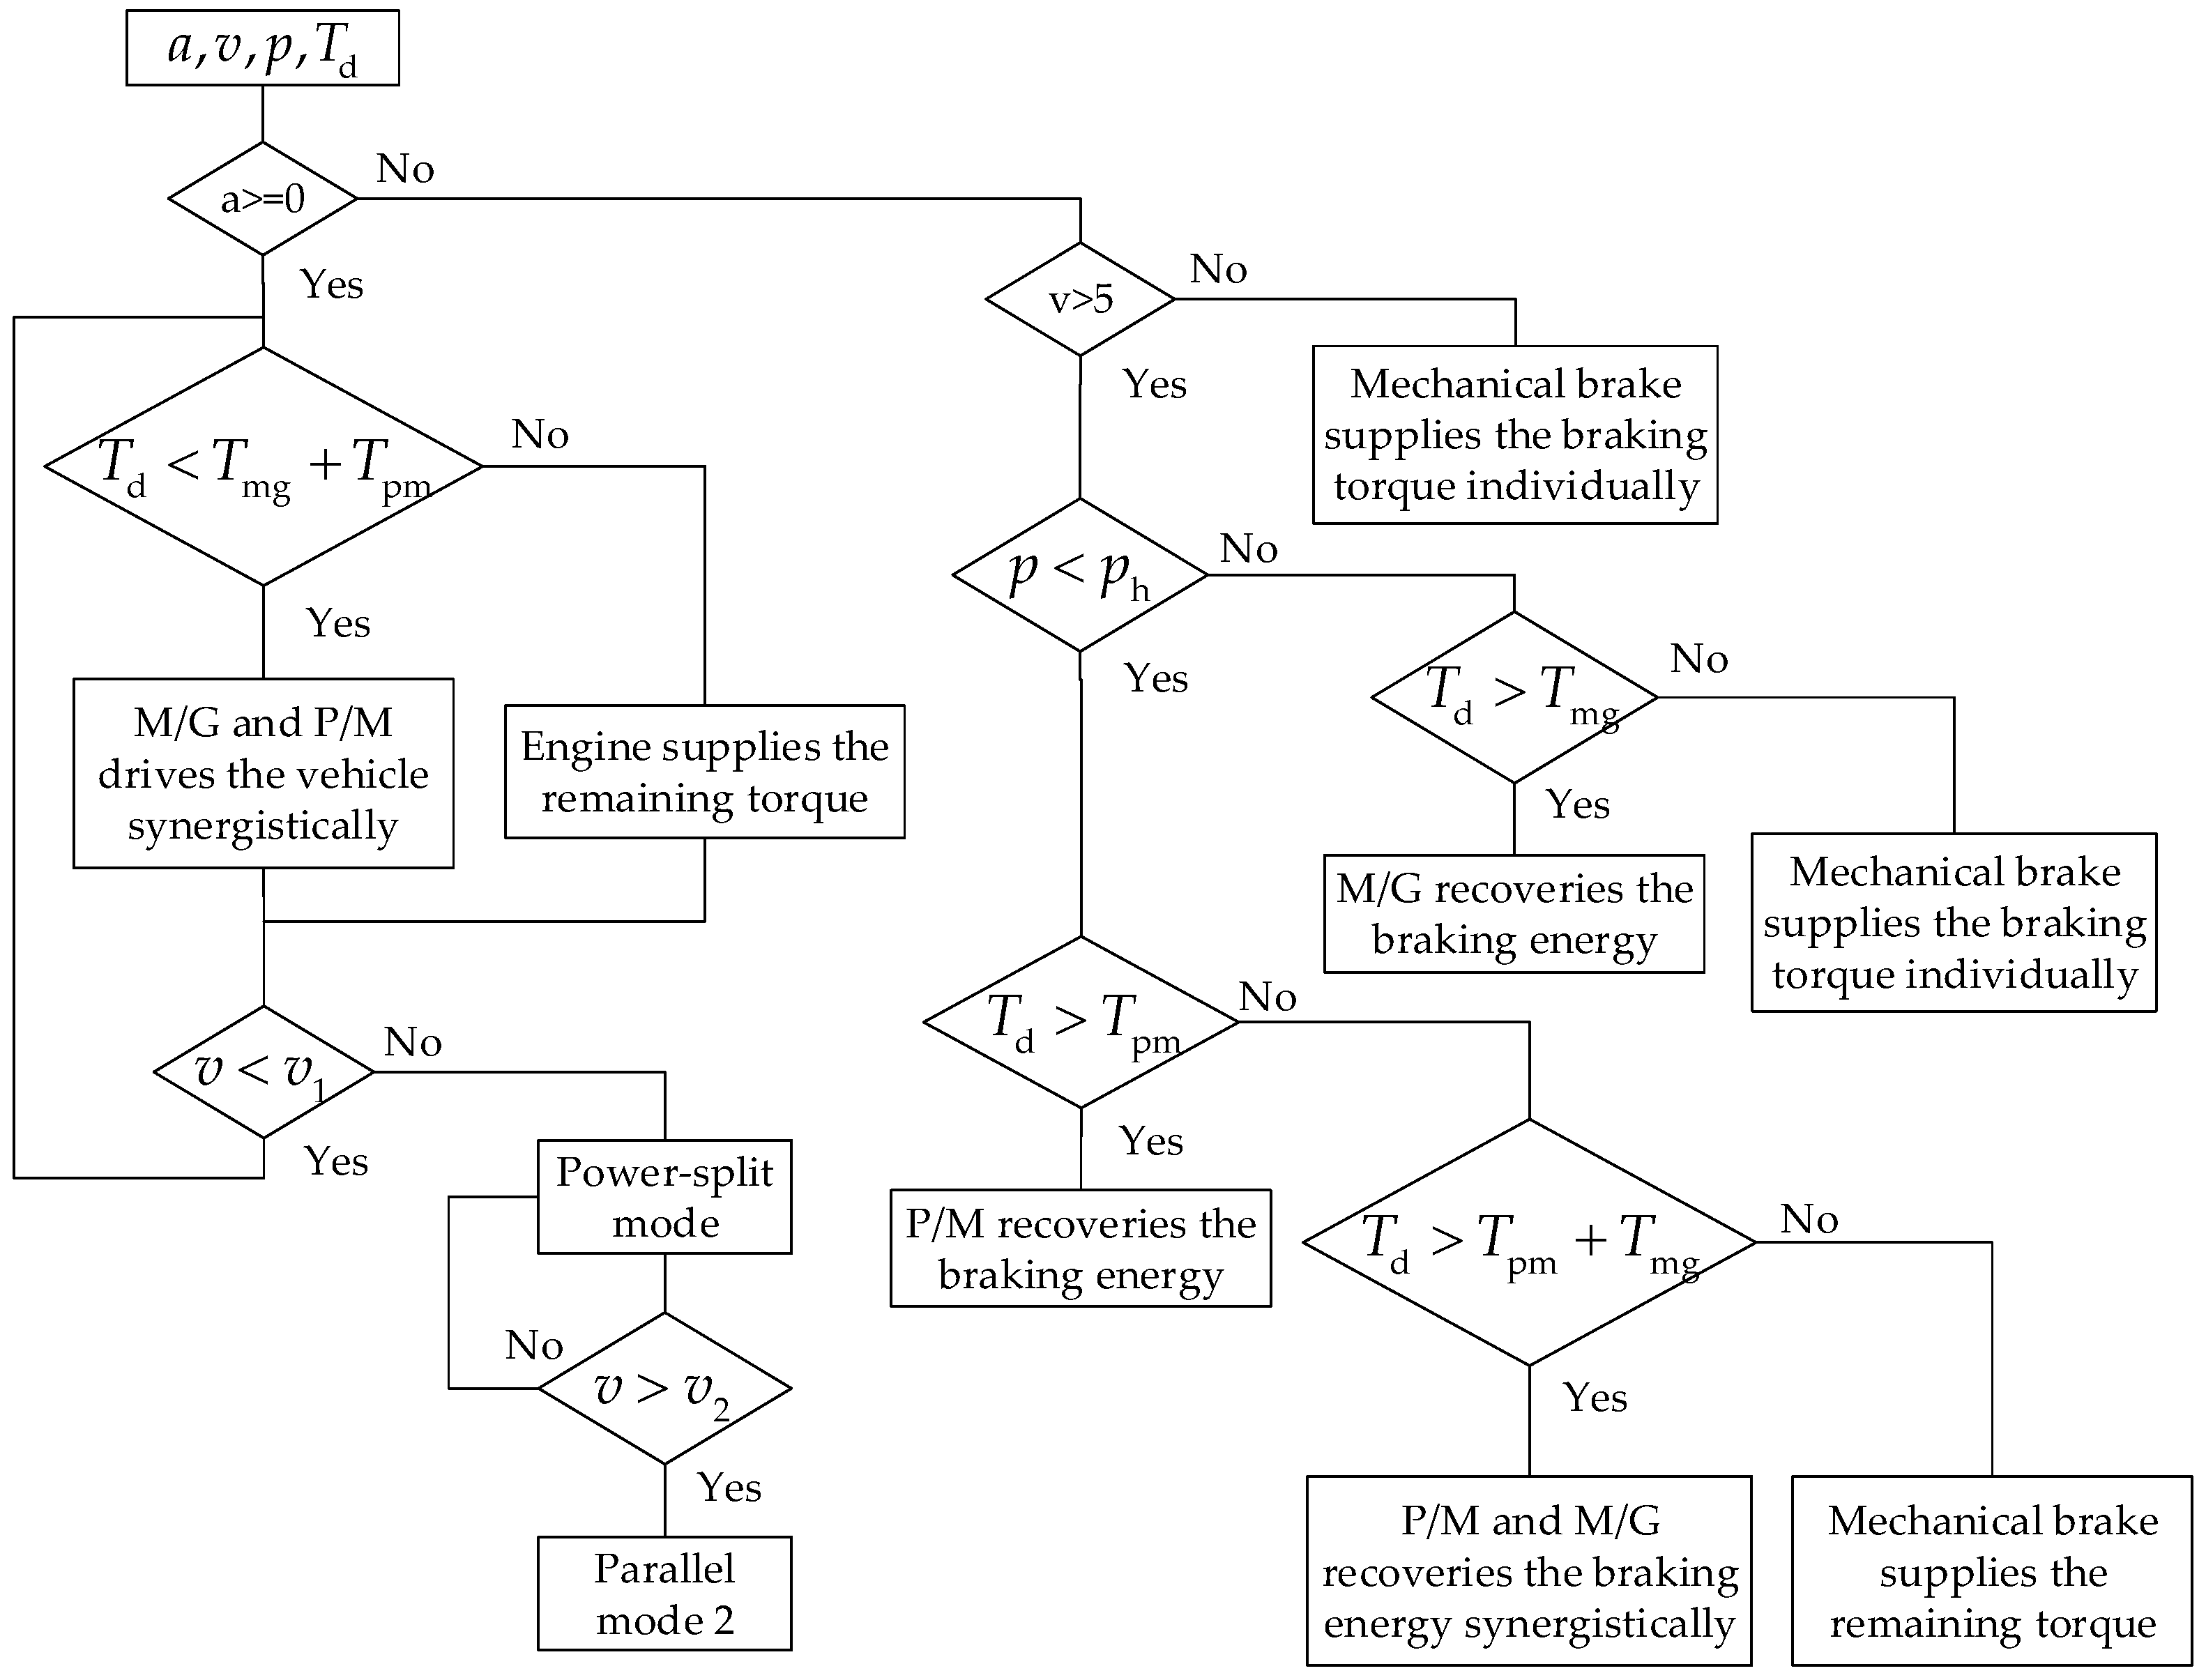
Figure 11 illustrates the control strategy of the HESV. During the start-up period, the HESV works in parallel mode 1, and the vehicle is driven by both the hydraulic P/M and the M/G. If the driving torque is insufficient, the engine starts to compensate the torque. As the speed increases to a certain threshold v1, the HESV switches to a power-split mode where the engine always runs in the certain range near the minimum fuel consumption line by adjusting the speed and torque of the M/G. As the speed increases to another threshold v2, the HESV switches to parallel mode 2. In this mode, the vehicle is directly driven by the engine unless the M/G is needed. When the vehicle needs to slow down or brake (the demand torque Td is negative), the braking energy is firstly recovered by the hydraulic P/M. If the braking torque provided by the hydraulic P/M is insufficient, the M/G starts and supplies the needed torque. If the torque provided by both the hydraulic P/M and M/G still cannot meet the requirement, the mechanical brake starts to compensate the gap. If the pressure of the hydraulic accumulator reaches a certain threshold ph, the hydraulic P/M is switched off with the M/G, or the mechanical brake delivers the braking torque. When the speed is lower than 5 km/h, the mechanical brake delivers the braking torque individually.
Note that in parallel mode 1, the speed ratios of the engine or M/G to the drive shaft are 2.35 and 2.51, respectively, which can be calculated from the following equations.
where ns1, nj1, nr1, ns2, nj2, and nr2 represent the rotation speed of the sun gear, planet carrier, and ring of the planetary set 1 and planetary set 2, respectively.
6. Simulation Results
6.1. Fuel Economy Analysis
Based on the dynamic equations and the power management strategies described above, the forward simulation models of the four vehicles are built in the platform of MATLAB/Simulink/Driveline. The speed following error is less than 1 km/h, ensuring the accuracy of the simulation. The simulation results under the CUBC are reported in Table 5, where the equivalent fuel consumption refers to the sum of the engine fuel consumption and the fuel consumption converted by the SOC variation of the battery.
It’s obvious that the fuel economy of the three hybrid vehicles is significantly more efficient than the TV. However, the fuel consumption of the three hybrid vehicles is quite similar. Therefore, the superiority of the scheme cannot be distinguished through only considering the fuel economy. The total cost over five years is estimated in the next section. In order to verify the Simulink models, the fuel economy simulation of the TV is also carried out in the platform of ADVISOR. The fuel consumption of the TV under CUBC is 31.7 L/100 km, which is quite close to the result attained in Simulink, indicating the effectiveness of Simulink models. Note that the results refer to the Chinese urban bus cycle and might not suitable for real driving conditions.
Figure 12 is about the time histories of the battery SOC along the cycle for the HEV and HESV. As we can see, the depth of discharge of the two hybrid vehicles is less than 10%, and the terminal SOC is basically the same as the initial SOC.
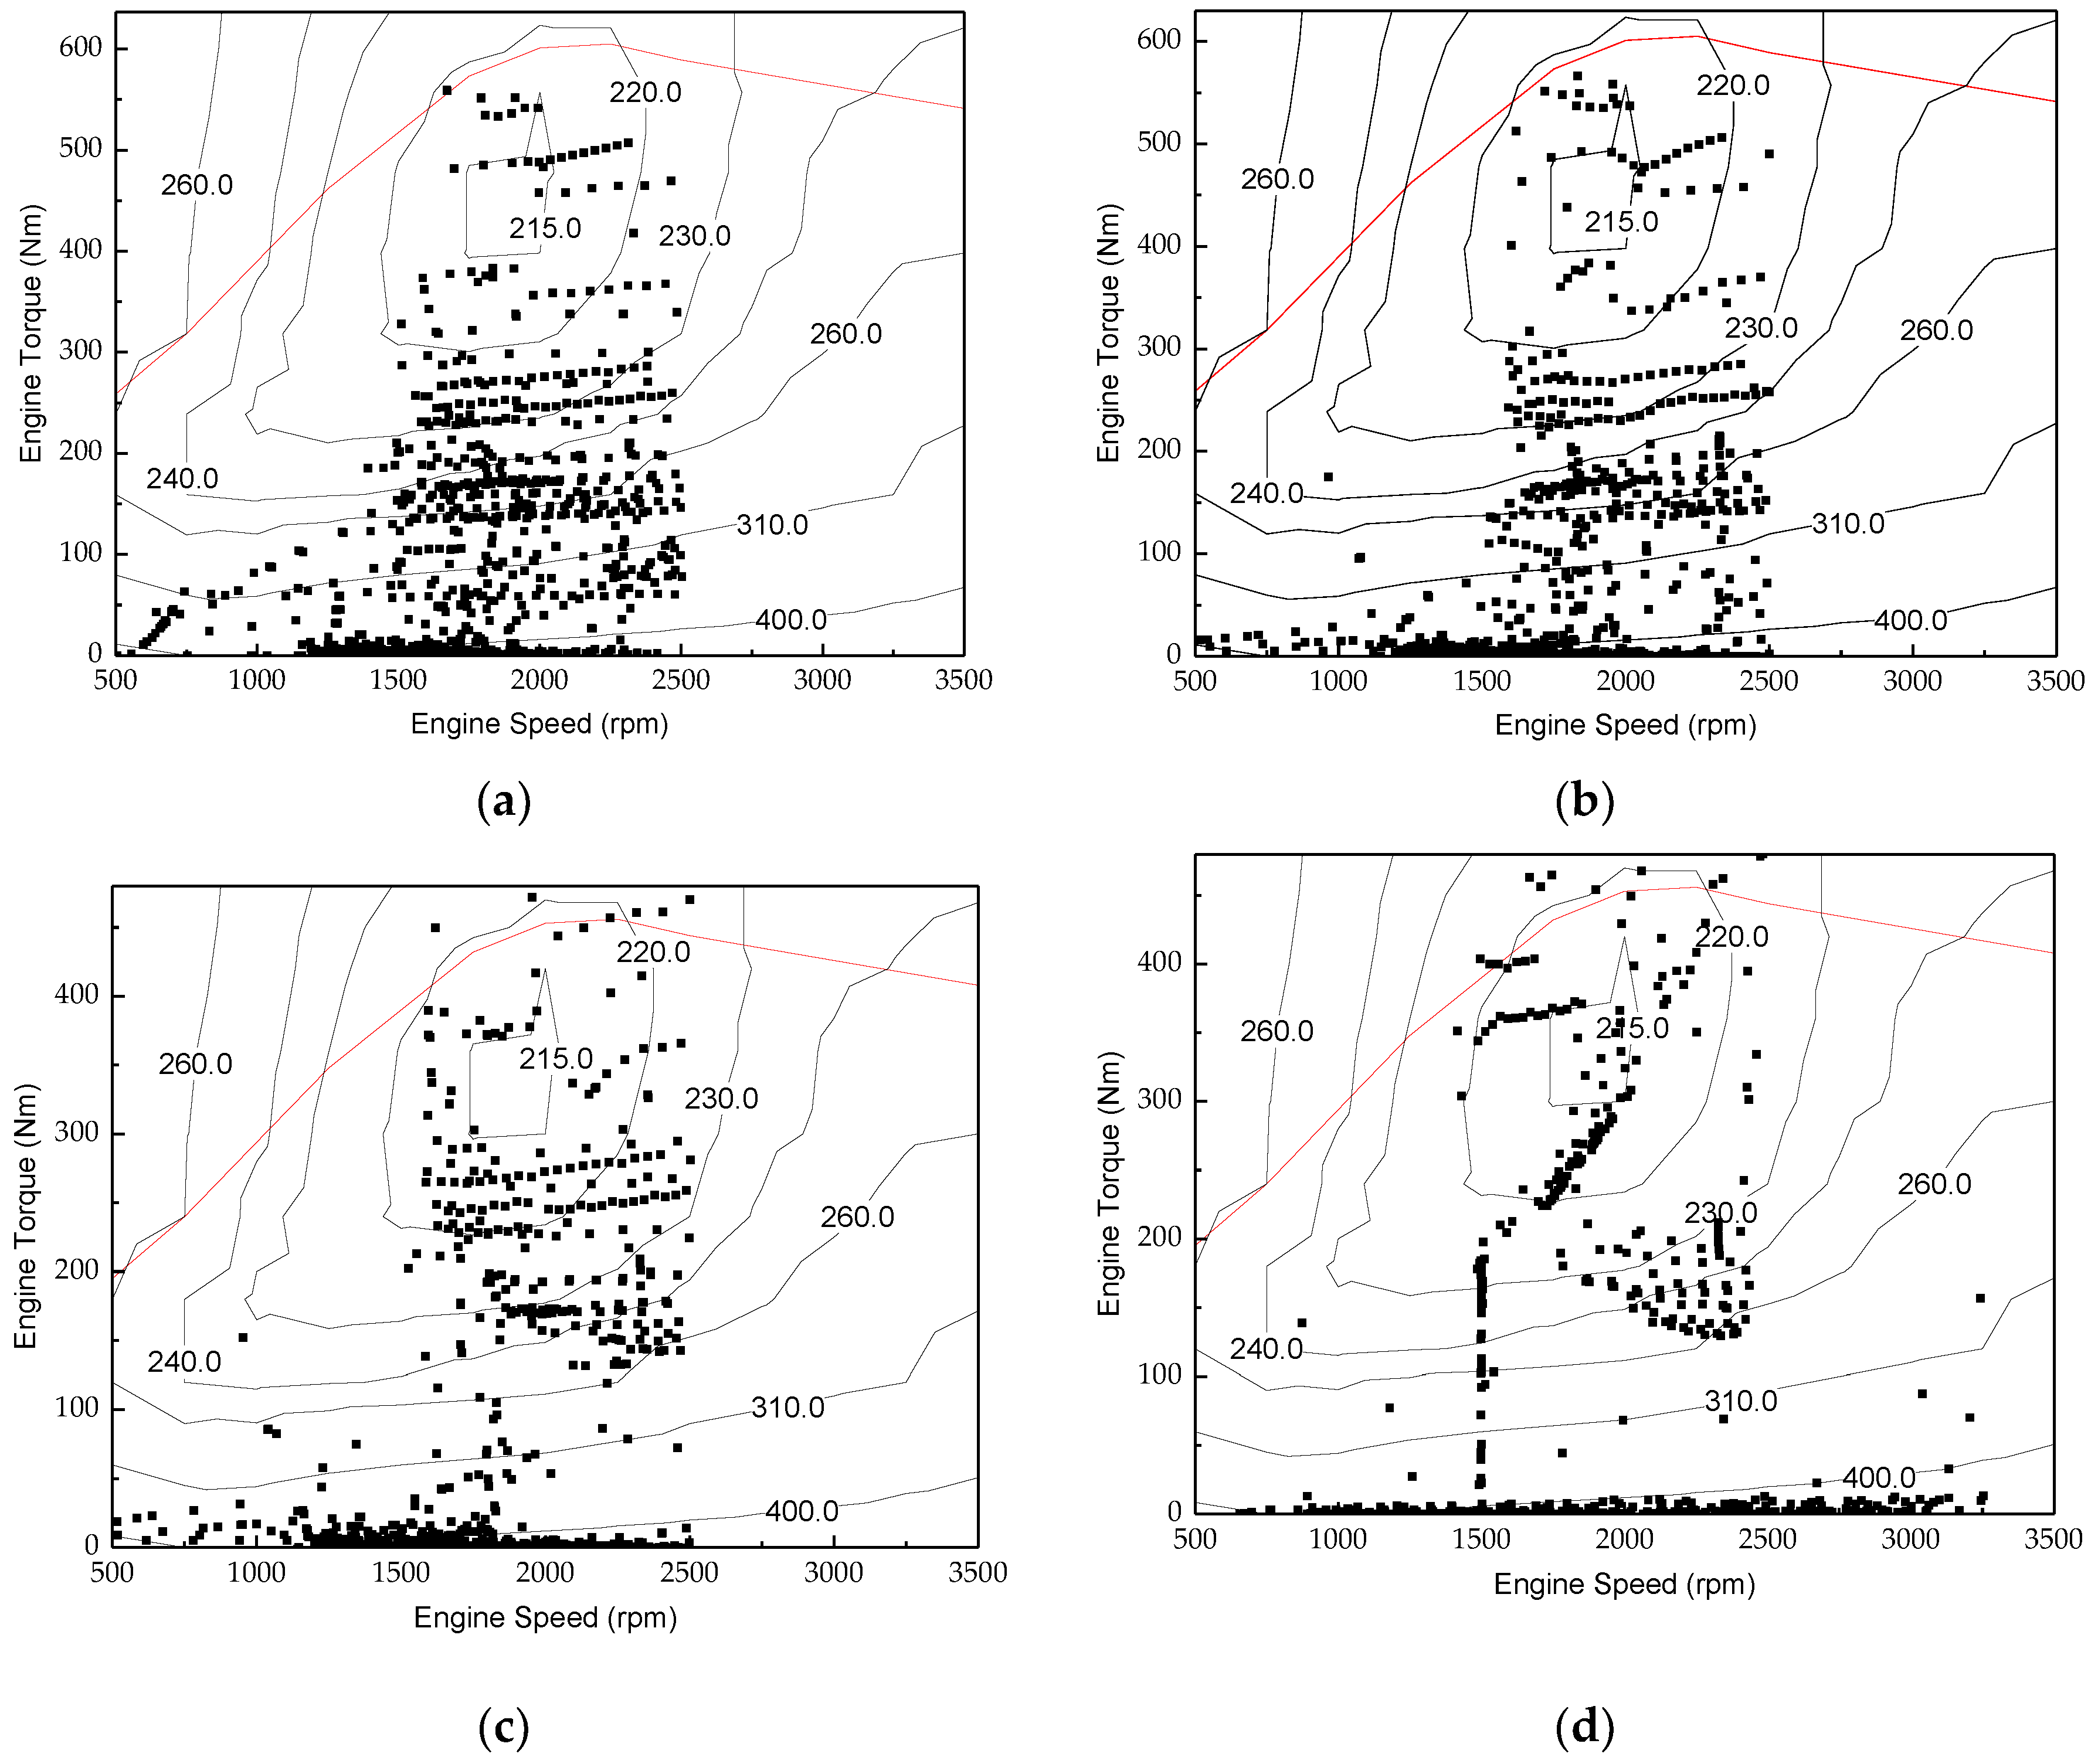
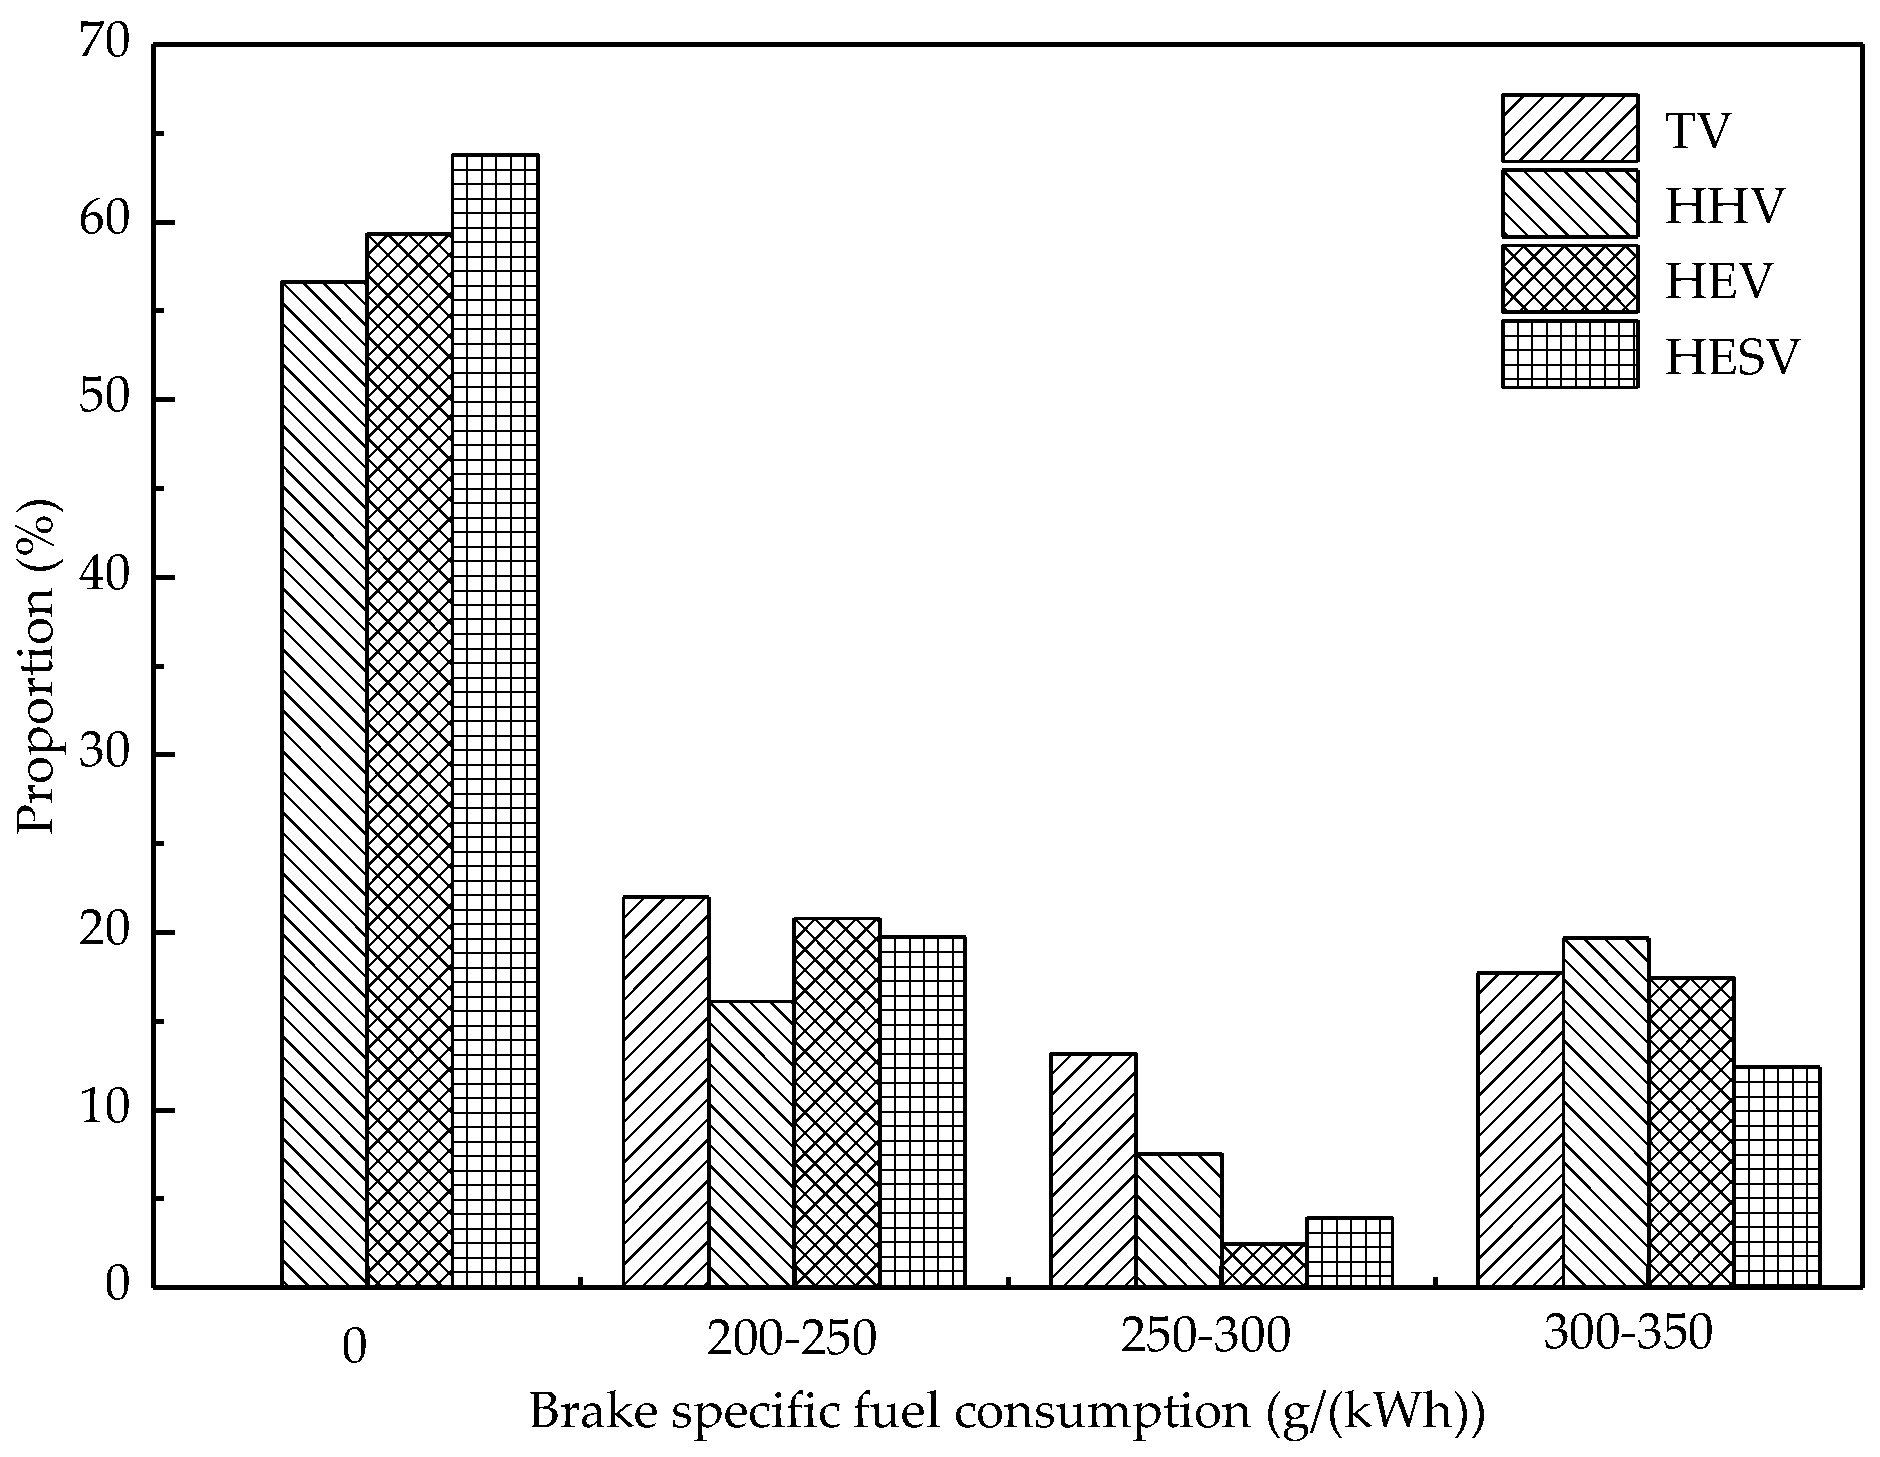
Figure 13 is the engine working points of four vehicles. Compared with TV, the engine working points of three hybrid vehicles are clustered in moderate or high load zone. Figure 14 is the distribution of engine working points. It’s obvious that the engine shuts down for the longest time in the HESV among the three hybrid vehicles. Compared with the HEV, the HHV tends to work at higher fuel consumption points because the engine might be activated to supply power due to the lower energy density of the accumulator. The working point of the HESV is similar with that of the HEV. In addition, the HESV tends to work the least time in the interval of 300~350 g/(kW·h) among three hybrid vehicles, which shows the superiority of its power-split mode.
6.2. Total Operating Cost Estimation in Five Years
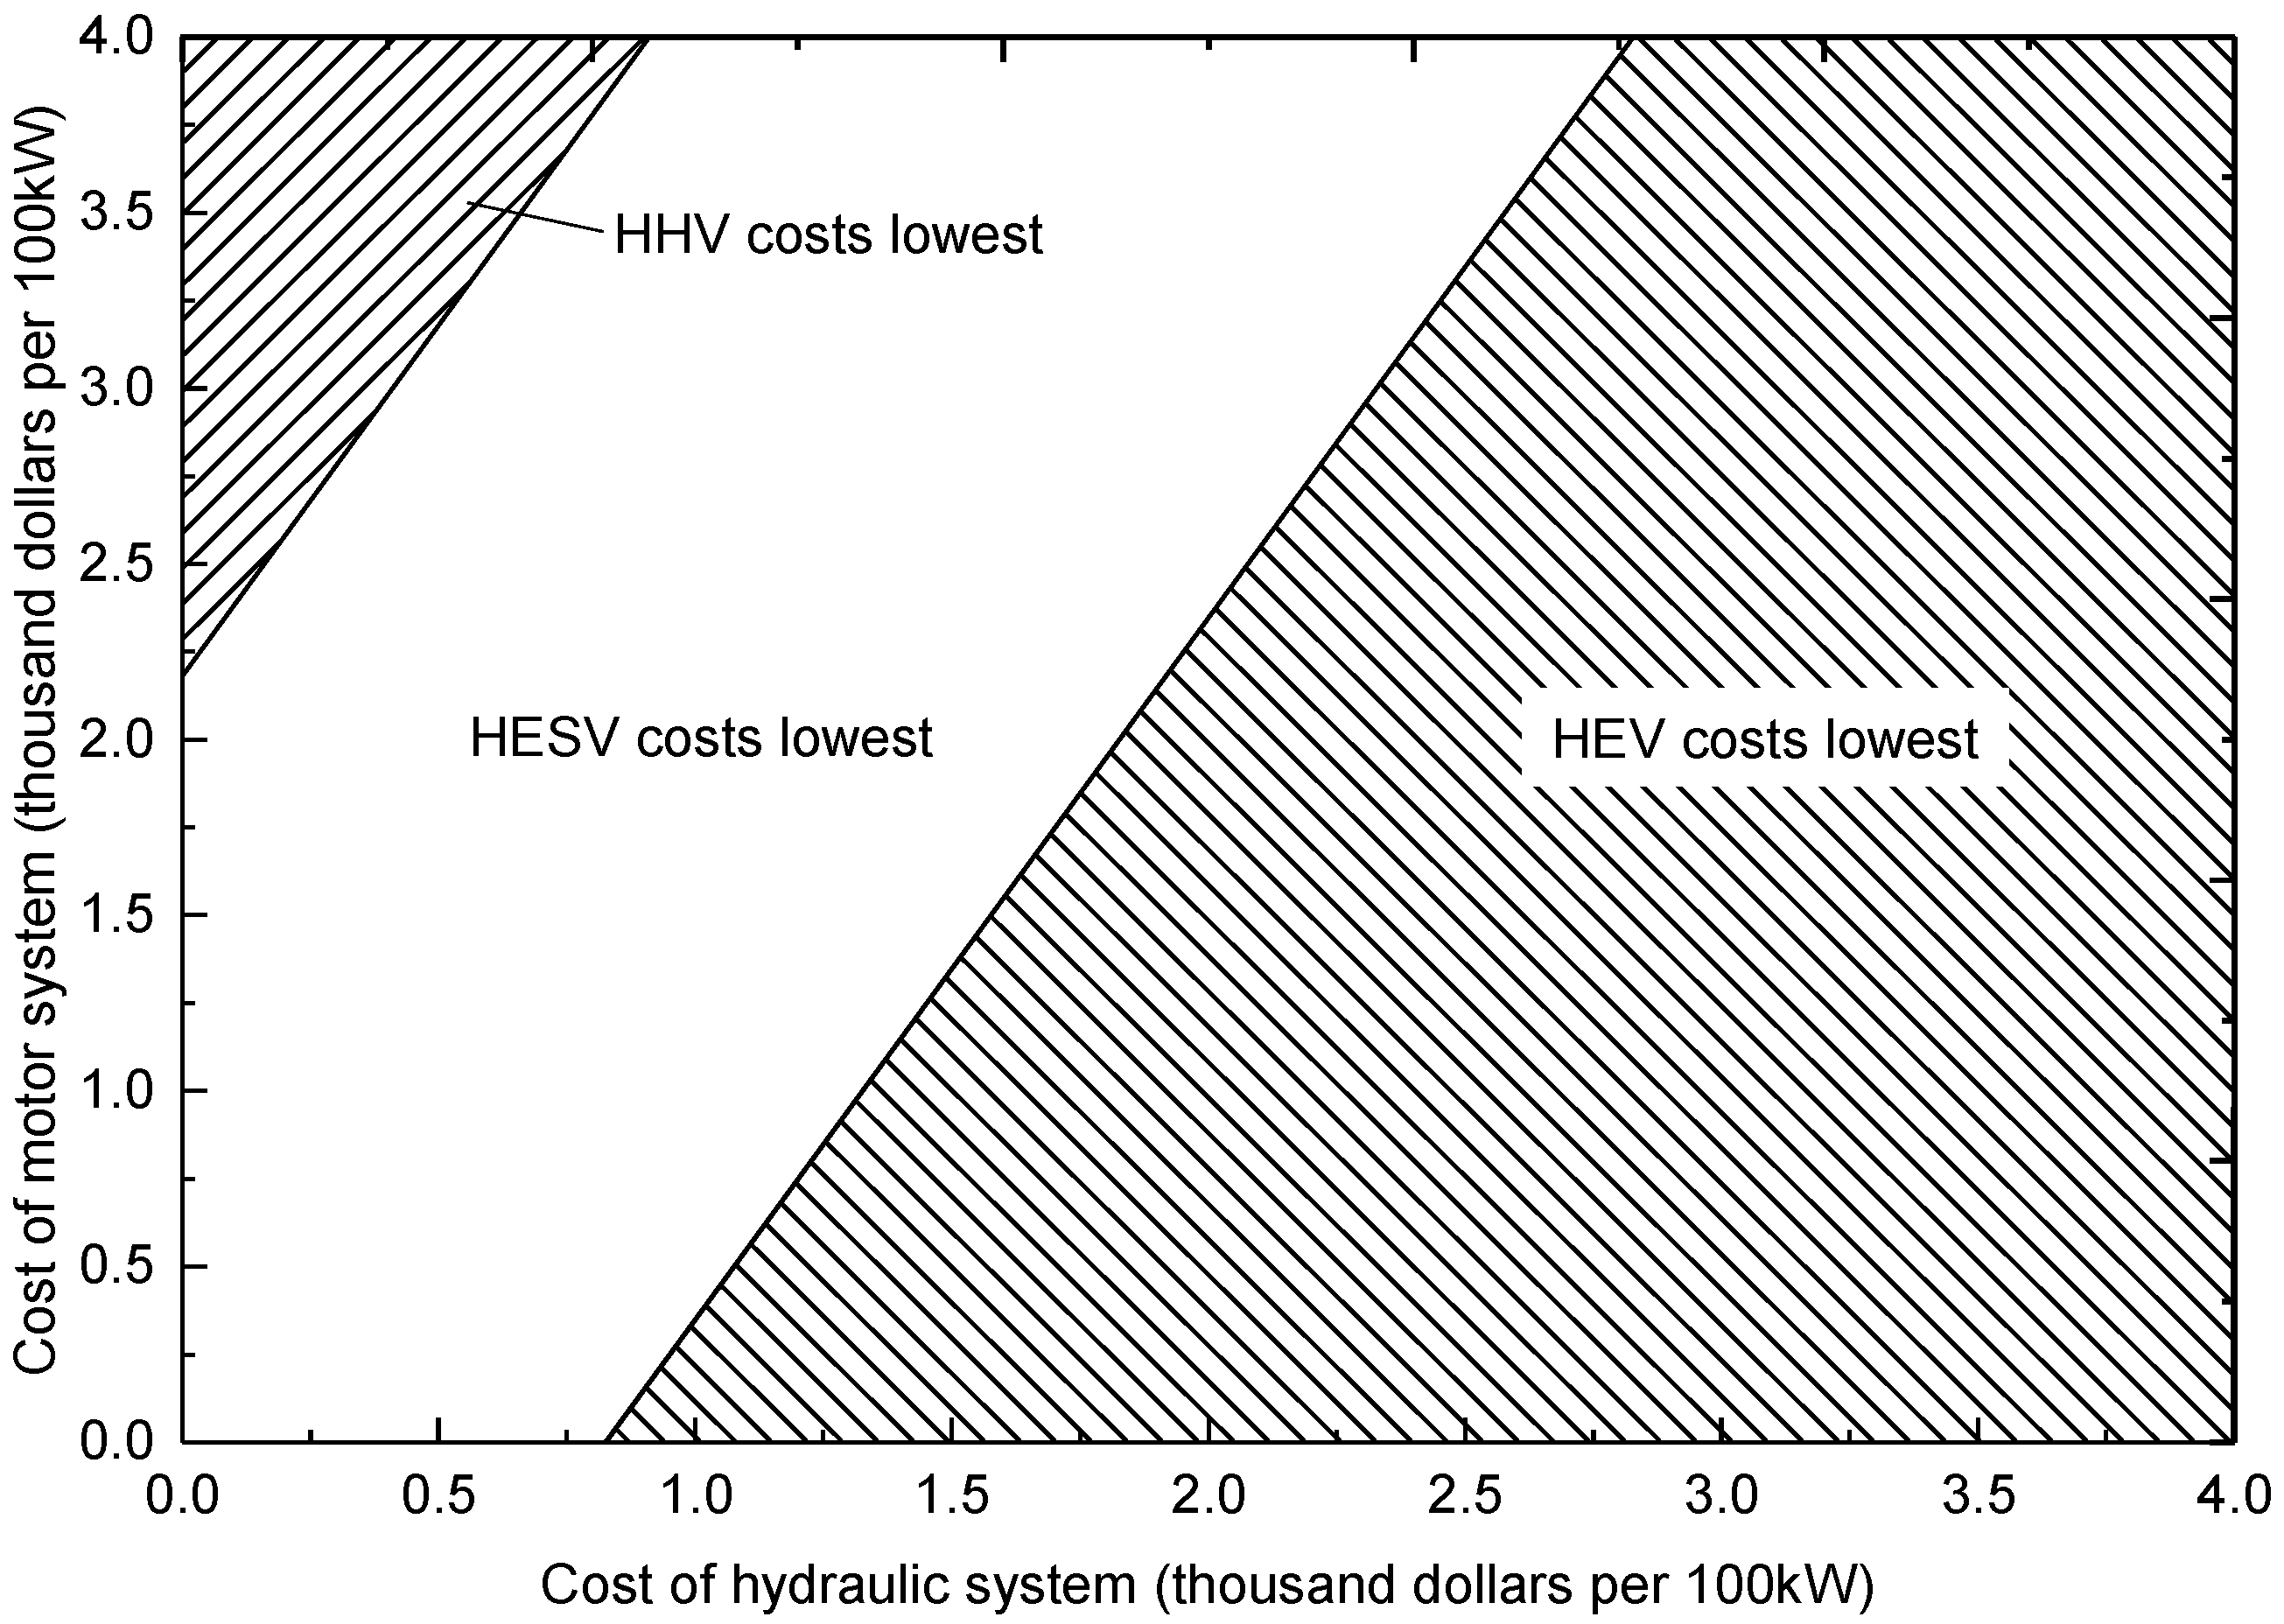
As can be seen from Table 5, compared with the HHV, the HESV can save 0.81 L fuel per 100 km. Assuming that a typical Chinese urban bus travels 80,000 km per year, the HESV can save $3000 in five years based on China’s current average oil price of $0.93/L. In order to facilitate the quantitative estimation of the total operating cost, it is assumed that the 199-kW engine costs $6000, the 150-kW engine costs $4500, the cell costs $140/kW·h, the hydraulic system (including hydraulic accumulator) costs $x thousand per 100 kW, and the motor system (without battery) costs $y thousand per 100 kW. The total operating cost of the three hybrid vehicles can be represented with:
where zHESV, zHEV, and zHHV are the total operating cost of the HESV, HEV, and HHV, respectively.
Based on Equation (15), the total operating cost of the three hybrid vehicles is shown in Figure 15. This map illustrates the lowest cost ranges of three hybrid vehicles. The HHV wins out only when the cost of the motor system is much greater than that of the hydraulic system, while the HEV sticks out in near half of the conditions. Although the estimate cost of the engine and the battery may deviate slightly from the actual cost here, these cost analysis estimations can aid in the selection of optimal hybrid systems.
7. Conclusions
A numerical investigation aimed at comparing different power systems (i.e., conventional, hydraulic, electric, and hydraulic/electric synergy) for an urban bus is carried out in this paper. The component sizes of three hybrid vehicles are selected, and models of four vehicles are built in the MATLAB/Simulink/Driveline platform. Fuel economy simulation under China’s urban bus cycle shows that the fuel consumption of the three hybrid vehicles is similar but much better than that of the TV. Moreover, based on the equivalent battery life estimation, the total operating costs of the three hybrid vehicle in five years are compared, and their lowest cost ranges are determined. The cost analysis can contribute to the selection of different hybrid schemes.
Acknowledgments
The authors would like to appreciate the financial support of the National Natural Science Foundation of China (Grant No. 51405087), and the Fundamental Research Funds for the Central Universities (Grant No. 2015ZZ086).
Author Contributions
Kegang Zhao and Zhihao Liang proposed the specific tri-energy hybrid powertrain and conducted the simulation. Yanjun Huang proposed the control strategies. Hong Wang modeled the electric system and proposed the battery life estimation formula. Amir Khajepour put forward the concept of tri-energy hybrid. Yuke Zhen matched the dynamic parameters for hybrid vehicles.
Conflicts of Interest
The authors declare no conflict of interest.
References
- Filipi, Z.; Louca, L.; Daran, B.; Lin, C.C.; Yildir, U.; Wu, B.; Kokkolaras, M.; Assanis, M.; Peng, H.; Stein, J.; et al. Combined optimisation of design and power management of the hydraulic hybrid propulsion system for the 6 × 6 medium truck. Int. J. Heavy Veh. Syst. 2004, 11, 372–402. [Google Scholar] [CrossRef]
- Wu, B.; Lin, C.C.; Filipi, Z.; Peng, H.; Assanis, D. Optimal Power Management for a Hydraulic Hybrid Delivery Truck. Veh. Syst. Dyn. 2004, 42, 23–40. [Google Scholar] [CrossRef]
- Pregelj, B.; Vrecko, D.; Petrovcic, J.; Jovan, V.; Dolanc, G. A model-based approach to battery selection for truck onboard fuel cell-based APU in an anti-idling application. Appl. Energy 2015, 137, 64–76. [Google Scholar] [CrossRef]
- Bubna, P.; Brunner, D.; Advani, S.G.; Prasad, A.K. Prediction-based optimal power management in a fuel cell/battery plug-in hybrid vehicle. J. Power Sources 2010, 195, 6699–6708. [Google Scholar] [CrossRef]
- Santucci, A.; Sorniotti, A.; Lekakou, C. Power split strategies for hybrid energy storage systems for vehicular applications. J. Power Sources 2014, 258, 395–407. [Google Scholar] [CrossRef]
- Yu, Q.; Xiong, R.; Lin, C.; Shen, W.; Deng, J. Lithium-ion Battery Parameters and State-of-Charge Joint Estimation Based on H-Infinity and Unscented Kalman Filters. IEEE Trans. Veh. Technol. 2017, 207, 8693–8701. [Google Scholar] [CrossRef]
- Sun, H.; Jiang, J.H.; Wang, X. Torque control strategy for a parallel hydraulic hybrid vehicle. J. Terramechan. 2009, 46, 259–265. [Google Scholar]
- Sun, H.; Yang, L.; Jing, J.; Luo, Y. Control strategy of hydraulic/electric synergy system in heavy hybrid vehicles. Energy Convers. Manag. 2011, 52, 668–674. [Google Scholar]
- Huang, X.; Zhao, K.; Luo, Y.; Liu, W. Study on a new split type of HEV powertrains. Int. J. Veh. Des. 2005, 38, 96–105. [Google Scholar]
- Kang, J.; Choi, W.; Kim, H. Development of a control strategy based on the transmission efficiency with mechanical loss for a dual mode power split-type hybrid electric vehicle. Int. J. Automot. Technol. 2012, 13, 825–833. [Google Scholar] [CrossRef]
- Grewe, T.M.; Conlon, B.M.; Holmes, A.G. Defining the General Motors 2-Mode Hybrid Transmission. In Proceedings of the 2007 World Congress, Detroit, MI, USA, 16–19 April 2007. [Google Scholar]
- Mashadi, B.; Emadi, S.A.M. Dual-Mode Power-Split Transmission for Hybrid Electric Vehicles. IEEE Trans. Veh. Technol. 2010, 59, 3223–3232. [Google Scholar] [CrossRef]
- GB/T 19754-2015. Test Methods for Energy Consumption of Heavy-Duty Hybrid Electric Vehicles; China Standard Press: Beijing, China, 2015. [Google Scholar]
- Yan, Y.; Liu, G.; Chen, J. Integrated Modeling and Optimization of a Parallel Hydraulic Hybrid Bus. Int. J. Automot. Technol. 2010, 11, 97–104. [Google Scholar] [CrossRef]
- Wang, B.H.; Luo, Y.G.; Zhang, J.W. Simulation of City Bus Performance Based on Actual Urban Driving Cycle in China. Int. J. Automot. Technol. 2008, 9, 501–507. [Google Scholar] [CrossRef]
- Zhao, Z.G.; He, N.; Zhu, Y.; Yu, Z.P. Mode Transition Control for Four Wheel Drive Hybrid Electric Car. J. Mech. Eng. 2011, 47, 100–109. [Google Scholar] [CrossRef]
- Chen, J.S. Energy Efficiency Comparison between Hydraulic Hybrid and Hybrid Electric Vehicles. Energies 2015, 8, 4697–4723. [Google Scholar] [CrossRef]
- Kim, Y.; Filipi, Z. Simulation Study of a Series Hydraulic Hybrid Propulsion System for a Light Truck. In Proceedings of the Commercial Vehicle Engineering Congress and Exhibition, Rosemont, IL, USA, 30 October–1 November 2007. [Google Scholar]
- Johri, R.; Filipi, Z. Low-Cost Pathway to Ultra Efficient City Car: Series Hydraulic Hybrid System with Optimized Supervisory Control. SAE Int. J. Engines 2010, 2, 505–520. [Google Scholar] [CrossRef] [Green Version]
- Senger, R.; Merkle, M.; Nelson, D. Validation of ADVISOR as a Simulation Tool for a Series Hybrid Electric Vehicle. In Proceedings of the International Congress and Exposition, Detroit, MI, USA, 23–26 February 1998. [Google Scholar]
- Tremblay, O.; Dessaint, L.A. Experimental Validation of a Battery Dynamic Model for EV Applications. In Proceedings of the International Battery, Hybrid and Fuel Cell Electric Vehicle Symposium, Stavanger, Norway, 13–16 May 2009. [Google Scholar]
- Xiong, R.; Zhang, Y.; He, H.; Zhou, X.; Pecht, M.G. A double-scale, particle-filtering, energy state prediction algorithm for lithium-ion batteries. IEEE Trans. Ind. Electron. 2017, 65, 1526–1538. [Google Scholar] [CrossRef]
- Serrao, L.; Onori, S.; Sciarretta, A.; Guezennec, Y.; Rizzoni, G. Optimal energy management of hybrid electric vehicles including battery aging. In Proceedings of the 2011 American Control Conference, San Francisco, CA, USA, 29 June–1 July 2011. [Google Scholar]
- Spagnol, P.; Onori, S.; Madella, N.; Guezennec, Y.; Neal, J. Aging and Characterization of Li-Ion Batteries in a HEV Application for Lifetime Estimation. IFAC Proc. Vol. 2010, 43, 186–191. [Google Scholar] [CrossRef]
- Yang, Y.; Luo, C.; Li, P. Regenerative Braking Control Strategy of Electric-Hydraulic Hybrid (EHH) Vehicle. Energies 2017, 10, 1038. [Google Scholar] [CrossRef]
- Alson, J.; Barba, D.; Bryson, J.; Doorlag, M.; Haugen, D.; Kargul, J. Progress Report on Clean and Efficient Automotive Technologies under Development at EPA; EPA420-R-04-002; United States Environmental Protection Agency: Washington, DC, USA, 2004.
- Mou, L.; Yin, G.; Yang, S. A dynamic simulation model to simulate shifting transients of off-highway vehicles. China Mech. Eng. 2005, 16, 60–63. [Google Scholar]
- Tie, S.F.; Tan, C.W. A review of energy sources and energy management system in electric vehicles. Renew. Sustain. Energy Rev. 2013, 20, 82–102. [Google Scholar] [CrossRef]
Figure 1.
Structural diagram of the hydraulic/electric synergy powertrain.
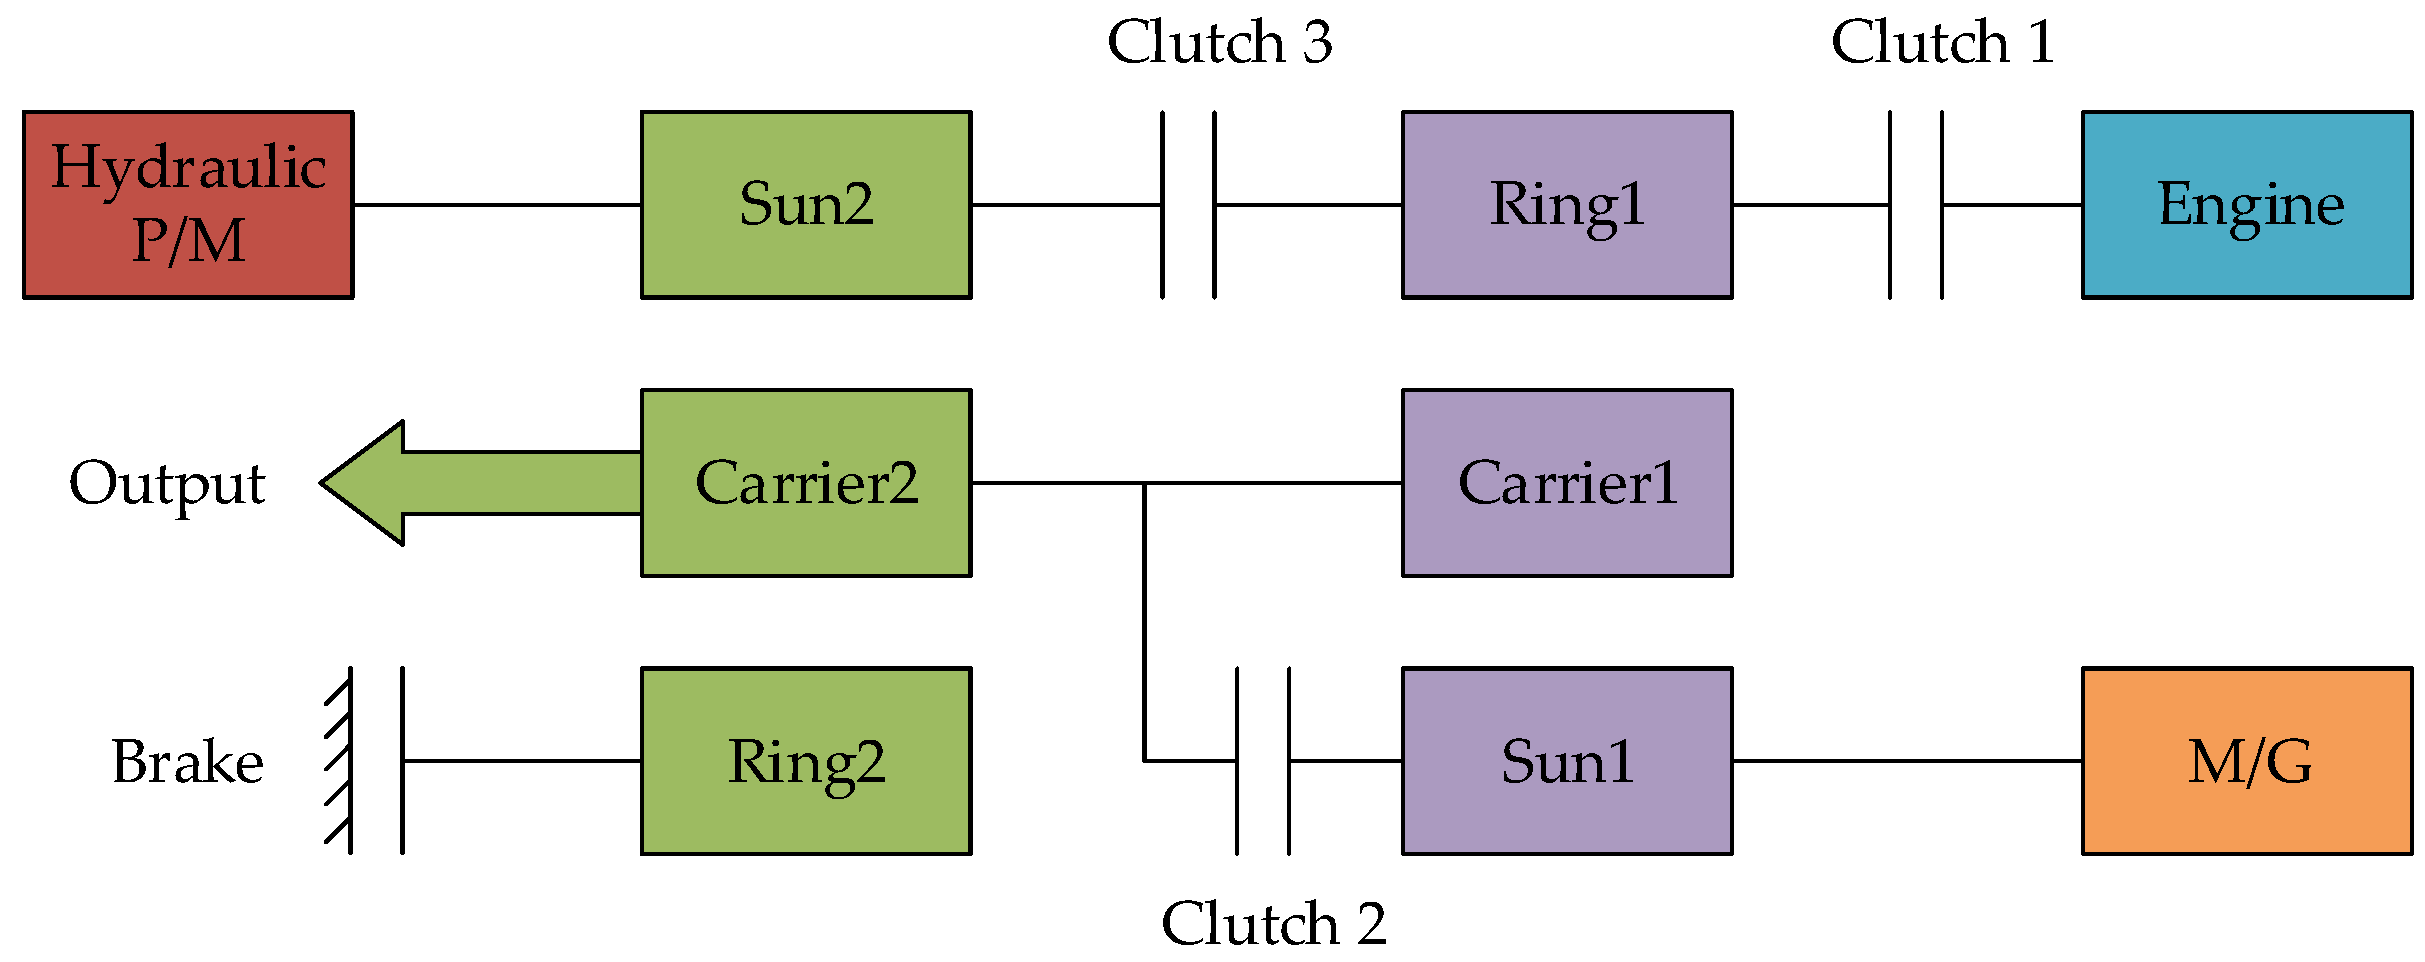
Figure 2.
The specific structure of a hydraulic/electric synergy vehicle.
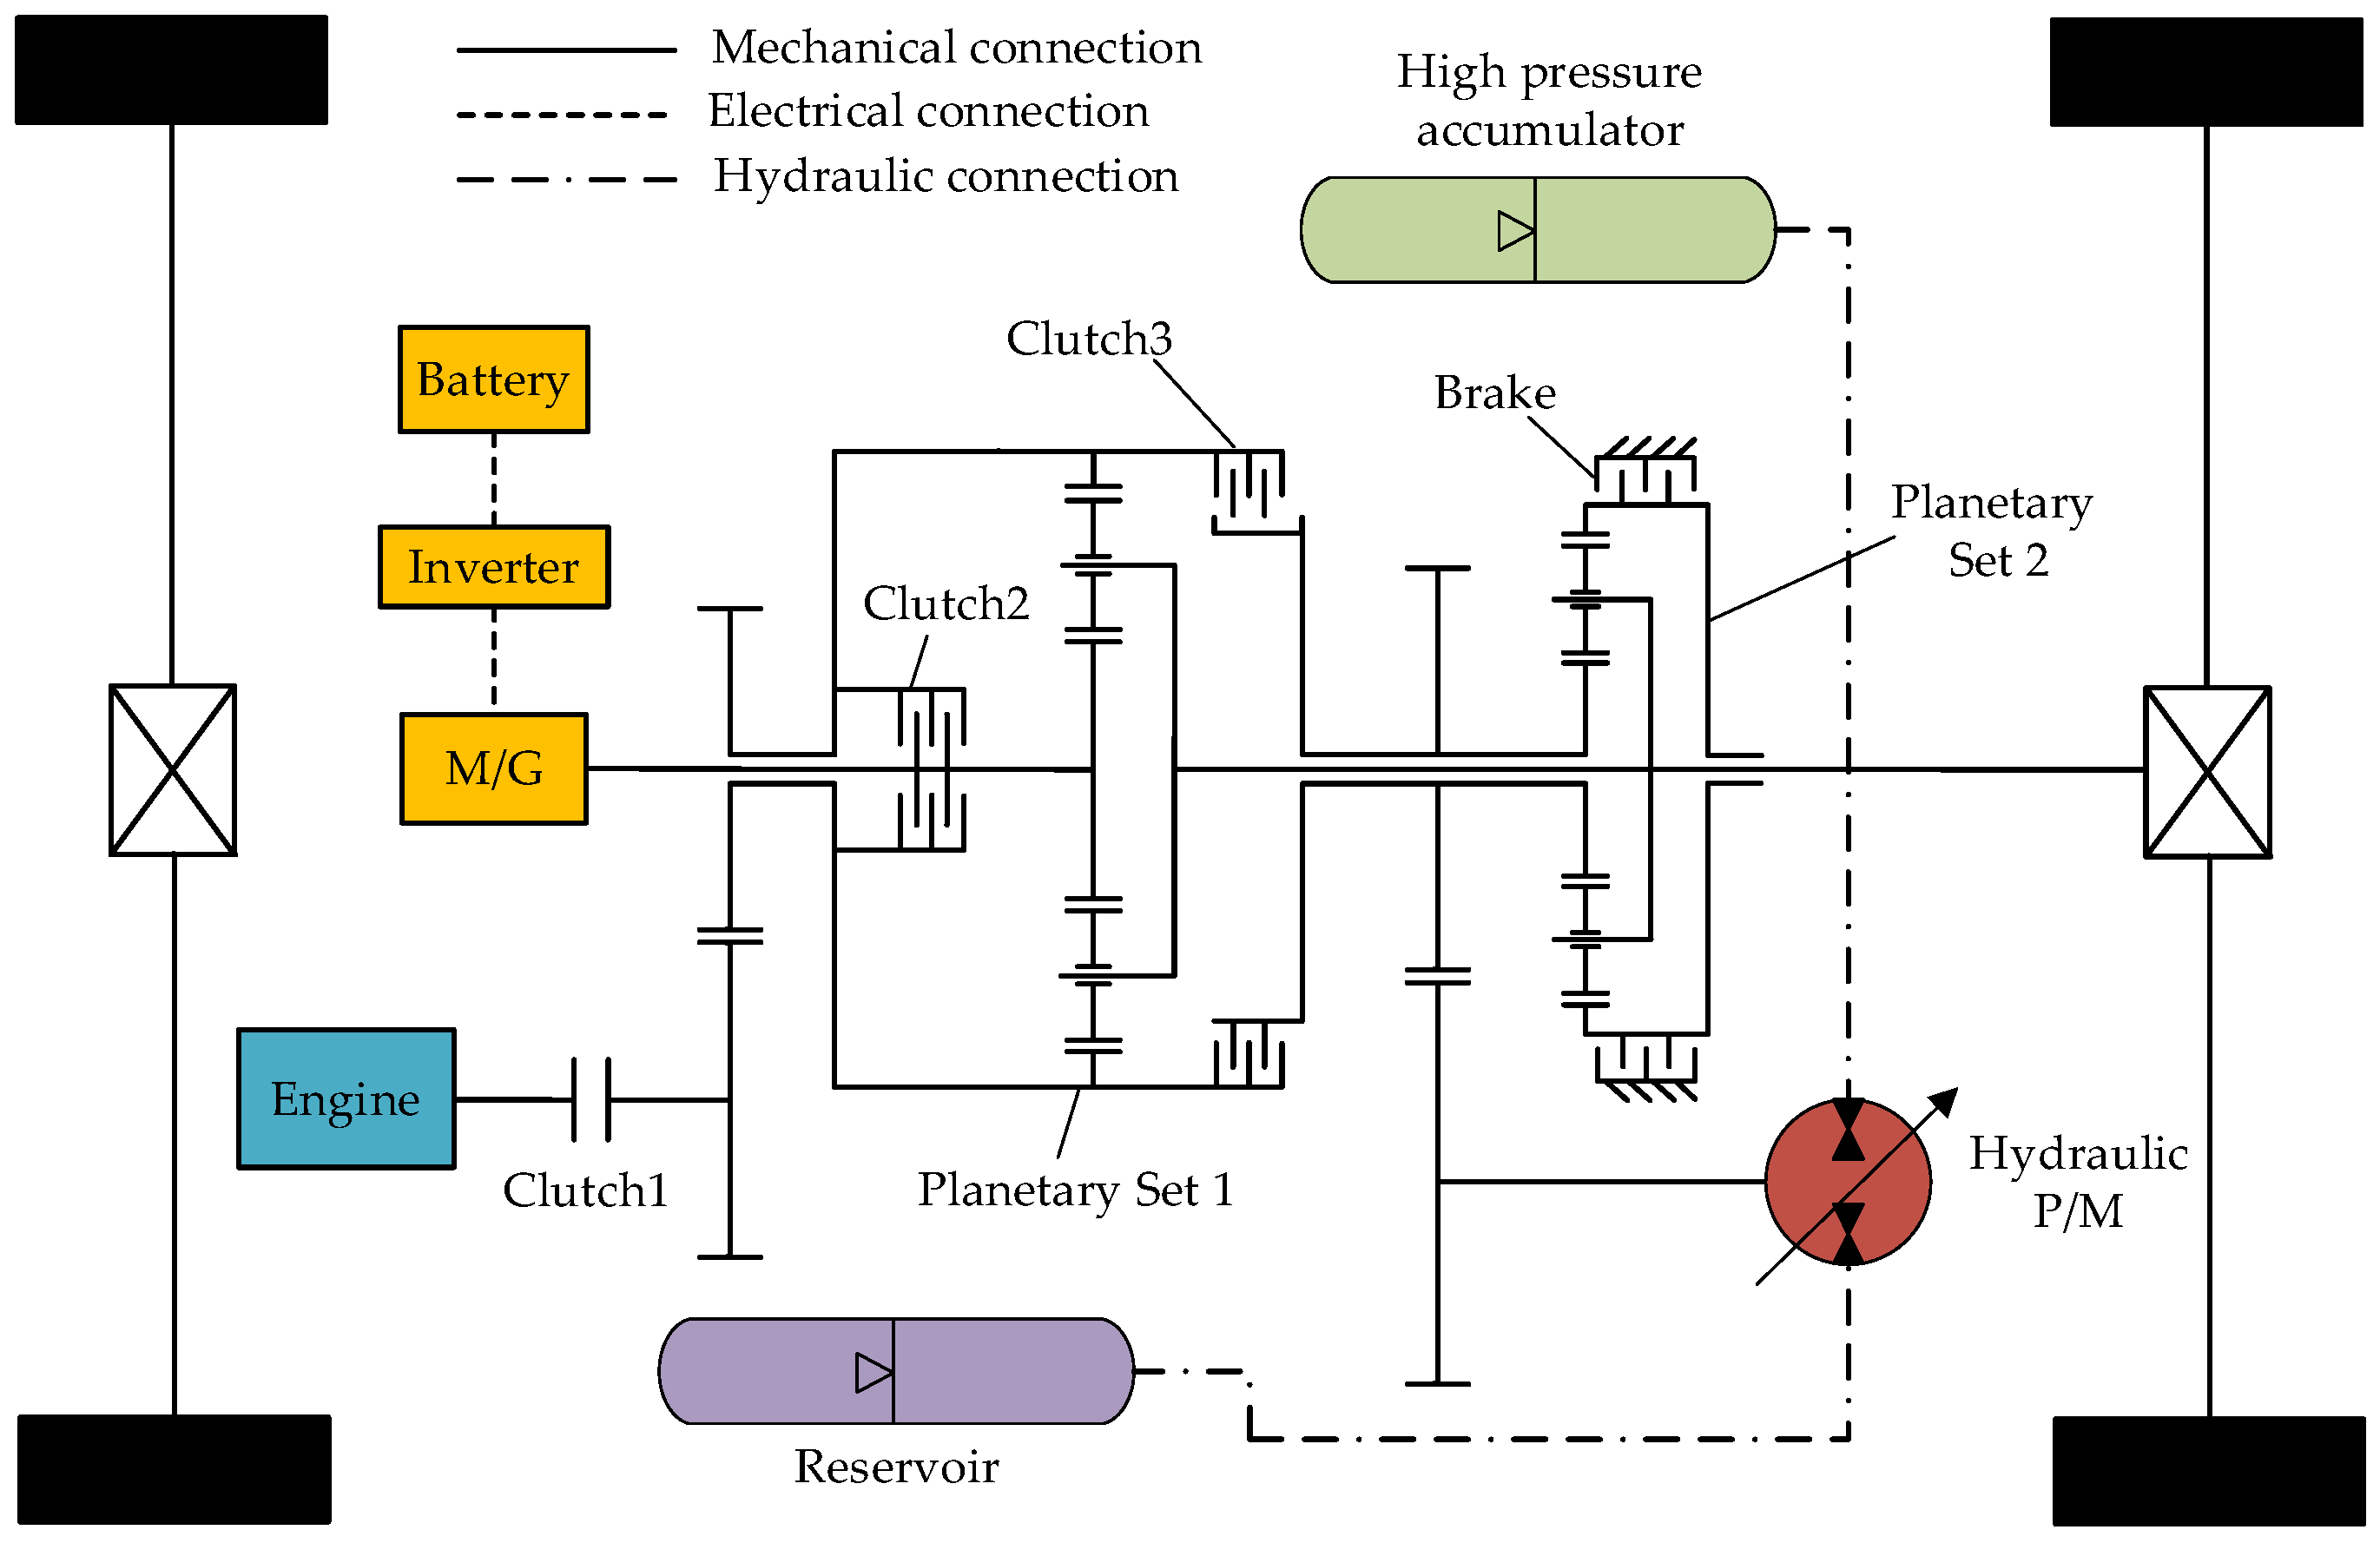
Figure 3.
Power flow of the hydraulic/electric synergy vehicle (HESV) under common conditions: (a) start-up conditions; (b) urban conditions; (c) high-speed conditions; (d) braking conditions and (e) parking conditions.
Figure 3.
Power flow of the hydraulic/electric synergy vehicle (HESV) under common conditions: (a) start-up conditions; (b) urban conditions; (c) high-speed conditions; (d) braking conditions and (e) parking conditions.
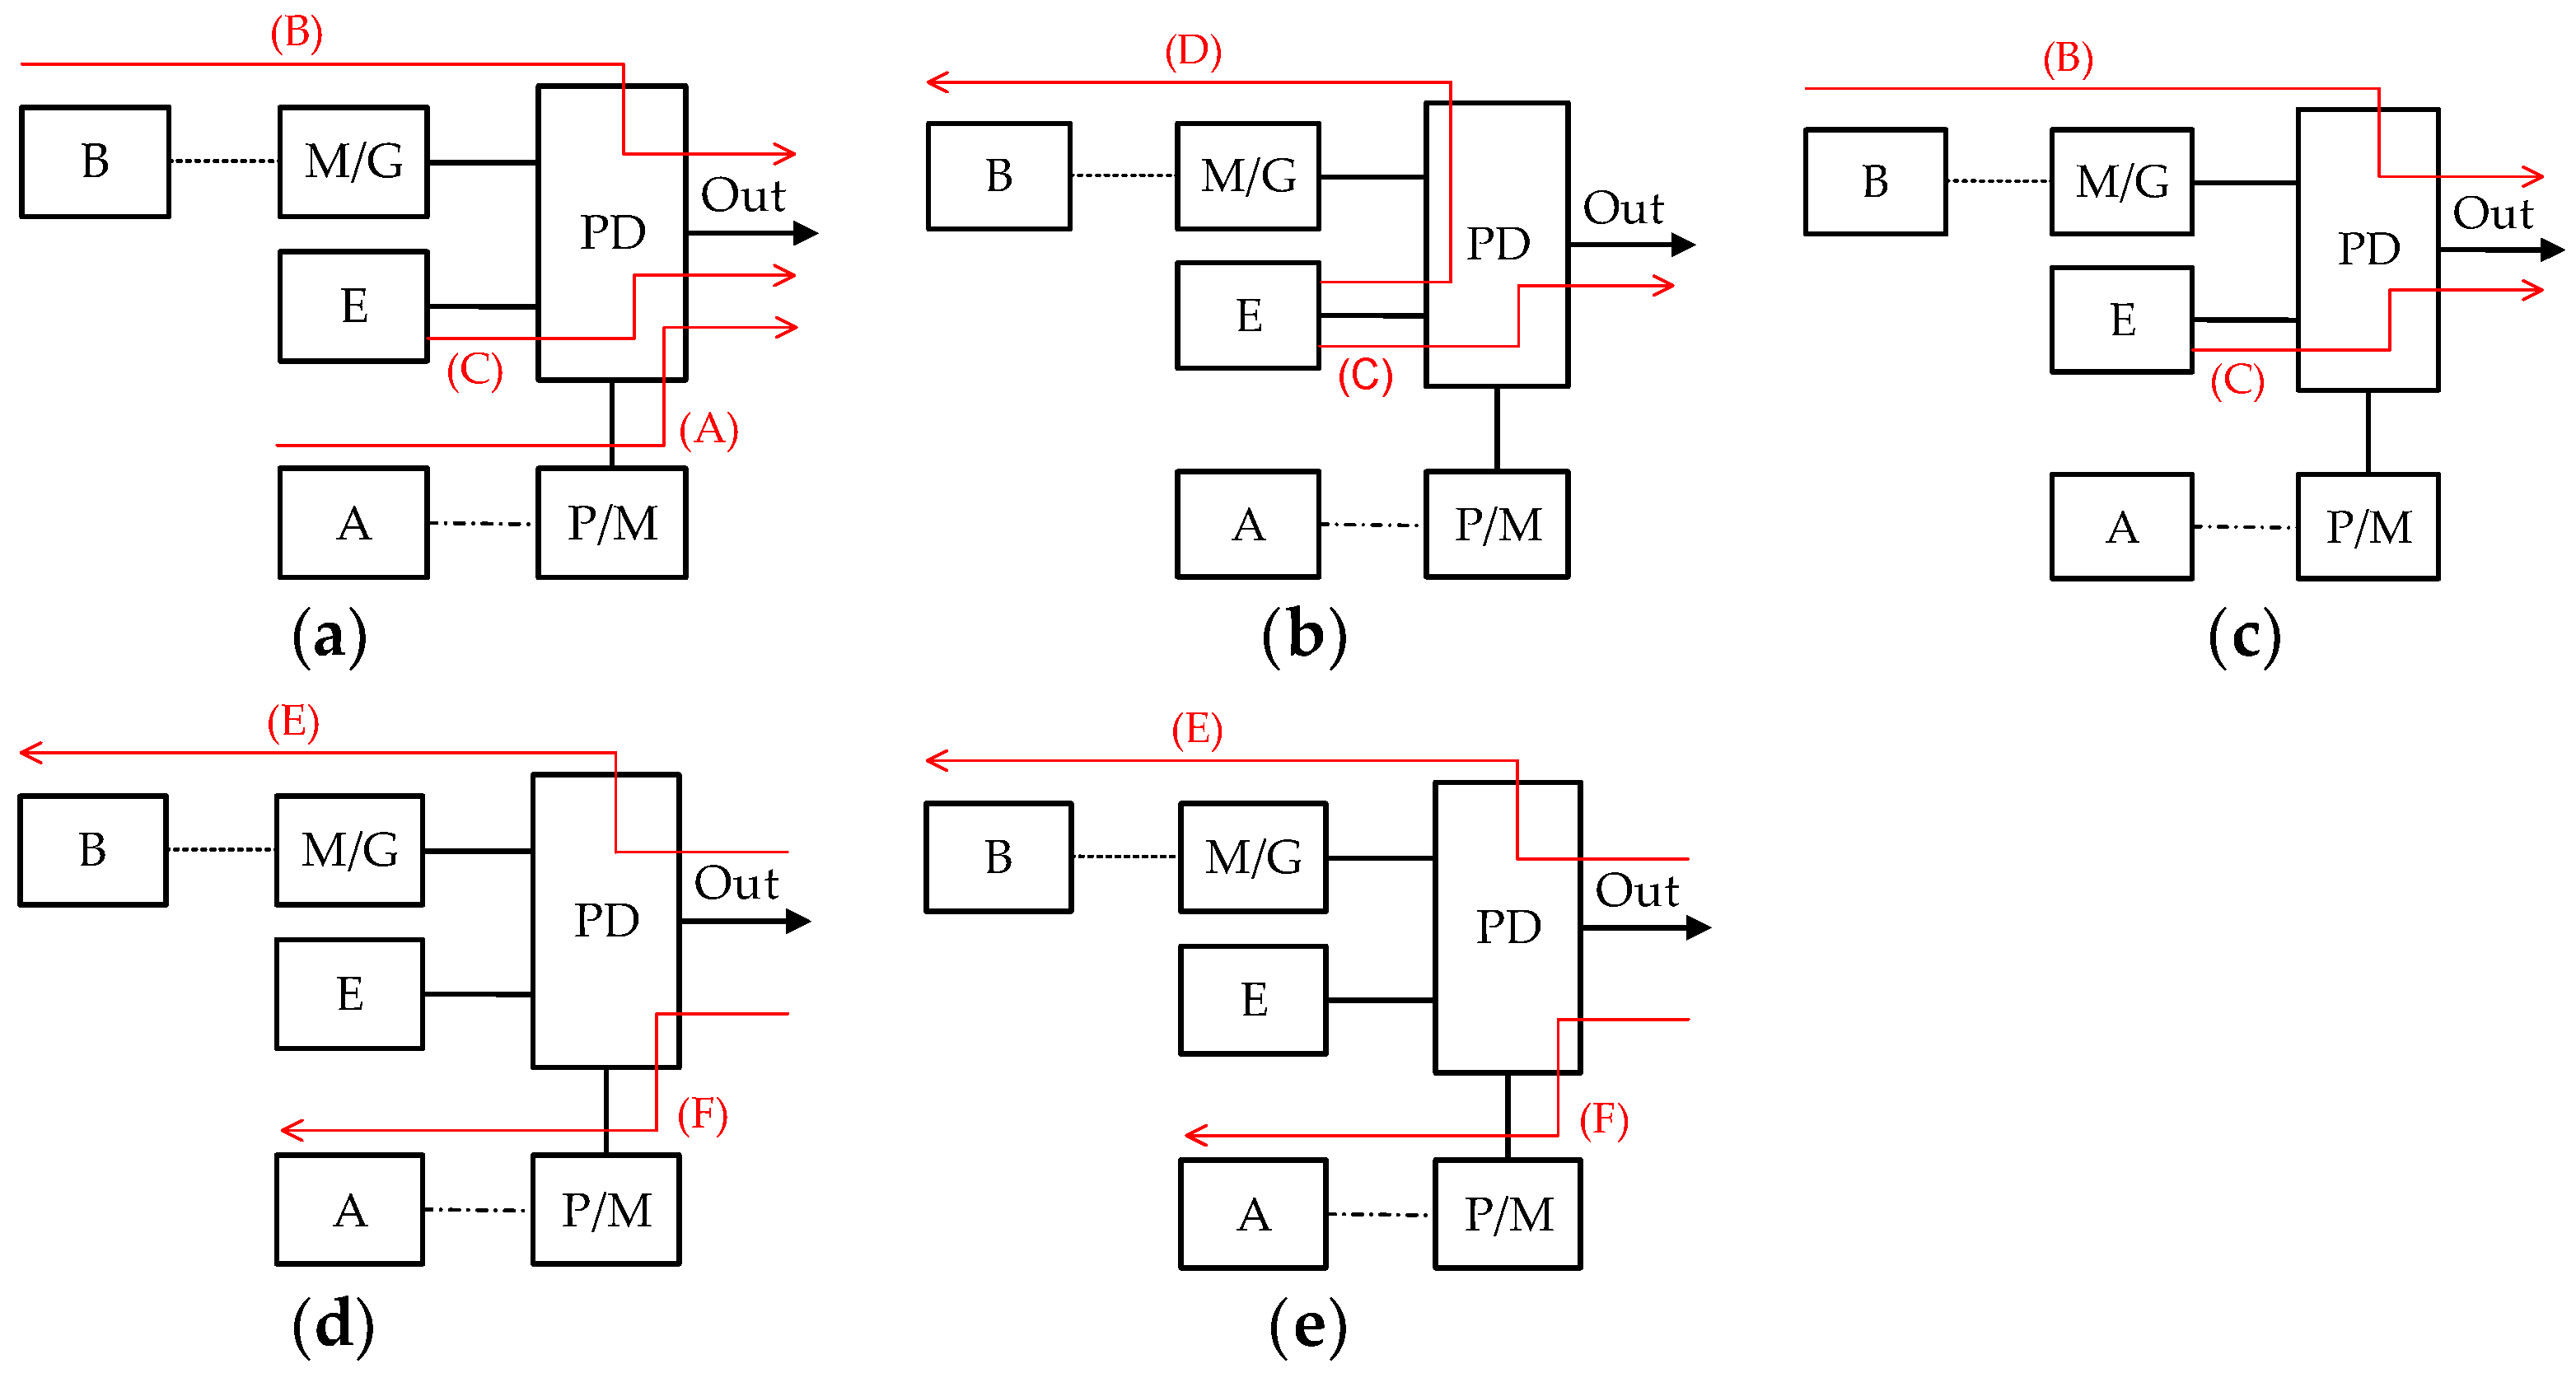
Figure 4.
Structural diagram of hydraulic hybrid vehicle.

Figure 5.
Brake specific fuel consumption (BSFC) contour diagram for a 199 kW diesel engine.

Figure 6.
Efficiency contour diagram for a 111 kW M/G.
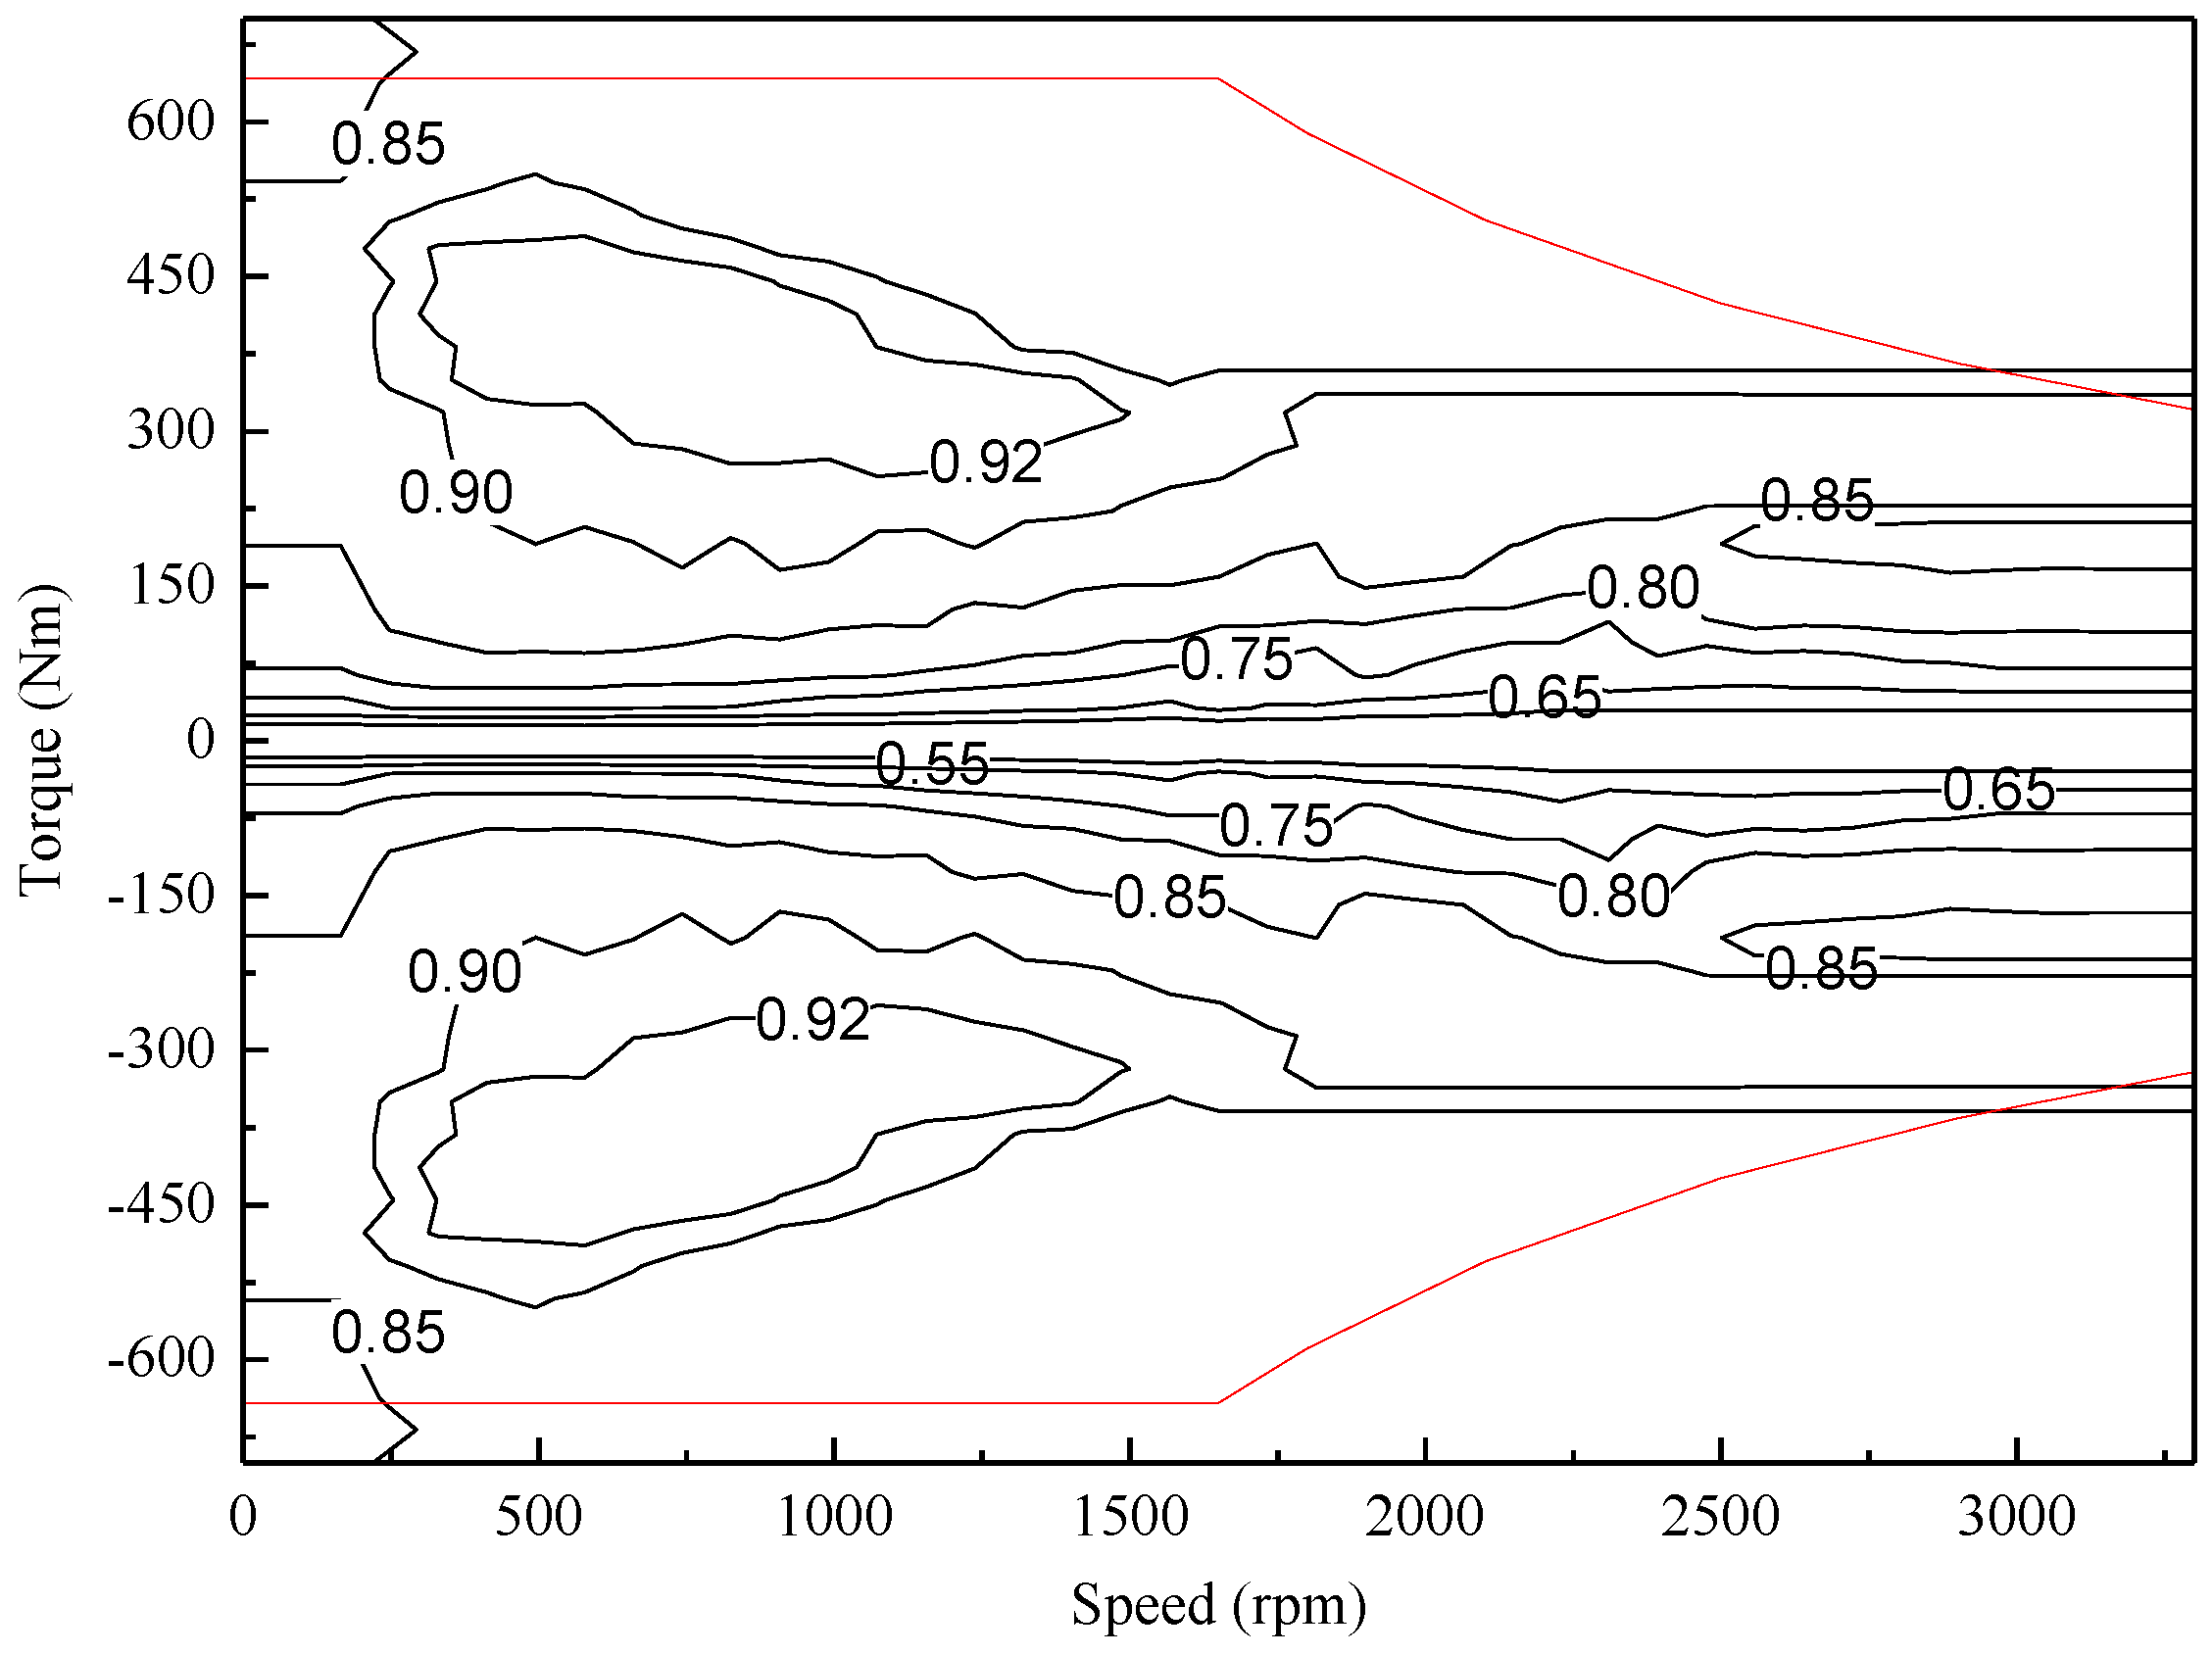
Figure 7.
Efficiency contour diagrams for a 222-kW hydraulic P/M at different pressures.
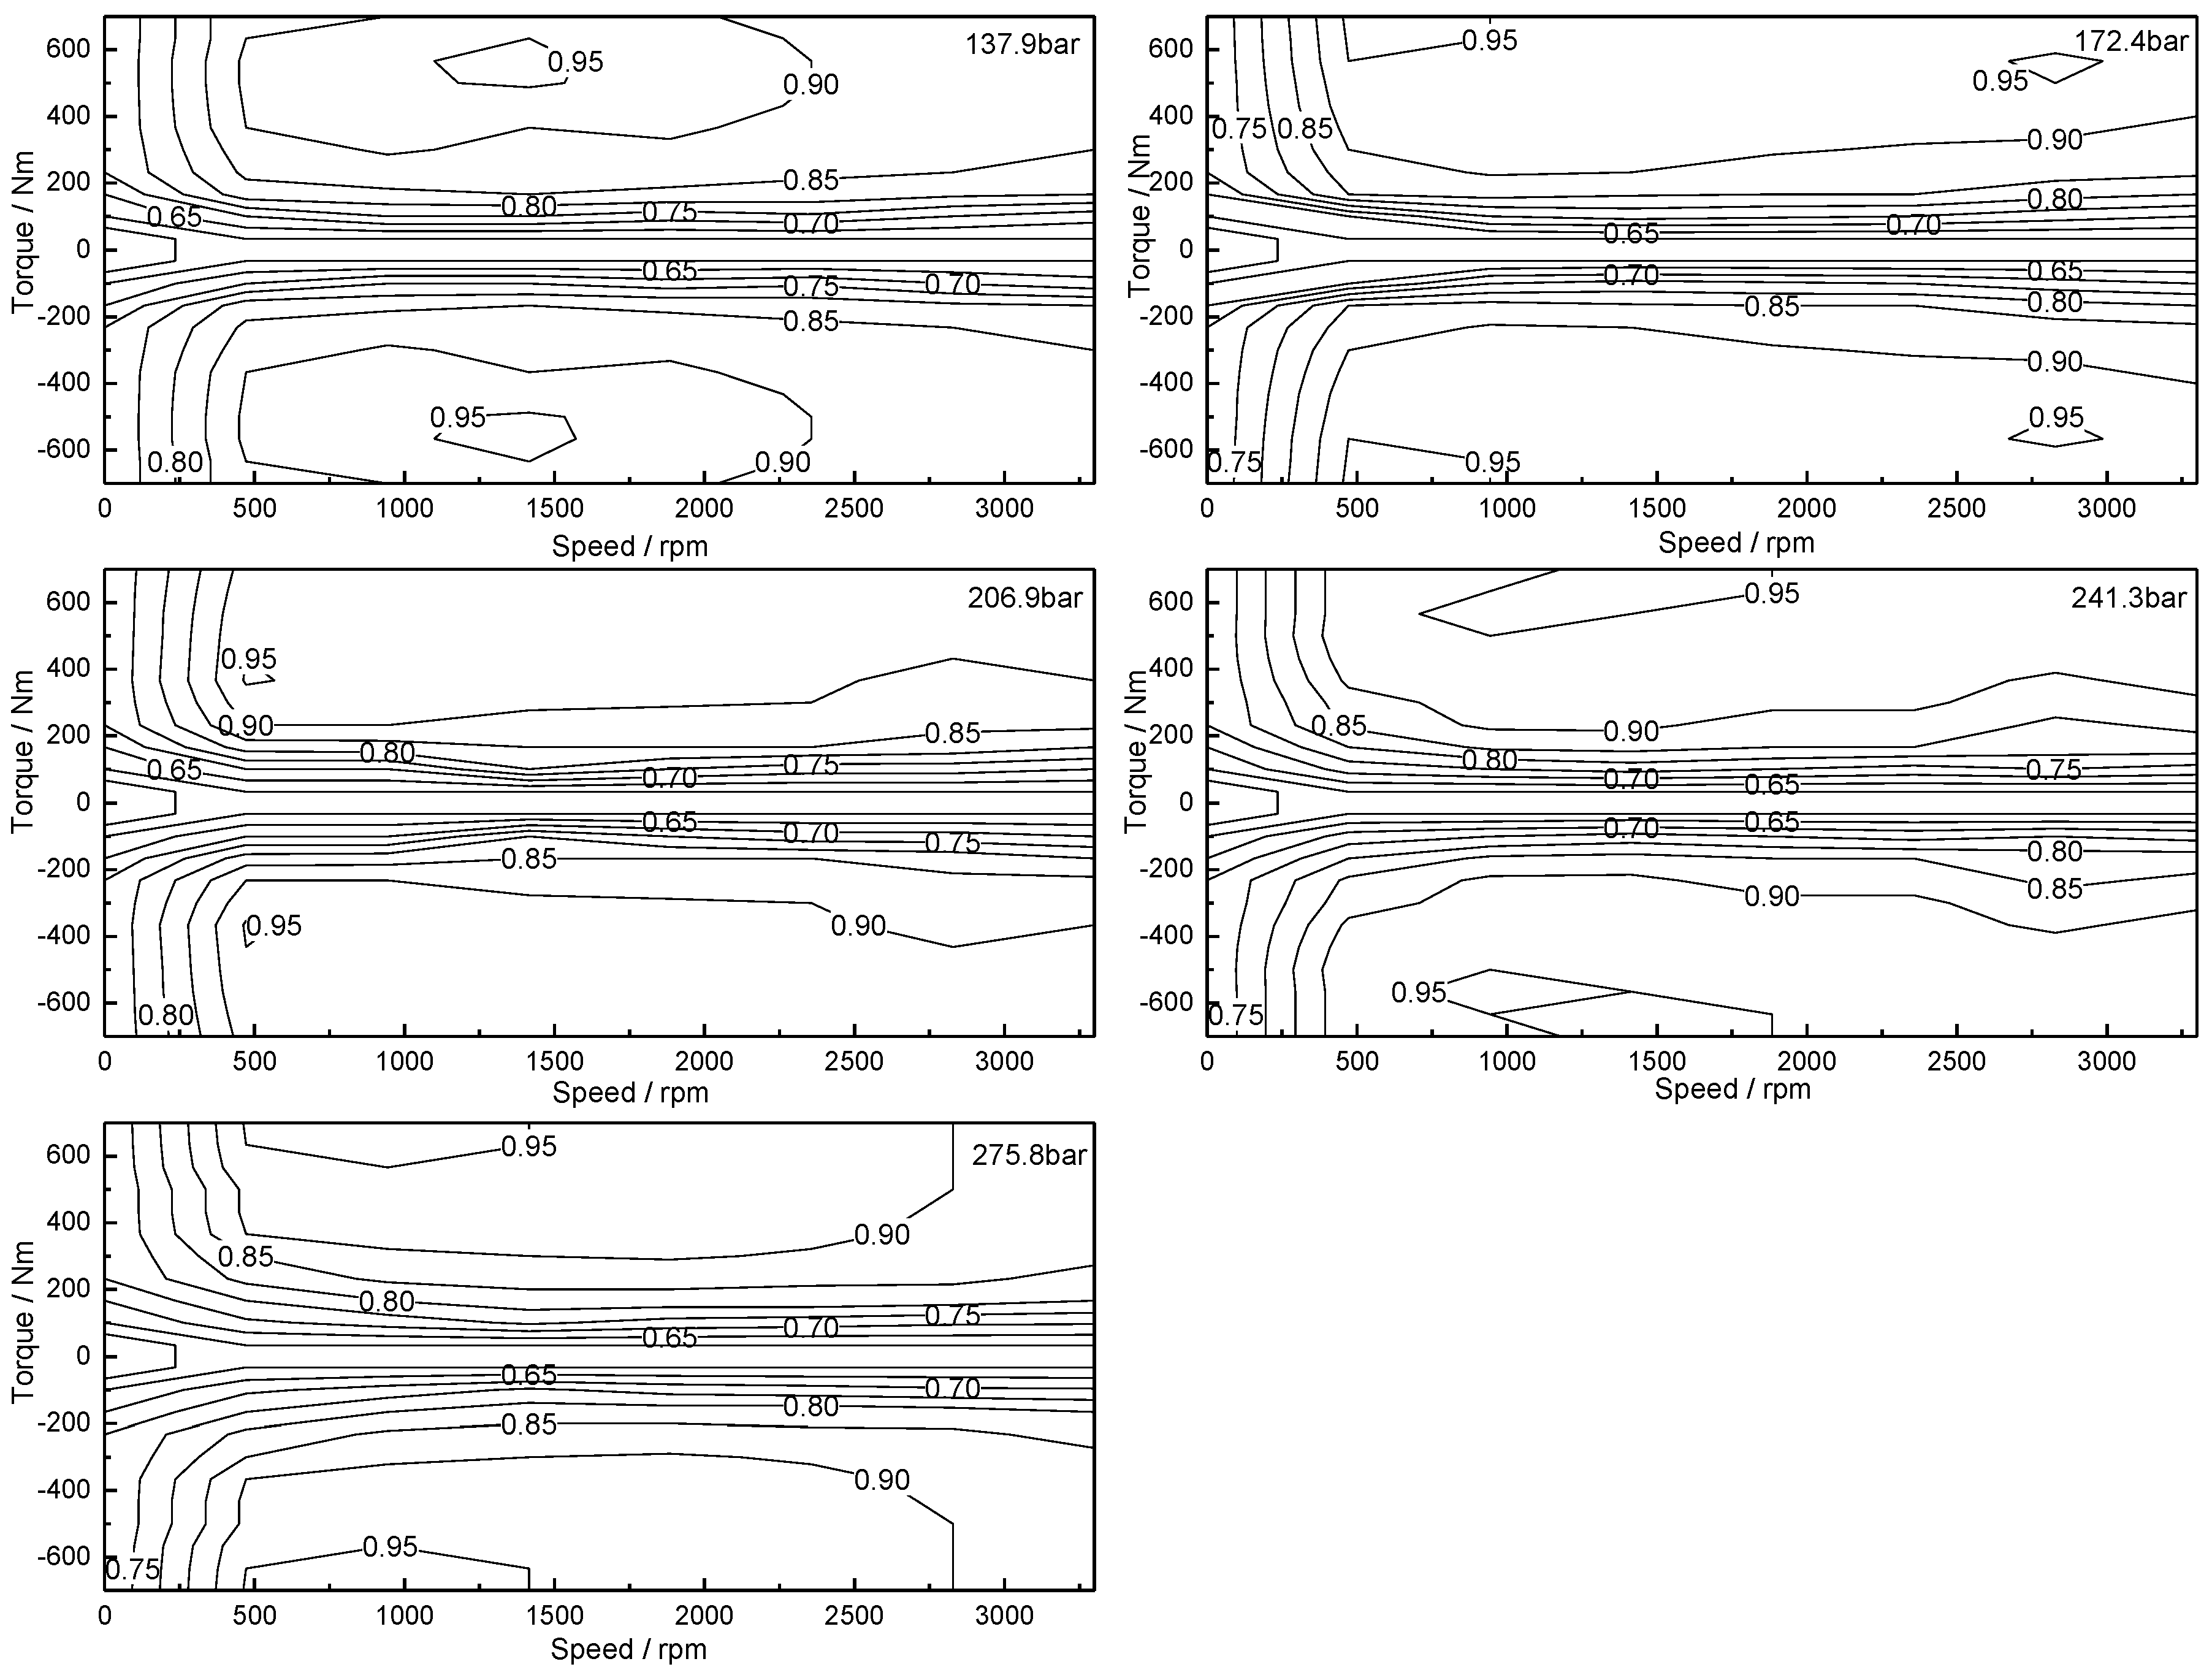
Figure 8.
Control flow chart of the HESV.
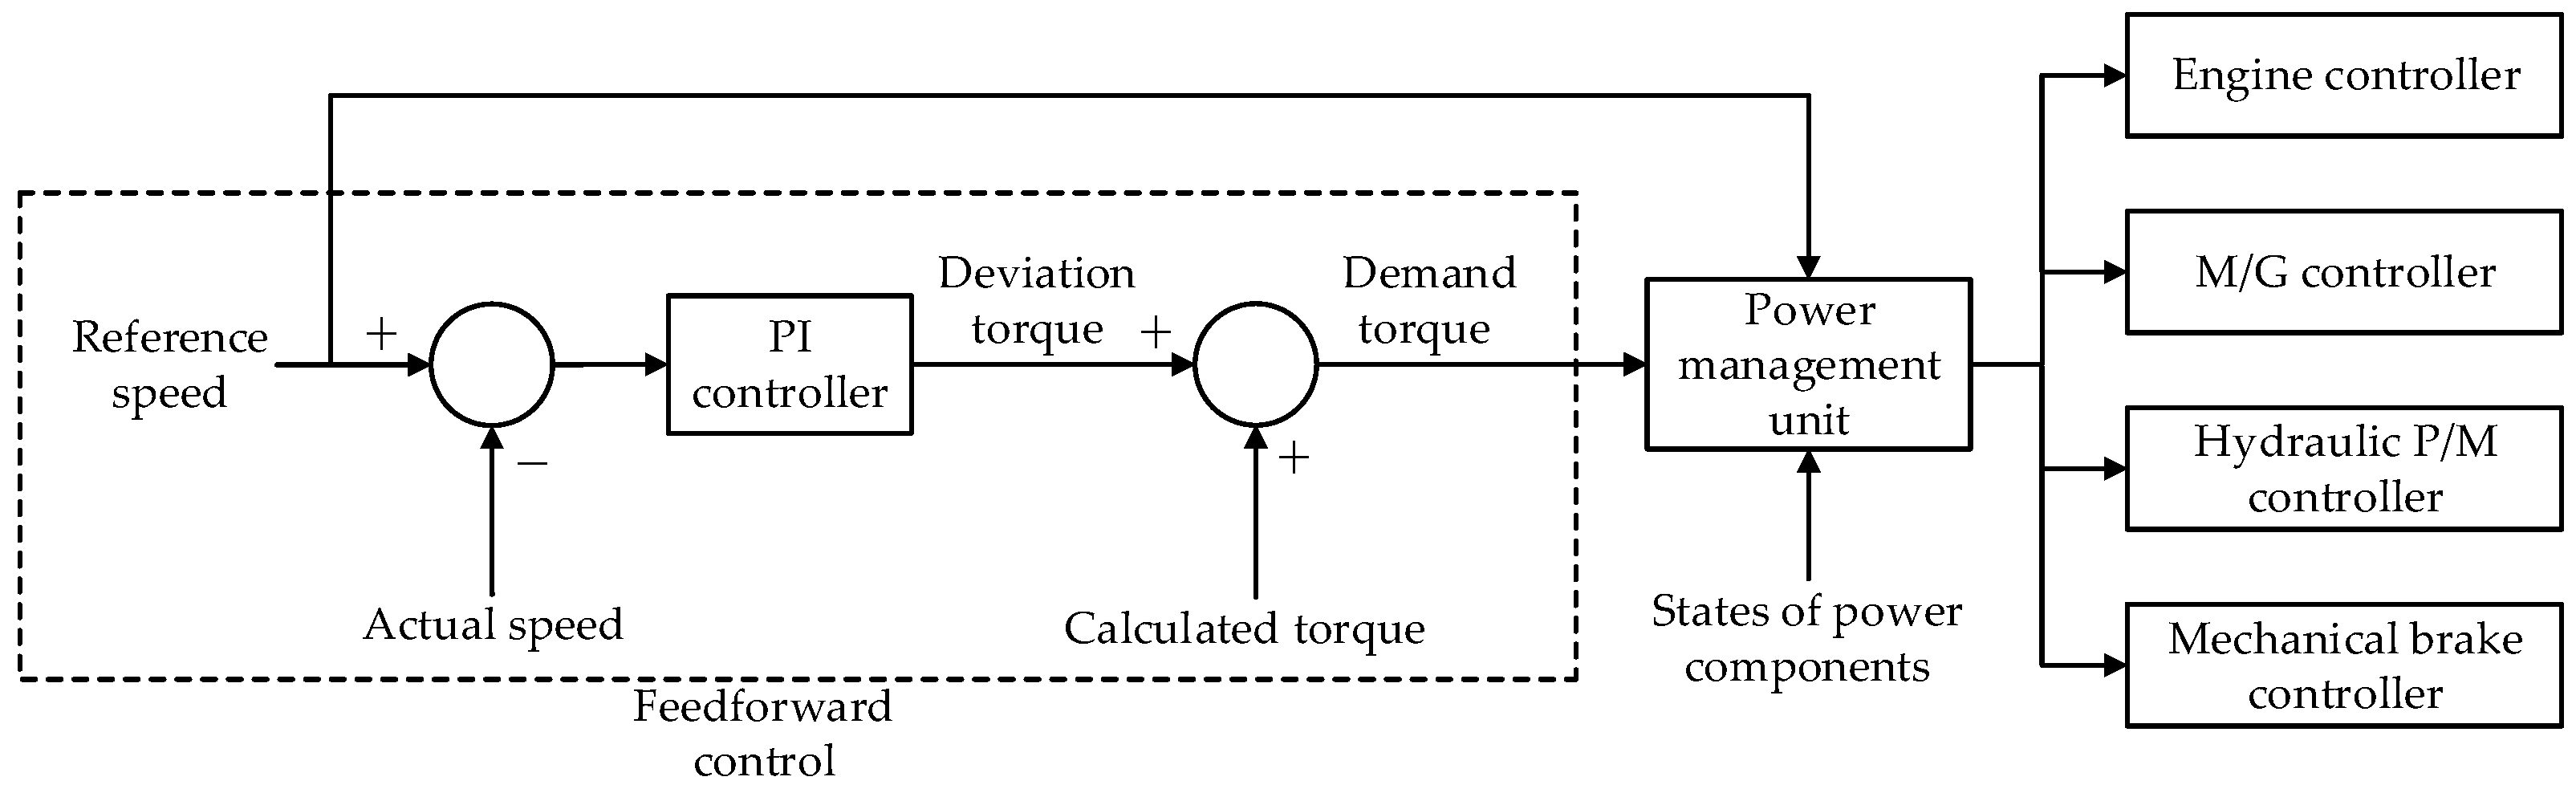
Figure 9.
Power management strategy of the HHV.

Figure 10.
Power management strategy of the HEV.
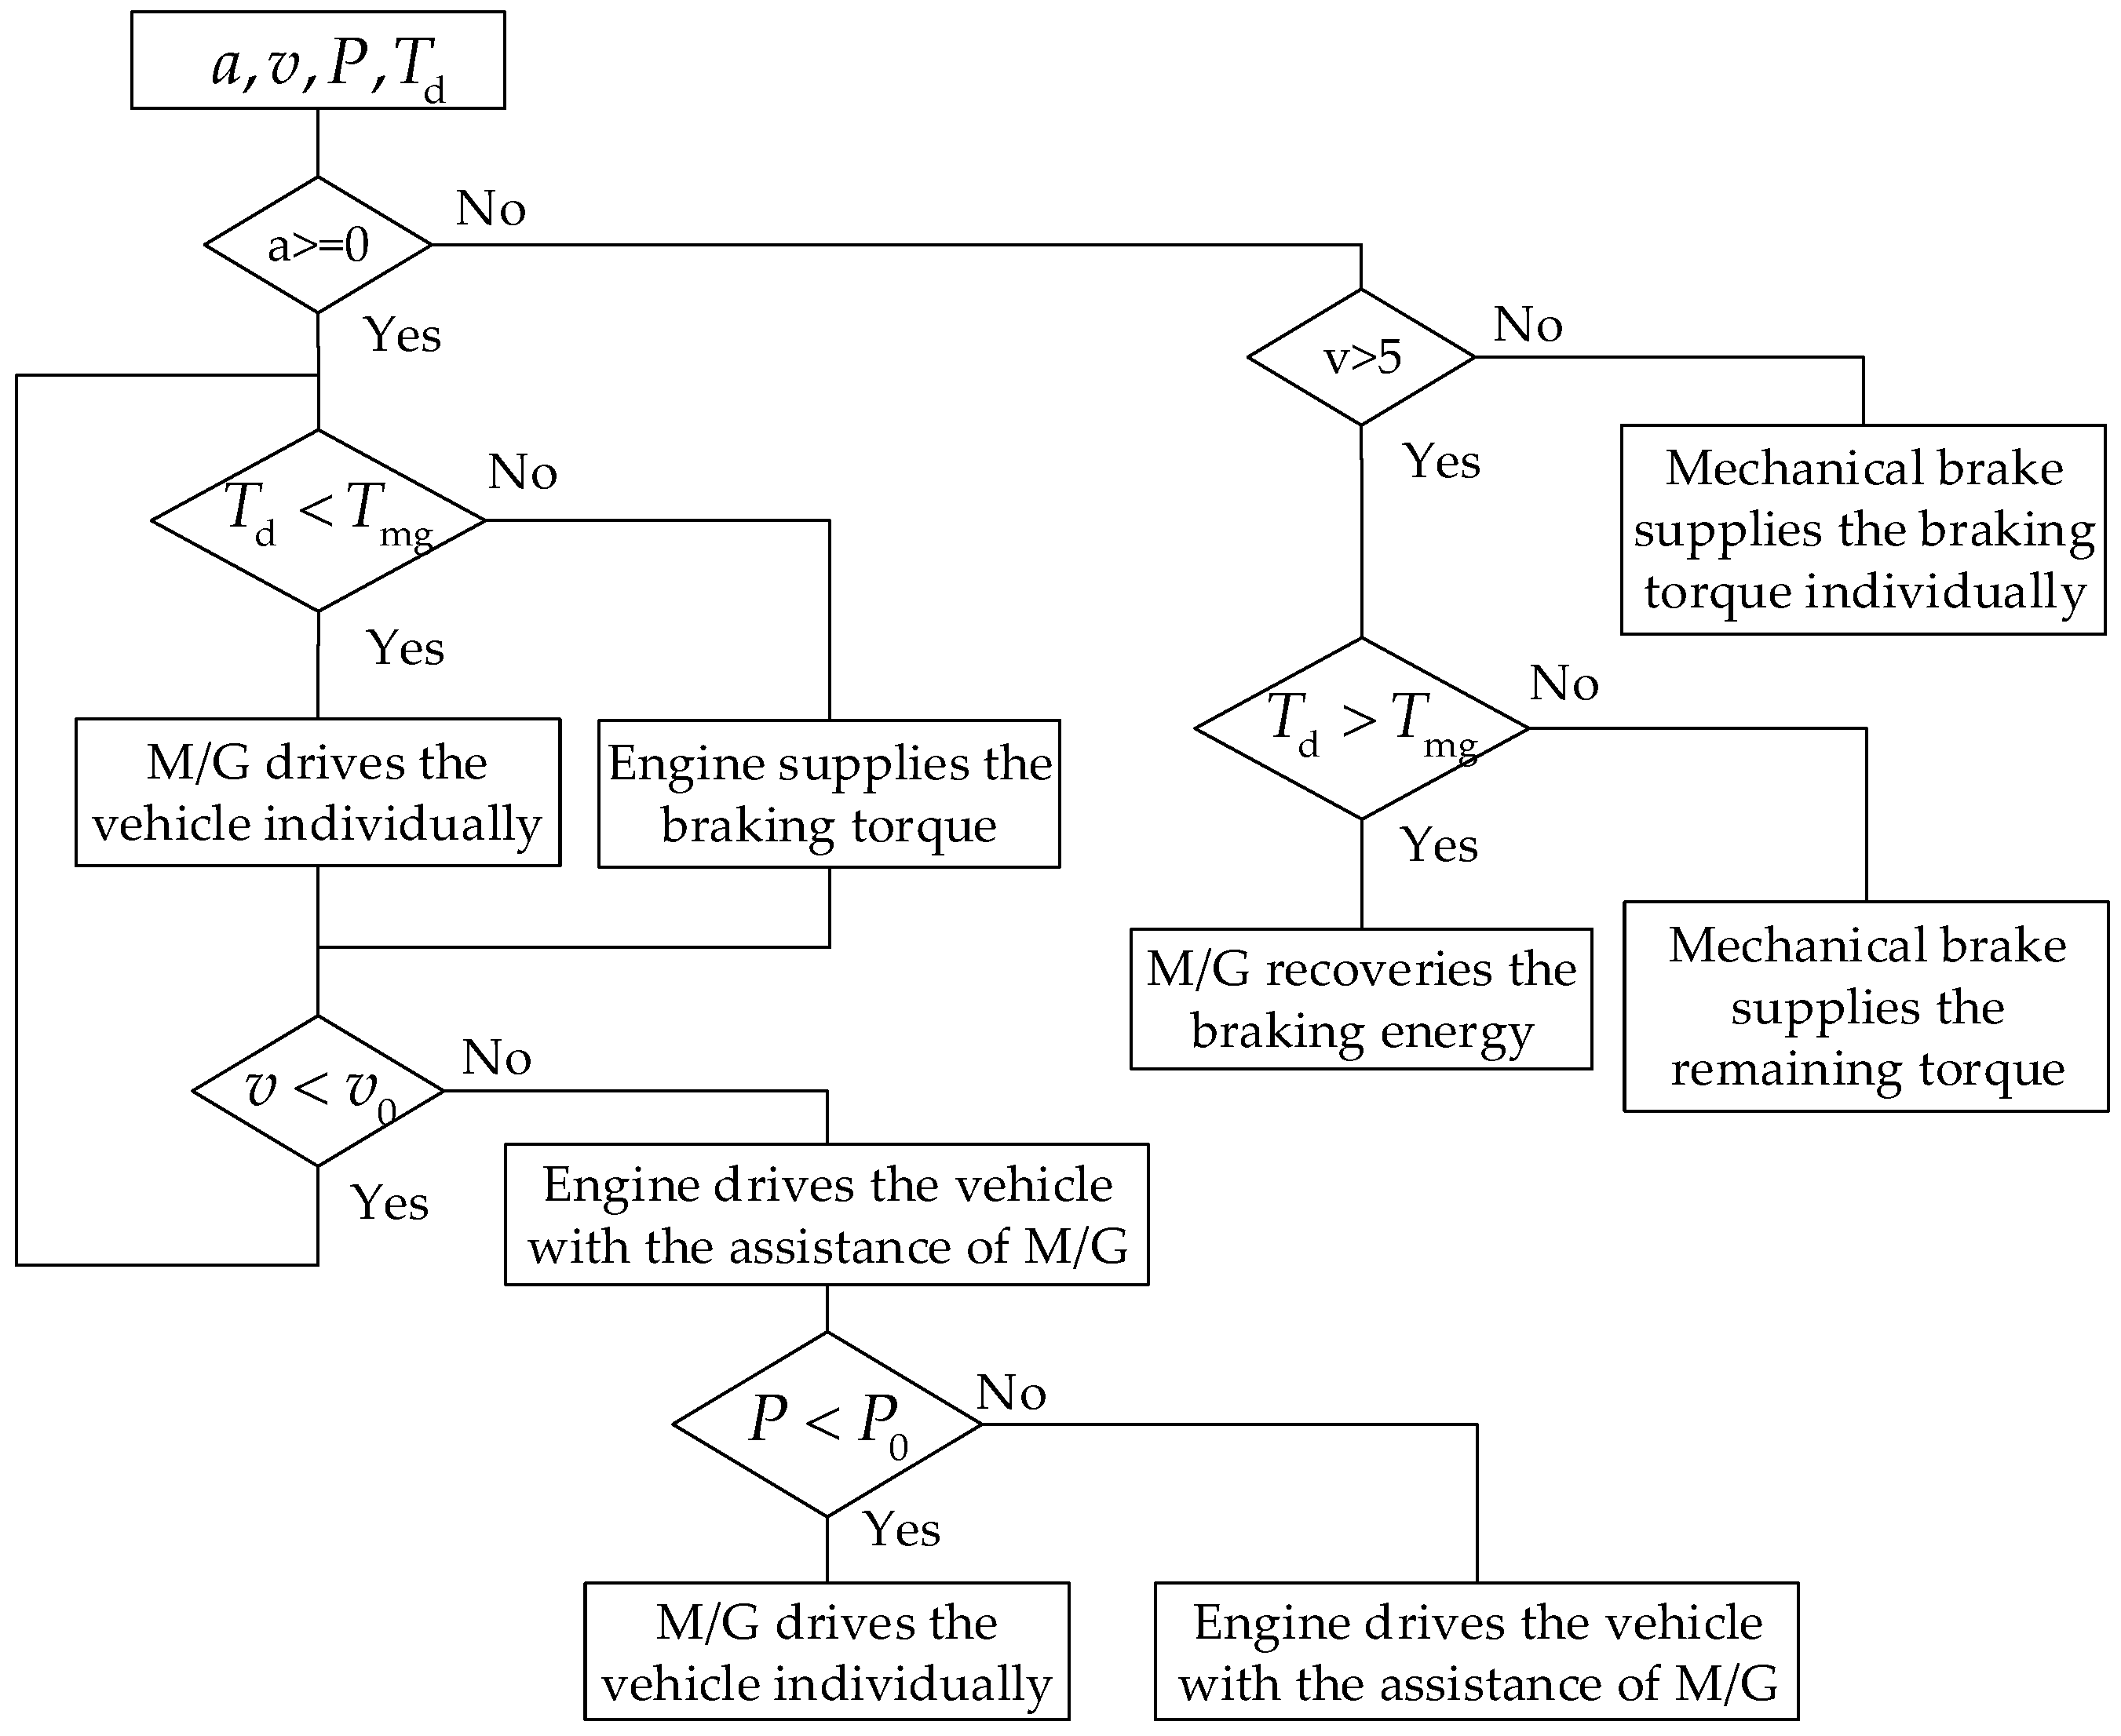
Figure 11.
Power management strategy of the HESV.

Figure 12.
Time histories of battery state of charge (SOC) along the cycle for (a) HEV and (b) HESV.
Figure 12.
Time histories of battery state of charge (SOC) along the cycle for (a) HEV and (b) HESV.
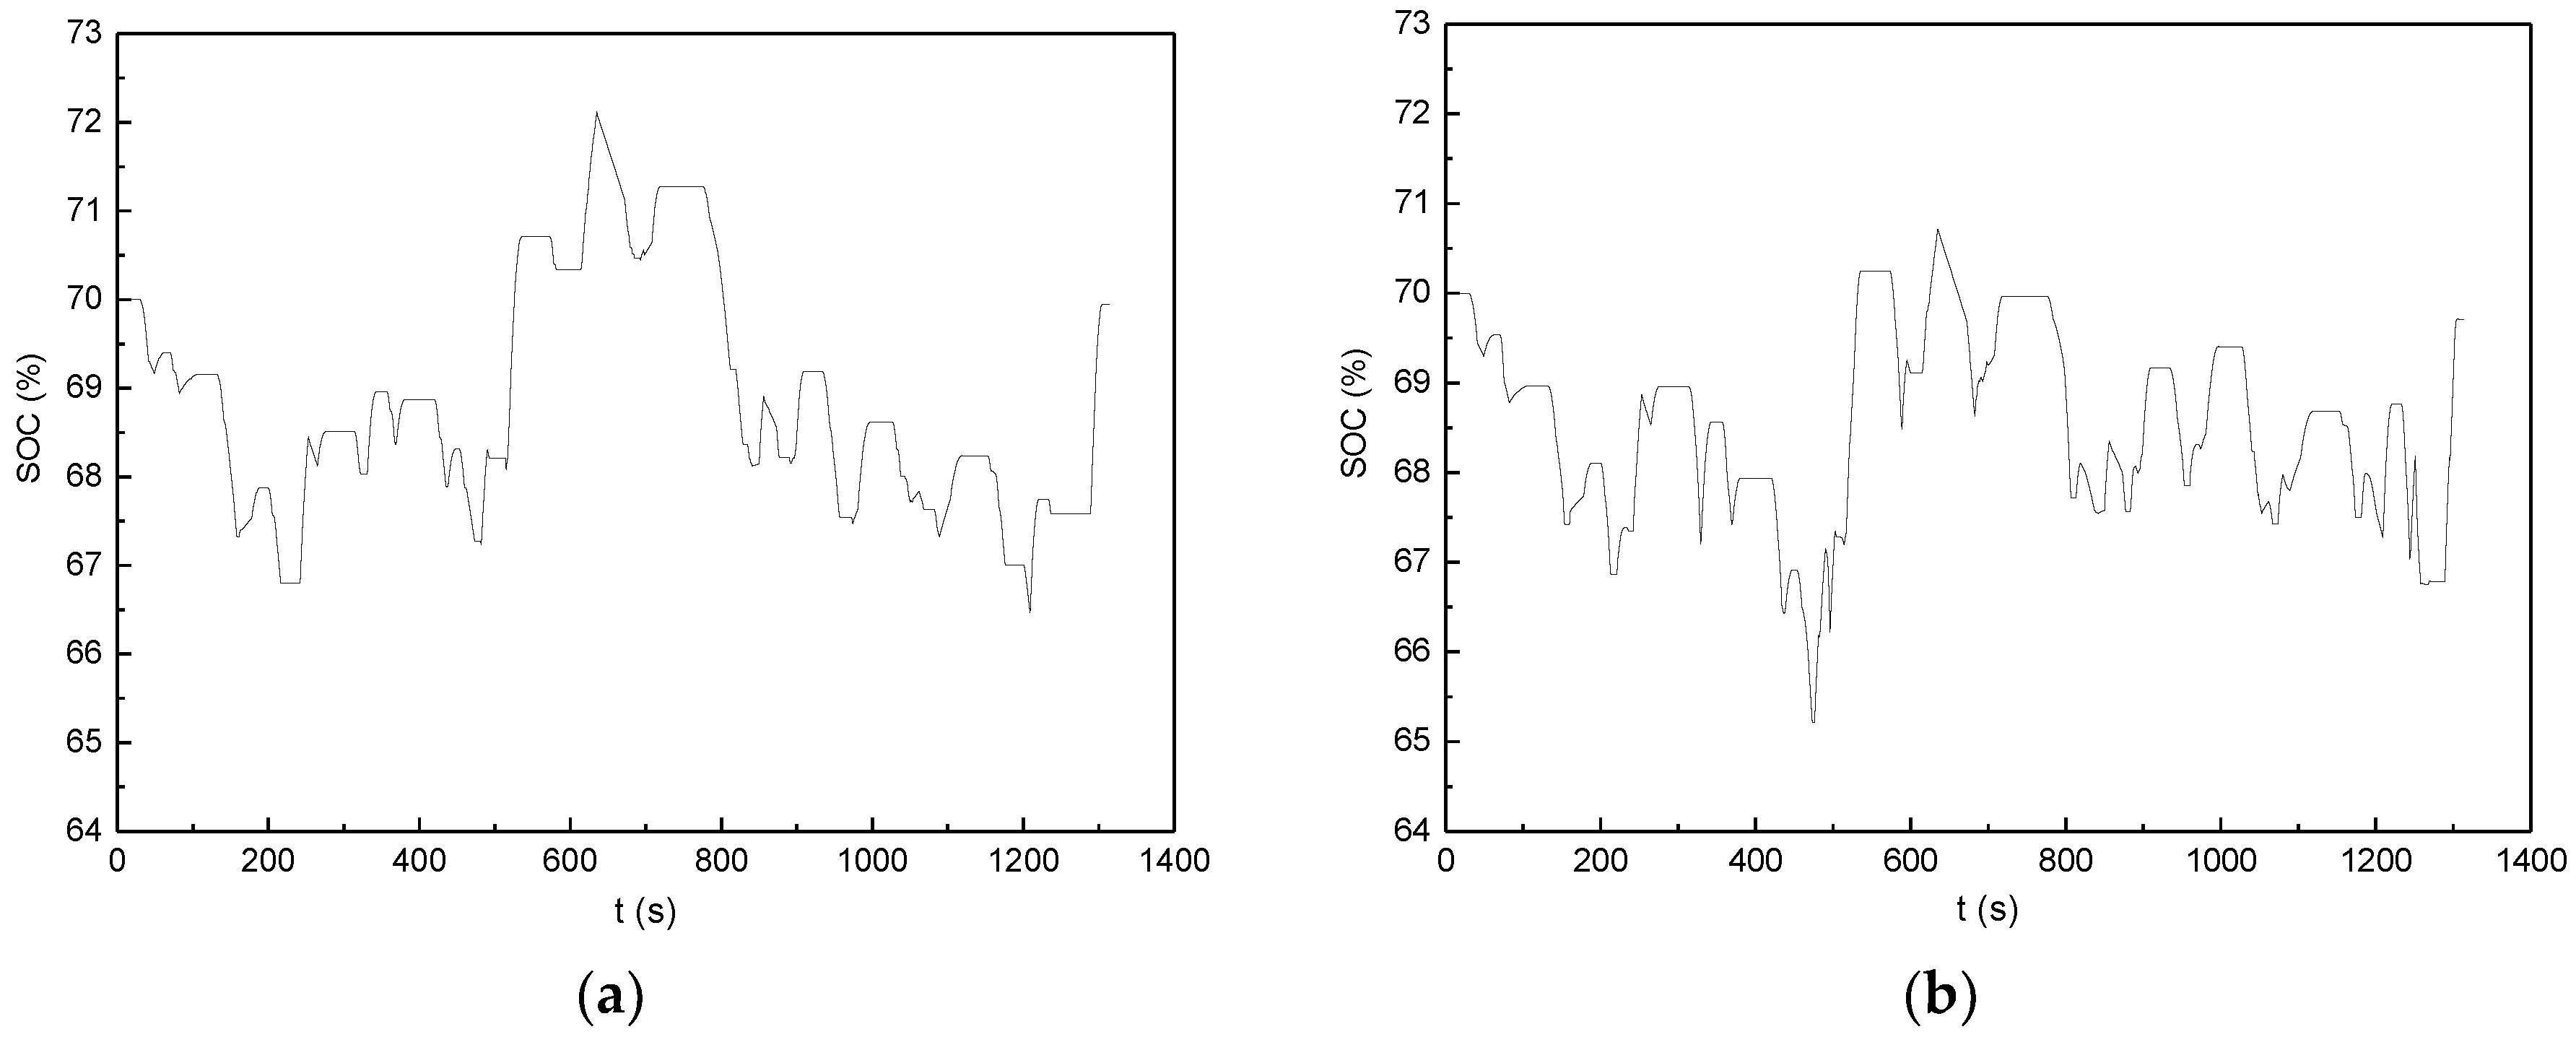
Figure 13.
Engine working points of the (a) TV, (b) HHV, (c) HEV, and (d) HESV.

Figure 14.
Distribution of engine working points.

Figure 15.
Illustration of the total operating cost of three hybrid vehicles.

Table 1.
Working pattern division. M/G: motor/generator; P/M: pump/motor.
| Working Modes | Engine | M/G | Hydraulic P/M | Clutch1 | Clutch2 | Clutch3 | Brake |
|---|---|---|---|---|---|---|---|
| Parallel Mode 1 | Off | On | On | D | D | E | E |
| On | On | On | E | D | E | E | |
| Parallel Mode 2 | On | On | Off | E | E | D | E |
| Power-split Mode | On | On | Off | E | D | D | E |
| Regeneration 1 | Off | On | On | E | E | D | E |
| Regeneration 2 | Off | On | On | D | D | E | E |
| Parking | On | Off | On | E | D | E | D |
| On | On | Off | E | D | D | D |
Note: D—Disengage, E—Engage.
Table 2.
Key parameters of the target vehicle (TV).
| Parameters | Value |
|---|---|
| Gross weight (kg) | 15,500 |
| Wheel radius (m) | 0.51 |
| Gear ratios | 6.765, 3.794, 2.26, 1.424, 1, 0.879 |
| Final drive ratio | 7.46 |
| Engine (kW/rpm) | 199/3300 |
Table 3.
Comparison of the dynamic performance of four vehicles. HHV: hydraulic hybrid vehicle; HEV: hybrid electric vehicle; HESV: hydraulic/electric synergy vehicle.
Table 3.
Comparison of the dynamic performance of four vehicles. HHV: hydraulic hybrid vehicle; HEV: hybrid electric vehicle; HESV: hydraulic/electric synergy vehicle.
| Dynamic Performance Index | TV | HHV | HEV | HESV |
|---|---|---|---|---|
| 0–40 km/h acceleration time (s) | 8.03 | 4.78 | 5.87 | 5.69 |
| Maximum climbing degree at 15 km/h (%) | 24.48 | 31.13 | 24.22 | 25.71 |
| Maximum speed (km/h) | 96.69 | 96.69 | 96.69 | 96.69 |
Table 4.
Gear-shifting rules of the HHV.
| Gear | GUP (km/h) | GDN (km/h) |
|---|---|---|
| 1↔2 | 9.5 | 8.1 |
| 2↔3 | 17.0 | 13.7 |
| 3↔4 | 28.5 | 21.7 |
| 4↔5 | 45.2 | 30.9 |
| 5↔6 | 64.4 | 35.2 |
Table 5.
Simulation results of the four vehicles under the Chinese urban bus cycle (CUBC).
| Parameters | TV | HHV | HEV | HESV |
|---|---|---|---|---|
| Engine fuel consumption (L/100 km) | 31.8 | 22.7 | 22.0 | 21.7 |
| Equivalent fuel consumption (L/100 km) | — | — | 22.0 | 21.9 |
| Equivalent battery life (cycle) | — | — | 22,591 | 14,269 |
| Fuel economy improvement (%) | — | 28.8 | 30.9 | 31.3 |
© 2017 by the authors. Licensee MDPI, Basel, Switzerland. This article is an open access article distributed under the terms and conditions of the Creative Commons Attribution (CC BY) license (http://creativecommons.org/licenses/by/4.0/).
Share and Cite
MDPI and ACS Style
Zhao, K.; Liang, Z.; Huang, Y.; Wang, H.; Khajepour, A.; Zhen, Y. Research on a Novel Hydraulic/Electric Synergy Bus. Energies 2018, 11, 34. https://doi.org/10.3390/en11010034
AMA Style
Zhao K, Liang Z, Huang Y, Wang H, Khajepour A, Zhen Y. Research on a Novel Hydraulic/Electric Synergy Bus. Energies. 2018; 11(1):34. https://doi.org/10.3390/en11010034
Chicago/Turabian StyleZhao, Kegang, Zhihao Liang, Yanjun Huang, Hong Wang, Amir Khajepour, and Yuke Zhen. 2018. "Research on a Novel Hydraulic/Electric Synergy Bus" Energies 11, no. 1: 34. https://doi.org/10.3390/en11010034
Note that from the first issue of 2016, this journal uses article numbers instead of page numbers. See further details here.