An Evaluation of Investment in a PV Power Generation Project in the Gobi Desert Using a Real Options Model


1
Energy Development and Environmental Protection Strategy Research Center, Jiangsu University, Zhenjiang 212013, China
2
Faculty of Science, Jiangsu University, Zhenjiang 212013, China
3
School of Mathematical Sciences, Nanjing Normal University, Nanjing 210046, China
*
Author to whom correspondence should be addressed.
Energies 2018, 11(1), 257; https://doi.org/10.3390/en11010257
Submission received: 14 November 2017
/
Revised: 16 January 2018
/
Accepted: 18 January 2018
/
Published: 21 January 2018
(This article belongs to the Section F: Electrical Engineering)
Abstract
:This paper presents a policy benefit model of a photovoltaic (PV) power generation project based on real options analysis (ROA) and the two-factor learning curve model. The main purpose is to examine the investment behavior of developing a PV project in the Gobi desert considering multiple uncertain factors. We take the environmental cost of desertification control into account for the first time in the literature. Four other uncertain factors are thermal power cost, PV power generation cost, carbon prices, and government subsidy. A binary tree method is applied to solve the proposed model, and we obtain both unit decision value and optimal investment time. Our baseline scenario illustrates that ROA is more effective than net present value (NPV) analysis when dealing with uncertainty. Our simulation results show that the government could suffer a loss in accordance with the existing subsidy policy when investing in a PV project. Therefore, the subsidy should be gradually reduced. Finally, the influence of the subsidy policy on decision value is discussed, and an appropriate subsidy is determined accordingly.
1. Introduction
Due to the shortage of energy, global warming, and environmental deterioration, the world has focused attention on sources of renewable energy (RE), among which solar energy is widely favored for its unique advantages. Solar energy is an inexhaustible, safe, and alternative clean energy that causes zero emissions of SO2, NOx, toxic gas, smoke dust, and carbon. Developing solar energy could enlarge the energy sources in the energy industry, lighten the limitations of the fossil fuel supply, decrease environmental pollution caused by fossil energy combustion, and maintain long-term sustainable development. Meanwhile, the massive development of photovoltaic (PV) technology also has the potential to meet the world’s energy demand in the near future, which has becomes a hot topic in current scientific research.
However, due to low solar energy density and a comparatively low conversion rate, large-scale energy facilities have to be taken into account in order to meet the energy demand, which inevitably occupy too much land. The fourth national desertification and sandification monitoring results showed that desertification land area was 2.6237 million km2 and sandification land area was 1.7311 million km2 by the end of 2009 in China, accounting for 27.33% and 18.03% of the total land area, respectively [1], while the existing sandification land accounted for nearly one-fifth of the total land area in China. Of course, much desertified lands is caused by artificial exploitation and utilization, such as overreclamation, overgrazing, deforestation, and unreasonable use of water resources. If we can rationally develop and use these vast desert lands and make full use of solar energy in these areas, not only could the energy crisis be alleviated, but the environment can also be protected, so as to realize harmonious development between man and nature.
Meanwhile, it is of practical significance that a large-scale grid-connected power station in the Gobi desert in built. First, it can solve the local labor problem by providing employment opportunities for people whose living conditions are not suitable for farming, animal husbandry, or forestry. As a result, this project would reduce local farming, animal husbandry, and forestry scale and reduce agricultural demand for water resources, which means that it would also improve the ecological environment. Second, developing solar energy resources can provide large amounts of clean energy instead of conventional energy and biological energy to meet the energy demand, which can improve the environment. Third, the PV array converts a part of the radiation energy into electrical energy for output, which can reduce the surface layer temperature and the evaporation of surface water and can promote the recovery and growth of vegetation [2]. Fourth, large-scale solar panels can weaken the surface wind speed and play windbreak and sand fixation roles, so as to improve the local vegetation and the ecological environment [3].
Furthermore, there is an important social value to large-scale development and utilization of solar energy resources in desert regions. First, according to a report released by the United Nations Environment Program—“Green Jobs: Towards Decent work in a Sustainable, Low-Carbon World” [4], the field of bioenergy currently has about 1 million jobs worldwide. By 2030, bioenergy is expected to add 12 million new jobs; solar panel production, installation, and maintenance will add 6.3 million; and wind energy will add about 2 million. Second, saving energy and reducing emissions and using PV power instead of thermal power can reduce greenhouse gases and harmful gas emission, slow global warming, and improve the quality of the atmosphere. Therefore, it is necessary to establish a large-scale PV power plant in the Gobi desert.
At present, China’s PV project investment environment is full of uncertainty. Many uncertain factors are intertwined, work together to invest in PV power generation projects. Therefore, it is necessary to systematically study the effects of uncertainty on investment in PV power generation projects. The real options approach can quantify the value of uncertain factors in new energy projects, recognize the irreversible investment and flexibility of new energy projects, and improve the investment decision-making process of investing in new energy power generation projects. Therefore, with the background of the Gobi desert, this study establishes a policy benefit model of PV power generation projects based on real options analysis (ROA) and the two-factor learning curve model. A binary tree method is applied to solve the model. The investment value and the optimal investment time of Chinese PV power generation project are analyzed. The effect of the subsidy policy on the unit decision value and optimal investment time of PV power generation projects is also analyzed through three different forms of subsidies.
The remainder of this study is organized as follows. Section 2 offers a literature review. The next section discuss five uncertain factors considered in policy benefit analysis. Section 4 describes the real options model. All parameters in this paper are estimated in Section 5. Section 6 compares the net present value and the real options value of the project and studies the influence of subsidy on the unit decision value and the optimal investment time. Finally, we provide conclusions in Section 7.
2. Literature Review
While pioneering the theory of interest and the value of time, Fisher [5,6] proposed the discounted cash flow (DCF) method. The DCF method is extensively adopted to evaluate investments and real asset investment decisions. The DCF method is based on building expected future cash for each future period. Each expected cash flow is discounted back to the present value at a discount rate that reflects cash flow risk. Initial investment costs are then subtracted from the present value of future cash flows to yield the net present value (NPV) of the investment. With this analysis, the investment decision rule is simple: if NPV > 0, the investment is economically sound and decision-makers are advised to proceed; if NPV < 0, the investment is not economically sound and should be abandoned. However, Dixit et al. [7] pointed out that the NPV method is inappropriate for a rapidly changing investment climate. Furthermore, Trigeorgis and Mason [8] indicated that the NPV method cannot promptly reflect managerial flexibility in investment decisions, possibly underestimating the opportunity and actual values of an investment.
The concept of real options was first put forward by Stewart Myers [9] in finance. He referred to an investment scheme that generates cash flow, which creates profits from the use value of currently owned assets plus the choice value of future investment opportunities. While disputing the underlying assumptions of traditional capital budgeting methods, this method seeks gains from deferring an irreversible investment expenditure (in contrast to the “now or never” proposition implicit in traditional NPV analysis). Hence, the option pricing theory of Black and Scholes [10] and Merton [11] was applied to the valuation of non-financial or “real” investments planning and acquisition of real assets with learning and flexibility. In contrast with traditional valuation models of investment decisions, real option models can evaluate managerial flexibility. Trigeorgis and Mason [8] referred to the investment project value of an options value with managerial flexibility as “expanded” or “strategic” NPV. This value is the sum of the traditional NPV and the managerial flexibility value.
In recent years, the real options analysis (ROA) has been adopted as an analytical tool for the valuation of RE investment projects and the overall benefit for RE development planning. Venetsanos et al. [12] used the real options model for valuing wind power investment projects and for assessing the profitability of wind power plants in the face of uncertain competition in the energy market. They also noted that the uncertain parameters of an investment project include fossil fuel price, environmental regulations, demand, supply, technological, and market structure. Sarkin and Tamarkin [13] used the options evaluation model to evaluate the PV power generation project investment under the conditions of electricity price and technological uncertainty. Wolf [14] applied a discrete real options model to analyze investment in a new energy power generation project, the selection of technology type, and the decision on optimal operation under power producers with the uncertainties of price, market, and policy.
Some ROA studies have focused on evaluating the overall benefits of RE development planning. Using ROA methods in Taiwan, Lee et al. [15] estimated the options value of developing RE in the face of uncertain fossil energy prices and RE policy. The research results provided a reference for the government to accurately evaluate the relevant policies and promote the formation and implementation of RE policy. Zhang et al. [16] evaluated the project benefits of PV power generation in China and discussed an interest balance of government and investors. The proposed model considers RE costs, non-renewable energy (NRE) costs, carbon price, and subsidies. Tian et al. [17] estimated the policy benefit of a wind power project in the face of four uncertain factors. Those studies [15,16,17] further demonstrated that the real options evaluation model is appropriate for evaluating the investment value of RE technological development.
Many scholars have studied PV project investment evaluation under multiple uncertain factors using ROA. Such as Martinez and Mutale [18] studied the design of PV power generation systems and established an analysis model of a distributed PV power generation system under the condition of consumer demand uncertainty. Lin et al. [19] estimated solar PV power generation planning value with the uncertainty of fossil energy prices and under technology learning effect, and evaluated present Chinese solar feed-in tariff policy. Combining the actual project cases, Xie [20] compared the investment benefits of constructing PV power generation projects in the eastern coastal areas and the western regions using different subsidy methods, which provided a reference for investors. According to the characteristics of PV power generation projects and the current research results in this field, Liu et al. [21] put forward a PV power generation investment decision-making model based on real options theory, which enriched and developed the theory of real options in the application of electric power investment decisions. Those studies [18,19,20,21] further demonstrated that ROA is more effective than NPV analysis when dealing with uncertainty. Therefore, the research model in this study utilizes the real options pricing approach.
As for the development of a PV power generation project in the Gobi desert, Xu et al. [22] studied prospects and problems of concentrating solar power technologies for power generation in desert regions. Other studies discussed the impact of PV power plants on the surrounding environment. For example, Zhang et al. [23] analyzed the potential role of large-scale PV power generation in desert areas in alleviating the energy crisis, transforming the desert, reducing air pollution, and increasing the supply of fresh water. Chang [3] summed up the status, causes, and hazards of desertification and the status and development of PV technology in China, so as to qualitatively demonstrate the significance of the developing solar energy resources in desertification areas. As we know, quantitative research has not been carried out, and relevant research results are quite rare. Furthermore, previous studies have not considered the decision value of PV projects and the cost of desert control together. Therefore, we here reestablish the decision value function of PV projects, which first incorporates desert governance as an uncertain factor. Neglecting the cost of desertification control will lead to an increased unit decision value and an advanced optimal investment time.
3. Factors Considered in the Model
According to the above research, many factors affect RE development. This paper considers five uncertain factors: thermal power generating cost, PV power generating cost, carbon price, subsidy policy, and the environment cost of desertification control. In this study, we look at a PV investment project as a compound investment option. Each uncertain factor is described in detail as follows.
3.1. Thermal Power Generation Cost
NRE power generation cost is an important factor that affects the decision value of a PV project. Since thermal power generation is the primary source of NRE power generation in China, its cost is hereby taken as the cost of NRE power generation.
As is known, coal in thermal power enterprises makes up 70% of the cost of power generation [16]. According to National Energy Bureau statistics, the national average consumption of coal for power was 0.317 ton/kwh [24] by the end of August 2013. With S representing the price of coal, the thermal power cost H is:
where the unit of S is yuan/ton and the unit of H is yuan/kwh.
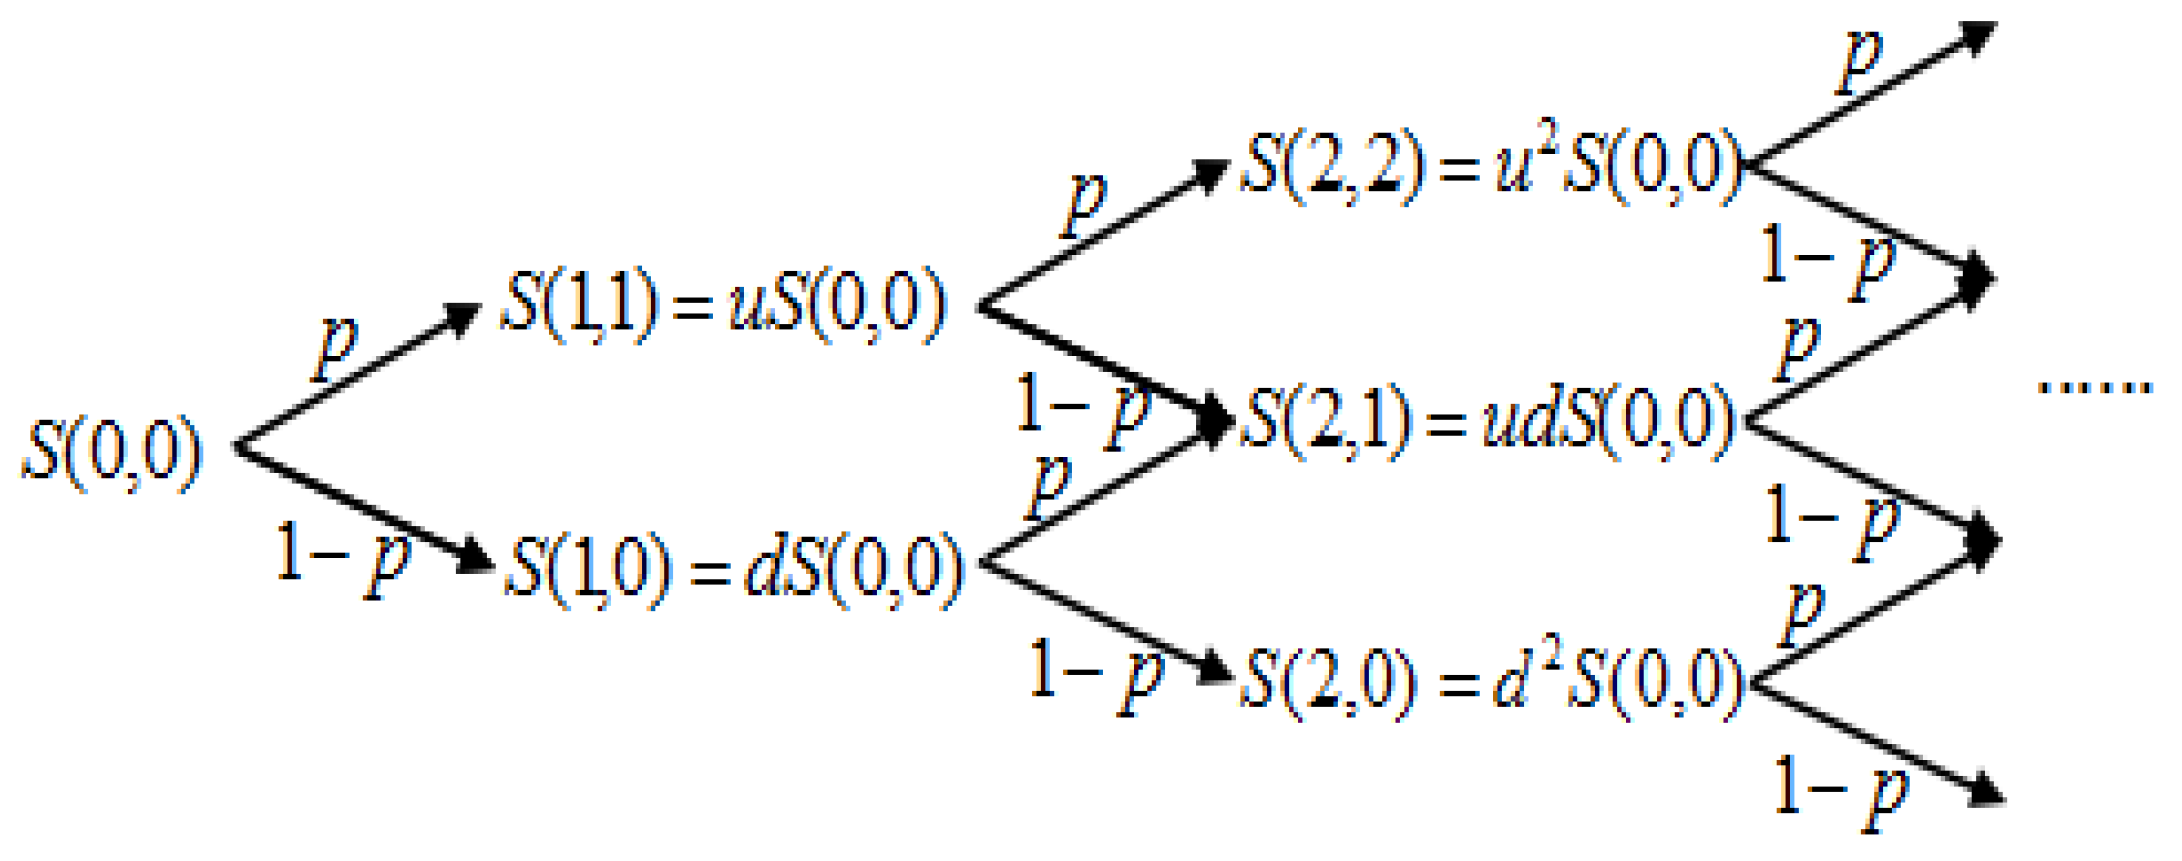
In previous studies [15,17], changes in coal prices and NRE power generation cost were subject to geometric Brownian motion (GBM). Therefore, we also assume that the coal price is in accordance with GBM and use the binary tree stochastic process to simulate its change process (Figure 1).
Suppose is the total time of project planning and the interval is divided into equal parts ( is total number of fluctuations): . Note that , . As usual, we set . and are thus equal in value. is the number of fluctuations, and is the mobile number of coal price . is the coal price with periods elapsed and an upward cost movement. is the initial coal price; the coal price for the next period is stochastic and can be valued in two ways:
Generally,
where is the up factor, ; is the down factor, ; is the volatility rate; is risk-neutral probability, and ; is the risk-free interest rate. , i.e., is the last discrete node. In previous studies [15,16], the questioned setting is represented as .
Since thermal power cost is a linear function of coal price,
where is a constant, is a normally distributed random variable, its mean is 0, and its standard deviation equals 1. Therefore, also follows GBM; its volatility rate and risk-neutral probabilities are consistent with coal price.
It is significant to determine the value of to depict the binary lattice stochastic process. This study uses the method proposed by John C. Hull [25] to estimate volatility rate .
3.2. Carbon Value
Solar PV power generation can reduce greenhouse gases produced by conventional thermal power. Consequently, the carbon value should be considered in the decision value model. The carbon value defined in this study mainly refers to the price of carbon. It could be the cost paid by power generation companies that exceed the carbon emissions quota of greenhouse gases, or one party to a contract paying the other party for getting the amount of greenhouse gas reduction, with the buyer purchasing the amount of emission reduction in order to alleviate the greenhouse effect and achieve emission reduction targets.
The change in carbon prices is random. The stochastic process can better reflect the fluctuation of carbon prices. In former studies, Fuss [26], Reuter et al. [27], Abzdie et al. [28], and Heydari et al. [29] assumed that carbon price follows a random process. We also assume that carbon price follows GBM, and Figure 2 describes the binary tree stochastic process of the price change.
Here, is the carbon price with periods elapsed and a upward cost movement, and is a mobile number of the carbon price . is the initial carbon price, is the up factor, ; is the down factor, ; is the volatility rate; is the risk-neutral probability, .
3.3. PV Power Generation Cost
The learning curve concept was first introduced by Wright [30]. The learning curve model is based on three hypotheses: (1) direct labor time or cost required for the production of the first product is always more than the first n; (2) when the accumulation of production increases, direct labor time or cost required reduces at a diminishing rate; and (3) labor time or cost reduction obeys exponential distribution. At present, much research shows that the development of new energy sources such as PV power generation and wind power is in keeping with the learning curve model [31,32,33]. Recent research [16,34] shows that the cost of power generation could be reduced through cumulative installed capacity and the total amount of research and development (R&D). We use a two-factor learning curve model proposed by Zeng et al. [34] to measure PV power generation cost. It is assumed that power generation cost meets the two-factor learning curve, i.e.,
where is the PV power cost, is the initial cost, is the cumulative production, is the cumulative R&D, is the learning index of , is the learning index of , is the learning rate of learning by doing, and is the learning rate of learning by searching.
Here, we adopt Professor Miketa’s research results [35], i.e., , . Therefore, we get and . Zeng et al. [34] pointed out that the cumulative R&D growth rate fluctuated between 20% and 40% when the growth rate during 2001–2010 was calculated. According to the Thirteenth Five-Year Plan, China will strive to realize over 100 GW of installed capacity by 2020. Based on previous research, cumulative production growth rate and cumulative R&D growth rate are set as 20% and 25%, respectively. By using Equation (2), we obtain:
3.4. Government Subsidies
In China, thermal power and hydropower are our traditional sources, because their technology is mature and cost is relatively low. However, because solar power is a new RE, the survival and development of the solar power generation industry is dependent on national and local subsidies and support. In order to promote development of the solar power industry, the state has promulgated a series of policies, laws, and regulations. Through tax relief, encouragement of grid connection, preferential feed-in tariff (FIT), subsidized loans and financial subsidies, or other incentive policies, the government attempts to stimulate power generation enterprises and consumers to actively participate in RE power generation. Among these factors, price subsidy is the core. By adjusting existing policies and introducing new ones, the support policy system for PV development has been basically established.
3.5. Environmental Costs of Desertification Control
By the end of 2009, the country’s desertified land area was 2.6237 million km2, accounting for 27.4% of the total land area, and nearly 400 million people were affected by desertification [37]. According to an international joint research project run cooperatively between China, the United States, and Canada, desertification is causing annual direct economic losses of about 54.1 billion yuan in China [38]. Therefore, if we can reasonably develop this land to build PV power stations not only can we relieve the energy crisis in our country but also make full use of the vast land and abundant solar energy resources to achieve environmental governance. Once the power plant is operational, due to the conversion of solar energy into electricity, the surface solar radiation will be reduced, and the surface temperature will also be reduced [2]. At the same time, the local diurnal and annual ranges will decrease, and the relative humidity and precipitation will increase to some extent, thus alleviating the drought crisis in the Gobi desert. After the PV power plant is completed, massive solar panels will cover the land surface, which not only serves as a sand barrier but also reduces the rate of water evaporation from the land surface and increases the rate of vegetation recovery. Coupled with artificial greening measures, local vegetation coverage will increase. Increased vegetation coverage decreases wind speed and sediment transport rate, which plays a role in windbreak and sand fixation, and helps to control desertification, reducing the investment required in desertification [39].
According to the Twelfth Five-Year Plan, large-scale desert solar power stations will be an important direction in the development of the Chinese solar industry [40,41,42]. China’s solar energy resource-rich areas are mainly located in the northern and western regions of the desert areas [43,44].
However, in previous studies, the models of PV projects have only considered those uncertainty factors, such as the price of electricity, generation technology, fossil energy prices, and RE policy, and has never considered the environmental costs of desertification control. Moreover, many large-scale solar PV power stations are built in desert areas in China. Therefore, our model introduces the environmental cost of desertification control, which increases the decision value of the project and advances the time of investment income.
4. Real Options Model
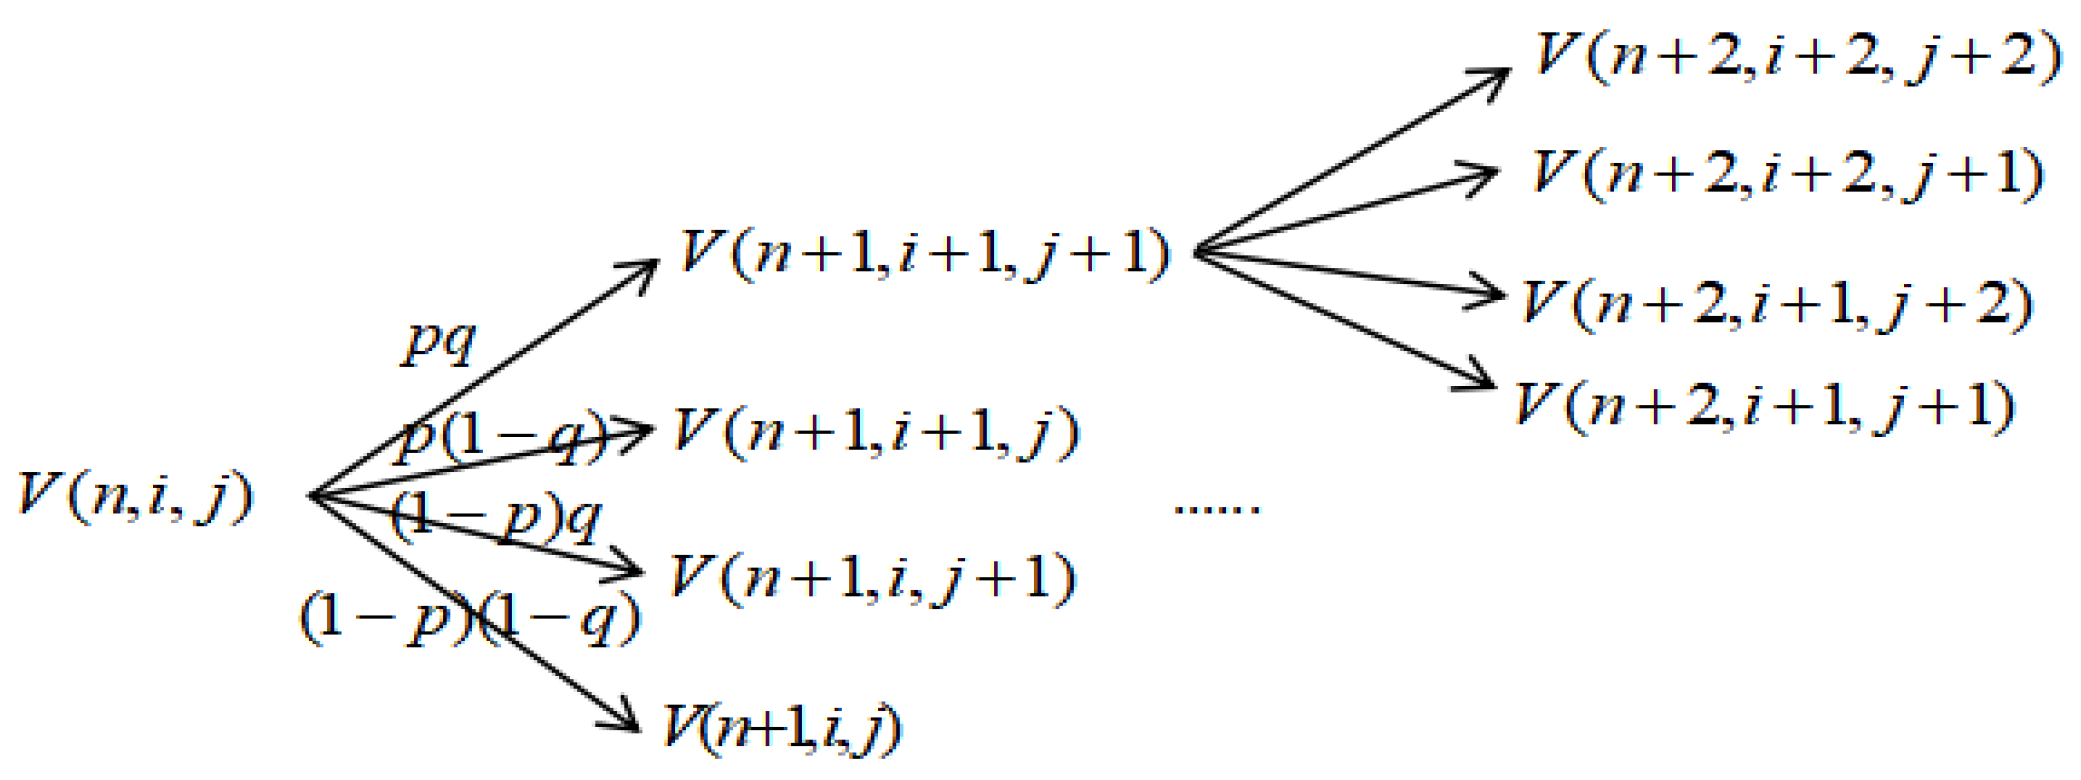
In this study, the real options model of the PV power project’s decision value is defined as decision value = value of saving − subsidy expenditure. The binomial tree real options model and two-factor learning curve theory were applied to establish the decision value model from the viewpoint of government. Our highlights are as follows. First, the environmental cost of desertification control is incorporated for the first time. Second, the model is more complex because the binary tree expands to a two-dimensional binary tree. Third, in previous research, the European options pricing method has been used to obtain the initial value of the planning period. In this study, we used the American options pricing method to obtain the decision value of each time node.
Here we introduce the model of decision value in detail.
Figure 4 shows the random decision-making process of a PV investment project. At each node, due to the random changes of thermal power cost and carbon price—thermal power cost increases as probability and carbon price rises as probability —each node will produce four different results at the next moment. Therefore, the original binary tree evolves into a two-dimensional binary tree.
Suppose the government is faced with two choices on each decision node, to continue or to delay the development of a PV project. Within the effective period of investment, the government makes a comparison between immediate and delayed investment: the government will benefit when the decision value is >0; otherwise, the government will postpone investment because the decision value = 0, and will make a decision after obtaining the relevant information from the next decision node.
According to this, the model of the decision value evaluation is as follows:
where is the saving unit cost of PV power relative to thermal power, and is the subsidy of government expenditure. The last discrete node T is the effective period of investment: if the decision value >0, the government immediately invests; if the decision value = 0, the government will give up the investment.
Due to the decision-making power of the PV power generation projects is American options, a decision about the optimal strategy could be made at any time nodes during the project planning period, comparing the values of currently supporting development or delaying development.
For the traditional binary tree model, as mentioned in the preceding model, coal price, thermal power cost, and carbon price are all estimated using backward induction. In this paper, and are uncertain factors, both and change with time, and is a constant. Therefore, we cannot resolve it directly, and indirect conversion is required. According to backward induction, we ought to first resolve and then .
Thus, we set:
The decision value of the last node is as follows:
Generally, for ,
The decision value of developing PV power is
On the basis of risk-free interest rate and risk-neutral probability, we can calculate the decision value at each node during the planning period from the last node by reverse calculation.
5. Parameter Estimation
The PV generation planning period in this context is 2015–2030, and cost and price fluctuations are assumed to change 16 times; the time interval of the binomial tree model is one year ().
5.1. Parameter Estimation of Thermal Power Cost
In the selection of data, since Qinhuangdao Port is the largest coal trading market in China, its market information can be announced in time, which is a barometer of the national coal market.Therefore, we apply the average price of the Bohai rim thermal coal during 2014–2015 to describe Chinese coal prices, and the data is obtained from trading announcement of Qinhuangdao sea coal trading market. By calculating with historic sample data of coal prices, we obtain .
We take the average coal price over 50 weeks in 2015 as the initial coal price , and by Equation (1) we can obtain yuan/kwh. A binary tree stochastic process of thermal power generation cost is shown in Table 1.
5.2. Parameter Estimation of Carbon Emission Price
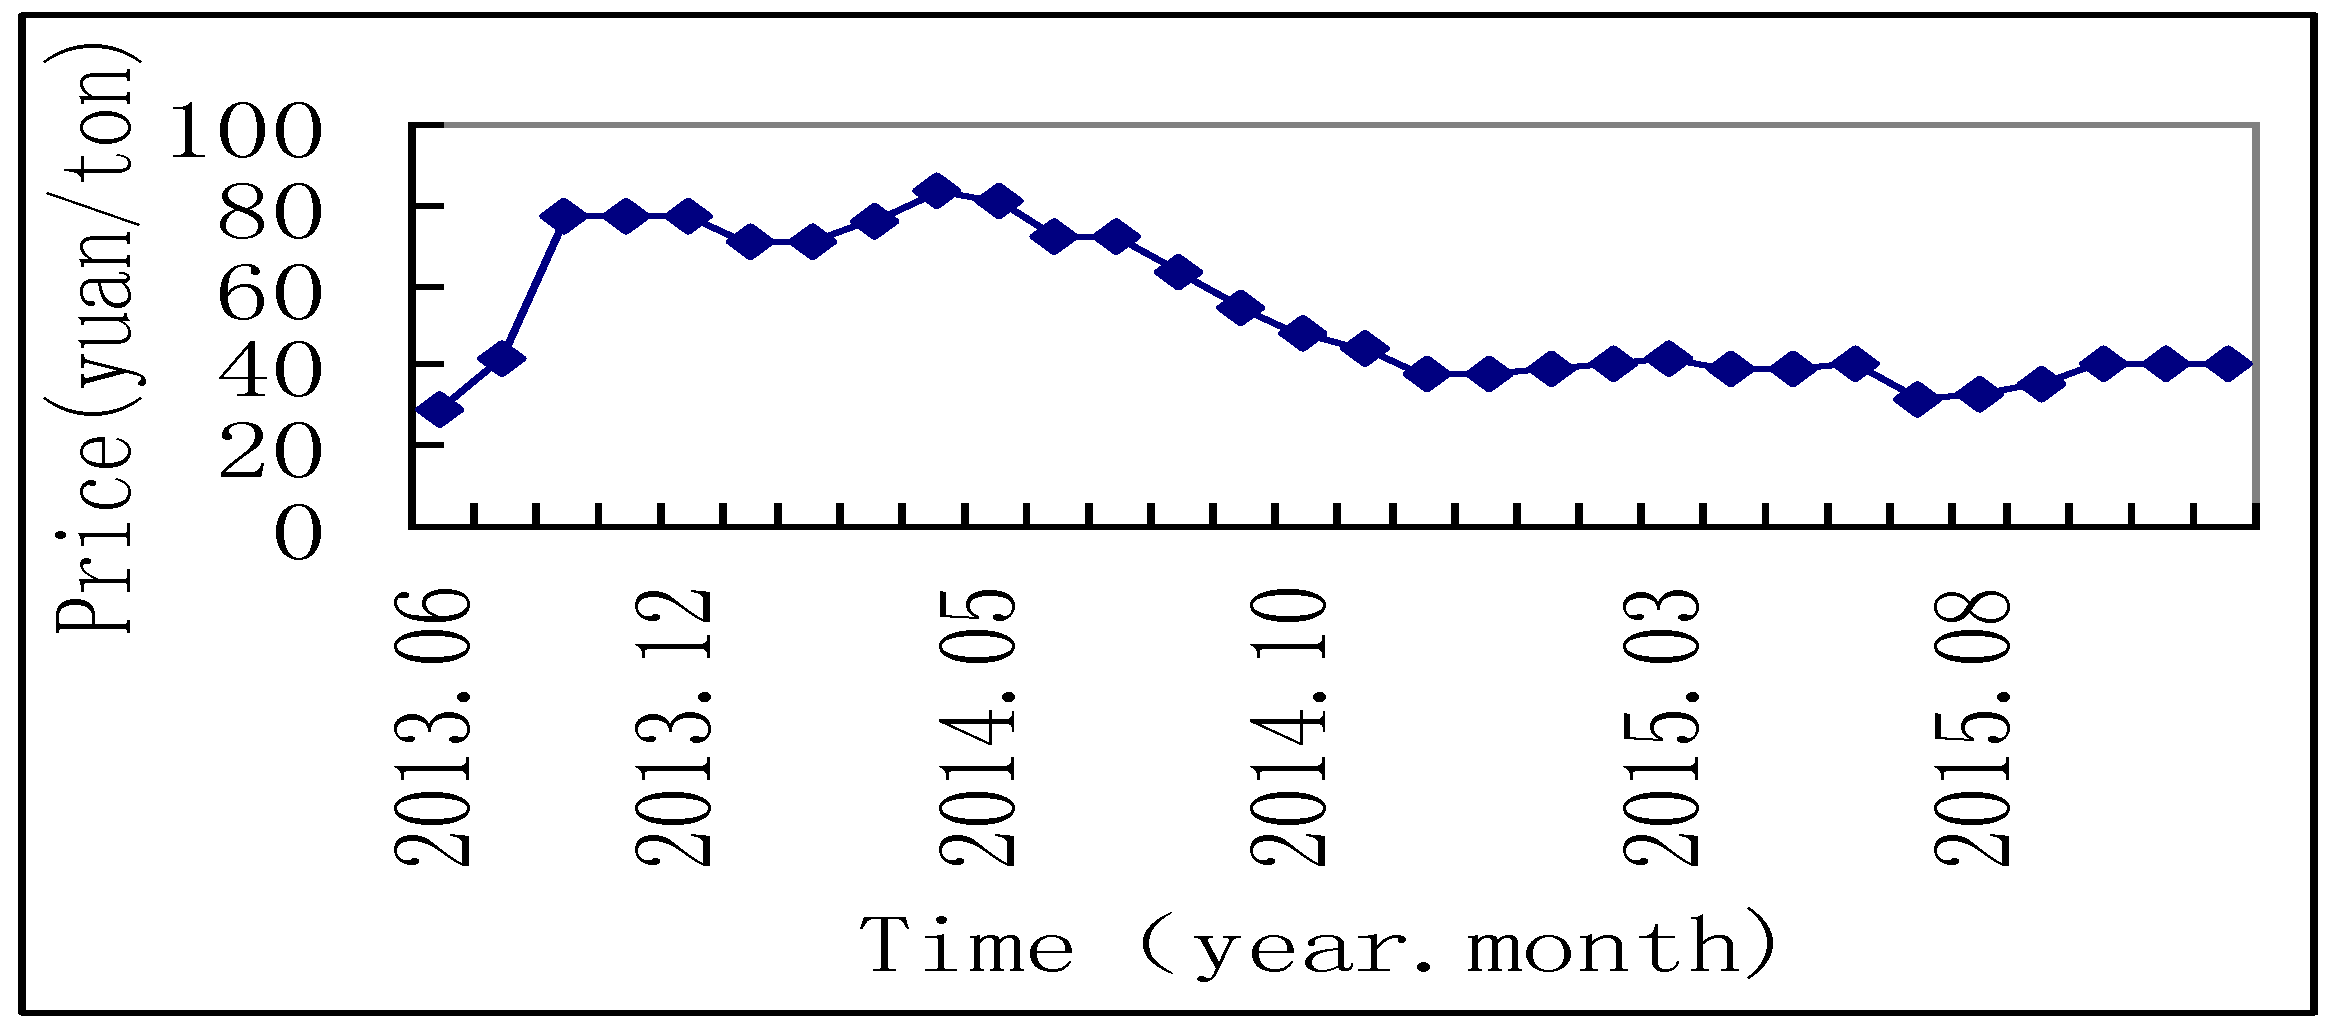
The first carbon emissions exchange was set up in June 18, 2013 in Shenzhen, and carbon emissions trading was initially carried out. Taking into account the longest transaction time, the maximum cumulative turnover, and the largest volume, the trading price of the most representative and the mature trading system, we select the Shenzhen carbon trading price as the domestic carbon emissions price. The sampling interval for carbon emission trading data is June 2013~December 2015, and the price of carbon emissions is shown in Figure 5. Data are from the Shenzhen carbon emissions trading announcement.
We obtain by calculating the carbon price history sample data.
5.3. Other Parameter Estimation
5.3.1. Risk-Free Interest Rate
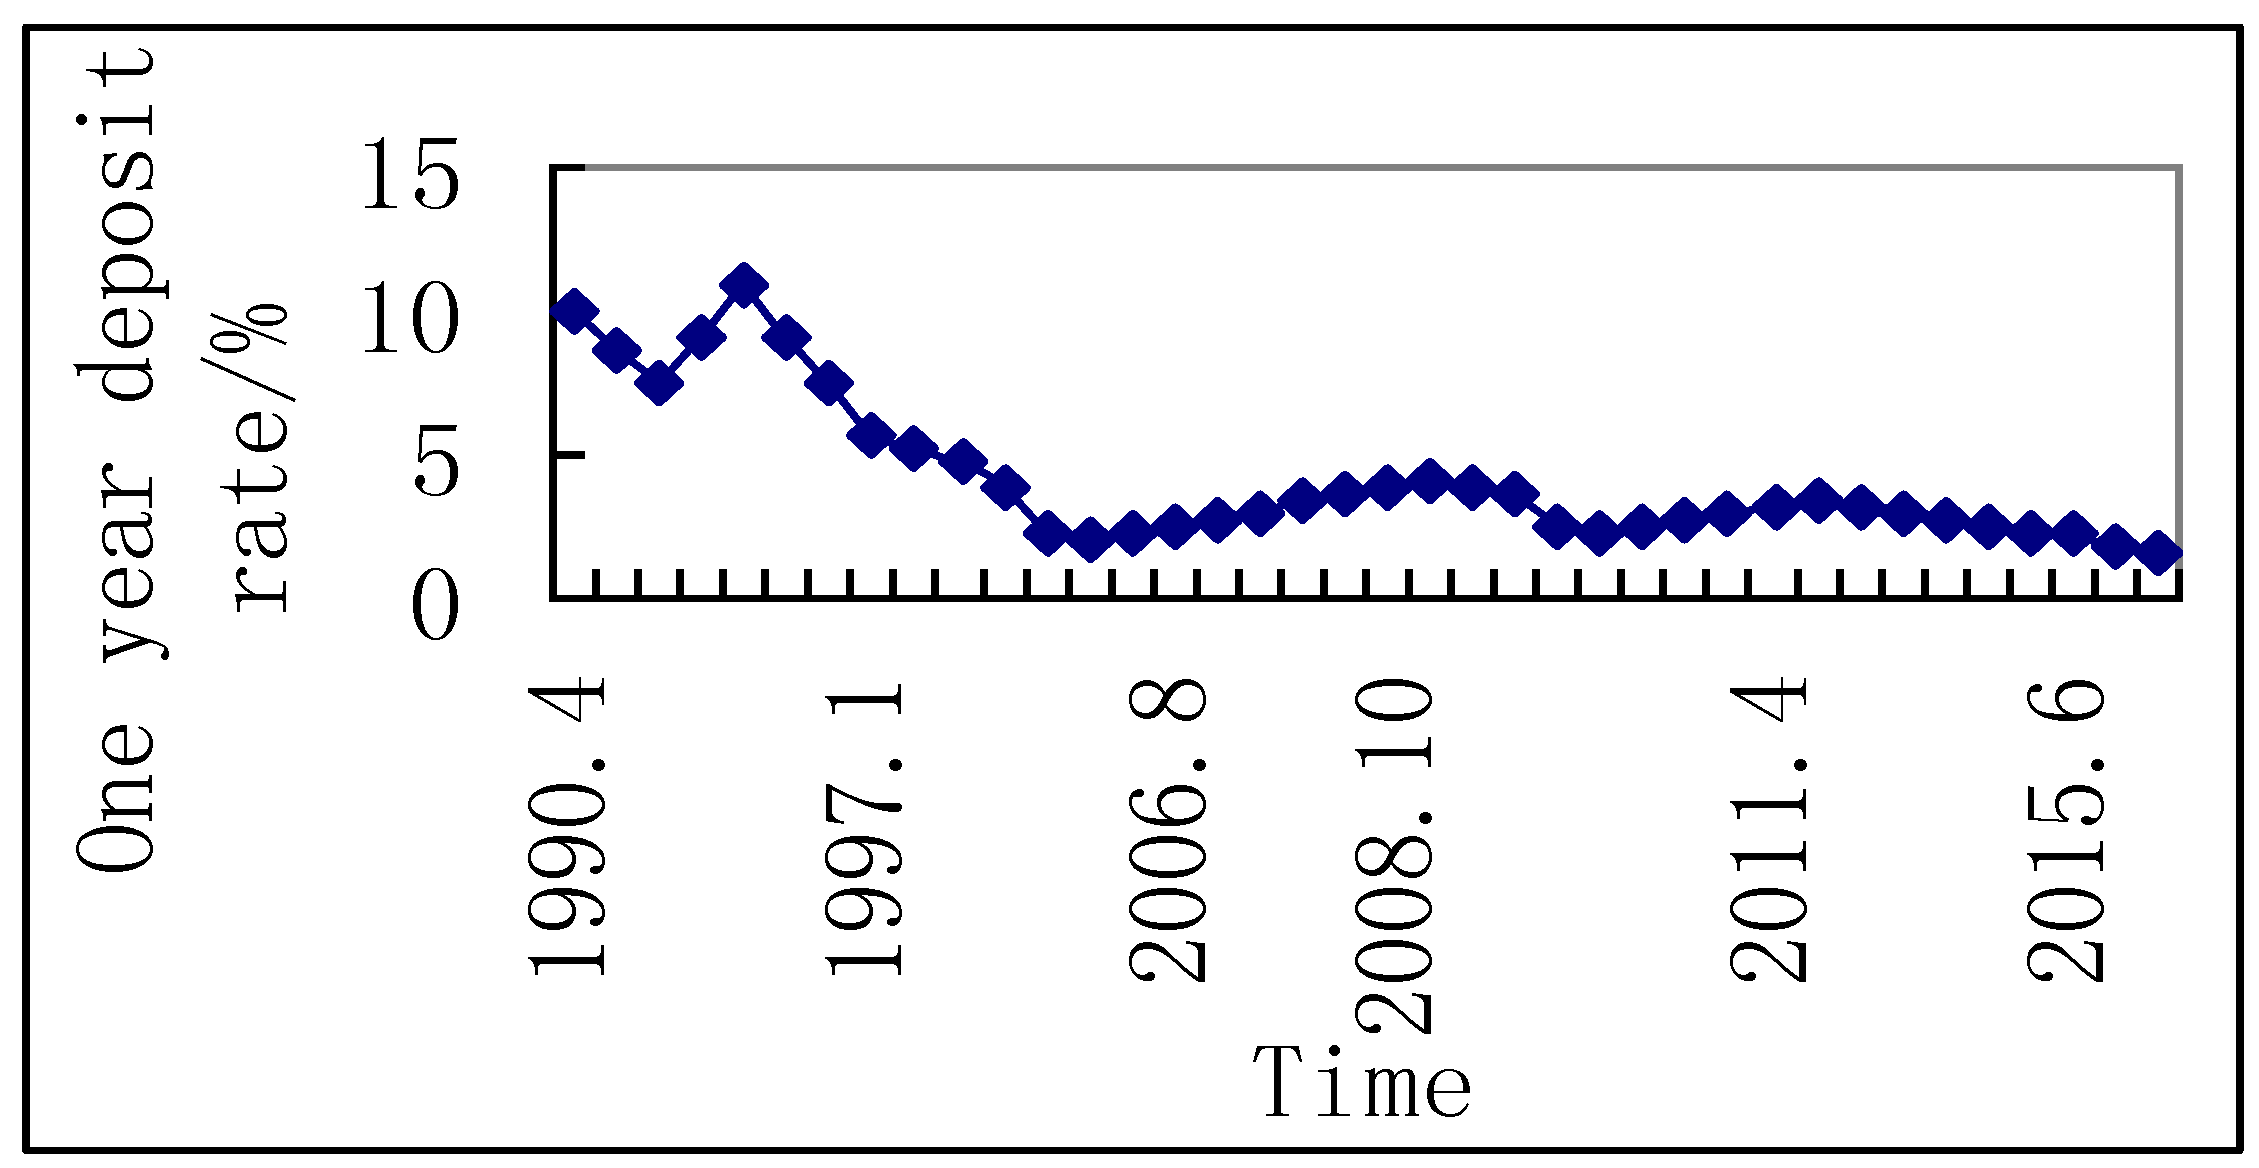
This paper takes the average value of the one-year deposit interest rate of the People’s Bank as the risk-free rate, from which we can obtain the average value of one-year deposit interest rate, (see Figure 6).
5.3.2. Government Subsidies of PV Power Generation Projects
In the light of the current policy for RE in China, we can obtain the price subsidy , where is the unit price subsidy, FIT is feed-in tariff, and is the desulfurization electricity price. Table 3 presents the average FIT of Chinese power plants for 2015–2020 [45]. The average desulfurization electricity price is 0.41 yuan/kwh [16], so we can obtain the price subsidies for 2015~2020 (see Table 3). Assuming that FIT will be the same in 2021–2030 and equal to the FIT of 2020, the unit price subsidy in 2021~2030 will be 0.40 yuan/kwh.
5.3.3. Unit Cost of Desertification Control
Building a PV plant in the Gobi desert not only could ease the energy crisis but also reduce government investment in desertification control. Therefore, considering the effects of PV power station on the surroundings, the environmental cost of desertification control was added to the model.
According to the statistics, a PV power plant with the installed capacity of 1 MW generates an average capacity of approximately 1096 million kwh [46] in the first year. The average annual generating capacity during the entire operating period of 25 years accounts for 80% of the first year’s generating capacity and covers an area of about 29,950 m2 [3]. Ningxia is located in one of the most serious desertification areas in China’s northwestern provinces, so we chose the data of desert governance in Ningxia as the data for this study. According to a State Forestry Administration announcement, the World Bank loaned $80 million to support the governance of desertification land in Ningxia. The World Bank Loan Ningxia Desertification Control and Ecological Protection Project has officially started recently, and it will take five years to complete the desertification of an area of 720 km2 in Ningxia. The world bank loan along the eastern coast of the Yellow River in Ningxia sand prevention project experienced a medium-term adjustment on 28 October 2015, the total project area was reduced from the original 720 to 473 km2, and funds decreased from 716.65 to 598.06 million yuan [47]. Thus, we could obtain the environmental cost of the decision value function by analogy:
6. Scenario Analysis
6.1. Base Case Analysis: Comparison Between NPV and ROA
The goal of the base case analysis is to compare the effect of NPV and ROA on handling uncertainty. According to the NPV method, the decision value of each year can be calculated (see Table 4). The unit decision value was −0.96 yuan/kwh in 2015, which shows that the current development of PV power generation projects is not profitable and should be postponed. The save-path rate (that is, the number of saved paths divided by the number of paths) is less than 50% for 2015~2029, reaching 50% in 2030. From the point of view of income, PV power generation should be developed in 2030. If we remove the environmental cost of desertification control, namely , the value of the unit decision will be reduced accordingly. The save-path rate is less than 50% during the whole project planing period, which means that the development of PV power generation projects will suffer a loss in 2015~2030. Therefore, due to the additional environmental cost of desert governance, the decision value increases and the benefit time of the project advances.
We can see that the initial unit decision value is 0 according to the ROA from Table 5, which indicates that the government will suffer a loss if it develops PV power under the current situation. This is consistent with the NPV method. The save-path rate is less than 50% in 2015–2029 and reaches 50% in 2030, which shows that it will be possible for PV power generation to make a profit in 2030. If we let , the save-path rate is less than 50% in 2015–2030. In general, the save-path rate calculated with ROA exceeds the value using NPV (see Figure 7). This is because the traditional NPV method ignores the uncertainty and managerial flexibility in the planning period, leading to an underestimate of the decision value. However, the difference is very small. It is because the speed of technological progress is not fast enough and the volatility rate of coal and carbon price are relatively small.
In brief, under the current level of subsidy, the government could experience a loss in developing the PV project. To reverse this situation or reduce the loss, FIT and government subsidy need to be adjusted. This is because the PV power generation cost could be gradually reduced over time, and FIT would be reduced accordingly. Therefore, we establish three different subsidy fitting curves to study the influence of subsidy on unit value and the optimal investment time. The detailed analysis is as follows.
6.2. Varying Subsidy Policies
The purpose of the subsidy policy is to encourage and promote the development of PV projects. For medium- and long-term development, implementation of this policy has achieved the desired purpose, and the subsidy may be reduced appropriately. In accordance with three scenarios—linear function fitting, exponential function fitting, and the subsidy being zero after 2021—we explore the impact of subsidy on the save-path rate and the unit decision value.
(1). Linear Function Fitting
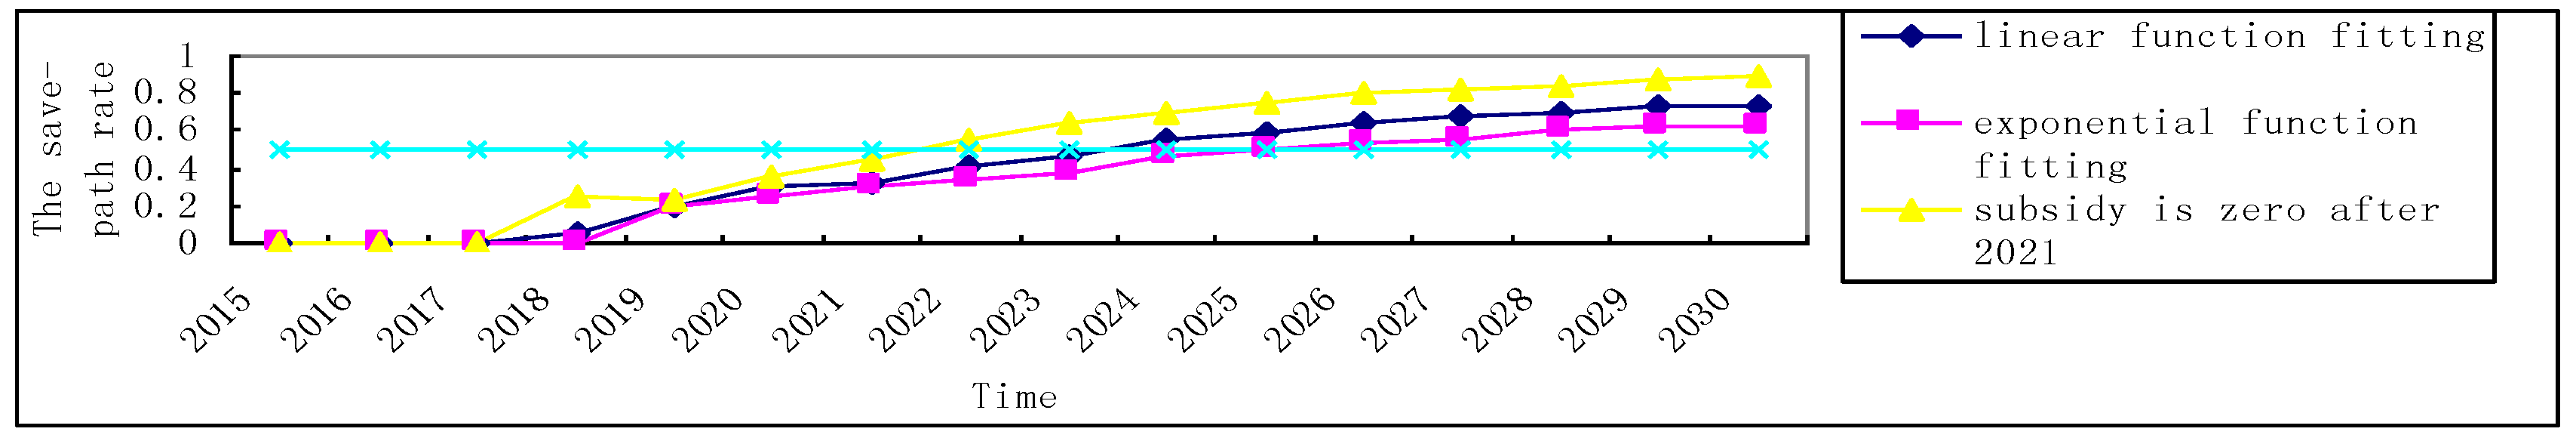
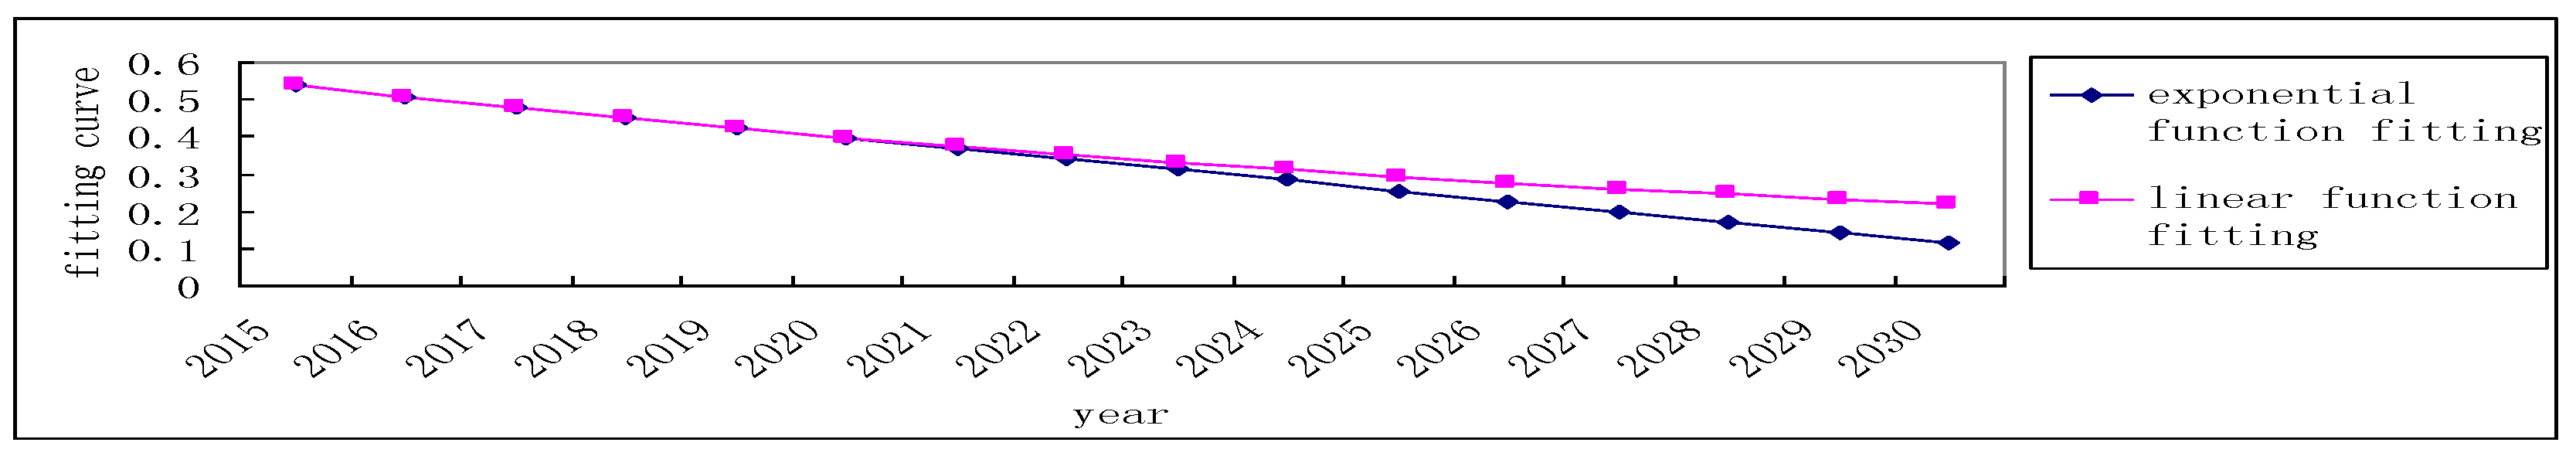
According to the situation of unit subsidy of 2015~2020 (Table 3), we can obtain the linear function fitting curve: , where , and the value of (significant level) is 0, which shows a remarkable linear dependence. Thus, we can get unit subsidy for 2021–2030 (see Figure 8). By calculating the decision value, we see that the unit decision value is 0 in 2015–2017, and the save-path rate is less than 50% in 2018–2023, which indicates that the risk of loss is higher than the benefit during this period. In 2024–2030, the save-path rates are 55%, 59.5%, 63.89%, 67.46%, 69.39%, 72.44%, and 73.83% per year, respectively (Figure 9). Thus, the optimal investment time for the PV power generation project is 2024.
(2). Exponential Function Fitting
Using exponential function fitting, we can get the fitting curve: (see Table 3), where and , with a significant exponential relationship. The unit policy subsidy for 2021–2030 can be obtained (see Figure 8). The unit decision value is 0 in 2015–2018 and the save-path rate is less than 50% in 2019–2025. In 2026–2030, the save-path rates are 53.47%, 56.21%, 60.2%, 62.67%, and 62.89% per year, respectively (Figure 9). Therefore, the optimal investment time is 2026. The save-path rate with exponential function fitting is less than the value using linear function fitting, because the former subsidies are higher than the latter.
(3). Policy Subsidy after 2021
It would be ideal for the subsidy to become 0 after 2021, which means that the country stops the subsidy on the PV project. There would be no difference between the price of PV power and thermal power. The unit decision value is 0 in 2015–2017 and the save-path rate is less than 50% in 2018~2021 (Figure 9). After 2022, the save-path rate is more than 50%, and the optimal investment time for the PV project is 2022.
Through the above three cases, we can observe the following results. The subsidy under the exponential function fitting is highest and the corresponding decision value is the lowest, so the best investment opportunity is the latest (2026); the subsidy is centered under the linear function fitting, and as a result the corresponding decision value and the best investment time are in the middle (2024); the subsidy is the lowest in the third case (subsidy is 0 after 2021), so the decision value is highest and the best investment opportunity is the earliest (2022). However, the government will face a loss if it develops the PV project before 2022 regardless of what happens. The main reason is that thermal power generation technology is relatively mature and the power cost is low, and, due to the late start of PV power generation and the higher cost, the power generation cost is much higher than the thermal power cost despite the advancement of technology. Therefore, in order to reduce the government’s loss, the state should increase R&D investment in the PV project and maintain the stability of PV market conditions and technological development, so as to promote the progress of PV technology and thereby reduce the cost of power generation.
7. Conclusions
This paper presents a policy benefit model based on ROA and the two-factor learning curve model. We consider the investment behavior of developing a PV project in the Gobi desert from the perspective of the government and quantitatively analyze the impact of uncertain factors on the feasibility of the project, which provides further reference for project decision-makers.
Our study shows that thermal power cost, PV power generation cost, carbon prices, environmental cost of desertification control, and government subsidy may affect the decision value of the PV project. The thermal power cost, carbon price following GBM, and PV power generation cost is in line with the two-factors learning curve model. Scenario analysis illustrates that the environmental cost of desertification control increases the decision value and advances the optimal investment time. If the government subsidy decreases linearly or exponentially, the optimal investment time is 2024 or 2026, respectively. If the subsidy vanishes after 2021, the optimal investment time is 2022. In a word, it would be beneficial for the government to reduce the subsidy. However, even if the subsidy is reduced to a minimum (), development of the PV project will suffer a loss for the government. Therefore, other aspects, such as boosting research into PV technology and levying a surcharge on RE, could compensate for the government's loss.
The proposed model can be used to analyze other RE sources and provide help in making relevant decisions. However, RE projects involve complex investment with considerable uncertainties, and the uncertainty factors studied here may still be insufficient. First, for simplicity, the cumulative production growth rate, cumulative R&D growth rate, and the bank interest rate are assumed to be constant. In reality, these factors may change with time, which would affect the results of the model. Second, the model only considers five kinds of uncertain factors, which are highly correlated with the PV power generation technology and economic evaluation, and there might be other factors that affect PV projects. For example, dust (sand), combined dust-moisture conditions [48], and the operating temperature [49] play central roles in the PV energy conversion process, which remains to be further discussed in future studies. In spite of these limitations, we think this study has reference value.
Acknowledgments
The authors gratefully acknowledge the financial support provided by the National Natural Science Foundation of China (Nos. 71690242, 91546118 and 11731014), the scientific research innovation project of College Graduate in Jiangsu Province (No. CXLX13_672).
Author Contributions
Yiqing Li and Weiguo Yang conceived and designed the model for the decision value of PV power generation project. Lixin Tian and Jie Yang analyzed the data. Yiqing Li wrote the paper.
Conflicts of Interest
The authors declare no conflicts of interest.
References
- State Forestry Administration (SFA). Fourth Bulletin of Status Quo of Desertification and Sandification in China; State Forestry Administration (SFA): Beijing, China, 2011.
- Yang, L.; Gao, X.; Lv, F.; Hui, X.; Ma, L.; Hou, X. Study on the local climatic effects of large photovoltaic solar farms in desert sareas. Sol. Energy 2017, 144, 244–253. [Google Scholar] [CrossRef]
- Chang, R.; Shen, Y.; Luo, Y.; Wang, B.; Yang, Z.; Guo, P. Observed surface radiation and temperature impacts from the largescale deployment of photovoltaics in the barren area of Gonghe, China. Renew. Energy 2018, 118, 131–137. [Google Scholar] [CrossRef]
- United Nations Environment Programme. Green Jobs, 2008. Towards Decent Work in a Sustainable, Low-carbon World, UNEP/ILO/IOE/ITUC; United Nations Environment Programme: Nairobi, Kenya, 2008. [Google Scholar]
- Fisher, I. The Rate of Interest: Its Nature, Determination, and Relation to Economic Phenomena; Macmillan: New York, NY, USA, 1907. [Google Scholar]
- Fisher, I. The Theory of Interest; Macmillan: New York, NY, USA, 1930. [Google Scholar]
- Dixit, A.K.; Pindyck, R.S. The options approach to capital investment. Harv. Bus. Rev. 1995, 73, 10515. [Google Scholar]
- Trigeorigis, L.; Mason, S.P. Valuing managerial flexibility and strategy in resource. Midl. Corp. Financ. J. 1987, 5, 14–21. [Google Scholar]
- Myers, S.C. Determinants of corporate borrowing. J. Financ. Econ. 1977, 5, 147–175. [Google Scholar] [CrossRef]
- Black, F.; Scholes, M. The pricing of options and corporate liabilities. J. Political Econ. 1973, 81, 637–654. [Google Scholar] [CrossRef]
- Merton, R.C. Theory of rational option pricing. Bell J. Econ. Manag. Sci. 1973, 4, 141–183. [Google Scholar] [CrossRef]
- Venetsanos, K.; Angelopoulou, P.; Tsoutsos, T. Renewable energy sources project appraisal under uncertainty-the case of wind energy exploitation within a changing energy market environment. Energy Policy 2002, 30, 293–307. [Google Scholar] [CrossRef]
- Sarkis, J.; Tamarkin, M. Emissions Trading; Springer: New York, NY, USA, 2008. [Google Scholar]
- Reuter, W.H.; Szolgayova, J.; Fuss, S. Renewable energy investment: Policy and market impacts. Appl. Energy 2012, 97, 249–254. [Google Scholar] [CrossRef]
- Lee, S.C.; Shih, L.H. Renewable Energy Policy Evaluation Using Real Options Model-The Case of Taiwan. Energy Econ. 2010, 32, 67–78. [Google Scholar] [CrossRef]
- Zhang, M.; Zhou, D.; Zhou, P. A real option model for renewable energy policy evaluation with application to Solar PV power generation in China. Renew. Sustain. Energy Rev. 2014, 40, 944–955. [Google Scholar] [CrossRef]
- Tian, L.; Xu, P.; Fu, M. Wind Power Policy Evaluation in China Using Real Option Model. Chin. J. Manag. 2013, 10, 266–273. [Google Scholar]
- Martinez-Cesena, E.A.; Mutale, J. Application of an advanced real options approach for renewable energy generation projects planning. Renew. Sustain. Energy Rev. 2011, 15, 2087–2094. [Google Scholar] [CrossRef]
- Lin, B.; Wesseh, P.K., Jr. Valuing Chinese feed-in tariffs program for solar power generation: A real options analysis. Renew. Sustain. Energy Rev. 2013, 28, 474–482. [Google Scholar] [CrossRef]
- Xie, B.-X. Discussion on Golden Sun pilot project investment profit. Renew. Energy Resour. 2011, 6, 160–162. [Google Scholar]
- Liu, J.; Han, S.-B.; Zeng, H.-R.; Chen, S.-J. The Photovoltaic Power Generation Investment Decision-making Model Based on Real Options Theory. Energy Conserv. Technol. 2013, 31, 75–78. [Google Scholar]
- Xu, X.; Vignarooban, K.; Xu, B.; Hsu, K.; Kannan, A.M. Prospects and problems of concentrating solar power technologies for power generation in the desert regions. Renew. Sustain. Energy Rev. 2016, 53, 1106–1131. [Google Scholar] [CrossRef]
- Hengxu, Z.; Yutian, L. Potential role of large-scale renewable energy in environment improvement of China. Renew. Energy Resour. 2014, 32, 1249–1254. [Google Scholar]
- Yang, Y.; Yang, Z.; Xu, G.; Wang, N. Situation and Prospect of Energy Consumption for China’s Thermal Power Generation. Proc. CSEE 2013, 23, 1–11. [Google Scholar]
- Hull, J.C. Options, Futures and Other Derivatives; China Machine Press: Beijing, China, 2011. [Google Scholar]
- Fuss, S. Investment under market and climate policy uncertainty. Appl. Energy 2008, 85, 708–721. [Google Scholar] [CrossRef]
- Retuer, W.H.; Scolgayova, J.; Fuss, S.; Obersteiner, M. Investment in wind power and pumped storage in a real options model. Renew. Sustain. Energy Rev. 2012, 16, 2242–2248. [Google Scholar] [CrossRef]
- Abadie, L.M.; Chamorro, J.M. European CO2 prices and carbon capture investments. Energy Econ. 2008, 30, 2992–3015. [Google Scholar] [CrossRef]
- Heydari, S.; Ovenden, N.; Siddiqui, A. A real options analysis of investment in carbon capture and sequestration technology. Comput. Manag. Sci. 2012, 9, 109–138. [Google Scholar] [CrossRef]
- Wright, T.P. Factors Affecting the Cost of Airplanes. J. Aeronaut. Sci. 1936, 3, 122–128. [Google Scholar] [CrossRef]
- Mcdonald, A.; Schrattenholzer, L. Learning rate for energy technologies. Energy Policy 2001, 29, 255–261. [Google Scholar] [CrossRef]
- Ibenholt, K. Explaining learning curves for wind power. Energy Policy 2002, 30, 1181–1189. [Google Scholar] [CrossRef]
- Grubler, A.; Messner, S. Technological change and the timing of mitigation measures. Energy Econ. 1998, 20, 495–512. [Google Scholar] [CrossRef]
- Zeng, M.; Lu, W.; Duan, J.; Li, N. Study on the Solar Photovoltaic Generation Using Double-factors Learning Curve Model. Mod. Electr. Power 2012, 29, 72–76. [Google Scholar]
- Miketa, A.; Schrattenholzer, L. Experiments with a methodology to model the role of R&D expenditures in energy technology learning processes; first results. Energy Policy 2004, 32, 1679–1692. [Google Scholar]
- Ma, C.; Shi, D.; Cong, X. The Reaserch on the Generation Cost of Solar Photovoltaic Electricity and a Pathway to Grid Parity. Mod. Econ. Sci. 2014, 36, 85–94. [Google Scholar]
- Weng, Z. Discussion on the Construction of Ecological Civilization. Theor. Ref. 2012, 5, 9–22. [Google Scholar]
- Zhang, Y.; Ning, D.; Vaclan, S. An Estimate of Economic Loss for Desertification in China. China Popul. Resour. Environ. 1996, 6, 45–49. [Google Scholar]
- Lu, X. The Environmental Effect Analysis of PV Power Plant Construction in Desert Gobi—Take Dongdongtan Million Kilowatt Solar Power Demonstration Base, Jiuquan City as An Example; Lanzhou University: Lanzhou, China, 2013. [Google Scholar]
- Ministry of Industry and Information Technology of the People’s Republic of China. Solar Photovoltaic Industry “Twelfth Five-Year” Development Plan; Ministry of Industry and Information Technology of the People’s Republic of China: Beijing, China, 2012.
- Yan, L.; Zhou, X.; Zhang, C.; Fei, W.; Xia, X.; Zhou, F.; Hu, X.; Xu, H.; Huang, C.; Liu, F.; et al. A proposal for planning and constructing a national integrated energy base combined with large-scale photovoltaic power and hydropower in Qinghai province. Adv. Technol. Electr. Eng. Energy 2012, 29, 1–9. [Google Scholar]
- Yan, L.; Zhou, X.; Zhang, C.; Fei, W.; Xia, X.; Zhou, F.; Hu, X.; Xu, H.; Huang, C.; Liu, F.; et al. A proposal for planning and constructing a national integrated energy base combined with large-scale photovoltaic power and hydropower in Qinghai province (continue). Adv. Technol. Electr. Eng. Energy 2011, 30, 8–11. [Google Scholar]
- Zha, L. Regional variations of solar radiation in China. Geogr. Res. 1996, 15, 21–27. [Google Scholar]
- Chen, F.; Ma, Y.; Li, W. Distribution characteristics of solar radiation over Qinghai plateau. Meteorol. Sci. Technol. 2005, 33, 231–234. [Google Scholar]
- Zhang, M.M.; Zhou, D.Q.; Zhou, P.; Liu, G.Q. Optimal feed-in tariff for solar photovoltaic power generation in China: A real options analysis. Energy Policy 2016, 97, 181–192. [Google Scholar] [CrossRef]
- Wang, H.; Yi, H.; Peng, J.; Wang, G.; Liu, Y.; Jiang, H.; Liu, W. Deterministic and probabilistic forecasting of photovoltai power based on deep convolutional neural network. Energy Convers. Manag. 2017, 153, 409–422. [Google Scholar] [CrossRef]
- Li, J.; Yang, X.; Jin, Y.; Yang, Z.; Huang, W.; Zhao, L.; Gao, T.; Yu, H.; Ma, H.; Qin, Z.; et al. Monitoring and analysis of grassland desertification dynamics using Landsat images in Ningxia, China. Remote Sens. Environ. 2013, 138, 19–26. [Google Scholar] [CrossRef]
- Sarver, T.; Al-Qaraghuli, A.L.; Kazmerski, L. A comprehensive review of the impact of dust on the use of solar energy: History, investigations, results, literature, and mitigation approache. Renew. Sustain. Energy Rev. 2013, 22, 698–733. [Google Scholar] [CrossRef]
- Dubey, S.; Sarvaiya, J.N.; Seshadri, B. Temperature Dependent Photovoltaic (PV) Efficiency and Its Effect on PV Production in the World A Review. Energy Procedia 2013, 33, 311–321. [Google Scholar] [CrossRef]
Figure 1.
Binary lattice stochastic process of coal price.

Figure 2.
Binary lattice stochastic process of carbon price.
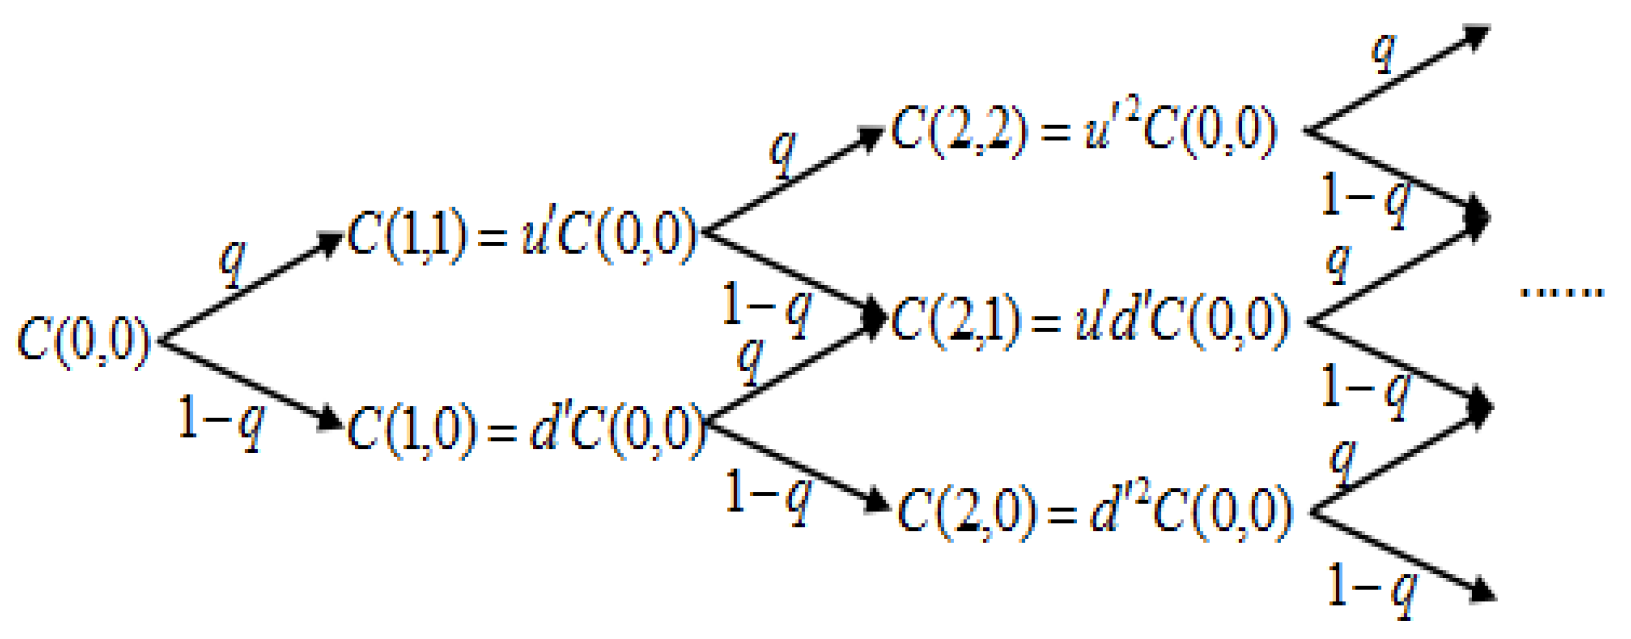
Figure 3.
Photovoltaic (PV) power generation cost in 2016~2030.
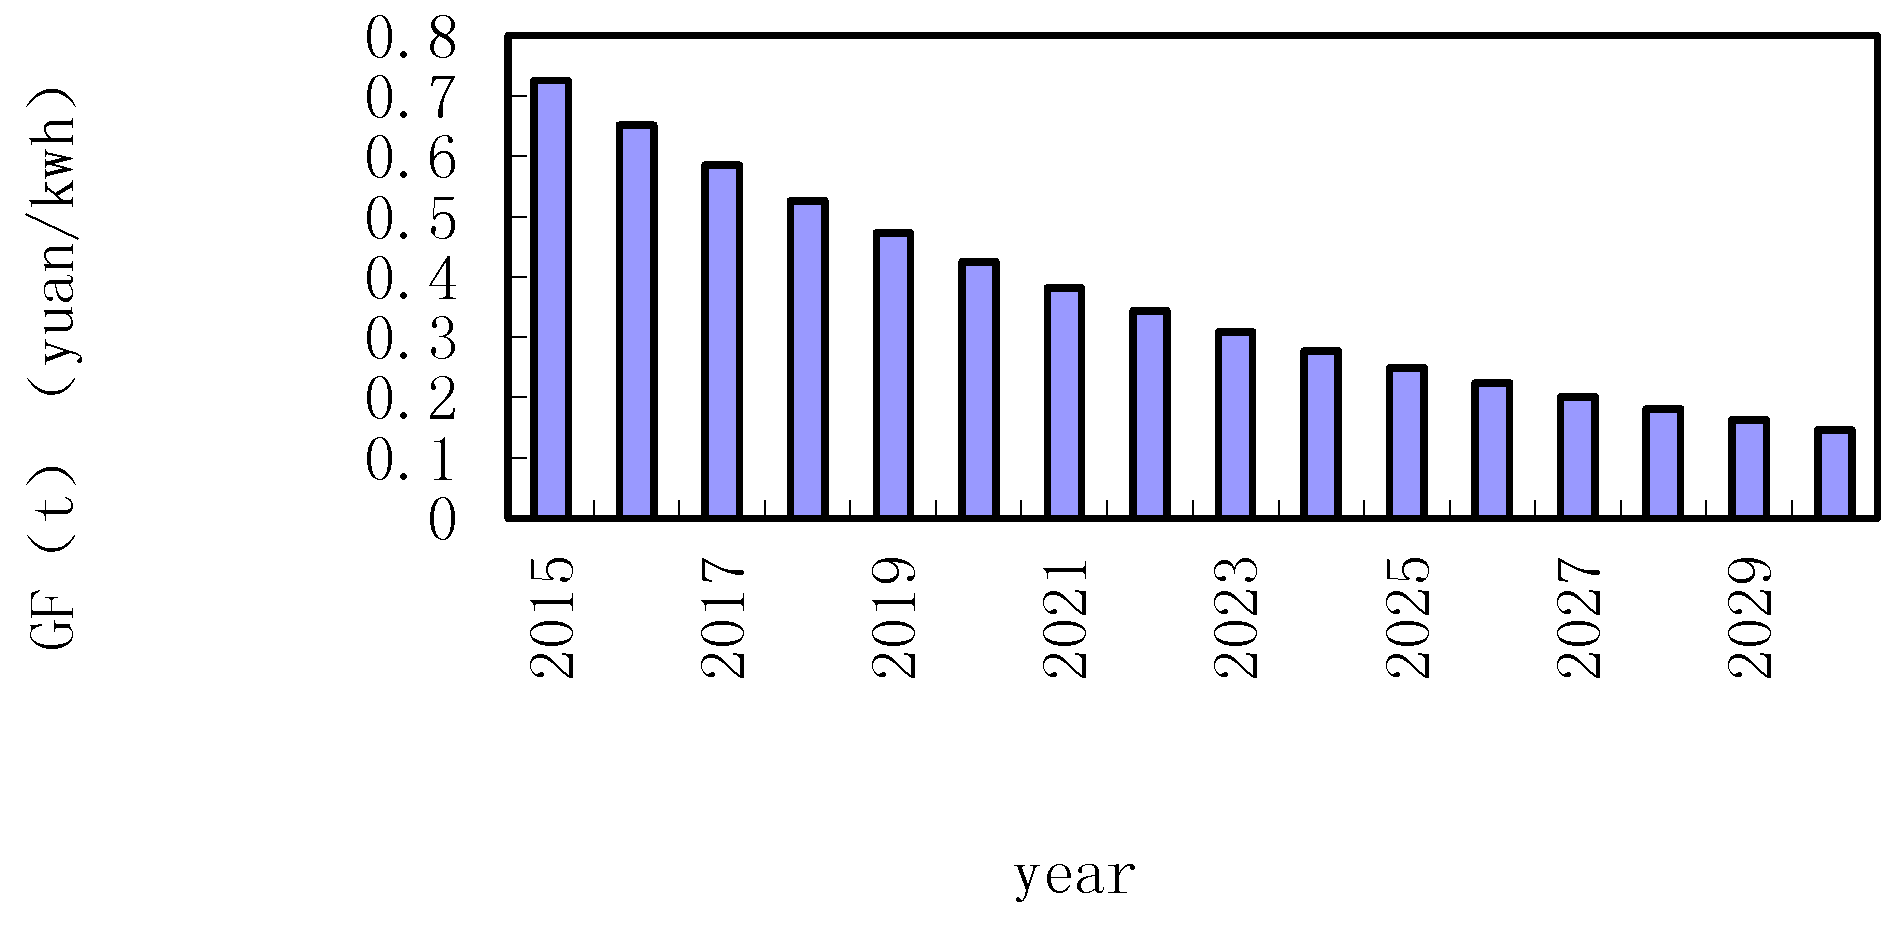
Figure 4.
Stochastic decision process of PV investment project.

Figure 5.
Historical transaction data of carbon emission.

Figure 6.
One-year interest rate adjusted change trend in 1990–2015.

Figure 7.
Curve of the save-path rate based on ROA and NPV.
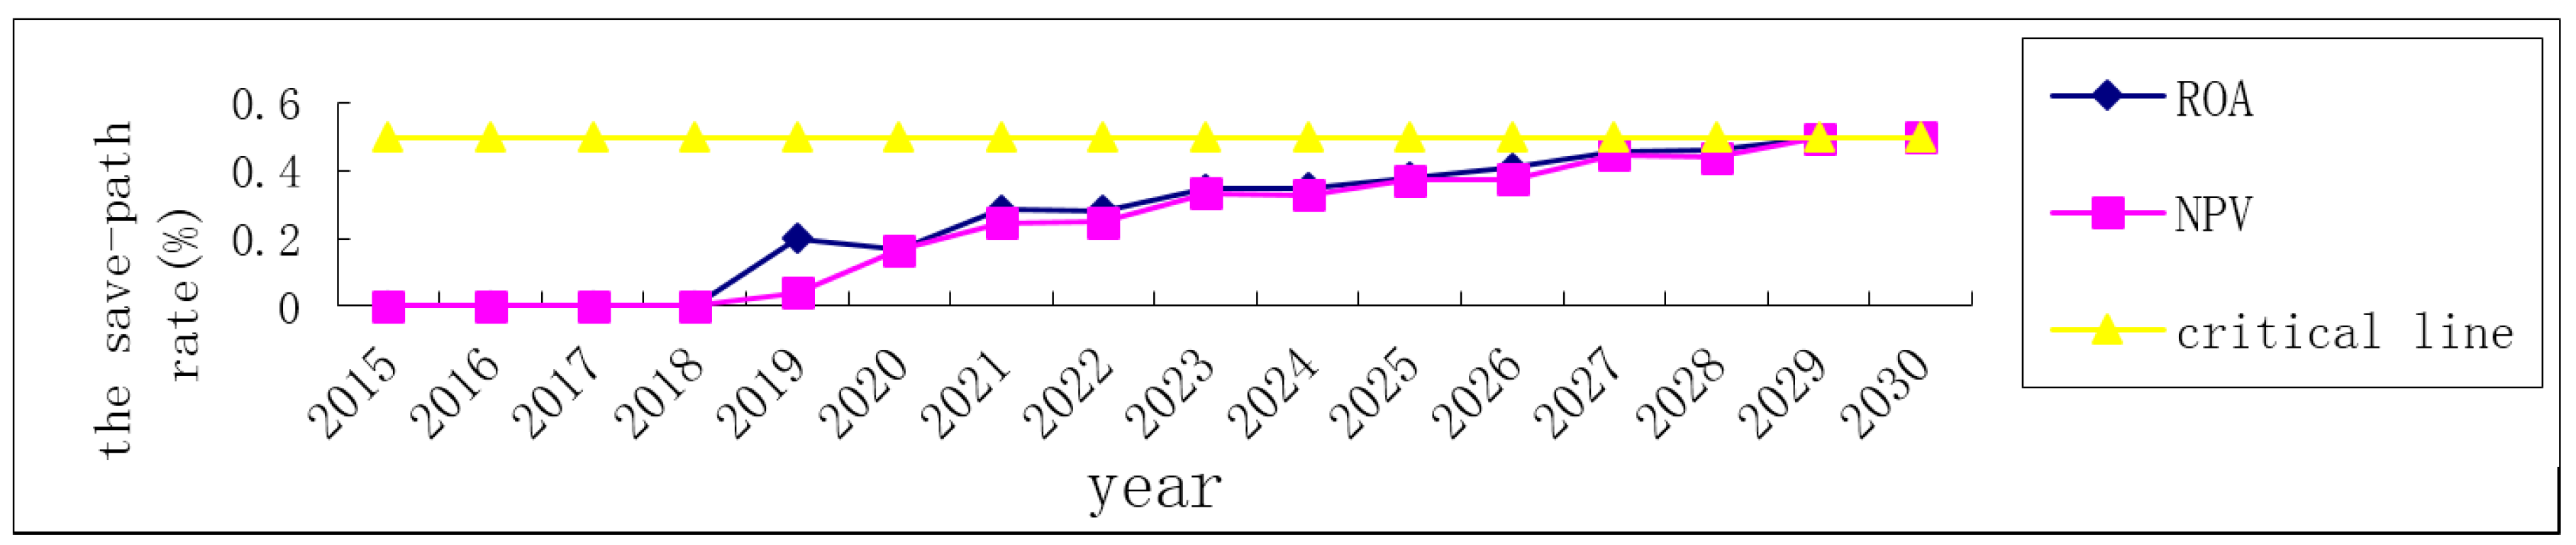
Figure 8.
Unit policy subsidy with linear function fitting and exponential function fitting.

Figure 9.
Curve of the save-path rate for three cases.

Table 1.
Binary tree stochastic process of thermal power generation cost (yuan/kwh).
| 2015 | 2016 | 2017 | 2018 | 2019 | 2020~2028 | 2029 | 2030 |
|---|---|---|---|---|---|---|---|
| 0.20 | 0.22 | 0.24 | 0.26 | 0.28 | … | 0.63 | 0.68 |
| - | 0.19 | 0.20 | 0.22 | 0.24 | … | 0.54 | 0.59 |
| - | - | 0.17 | 0.19 | 0.20 | … | 0.46 | 0.40 |
| - | - | - | 0.16 | 0.17 | … | 0.39 | 0.42 |
| - | - | - | - | 0.15 | … | 0.33 | 0.36 |
| - | - | - | - | - | … | 0.28 | 0.30 |
| - | - | - | - | - | … | 0.24 | 0.26 |
| - | - | - | - | - | … | 0.20 | 0.22 |
| - | - | - | - | - | … | 0.17 | 0.19 |
| - | - | - | - | - | … | … | … |
| - | - | - | - | - | … | - | 0.06 |
Table 2.
Binary tree stochastic process of carbon price (yuan/kwh).
| 2015 | 2016 | 2017 | 2018 | 2019 | 2020~2028 | 2029 | 2030 |
|---|---|---|---|---|---|---|---|
| 0.06 | 0.11 | 0.19 | 0.33 | 0.58 | ... | 166.13 | 292.31 |
| - | 0.035 | 0.06 | 0.11 | 0.19 | ... | 53.66 | 94.42 |
| - | - | 0.02 | 0.03 | 0.06 | ... | 17.33 | 30.50 |
| - | - | - | 0.01 | 0.02 | ... | 5.60 | 9.85 |
| - | - | - | - | 0.01 | ... | 1.81 | 3.18 |
| - | - | - | - | - | ... | 0.58 | 1.03 |
| - | - | - | - | - | ... | 0.19 | 0.33 |
| - | - | - | - | - | ... | 0.06 | 0.11 |
| - | - | - | - | - | ... | 0.02 | 0.03 |
| - | - | - | - | - | ... | ... | ... |
| - | - | - | - | - | ... | - | 1.27 × 10⁻⁵ |
Table 3.
Average feed-in tariff (FIT) (yuan/kwh) and price subsidy (yuan/kwh) for 2015–2020.
| Year | 2015 | 2016 | 2017 | 2018 | 2019 | 2020 |
| Average FIT | 0.95 | 0.92 | 0.89 | 0.87 | 0.84 | 0.81 |
| Unit Price Subsidy | 0.54 | 0.51 | 0.48 | 0.45 | 0.43 | 0.40 |
Table 4.
Unit decision value of the PV project (net present value (NPV)) (yuan/kwh).
| 2015 | 2016 | 2017 | 2018 | 2019 | 2020~2028 | 2029 | 2030 |
|---|---|---|---|---|---|---|---|
| −0.96 | −0.79 | −0.60 | −0.39 | 0.01 | … | 166.25 | 292.50 |
| - | −0.86 | −0.72 | −0.61 | −0.39 | … | 53.78 | 94.61 |
| - | −0.82 | −0.76 | −0.68 | −0.51 | … | 17.45 | 30.68 |
| - | −0.90 | −0.63 | −0.71 | −0.55 | … | 5.72 | 10.04 |
| - | - | −0.76 | −0.46 | −0.57 | … | 1.96 | 3.37 |
| - | - | −0.80 | −0.65 | −0.03 | … | 0.70 | 1.21 |
| - | - | −0.66 | −0.72 | −0.43 | … | 0.31 | 0.52 |
| - | - | −0.79 | −0.75 | −0.56 | … | 0.18 | 0.30 |
| - | - | −0.83 | −0.46 | −0.60 | … | 0.14 | 0.22 |
| - | - | - | … | … | … | … | … |
| - | - | - | - | - | - | - | −0.44 |
Table 5.
Unit decision value of the PV project (real options analysis (ROA)) (yuan/kwh).
| 2015 | 2016 | 2017 | 2018 | 2019 | 2020~2028 | 2029 | 2030 |
|---|---|---|---|---|---|---|---|
| 0 | 0 | 0 | 0 | 0.17 | … | 166.26 | 292.50 |
| - | 0 | 0 | 0 | 0 | … | 53.79 | 94.61 |
| - | 0 | 0 | 0 | 0 | … | 17.46 | 30.68 |
| - | 0 | 0 | 0 | 0 | … | 5.73 | 10.04 |
| - | - | 0 | 0 | 0 | … | 1.94 | 3.39 |
| - | - | 0 | 0 | 0.13 | … | 0.72 | 1.21 |
| - | - | 0 | 0 | 0 | … | 0.32 | 0.52 |
| - | - | 0 | 0 | 0 | … | 0.19 | 0.30 |
| - | - | 0 | 0 | 0.17 | … | 0.15 | 0.22 |
| - | - | - | … | … | … | … | … |
| - | - | - | - | - | - | - | 0 |
© 2018 by the authors. Licensee MDPI, Basel, Switzerland. This article is an open access article distributed under the terms and conditions of the Creative Commons Attribution (CC BY) license (http://creativecommons.org/licenses/by/4.0/).
Share and Cite
MDPI and ACS Style
Li, Y.; Yang, W.; Tian, L.; Yang, J. An Evaluation of Investment in a PV Power Generation Project in the Gobi Desert Using a Real Options Model. Energies 2018, 11, 257. https://doi.org/10.3390/en11010257
AMA Style
Li Y, Yang W, Tian L, Yang J. An Evaluation of Investment in a PV Power Generation Project in the Gobi Desert Using a Real Options Model. Energies. 2018; 11(1):257. https://doi.org/10.3390/en11010257
Chicago/Turabian StyleLi, Yiqing, Weiguo Yang, Lixin Tian, and Jie Yang. 2018. "An Evaluation of Investment in a PV Power Generation Project in the Gobi Desert Using a Real Options Model" Energies 11, no. 1: 257. https://doi.org/10.3390/en11010257
Note that from the first issue of 2016, this journal uses article numbers instead of page numbers. See further details here.