Impact of Thermal Pretreatment Temperatures on Woody Biomass Chemical Composition, Physical Properties and Microstructure


Department of Energy (DOE), National Energy Technology Laboratory (NETL), 626 Cochrans Mill Road, Pittsburgh, PA 15236, USA
*
Author to whom correspondence should be addressed.
Energies 2018, 11(1), 25; https://doi.org/10.3390/en11010025
Submission received: 29 September 2017
/
Revised: 8 December 2017
/
Accepted: 19 December 2017
/
Published: 23 December 2017
(This article belongs to the Special Issue Woody Biomass for Bioenergy Production)
Abstract
:Thermal pretreatment of biomass by torrefaction and low temperature pyrolysis has the potential for generating high quality and more suitable fuels. To utilize a model to describe the complex and dynamic changes taking place during these two treatments for process design, optimization and scale-up, detailed data is needed on the property evolution during treatment of well-defined individual biomass particles. The objectives of this study are to investigate the influence of thermal pretreatment temperatures on wood biomass biochemical compositions, physical properties and microstructure. Wild cherry wood was selected as a model biomass and prepared for this study. The well-defined wood particle samples were consecutively heated at 220, 260, 300, 350, 450 and 550 °C for 0.5 h under nitrogen. Untreated and treated samples were characterized for biochemical composition changes (cellulose, hemicellulose, and lignin) by thermogravimetric analyzer (TGA), physical properties (color, dimensions, weight, density and grindablity), chemical property (proximate analysis and heating value) and microstructural changes by scanning electron microscopy (SEM). Hemicellulose was mostly decomposed in the samples treated at 260 and 300 °C and resulted in the cell walls weakening resulting in improved grindability. The dimensions of the wood were reduced in all directions and shrinkage increased with increased treatment temperature and weight loss. With increased treatment temperature, losses of weight and volume increased and bulk density decreased. The low temperature pyrolyzed wood samples improved solid fuel property with high fuel ratio, which are close to lignite/bituminous coal. Morphology of the wood remained intact through the treatment range but the cell walls were thinner. These results will improve the understanding of the property changes of the biomass during pretreatment and will help to develop models for process simulation and potential application of the treated biomass.
1. Introduction
Biomass is a renewable fuel and carbon natural because it consumes CO2 from the atmosphere during growth. CO2 as a primary greenhouse gas (GHG) is widely believed to be a major contributor to climate change. Reducing CO2 emissions is the main advantage of utilizing biomass. Biomass can be converted to gas or liquid fuels (using gasification, anaerobic digestion, pyrolysis, fermentation and transesterification), heat and power, and chemicals. Heat and power generation for industrial and utility-scale applications primarily use direct combustion or co-firing (replacing a portion of the coal with biomass in coal-fired plants) [1]. Recently, the United Kingdom started using wood pellets in co-firing and in dedicated biomass power plants to meet the European Commission’s 2020 climate and energy plan, which primarily is a reduction in GHG and an increase of renewable energy usage in total energy consumption [2]. In the U.S, biomass (wood and waste) was used to generate about 1.5% of the total power output in 2016 [3]. To increase domestic biomass utilization, the development of technologies to reduce its cost and increase its utilization efficiency is required.
Developing large-scale (>50 MW) biomass power plants and co-firing may allow for power generation at high efficiencies and relatively low costs [1]. In addition, reducing biomass feedstock processing and transportation costs might help to further lower power generation cost. Biomass is generally considered a low quality fuel mainly due to its lower energy density which is attributed to a high moisture content, less carbon, more oxygen, lower density and lower heating value [4]. These characteristics contribute to inefficiencies associated with transportation, handling, storage and conversion of biomass in an efficient and economic manner. High transportation cost results in less biomass being collected and utilized. Biomass combustion yields a lower flame temperature which results in decreased thermal efficiency [5]. Gasification of biomass results in a lower quality syngas with a high tar concentration [6]. For a pulverized coal (PC) boiler, used by the majority of coal power plants, or an entrained-flow gasifier (used in integrated gasification combined cycle (IGCC)), the average coal particle size is required to be less than 100 µm (0.1 mm) [7,8]. Reducing biomass particle size to below 0.2 mm without pretreatment is difficult and costly because biomass is fibrous and compressible [9]. Torrefaction and low temperature pyrolysis carbonization processes have been proposed as pretreatment methods that could potentially address these issues [5,10,11,12,13,14,15].
Torrefaction has been extensively investigated in recent years and was reviewed by Madanayake [16], Chen [15], Chew [14] and Van der Stelt [13]. It has been successfully tested and demonstrated in pilot scale and (semi)commercial facilities [17]. Torrefaction is a mild pyrolysis which takes place at 200 to 300 °C in an inert or non-oxidative environment with the aim of producing torrefied biomass (solid) as the primary product [13,15,18,19]. It focuses on improving physicochemical properties of biomass including increased energy density, improved grindability, and higher hydrophobicity [5,18,20,21]. The heating value of torrefied woody biomass can be increased by 37% compared to the untreated wood [16,22]. For wood treated at 240 °C for 0.5 h and ground, the percentage of particles less than 415 μm (0.415 mm) and 150 μm (0.150 mm) were double that of untreated wood [22]. Torrefaction research has been focused on experimental studies of process conditions (temperature, gas environment and time), comparison of various biomass species and their major components, characterization of the products, and applying the torrefied biomass in densification, co-firing in coal power plant, gasification and ironmaking [15,16]. Using torrefied biomass pellets could improve gasification in terms of both energy efficiency and syngas quality because of the removal of oxygenated volatile compounds [15,23]. In addition to non-oxidative or conventional torrefaction, researchers have recently investigated oxidative torrefaction, wet torrefaction, and steam torrefaction to develop alternative technologies to upgrade biomass [15].
Low temperature pyrolysis with the aim of producing biochar (solid) as the primary product occurs in the range of 300 to 500 °C [10,12,19]. It significantly improves fuel combustion properties with increased thermal conversion efficiency [5,24]. It generates biochar with higher carbon content (FC-fixed carbon) and fuel ratio (FC/VM-volatile matter) compared to torrefied biomass [19]. Chars produced by torrefaction at 300 °C or pyrolysis below 500 °C have fuel properties such as fuel ratio, burnout and ignition temperature that fall between a high-volatile and a low-volatile bituminous coal [19]. Biochar produced at 350 °C had higher combustion rate than the torrefied woody biomass at 275 °C [12]. Treatment temperature is the key difference defining torrefaction and low temperature pyrolysis. The temperature ranges of the reported studies were 300–500 °C [10], 200–400 °C [12], 200–330 °C [5], and 250–300/400–500 °C [19]. Fundamental studies spanning the temperature ranges of both of these processes (200 to 500 °C) are lacking, therefore, the primary focus of this study is to address this deficiency.
Computer modeling is the primary approach along with experimentation to help with fuel conversion process design, optimization and scale-up [25,26,27]. Experimental studies are necessary to understand the processes and to obtain experimental data needed to develop and validate the models. To completely describe the complex and dynamic process by a model, a biomass particle with controlled, well documented characteristics is used to follow the evolution of the individual particles through pyrolysis [25], combustion [26] and gasification [27]. A similar experimental method was applied for this pretreatment study. The most commonly reported experimental studies have investigated small amounts of milled small particles (for example <500 µm (<0.500 mm), 15 g) [22,24,28,29] or larger amounts of chips/blocks (for example 10 mm × 20 mm × 3 mm, 80 g) [10,12,20].To address the lack of fundamental data, this study utilized well defined wood particle samples to obtain torrefaction and low temperature pyrolysis data to thoroughly understand the processes and aid future modeling studies. Physical (appearance, weight, size, grindability) and chemical properties (chemical composition and proximate analysis), and heating value of the untreated and treated woods were investigated. The variations in shrinkage in the three sample reference directions are included because the shrinkage affects heat transfer to the particle and gas flow within the particle [25]. The shrinkage as a function of the mass loss was addressed in this study because the shrinkage is caused by loss of water and a portion of the mass of the biomass due to decomposition to volatiles. These parameters are important for modeling studies.
Wood and wood residues are one of the major sources of biomass [30]. Wood is essentially a series of elongated tubular fibers or cells aligned with the axis or longitudinal direction of the tree trunk and cemented together [31,32]. Each cell wall is composed of various quantities of three polymers: cellulose, hemicellulose, and lignin [32]. Cellulose is the basic structural component of all wood cell walls and primarily responsible for the strength of wood. Hemicellulose acts as a matrix for the cellulose and increases the packing density of the cell walls. Lignin acts as a glue which holds wood fibers together. Thermal treatments of wood cause the thermal degradation of the three cell wall polymers and result in physical and chemical changes of the wood. The physical changes in size, density, and grindability impact supply, handling and conversion of wood. The changes in biochemical composition significantly affect the wood properties and its conversion process. The high heating values of lignin are reported to be higher than the cellulose and hemicellulose due to higher degree of oxidation of the cellulose and hemicellulose [4]. The air-steam gasification conversions of cellulose, hemicellulose and lignin on a carbon basis are 97.9%, 92.2%, and 52.8%, respectively [33]. The product gas composition from cellulose in mol % is 35.5% CO, 27.0% CO2, and 28.7% H2 and from hemicellulose and lignin are approximately 25% CO, 36% CO2, and 32% H2. Pure cellulose produces a lower tar concentration in the syngas compared to beech and willow, which may be due to the hemicellulose and lignin content [6]. Study of the cell wall composition of the untreated and treated wood samples will aid in understanding the cause of treated wood property changes. The biochemical composition of biomass can be characterized using a thermogravimetric analyzer (TGA) [34,35]. Chen et al. qualitatively studied the composition of torrefied biomass (<150 µm, bamboo, banyan and willow) at 250, 275 and 300 °C using a TGA [28]. Mafu et al. quantitatively analyzed torrefied biomass (<500 µm (<0.500 mm), softwood chips, hardwood chips and sweet sorghum bagasse) at 260 °C using the ‘food industry’ chemical method [29]. For simplicity, this study utilized the TGA method.
Thermal pretreatments affect the biomass properties (such as shrinkage and grindablity) on a microscopic scale as well as on a macroscopic scale. Study of microstructural transformations will allow insight into the structural features and mechanisms responsible for the property changes. Microstructural transformations that occur during thermal degradation of the biomass are commonly observed using a scanning electron microscope (SEM) [36]. For this study, the same analysis locations in the three sample directions were followed during treatments so that change could be correlated to the different structures in each direction; a more detailed SEM analysis approach than typically reported [28,37]. The objectives of this study are to investigate a single wood particles over a range encompassing temperatures of torrefaction and low temperature pyrolysis; analyze the cell wall compositional changes for the treated woods using TGA; characterize physical and chemical property changes of the treated wood; and to examine the morphological changes of the wood samples during the thermal treatment process using SEM. These results improve the understanding of the property changes of the biomass during pretreatment and will help to develop models for process simulation and the treated biomass applications.
2. Experimental
This study focused on thermal treatment temperatures. Selected treatment temperatures were 220, 260, 300, 350, 450 and 550 °C. Selection of a wide range of temperatures was used to investigate both torrefaction and low temperature pyrolysis. The torrefaction temperatures of 220, 260, and 300 °C were selected to present light (200–235 °C), mild (235–275 °C), and severe (275–300 °C) torrefaction [15] and are considered temperatures reported in most studies [14,15]. The temperatures of pyrolysis were chosen based on reported studies of biochar fuel characteristics for direct combustion and co-firing with coal [10,12,19]. The pyrolysis temperature range is typically considered to be 350 to 650 °C [38]. After each of the thermal treatments, the samples were characterized and compared with untreated wood samples to evaluate property changes. The characterizations included biochemical composition/cell wall composition; physical (weight loss, color, dimensions/size, bulk density, and grindability) and chemical properties (proximate analysis and high heating value); and microstructual transformation.
2.1. Sample Preparation
Cherry wood (Prunus serotina; identification based on bark and wood), obtained locally in Pittsburgh, Pennsylvania, was selected as a model for this study. This relatively fast growing species is very common throughout the eastern United States and Canada and therefore has potential to be utilized as a biomass source. The wood samples used in this study were prepared by the following method (Figure 1). First, a 16-mm thick slice of wood was cut across the grain (longitudinal cell); second, an approximately 7 mm tangential section was split from the heartwood along an annual ring; and, finally, eighteen pieces having dimensions of about 16 mm × 7 mm × 5 mm (length, width, thickness) were split from the section. Samples were produced by splitting to avoid saw blade damage to the surfaces. The purpose of taking the samples from a single tangential section in the heartwood was to limit the effects of the natural variability of the wood and improve the reproducibility of results. For the eighteen samples (as illustrated in Figure 1), fourteen samples (1–7) (two sets) were used for biochemical composition/cell wall composition (1 set of 7), and proximate analysis and grindability (1 set of 7). Two samples (8–9) were used for the physical properties tests (weight, color, and size), and two samples (10–11) were used for the microstructure SEM analysis.
2.2. Thermal Treatment
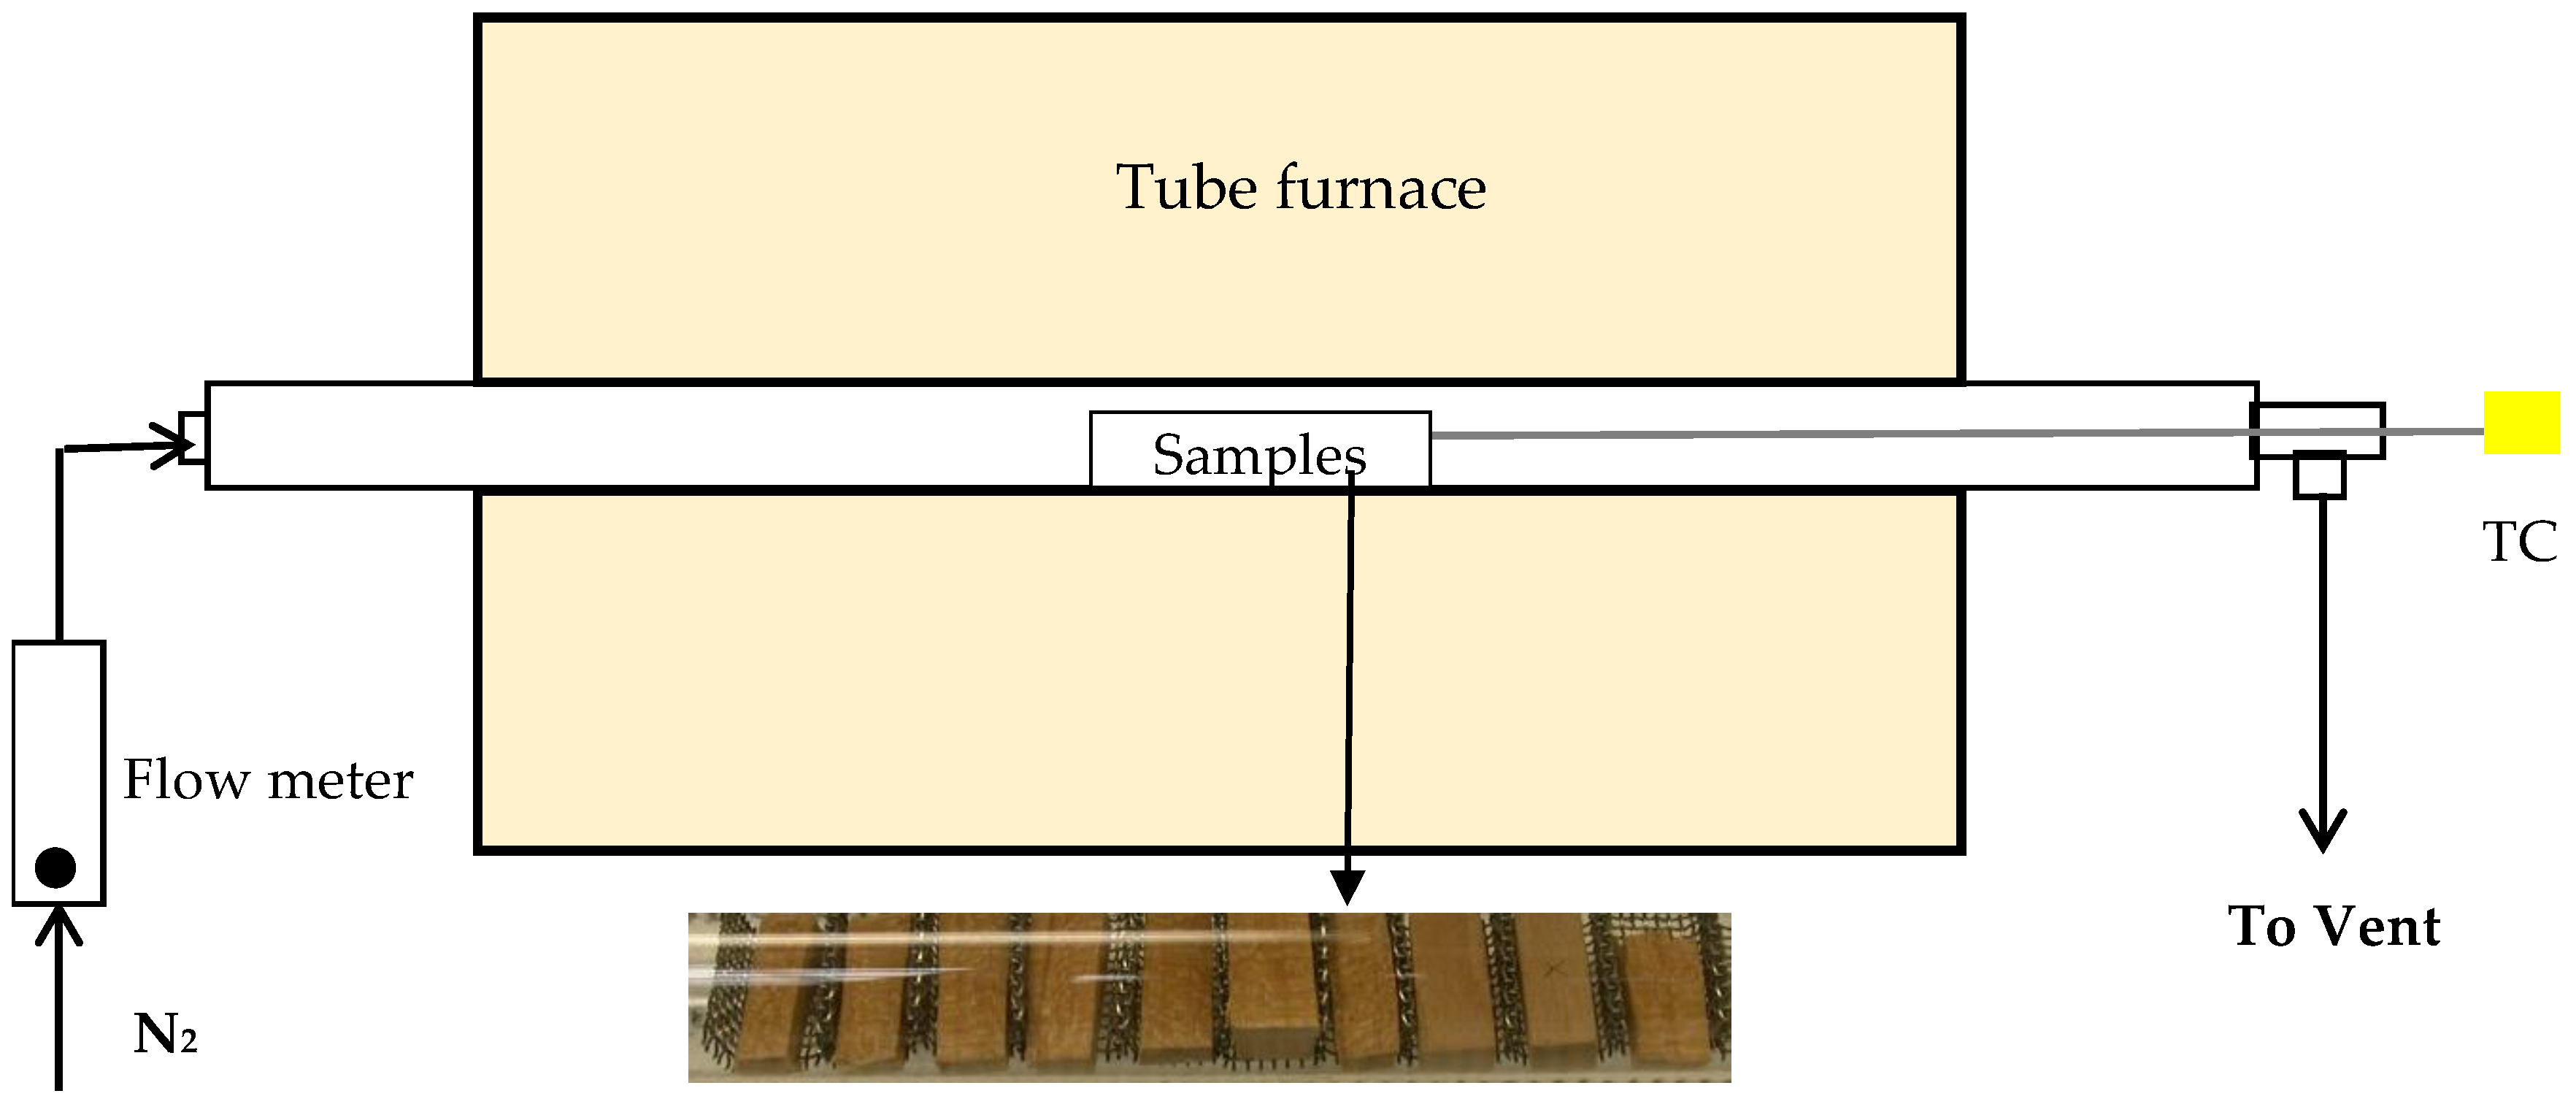
Figure 2 shows a schematic diagram of the thermal treatment experimental setup. The cherry wood samples were successively treated at 220, 260, 300, 350, 450 and 550 °C for 0.5 h for each temperature under flowing nitrogen in a quartz tube furnace. The samples were placed in a holder (Figure 2) and loaded into the middle of the tube at a fixed location and continuously purged with N2 at a 50 mL/min flow rate for 0.5 h at room temperature to remove oxygen. Once the furnace reached the target temperature measured with a thermocouple, the quartz tube with the samples was placed in the furnace. When the samples reached the selected temperature, which was measured by a thermocouple placed close to the sample holder, they were held for 0.5 h. The treatment time was the same for all treatments since the treatment temperature is the more critical variable for torrefaction [15]. It was selected based on previously reported woody biomass torrefaction [22] and low temperature pyrolysis studies [12]. Torrefaction time is normally less than 1 h because the biomass thermal decomposition rate is initially fast, slowing after about 1 h [15]. A half hour was selected as the optimal time for torrefaction based on the improvement of grindability, the mass and energy yields [22]. A half hour treatment time was also used in a study of forest biomass grindability and fuel characteristics at torrefaction temperatures from 225 to 300 °C [20]. After the 0.5 h treatment, the tube was removed from the furnace and quickly cooled to room temperature under flowing N2. The treated samples were stored in a desiccator.
2.3. Characterization and Analysis of the Chars Generated from Thermal Reatments
After each treatment, the samples were characterized. Untreated wood (1, untreated 8–11) was used as a reference. For the twelve samples (2–7), one sample was removed after each temperature treatment in the sequence; therefore, each sample at a given temperature was cumulatively exposed to all the thermal treatments at lower temperatures. Two samples (8–9) were used to characterize physical property changes. The remaining two samples (10–11) were used for study of microstructural changes. These four samples (8–11) were taken through all the temperature treatments and examined after each step.
2.3.1. Cell Wall Component Decomposition Study of Untreated and Treated Woods by TGA and Differential Scanning Calorimetry (DSC)
For cell wall compositional changes, samples of approximately 10 mg were tested in the TGA (Perkin Elmer Pyris 1 TGA, PerkinElmer Inc., Shelton, CT, USA) using a non-isothermal method. Before the TGA test, the untreated and treated wood samples (1–7) were manually ground with a double-cut flat file and sieved through a 60 mesh screen (less than 250 µm). Samples were heated at a 2 °C/min from 25 to 800 °C under nitrogen with a total flow rate of approximately 125 mL/min. A slow heating rate was selected to clearly identify model components that thermally decompose over different temperature ranges. This rate was much lower than others reported (20 °C/min) [28,34].
Model compounds representing typical cell wall compositions were also analyzed by TGA to aid in identifying cell wall component changes in the treated wood samples. Cellulose (fibrous, long and medium), xylan from birch and beech (used as a model for hemicelluloses), and lignin (alkali) were selected as the model components. Both birch and beech are hardwoods and the use of xylans was to better represent hemicellulose because hemicellulose may be different between different types of biomass. All model compounds were purchased from Sigma-Aldrich (St. Louis, MO, USA).
Percent weight for each cell wall chemical component was calculated by weight loss in designated temperature ranges that correlate to the cell wall components from TGA analysis [34]. The designated temperature ranges were selected based on differential thermogravimetry (DTG) curves vs. temperature of the model cell wall components. Weight loss in each temperature range of the component was calculated by area in the range of DTG curve for the samples because the sample was heated at a slow constant rate and temperatures were linear with time. In this study, the area was adjusted based on the distribution of the model lignin in the designated temperature ranges because the lignin slowly decomposes over all temperature ranges (results shown in Section 3.1). Percent weight (dry basis) for the component was calculated by the weight loss in the temperature range of the component over the total weight loss in all designated temperature ranges (200–800 °C). The value of this method has been demonstrated with other biomass materials such as untreated and thermally treated switchgrass and cherry bark in our laboratory.
For differential scanning calorimetry (DSC) (Perkin Elmer Pyris Diamond DSC, PerkinElmer Inc., Shelton, CT, USA), the samples were tested at the same conditions as was used for TGA but over a temperature range of 25 to 600 °C. The DSC tests were used to further understand the thermal behaviors of biomass torrefaction and low temperature pyrolysis. All TGA and DSC experiments were performed in duplicate.
2.3.2. Physical Properties (Color, Weight, Dimensions, Bulk Density and Grindbility) of Untreated and Treated Woods
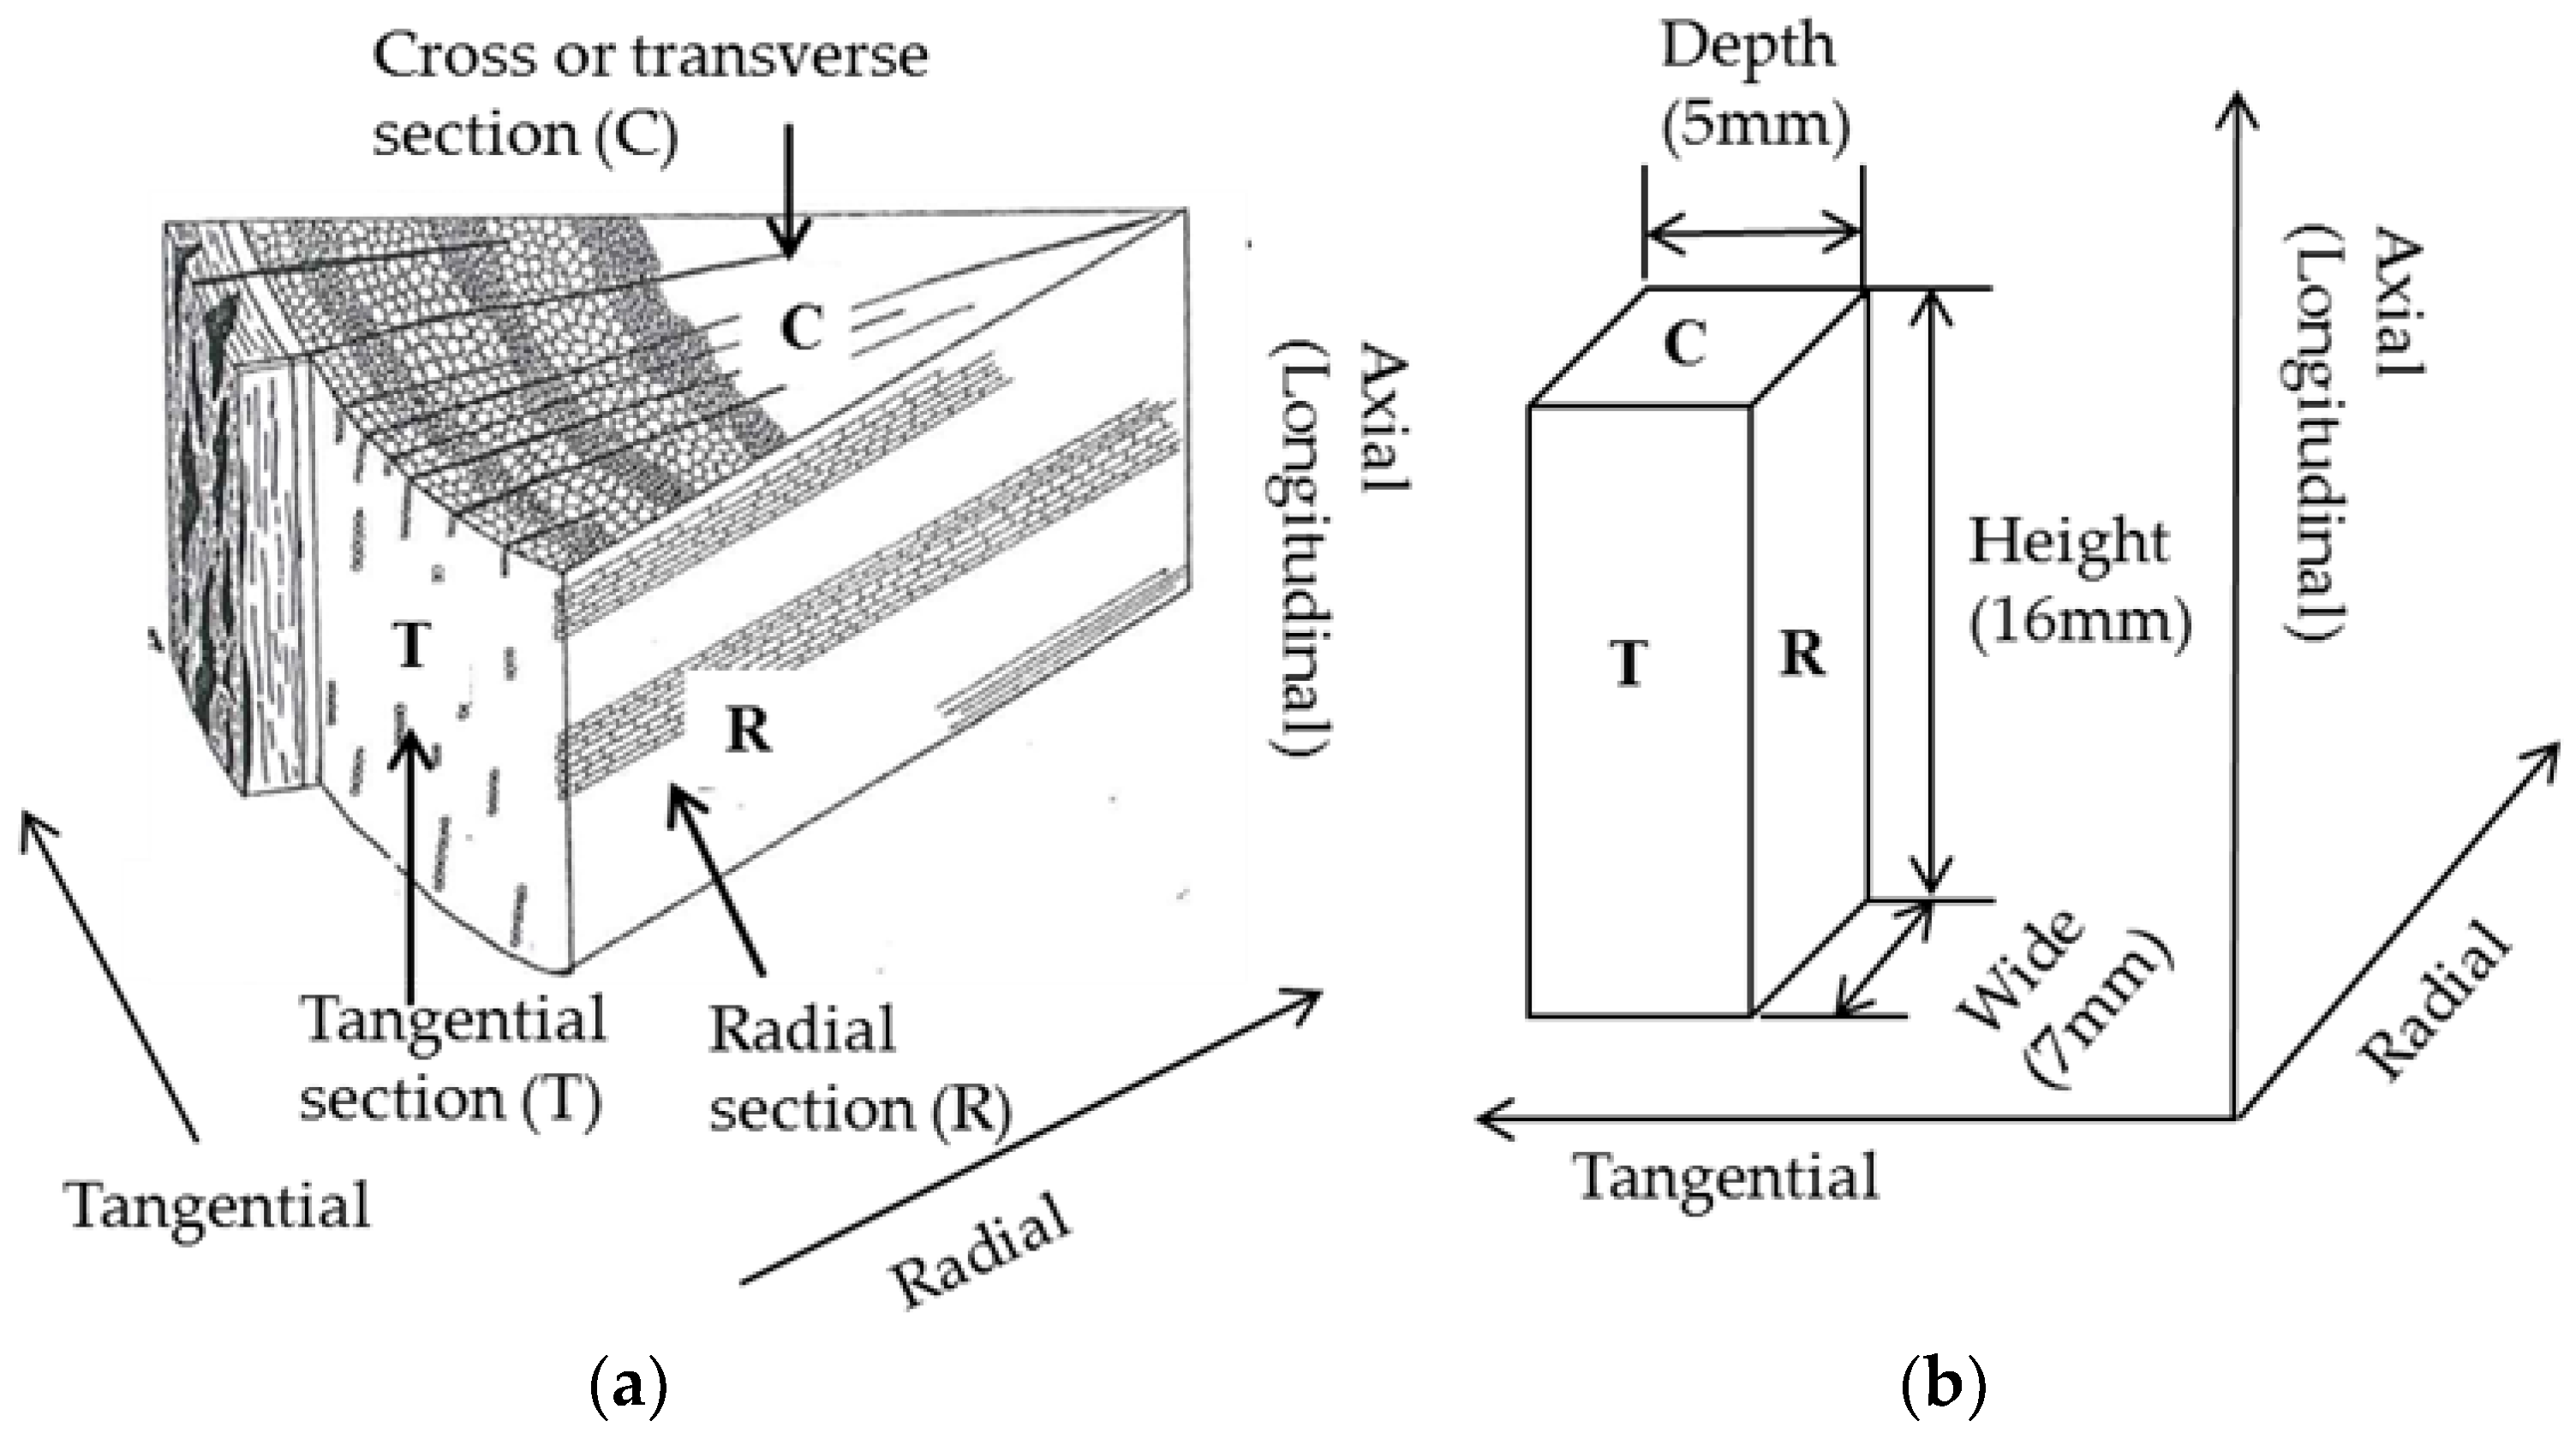
For physical changes, sample color was recorded using a digital camera and the dimensions measured using a digital caliper. After each treatment, the sample was weighed and weight loss percentage was calculated by the weight of treated sample over the untreated sample (mass yield = 100 − weight loss percentage). Dimensions of the samples are presented as height along the axial (longitudinal) direction, width along the radial direction and depth along the tangential direction (Figure 3) [39]. Bulk densities of the samples were calculated based on the measured weights and dimensions, however, due to the variations in sample shapes, the calculated bulk densities are approximate. The results of the bulk density measurement were used to estimate heating value in a volumetric basis. The physical property tests were performed in duplicate using samples (7–8). One sample was marked with a small “X” using a scalpel to differentiate it from the other.
Grindability testing of untreated and treated particles (1–7) was conducted using a hammer mill (Kinematica AG Polymix PX-MFC 90D, Luzernerstrasse, Switzerland) with a 0.8 mm bottom sieve at a rotational speed of about 1500 rpm. After milling, the samples were sieved using 500, 260 and 106 µm screen to four size fractions: >500 µm, 500–212 µm, 212–106 µm and <106 µm. Each fraction was weighted and its weight percentage was calculated over total sample weight to obtain particle size distribution for the sample. The fine particle size weight percentages of treated samples were compared with the untreated sample to evaluate the grindability changes resulting from treatment. The grindability test was performed one time for each treatment. However, multiple preliminary tests were conducted to determine the best grindability test method.
2.3.3. Proximate Analysis and High Heating Value of Untreated and Treated Woods
For chemical property changes, proximate analysis (moisture content (MC), volatile matter (VM), fixed carbon (FC) and ash) was conducted by TGA (TA DSC-TGA Q600). The ASTM D-3172 (ASTM International, West Conshohocken, PA, USA) procedure for coal and coke was used. The samples used for the proximate analysis were from the grindablity tests. Approximately, 10 mg of ground sample with a size of <212 µm was placed in an alumina crucible for testing. MC and VM were tested at 105 and 950 °C, respectively, in Ar. Ashing was conducted at 750 °C in 22% O2 with Ar balance. FC was calculated on a dry basis by subtracting ash and VM percentages. The proximate analyses were performed in duplicate.
High heating value (HHV) was calculated using proximate analyses and cell wall composition (structure analysis) data. This is simple method for the estimation of caloric value and is acceptable for engineering estimations of net heating value of a biomass fuel [40]. In this paper, the correlation proposed based on structural analysis (lignin content) (Equation (1)) [41] and the proximate analysis (Equation (2)) [42] were selected. Those correlations developed based on raw biomass are also applicable to the estimation of the HHV of torrefied biomass [15].
For wood,
where HHV (MJ/kg) is the energy content on a dry-ash-free and extractive-free basis. L (wt %) is lignin content of biomass on a dry basis.
where HHV (MJ/kg) is the energy content on a dry basis. FC (wt %), VM (wt %) and ash (wt %) are fixed carbon, volatile matter and ash on a dry basis, respectively.
HHV = 0.0893 (L) +16.9742
HHV = 0.3536FC + 0.1559VM − 0.0078Ash
2.3.4. Microstructual Transformations Study Using SEM
For the SEM analyses (FEI Company (Thermo Fisher Scientific, Waltham, Massachusetts, USA) Quanta 600 field emission scanning electron microscope, low vacuum mode, secondary electron detector), three plane sections on the wood sample (tangential, radial, and cross or transverse) and twelve analysis spots for each section were examined using six magnifications at each spot resulting in a total of 216 images. The tangential plane section of the wood sample (10) (with the rough edge, indicated by the arrow in Figure 1) was prepared by manually breaking it to preserve its microstructure. The sample (11) was used for the microstructure study of the radial and transverse plane sections of the wood sample (indicated by the arrow in Figure 1). To allow the same analysis sites to be followed through all the treatment steps, small reference marks were made on the samples with a scalpel. Low magnification images were collected and a reference map was constructed allowing the reference marks and obvious features to be utilized for the relocation of the analysis sites following each treatment step. Following the changes observed at the same analysis spots through the thermal treatment steps allows correlation of the observed changes with other measured characteristics. These results contribute to the understanding of the property changes of the biomass during treatment.
3. Results and Discussions
3.1. Cell Wall Component Composition Study of Untreated and Treated Woods by TGA and DSC
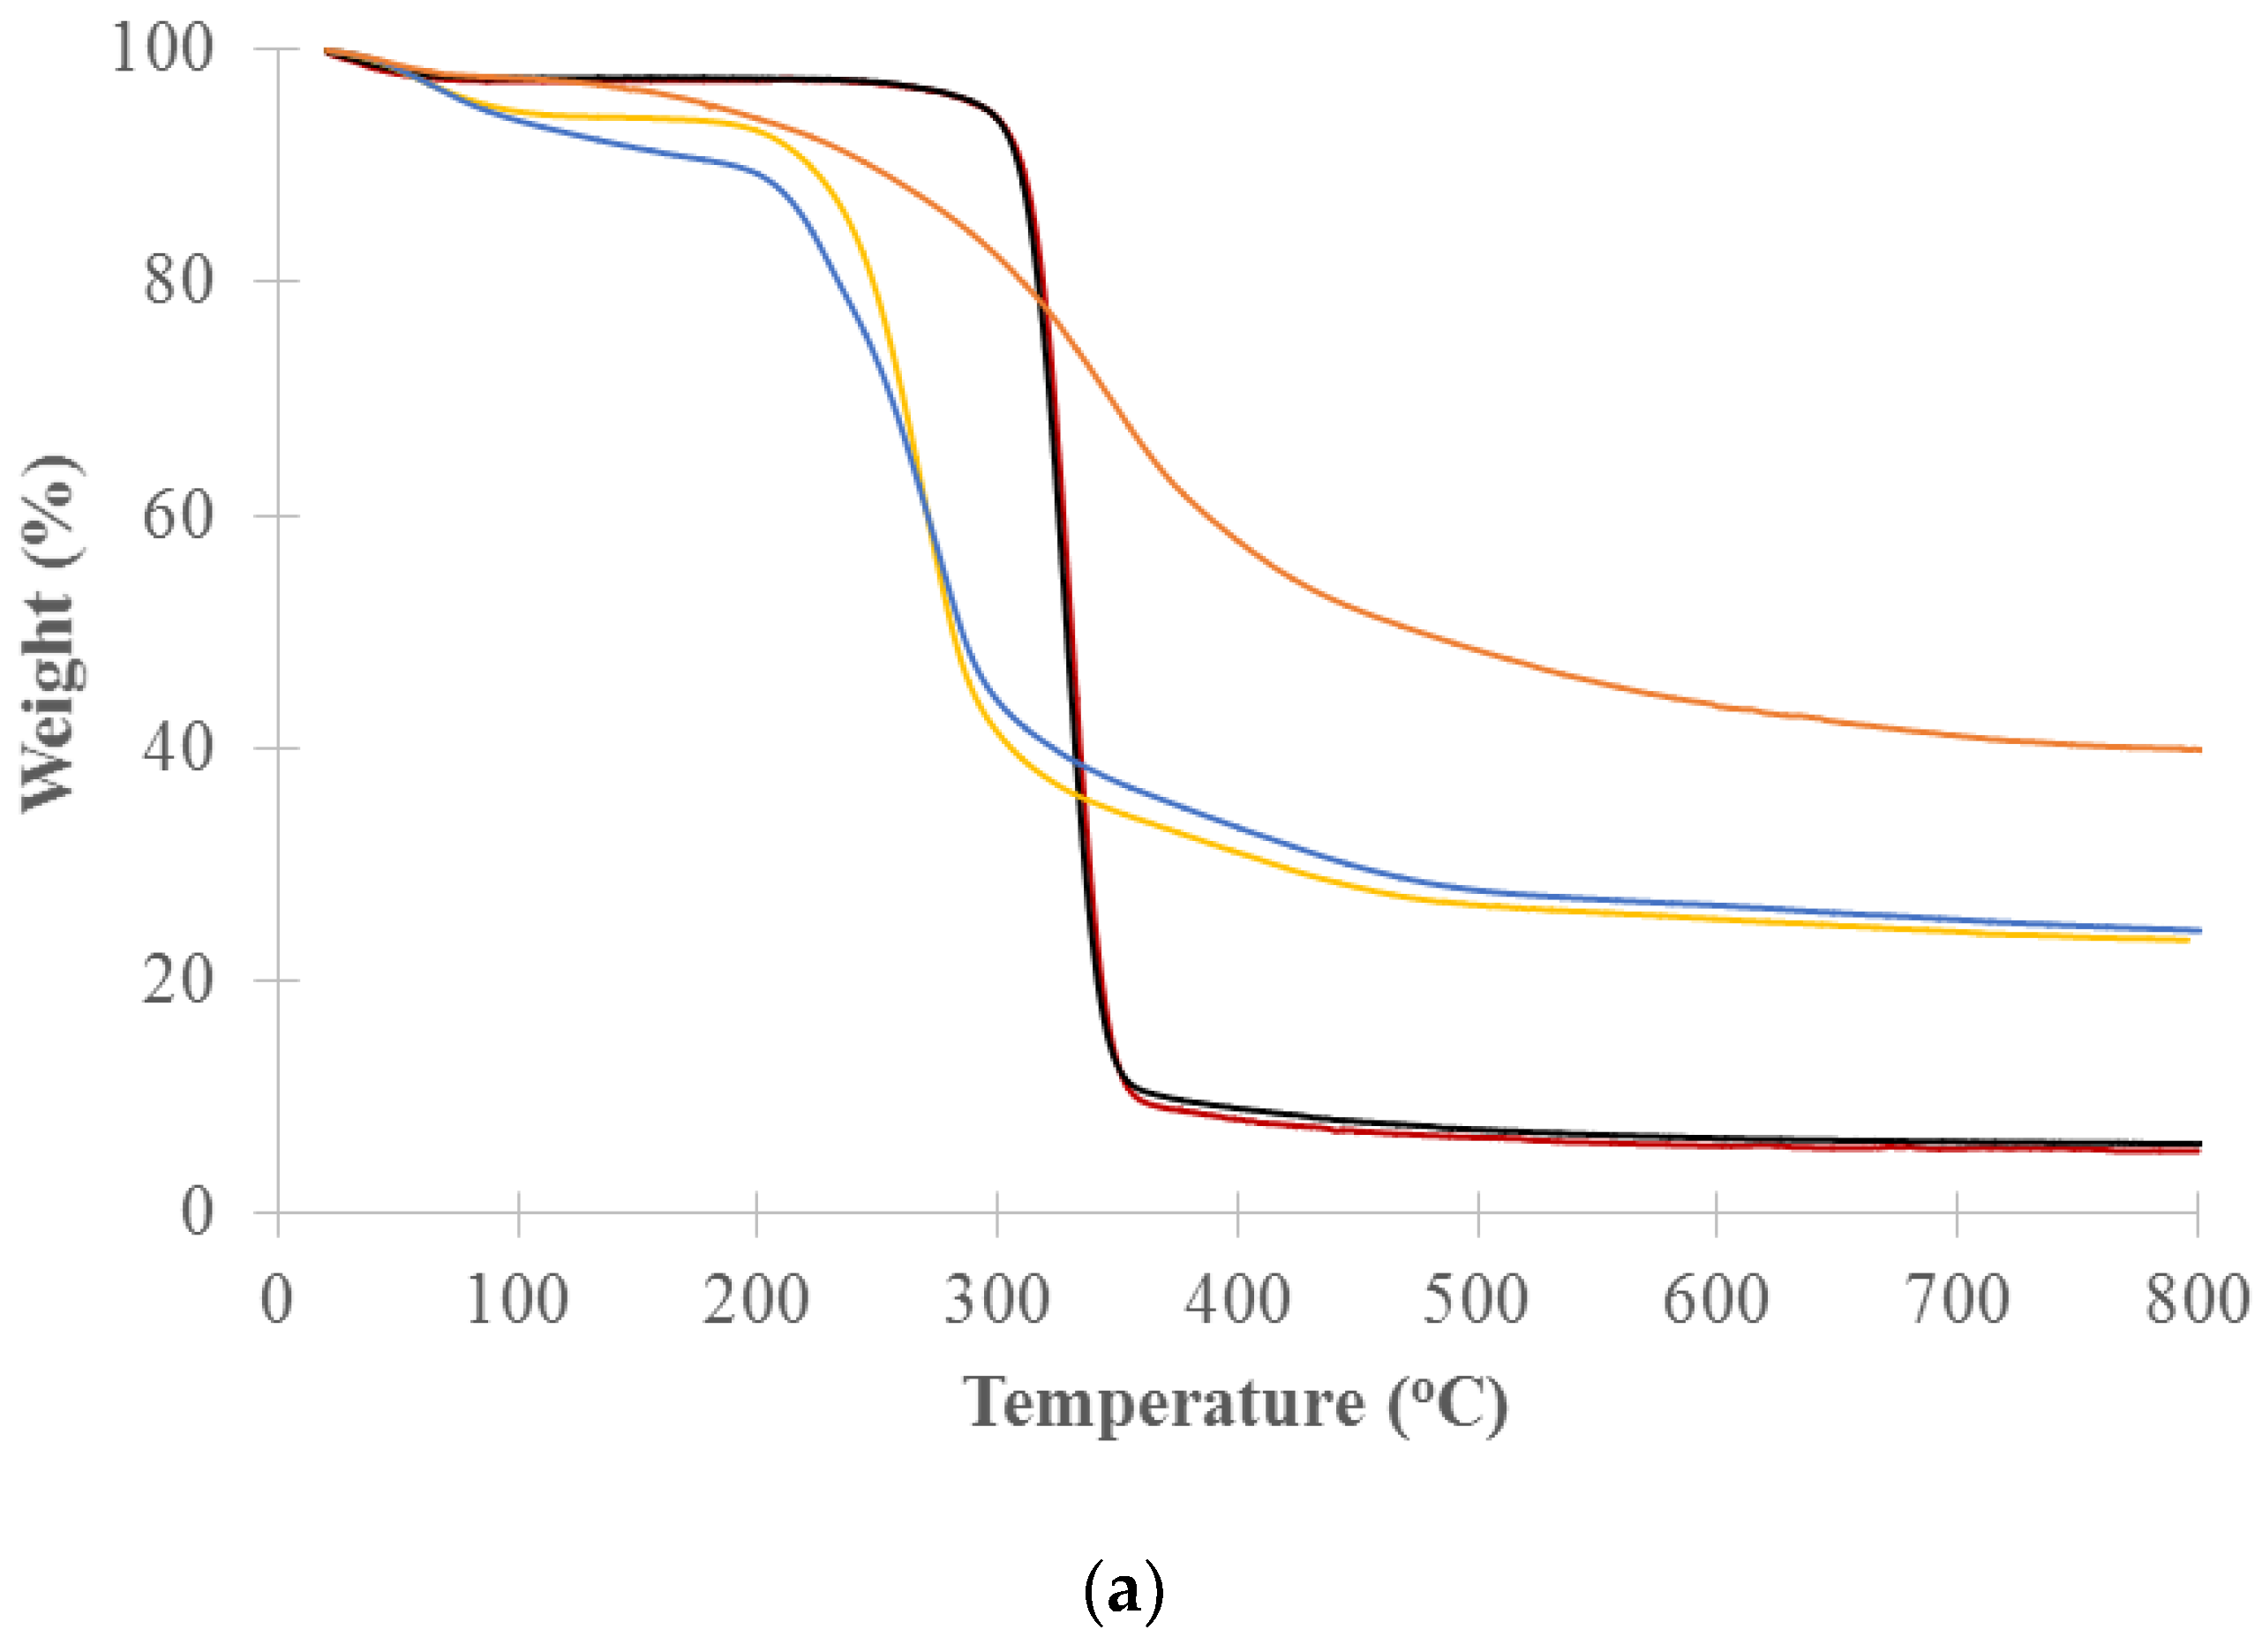
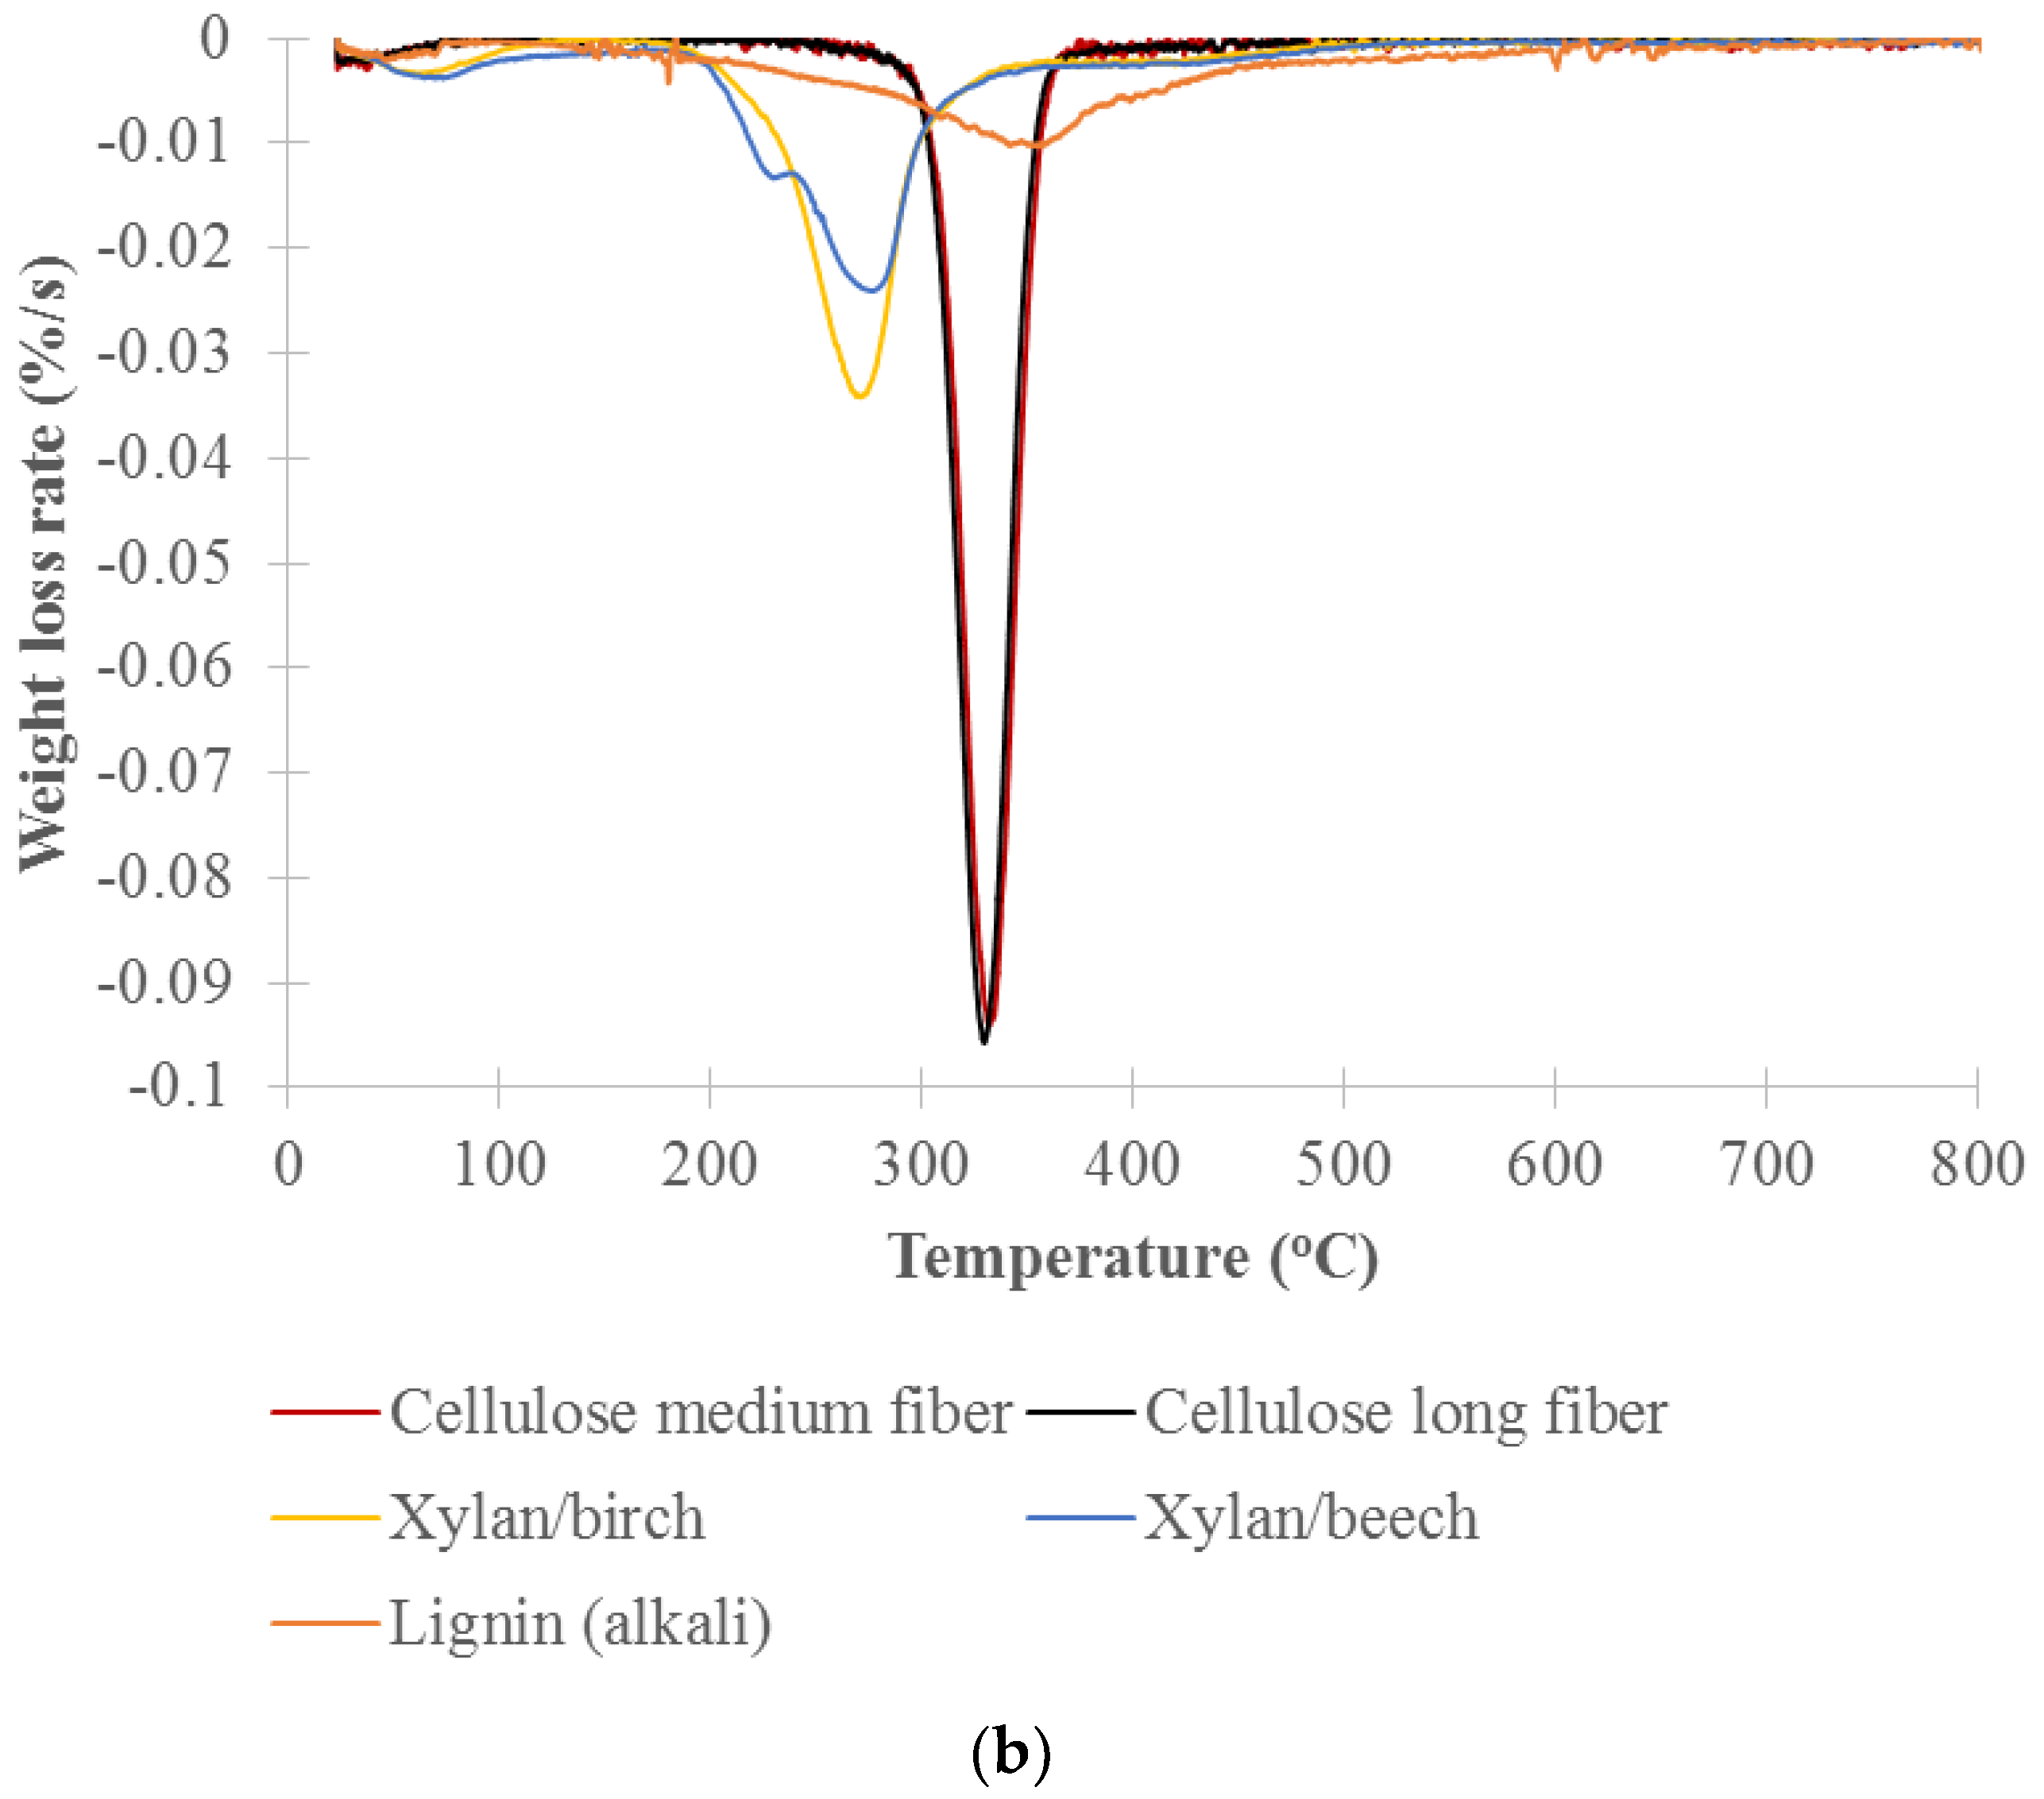
TGA analysis of the decomposition of pure cellulose, xylan and lignin was used to identify the temperature ranges that will be used for the cell well composition analysis of untreated and treated woods. Figure 4 shows the thermogravimetry (TG) and the differential thermogravimetry (DTG) curves vs. temperature for long and medium cellulose fibers, xylans from beech and birch wood (representing hemicelluloses) and lignin (alkali). The DTG curves show a distinct primary peak for each model component. Xylan from birchwood and xylan from beechwood decomposed over the range of about 200 to 300 °C with peak maximums at 269 and 274 °C, respectively. The long and medium cellulose fibers mainly decomposed over the range of about 300 to 360 °C with peak maximums at 330 and 328 °C, respectively. Lignin slowly decomposed over the range of about 200 to 800 °C with a peak maximum at 353 °C. The hemicelluloses are the most thermally sensitive of the main biomass components. Yang et al. studied pyrolysis of hemicellulose (xylan from birchwood), cellulose fiber and lignin (alkali) and reported that xylan decomposed at 220–315 °C with peak maximums at 268 °C, cellulose fiber at 315–400 °C with peak maximums at 355 °C, and lignin at 150–900 °C [43]. Our results showed a lower decomposition temperature due to our lower heating rate of 2 °C/min versus their 10 °C/min. The peak maximums of celluloses measured by both TGA and DSC were comparable. The peak maximums observed for the xylans and lignin by TGA were slightly lower than those measured by DSC but still fell in similar decomposition temperature ranges.
Percent weight for each cell wall chemical component was calculated by weight loss in designated temperature ranges that correlate to the cell wall components from TGA analysis [34]. Based on DTG curves of the model components (Figure 4b), the designated temperature ranges for calculating the percent weight of cell wall chemical components were selected. The ranges are hemicellulose between 200 and 300 °C, cellulose between 300 and 360 °C, and lignin between 360 and 800 °C. Percent weight (dry basis) for the component was calculated by the weight loss in the temperature range of the component over the total weight loss in all designated temperature ranges (200–800 °C). The weight loss in each temperature range was calculated by area in the range of DTG curve for the samples. In this study, the area was adjusted based on the distribution of the model lignin in the designated temperature ranges. Table 1 lists the calculated cell wall chemical components of the untreated and treated woods at 220, 260, 300, 350, 450 and 550 °C. The results clearly show the changes in cell wall chemical components with thermal treatment temperature. Hemicellulose contents of the untreated and torrefied woods at 220 , 260 ,and 300 °C are 24.3% 21.2%, 10.1% and 7.4%, respectively, showing that hemicellulose was slightly decomposed by 220 °C, mildly by 260 °C, and significantly by 300 °C. Cellulose was slightly decomposed for the torrefied wood at 300 °C and more severely for the pyrolyzed wood at 350 °C. The samples pyrolyzed at 450 and 550 °C have only lignin with both hemicellulose and cellulose decomposed. The cell wall composition of the torrefied woods correspond with the light, mild and severe torrefaction as classified by Chen et al. [15] and are similar with the results reported by Chen et al. [28] and Mafu et al. [29]. Mafu et al. tested the hardwood cell wall compositions of untreated and torrefied at 260 °C samples using the chemical method. Hemicellulose, cellulose and lignin contents of the untreated and torrefied samples were 11.4% and 1.2%, 56.9% and 46.7%, 15.7% and 16.0%, respectively. Most of hemicellulose for the torrefied wood was decomposed while cellulose and lignin were slightly impacted or not changed.
The decomposition of cellulose, xylan, and lignin were endothermic in the temperature range up to 600 °C as shown by the DSC results. The order of the amount of energy (heat of decomposition) required from high to low is: Cellulose > xylan > lignin. Decomposition temperature ranges and peak temperatures for cellulose, xylan and lignin obtained from DSC tests are comparable to TGA. During the DSC tests, the amount of energy absorbed (heat of decomposition) for treated samples at 350, 450 and 550 °C was much less than observed for the lower temperature treated woods at 220, 260 and 300 °C since at 350 °C and above, the xylans/hemicelluloses and much of the cellulose, which has the highest heat of decomposition of all the cell wall components of biomass, have already been decomposed. For the sample treated at 220 °C, some hemicellulose is decomposed. For the samples treated at 260 and 300 °C, hemicellulose is mostly decomposed. Both hemicellulose and cellulose are decomposed for the samples treated at 450 and 550 °C.
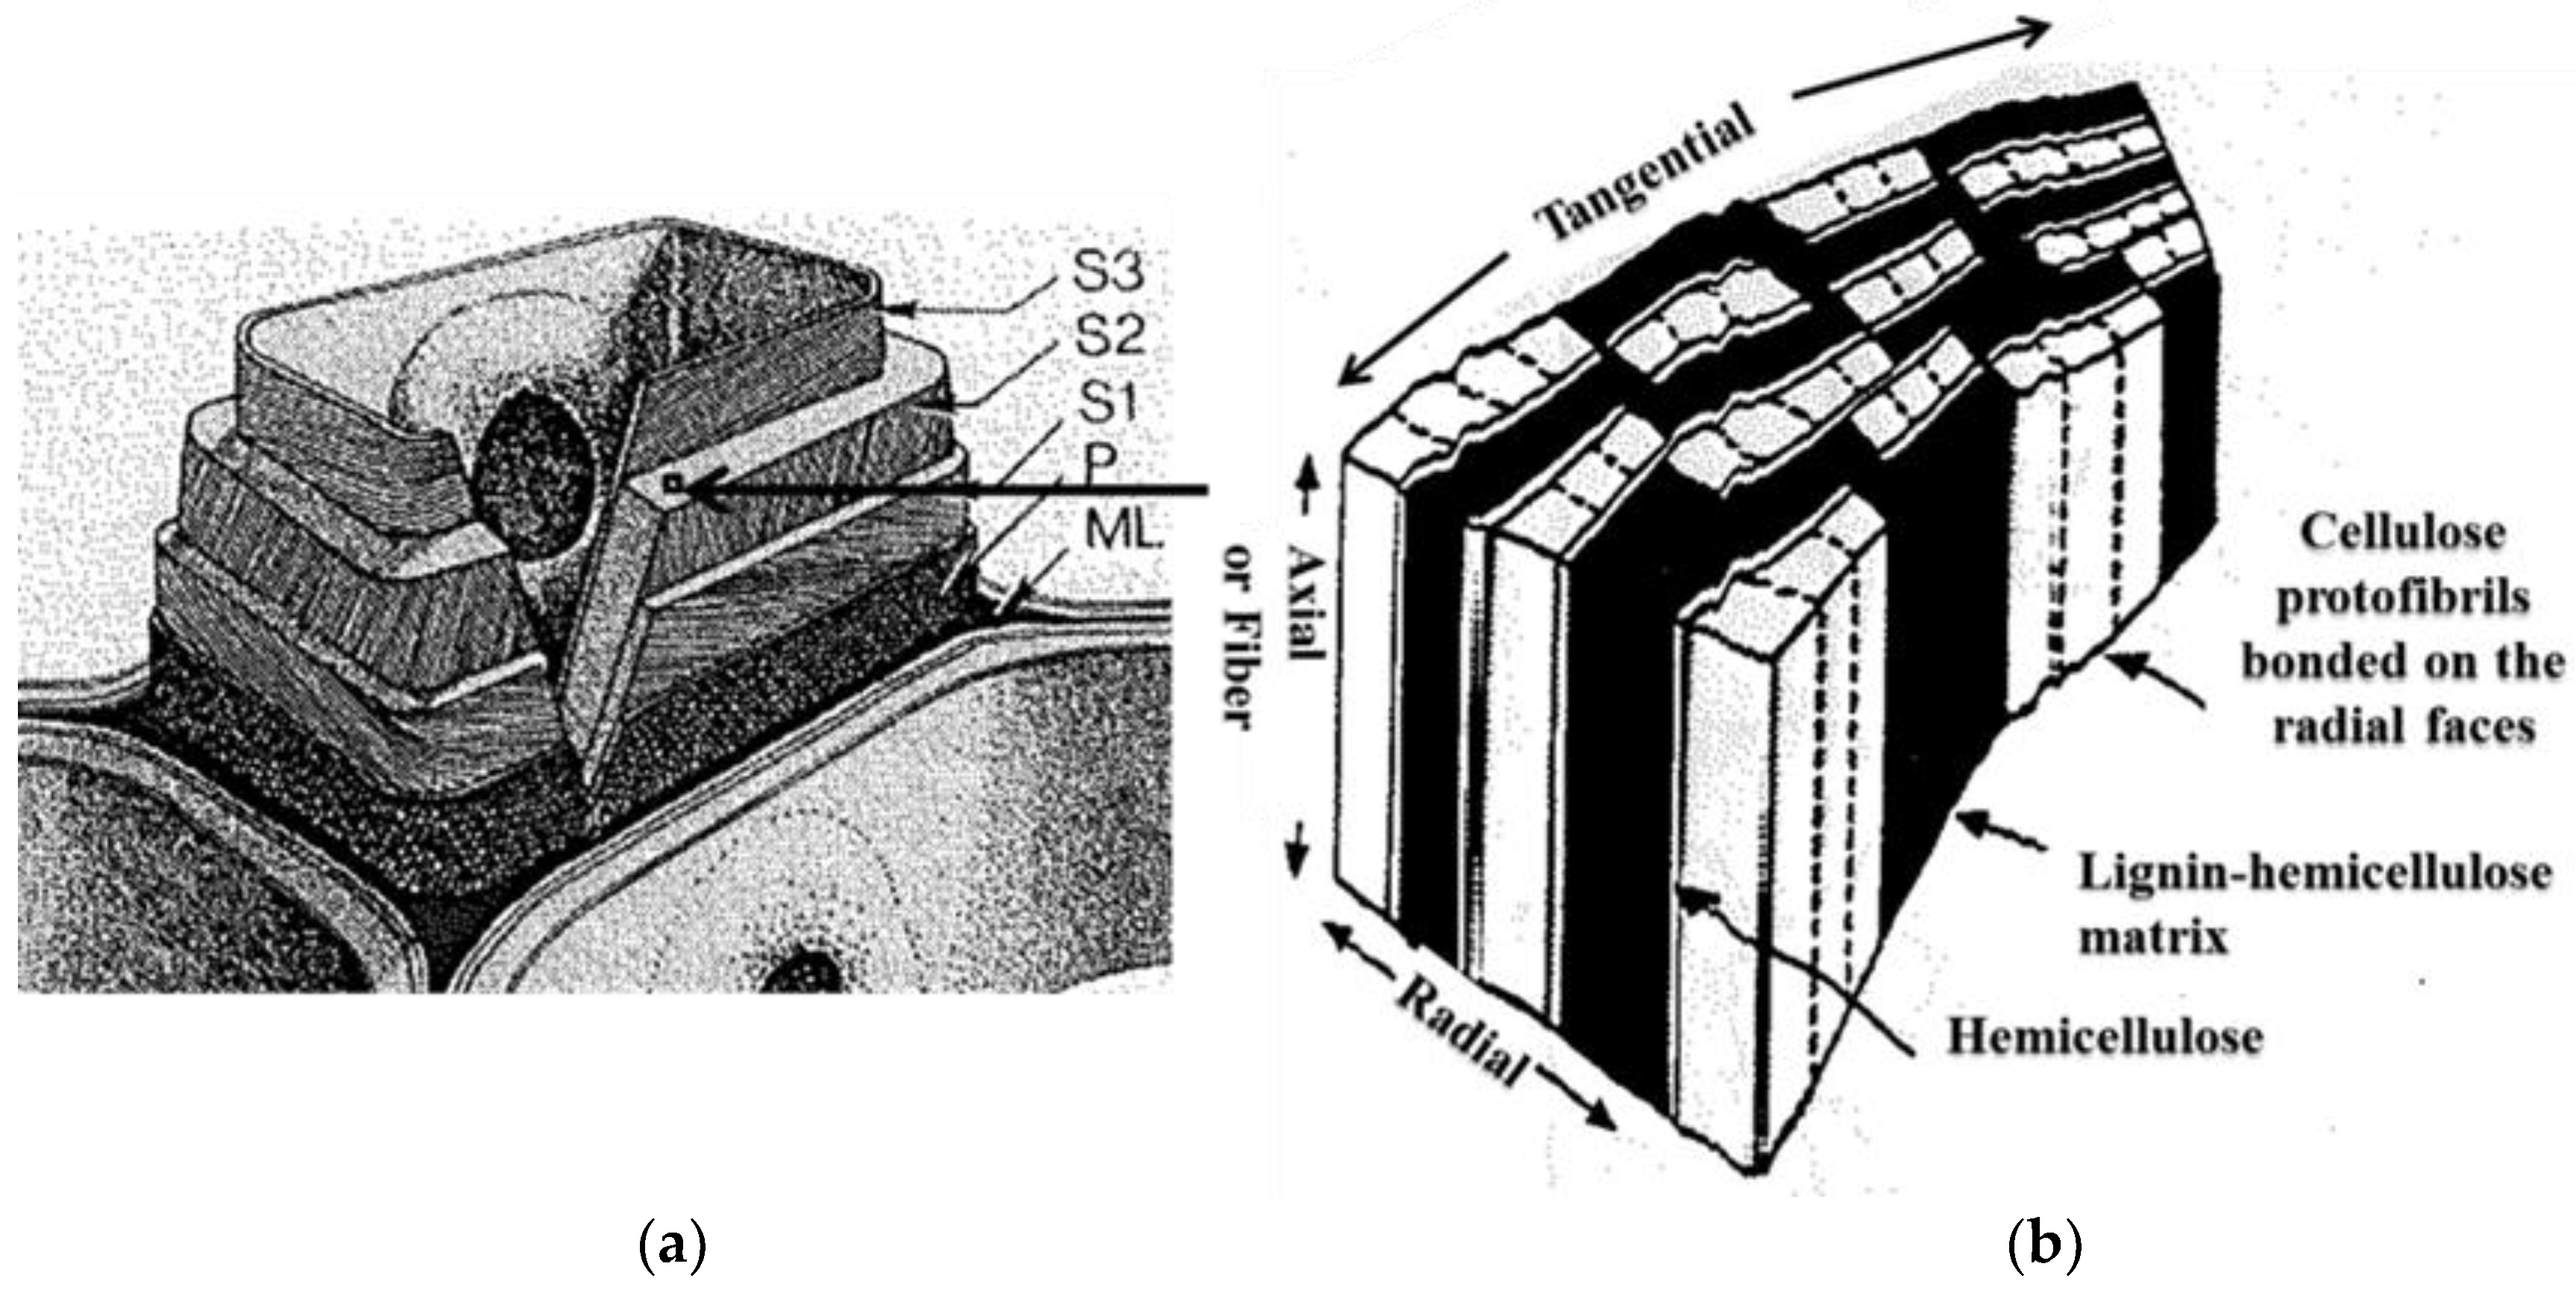
Decomposition of the cell wall components of the cherry wood during the thermal treatments can be used to explain the cause of the grindability improvement after the thermal treatments (grindability test results in Section 3.2). Wood strength results primarily from the fiber content since wood is basically a series of tubular fibers or cells cemented together [32,44]. The cell walls have three main regions: the middle lamella (ML) that acts as adhesion between two or more cells, the primary wall (P) and the secondary wall in its three layers (S1, S2,and S3) (Figure 5a) [44]. These regions have different thicknesses and various quantities of the major chemical components hemicellulose, cellulose, and lignin. For example, for Scotch pine wood, the S2 layer has the highest cellulose content (32.7%) in the cell wall with lesser quantities of hemicellulose (18.4%) and lignin (9.1%) [32]. The S2 layer is the thickest in the secondary wall and in the cell wall overall. From this respect, the S2 layer is mainly responsible for the overall properties of the cell wall. For the S2 layer, a proposed ultrastructural model described the arrangements of hemicellulose, cellulose and lignin and is illustrated in Figure 5b [32]. Lignin and hemicellulose act as a matrix for cellulose in the S2 layer. The lignin in the S2 layer is evenly distributed throughout the layer. Thin, low molecular weight hemicellulose channels bond cellulose microfibrils on their radial faces. Sheaths of hemicellulose are along the boundary area of the cellulose microfibrils. Thermal treatments decompose the hemicellulose resulting in interwall cracks in the S2 layer and weakening of the cell wall. The resulting weakening leads to improved biomass grindability. For the samples treated at 260 and 300 °C, hemicellulose was mostly decomposed resulting in a weakening of the cell walls and, subsequently, an improvement in grindability.
Torrefaction decomposes most of the hemicellulose. Therefore, gasification of torrefied wood should result in improve syngas quality since hemicellulose and lignin may produces a higher tar concentration in the syngas compared to cellulose [6]. This benefit is also confirmed by gasification of torrefied biomass pellets which resulted in both improved energy efficiency and syngas quality [15,23]. The lignin contents of treated woods increased as the treatment temperature increased (Table 1). The high heating values of lignin are higher than the cellulose and hemicellulose due to higher degree of oxidation of the cellulose and hemicellulose [4]. The biochar with higher lignin content has the high heating values that is desired combustion property. On other hand, the air-steam gasification conversions of lignin (52.8%) was much lower than cellulose (97.9%) and hemicellulose (92.2%) [34]. Therefore, the production method of biochar used for gasification should be considered.
3.2. Physical Properties of Untreated and Treated Woods
3.2.1. Physic Properties of Color, Weight, Dimensions, and Bulk Density
Table 2 shows the physical properties of untreated versus treated wood at 220, 260, 300, 350, 450 and 550 °C. Thermal treatments were found to darken the wood samples, as expected. The samples changed from the light brown of the untreated wood to dark cinnamon after the 220 °C treatment and essentially black after the 260 °C treatment. The darkening of the wood might be due to losses of arabinose and xylose that are converted to chocolate-brown colored furfural [32]. This agreed with the TGA test results on chemical composition changes of treated woods. Some hemicellulose in the 220 °C treated wood, most hemicellulose in the samples treated at 260 and 300 °C, and all hemicellulose in the samples treated at 350, 450 and 550 °C was decomposed.
The dimensions of the wood were reduced in all directions and shrinkage increased as treatment temperature increased (Table 2). The shrinkage observed is a result of the chemical reactions associated with cell wall component decomposition and subsequent structural changes during the thermal treatments. In the axial/longitudinal direction (height), the shrinkage for the 220 and 260 °C treated samples were close to zero; shrinkage started at 300 °C (0.41%) and increased significantly at 350 °C (6.48%). Our results are similar to Davidsson and Pettersson who reported that the longitudinal shrinkage of birch wood particles was close to zero below 300 °C and 5% at 350 °C. The longitudinal shrinkage of wood is a result of decomposition of cellulose in the microfibrils in the S2 layer of the cell walls according to the microfibril dominance theory suggested [45]. Our TGA test results agreed with the axial shrinkage. Cellulose in the 220 °C and 260 °C treated woods did not decompose during the thermal treatment. Some cellulose in the 300 °C treated wood decomposed and cellulose in the 350 °C treated wood decomposed completely during these thermal treatments.
The shrinkages along radial (width) and tangential directions (depth) were similar in behavior and were different from the axial shrinkage. The shrinkages in these two directions started at low temperature, approximately 220 °C, primarily due to hemicellulose decomposition (Table 1). A large increase in the percent shrinkage was observed between 300 and 350 °C due to cellulose decomposition. Both the radial and tangential direction shrinkages were more than the axial direction. This may be because decomposition of hemicellulose and lignin mainly contributed to the radial and tangential shrinkages. Since cellulose is arranged in fibrils mainly in the axial directions and both hemicellulose and lignin bond the cellulose fibrils together, hemicellulose decomposition, primarily at low temperature, and lignin decomposition, in all temperature ranges, with a peak at a temperature higher than the cellulose decomposition temperature, is primarily responsible for the observed shrinkage (Figure 4). The order of shrinkages from high to low was width > depth > height. Based on the ultrastructural model (Figure 5b), the thin hemicellulose channels bond cellulose microfibrils on their radial faces and the hemicellulose decompositions results in the shrinkage in the radial direction.
The shrinkage was caused by the decomposition of cell wall components that resulted in loss of a portion of the mass from the biomass. Regression analyses of the shrinkages (S%) along radial, tangential and longitudinal direction as a function of the weight loss (w %) during the thermal pretreatments were carried out on experimental data. Formulas and R-squared (R2) of the regression analysis are listed in Equations (3)–(5). The formulas show good agreement with experimental data.
For radial direction/width,
For tangential direction/depth,
For tangential direction/Height,
The variations in shrinkage in the three sample reference directions are important for modeling studies of the wood thermal pretreatment. The shrinkage affects heat transfer to the particle and gas flow within the particle [25].
The weight losses of treated samples at 260 and 300 °C were 27.57% and 39.21%, respectively (Table 2). It was mainly caused by hemicellulose decomposition/devolatilization to volatiles along with the cellulose and lignin decomposition (Table 1). These results were comparable to Yan et al. who reported that mass yields (100 - weight loss%) of pine woods after torrefaction at 275 and 300 °C were 74.2% and 60.5%, respectively [46]. Losses of weight and volume increased as treatment temperature increased. Losses of weight and volume of the pyrolyzed wood samples were much higher than those of the torrefied samples. There was a large step in percentage weight loss between 300 and 350 °C, which is more than for any other temperature step. This is due to the decomposition of cellulose which the primary component of the wood. At 350 °C, the weight loss (62.07%) and volume loss (37.39 %) were much higher than the weight loss (39.21 %) and volume loss (15.11%) at 300 °C. The weight losses at the higher temperature treatments of 450 to 550 °C increased slightly from 69.70 to 73.22%. Those results were close to Abdullah and Wu who reported that char yields of treated mallee wood at 300 and 450 °C were ~56% and ~27%, respectively [10]. The weight loss during low temperature pyrolysis was much higher than observed during torrefaction.
The measured bulk density of the untreated cherry wood was 540 kg/m3 (0.54 g/cm3) which falls in the typical range [16], The densities of the treated wood samples decreased with increasing temperature over the temperature range of 220 to 350 °C but changed little over the range of 350 to 550 °C. The bulk density of wood is dependent upon cellular diameters and wall thickness [47]. During the thermal treatments, weight loss and size reduction caused by the decomposition of chemical components in the cell wall resulted in the density changes. Weight losses higher than volume losses resulted in the density reduction with increasing temperatures. The low density of treated wood may be addressed through densification (pelletizing for example) to improve the handling, transportation, storage and conversion of the wood [14,15].
Regression analyses of the weight loss (w%), volume loss (v%) and density (d g/cm3) as a function of the treatment temperature (T °C) were carried out on experimental data. Formulas and R-squared (R2) of regression were listed in Equations (6)–(8). The formulas show good agreement with experimental data.
For weight loss,
w = −0.0007T2 + 0.7451T − 114.31, R2 = 0.9788
For volume loss,
v = −0.0004T2 + 0.4607T − 81.733, R2 = 0.9555
For density,
d = 0.000003T2 − 0.00261T + 0.9146, R2 = 0.9774
3.2.2. Grindbility of Untreated and Treated Woods
The untreated and treated at 220 °C samples were incompletely milled resulting in a fraction of those materials not being able to pass the bottom screen (0.8 mm) of the hammer mill. The untreated wood was ground three times and during grinding it was occasionally stuck in the mill between hammer-grinding stators and hammer-rotors. The ground samples were sieved into four size fractions: >500 µm, 500–212 µm, 212–106 µm and <106 µm. Table 3 lists the particle size distribution of the milled untreated and treated woods. The grindability of treated woods improved as the percentage of particles with the lower size fractions increased. The treated wood at 260 and 300 °C had 23.5% and 55.5% passing through 212 µm, respectively, compared to only 11% of the untreated wood. The results are similar to Aria et al. who reported that the percentage of particles less than 150 μm was double that of untreated wood for wood treated at 240 °C for 0.5 h and ground.
From the cell well composition study (Table 1), hemicellulose contents of the treated woods at 260 °C (10%) and 300 °C (7%) were lower that of the untreated wood (24%). Wood is essentially a series of elongated tubular fibers or cells and cemented together [31,32]. Hemicellulose acts as a matrix for the cellulose along with lignin. The decomposed hemicellulose resulted in the cell walls weakening and subsequently improved grindability as shown by the increase in the percentage of small particles versus the untreated wood.
For the treated wood at 350 °C, the percentage that passed through the 106 µm sieve increased to 16.7% compared to 3% of the treated wood at 300 °C. However, further treatment at higher temperatures did not further improve the grindability. The results are similar to Abdullah and Wu (2009) who reported that grindability of treated wood at 300 °C was drastically improved but increasing temperature to 500 °C resulted in only a small additional improvement in the grindability [10]. Therefore the torrefaction of wood can improve the wood grindability. The torrefied wood may be directly fed with coal for co-firing in a PC boiler and for co-gasification in an entrained-flow gasifier that require fine particle size of fuels.
3.3. Proximate Analysis and High Heating Value of Untreated and Treated Woods
The proximate analysis of untreated and treated woods reveals the changes in moisture, volatile matter, fixed carbon and ash after thermal pretreatment. The moisture content of the untreated wood sample used in this study was low at 6% and similar to the 6.5% of reported for oak wood [16]. Table 3 shows the proximate analysis results of untreated and treated woods at 220, 260, 300, 350, 450 and 550 °C. The VM of untreated wood is high (88.1%), while its FC (11.5%) and ash (0.4%) are low. These untreated wood proximate analysis results are similar to that reported for beech wood with VM 84.2%, FC 15.5% and ash 0.3% [14]. The thermally treated woods were decomposed and light volatiles lost so the VM in the treated woods decreased and the FC increased with increasing temperature. The FC of pyrolyzed woods at 350, 450 and 550 °C are 54.3 to 83.4% and much higher than those of the torrefied woods at 220, 260 and 300 °C 13.9 to 24.9%. The pyrolyzed woods has high fuel quality, similar to coal which has mean FC 43.9% [48].
The calculated HHVs of untreated and treated woods in weight (MJ/kg) and volumetric value (MJ/m3) were listed in Table 4. The HHVs of torrefied woods at 220, 260 and 300 °C were 18 to 22 MJ/kg and in the range of 16–29 MJ/kg of torrefied biomass [15]. The heating values (by weight) of torrefied woods at 260 and 300 °C increased 6.1% and 15.9% compared to the untreated wood. The torrefied wood with improved fuel quality may be utilized as solid fuel with higher process efficiency. The pyrolyzed woods at 350, 450 and 550 °C were 25 to 32 MJ/kg and close to the mean HHV of coal of 25 MJ/kg [48]. Therefore, the pyrolyzed woods are compatible for utilization with coal. The HHVs of the treated woods by weight increased with increasing treated temperature due to increasing weight loss due to devolatilization hemicellulose and cellulose. But the HHVs of the treated woods in a volumetric basis decreased because weight losses were higher than volume losses. These results agree with those reported [17]. Pelletizing can significantly increase the volumetric energy density of the treated biomass facilitating transport and storage, leading to savings in logistics [9].
Fuel ratio is defined as a ratio of fixed carbon to volatile matter (FC/VM) and is an important solid fuel property [5]. From the proximate analysis results (Table 4), fuel ratio of the treated woods increased as the volatiles decreased due to the thermal treatment. The fuel ratios of the torrefied woods were 0.16–0.34 and lower than lignite coal 0.85 [5]. Those of the biochars at 350, 450 and 550 °C were 1.2, 2.8 and 5.6, respectively. The biochar from the wood treated at 350 °C (1.2) was close to that of high volatile bituminous coal (0.92) [19] and bituminous coal 1.56 [20]. So the low temperature pyrolysis improves wood combustion properties but the torrefaction did not [12]. The biochars were more suitable than raw biomas for co-firing with coal and increased thermal conversion efficiency [5,24].
During the thermal treatment, the mass loss results in energy loss with respect to the untreated biomass. The treated biomass is a solid fuel so its energy content can be evaluated using energy yield. The energy yield is defined as: energy yield (%) = mass yield (%) * HHVf/HHVo, where mass yield = 100 − weight loss (%), HHV is high heating value, subscript o and f refer to the untreated and treated biomass, respectively [22]. The energy yields of the torrefied woods were in the range 70.3–86.5% and those of the pyrolyzed woods in the range 41.8–56.0%. With respect to energy yield, the torrefied woods are superior compared to the pyrolyzed woods [12]. The energy loss may be recovered by utilizing the volatiles generated during the pretreatment.
3.4. Morphological Study of Untreated and Treated Woods by SEM
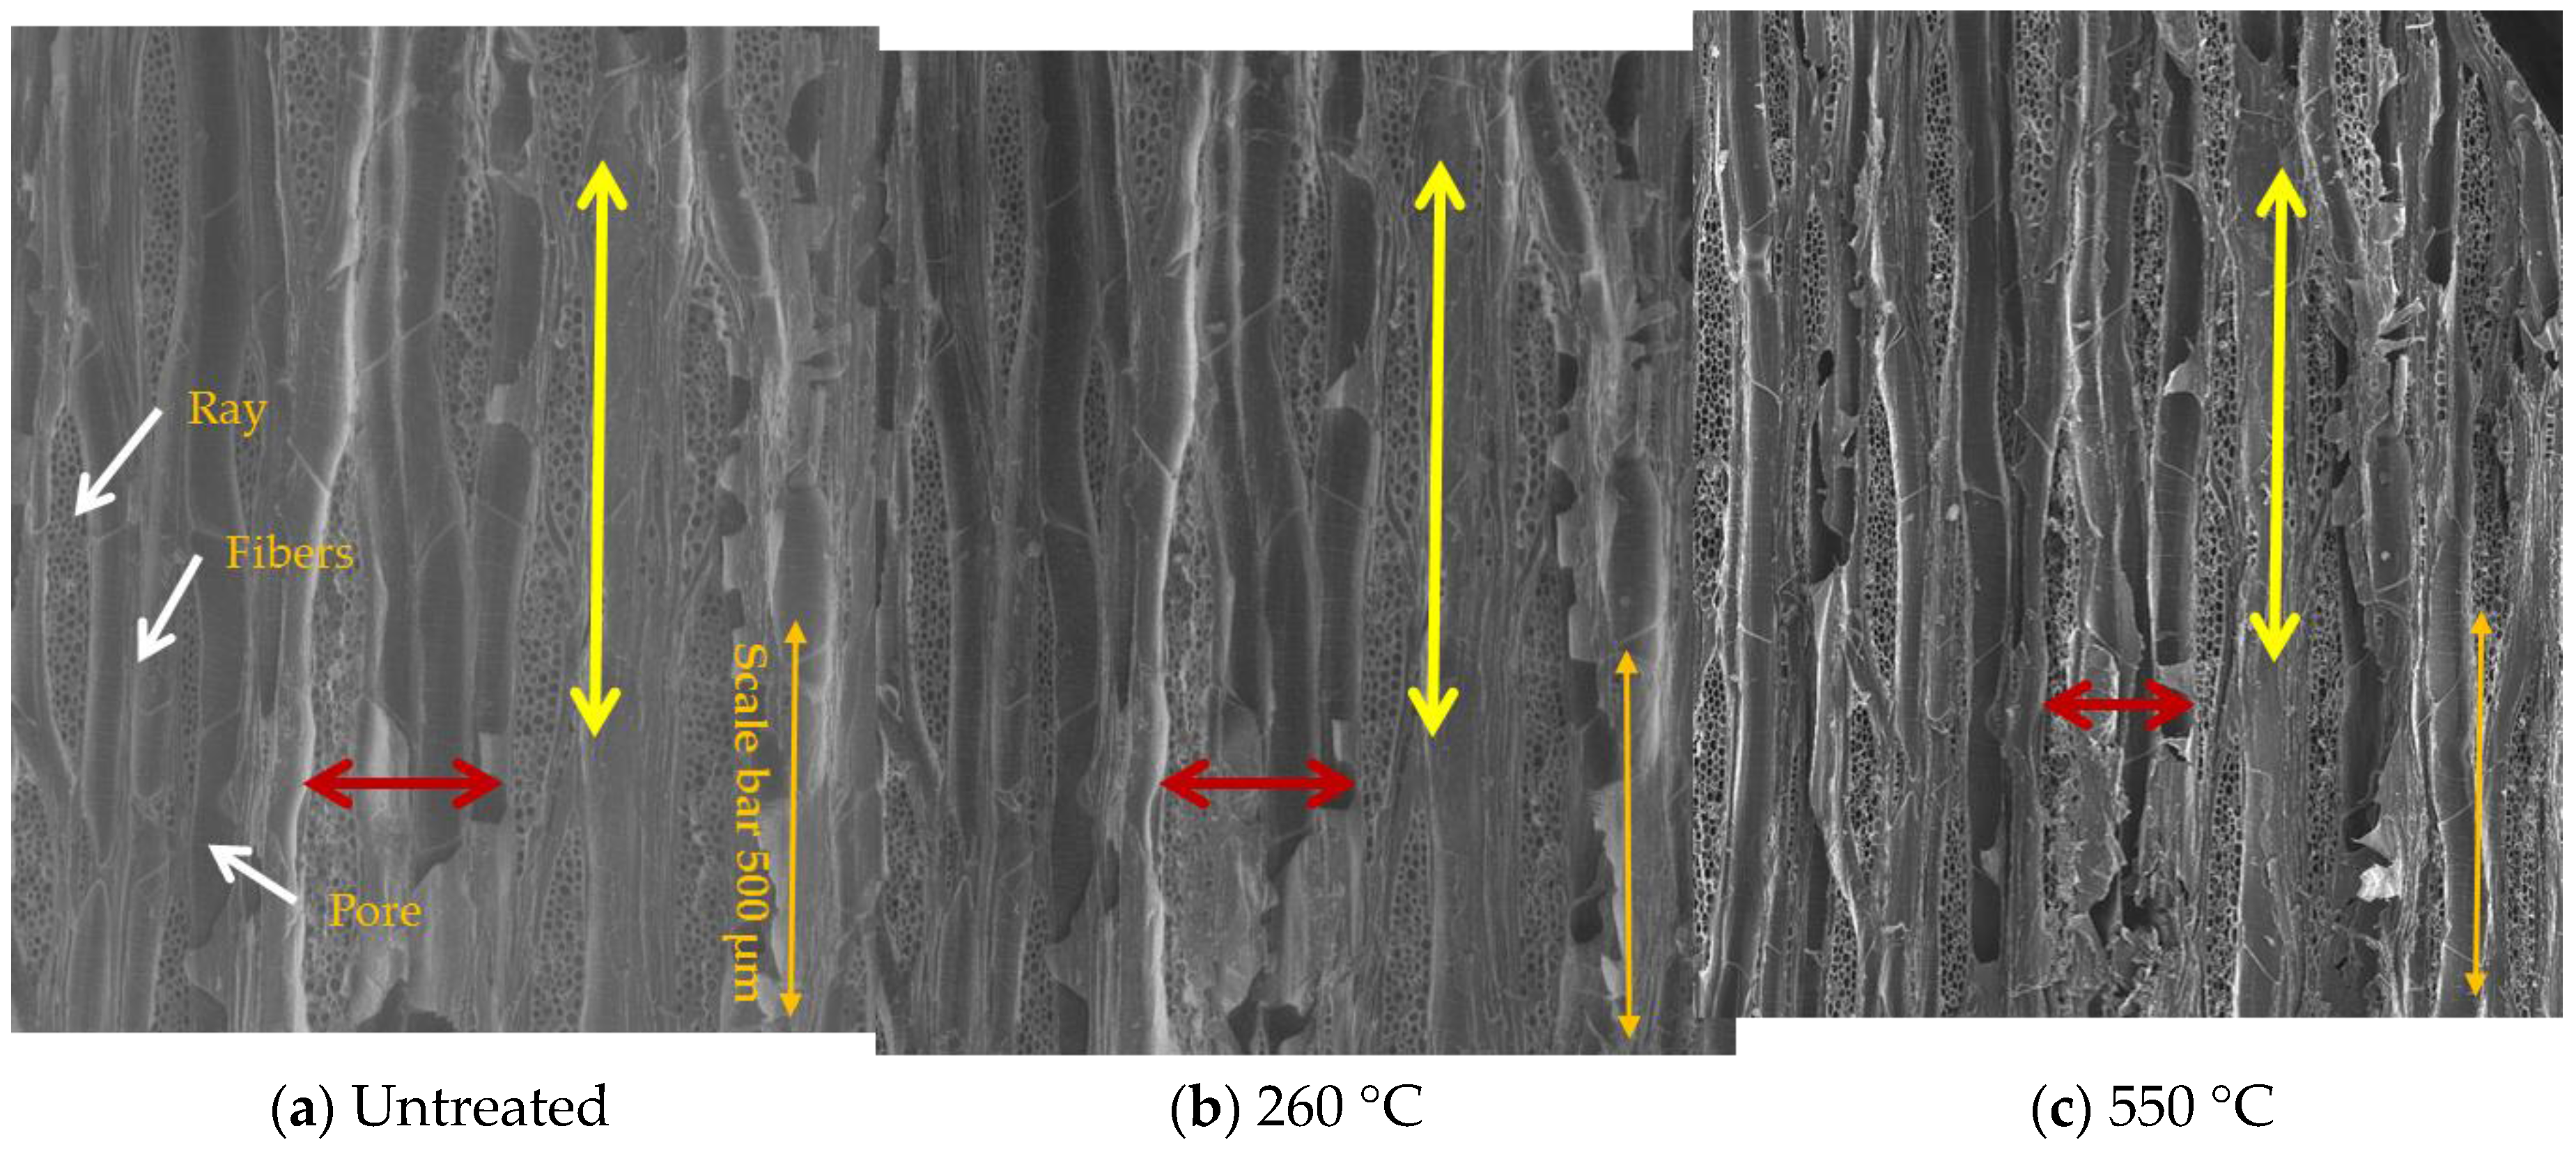
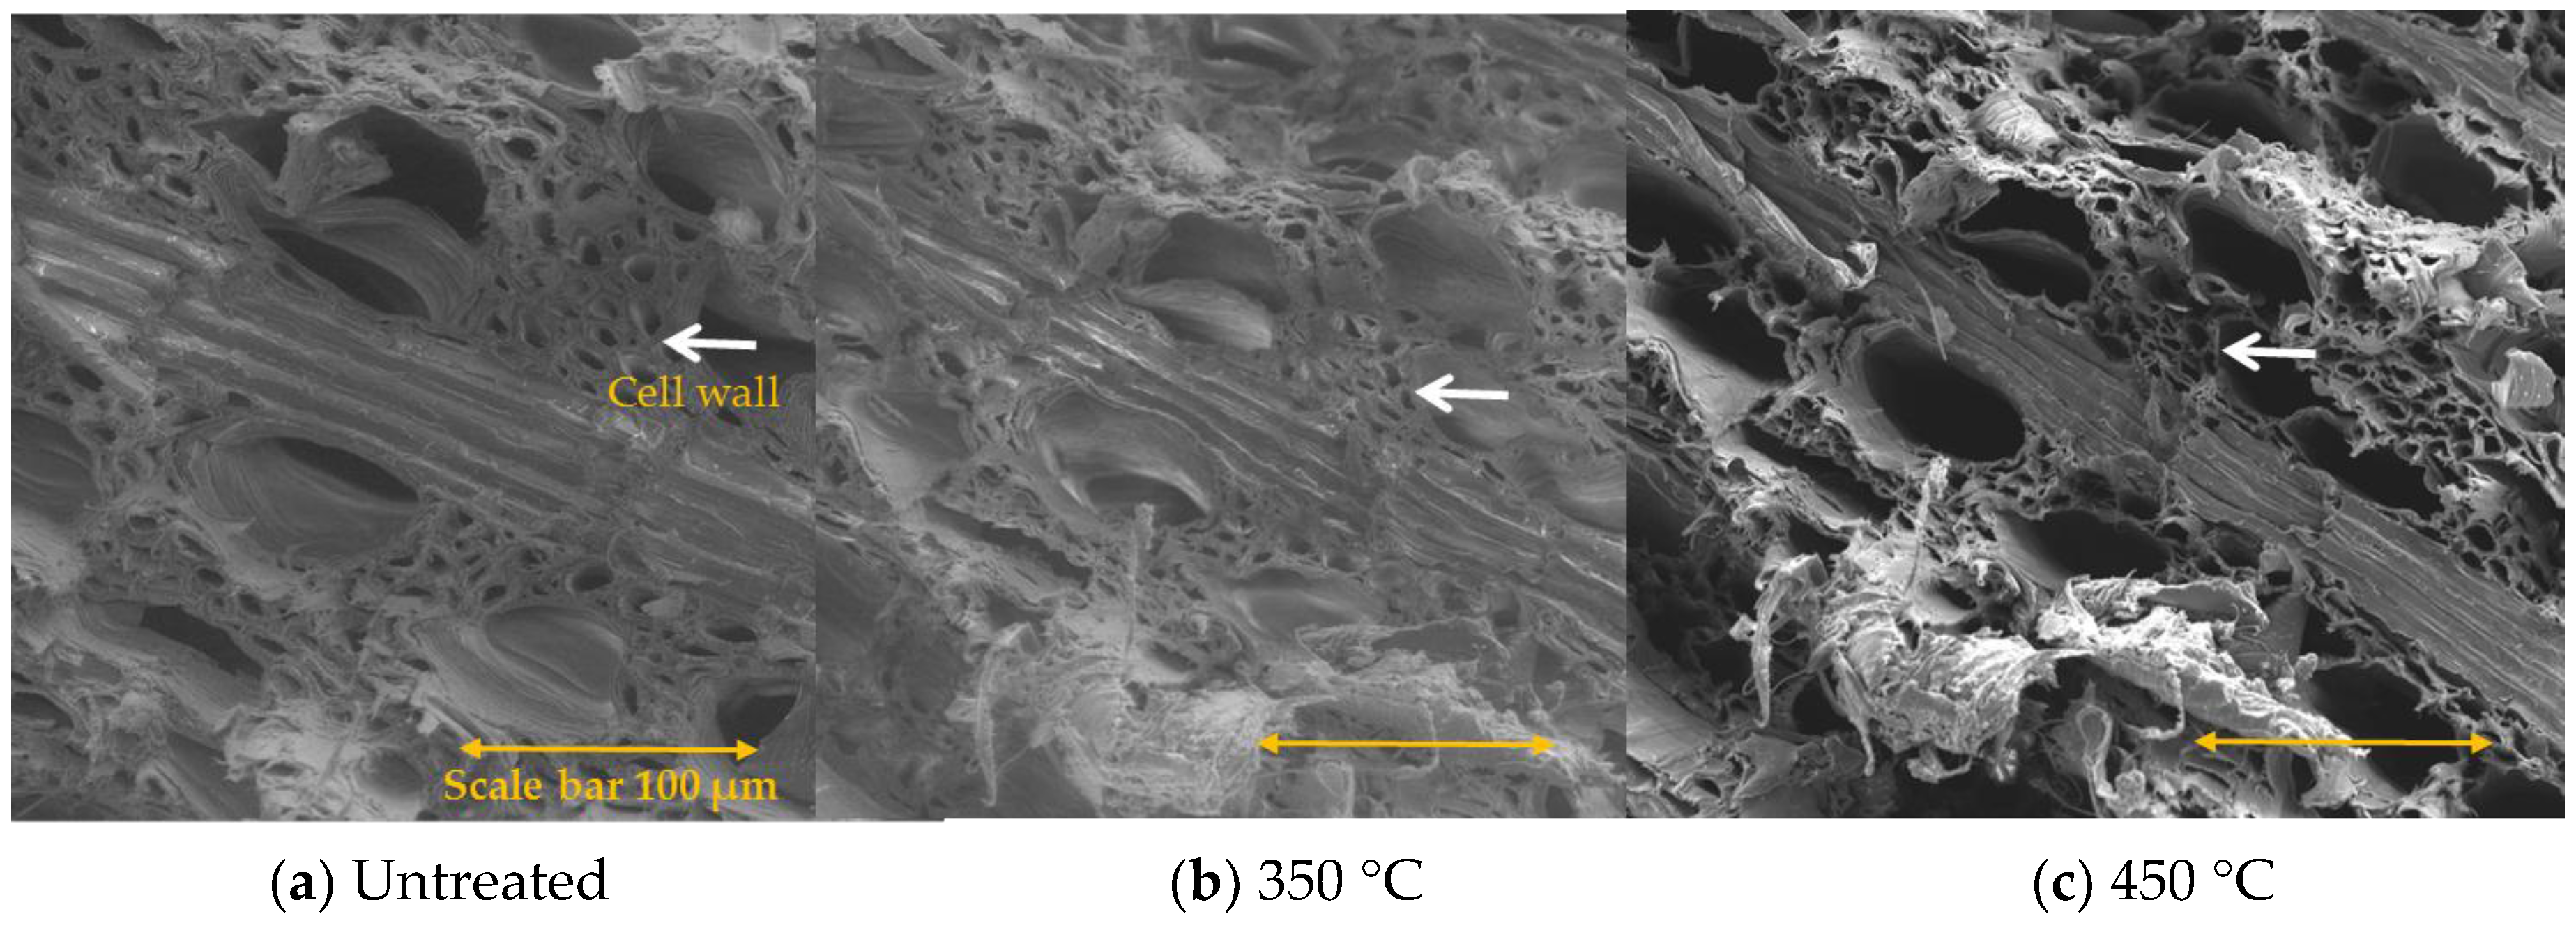
Figure 6 shows the SEM images (horizontal field width = 1.28 mm; scale bar of 500 µm; vertical as images are presented) of the tangential section views of the untreated and the 260 and 550 °C treated woods. There are fibers, rays seen in end-view formed by stacks of ray parenchyma cells and pores visible in the tangential section images. Identified morphological structures were seen in all three woods. Figure 7 shows the SEM images (horizontal field width = 1.28 mm; scale bar of 500 µm; vertical as images are presented) of the radial section views of the untreated and the 300 and 550 °C treated woods. There are fibers, rays that look like a brick wall crossing in the longitudinal direction and pores visible in the radial section images. Figure 8 shows the SEM images (horizontal field width = 1.28 mm; scale bar of 500 µm) of the cross section views of the untreated and the 300 and 550 °C treated woods. There are many pores of various sizes and arrangements, fibers and annual or growth rings visible in the cross section images. Overall, the morphological features of the wood remain intact during the thermal treatments, which is in agreement with Haas et al. [49] who studied the pyrolysis of poplar wood up to 700 °C using microscopy in real-time and Winandy and Rowell [32] who studied the pyrolysis of pine wood at 295 °C. Figure 9 shows the SEM images (horizontal field width = 320 μm; scale bar of 100 µm) of cross sections of the untreated and the 350 and 450 °C treated samples. The cell walls were thinner after the thermal treatments.
Along the axial direction (Figure 6), the untreated and the 260 °C treated samples did not significantly shrink: however, the 550 °C treated sample shrank about 15%, which agreed with the physical property tests of sample height (Table 2). Along the tangential direction, the 260 °C treated samples shrank slightly; however, the 550 °C treated samples shrank 22% compared with the untreated sample, which agreed with the physical property tests of sample depth (Table 2). There was more shrinkage along the tangential direction than the axial direction. Along the radial direction (Figure 7), the samples treated at 300 and 550 °C shrank 10 and 29% respectively, compared with the untreated one, which agreed with physical property test of sample width, Table 1.
4. Conclusions
This study utilized well defined wood particle samples to obtain torrefaction and low temperature pyrolysis data to more thoroughly understand the processes and aid future modeling studies. Treatment temperature has a great impact on biochemical composition, physical and chemical properties and microstructure of wood during torrefaction (220–300 °C) and low temperature pyrolysis (300–550 °C). The hemicellulose in the wood treated at 260 and 300 °C was mostly decomposed and resulted in the cell walls weakening and subsequent improvement in grindability as shown by the increase in the percentage of small particles as compared to the untreated wood. Treatment at higher temperatures (>300 °C) did not result in a significant increased improvement of grindability. The morphologies of the wood samples remained essentially intact over the treatment temperature range but the cell walls were observed to be thinner. Shrinkages of the treated woods in the three reference directions increased with increased treatment temperature and correlated well with each other. Losses of weight and volume of the pyrolyzed wood samples were much higher than those of the torrefied samples. The bulk densities of the treated wood samples decreased with increasing temperature over the temperature range of 220 to 350 °C but changed little over the range of 350 to 550 °C. The HHVs of the treated woods by weight increased with increased treatment temperature but the HHVs of the treated woods in a volumetric basis decreased. The low temperature pyrolyzed wood samples resulted in an improved solid fuel high fuel ratio, which was close to that of lignite/bituminous coal. The selection of a biomass thermal pretreatment process should take into consideration the application because torrefaction and low temperature pyrolysis result in different product properties. These results improve the understanding of the property changes of the biomass during thermal pretreatment and will help in the development of models for process simulation and potential application of the treated biomass.
Acknowledgments
This report was prepared as an account of work sponsored by the Department of Energy, National Energy Technology Laboratory, an agency of the United States Government. Neither the United States Government nor any agency thereof, nor any of their employees, makes any warranty, express or implied, or assumes any legal liability or responsibility for the accuracy, completeness, or usefulness of any information, apparatus, product, or process disclosed, or represents that its use would not infringe privately owned rights. Reference herein to any specific commercial product, process, or service by trade name, trademark, manufacturer, or otherwise does not necessarily constitute or imply its endorsement, recommendation, or favoring by the United States Government or any agency thereof. The views and opinions of authors expressed herein do not necessarily state or reflect those of the United States Government or any agency thereof.
Author Contributions
The authors equally contributed to the work reported.
Conflicts of Interest
The authors declare no conflict of interest.
References
- International Energy Agency (IEA). Technology Roadmap Bioenergy for Heat and Power; International Energy Agency: Paris, France, 2012; Available online: http://www.iea.org/publications/freepublications/publication/2012_Bioenergy_Roadmap_2nd_Edition_WEB.pdf (accessed on 10 May 2017).
- U.S. Energy Information Administration (EIA). International Energy Outlook 2016; DOE/EIA-0484 (2016); U.S. Energy Information Administration: Washington, DC, USA, 2016. Available online: https://www.eia.gov/outlooks/ieo/ (accessed on 11 May 2017).
- U.S. Energy Information Administration (EIA). June 2017 Monthly Energy Review; DOE/EIA-0035(2017/6); U.S. Energy Information Administration: Washington, DC, USA, 2017. Available online: https://www.eia.gov/totalenergy/data/monthly/pdf/mer.pdf (accessed on 11 May 2017).
- Saidur, R.; Abdelaziz, E.A.; Demirbas, A.; Hossain, M.S.; Mekhilef, S. A review on biomass as a fuel for boilers. Renew. Sustain. Energy Rev. 2011, 15, 2262–2289. [Google Scholar] [CrossRef]
- Liu, Z.; Balasubramanian, R. A comparison of thermal behaviors of raw biomass, pyrolytic biochar and their blends with lignite. Bioresour. Technol. 2013, 146, 371–378. [Google Scholar] [CrossRef] [PubMed]
- Van Paasen, R.H.; Kiel, J.H.A. Tar Formation in a Fluidised-Bed Gasifier: Impact of Fuel Properties and Operating Conditions; Energy Research Center of the Netherlands (ECN): Sint Maartensvlotbrug, The Netherlands, 2004. [Google Scholar]
- Higman, C.; van der Burgt, M. Gasification; Elsevier: New York, NY, USA, 2008. [Google Scholar]
- Smoot, L.D.; Smith, P.J. Coal Combustion and Gasification; Plenum Press: New York, NY, USA, 1985. [Google Scholar]
- Bergman, P.; Kiel, J. Torrefaction for biomass upgrading. In Proceedings of the 14th European Biomass Conference & Exhibition, Paris, France, 17–21 October 2005. [Google Scholar]
- Abdullah, H.; Wu, H. Biochar as a fuel: 1. Properties and grindability of biochars produced from the pyrolysis of mallee wood under slow-heating conditions. Energy Fuels 2009, 23, 4174–4181. [Google Scholar] [CrossRef]
- Huang, Y.-F.; Syu, F.-S.; Chiueh, P.-T.; Lo, S.-L. Life cycle assessment of biochar cofiring with coal. Bioresour. Technol. 2013, 131, 166–171. [Google Scholar] [CrossRef] [PubMed]
- Park, S.-W.; Jang, C.-H.; Baek, K.-R.; Yang, J.-K. Torrefaction and low-temperature carbonization of woody biomass: Evaluation of fuel characteristics of the products. Energy 2012, 45, 676–685. [Google Scholar] [CrossRef]
- Van der Stelt, M.J.C.; Gerhauser, H.; Kiel, J.H.A.; Ptasinski, K.J. Biomass upgrading by torrefaction for the production of biofuels: A review. Biomass Bioenergy 2011, 35, 3748–3762. [Google Scholar] [CrossRef]
- Chew, J.J.; Doshi, V. Recent advances in biomass pretreatment—Torrefaction fundamentals and technology. Renew. Sustain. Energy Rev. 2011, 15, 4212–4222. [Google Scholar] [CrossRef]
- Chen, W.-H.; Peng, J.; Bi, X.T. A state-of-the-art review of biomass torrefaction, densification and applications. Renew. Sustain. Energy Rev. 2015, 44, 847–866. [Google Scholar] [CrossRef]
- Madanayake, B.N.; Gan, S.Y.; Eastwick, C.; Ng, H.K. Biomass as an energy source in coal co-firing and its feasibility enhancement via pre-treatment techniques. Fuel Process. Technol. 2017, 159, 287–305. [Google Scholar] [CrossRef]
- Koppejan, J.; Cremers, M.; Middelkamp, J.; Witkamp, J.; Sokhansanj, S.; Melin, S.; Madrali, S. Status Overview of Torrefaction Technologies: A Review of the Commercialisation Status of Biomass Torrefaction; International Energy Agency Bioenergy: Paris, France, 2015; Available online: http://www.ieabcc.nl/publications/IEA_Bioenergy_T32_Torrefaction_update_2015b.pdf (accessed on 9 October 2017).
- Bergman, P.C.A.; Boersma, A.R.; Zwart, R.W.R.; Kiel, J.H.A. Torrefation for Biomass Co-Fring in Existing Coal-Fired Power Stations “Biocoal”; ECN-C-05-013; Energy Research Centre of the Netherlands: Sint Maartensvlotbrug, The Netherlands, 2005. [Google Scholar]
- Du, S.-W.; Chen, W.-H.; Lucas, J.A. Pretreatment of biomass by torrefaction and carbonization for coal blend used in pulverized coal injection. Bioresour. Technol. 2014, 161, 333–339. [Google Scholar] [CrossRef] [PubMed]
- Phanphanich, M.; Mani, S. Impact of torrefaction on the grindability and fuel characteristics of forest biomass. Bioresour. Technol. 2011, 102, 1246–1253. [Google Scholar] [CrossRef] [PubMed]
- Repellin, V.; Govin, A.; Rolland, M.; Guyonnet, R. Energy requirement for fine grinding of torrefied wood. Biomass Bioenergy 2010, 34, 923–930. [Google Scholar] [CrossRef] [Green Version]
- Arias, B.; Pevida, C.; Fermoso, J.; Plaza, M.G.; Rubiera, F.; Pis, J.J. Influence of torrefaction on the grindability and reactivity of woody biomass. Fuel Process. Technol. 2008, 89, 169–175. [Google Scholar] [CrossRef] [Green Version]
- Prins, M.J.; Ptasinski, K.J.; Janssen, F. More efficient biomass gasification via torrefaction. Energy 2006, 31, 3458–3470. [Google Scholar] [CrossRef]
- Liu, Z.G.; Han, G.H. Production of solid fuel biochar from waste biomass by low temperature pyrolysis. Fuel 2015, 158, 159–165. [Google Scholar] [CrossRef]
- Davidsson, K.O.; Pettersson, J.B.C. Birch wood particle shrinkage during rapid pyrolysis. Fuel 2002, 81, 263–270. [Google Scholar] [CrossRef]
- Kumar, R.R.; Kolar, A.K.; Leckner, B. Shrinkage characteristics of casuarina wood during devolatilization in a fluidized bed combustor. Biomass Bioenergy 2006, 30, 153–165. [Google Scholar] [CrossRef]
- Kwiatkowski, K.; Bajer, K.; Celinska, A.; Dudynski, M.; Korotko, J.; Sosnowska, M. Pyrolysis and gasification of a thermally thick wood particle—Effect of fragmentation. Fuel 2014, 132, 125–134. [Google Scholar] [CrossRef]
- Chen, W.H.; Cheng, W.Y.; Lu, K.M.; Huang, Y.P. An evaluation on improvement of pulverized biomass property for solid fuel through torrefaction. Appl. Energy 2011, 88, 3636–3644. [Google Scholar] [CrossRef]
- Mafu, L.D.; Neomagus, H.; Everson, R.C.; Carrier, M.; Strydom, C.A.; Bunt, J.R. Structural and chemical modifications of typical south african biomasses during torrefaction. Bioresour. Technol. 2016, 202, 192–197. [Google Scholar] [CrossRef] [PubMed]
- Wang, P.; Shuster, E.; Matuszewski, M.; Tarka, T.; VanEssendelft, D.; Berry, D. Selection of biomass type for co-gasification studies. In Proceedings of the 35th International Technical Conference on Clean Coal & Fuel Systems, Clearwater, FL, USA, 6–10 June 2010. [Google Scholar]
- Rowell, R.M.; Pettersen, R.; Han, J.S.; Rowel, J.S.; Tshabalala, M.A. Cell wall chemisty. In Handbook of Wood Chemistry and Wood Composites; Rowell, R.M., Ed.; Tayer & Francis: New York, NY, USA, 2005. [Google Scholar]
- Winandy, J.E.; Rowell, R.M. Chemistry of wood strength. In Handbook of Wood Chemistry and Wood Composites; Rowell, R.M., Ed.; Tayor & Francis: New Yok, NY, USA, 2005. [Google Scholar]
- Hanaoka, T.; Inoue, S.; Uno, S.; Ogi, T.; Minowa, T. Effect of woody biomass components on air-steam gasification. Biomass Bioenergy 2005, 28, 69–76. [Google Scholar] [CrossRef]
- Serapiglia, M.J.; Cameron, K.D.; Stipanovic, A.J.; Smart, L.B. High-resolution thermogravimetric analysis for rapid characterization of biomass composition and selection of shrub willow varieties. Appl. Biochem. Biotechnol. 2008, 145, 3–11. [Google Scholar] [CrossRef] [PubMed]
- Chen, W.H.; Kuo, P.C. A study on torrefaction of various biomass materials and its impact on lignocellulosic structure simulated by a thermogravimetry. Energy 2010, 35, 2580–2586. [Google Scholar] [CrossRef]
- Bahng, M.-K.; Mukarakate, C.; Robichaud, D.J.; Nimlos, M.R. Current technologies for analysis of biomass thermochemical processing: A review. Anal. Chim. Acta 2009, 651, 117–138. [Google Scholar] [CrossRef] [PubMed]
- Fisher, E.M.; Dupont, C.; Darvell, L.I.; Commandre, J.M.; Saddawi, A.; Jones, J.M.; Grateau, M.; Nocquet, T.; Salvador, S. Combustion and gasification characteristics of chars from raw and torrefied biomass. Bioresour. Technol. 2012, 119, 157–165. [Google Scholar] [CrossRef] [PubMed]
- Demirbas, A. Biorefineries: Current activities and future developments. Energy Convers. Manag. 2009, 50, 2782–2801. [Google Scholar] [CrossRef]
- Friedman, J. Wood Identification by Microscopic Examination: A Guide for the Archaeologist on the Northwest Coast of North America (Heritage Record); British Columbia Provincial Museum: Victoria, BC, Canada, 1978. [Google Scholar]
- Erol, M.; Haykiri-Acma, H.; Kucukbayrak, S. Calorific value estimation of biomass from their proximate analyses data. Renew. Energy 2010, 35, 170–173. [Google Scholar] [CrossRef]
- Demirbas, A. Relationships between lignin contents and heating values of biomass. Energy Convers. Manag. 2001, 42, 183–188. [Google Scholar] [CrossRef]
- Parikh, J.; Channiwala, S.A.; Ghosal, G.K. A correlation for calculating hhv from proximate analysis of solid fuels. Fuel 2005, 84, 487–494. [Google Scholar] [CrossRef]
- Yang, H.; Yan, R.; Chen, H.; Lee, D.H.; Zheng, C. Characteristics of hemicellulose, cellulose and lignin pyrolysis. Fuel 2007, 86, 1781–1788. [Google Scholar] [CrossRef]
- Wiedenhoeft, A.C.; Miller, R.B. Structure and function of wood. In Handbook of Wood Chemistry and Wood Composites; MRowell, R.M., Ed.; Taylor & Francis: New York, NY, USA, 2005; pp. 9–33. [Google Scholar]
- Byrne, C.E.; Nagle, D.C. Carbonized wood monoliths—Characterization. Carbon 1997, 35, 267–273. [Google Scholar] [CrossRef]
- Yan, W.; Acharjee, T.C.; Coronella, C.J.; Vasquez, V.R. Thermal pretreatment of lignocellulosic biomass. Environ. Prog. Sustain. Energy 2009, 28, 435–440. [Google Scholar] [CrossRef]
- Byrne, C.E.; Nagle, D.C. Carbonization of wood for advanced materials applications. Carbon 1997, 35, 259–266. [Google Scholar] [CrossRef]
- Vassilev, S.V.; Vassileva, C.G.; Vassilev, V.S. Advantages and disadvantages of composition and properties of biomass in comparison with coal: An overview. Fuel 2015, 158, 330–350. [Google Scholar] [CrossRef]
- Haas, T.J.; Nimlos, M.R.; Donohoe, B.S. Real-time and post-reaction microscopic structural analysis of biomass undergoing pyrolysis. Energy Fuels 2009, 23, 3810–3817. [Google Scholar] [CrossRef]
Figure 1.
Sample preparation and sample arrangement.
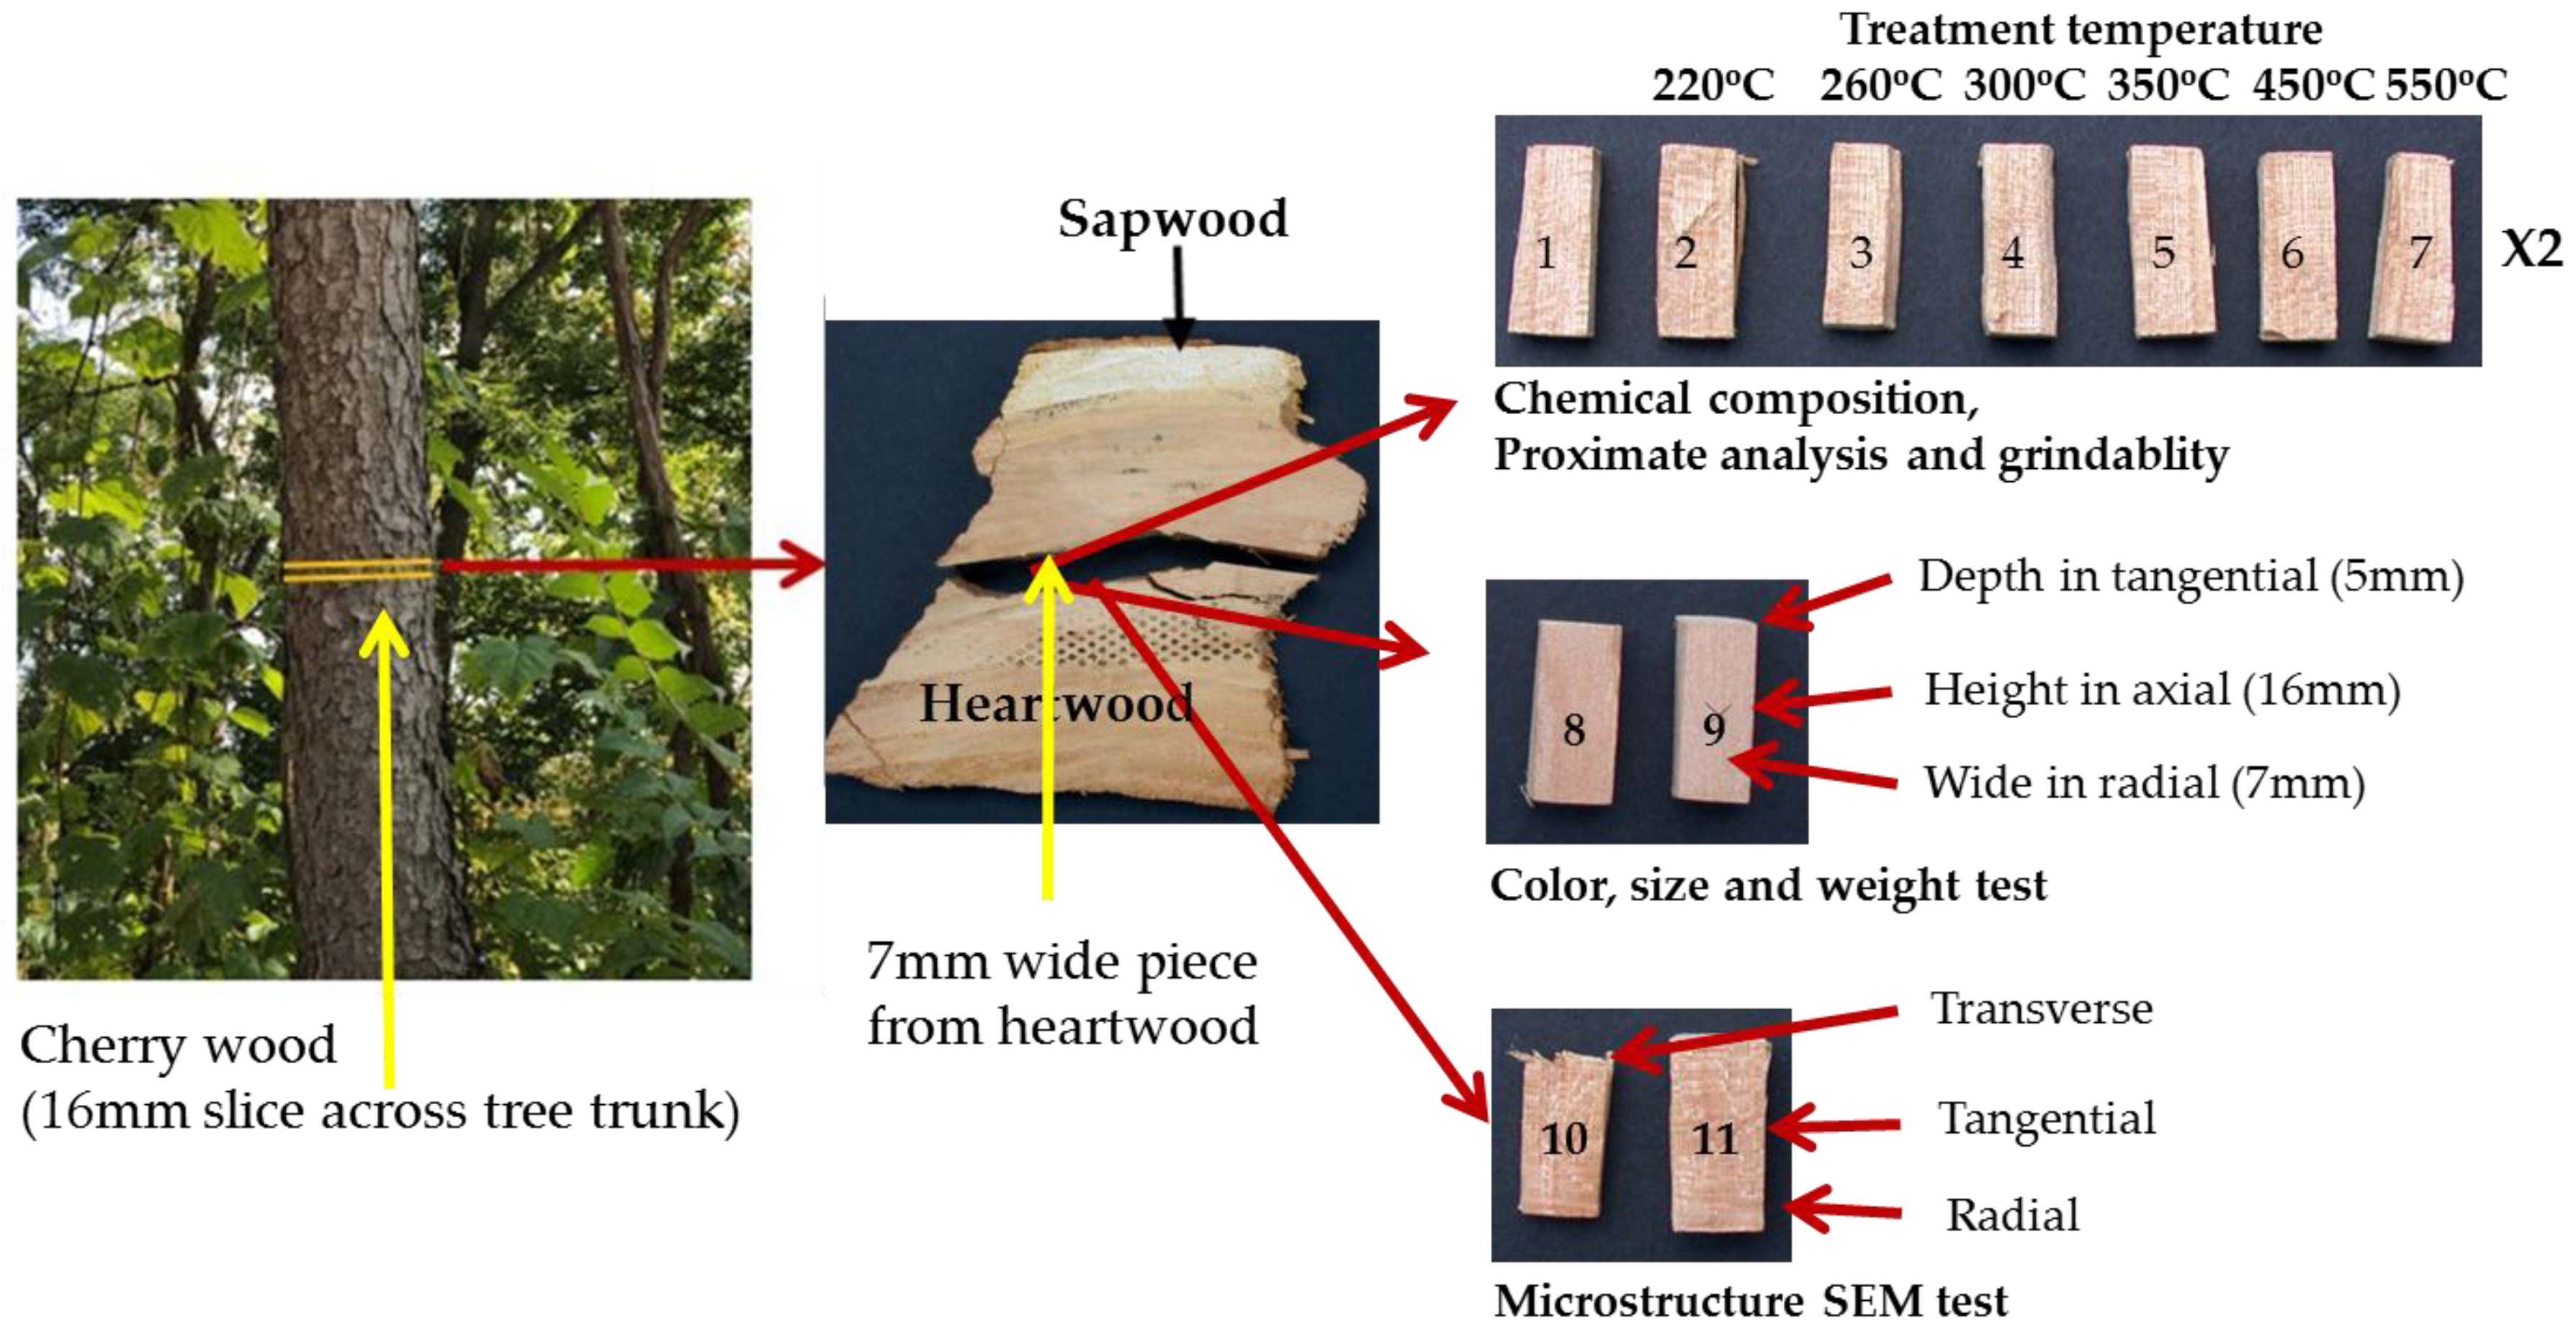
Figure 2.
Schematic diagram of the thermal treatment experimental setup.

Figure 3.
(a) Illustration of a section of wood showing the three planes discussed [39]; (b) Schematic of a wood sample used for these tests with the dimensions and orientations indicated.
Figure 3.
(a) Illustration of a section of wood showing the three planes discussed [39]; (b) Schematic of a wood sample used for these tests with the dimensions and orientations indicated.

Figure 4.
(a) Thermogravimetry (TG); (b) Differential thermogravimetry (DTG) curves versus temperature for the pure model components (xylan/hemicelluloses, cellulose, and lignin) of biomass cell wall components.
Figure 4.
(a) Thermogravimetry (TG); (b) Differential thermogravimetry (DTG) curves versus temperature for the pure model components (xylan/hemicelluloses, cellulose, and lignin) of biomass cell wall components.


Figure 5.
(a) Illustration of three main regions in the cell wall: the middle lamella (ML), the primary wall (P), and the three layers of the secondary wall (S1, S2 and S3) [44]; (b) Proposed ultrastructural model of the arrangement of hemicellulose, cellulose and lignin in the S2 layer [32].

Figure 6.
SEM images (horizontal field width = 1.28 mm; scale bar of 500 µm; vertical as images are presented) of the tangential section views of the untreated and the 260 and 550 °C treated cherry wood samples. White arrows indicate rays and fibers seen in end-view formed by stacks of ray parenchyma cells, also pores are visible in the tangential section images. Yellow bars indicate shrinkage along the axial direction using reference structures. Red bars mark shrinkage along the tangential direction using reference structures.

Figure 7.
SEM images (horizontal field width = 1.28 mm; scale bar of 500 µm; vertical as images are presented) of the radial section views of the untreated and the 300 and 550 °C treated cherry wood samples. White arrows point out fibers and rays that look like a brick wall crossing in the longitudinal direction, also pores are visible in the radial section images. Yellow bars mark shrinkage along the axial direction (using reference structures). Red bars mark shrinkage along the radial direction (using reference structures).
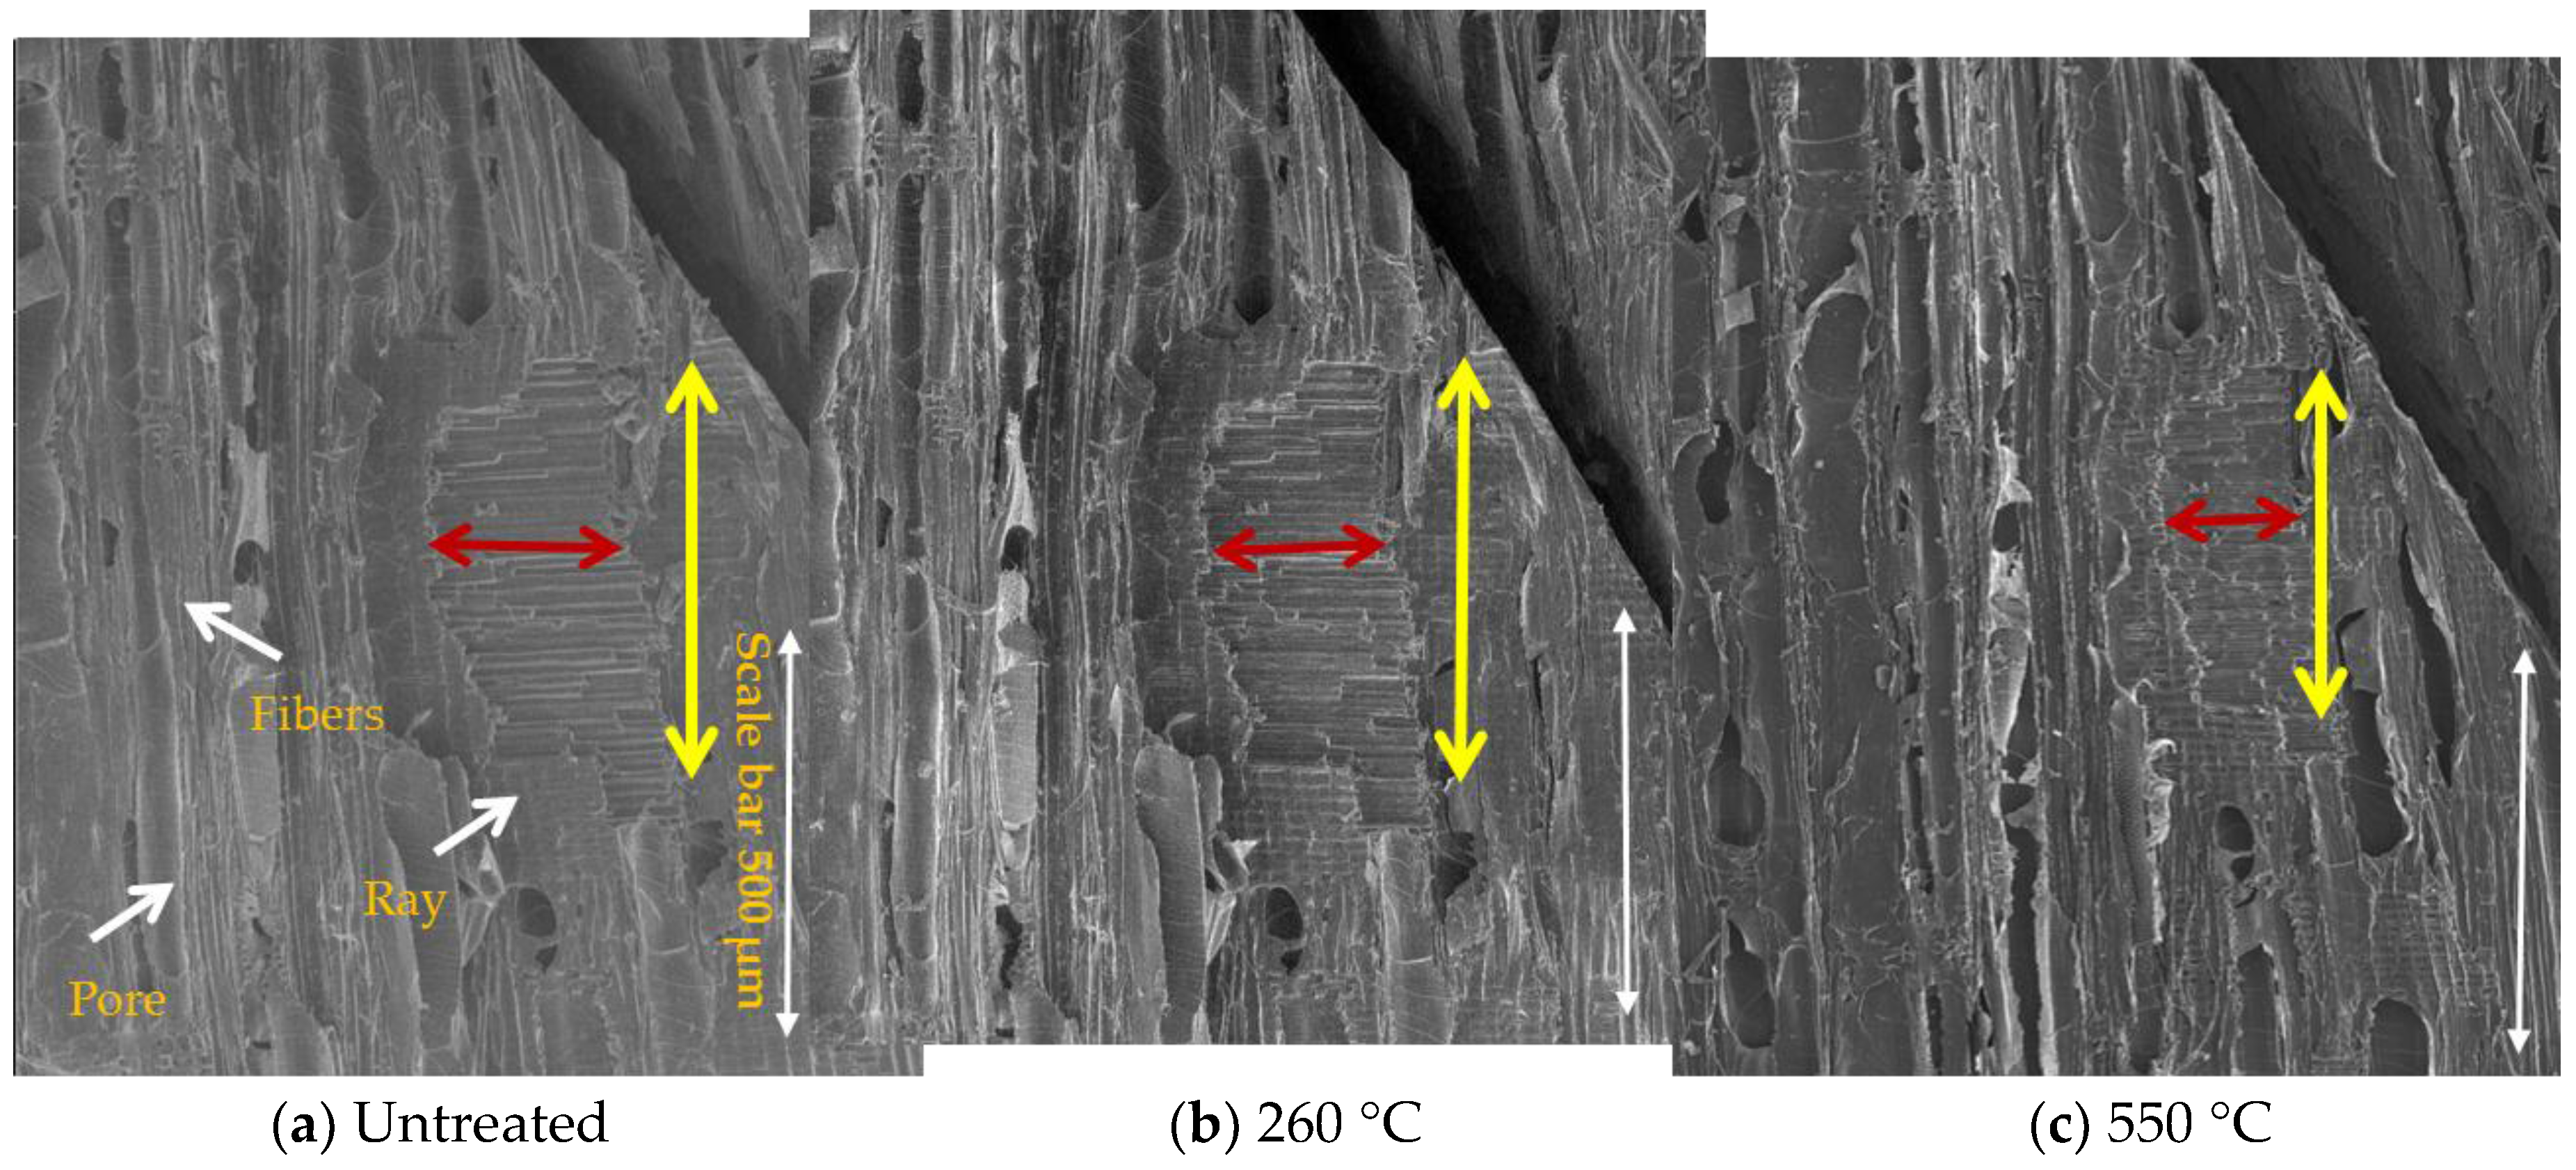
Figure 8.
SEM images (horizontal field width = 1.28 mm; scale bar of 500 µm) of the cross section views of the untreated and the 300 and 550 °C treated cherry wood samples. White arrows point out fibers and pores. Yellow bars mark annual or growth rings and its shrinkage along the radial direction (using reference structures).
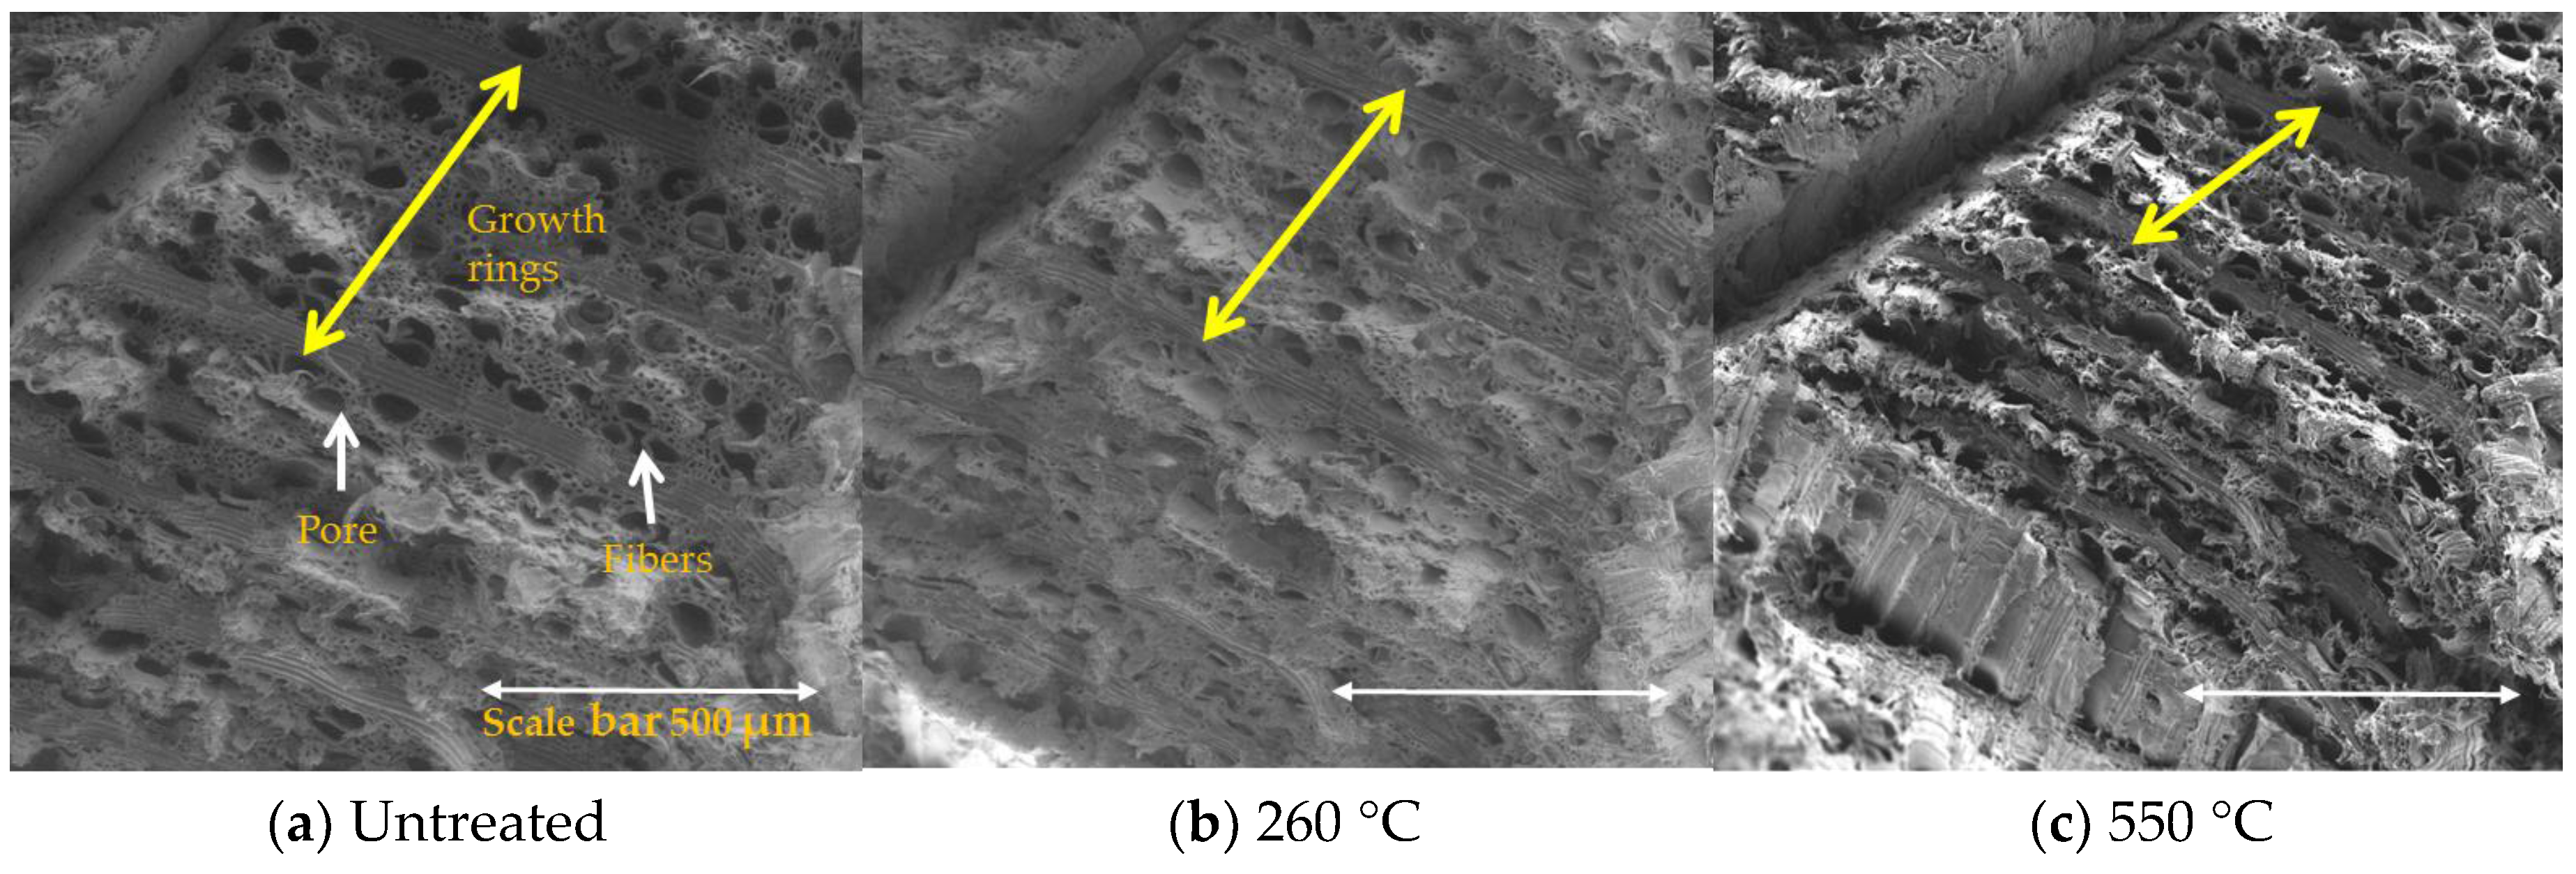
Figure 9.
SEM images (horizontal field width = 320 μm; scale bar of 100 µm) of the cross section views of the untreated and the 350 and 450 °C treated cherry wood samples. White bars point out cell walls which were thinner after the thermal treatments.
Figure 9.
SEM images (horizontal field width = 320 μm; scale bar of 100 µm) of the cross section views of the untreated and the 350 and 450 °C treated cherry wood samples. White bars point out cell walls which were thinner after the thermal treatments.


Table 1.
Calculated cell wall chemical component of untreated and treated woods at each treatment temperature based on thermogravimetric analyzer (TGA) tests.
Table 1.
Calculated cell wall chemical component of untreated and treated woods at each treatment temperature based on thermogravimetric analyzer (TGA) tests.
| Samples | Chemical Components (%) | ||
|---|---|---|---|
| Hemicellulose | Cellulose | Lignin | |
| Untreated | 24.3 | 42.8 | 32.9 |
| 220 | 21.2 | 46.1 | 32.8 |
| 260 | 10.1 | 48.3 | 41.6 |
| 300 | 7.4 | 38.7 | 53.9 |
| 350 | 0.0 | 6.8 | 93.2 |
| 450 | 0.0 | 0.0 | 100.0 |
| 550 | 0.0 | 0.0 | 100.0 |
Table 2.
Physical property changes of untreated and treated woods at each treatment temperature.
| Physical Property | Temperature (°C) | ||||||
|---|---|---|---|---|---|---|---|
| 25 | 220 | 260 | 300 | 350 | 450 | 550 | |
| Color |  |  |  |  |  |  |  |
| Weight loss (%) | 0 | 15.84 | 27.57 | 39.21 | 62.07 | 69.70 | 73.22 |
| Height shrinkage (%) | 0 | 0.09 | 0.06 | 0.41 | 6.48 | 12.51 | 15.34 |
| Wide shrinkage (%) | 0 | 3.85 | 6.64 | 10.72 | 22.54 | 26.95 | 29.53 |
| Depth shrinkage (%) | 0 | 1.06 | 2.31 | 4.52 | 13.57 | 19.44 | 22.24 |
| Volume loss (%) | 0 | 4.96 | 8.85 | 15.11 | 37.39 | 48.52 | 53.60 |
| Bulk density (g/cm3) | 0.54 | 0.48 | 0.43 | 0.39 | 0.33 | 0.32 | 0.31 |
| Density change (%) | 0 | −11.44 | −20.54 | −28.39 | −39.43 | −41.16 | −42.29 |
Table 3.
Particle size distribution of the milled untreated and treated woods.
| Samples | >500 µm | 500–212 µm | 212–106 µm | <106 µm |
|---|---|---|---|---|
| Untreated | 66.0 | 40.7 | 11.0 | 2.8 |
| 220 | 63.6 | 45.9 | 11.9 | 1.5 |
| 260 | 54.2 | 53.2 | 23.5 | 3.6 |
| 300 | 32.3 | 38.1 | 55.5 | 3.0 |
| 350 | 4.2 | 33.6 | 45.5 | 16.7 |
| 450 | 4.6 | 23.6 | 50.5 | 21.4 |
| 550 | 3.8 | 24.7 | 49.8 | 21.8 |
Table 4.
Proximate analysis and high heating value changes of untreated and treated woods at each treatment temperature.
Table 4.
Proximate analysis and high heating value changes of untreated and treated woods at each treatment temperature.
| Samples | VM | FC | Ash | High Heating Value (MJ/kg) | High Heating Value (MJ/m3) | ||||||
|---|---|---|---|---|---|---|---|---|---|---|---|
| Proximate | Incr. | Lignine | Incr. | Proximate | Decr. | Lignine | Decr. | ||||
| (wt%) | (wt%) | (wt%) | Eq. 2 | % | Eq. 1 | % | Eq. 2 | % | Eq. 1 | % | |
| Untreated | 88.1 | 11.5 | 0.4 | 17.8 | 19.7 | 9605.2 | 10663.2 | ||||
| 220 | 85.7 | 13.9 | 0.5 | 18.3 | 2.6 | 19.7 | 0.0 | 8760.0 | −8.8 | 9474.1 | −11.2 |
| 260 | 82.0 | 16.0 | 0.8 | 18.9 | 6.1 | 20.5 | 3.9 | 8113.0 | −15.5 | 8823.6 | −17.3 |
| 300 | 73.3 | 24.9 | 0.7 | 20.6 | 15.9 | 21.6 | 9.5 | 8041.5 | −16.3 | 8429.3 | −20.9 |
| 350 | 44.1 | 54.3 | 0.9 | 26.3 | 47.9 | 25.1 | 27.1 | 8682.0 | −9.6 | 8285.4 | −22.3 |
| 450 | 25.8 | 72.9 | 1.6 | 29.7 | 66.9 | 25.7 | 30.2 | 9500.3 | −1.1 | 8227.8 | −22.8 |
| 550 | 14.9 | 83.4 | 1.7 | 31.8 | 78.7 | -- | -- | 9856.0 | 2.6 | -- | -- |
© 2017 by the authors. Licensee MDPI, Basel, Switzerland. This article is an open access article distributed under the terms and conditions of the Creative Commons Attribution (CC BY) license (http://creativecommons.org/licenses/by/4.0/).
Share and Cite
MDPI and ACS Style
Wang, P.; Howard, B.H. Impact of Thermal Pretreatment Temperatures on Woody Biomass Chemical Composition, Physical Properties and Microstructure. Energies 2018, 11, 25. https://doi.org/10.3390/en11010025
AMA Style
Wang P, Howard BH. Impact of Thermal Pretreatment Temperatures on Woody Biomass Chemical Composition, Physical Properties and Microstructure. Energies. 2018; 11(1):25. https://doi.org/10.3390/en11010025
Chicago/Turabian StyleWang, Ping, and Bret H. Howard. 2018. "Impact of Thermal Pretreatment Temperatures on Woody Biomass Chemical Composition, Physical Properties and Microstructure" Energies 11, no. 1: 25. https://doi.org/10.3390/en11010025
Note that from the first issue of 2016, this journal uses article numbers instead of page numbers. See further details here.