Frequency Regulation of a Hybrid Wind–Hydro Power Plant in an Isolated Power System


Department of Hydraulic, Energy and Environmental Engineering, Universidad Politécnica de Madrid, C/Profesor Aranguren, 28040 Madrid, Spain
*
Author to whom correspondence should be addressed.
Energies 2018, 11(1), 239; https://doi.org/10.3390/en11010239
Submission received: 13 December 2017
/
Revised: 11 January 2018
/
Accepted: 16 January 2018
/
Published: 19 January 2018
(This article belongs to the Special Issue Wind Generators Modelling and Control)
Abstract
:Currently, some small islands with high wind potential are trying to reduce the environmental and economic impact of fossil fuels by using renewable resources. Nevertheless, the characteristics of these renewable resources negatively affect the quality of the electrical energy, causing frequency disturbances, especially in isolated systems. In this study, the combined contribution to frequency regulation of variable speed wind turbines (VSWT) and a pump storage hydropower plant (PSHP) is analyzed. Different control strategies, using the kinetic energy stored in the VSWT, are studied: inertial, proportional, and their combination. In general, the gains of the VSWT controller for interconnected systems proposed in the literature are not adequate for isolated systems. Therefore, a methodology to adjust the controllers, based on exhaustive searches, is proposed for each of the control strategies. The control strategies and methodology have been applied to a hybrid wind–hydro power plant on El Hierro Island in the Canary archipelago. At present, in this isolated power system, frequency regulation is only provided by the PSHP and diesel generators. The improvements in the quality of frequency regulation, including the VSWT contribution, have been proven based on simulating different events related to wind speed, or variations in the power demand.
1. Introduction
The increased use of intermittent renewable energy sources in most electric power systems has been documented [1,2]. These increases constitute a good way to reduce polluting gases generated by fossil fuel combustion. However, this class of renewable energies involves inherent drawbacks, such as unpredictability [3] or demand independence [4]. These characteristics of renewable sources negatively affect the quality of the supplied electrical energy, causing frequency [5] and power disturbances [6].
According to Albadi and El-Saadany [3], the impact of renewable energies on power systems depends mainly on its penetration rate and the system inertia. For this reason, the negative effects of renewable energy sources are amplified in isolated systems. Nevertheless, in islands with wind potential, the economic and environmental costs of fossil fuels can be reduced. Therefore, the reduced use of fossil fuels owing to the increasing use of renewable energies in small isolated systems has become the main focus of numerous researchers during the past few years [7,8,9,10]. For example, Kaneshiro [11] has analyzed how wind ramps affect the quality of supply in a Hawaiian power system, considering different rates of renewable penetration and highlighting the importance of wind forecasting in the medium and long term in order to operate the system safely and efficiently. In [12], the penetration of wind energy in Flores Island has been shown to be limited because of low-frequency problems. According to [13], the increased penetration of wind and solar energy in the power systems of the French islands of Martinique and Réunion has generated serious problems of frequency deviations, thereby establishing load shedding operations as common operations for all these power systems. In fact, the French government—by ministerial order—has limited the penetration of renewable sources in power systems to 30%.
Different methods exist in the literature that mitigate these negative effects. In [6], a penalty system has been introduced for generators that cause frequency disturbances. Energy storage can contribute to this aim. Others [14,15] have carried out exhaustive reviews of available energy storage technologies in the last few years, remarking on the importance of pump storage hydropower plants (PSHP), flywheels, batteries, capacitors, or superconductors. Specifically, in the case of isolated systems, it has been shown that the long-term variability of renewable energy is well managed by combining wind and solar farms with PSHPs [16,17,18]. However, in the short term, PSHPs need complementary technologies capable of injecting or absorbing power over brief time periods of a few seconds to avoid inadmissible frequency variations [15,19,20]. These contributions to frequency regulations can be provided by flywheels [21,22], variable-speed hydro-pump turbines [23], and others.
Variable-speed wind turbines (VSWT) can also provide frequency regulation to mitigate large frequency deviations after disturbances [24]. Several approaches can be found in the literature on the contributions of frequency support to the regulation of wind turbines [25,26]. In general, VSWT provide negligible inertia since the fast control of power electronic converters maintains a practically constant output power irrespective of changes in the frequency of the grid [27]. However, it is possible to achieve short-term inertial responses from variable-speed wind turbines by modifying their control loops [28,29,30,31]. According to this idea, synthetic inertia of a VSWT is modeled in [32], highlighting the important improvement in the minimum frequency (NADIR). Different activation schemes for the synthetic inertia on VSWT based on full converters have been proposed in [33]. The same authors have established the practical limits of synthetic inertial gains in the inertia controller used in full-converter VSWT generators in [34].
Primary frequency regulation can also be provided by VSWT. The primary frequency response stabilizes the frequency at a new value by modifying the power generation proportionally to different frequency variations. Admittedly, a non-optimal working point can be reached in the response curve of torque and rotor speed of the turbine [35,36]. Furthermore, the impact of using doubly fed induction wind generators participating in primary frequency regulation has been evaluated in [37,38,39]. Moreover, primary frequency regulation can be combined with inertia emulation [40,41]. In [42], a control loop acting on the frequency deviation is added to the inertia emulation loop in order to enhance the inertia support from the wind turbine, maintaining a permanent frequency error.
The main problem of the contribution of VSWT to the primary regulation is that VSWT do not operate at their optimum operational point. This non-optimal operation would reduce the generated energy to some extent, and inevitably leads to economic losses [43]. To mitigate this drawback, Mauricio et al. [44] have presented a new method to improve the use of variable-speed wind energy conversion systems by modifying the inertial control scheme through the addition of a proportional loop that weights the frequency deviation. Both classical and modified inertial control loops allow the release of the stored fraction of the kinetic energy in rotational masses to provide earlier frequency support, thereby taking advantage of the fast response capability of electronically controlled converters. This control strategy does not need to have a regulation reserve, and thus allows a better use of wind resources.
The aim of this study is to evaluate the VSWT contribution to frequency regulation in an isolated power system when it operates solely based on the use of wind and hydro resources. Different control strategies for the VSWT are analyzed: inertial, proportional, and their combination. Primary regulation is not considered adequate in avoiding the negative economic effects associated with VSWT. The VSWT controller gains that have been proposed in the literature have been previously employed in interconnected systems, but these settings may not be adequate for isolated systems. Therefore, new controller adjustments will be used herein for each control strategy based on an exhaustive search. Additionally, this study has also analyzed whether it is necessary to modify the PSHP governor settings owing to the VSWT contribution to frequency regulation.
To achieve these objectives, a dynamic model has been developed. The construction of a realistic model that takes into account all the phenomena involved in system operations is essential in order to draw relevant conclusions [45]. The PSHP configuration includes a large penstock, thereby limiting the applicability of rigid-water column models, and making it necessary to consider elastic phenomena [46]. In order to model the VSWT properly, the VSWT speed governor, VSWT inertial control loop, VSWT blade pitch angle control, and VSWT aerodynamics, have been used.
Control strategies and adjustment methodology extracted from this study are applied to the El Hierro power system. El Hierro is an island in the Canary island archipelago. Historically, electric generation was based on diesel generators. The island aims to become entirely free from carbon dioxide emissions [9]. In order to contribute to the achievement of this objective, a power hybrid wind–pumped storage hydropower plant (W-PSHP) at a rated power of 22.8 MW was committed in June 2014 to minimize utilization of fossil fuels [47]. As a matter of fact, the electrical energy generated in 2015 by the W-PSHP in Gorona del Viento was 9 GWh, which corresponded to 22.5% of the total electrical energy demand in the island. During 2015, the maximum power demand was 7.7 MW. In fact, only just 1000 h of operation have been achieved since the onset of 100% renewable generation [48]. This underutilization of renewable resources may have been caused by inadmissible frequency deviations. Although the inertia and the regulation capacity of PSHP are insufficient to elicit adequate responses to the fluctuations in demand and wind generation, the regulation capacity of the VSWT is currently not used. It is expected that frequency deviations will be reduced owing to the contribution of VSWT to frequency regulation, thereby approaching the fulfilment of the objective of operating the island with 100% renewable energy.
The paper is organized as follows. In Section 2, the W-PSHP dynamic model is presented. The VSWT control loops and the control strategy are described in Section 3. The methodology used to adjust the VSWT control loop gains based on an exhaustive search is proposed in Section 4. In Section 5, some realistic events applied to El Hierro power system are proposed to simulate the W-PSHP dynamic response so as to evaluate the proposed methodology. Finally, Section 6 outlines the main conclusions of this study.
2. Hybrid Wind–Hydro Power Plant Simulation Model Description
A PSHP and a VSWT connected to an isolated system have been modeled in MATLAB (Technical University of Madrid license) with Simulink. Frequency regulation will be provided by the VSWT and the PSHP. Therefore, the simulation model includes the dynamic behavior of an isolated power system, a PSHP and a VSWT. PSHP will operate in generation mode during all simulations. The VSWT converter dynamics and the PSHP alternator are supposed to be very fast when compared with the other components of the model. Therefore, the PSHP alternator and the VSWT converter dynamics will be neglected, and the VSWT inertia is thus uncoupled from the electric system. Figure 1 shows the block diagram of the hybrid wind–hydro power plant and the power system.
2.1. Power System
As stated above, the PSHP is connected to an isolated system comprising intermittent energy sources and loads. Therefore, the frequency dynamics described by Equation (1) are the result of the imbalance between the sum of the hydroelectric ph and wind converter powers pnc and the power demand pdem.
Inertial mechanical time refers only to PSHP. VSWT is supposed to be connected to the system through a frequency converter, and does not contribute to the system inertia. The parameter k includes the load frequency sensitivity. It is assumed that k = 1, which corresponds to static loads.
2.2. Pumped Storage Hydropower Plant
A PSHP plant has been modeled with a long penstock in generation mode. Due to the length of the penstock, the elasticity of water and conduit is needed to be considered. All the variables, parameters, and coefficients used are explained in the nomenclature section.
2.2.1. Penstock
Transient flow in conduits is described by the conservation of mass and momentum (Equations (2) and (3)) [49]:
To solve these equations, different approaches can be found in the specialized literature, such as the method of characteristics [50], or the transfer function proposed in [51]. The lumped parameter approach [52,53] has been used in this study to solve Equations (2) and (3).
This approach leads to a system of ordinary differential equations that can be represented as a series of consecutive, Γ-shaped elements where the conduit properties (inertia, elasticity, and friction) are proportionally assigned to the segment length Le. The ‘configuration’ and ‘orientation’ of the Γ-shaped elements may vary according to the upstream and downstream boundary conditions of the pipe. Figure 2 shows the scheme of the penstock model. Equations (4) and (5) of the penstock dynamics are
The number of segments nt determines the order of the system.
2.2.2. Turbine
Equation (7) expresses the relation between flow, head, and nozzle opening [51], while Equation (8) expresses the generated power corresponding to ideal rated conditions in Pelton turbines where the absolute fluid speed is twice the runner peripheral speed [55]. Pelton turbines are widely used in hydropower plants with high head available.
The modeled hydropower plant has more than one identical unit. These units are supposed to operate at the same time in an identical manner. Thus, a single equivalent turbine has been used instead in the remaining parts of this work.
2.3. Variable Speed Wind Turbine Model
2.3.1. Wind Power Model
The power extracted from the wind is modeled using the mathematical function in Equation (9) [56,57]:
where λ is the ratio of the rotor blade tip speed and the wind speed (10), while θ is the blade pitch angle in degrees.
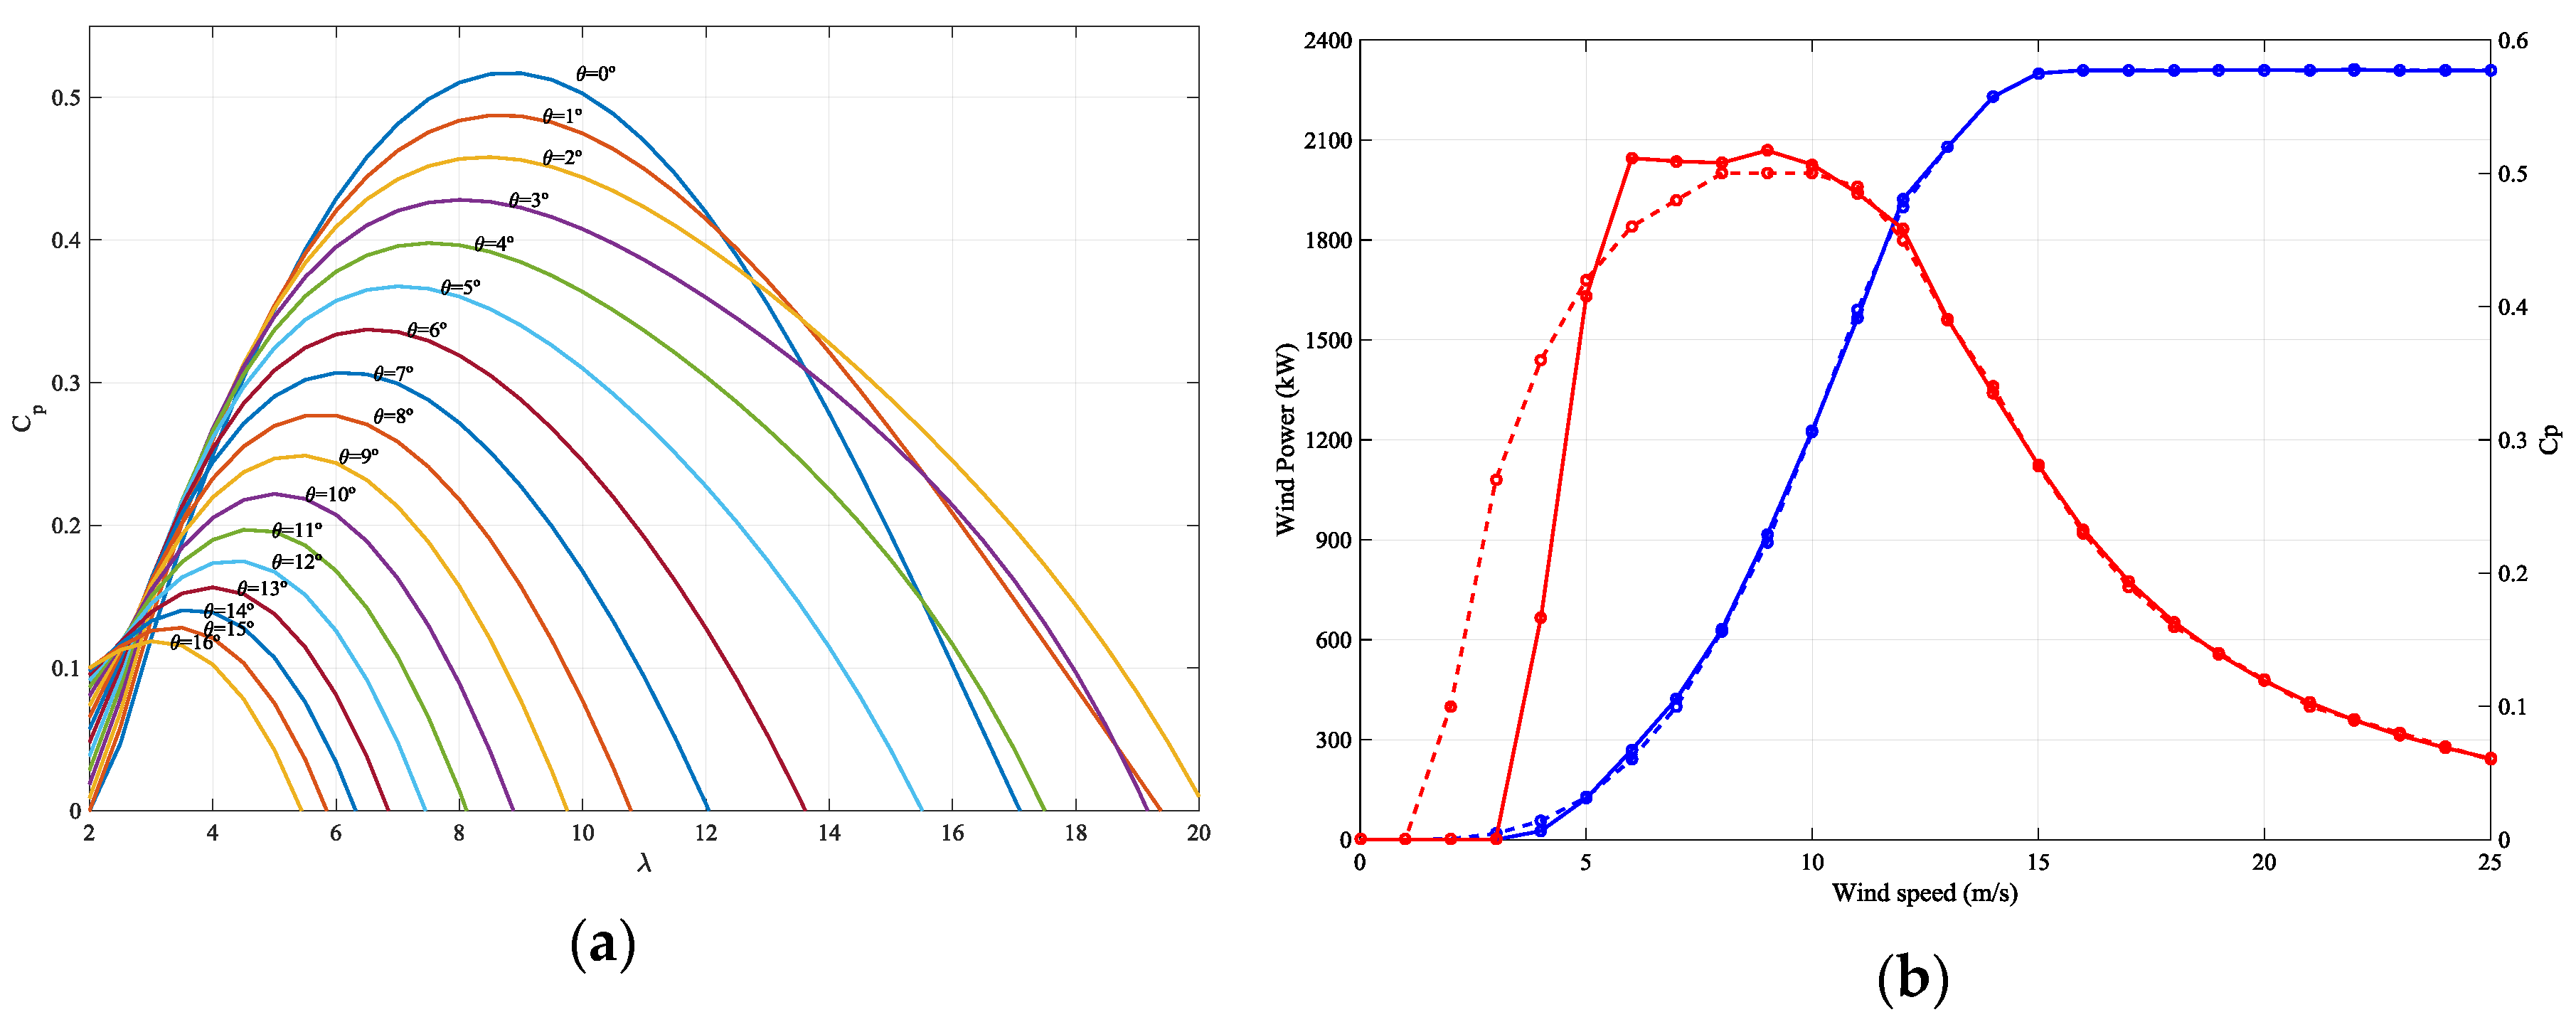
Cp is usually provided as a group of curves that relates Cp to λ and θ. Equation (11) represents the curves used in this model [57]. The Cp curves for the modeled wind turbine are shown in Figure 3a. These curves are a good approximation for values of 2 < λ < 13. Cp values corresponding to λ smaller than the previous range have been linearly interpolated between Cp (λ = 0) and Cp (λ = 2). However, λ values outside the previous range represent either very high or low wind speeds that are outside the continuous rating of the machine. These considerations are also outside the scope of this work.
2.3.2. Blade Pitch Angle Control
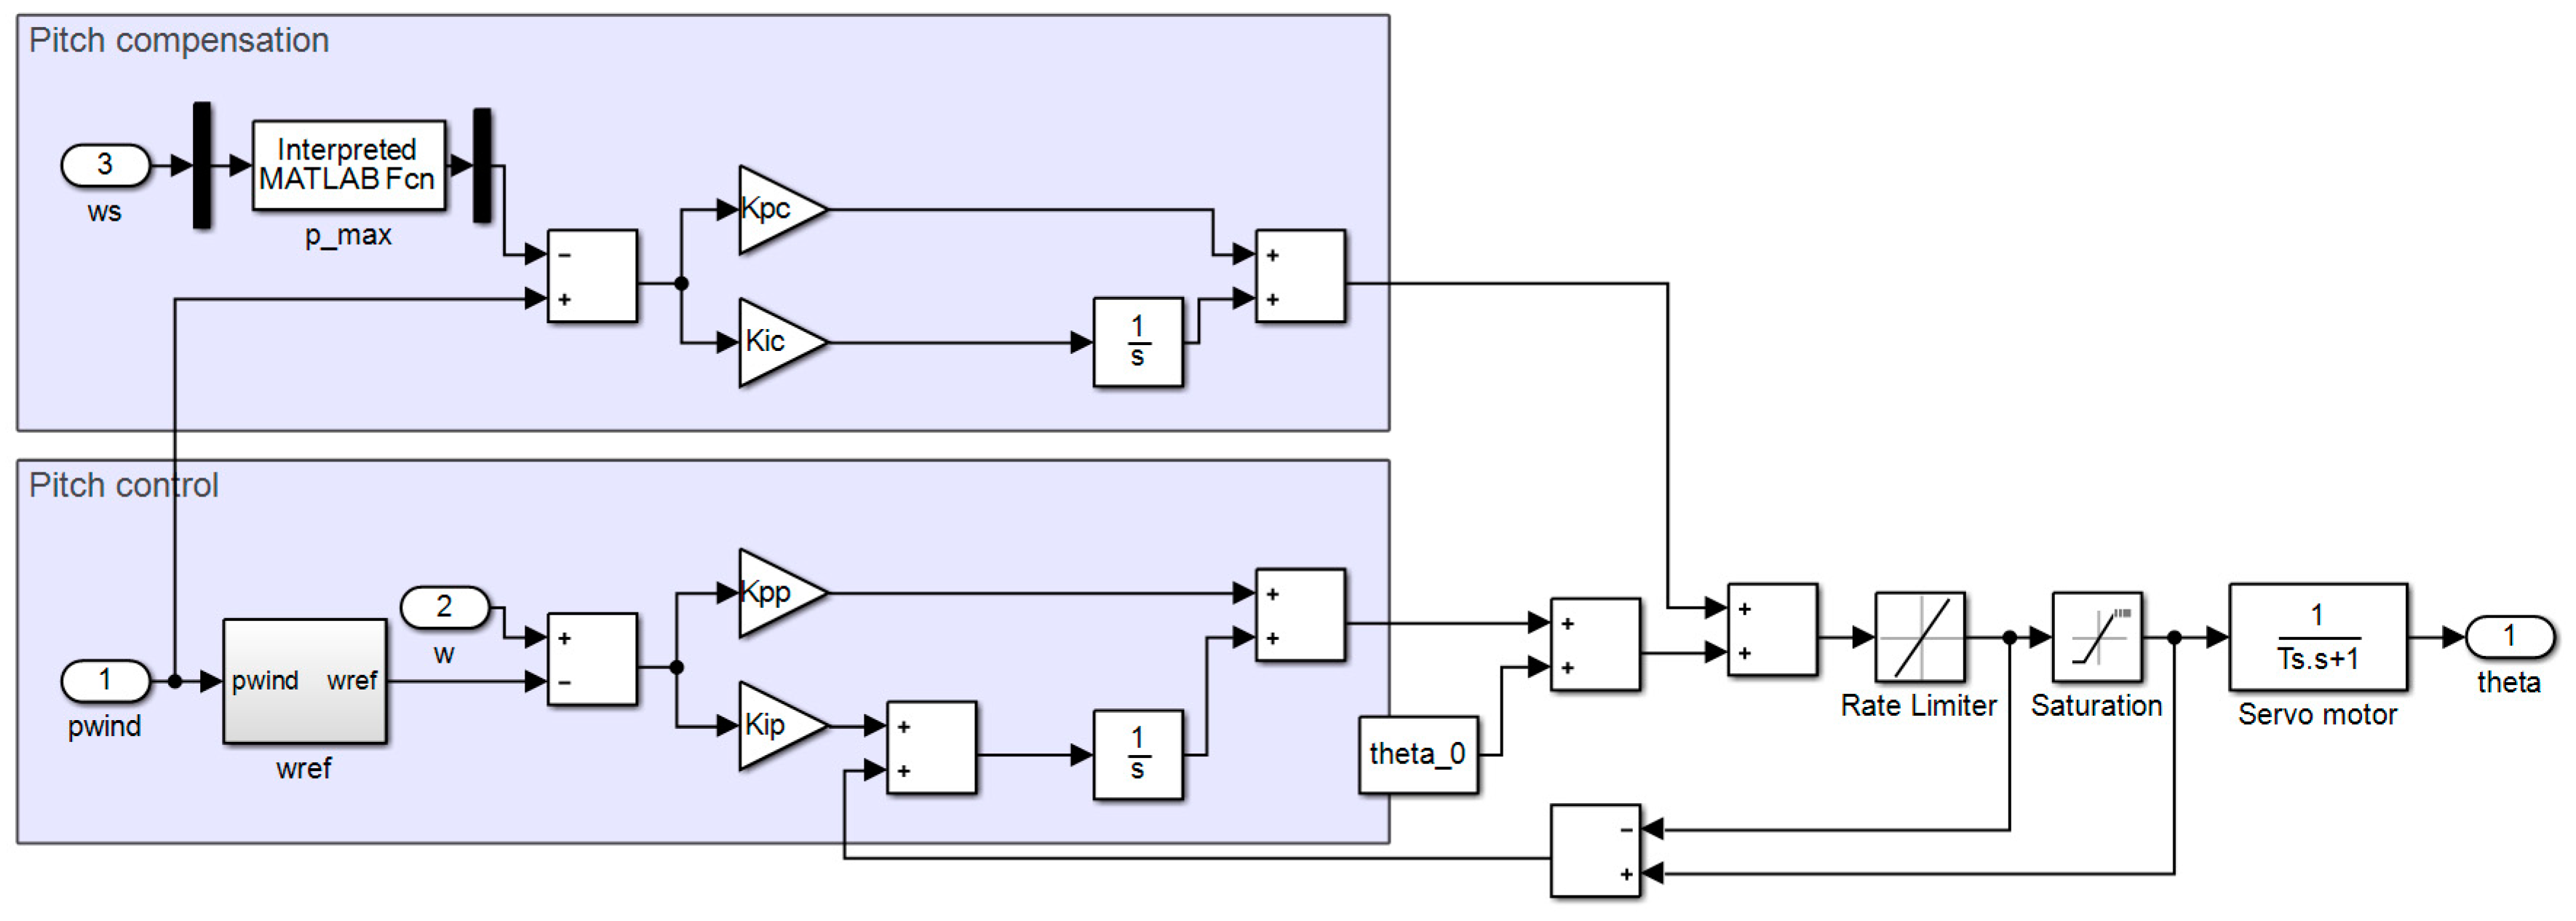
Figure 4 shows the block diagram of the blade pitch angle control. This control is a combination of a traditional pitch angle control and pitch compensation. The traditional pitch angle control implements Proportional Integral (PI) control that computes the difference between rotor and reference rotor speeds [59]. Furthermore, pitch angle control takes into account the compensation through a different PI control that computes the difference between mechanical wind power and maximum rated power for each wind speed [60].
The reference speed ωref is usually 1.2 p.u. but it can be lower. Speed reference is incorporated in the model by using the quadratic equation, which has been obtained by taking into account the operational curves provided by the manufacturers [58].
2.3.3. Mechanical Model of Rotor
The VSWT model includes the rotor inertial expression for the wind turbine rotor (12) [31]. This expression computes the rotor speed variances owing to differences between the torque provided by the wind torque and the torque demanded by the power converter:
3. Proposed Hybrid Wind–Hydro Contribution to Frequency Regulation
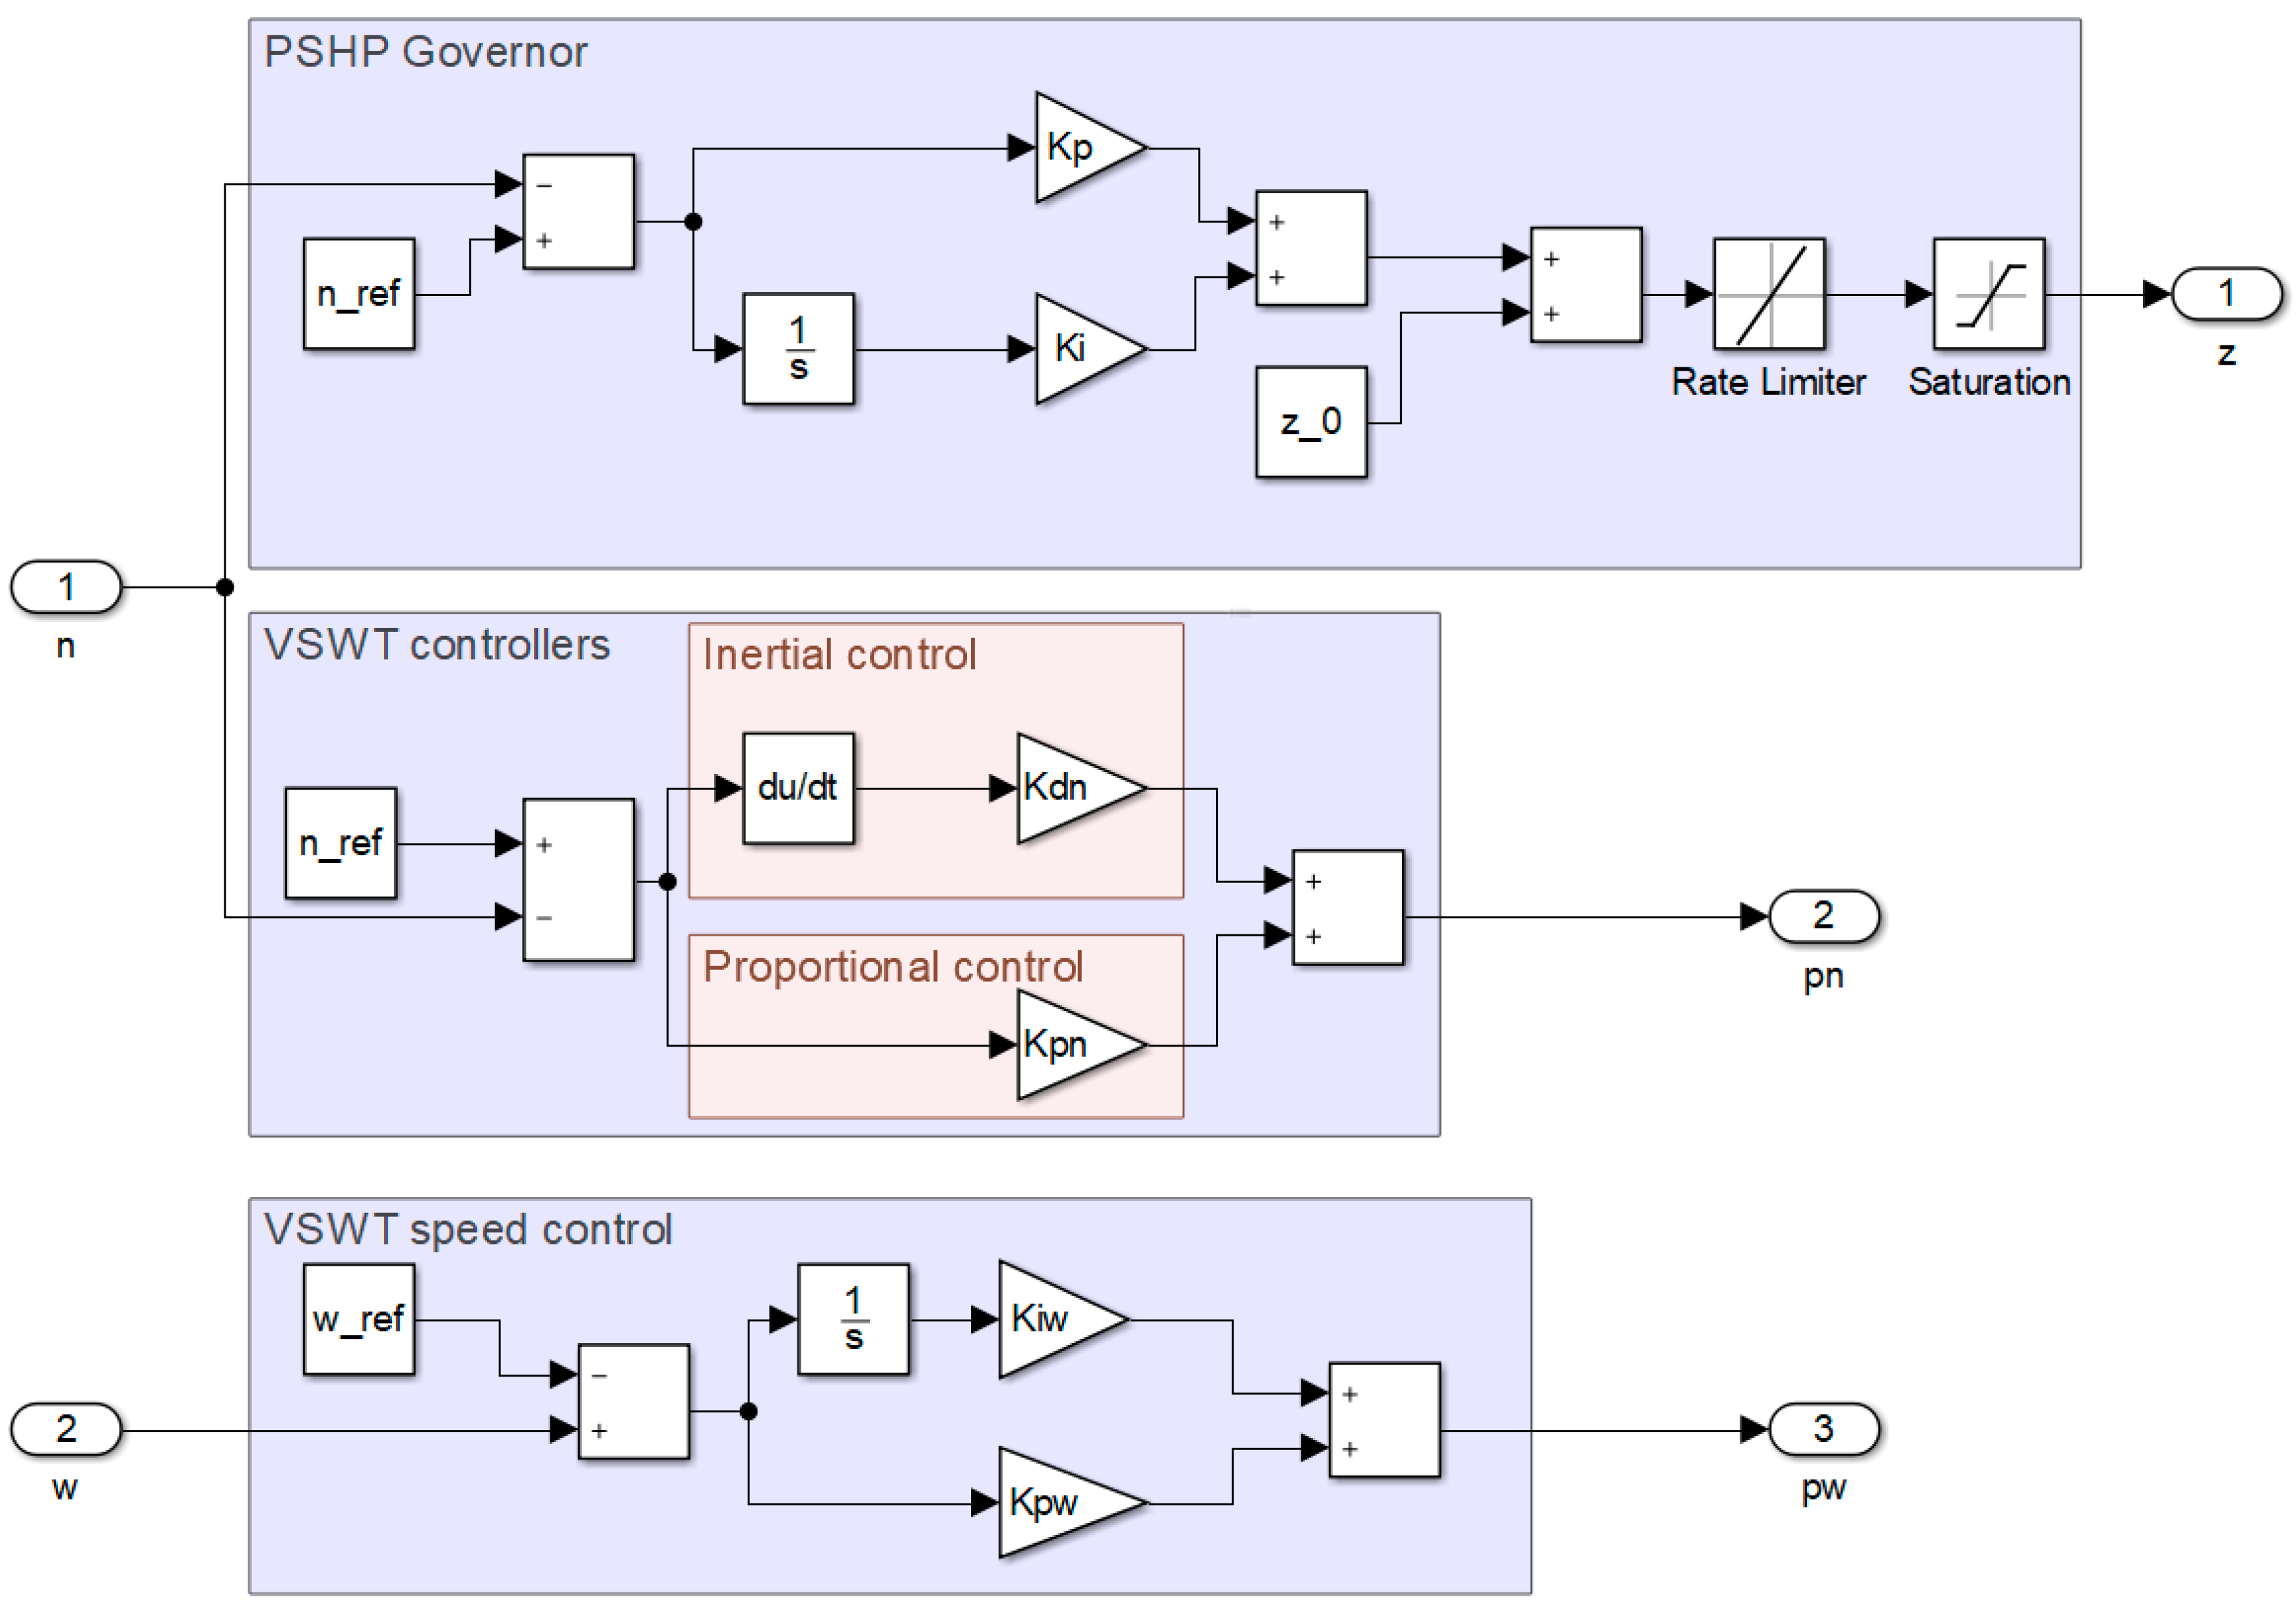
In addition to the frequency regulation, usually provided by the hydroelectric power plant, the regulation capacity of the VSWT will be used. In this study, different VSWT control strategies are analyzed in addition to hydropower frequency regulation. VSWT can contribute to frequency regulation through different control strategies: inertial, proportional, and their combination. In the following section, the PSHP governor and the VSWT control loops are described. Moreover, a wind rotor speed control is necessarily included to make the VSWT restore the reference rotor speed; otherwise, the VSWT will be destabilized. Figure 5 shows the block diagram of the hybrid wind–hydro controllers.
3.1. PSHP Governor
The proposed PSHP governor model, which is based on [45], is formulated in Equation (13). The main function of this regulator is to control the unit speed through the feedback frequency error signal, modifying the turbine nozzles and regulating the water flow through the penstock. The error signal is processed by a conventional proportional–integral (PI) controller. The limits in the positions of the turbine nozzles and their rates of change are considered in the model by the use of a rate limiter and a saturator element.
3.2. VSWT Inertial and Proportional Control Loop
Synthetic inertia is defined in [31] as ‘the response of a generating unit to frequency changes, and in particular, a power exchange that is proportional to Rate of Change of Frequency (RoCoF)’. Equation (14) represents the inertial control loop:
The same authors have also defined ‘fast frequency response’ as the controlled contribution of electrical power from a unit that quickly corrects frequency deviations. Equation (15) represents the proportional control loop:
Therefore, three control strategies can be defined. Inertial control strategy only takes the RoCoF as the control loop input. Proportional control strategy only takes the variation in frequency as the control loop input. Finally, inertial and proportional control strategy takes both variations as the control loop input.
These inertial and proportional control loops allow a fraction of the kinetic energy stored in rotational masses to be released in order to provide earlier frequency support, thereby taking advantage of the fast response capability associated with electronically controlled converters. These control strategies allows not have a regulation reserve so a better use of the wind resource is achieved.
Owing to the existence of a wind energy conversion system, the inertial and proportional control loops add a power signal to the power reference output to be tracked by the converter (16) [44].
Kpn weighs the frequency deviation, while Kdn is a constant weighing of the frequency variation rate. When inertial or proportional control is executed individually, the other controller is disabled by canceling the corresponding gain listed in Equations (14) and (15).
A methodology to adjust gain values is described in the following section. In practice, the value of Kdn is limited given its relationship with the inertial constant of the real wind turbine, Hwt [34]. This limitation has been used for its estimation.
3.3. VSWT Rotor Speed Control
The speed control, which controls the rotational speed by regulating the electromagnetic torque, aims to recover the optimal speed once the frequency transient has subsided [61]. Rotational speed control is more convenient than pitch control when the rotational speed is below the maximum value [59]. Therefore, a PI controller obtains a power reference, ∆pω (17), based on the difference between the rotational speed and the optimal rotational speed. The PI controller proposed in this study is based on [44]. The speed control must always be enabled; otherwise the VSWT will be destabilized.
The total power supplied by the electronic converter (Equation (18)) will be the sum of the mechanical power initially produced by the wind and both of the power increments that have been previously described:
4. Controllers Adjustment Methodology
A methodology based on exhaustive searches is proposed for the adjustment of the PSHP and VSWT controller gains for each of the strategies described above. The benefits of the adjustments of the PSHP and VSWT controllers used together or individually were also analyzed. To achieve these strategies, two cases were considered: (1) known gains for the PSHP controller were assumed, and the gains of the VSWT controllers were then obtained, and (2) a search was conducted for all the controller gains. In order to obtain the PSHP governor gains and assess the contribution of the VSWT regulation, a strategy was considered in which VSWT did not provide frequency regulation, classified under ‘case A’.
Blade pitch angle variations are slow enough to be decoupled from the dynamic responses of other variables. In the literature, there is agreement on the value of these gains. Therefore, gains proposed in [56,57] have been assumed. Blade pitch angle control parameters are summarized in Table A2 in Appendix A.
Taking into account the casuistry described previously, seven different cases for the exhaustive searches are distinguished. These cases are summarized in Table 1.
For cases B, D, and F, the PSHP governor gains obtained in case A were assumed. To obtain PSHP governor gains and VSWT controller gains for the cases described previously, several exhaustive searches had been carried out by varying the PSHP and VSWT controller gains when a 5% step increase in the load of the island had been simulated, according to the recommendation in [62] for the speed governor of hydraulic turbines.
For each studied case, at least two different wind speeds should be considered for the exhaustive search representing high and low wind speeds, thus assessing the VSWT operating point influence on the adjustment of the controllers. Gains bounds are summarized in Table 2. It was assumed that one equivalent turbine and one VSWT were operating. It has been verified that gains outside of these bounds can destabilize the system.
NADIR, the settling power time, or settling frequency time, are technical indicators that are used to define the system’s warranted frequency operating region from the unwarranted when an instant variance in the power demand takes place. These frequency response indicators can be used in any network to assess the frequency response owing to a loss of a generator [63]. In this case, the settling frequency time (Tn) is defined as the time it takes for the frequency to lie within the normal limits established by the Transmission System Operator (TSO) for isolated systems [64]. The settling power time (Tp) is defined as the time it takes for the power supplied by the VSWT and PSHP to be within ±2% of the power demand value.
It is difficult to find a group of controller gains that jointly provide the best values for these indicators. In the effort to achieve a compromising solution that improves these quality indicators, a coefficient has been proposed that favored increased NADIR values and penalized increased values for both settling times. This coefficient is expressed in accordance with Equation (19):
Therefore, NADIR, frequency settling time, power settling time, and the coefficient φ are used to characterise the quality of the system’s response. Adjustment criterion is defined as that aimed to extract the VSWT and PSHP controller gains based on the exhaustive searches, thereby yielding the best value of the coefficient φ.
5. Simulations and Results
Control strategies and adjustment methodology extracted from this study are applied to the El Hierro power system.
5.1. Case Study: El Hierro Power System
El Hierro is an island in the Canary island archipelago that was declared a biosphere reserve by United Nations Educational, Scientific and Cultural Organization (UNESCO). The island aims to become 100% free from carbon dioxide emissions [9]. The electrical capacity of the island is 35.9 MW, contributed by diesel generators (13 MW), solar farms (0.03 MW), and a W-PSHP rated at a power of 22.8 MW. The PSHP generates 11.32 MW, and the five VSWT provide the remaining 11.48 MW [65]. The electrical energy generated in 2015 by the Gorona del Viento W-PSHP was 9 GWh. This corresponded to 22.5% of the total electrical energy demand of the island. The maximum peak demand in that year was 7.7 MW, while the minimum was approximately 4 MW [66]. Nowadays, only 1000 h of plant operation have been achieved since the onset of power generation using 100% renewable sources in June 2014 [48]. Currently, the VSWT are not assigned to contribute to frequency regulation. Therefore, as the PSHP inertia and regulation capacity are insufficient to respond to the power demand and wind power fluctuations, a contribution from diesel generators is required to achieve frequency regulation. It is expected that the percentage of demand supplied by renewable resources will be increased. Thus, the number of hours of operation required to establish the island as self-sufficient based on the use of 100% renewable sources may be increased proportionally. In this context, it is assumed that the W-PSHP operates in isolation. Therefore, variations in power demand and wind power fluctuations are balanced by the VSWT itself and by the operation of the PSHP.
5.2. Adjustment of Control Strategies
Prior to checking the adequacy of the proposed methodology, it has been proven that the VSWT controller gains proposed in [44] for interconnected systems are not adequate for an isolated system, as shown in Figure 6, since isolated systems are more sensitive to power disturbances than interconnected systems.
Table 4 list the results of the exhaustive searches and response indicators for all the cases proposed previously for representative wind speeds of 10 m/s and 20 m/s, when a 5% power demand step is imposed.
Case A, in which the VSWT does not provide frequency regulation, is similar to the strategy proposed in [55]. It has been proven that the PSHP governor gains proposed by the authors, and the gains obtained in this study, match closely.
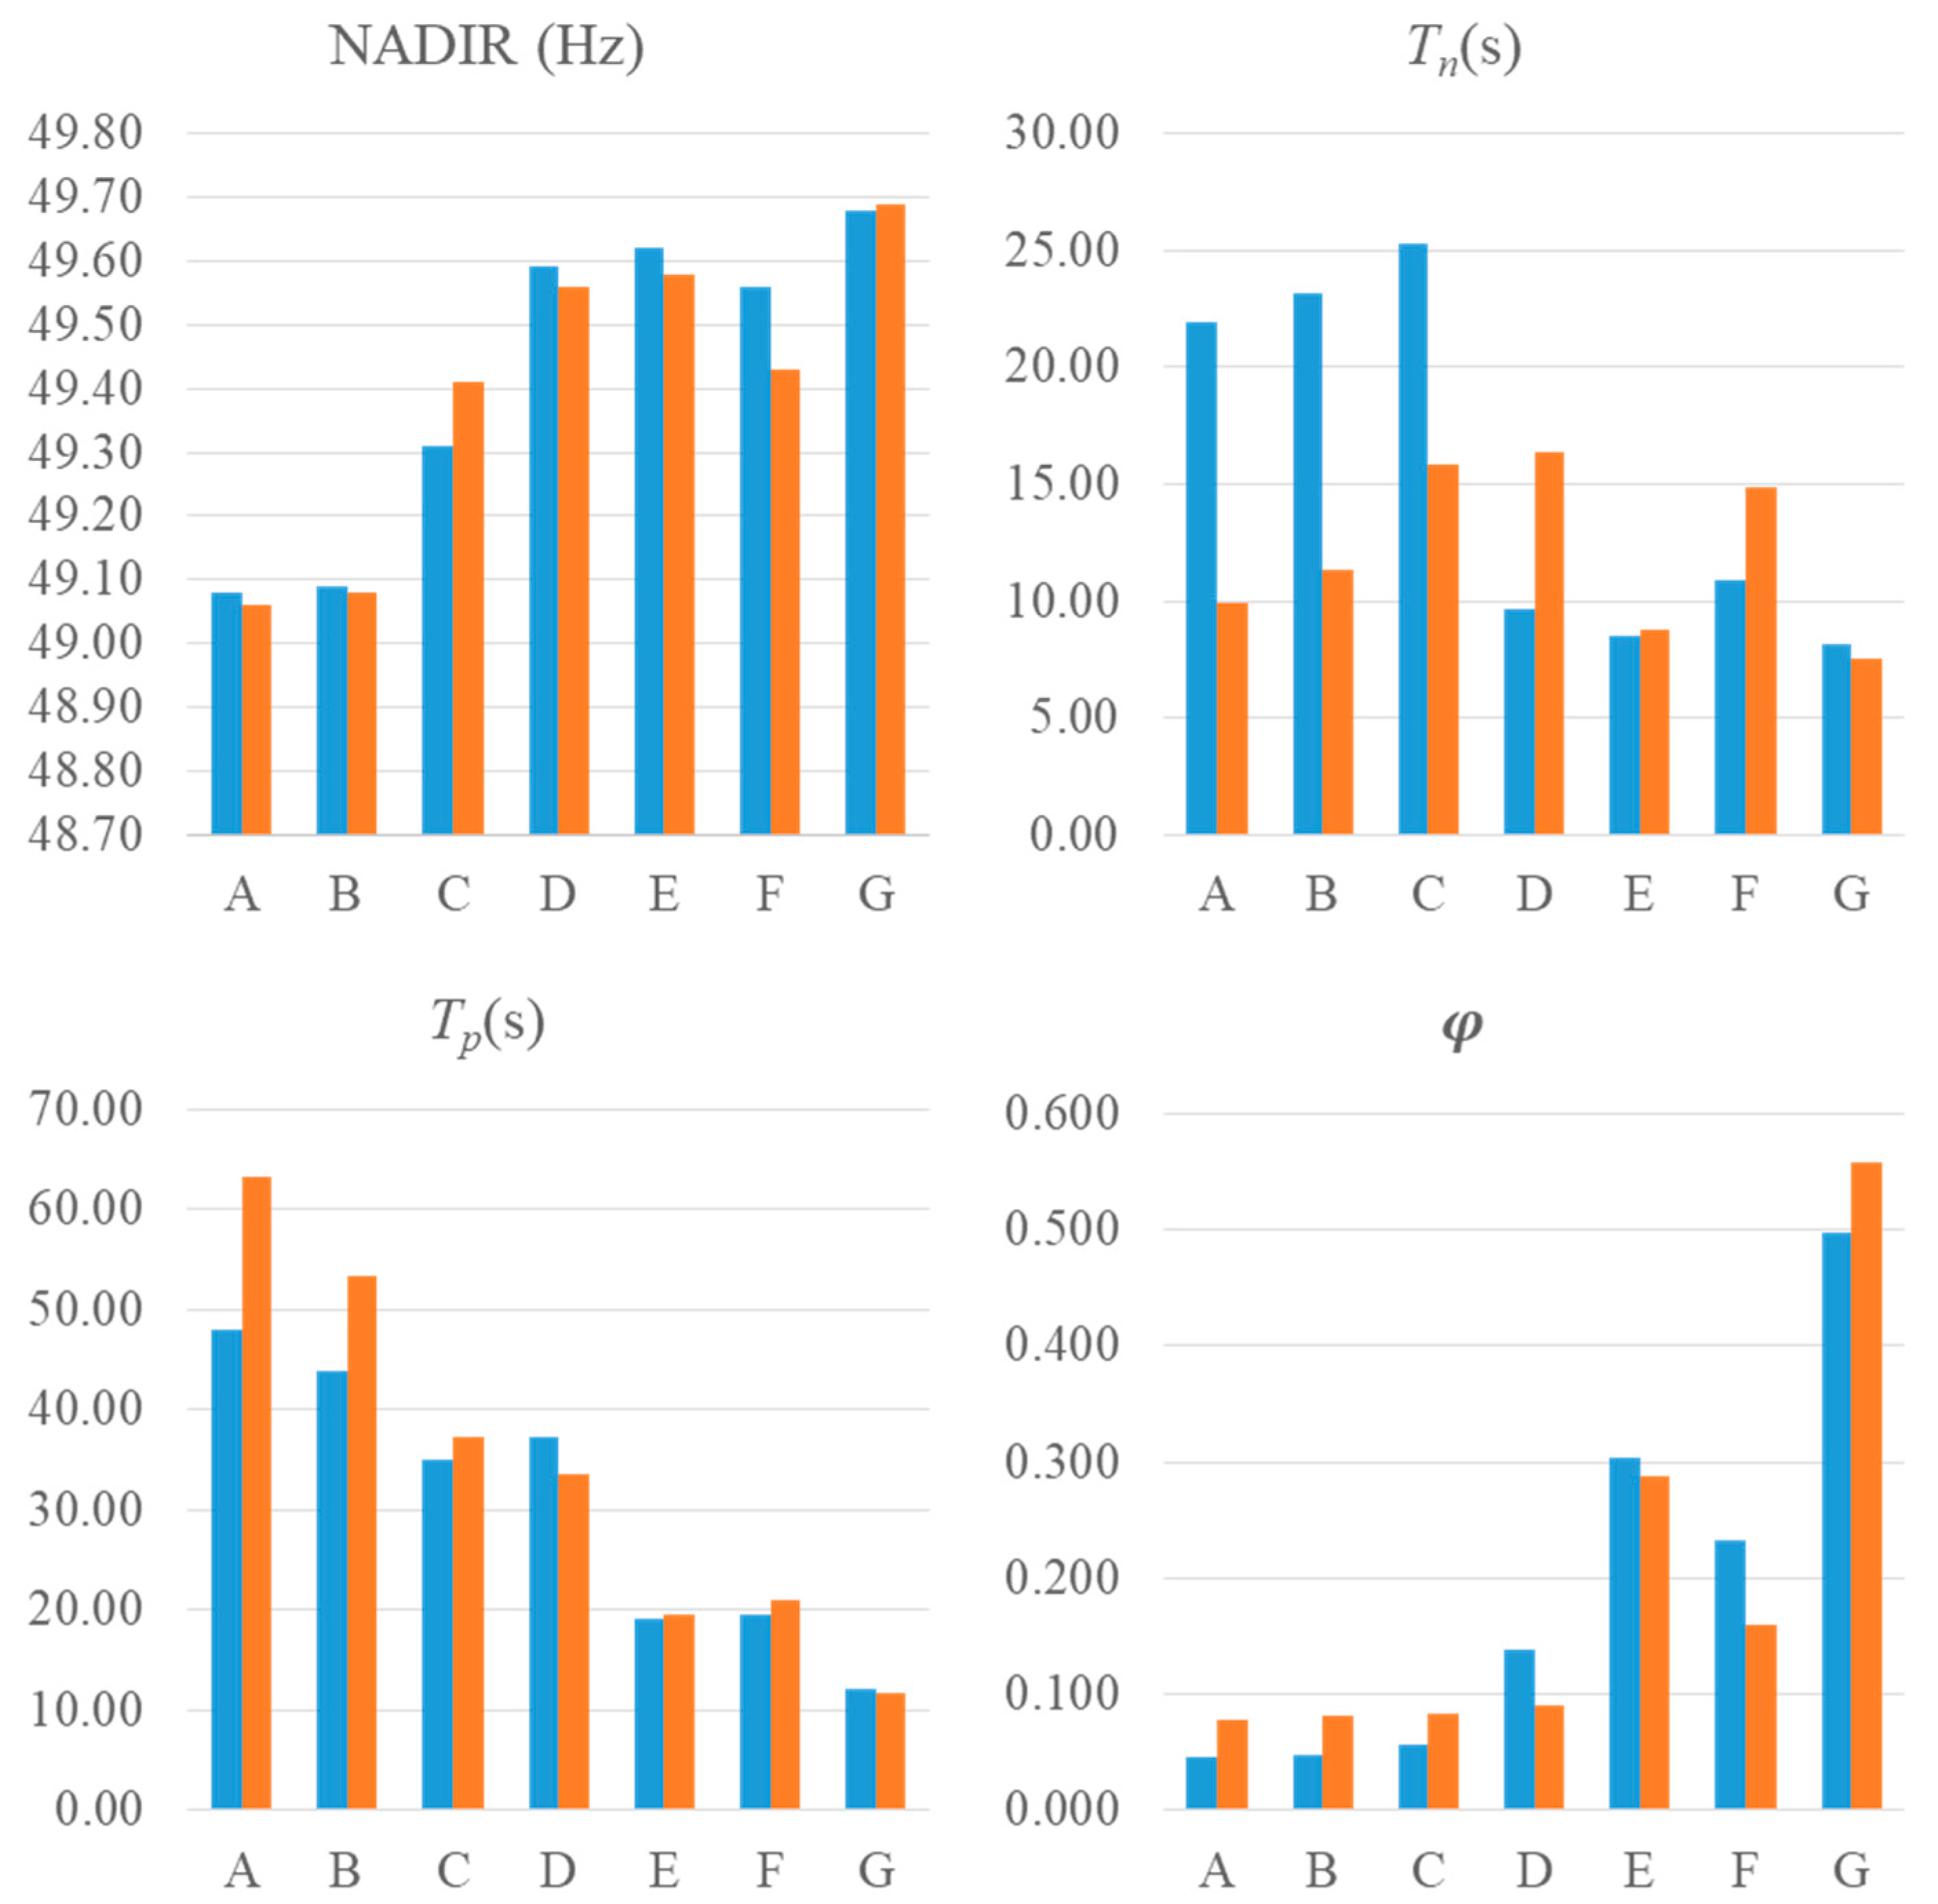
Figure 7 shows the comparison of the quality indicators between the seven proposed cases. It can be observed that the fast frequency response elicited by the proportional controller improves the NADIR value, thereby reaching an even better value when it acts synergistically with inertial control. In the same way, the power settling time is reduced. To reduce the frequency settling time, it is convenient that both controls act jointly. In contrast, if only the inertial control is effective, the frequency settling time is increased.
Although the proposed criterion does not aim towards the improvement of any particular quality indicator, the three previously mentioned are improved. It is important to highlight the system’s improvement by obtaining the set of gains jointly (PSHP + VSWT) rather than individually (VSWT), comparing elicited results from cases C, E, and G, compared to B, D, and F, respectively. Finally, the need to take into account the wind speed is verified since the latter determines the operating point of the VSWT, and therefore the operating point of the PSHP. Once the wind speed has been taken into account in the setting of the controllers, it will not significantly affect the quality of the power system.
5.3. Simulation Results
To check the suitability of controller adjustments, Jones et al. [69] affirmed that it is enough to simulate a step, a ramp, and a random signal. In accordance to this methodology, three different events related with renewable sources generation were simulated in [70]. Therefore, a load step, a wind-speed ramp (see Figure 8a) and a wind-speed fluctuation (see Figure 8b) have been simulated. Notwithstanding, unfortunately, these results cannot be compared at the present time with experimental data, it seems reasonable to expect a fairly good agreement, because a similar model has been used in [45] for Dinorwig power plant, where the simulation results reproduce the field measurements with sufficient accuracy.
Cases from B to G have been compared with case A, and have been considered as the base case to highlight the variation of each parameter mentioned previously. For case A, simulations with variable wind speeds, and gains Kpw and Kiw have been extracted from [44] and assigned to 1.5 and 0.15, respectively, since they could not be extracted from the exhaustive search.
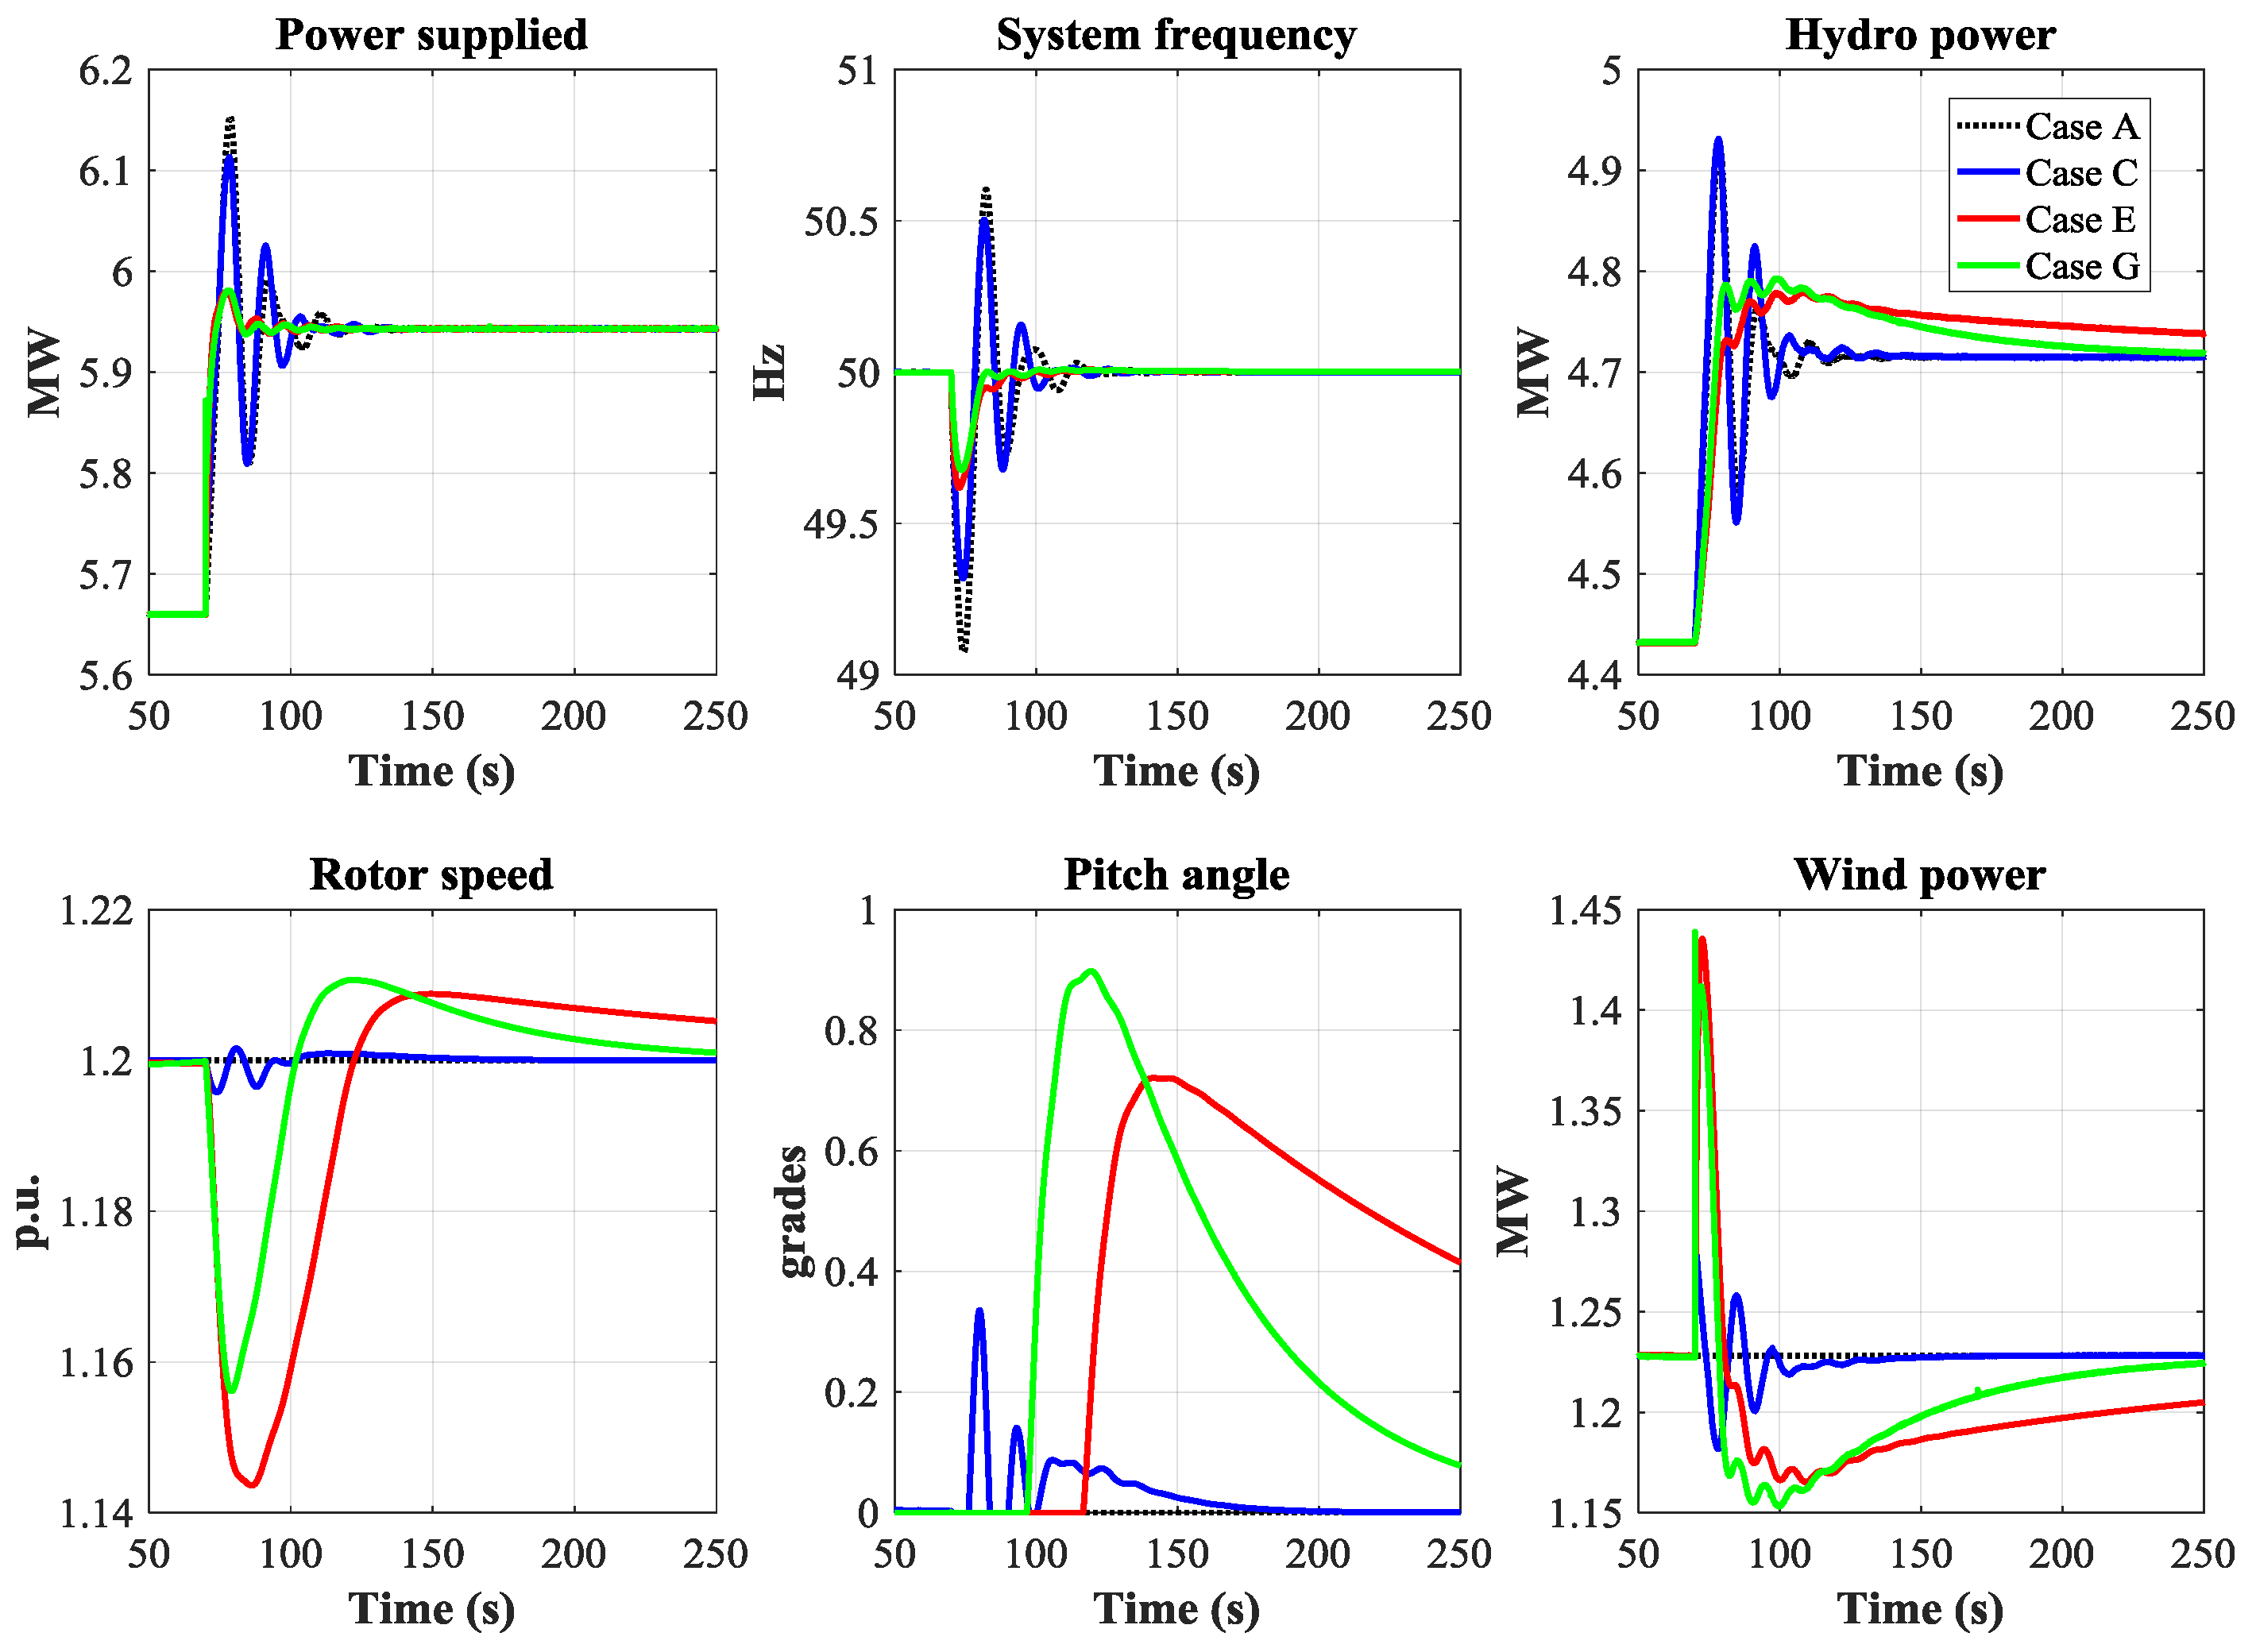
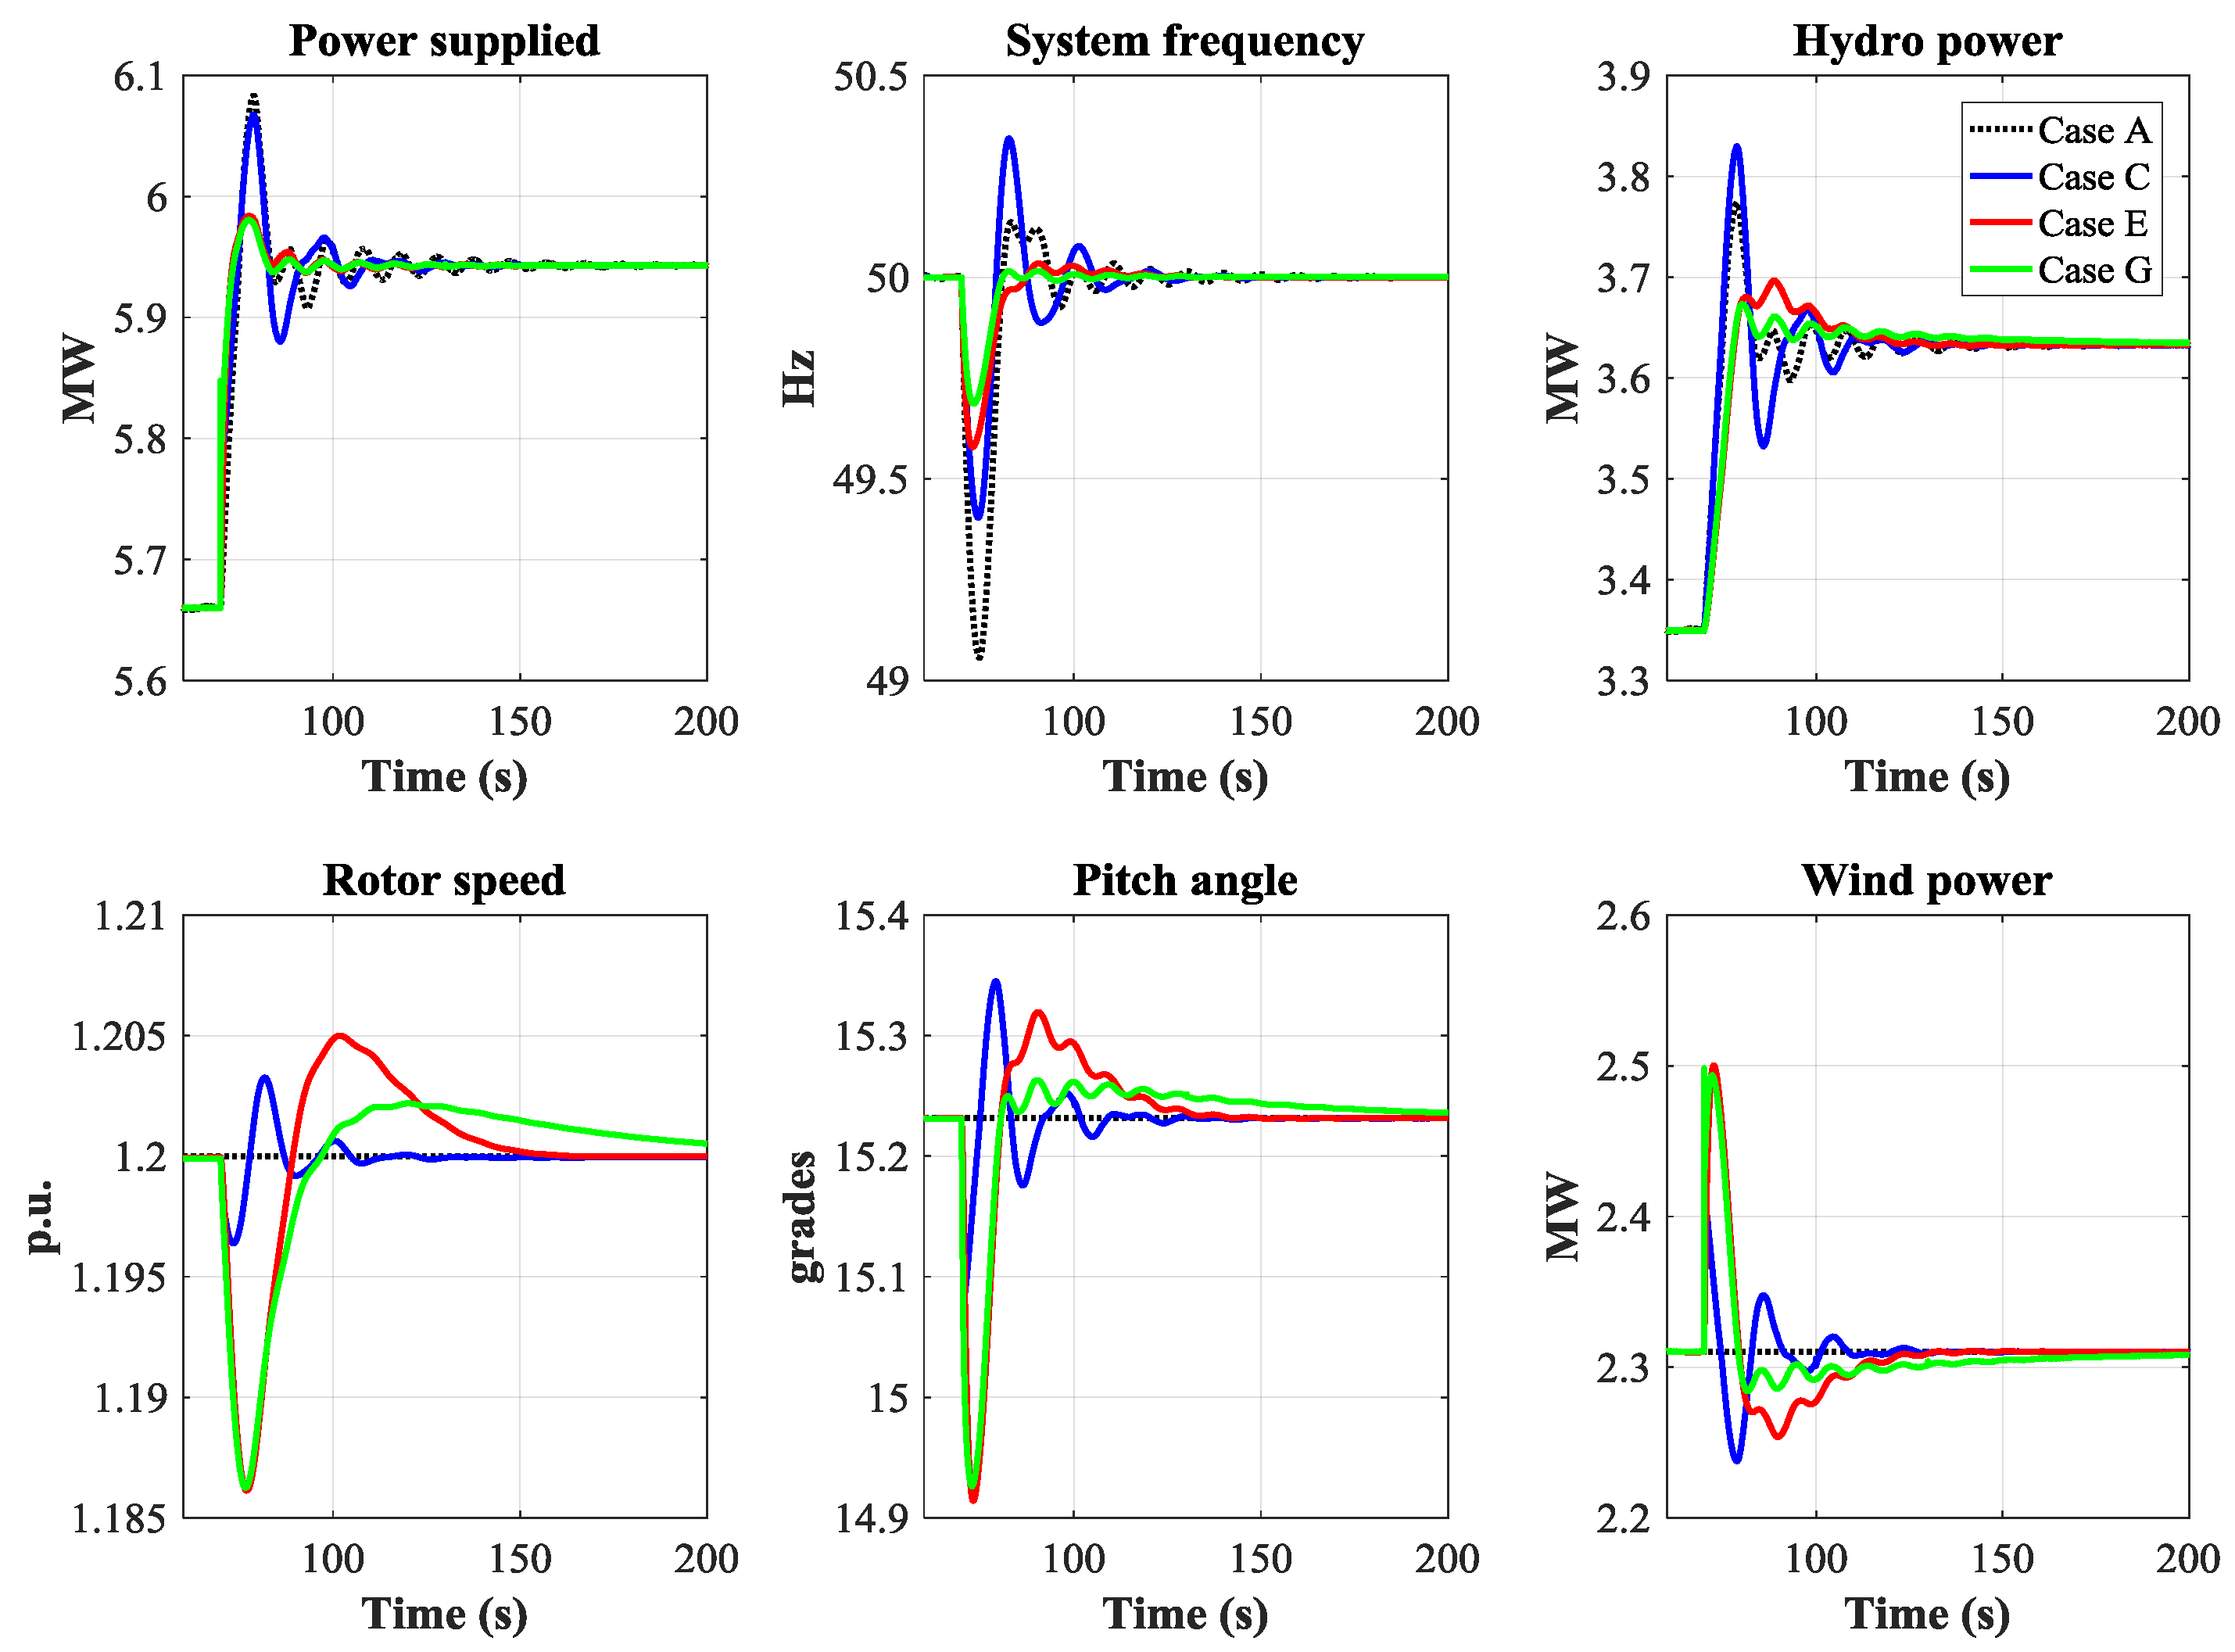
Figure 9 and Figure 10 show the dynamic response comparison between the base case (case A) and the different cases of VSWT contributions to frequency regulation, when a 5% power demand step is imposed, considering constant wind speeds of 10 m/s and 20 m/s, respectively, and for the cases in which PSHP and VSWT controller gains have been obtained jointly.
It can be verified that, regardless of the wind speed, the contribution of the VSWT to the frequency regulation is positive for the system, since it increases the value of the NADIR reducing the frequency and power settling time. In addition, VSWT contribution moderates the PSHP mechanical equipment movements.
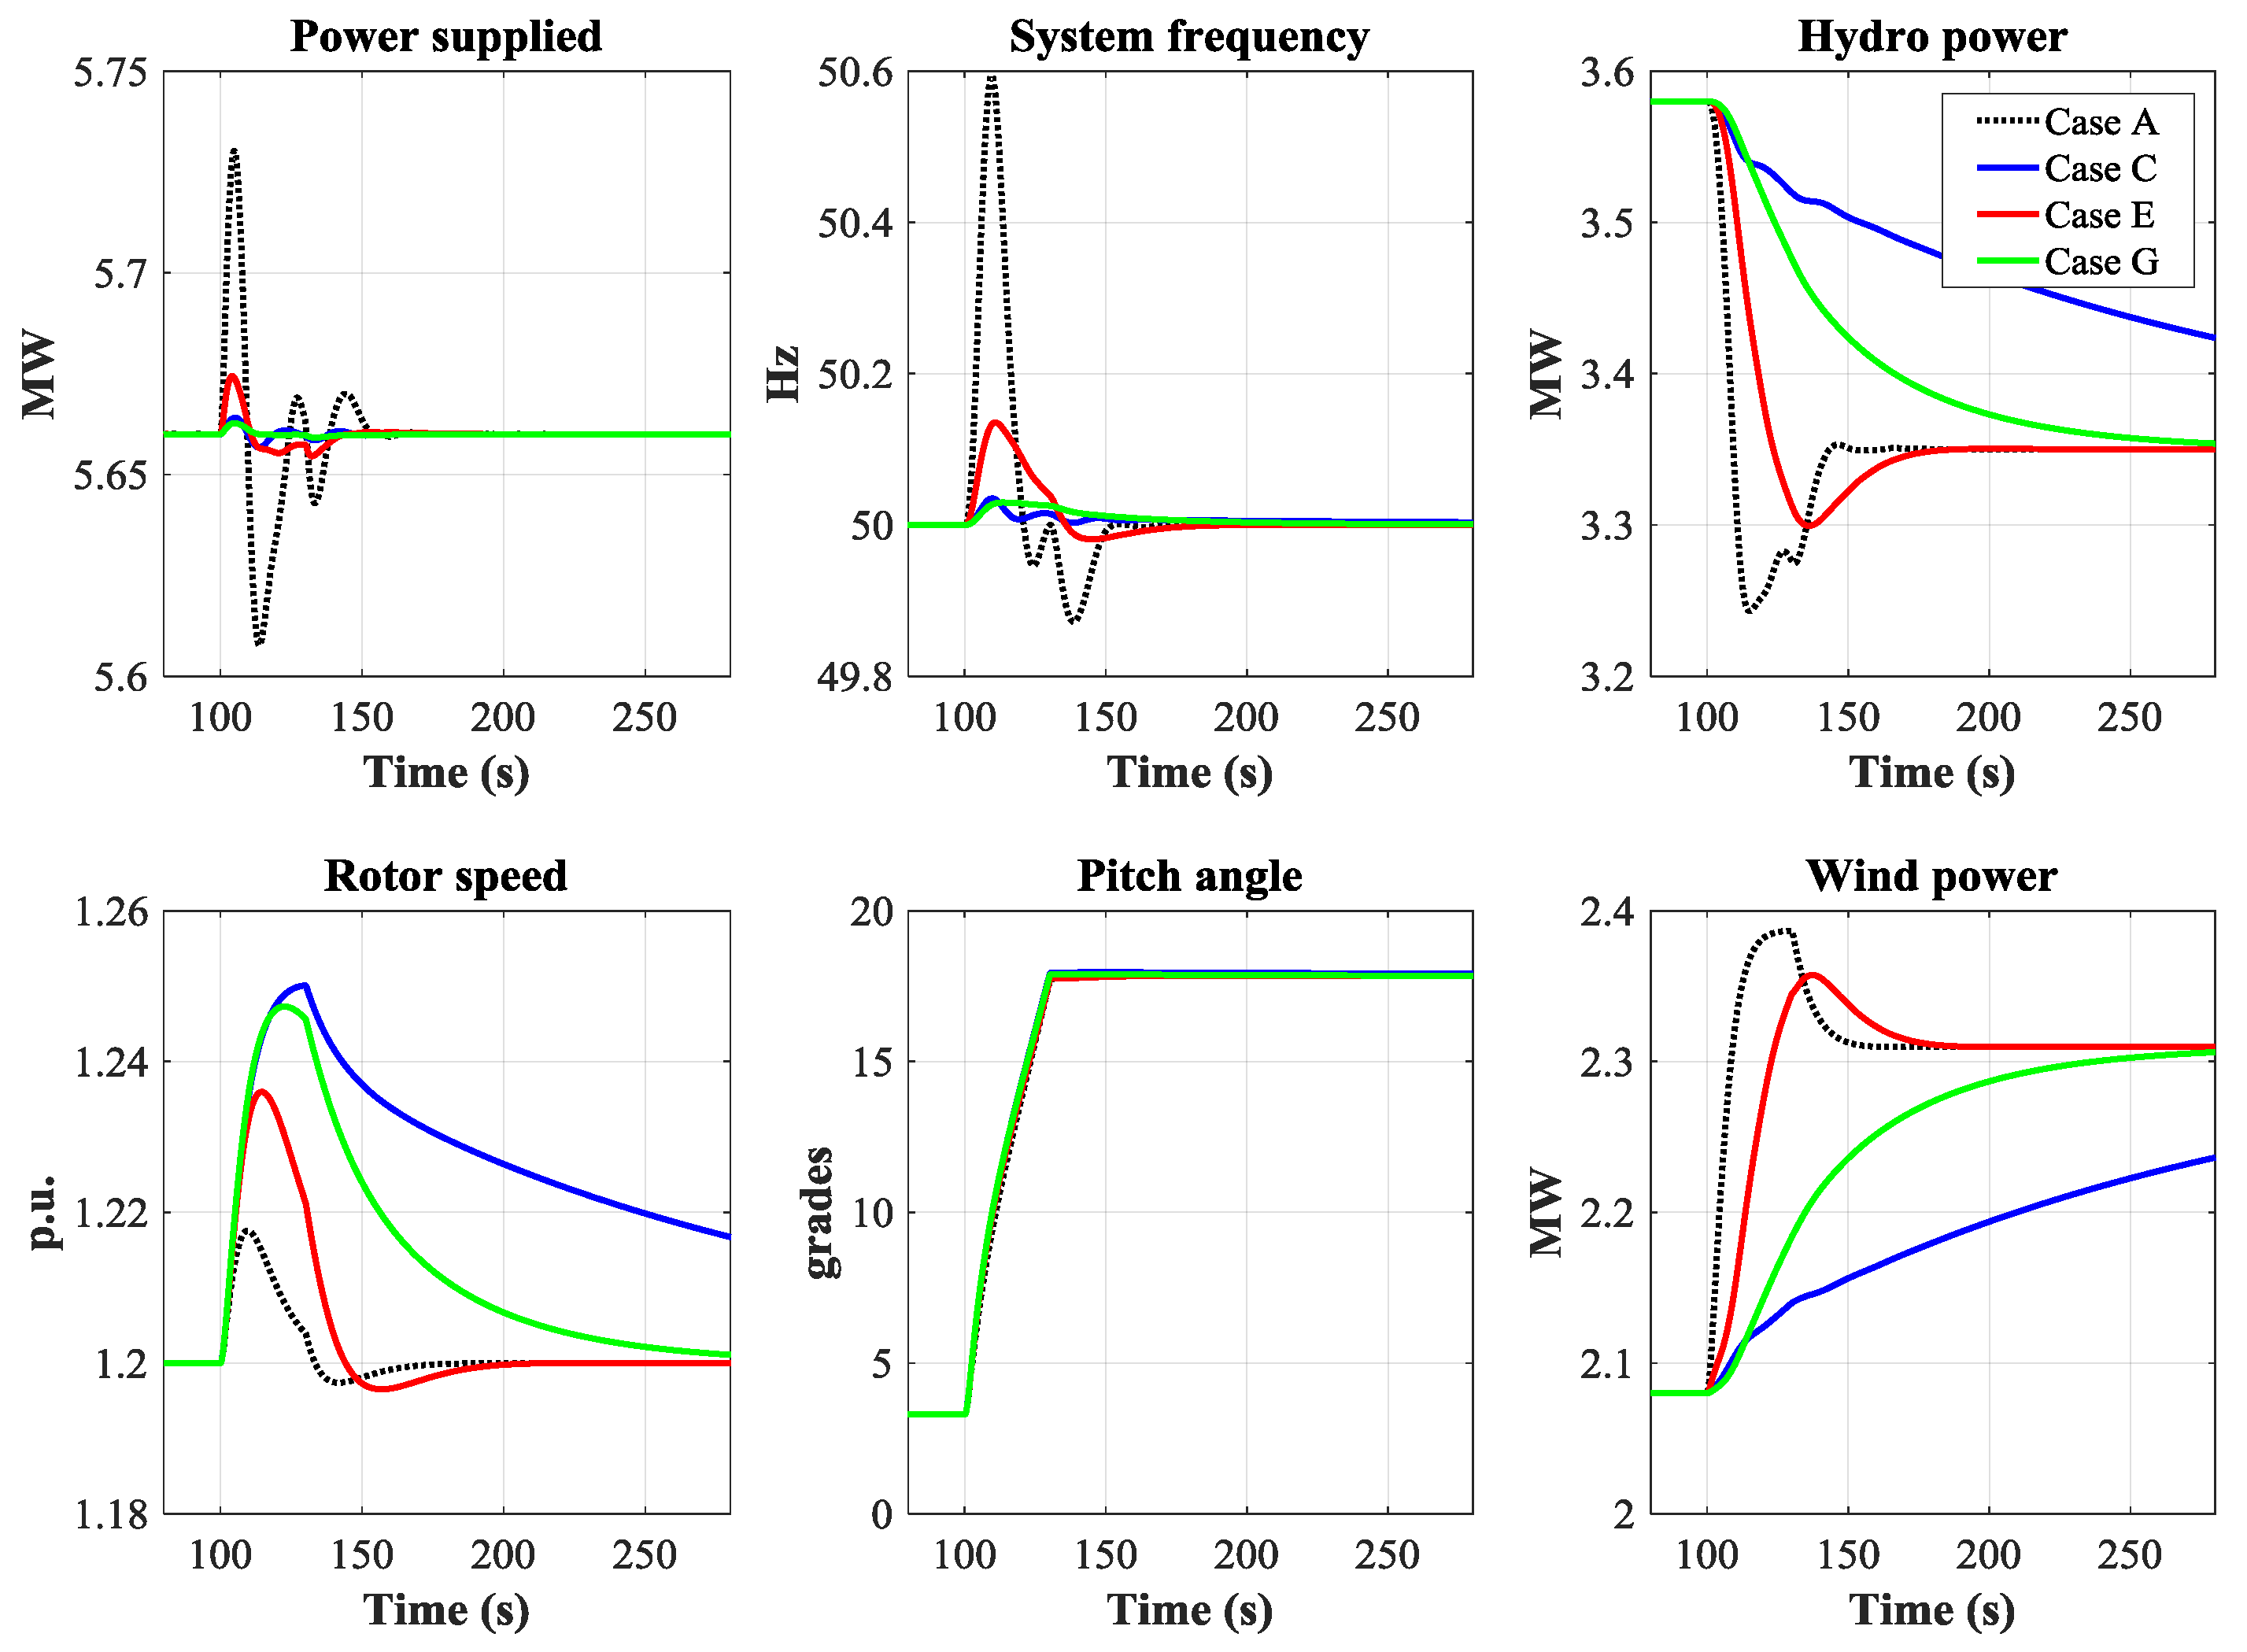
Additionally, Figure 11 also shows the dynamic response comparison between the base case (case A) and the different cases of VSWT contributions to frequency regulation, when a 5% power demand step is imposed, considering constant wind speed of 6 m/s and for the cases in which PSHP and VSWT controller gains have been obtained jointly. In this low wind speed regime, the blade pitch control does not act and the rotor speed variances are only controlled by changing generator torque. Despite the low power generated by the VSWT due to the low wind speed, the VSWT can still contribute to the frequency regulation by improving all the mentioned system quality indicators. However, as can be seen in the simulation, proportional control makes the rotor speed would take too long to recover its reference speed after the disturbance. Nevertheless, inertial control can improve the system dynamics without compromising the stability of VSWT.
Figure 12 shows the comparison of the dynamic responses of the system between the strategy in which VSWT did not contribute to the regulation, and the various other strategies of contribution in instances when a linear wind speed variation takes place.
Table 5 summarizes the medium-frequency deviation for each strategy, calculated based on Equation (20), NADIR, maximum frequency peak, nozzle movements per second, and blade angle movements per second when a wind ramp is simulated.
As shown in Figure 12, when a wind speed ramp takes place, and frequency regulation is only provided by the PSHP (case A), the frequency attains values outside the limits established by the TSO (50 Hz ± 0.15 Hz) [64]. In addition, the medium frequency deviation, NADIR, maximum frequency peak, and nozzle movement values are improved, supposing a small increase in the movements of the VSWT blades.
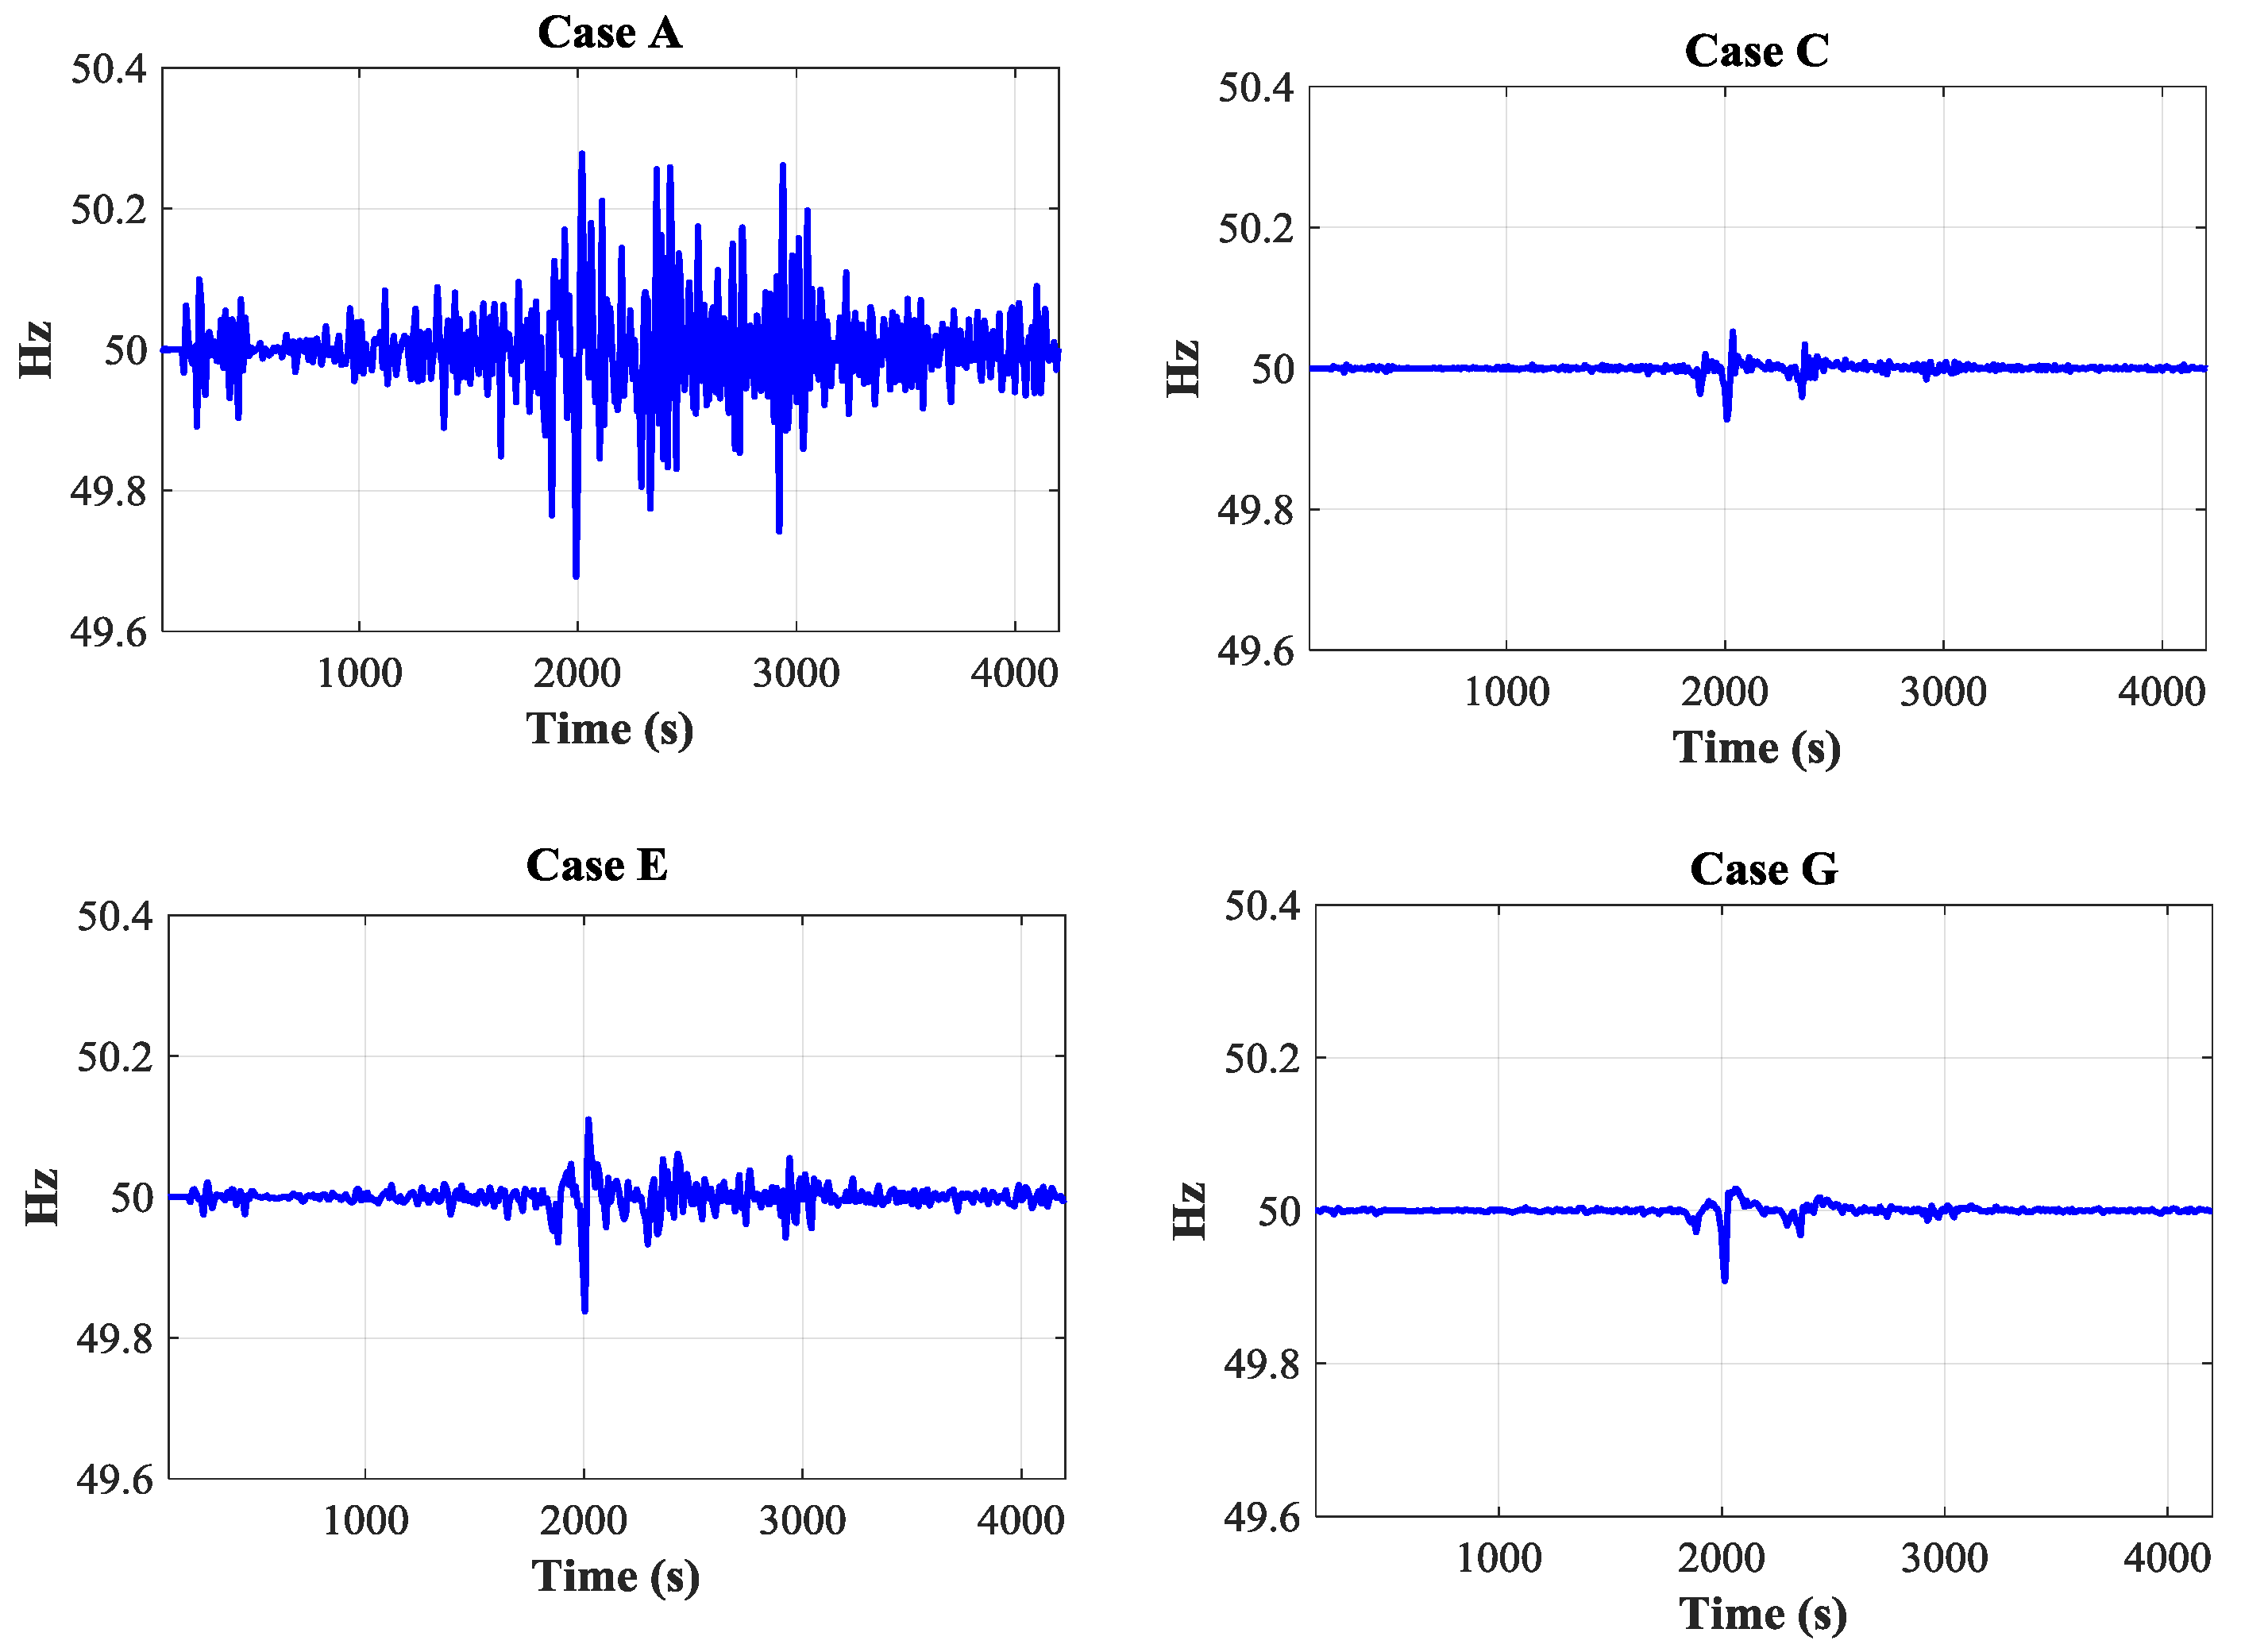
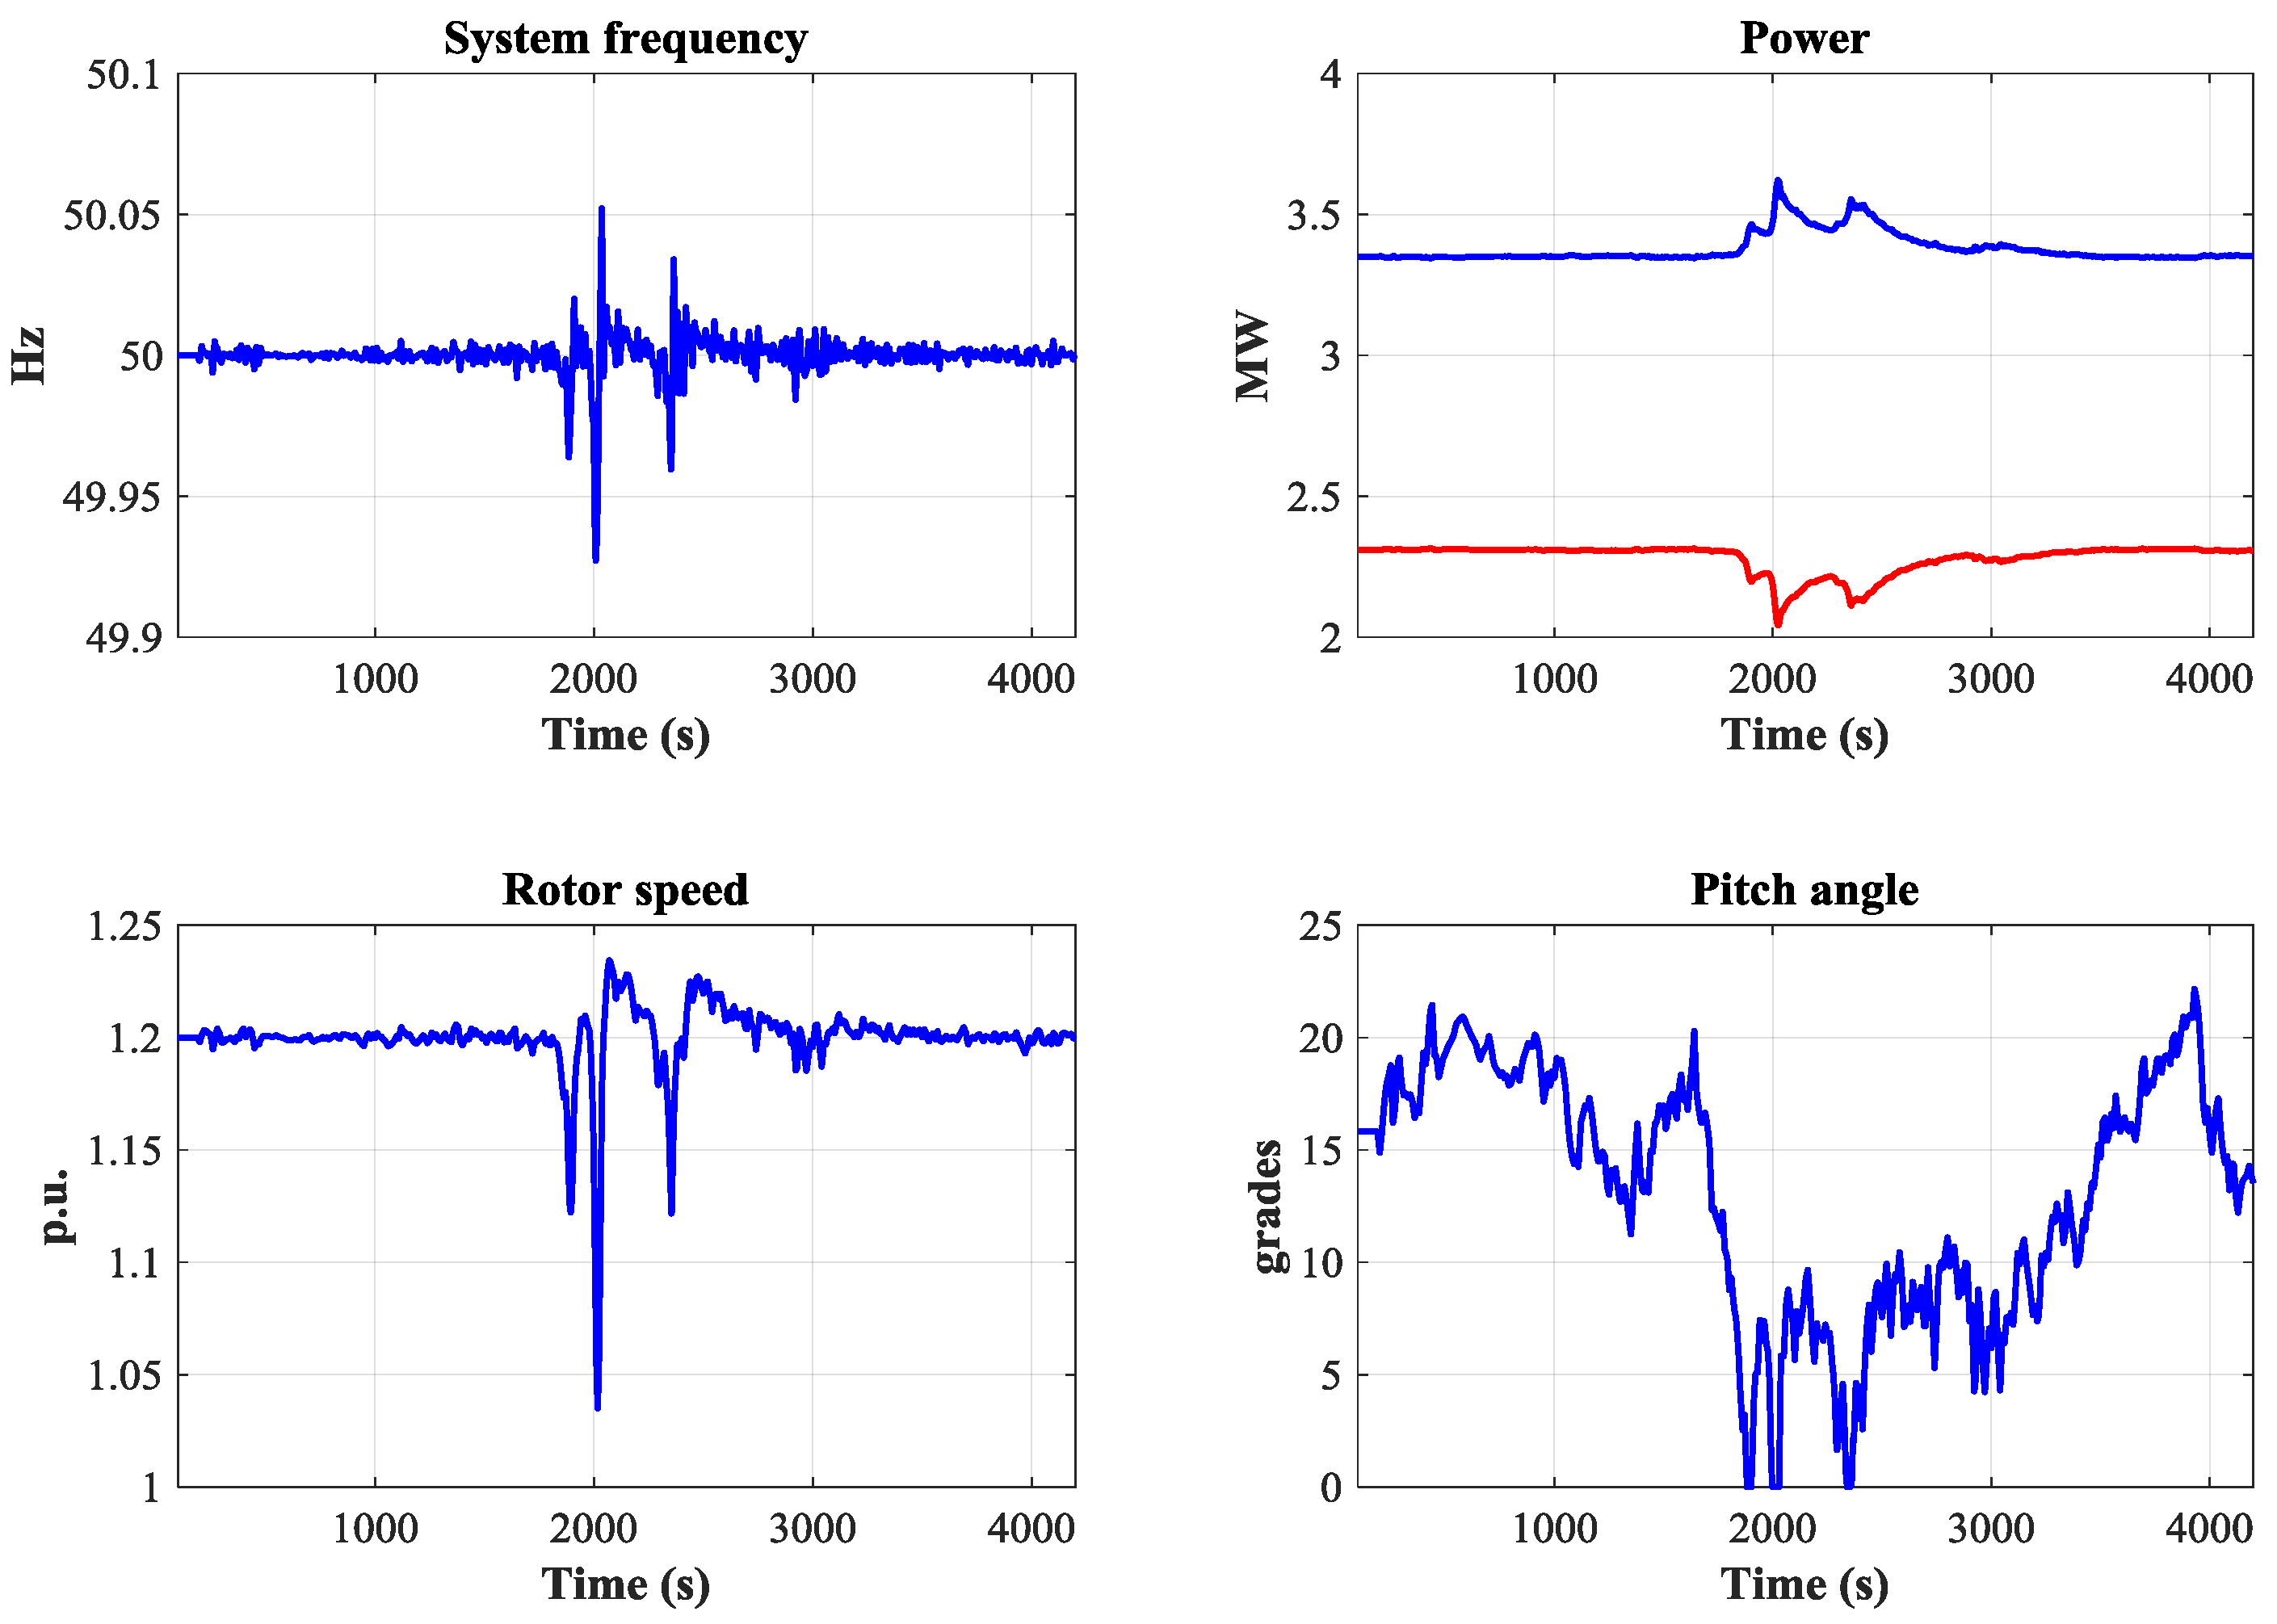
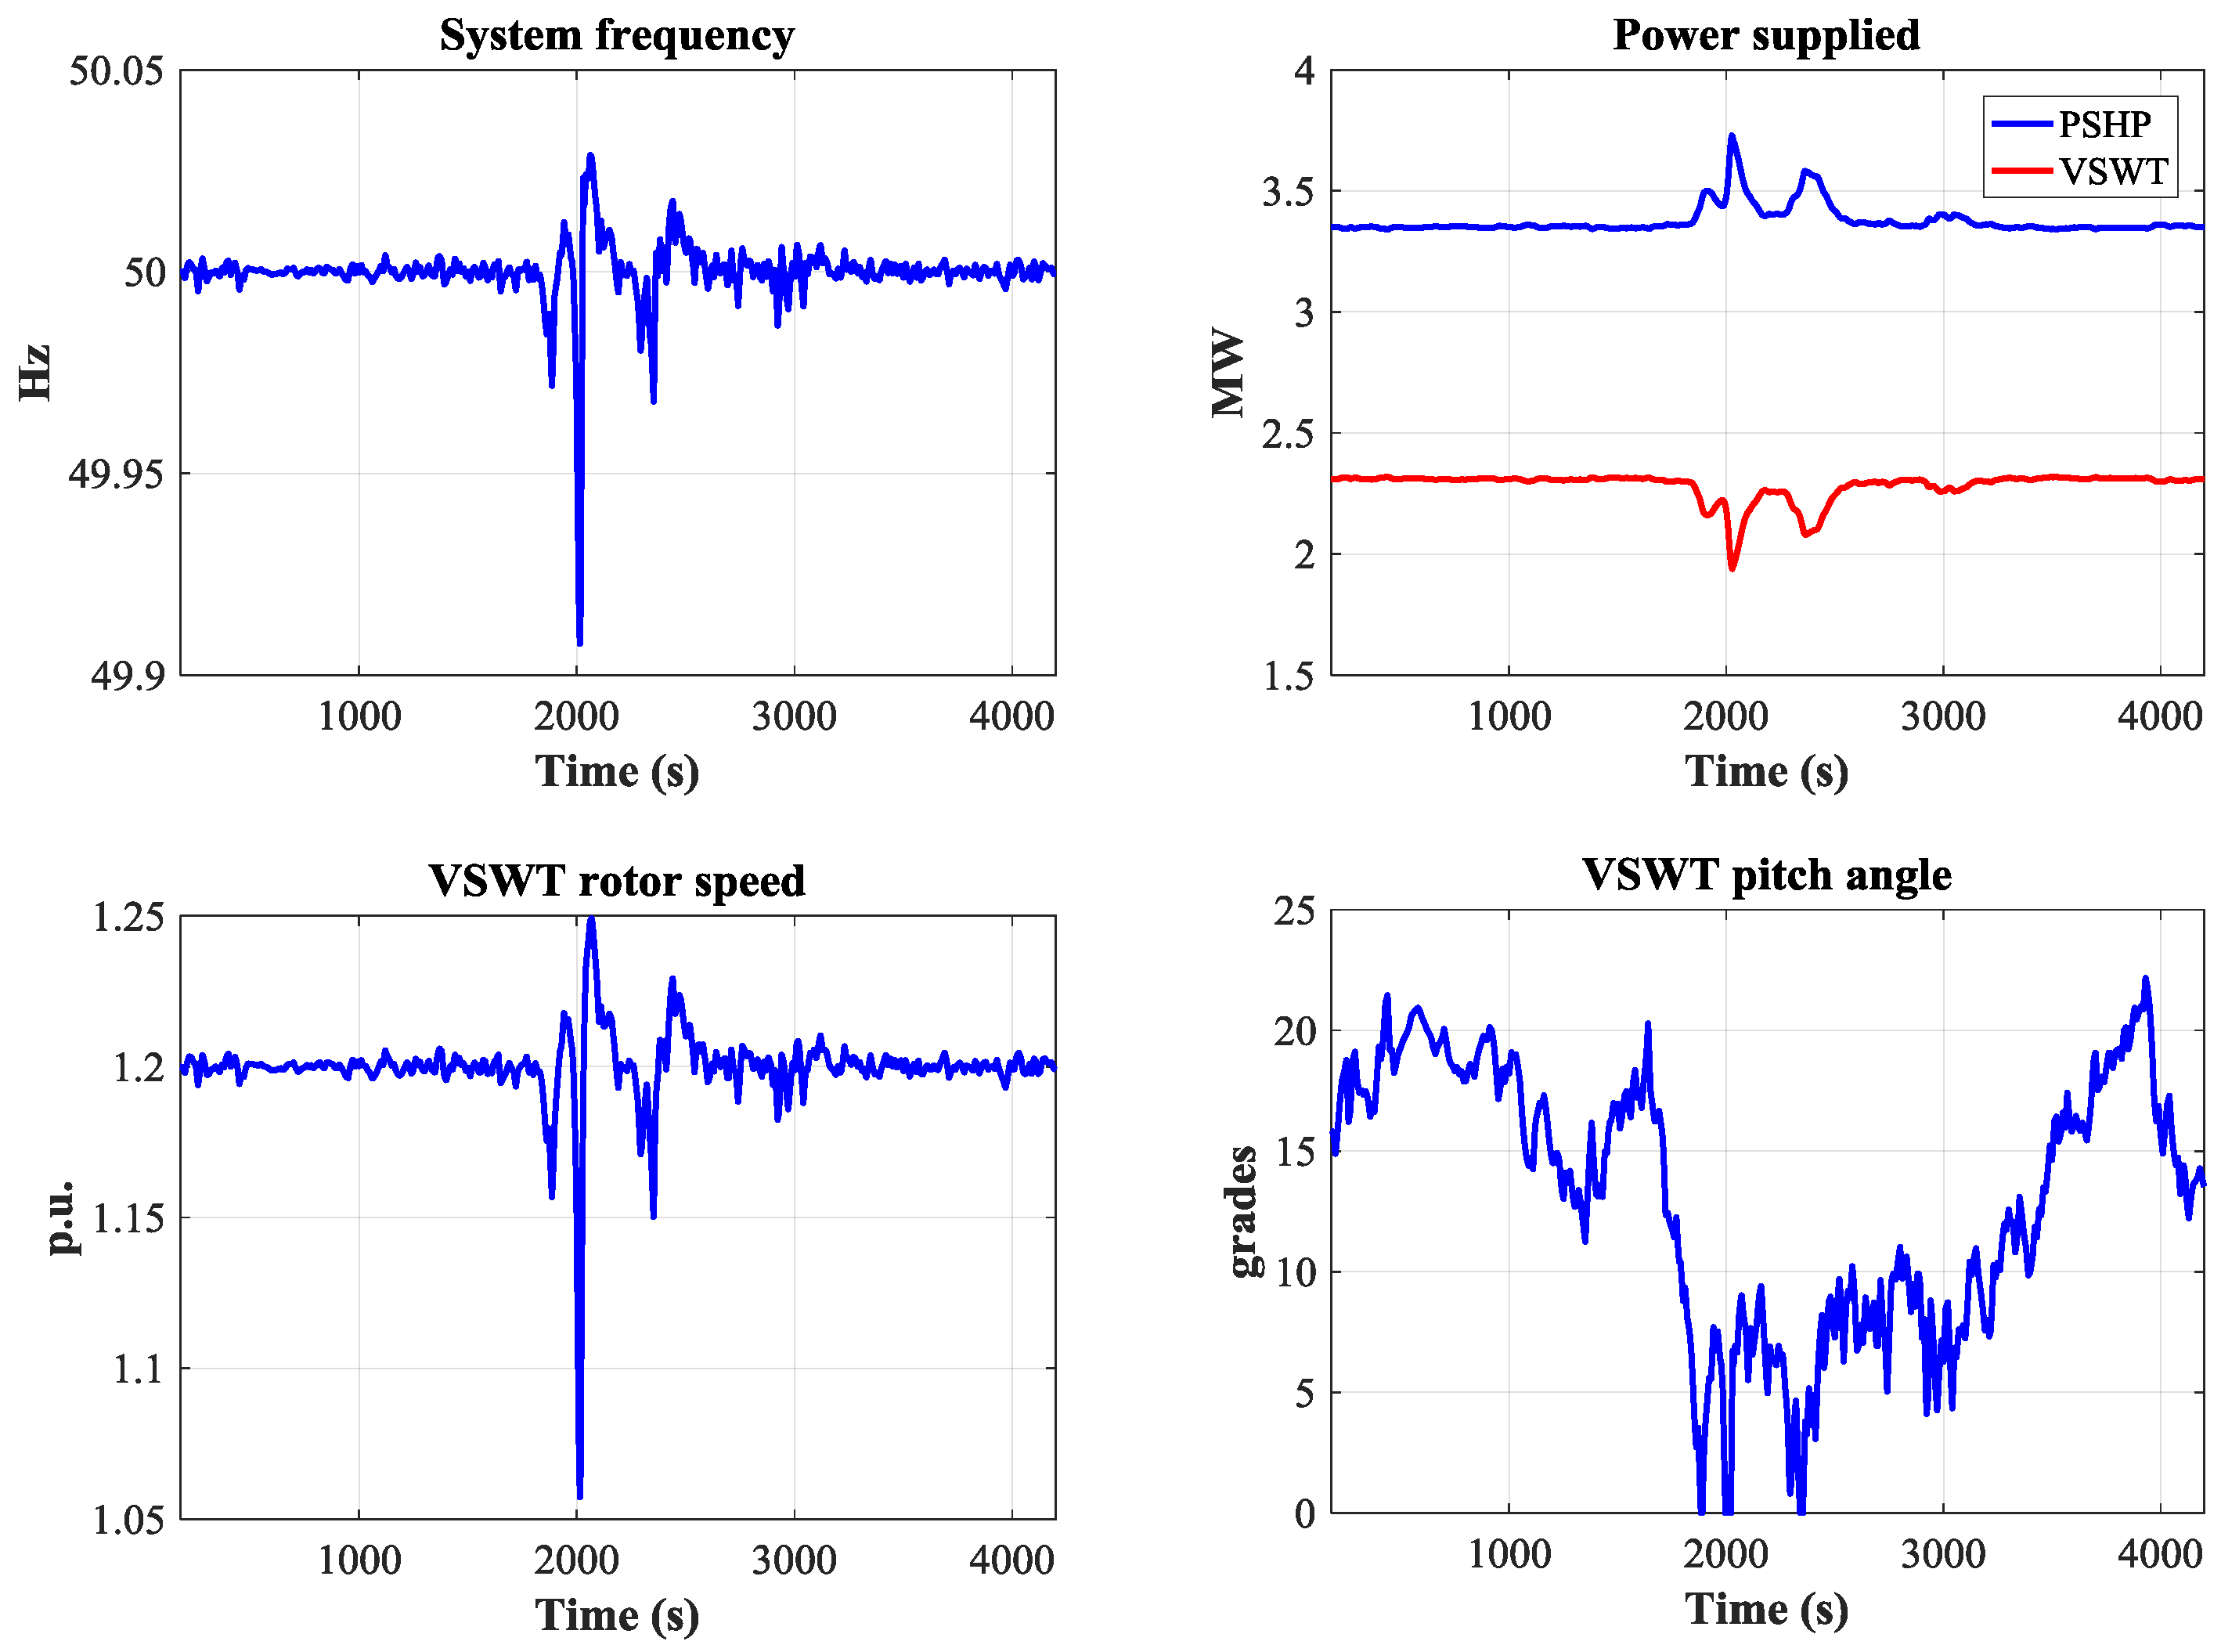
The elicited results from the simulation of a wind speed fluctuation are summarized in Table 6, listing for each strategy the wind energy generated, medium frequency deviation, NADIR, maximum frequency peak, nozzle movements per second, and blade angle movements per second. Moreover, Figure 13 shows the frequency comparison between cases A, C, E, and G. In addition, the dynamic responses of the system in cases A, C, E, and G during the wind speed fluctuation are shown in Appendix B.
As seen in Table 6, the VSWT contribution to frequency regulation implies a negligible loss of wind energy (less than 0.25%). Nevertheless, the medium frequency deviation, NADIR, maximum frequency peak and nozzle movement values are improved.
In both simulations assuming variances in wind speed, it is verified that for the proposed cases, the VSWT contribution to frequency regulation implies an improvement in the frequency indicators of the quality system. In regard to the moving parts, an important reduction in the movements of the turbine nozzle (more than 80%) takes place, thereby increasing its remaining lifetime. These reductions in movements suppose a small increase (less than 10%) in the movements of the VSWT blades. It can be observed that emulation of inertia improves the minimum and maximum frequency peaks as well as the medium frequency deviation in a better manner compared to proportional control. More importantly, these indicators reach an even better value when proportional control acts together with inertial control. The system improvement is also evaluated by obtaining the set of combined gains (PSHP + VSWT) instead of individually gains when wind variation is simulated comparing results from cases C, E, and G, to those from B, D, and F, respectively, in both simulations assuming variances in wind speed.
6. Conclusions
In this study, the capacity of a hybrid wind–hydro power plant to contribute to frequency regulation in an isolated system has been evaluated. To achieve this, a PSHP operating in generation mode, and VSWT connected to an isolated system, have been modeled.
In addition to the frequency regulation, usually provided by the hydroelectric power plant, VSWT can contribute to frequency regulation according to different proposed control strategies, including inertial, proportional, and their combination. To the author’s knowledge, there is no control strategies for VSWT to contribute to frequency regulation in conjunction with a hydroelectric plant in an isolated system proposed previously. It has been proven that VSWT controller gains recommended for interconnected systems are not adequate for isolated systems, since isolated systems are more sensitive to power disturbances than interconnected systems. Therefore, a methodology based on exhaustive searches for the set of gains for the PSHP and VSWT controllers has been conducted according to a proposed criterion. The convenience of adjusting jointly PSHP and VSWT regulators and taking into account the wind speed regime has been demonstrated.
Control strategies and adjustment methodology extracted from this study have been applied to the El Hierro power system, evaluating by simulating different events related to fluctuations in wind speed, or variations in power demand. Considerable improvements concerning frequency deviations have been achieved. When a load step occurs, the fast frequency response provided by the proportional controller improves the NADIR value, thereby reaching an even better value when it acts synergistically with inertial control. Nevertheless, inertial control improves the minimum and maximum frequency peaks as well as the medium frequency deviation in a better manner compared to proportional control when wind speed variations are simulated. For both disturbances, better quality indicators were achieved even when proportional control acted together with the inertial control. In addition, wind energy lost owing to the VSWT contribution to frequency regulation could be considered negligible.
Moreover, a simulation with a low wind speed has been carried out. In this speed regime, the blade pitch control does not act and the rotor speed variances are only controlled by changing generator torque. It has been proved that proportional control can destabilize the VSWT. Nevertheless, inertial control can improve the system dynamics without compromising the stability of VSWT.
Finally, it has been verified that the VSWT contribution to frequency regulation improves the lifetime of the hydro turbine governing system owing to the reduction of their movements at the expense of an admissible and increased workload imposed on the wind turbine blades.
Acknowledgments
The work presented in the paper has been partially funded by the Spanish Ministry of Economy and Competitiveness under the project ‘Value of pumped-hydro energy storage in isolated power systems with high wind power penetration’ of the National Plan for Scientific and Technical Research and Innovation 2013–2016 (Ref. ENE2016–77951–R).
Author Contributions
Guillermo Martínez-Lucas developed the wind-hydro power plant model, carried out the simulations and collaborated in the design of the control strategies and the analysis of results. José Ignacio Sarasúa collaborated in the design of the control strategies and the analysis of results. José Ángel Sanchez-Fernández collaborated in the development of the simulation model blocks, which correspond to the variable speed wind turbine.
Conflicts of Interest
The authors declare no conflict of interest.
Nomenclature
| Ar | [m2] | Area swept by rotor blades |
| aw | [m/s] | Wave speed |
| ch | [p.u.] | Hydraulic turbine mechanical torque |
| Cp | VSWT power coefficient | |
| D | [m] | Penstock diameter |
| f | Darcy–Weisbach friction factor | |
| g | [m/s2] | Gravity acceleration |
| h | [p.u.] | Net head |
| H | [m] | Net head |
| h0 | [p.u.] | Initial net head |
| Hb | [m] | Base head |
| hi | [p.u.] | Head at the end of the i-th Π element of the penstock |
| Hwt | [p.u.] | Wind turbine inertia constant |
| k | [p.u.] | Load—self regulation coefficient |
| Kdn | Constant that weights the frequency variation in the VSWT | |
| Kic | Integral gain in PI blade pitch angle compensation | |
| Kip | Integral gain in PI blade pitch angle control | |
| Kiω | Integral gain in PI VSWT speed control | |
| Kpc | Proportional gain in PI blade pitch angle compensation | |
| Kpn | Constant that weights the frequency deviation in the VSWT | |
| Kpp | Proportional gain in PI blade pitch angle control | |
| Kpω | Proportional gain in PI VSWT speed control | |
| L | [m] | Penstock length |
| Le | [m] | Segment length |
| MFD | Mean frequency deviation | |
| n | [p.u.] | Frequency |
| n0 | [p.u.] | Initial frequency |
| nref | [p.u.] | Reference frequency |
| nt | Number of segments in which the penstock is divided | |
| [MW] | Initial power demand | |
| pdem | [p.u.] | Power demand |
| pdn | [p.u.] | Power reference provided by VSWT inertial control |
| ph | [p.u.] | Power supplied by PSHP |
| [MW] | Initial power supplied by PSHP | |
| pn | [p.u.] | Power reference provided by VSWT proportional and inertial control |
| pnc | [p.u.] | Power supplied by VSWT converter |
| [p.u.] | Initial power supplied by VSWT converter | |
| [MW] | Initial power supplied by VSWT converter | |
| ppn | [p.u.] | Power reference provided by VSWT proportional control |
| pwind | [p.u.] | Wind mechanical power |
| pω | [p.u.] | Power reference provided by VSWT speed control |
| q | [p.u.] | Flow through the turbine |
| Qb | [m3/s] | Base flow |
| Qp | [m3/s] | Flow at the penstock |
| qp | [p.u.] | Flow at the penstock |
| qp,i | [p.u.] | Flow at the end of the i-th Π element of the penstock |
| [p.u.] | Initial flow at the penstock | |
| r/2 | [p.u.] | Continuous head losses coefficient in the penstock |
| Rb | [m] | VSWT radius |
| S | [m2] | Penstock section |
| sw | [m/s] | Wind speed |
| t | [s] | Time |
| Te | [s] | Water elastic time (L/aw) |
| Tl | =Te2/Tw | |
| Tm | [s] | Mechanical starting time |
| Tn | [s] | Frequency settling time |
| Tp | [s] | Power settling time |
| Tr | [s] | Hydro governor dashpot time constant |
| Ts | [s] | Time constant in servo motor transfer function |
| Tw | [s] | Penstock water starting time |
| x | [m] | axial distance along the streamline |
| z | [p.u.] | Nozzle opening |
| z0 | [p.u.] | Initial nozzle opening |
| αij | Cp curves coefficients | |
| δ | Hydro governor temporary speed droop | |
| θ | [o] | VSWT blade pitch angle |
| θ0 | [o] | VSWT initial blade pitch angle |
| θmax | [o] | VSWT maximum blade pitch angle |
| λ | Ratio of the rotor blade tip speed and the wind speed | |
| ρ | [kg/m3] | Air density: 1.225 kg/m3 |
| φ | Coefficient proposed | |
| ω | [p.u.] | VSWT rotational rotor speed |
| Ω | [rad/s] | VSWT rotational rotor speed |
| ω0 | [p.u.] | Initial VSWT rotational rotor speed |
| ωref | [p.u.] | Reference VSWT rotational rotor speed |
Appendix A

Table A1.
Cp coefficients αij.
| α00 | −4.1909 × 10⁻¹ | α01 | 2.1808 × 10⁻¹ | α02 | −1.2406 × 10⁻² | α03 | −1.3365 × 10⁻⁴ | α04 | 1.1524 × 10⁻⁵ |
| α10 | −6.7606 × 10⁻² | α11 | 6.0405 × 10⁻² | α12 | −1.3934 × 10⁻² | α13 | 1.0683 × 10⁻³ | α14 | −2.3895 × 10⁻⁵ |
| α20 | 1.5727 × 10⁻² | α21 | −1.0996 × 10⁻² | α22 | 2.1495 × 10⁻³ | α23 | −1.4855 × 10⁻⁴ | α24 | 2.7937 × 10⁻⁶ |
| α30 | −8.6018 × 10⁻⁴ | α31 | 5.7051 × 10⁻⁴ | α32 | −1.0479 × 10⁻⁴ | α33 | 5.9924 × 10⁻⁶ | α34 | −8.9194 × 10⁻⁸ |
| α40 | 1.4787 × 10⁻⁵ | α41 | −9.4839 × 10⁻⁶ | α42 | 1.6167 × 10⁻⁶ | α43 | −7.1535 × 10⁻⁸ | α44 | 4.9686 × 10⁻¹⁰ |
Table A2.
Blade pitch angle control parameters.
| Kpc | 3 | Kpp | 150 | θmax | 27 |
| Kic | 30 | Kip | 25 | Ts | 0.1 |
Appendix B
Figure A1.
Dynamic responses of the system in case A during wind speed fluctuation.
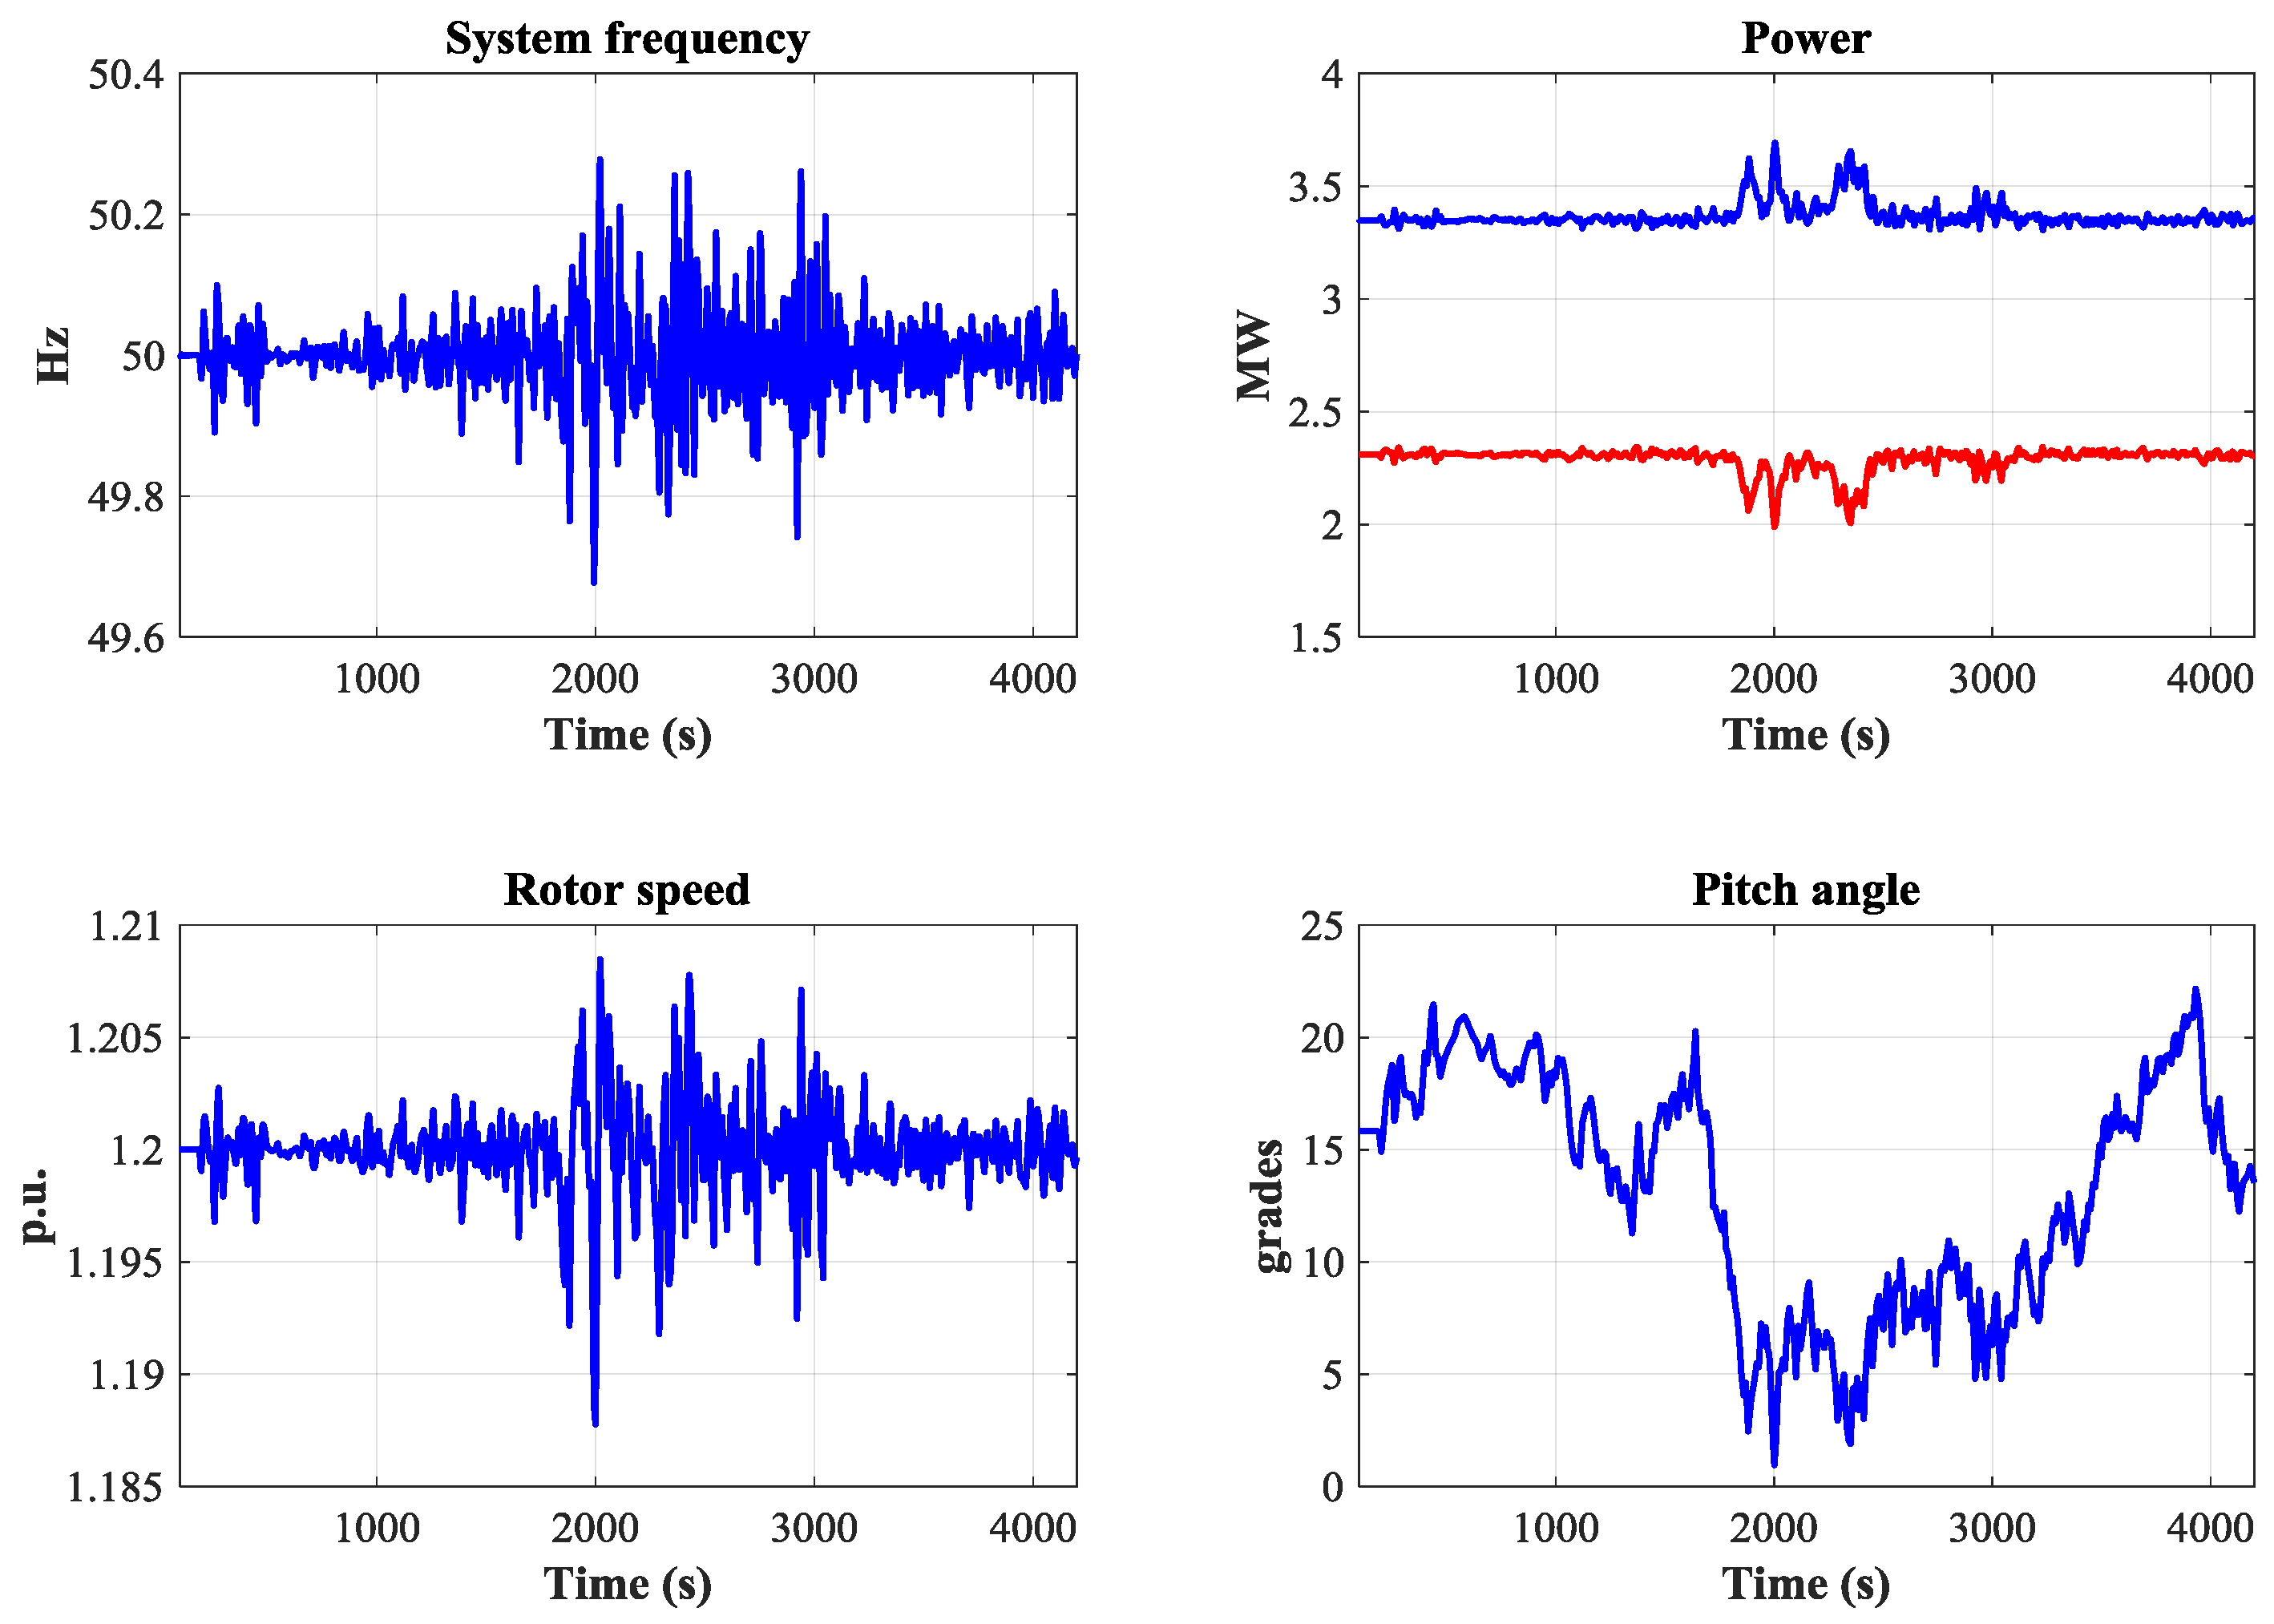
Figure A2.
Dynamic responses of the system in case C during wind speed fluctuation.

Figure A3.
Dynamic responses of the system in case E during wind speed fluctuation.
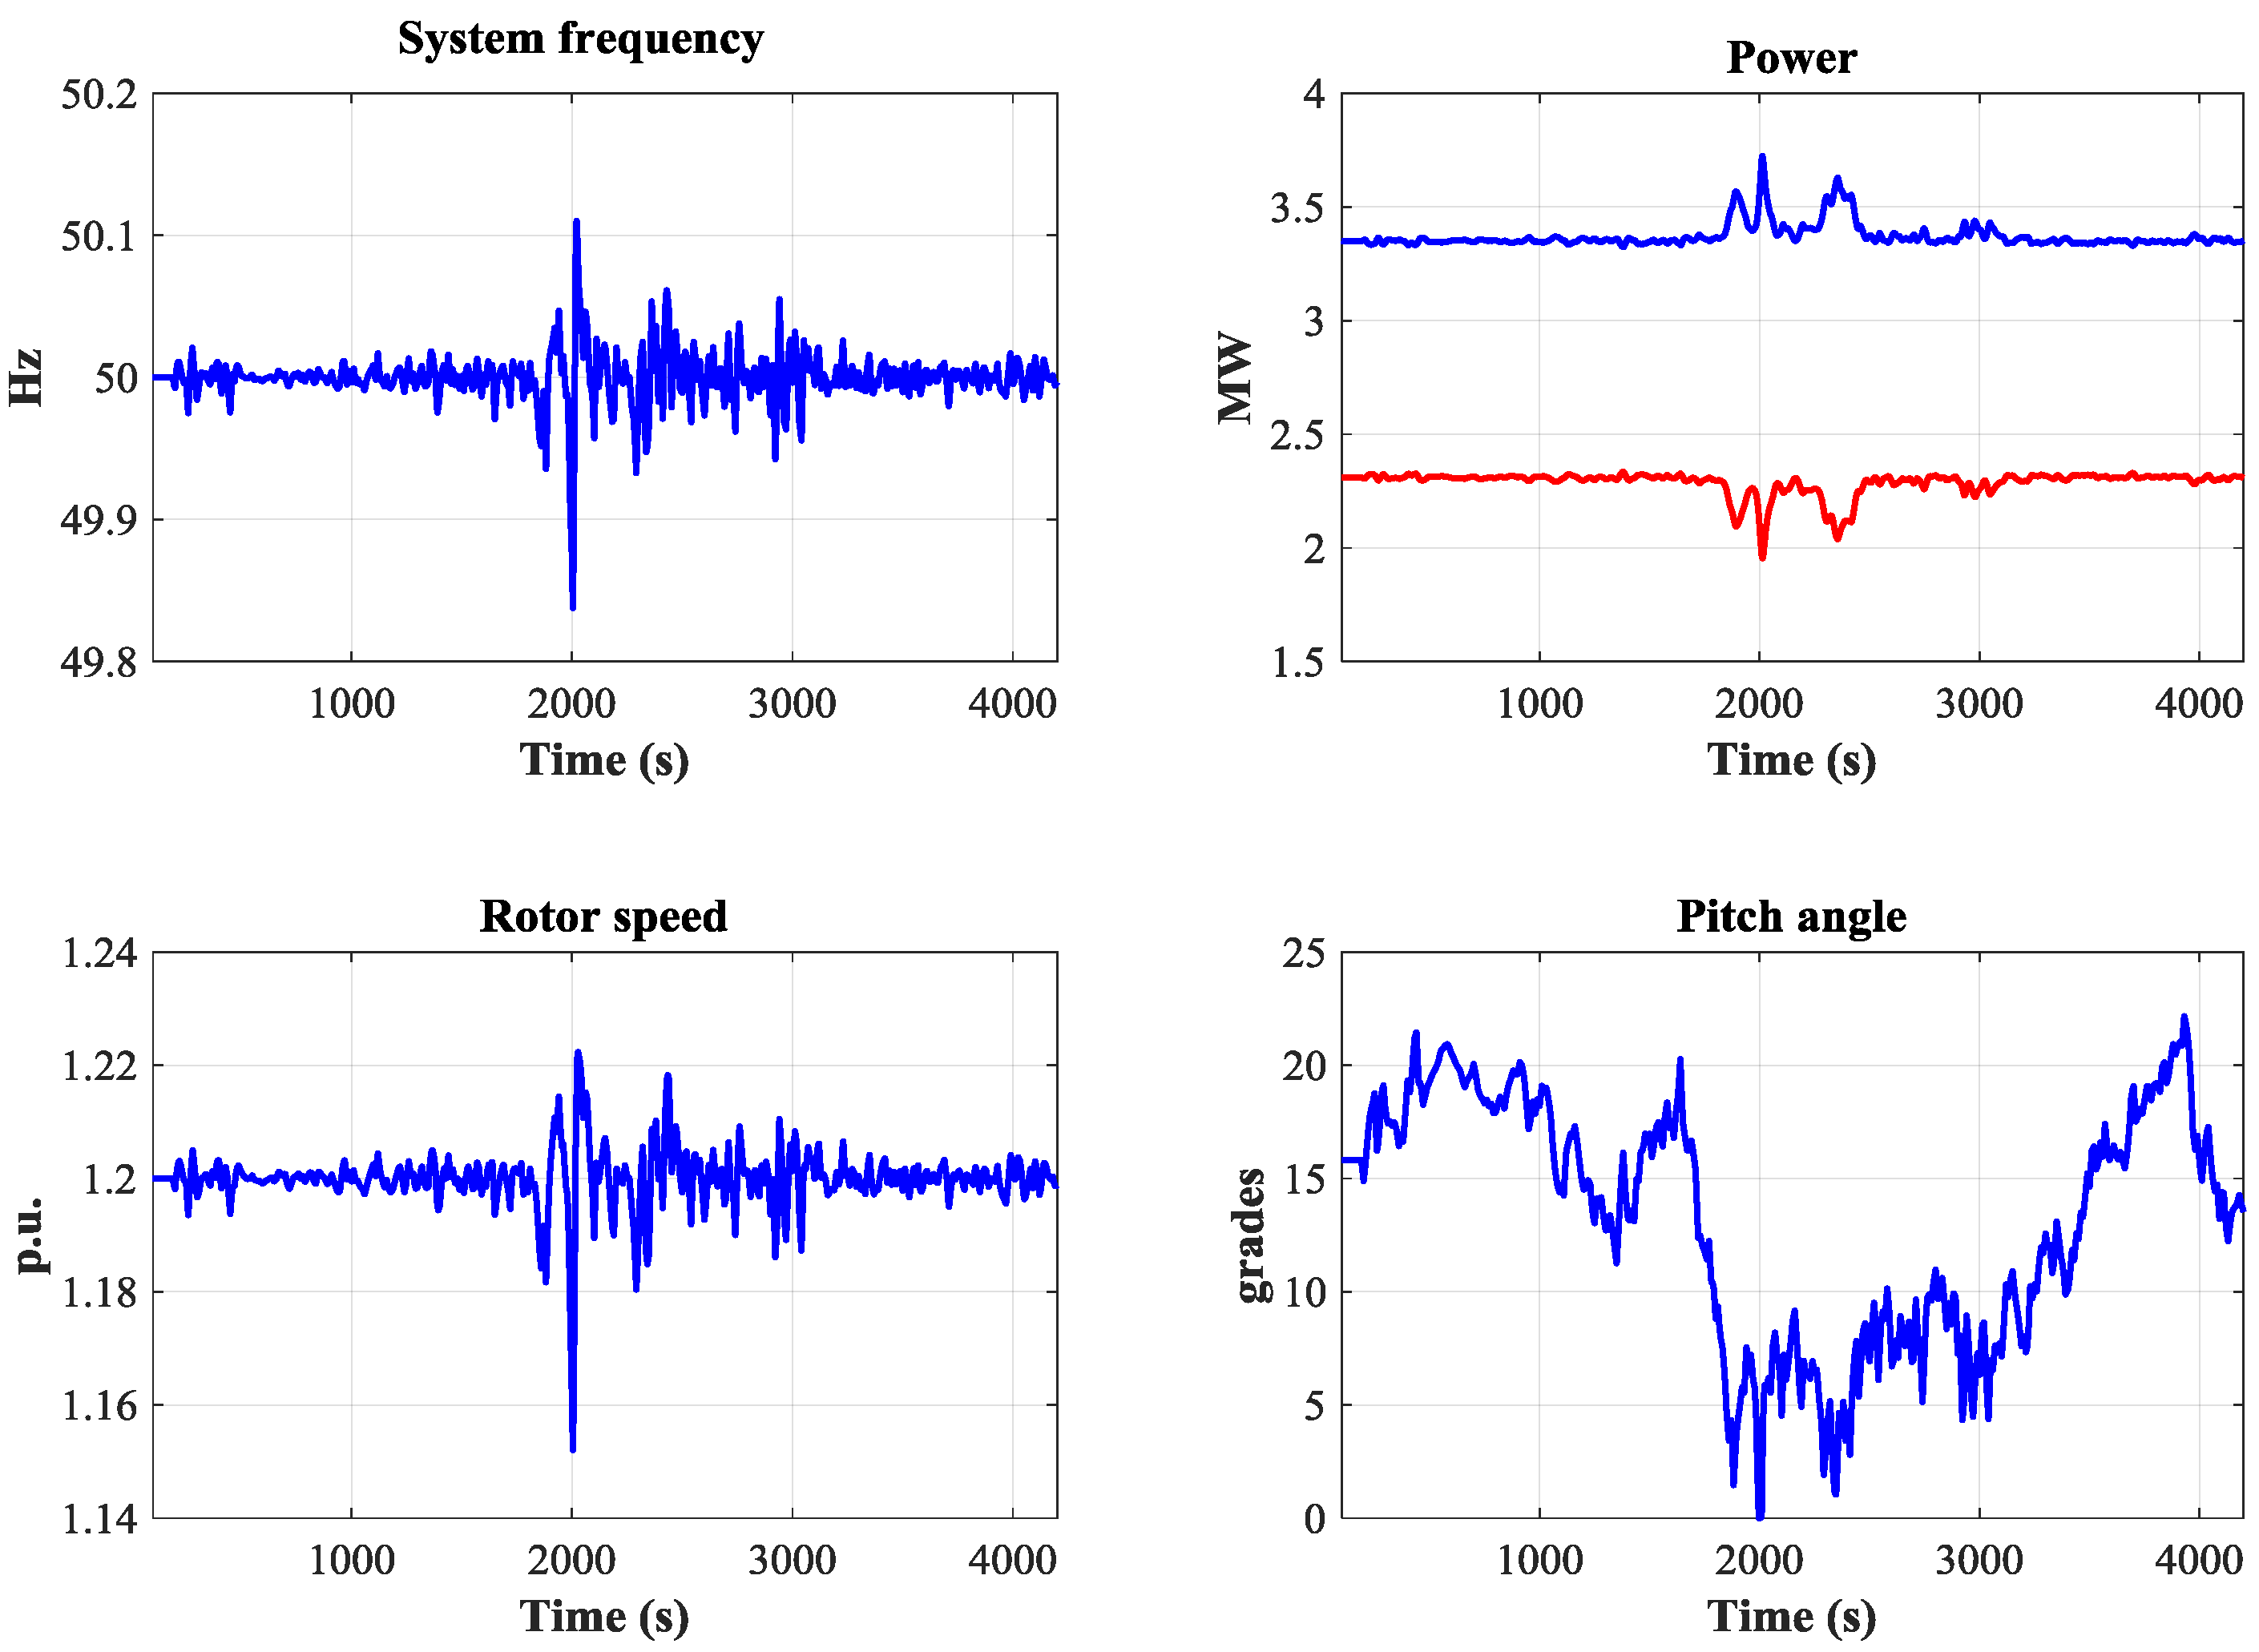
Figure A4.
Dynamic responses of the system in case G during wind speed fluctuation.

References
- Denholm, P.; Ela, E.; Kirby, B.; Milligan, M. The Role of Energy Storage with Renewable Electricity Generation; Nationa Renwable Energy Laboratory: Golden, CO, USA, 2010.
- Papaefthymiou, S.V.; Lakiotis, V.G.; Margaris, I.D.; Papathanassiou, S.A. Dynamic analysis of islands system with wind-pumped-storage hybrid power stations. Renew. Energy 2015, 74, 544–554. [Google Scholar] [CrossRef]
- Albadi, M.; El-Saadany, E. Overview of wind power intermittency impacts on power systems. Electr. Power Syst. Res. 2010, 80, 627–632. [Google Scholar] [CrossRef]
- The Electric Power Research Institute, Inc. Impacts of Wind Generation. 6 May 2011. Available online: https://www.epri.com/#/pages/product/1023166/ (accessed on 20 October 2017).
- Wang, Y.; Silva, V.; Lopez-Botet-Zulueta, M. Impact of high penetration of variable renewable generation on frequency dynamics in the continental Europe interconnected system. IET Renew. Power Gener. 2016, 10, 10–16. [Google Scholar] [CrossRef]
- Georgilakis, P.S. Technical challenges associated with the integration of wind power into power systems. Renew. Sustain. Energy Rev. 2008, 12, 852–863. [Google Scholar] [CrossRef]
- Kaldellis, J.; Kavadias, K. Optimal wind-hydro solution for Aegean Sea islands’ electricity-demand fulfilment. Appl. Energy 2001, 70, 333–354. [Google Scholar] [CrossRef]
- Kaldellis, J.; Kavadias, K.; Christinakis, E. Evaluation of the wind–hydro energy solution for remote islands. Energy Convers. Manag. 2001, 42, 1105–1120. [Google Scholar] [CrossRef]
- Iglesias, G.; Carballo, R. Wave resource in El Hierro—An island towards energy self-sufficiency. Renew. Energy 2011, 36, 689–698. [Google Scholar] [CrossRef]
- Merino, J.; Veganzones, C.; Sanchez, J.A.; Martinez, S.; Platero, C.A. Power system stability of a small sized isolated network supplied by a combined wind-pumped storage generation system: A case study in the canary islands. Energies 2012, 5, 2351–2369. [Google Scholar] [CrossRef] [Green Version]
- Kaneshiro, R.S. Hawaii Island (Big Island) Wind Impact. In Proceedings of the 2013 Workshop on Active Power Control from Wind Power, Broomfield, CO, USA, 17 May 2013. [Google Scholar]
- Hamsic, N.; Schmelter, A.; Mohd, A.; Ortjohann, E.; Schultze, E.; Tuckey, A.; Zimmermann, J. Stabilising the Grid Voltage and Frequency in Isolated Power Systems Using. In Proceedings of the 2006 Great Wall World Renewable Energy Forum and Exhibition, Beijing, China, 23–27 October 2006. [Google Scholar]
- Delille, G.; Francois, B.; Malarange, G. Dynamic Frequency Control Support by Energy Storage to Reduce the Impact of Wind and Solar Generation on Isolated Power System’s Inertia. IEEE Trans. Sustain. Energy 2012, 3, 931–939. [Google Scholar] [CrossRef]
- Ibrahim, H.; Ilinca, A.; Perron, J. Energy storage systems—Characteristics and comparisons. Renew. Sustain. Energy Rev. 2008, 12, 1221–1250. [Google Scholar] [CrossRef]
- Zhao, H.; Wu, Q.; Hu, S.; Xu, H.; Rasmussen, C.N. Review of energy storage system for wind power integration support. Appl. Energy 2015, 137, 545–553. [Google Scholar] [CrossRef]
- Díaz-González, F.; Sumper, A.; Gomis-Bellmunt, O.; Villafáfila-Robles, R. A review of energy storage technologies for wind power applications. Renew. Sustain. Energy Rev. 2012, 16, 2154–2171. [Google Scholar] [CrossRef]
- Kapsali, M.; Kaldellis, J.K. Combining hydro and variable wind power generation by means of pumped-storage under economically viable terms. Appl. Energy 2010, 87, 3475–3485. [Google Scholar] [CrossRef]
- Pérez-Díaz, J.I.; Jiménez, J. Contribution of a pumped-storage hydropower plant to reduce the scheduling costs of an isolated power system with high wind power penetration. Energy 2016, 109, 92–104. [Google Scholar] [CrossRef]
- Brown, P.D.; Lopes, J.A.P.; Matos, M.A. Optimization of Pumped Storage Capacity in an Isolated Power System with Large Renewable Penetration. IEEE Trans. Power Syst. 2008, 23, 523–531. [Google Scholar] [CrossRef]
- Makarov, Y.; Yang, B.; DeSteese, J.; Lu, S.; Miller, C.; Nyeng, P.; Ma, J.; Hammerstrom, D.; Viswanathan, V. Wide-Area Energy Storage and Management System to Balance Intermittent Resources in the Bonneville Power Administration and California ISO Control Areas; Pacific Northwest National Laboratory Richland: Washington, DA, USA, 2008.
- Lazarewicz, M.L.; Ryan, T.M. Integration of Flywheel-Based Energy Storage for Frequency Regulation in Deregulated Markets. In Proceedings of the 2010 IEEE Conference on Power and Energy Society General Meeting, Providence, RI, USA, 25–25 July 2010. [Google Scholar]
- Sarasúa, J.I.; Torres, B.; Pérez-Díaz, J.I.; Lafoz, M. Control Strategy and Sizing of a Flywheel Energy Storage Plant for the Frequency Control of an Isolated Wind-Hydro Power. In Proceedings of the 15th Wind Integration Workshop, Vienna, Austria, 15–17 November 2016. [Google Scholar]
- Martínez-Lucas, G.; Pérez-Díaz, J.; Sarasúa, J.; Cavazzini, G.; Pavesi, G.; Ardizzon, G. Simulation model of a variable-speed pumped-storage power plant in unstable operating conditions in pumping mode. J. Phys. Conf. Ser. 2017, 813, 012028. [Google Scholar] [CrossRef]
- Badihi, H.; Zhang, Y.; Hong, H. Active power control design for supporting grid frequency regulation in wind farms. Annu. Rev. Control 2015, 40, 70–81. [Google Scholar] [CrossRef]
- Gonzalez-Longatt, F. Effects of the Synthetic Inertia from Wind Power on the Total System Inertia: Simulation Study. In Proceedings of the 2nd International Symposium on Environment Friendly Energies and Applications (EFEA), Newcastle Upon Tyne, UK, 25–27 June 2012. [Google Scholar]
- Chamorro, H.; Ghandhari, M.; Eriksson, R. Wind power impact on power system frequency response. In Proceedings of the North American Power Symposium (NAPS), Manhattan, KS, USA, 22–24 September 2013. [Google Scholar]
- Aziz, A.; Aman, T.; Stojcevski, A. Frequency regulation capabilities in wind power plant. Sustain. Energy Technol. Assess. 2017, in press. [Google Scholar] [CrossRef]
- Lalor, G.; Mullane, A.; O’Malley, M. Frequency Control and Wind Turbine Technologies. IEEE Trans. Power Syst. 2005, 20, 1905–1913. [Google Scholar] [CrossRef]
- Mullane, A.; O’Malley, M. The Inertial Response of Induction-Machine-Based Wind Turbines. IEEE Trans. Power Syst. 2005, 20, 1496–1503. [Google Scholar] [CrossRef]
- Morren, J.; de Haan, S.; Kling, W. Wind turbines emulating inertia and supporting primary frequency control. IEEE Trans. Power Syst. 2006, 21, 433–434. [Google Scholar] [CrossRef]
- Eriksson, R.; Modig, N.; Elkington, K. Synthetic Inertia Versus Fast Frequency Response: A Definition. In Proceedings of the 15th Wind Integration Workshop, Vienna, Austria, 15–17 November 2016. [Google Scholar]
- Renuka, T.; Reji, P. Frequency Control of Wind Penetrated Hydro-Dominated Power System. In Proceedings of the International Conference on Advancements in Power and Energy (TAP Energy), Kollam, India, 24–26 June 2015. [Google Scholar]
- Gonzalez-Longatt, F.M. Activation schemes of synthetic inertia controller on full converter wind turbine (type 4). In Proceedings of the 2015 IEEE Power & Energy Society General Meeting, Denver, CO, USA, 26–30 July 2015; pp. 1–5. [Google Scholar]
- Gonzalez-Longatt, F.; Bonfiglio, A.; Procopio, R.; Bogdanov, D. Practical Limit of Synthetic Inertia in Full Converter Wind Turbine Generators: Simulation Approach. In Proceedings of the 19th International Symposium on Electrical Apparatus and Technologies (SIELA), Bourgas, Bulgaria, 29 May–1 June 2016. [Google Scholar]
- De Almeida, R.; Castronuovo, E.; Lopes, J. Optimum generation control in wind parks when carrying out system operator requests. IEEE Trans. Power Syst. 2006, 21, 718–725. [Google Scholar] [CrossRef]
- Courtecuisse, V.; Robyns, B.; Francois, B.; Petit, M.; Deuse, J. Variable Speed Wind Generators Participation in Primary Frequency Control. Wind Eng. 2008, 32, 299–318. [Google Scholar] [CrossRef]
- De Almeida, R.G.; Lopes, J.A.P. Participation of Doubly Fed Induction Wind Generators in System Frequency Regulation. IEEE Trans. Power Syst. 2007, 22, 944–950. [Google Scholar] [CrossRef]
- Ullah, N.R.; Thiringer, T.; Karlsson, D. Temporary Primary Frequency Control Support by Variable Speed Wind Turbines—Potential and Applications. IEEE Trans. Power Syst. 2008, 23, 601–612. [Google Scholar] [CrossRef]
- Díaz-González, F.; Hau, M.; Sumper, A.; Gomis-Bellmunt, O. Coordinated operation of wind turbines and flywheel storage for primary frequency control support. Electr. Power Energy Syst. 2015, 68, 313–326. [Google Scholar] [CrossRef] [Green Version]
- Morren, J.; Pierik, J.; de Haan, S.W. Inertial response of variable speed wind turbines. Electr. Power Syst. Res. 2006, 76, 980–987. [Google Scholar] [CrossRef]
- Ramtharan, G.; Ekanayake, J.; Jenkins, N. Frequency support from doubly fed induction generator wind turbines. IET Renew. Power Gener. 2007, 1, 3–9. [Google Scholar] [CrossRef]
- Fu, Y.; Zhang, X.; Hei, Y.; Hui, W. Active participation of variable speed wind turbine in inertial and primary frequency regulations. Electr. Power Syst. Res. 2017, 147, 174–184. [Google Scholar] [CrossRef]
- Singarao, V.Y.; Rao, V.S. Frequency responsive services by wind generation resources in United States. Renew. Sustain. Energy Rev. 2016, 55, 1097–1108. [Google Scholar] [CrossRef]
- Mauricio, J.M.; Marano, A.; Gómez-Expósito, A.; Ramos, J.L.M. Frequency Regulation Contribution through Variable-Speed Wind Energy Conversion System. IEEE Trans. Power Syst. 2009, 24, 173–180. [Google Scholar] [CrossRef]
- Pezic, M.; Cedrés, V.M. Unit commitment in fully renewable, hydro-wind energy systems. In Proceedings of the 10th International Conference on the European Energy Market (EEM), Stockholm, Sweden, 27–31 May 2013. [Google Scholar]
- Mansoor, S.; Jones, D.; Bradley, D.; Aris, F.; Jones, G. Reproducing oscillatory behaviour of a hydroelectric power station by computer simulation. Control. Eng. Pract. 2000, 8, 1261–1272. [Google Scholar] [CrossRef]
- Jiménez, O.F.; Chaudhry, M. Stability Limits of Hydroelectric Power Plants. J. Energy Eng. 1987, 113, 50–60. [Google Scholar] [CrossRef]
- Del Viento, G. Cumplimos la hora 1.000 al 100% con renovables. 2017. Available online: http://www.goronadelviento.es/index.php?accion=articulo&IdArticulo=204&IdSeccion=89 (accessed on 25 November 2017).
- Chaudhry, M. Applied Hydraulic Transients, 2nd ed.; Van Nostrand: New York, NY, USA, 1987. [Google Scholar]
- Riasi, A.; Tazraei, P. Numerical analysis of the hydraulic transient response in the presence of surge tanks and relief valves. Renew. Energy 2017, 107, 138–146. [Google Scholar] [CrossRef]
- IEEE Working Group. Hydraulic turbine and turbine control models for system dynamic studies. IEEE Trans. Power Syst. 1992, 7, 167–179. [Google Scholar]
- Souza, O.H.; Barbieri, N.; Santos, A.H.M. Study of hydraulic transients in hydropower plants through simulation of nonlinear model of penstock and hydraulic turbine model. IEEE Trans. Power Syst. 1999, 14, 1269–1272. [Google Scholar] [CrossRef]
- Nicolet, C.; Greiveldinger, B.; Hérou, J.J.; Kawkabani, B.; Allenbach, P.; Simond, J.J.; Avellan, F. High-Order Modeling of Hydraulic Power Plant in Islanded Power Network. IEEE Trans. Power Syst. 2007, 22, 1870–1880. [Google Scholar] [CrossRef]
- Fang, H.; Chen, L.; Dlakavu, N.; Shen, Z. Basic Modeling and Simulation Tool for Analysis of Hydraulic Transients in Hydroelectric Power Plants. IEEE Trans. Energy Convers. 2008, 23, 834–841. [Google Scholar] [CrossRef]
- Martínez-Lucas, G.; Sarasúa, J.I.; Sánchez-Fernández, J.Á.; Wilhelmi, J.R. Power-frequency control of hydropower plants with long penstocks in isolated systems with wind generation. Renew. Energy 2015, 83, 245–255. [Google Scholar] [CrossRef]
- Miller, N.W.; Price, W.W.; Sanchez-Gasca, J.J. Dynamic Modeling of GE 1.5 and 3.6 Wind Turbine-Generators. In Proceedings of the 2003 IEEE Power Engineering Society General Meeting, Toronto, ON, Canada, 13–17 July 2003. [Google Scholar]
- Bhatt, P.; Roy, R.; Ghoshal, S. Dynamic participation of doubly fed induction generator in automatic generation control. Renew. Energy 2011, 36, 1203–1213. [Google Scholar] [CrossRef]
- ENERCON GmbH. ENERCON Product Overview; Enercon GmbH: Aurich, Germany, 2016. [Google Scholar]
- Sun, Y.; Zhang, Z.; Li, G.; Lin, J. Review on frequency control of power systems with wind power penetration. In Proceedings of the International Conference on Power System Technology (POWERCON), Hangzhou, China, 24–28 October 2010. [Google Scholar]
- Ahmadyar, A.S.; Verbic, G. Control Strategy for Optimal Participation of Wind Farms in Primary Frequency Control. In Proceedings of the IEEE Eindhoven PowerTech, Eindhoven, Netherlands, 29 June–2 July 2015. [Google Scholar]
- Shang, L.; Hu, J.; Yuan, X.; Chi, Y. Understanding Inertial Response of Variable-Speed Wind Turbines by Defined Internal Potential Vector. Energies 2016, 10, 22. [Google Scholar] [CrossRef]
- IEEE. IEEE Guide for the Application of Turbine Governing Systems for Hydroelectric Generating Units; IEEE: Piscataway, NJ, USA, 2011. [Google Scholar]
- Seneviratne, C.; Ozansoy, C. Frequency response due to a large generator loss with the increasing penetration of wind/pv generation—A literature review. Renew. Sustain. Energy Rev. 2016, 57, 659–668. [Google Scholar] [CrossRef]
- Red Electrica de España. P.O. 1: Funcionamiento de los sistemas eléctricos insulares y extrapeninsulares; Boletín Oficial del Estado: Madrid, Spain, 2012; pp. 57263–57495. [Google Scholar]
- Canary Government. Anuario Energético de Canarias; Comercio y Conocimiento: Consejería de Economía, Industria, 2014.
- Red Electrica de España. El Sistema Electrico Español en 2015; Red Electrica de España: Madrid, Spain, 2016. [Google Scholar]
- Platero, C.A.; Nicolet, C.; Sánchez, J.A.; Kawkabani, B. Increasing wind power penetration in autonomous power systems through no-flow operation of pelton turbines. Renew. Energy 2014, 68, 515–523. [Google Scholar] [CrossRef]
- Carrillo, C.; Obando Montaño, A.F.; Cidrás, J.; Díaz-Dorado, E. Review of power curve modelling for wind turbines. Renew. Sustain. Energy Rev. 2013, 21, 572–581. [Google Scholar] [CrossRef]
- Jones, D.; Mansoor, S.; Aris, F.; Jones, G.; Bradley, D.; King, D. A standard method for specifying the response of a hydroelectric plant in frequency-control mode. Electr. Power Syst. Res. 2004, 68, 19–32. [Google Scholar] [CrossRef]
- Martínez-Lucas, G.; Sarasúa, J.I.; Sánchez-Fernández, J.Á.; Wilhelmi, J.R. Frequency control support of a wind-solar isolated system by a hydropower plant with long tail-race tunnel. Renew. Energy 2016, 90, 362–376. [Google Scholar] [CrossRef]
Figure 1.
Block diagram of the power system with a hybrid wind–hydro plant and the power system.
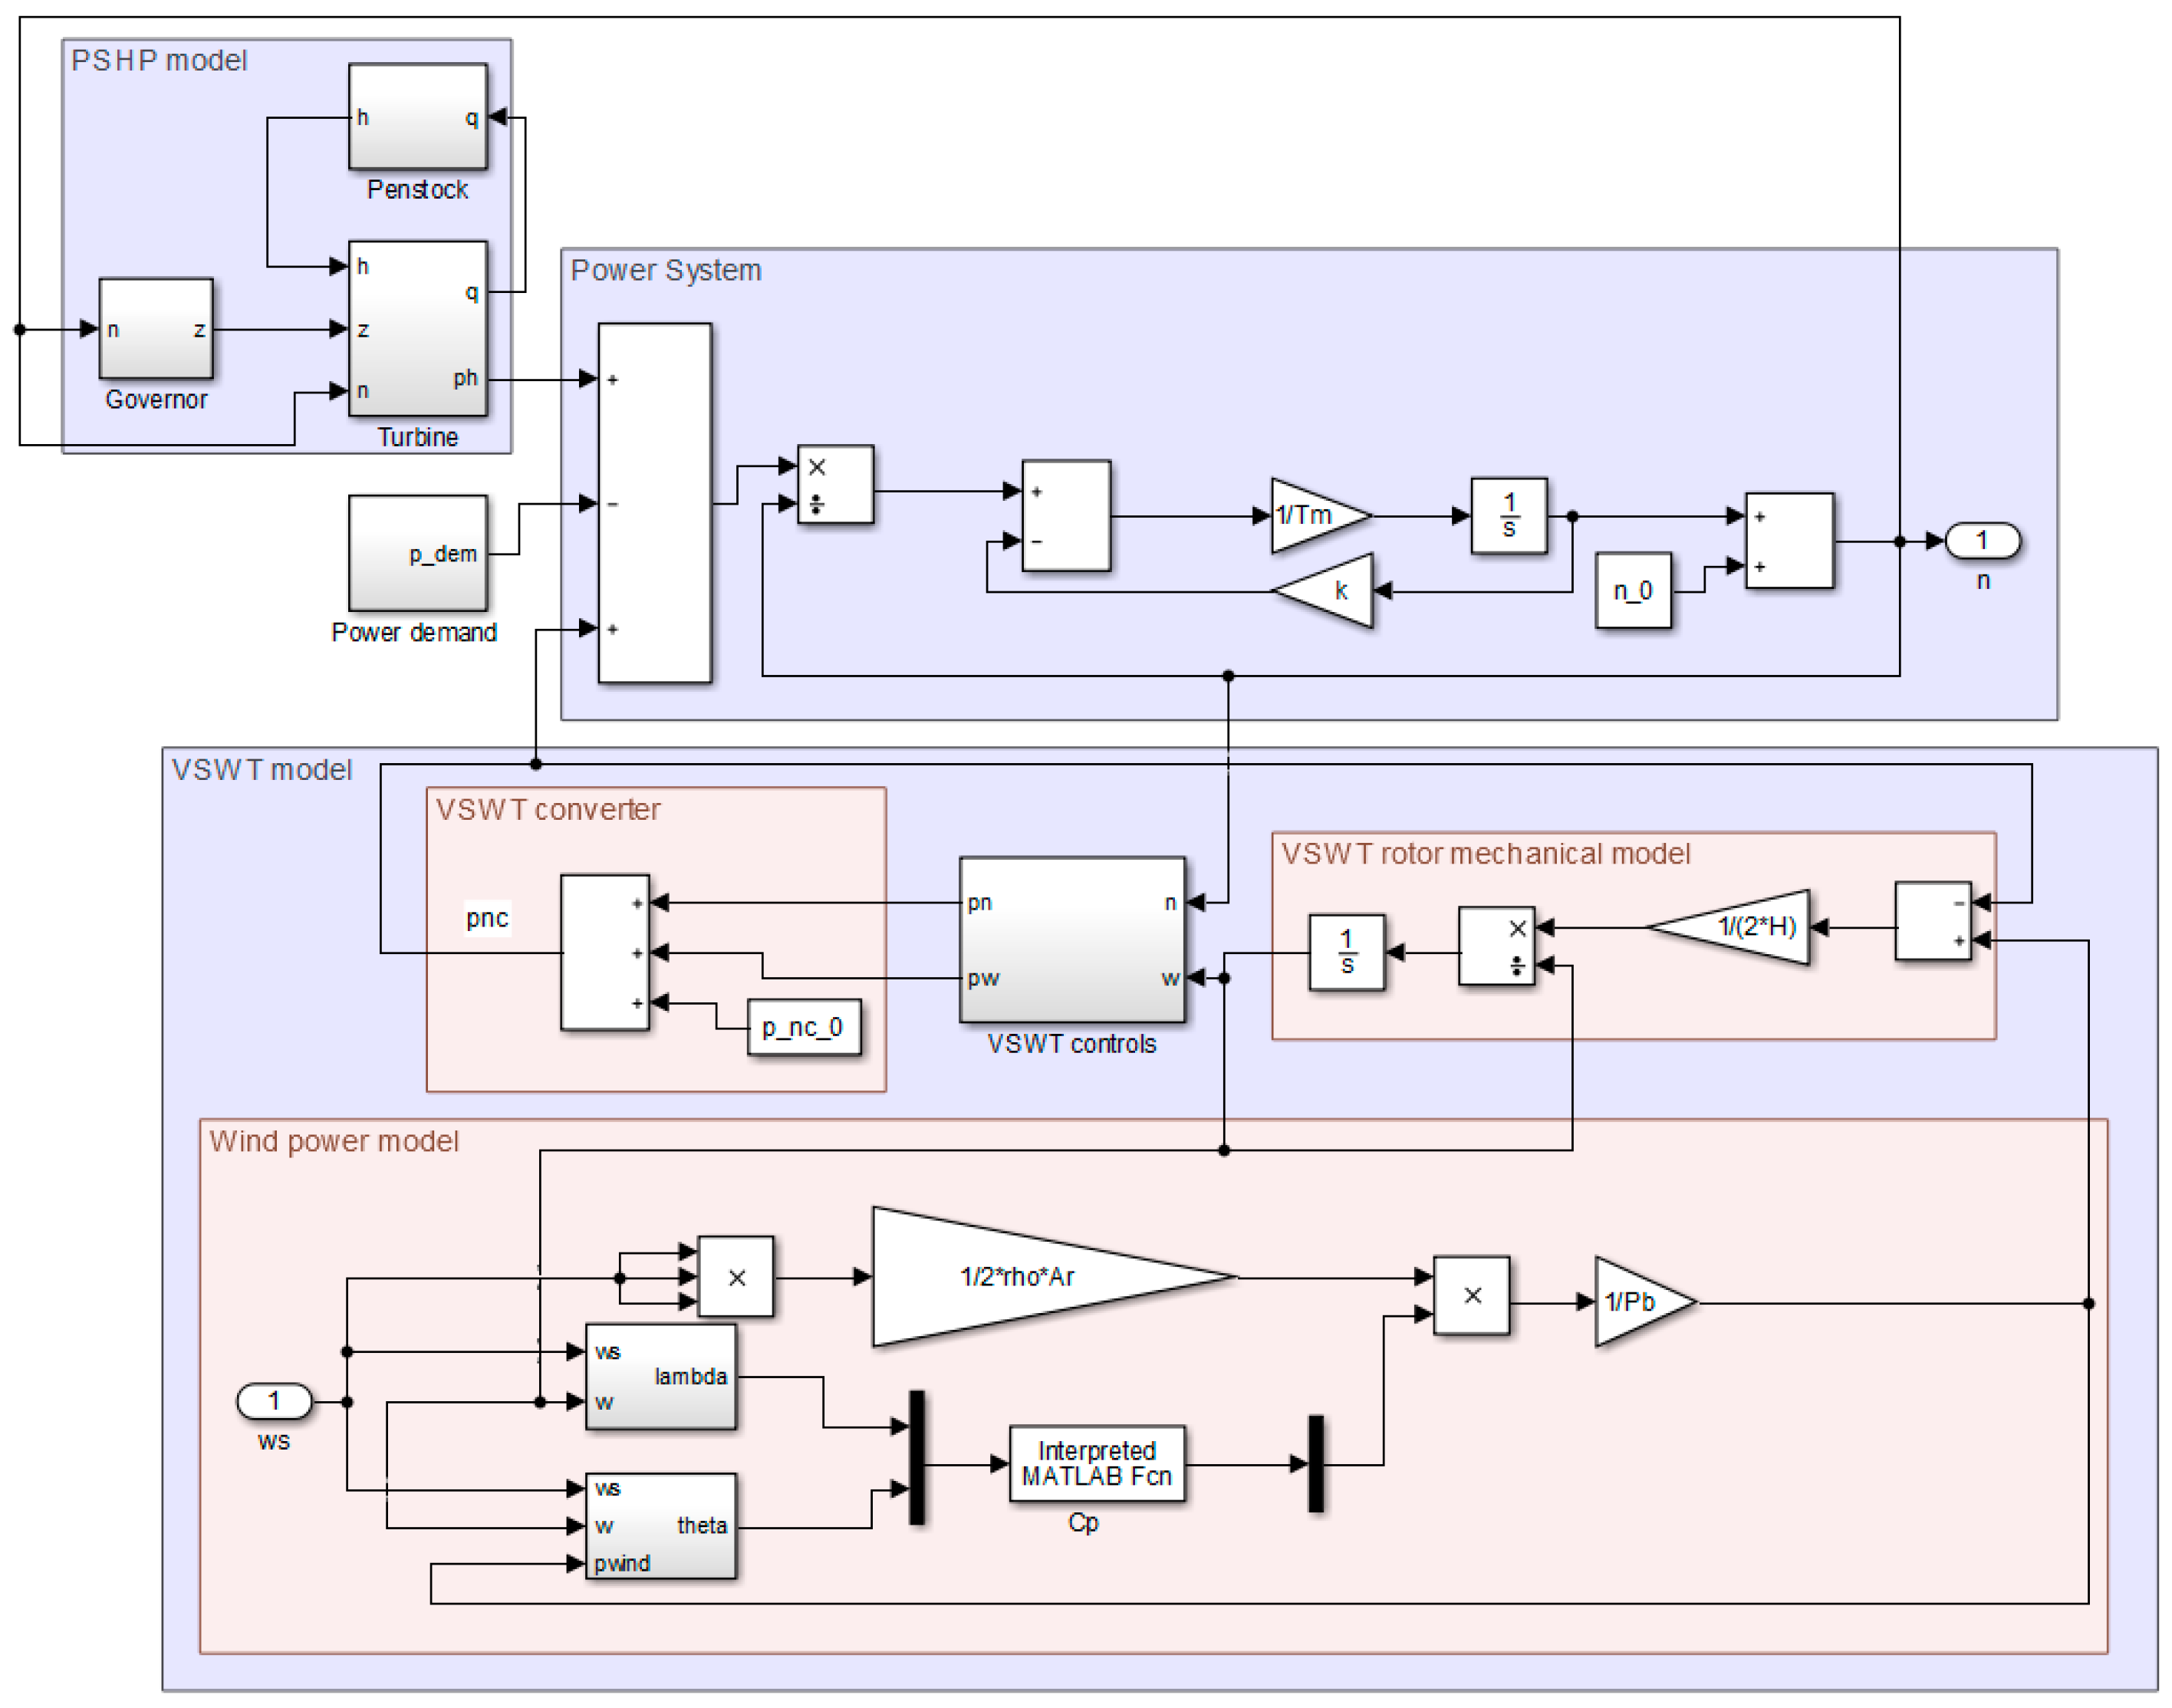
Figure 2.
Scheme of the penstock model.
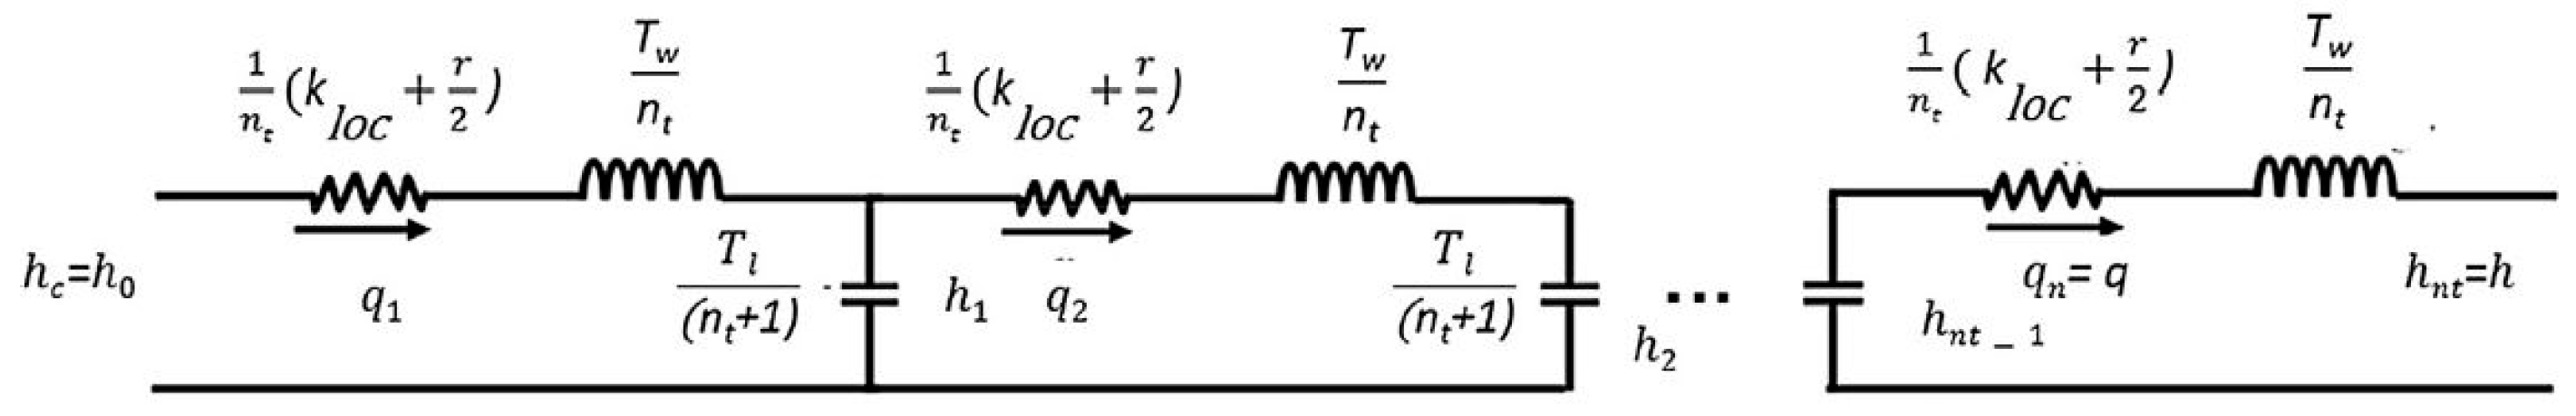
Figure 3.
(a) Wind power curves; (b) Comparison between Cp (red) and power (blue) responses resulting from the model (continuous lines) and response provided by the manufacturer (dashed line) [58].
Figure 3.
(a) Wind power curves; (b) Comparison between Cp (red) and power (blue) responses resulting from the model (continuous lines) and response provided by the manufacturer (dashed line) [58].

Figure 4.
Block diagram of pitch control model.

Figure 5.
Block diagram of the hybrid wind–hydro controllers.

Figure 6.
System response owing to a 5% step in power demand assuming the inertial control gains proposed in [44] for ws = 10 m/s.
Figure 6.
System response owing to a 5% step in power demand assuming the inertial control gains proposed in [44] for ws = 10 m/s.
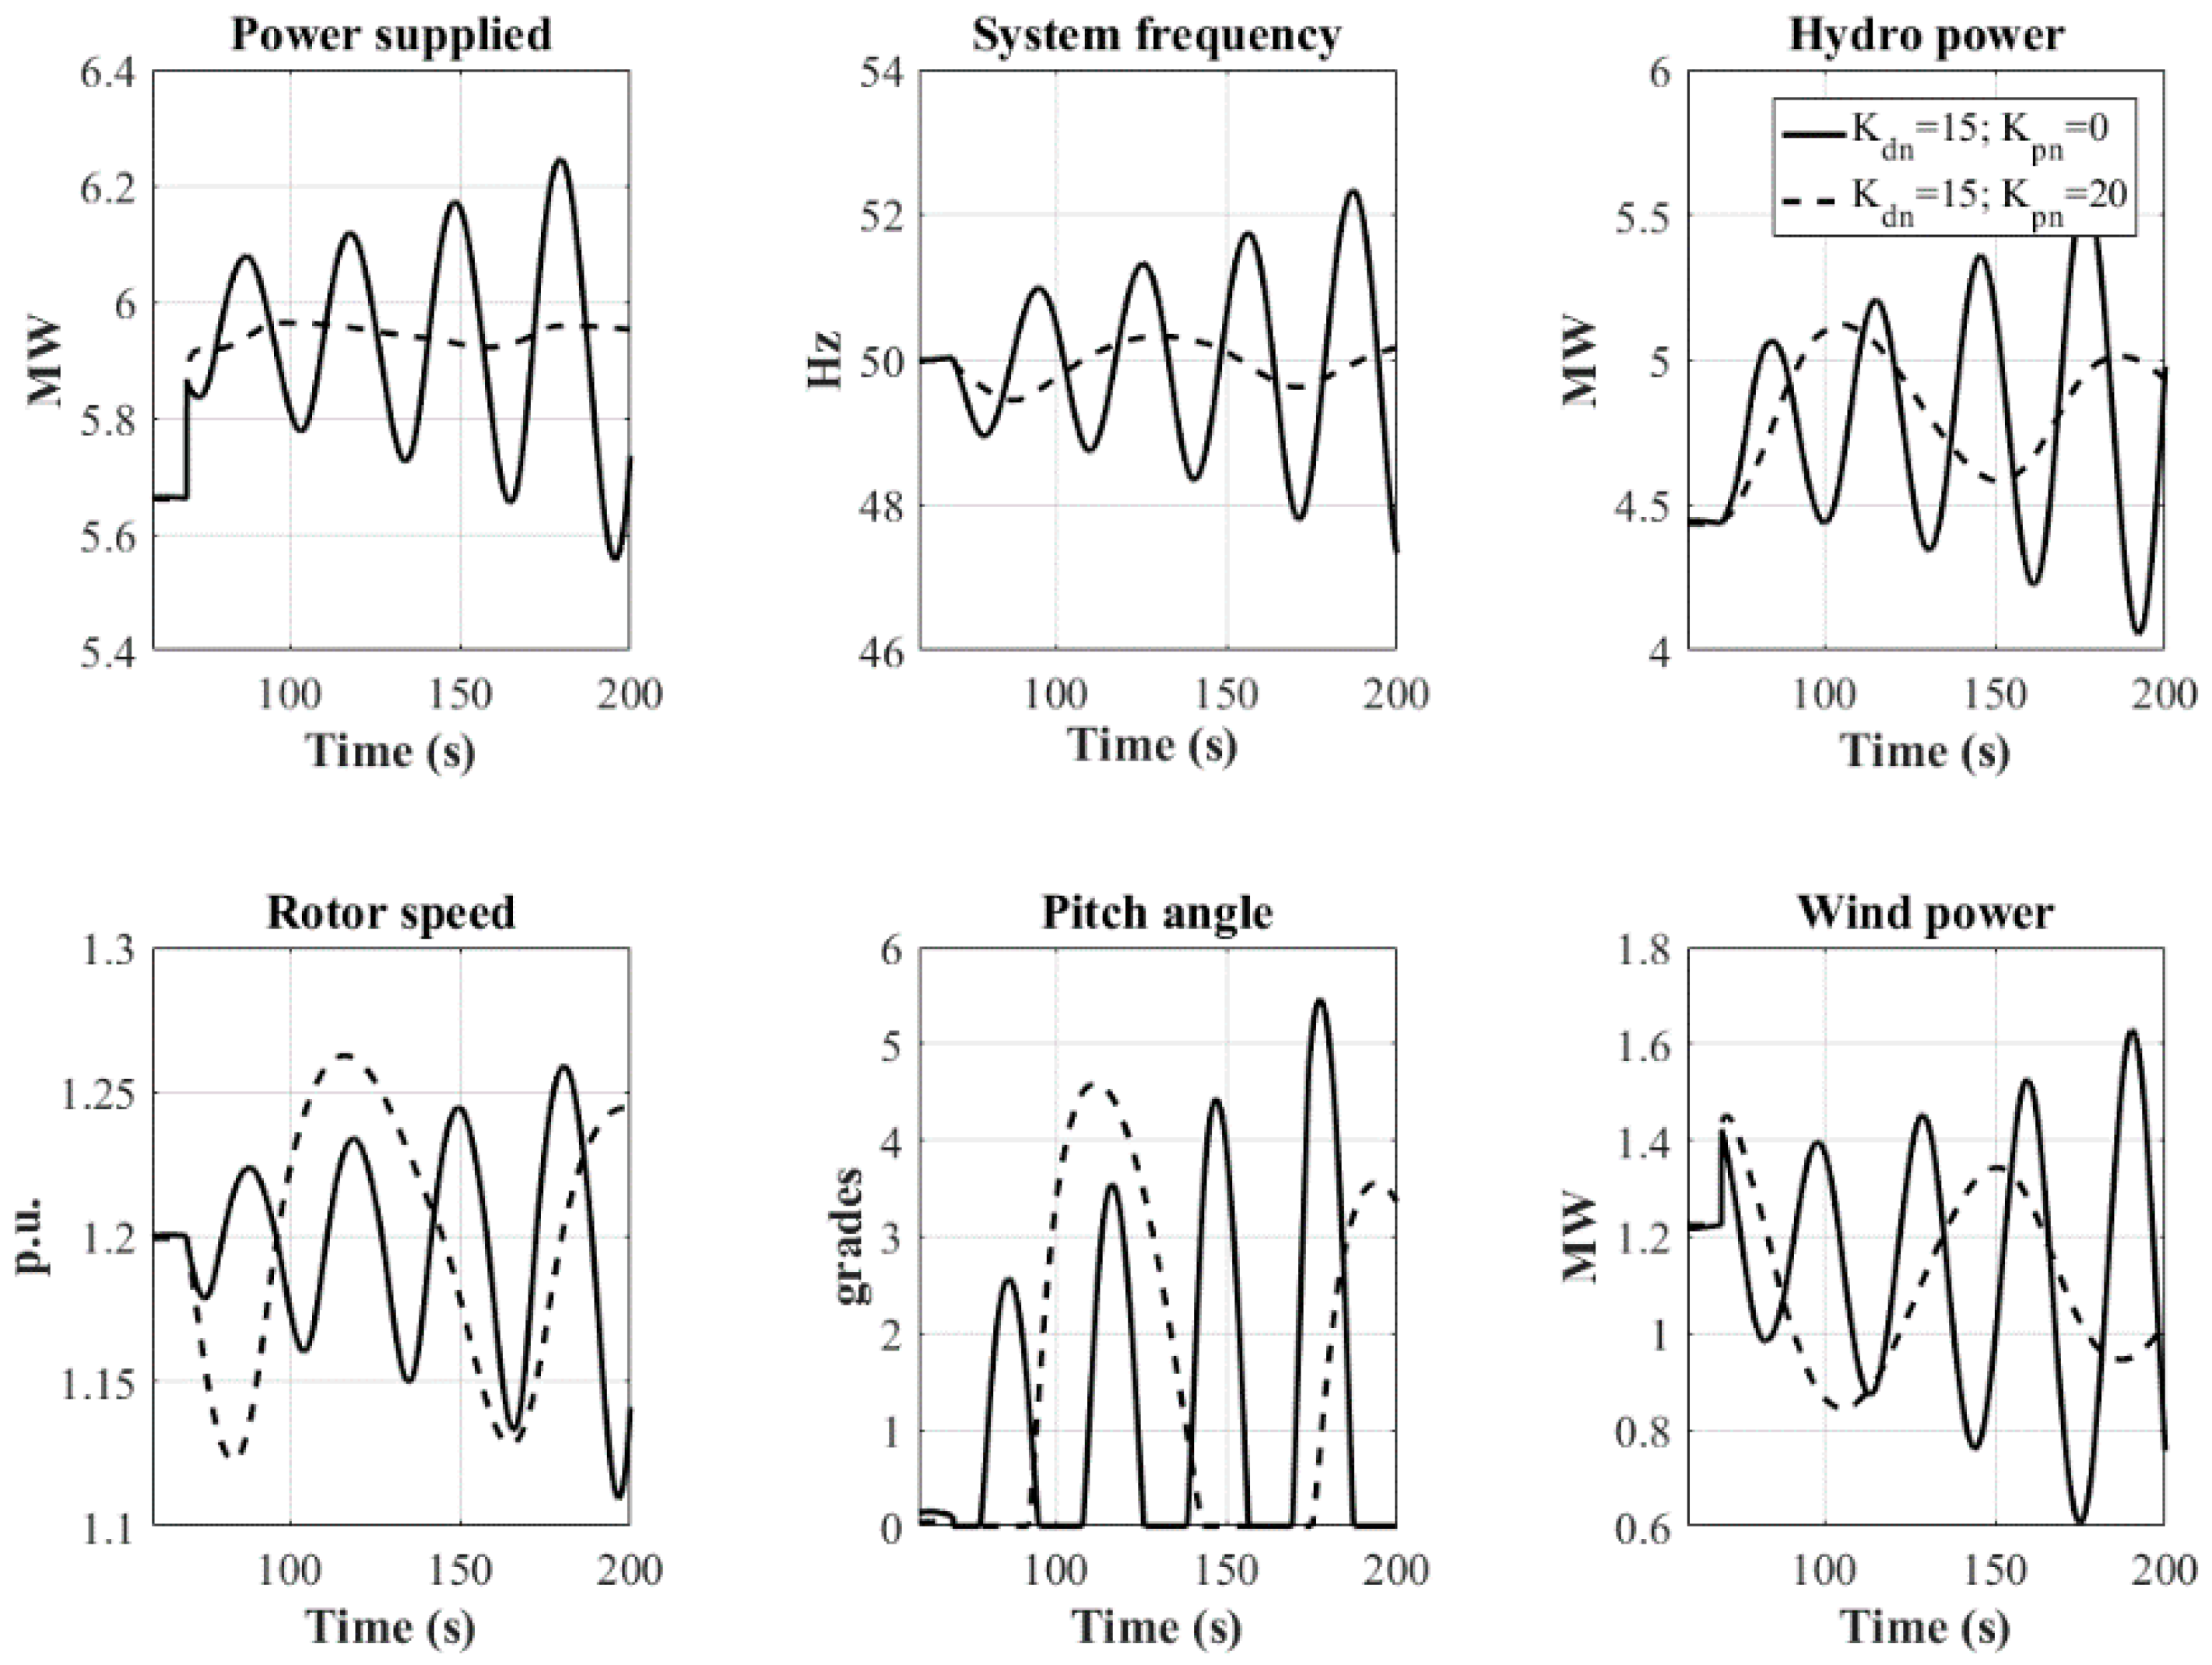
Figure 7.
Evolution of response indicators for different cases. Blue bars represent simulations assuming constant wind speed of 10 m/s while orange bars represent simulations assuming constant wind speed of 20 m/s.
Figure 7.
Evolution of response indicators for different cases. Blue bars represent simulations assuming constant wind speed of 10 m/s while orange bars represent simulations assuming constant wind speed of 20 m/s.

Figure 8.
(a) Wind speed ramp; (b) wind speed time series.

Figure 9.
Comparison of the dynamic response of the system between the base case and the case in which VSWT contributes to frequency regulation by combining the inertial and proportional control, and by considering a sudden power demand variation and a constant wind speed of ws = 10 m/s.
Figure 9.
Comparison of the dynamic response of the system between the base case and the case in which VSWT contributes to frequency regulation by combining the inertial and proportional control, and by considering a sudden power demand variation and a constant wind speed of ws = 10 m/s.

Figure 10.
Comparison of the dynamic response of the system between the base case and the case in which the VSWT contributes to frequency regulation by combining the inertial and proportional control, and by considering a sudden power demand variation and a constant wind speed of ws = 20 m/s.
Figure 10.
Comparison of the dynamic response of the system between the base case and the case in which the VSWT contributes to frequency regulation by combining the inertial and proportional control, and by considering a sudden power demand variation and a constant wind speed of ws = 20 m/s.

Figure 11.
Comparison of the dynamic response of the system between the base case and the case in which the VSWT contributes to frequency regulation by combining the inertial and proportional control, and by considering a sudden power demand variation and a constant wind speed of ws = 6 m/s.
Figure 11.
Comparison of the dynamic response of the system between the base case and the case in which the VSWT contributes to frequency regulation by combining the inertial and proportional control, and by considering a sudden power demand variation and a constant wind speed of ws = 6 m/s.
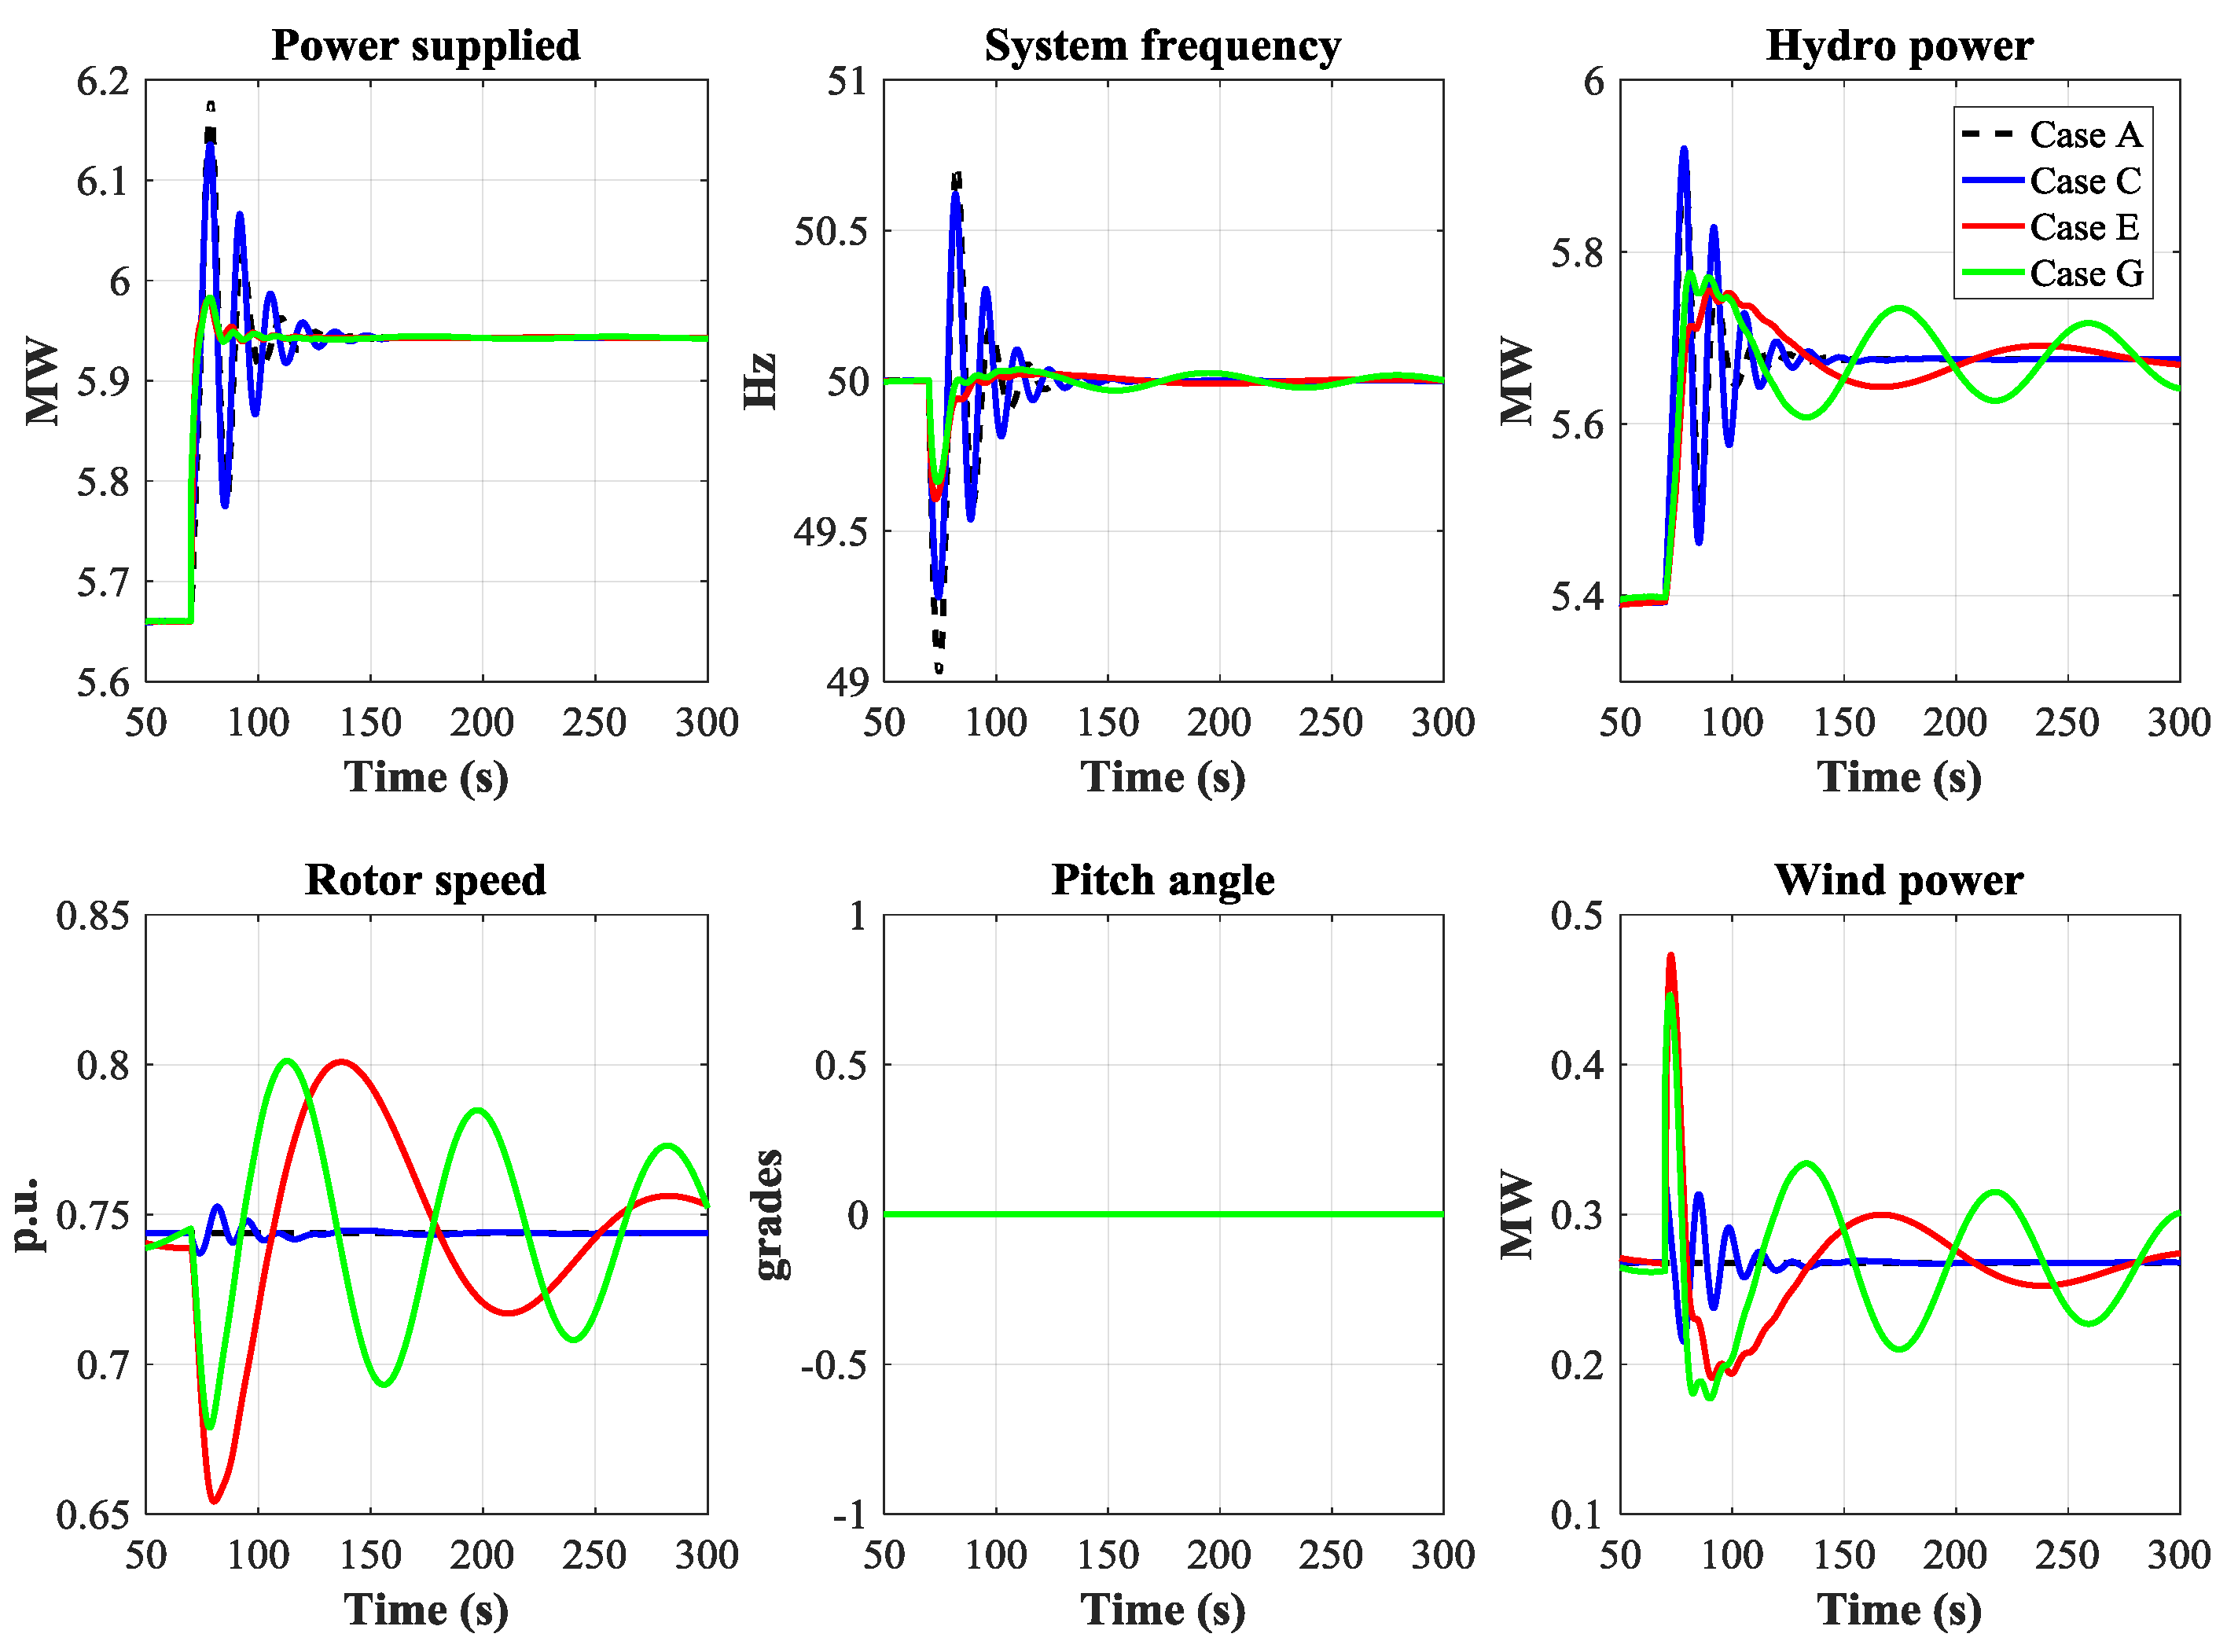
Figure 12.
Comparison of the dynamic responses of the system between the base case and the cases in which the VSWT contributes to the regulation assuming different control strategies during a wind speed ramp.
Figure 12.
Comparison of the dynamic responses of the system between the base case and the cases in which the VSWT contributes to the regulation assuming different control strategies during a wind speed ramp.

Figure 13.
Frequency comparison between cases A, C, E, and G during wind speed fluctuation.

Table 1.
Exhaustive summary of search cases.
| Strategy | Case | PSHP Adjustable Gains | VSWT Adjustable Gains |
|---|---|---|---|
| Regulation is only provided by PSHP | A | δ, Tr | - |
| VSWT inertial control | B | - | Kdn, Kpw, Kiw |
| C | δ, Tr | ||
| VSWT proportional control | D | - | Kpn, Kpw, Kiw |
| E | δ, Tr | ||
| VSWT inertial and proportional control | F | - | Kdn, Kpn, Kpw, Kiw |
| G | δ, Tr |
Table 2.
Gains bounds based on the exhaustive search conducted.
| Gain | Minimum Value | Maximum Value |
|---|---|---|
| δ | 0.5 | 5.0 |
| Tr | 0.5 | 5.0 |
| Kdn | 0.5 | 6.0 |
| Kpn | 0.5 | 6.0 |
| Kpw | 0.1 | 1.0 |
| Kiw | 0.005 | 0.010 |
Table 3.
Gorona del Viento W-PSHP ratings.
| PSHP generating unit | Rated power | 2.830 MW |
| Rated flow | 0.5 m3/s | |
| Number of units | 4 | |
| Rated speed | 1000 rpm | |
| Mechanical starting time (Tm) | 6 s | |
| Gross head | 670 m | |
| PSHP penstock | Length | 2577 m |
| Diameter | 1 m | |
| Darcy–Weisbach friction loss coefficient | 0.015 | |
| Wave speed (aw) | 1193 m/s | |
| Elastic time (Te) | 2.16 s | |
| VSWT | Number of VSWT | 5 |
| Model | ENERCON E-70 [58] | |
| Rated power | 2.3 MW | |
| Blade radius | 35.5 m | |
| Wind turbine inertia constant (Hwt) | 1.971 p.u. |
Table 4.
Exhaustive search results.
| Case | ws | Controllers Gains | Frequency Response Indicators | ||||||||
|---|---|---|---|---|---|---|---|---|---|---|---|
| PSHP | VSWT | ||||||||||
| δ | Tr | Kdn | Kpn | Kpw | Kiw | NADIR | Tn | Tp | |||
| (m/s) | (Hz) | (s) | (s) | ||||||||
| A | 10 | 0.70 | 2.00 | - | - | - | - | 49.08 | 21.95 | 47.93 | 0.047 |
| 20 | 0.60 | 3.60 | - | - | - | - | 49.06 | 9.93 | 63.19 | 0.078 | |
| B | 10 | 0.70 | 2.00 | 0.50 | - | 1.00 | 0.015 | 49.09 | 23.19 | 43.85 | 0.048 |
| 20 | 0.60 | 3.60 | 0.50 | - | 0.10 | 0.025 | 49.08 | 11.34 | 53.34 | 0.081 | |
| C | 10 | 0.50 | 1.90 | 1.50 | - | 0.10 | 0.030 | 49.31 | 25.26 | 34.93 | 0.056 |
| 20 | 0.50 | 1.90 | 3.50 | - | 0.10 | 0.005 | 49.41 | 15.80 | 37.23 | 0.084 | |
| D | 10 | 0.70 | 2.00 | - | 4.00 | 0.10 | 0.010 | 49.59 | 9.64 | 37.22 | 0.138 |
| 20 | 0.60 | 3.60 | - | 4.00 | 0.80 | 0.010 | 49.56 | 16.38 | 36.46 | 0.083 | |
| E | 10 | 3.50 | 0.30 | - | 5.00 | 0.10 | 0.005 | 49.62 | 8.51 | 19.23 | 0.303 |
| 20 | 3.50 | 0.30 | - | 4.50 | 0.50 | 0.050 | 49.58 | 8.81 | 19.51 | 0.288 | |
| F | 10 | 0.70 | 2.00 | 4.00 | 3.00 | 0.10 | 0.005 | 49.56 | 10.94 | 19.55 | 0.232 |
| 20 | 0.60 | 3.60 | 4.50 | 1.50 | 0.10 | 0.010 | 49.43 | 14.84 | 20.90 | 0.159 | |
| G | 10 | 1.50 | 0.50 | 4.50 | 5.00 | 0.10 | 0.015 | 49.68 | 8.20 | 12.17 | 0.498 |
| 20 | 1.50 | 0.50 | 4.00 | 5.00 | 0.10 | 0.015 | 49.69 | 7.56 | 11.80 | 0.557 | |
Table 5.
Simulation results with a ramp wind speed.
| Case | MFD | NADIR | Max. Frequency Peak | |||||||
|---|---|---|---|---|---|---|---|---|---|---|
| Hz | ∆ over A | Hz | ∆ over A | Hz | ∆ over A | 10–5 p.u./s | ∆ over A | o/s | ∆ over A | |
| A | 0.0195 | Base | 49.8719 | Base | 50.5947 | Base | 20.229 | Base | 0.1818 | Base |
| B | 0.0110 | −43.59% | 49.9997 | 0.26% | 50.1329 | −0.91% | 10.171 | −49.72% | 0.1820 | 0.11% |
| C | 0.0044 | −77.44% | 50.0000 | 0.26% | 50.0350 | −1.11% | 9.189 | −54.58% | 0.1844 | 1.43% |
| D | 0.0123 | −36.92% | 49.9778 | 0.21% | 50.1683 | −0.84% | 11.690 | −42.21% | 0.1833 | 0.83% |
| E | 0.0077 | −60.51% | 49.9814 | 0.22% | 50.1354 | −0.91% | 14.581 | −27.92% | 0.1818 | 0.00% |
| F | 0.0109 | −44.10% | 50.0000 | 0.26% | 50.0648 | −1.05% | 10.052 | −50.31% | 0.1839 | 1.16% |
| G | 0.0038 | −80.51% | 50.0000 | 0.26% | 50.0297 | −1.12% | 10.105 | −50.05% | 0.1832 | 0.77% |
Table 6.
Simulation results using variable wind speeds.
| Case | Wind Energy | MFD | NADIR | Maximum Frequency Peak | ||||||||
|---|---|---|---|---|---|---|---|---|---|---|---|---|
| MWh | ∆ over A | Hz | ∆ over A | Hz | ∆ over A | Hz | ∆ over A | 10–5 p.u./s | ∆ over A | o/s | ∆ over A | |
| A | 2.6707 | Base | 0.0400 | Base | 49.677 | Base | 50.2781 | Base | 46.493 | Base | 0.0800 | Base |
| B | 2.6686 | −0.08% | 0.0119 | −71.75% | 49.715 | 0.08% | 50.0967 | −0.36% | 11.340 | −75.61% | 0.0874 | 9.25% |
| C | 2.6616 | −0.34% | 0.0030 | −92.50% | 49.927 | 0.50% | 50.0521 | −0.45% | 6.7713 | −85.44% | 0.0854 | 6.75% |
| D | 2.6697 | −0.04% | 0.0133 | −66.75% | 49.773 | 0.19% | 50.1780 | −0.20% | 13.966 | −69.96% | 0.0856 | 7.00% |
| E | 2.6701 | −0.02% | 0.0102 | −74.50% | 49.837 | 0.32% | 50.1101 | −0.33% | 19.375 | −58.33% | 0.0858 | 7.25% |
| F | 2.6644 | −0.24% | 0.0069 | −82.75% | 49.809 | 0.27% | 50.0539 | −0.45% | 6.7310 | −85.52% | 0.0863 | 7.88% |
| G | 2.6658 | −0.18% | 0.0031 | −92.25% | 49.908 | 0.46% | 50.0288 | −0.50% | 8.3311 | −82.08% | 0.0874 | 9.25% |
© 2018 by the authors. Licensee MDPI, Basel, Switzerland. This article is an open access article distributed under the terms and conditions of the Creative Commons Attribution (CC BY) license (http://creativecommons.org/licenses/by/4.0/).
Share and Cite
MDPI and ACS Style
Martínez-Lucas, G.; Sarasúa, J.I.; Sánchez-Fernández, J.Á. Frequency Regulation of a Hybrid Wind–Hydro Power Plant in an Isolated Power System. Energies 2018, 11, 239. https://doi.org/10.3390/en11010239
AMA Style
Martínez-Lucas G, Sarasúa JI, Sánchez-Fernández JÁ. Frequency Regulation of a Hybrid Wind–Hydro Power Plant in an Isolated Power System. Energies. 2018; 11(1):239. https://doi.org/10.3390/en11010239
Chicago/Turabian StyleMartínez-Lucas, Guillermo, José Ignacio Sarasúa, and José Ángel Sánchez-Fernández. 2018. "Frequency Regulation of a Hybrid Wind–Hydro Power Plant in an Isolated Power System" Energies 11, no. 1: 239. https://doi.org/10.3390/en11010239
Note that from the first issue of 2016, this journal uses article numbers instead of page numbers. See further details here.