Perceived and Reported Reliability of the Electricity Supply at Three Urban Locations in Indonesia


1
Department of Design, Production and Management, Faculty of Engineering Technology, University of Twente, P.O. Box 217, 7500 AE Enschede, The Netherlands
2
Department of Electrical Engineering, Faculty of Science and Technology, UIN Suska Riau University, Jl. H.R. Soebrantas No. 115, Pekanbaru 28292, Indonesia
*
Author to whom correspondence should be addressed.
Energies 2018, 11(1), 140; https://doi.org/10.3390/en11010140
Submission received: 14 October 2017
/
Revised: 2 January 2018
/
Accepted: 3 January 2018
/
Published: 6 January 2018
(This article belongs to the Special Issue Resilience of Energy Systems 2017)
Abstract
:This paper focuses on the reliability of electricity supply at three different locations in Indonesia, namely in Sumatra, Timor, and Papua, through a comparison of reported indices of power reliability (SAIFI and SAIDI) and experimental results from user surveys and power measurements. The reason for this study is the lack of information about the actual, quantified reliability of power supplied by the main grid in Indonesia, while narratives of end-users indicate the reliability might be unsatisfactory. The study was executed using data from 114 randomly-selected respondents in the city of Pekanbaru in Sumatra, 65 in the city of Kupang in Timor and 26 in the city of Jayapura in Papua, totaling 205 respondents. These users experienced a higher unavailability of power delivered by the grid than expressed by the utility-reported SAIDI and SAIFI. Therefore, for this study, new indices are introduced, namely the Perceived (P) SAIDI and SAIFI, which are based on the frequency and duration of blackouts experienced by the users. It is concluded that the reported reliability indices do not always demonstrate the experience of the grid users. P-SAIFIs were 1.3 to 4.6 times higher in Pekanbaru and Kupang, respectively than the utility-reported SAIFIs for the same provinces. Also, P-SAIDIs were 2.6 to 3.9 times higher in Pekanbaru and Kupang, respectively, than the utilities’ SAIDIs. It is therefore not surprising that depending on the location, 14% to 65% of the users own a backup generator and that households are willing to pay $3 to $8 extra per monthly electricity bill or $1c–$3c per kWh for improved reliability.
1. Introduction
Access to electricity is a basic need for people. However, in some countries, not all people have access to reliable electricity from the grid. According to the International Energy Agency (IEA), around 1.2 billion people, 16% of the global population, were still without access to electricity in 2015 (IEA 2016 [1]). In Indonesia, around 35 million people remained without electricity in 2015 [2], which is more than the total population of Malaysia, its neighbor country, for the same year. Further, reliability problems, which are the focus of this study, exist in areas with access to the grid [3,4], as also occur in Indonesia [5].
Due to various economic, technical, and political problems, a low quality of electricity supplied by the grid can be expected in some developing countries [3,4]. This issue can be characterized by the intermittent and unreliable supply of electricity to the end-users commonly through regular grid interruptions, either planned or unplanned.
A low reliability of electricity supply affects individuals and family life as well as being interrelated with the development and economic condition of a country. A low gross domestic product (GDP) results from a weak power grid in a country or vice versa. For instance, according to Murphy et al. (2014) [6], a reduction in the number of outages from 100 days per year to 10 days per year corresponds to more than a two-fold increase in GDP per person.
The reliability of electricity services can be quantified by their availability [6]. To give a preliminary impression of the reliability of the electricity supply in Indonesia as a whole, we present a calculation of the actual availability of the utility grid and the “mean time between failure (MTBF)”. Availability, A, is the percentage of time that a system is functional, or the time the system is up (Tup), divided by the total time at risk (Ttotal = Tup + Tdown) (Propst 1995, in [6]). The calculations follow the procedure suggested by Murphy et al. [6]. Data from the World Bank [7] is used, where the monthly average number of outages in Indonesia in 2015 is 0.5 and the mean time to repair (MTTR), or the average duration of a typical outage, is 5.7 h.
For the average month lasting 730 h, Indonesia’s 0.5 outages per month averaging 5.7 h in duration gives a Tdown = (0.5 × 5.7) or 2.85 h on average for the grid in Indonesia. Thus, A can be calculated, resulting in 99.6%. Also, MTBF can also be calculated, since A is MTBF divided by the total of MTBF + MTTR [6], to be 58.1 h. These calculations show a very high reliability of electricity supply in Indonesia, while narratives of end-users indicate that the reliability might be unsatisfactory.
The reliability of electricity services is also often quantified with indices such as the System Average Interruption Duration Index (SAIDI) and System Average Interruption Frequency Index (SAIFI) [8], which are normally documented by utility companies. However, the self-reported reliability indices do not always represent the actual situation accurately [6]. In this sense, knowledge about the experience of the grid users can be useful to evaluate the reality of the reliability indices of electricity service.
How reliable is the electric power supply through the distribution networks (DN) in urban areas of Indonesia from the perspective of users, and how does this compare to official data? This interesting question guides this research. Currently, information is lacking about this important topic affecting the lives of millions of people in Indonesia. To the best of our knowledge, this paper presents the first independent study for Indonesia with an evaluation of household perception regarding the reliability of the electricity supply through the distribution grid, and how the user experiences compare to the reported data from the utility.
The remainder of this paper is organized as follows: Section 2.1 introduces energy demand and electricity supply in Indonesia followed by Section 2.2, which presents various topics that are related to the reliability and resilience of electricity grids in the country. The detailed research questions and related experiments are presented in Section 3. In Section 4, the results of the research are shown and, finally, in Section 5, conclusions are drawn and discussed within their context.
2. Literature Review
2.1. Energy Demand and Electricity Supply in Indonesia
Given its large and growing population of 255 million people and strong economic growth, Indonesia’s demand for electricity is rapidly increasing. The electricity consumption in 2015 was 201 TWh and is projected to reach 2008 TWh by 2050 [9]. However, due to the geographical distribution of the archipelago of Indonesia, the country faces challenges for providing a sufficient, evenly-distributed, and reliable electrical power supply to all locations and islands (Figure 1).
Java and Bali are the most densely populated islands in Indonesia as well as the center for industry and critical economic activities. In 2015, 58% of Indonesia’s population lived in Java and Bali, and around 70% of the 48 GW of the national generation capacity (i.e., 34 GW) supplied Java’s and Bali’s demand only. The Island of Sumatra used 10 GW out of 48 GW, and the remaining 9% of the national generation capacity was used in the other two-thirds of Indonesia. Similarly, of the electricity produced in 2015, approximately 75% was sold in Java and Bali, 29.3% in Sumatra, and 10% in Kalimantan and Eastern Indonesia [9].
The majority of Indonesia’s public power infrastructure is operated by Perusahaan Listrik Negara or PLN. PLN is a state-owned company and is the major power provider in Indonesia for electricity generation, transmission, distribution, and retail sales.
By the end of 2015, the overall electrification ratio (ER) in Indonesia was 86%, which ranged from the lowest value of 36% in Papua, a moderate value around 65% in some provinces on the islands of Sulawesi, Kalimantan, and Timor, to the highest value of 98% in Jakarta [2] (Figure 1). Electrification ratios in two other provinces selected in this study, the Province of Riau and the Province of East Nusa Tenggara (ENT), were 71.5% and 52.3%, respectively. These significant disparities in the ERs of the three provinces do not represent many differences of the absolute number of households without electricity. Approximately 530,000 households without electricity could be found in ENT, 470,000 in Papua, and 435,000 in Riau.
Access to electricity in rural areas of Indonesia has increased rapidly over the past decade [11]. According to the World Bank (2017) [12], an increase of 2% per year occurred in urban areas and 20% per year in rural areas from 2004 to 2014, with respect to data from 2004. However, the IEA (2016 [13]) reported an ER of 84% for 2016, which is slightly lower than the ER for 2015 based on the value from PLN of 86.2% [2]. According to the IEA, access to electricity in urban and rural areas of Indonesia in 2016 was 96% and 71%, respectively, while PLN does not differentiate between rural and urban areas in its reported ER values. Lack of access to electricity and unreliable power supply is common in rural areas, remote islands, and villages (see Figure 1 and Section 2.2). However, in cities issues also exist with access and reliability of the electrical energy supply, although to a lower extent compared to elsewhere. Despite this situation, there exist few, if any, publications on the reliability of electric power or the resilience of grids in Indonesia.
2.2. Reliability of Electric Power
Maintaining a reliable electricity supply over such an enormous distribution of islands, as the Indonesian archipelago, is a challenge due to higher investment costs for power infrastructure development. This was confirmed by Knoema [14] who ranked the power reliability of 144 countries based on electricity supply interruptions and voltage fluctuations. The report shows that the reliability of power supply in Indonesia in 2014 was 4.3 out of 7, which is slightly below the average world score of 4.5. Also, the CRO Forum [15] showed that the reliability of electric power in Indonesia was rated at 4 out of 7. Further, Erahman et al. [16] reported that Indonesia’s Energy Supply Index (ESI) ranked 55th out of 71 countries during the period 2008 to 2013, where lower values represent a more secure energy supply. The effects of outages could be detrimental to the economy and social life. As such, studies on the quality and reliability of electricity supply are significant from a societal perspective.
Indonesia and the rest of the South-East Asian region are likely to experience an increased intensity and frequency of power disruptions in the future (Hashim [17]). Being located in the tropical region, Indonesia is among the countries with a very high flash density and high risk of weather effects on outages (Zorro [18,19], Bi and Qi [20], and NASA [21]). Lightning causes high impacts on Indonesia’s power infrastructure and, according to Zorro [18], it is responsible for over 56% of the outages in PLN’s 500 kV system, 28% in the 150 kV system, 69% in the 70 kV system, and 90% in the 20 kV system. Additional causes of power outages in Indonesia include issues for PLN in the region of “Papua and West Papua” (PWP), which is involved in this study, related to equipment failures, vegetation, and overconsumption by the public along with other causes of outages in the local grids.
The electric power quality (PQ) is repeatedly used to specify the quality of voltage, the quality of current, the reliability of service, and the quality of power supply [22]. In this paper, we also present the actual voltage fluctuation to show the PQ of DN in the study locations. Power quality directly signifies the reliability of the electricity supply and is characterized by the probability of disturbance events [23], which, in this paper, is represented by the outage duration and frequency.
However, as mentioned above, there is a lack of information about the reliability of the electricity supply in Indonesia. Therefore, our objective is determining the actual reliability of distribution networks in urban areas of Indonesia with different ERs using the typical indicators of SAIDI and SAIFI (IEEE Standard 1366-2012).
SAIDI indicates the total duration of interruption for the average customer during a predefined period, in minutes of interruption per customer per year (Equation (1)) [8]:
where ri is the restoration time or the duration of interruption (minutes), Ni is the number of customers interrupted, and NT is the number of customers. The subscript i represents the service area.
SAIFI indicates how often the average customer experiences a sustained interruption over a predefined period per customer per year (Equation (2)) [8]:
2.3. User Perception to Evaluate Reliability of Electricity Supply
Public perception has been widely used to evaluate the quality of a variety of public goods, such as agroecosystems, public policy, health, and electricity [24,25]. Knowledge about public or end-user preference is an important input to policymaking or investment decisions as the basis for a sustainable improvement of services provided by public utilities. Failure in defining user perception could lead to improper conclusions and inefficiencies.
Information about the user perception regarding public goods may be generated from different sources, such as expert opinion, secondary sources, the direct opinion of the users, or a combination of these. Direct information from the users is often preferable because expert opinion and secondary sources have drawbacks [26]. Namely, expert opinion may be subject to biased personal perception because they do not experience the real situation. Secondary sources are possible subject to a lack of validity when they are applied in a different context.
Information from the users may be obtained using questionnaires, face-to-face interviews, or the qualitative deliberative (focus group) method [24,25,27]. Also, the perception or valuation of people toward a good or service can be assessed using survey and polling methodologies [28], which provide diverse tools and approaches to perform representative public opinion measurements. In this study, we obtained information from end-users with questionnaires and face-to-face interviews to capture their experience of electricity service from the grid.
Public perception of the reliability of the electricity supply is frequently studied in many countries. Using data obtained from a survey of the users of large computers in Japan, Matsukawa and Fujii [29] examined customer preferences for reliable sources of electricity at the users’ facilities. The results of the study showed a trade-off between the reliability of the power supply and the price users paid. A more recent study from Sagebiel and Rommel [30] applied a choice experimental method combined with a scale-adjusted latent class model to explore the valuation of electricity quality from the perspective of urban households in India. Their findings are interesting because, despite the limited preparedness of domestic users in India to pay for improved electricity quality and renewable energy, the grid users prefer state-owned distribution companies to private enterprises or cooperative societies. From another work by the same authors, which reviewed conditions in Germany [31], a different conclusion was suggested as respondents in Germany have a particularly high willingness to pay (WTP) for renewable energy.
Another study from Ozbafli and Jenkins [25] estimated households’ WTP for improved electricity service in North Cyprus. They found that to avoid the cost of outages, households were willing to incur 3.6% and 13.9% increases in their monthly electricity bill for summer and winter, respectively. Other recent studies regarding user preference concerning public goods and services include Kalkbrennera, Yonezawa, and Roosena [32], Bartczak et al. [33], Sagebiel [34], and Shina and Hwang [35]. From a review of these studies, public perception observed in a certain local setting could be different from the perception of people in other situations.
However, there are comparatively few examples of public perception used for energy research in Indonesia. Many studies which utilized public perception focus on health (Harapan et al. [36]), environment (Vollmer et al. [37], Suparman, Folmer and Oud [38], Ghozali and Kaneko [39], Soo [40]), tourism (Anna [41]), transportation (Hendratmoko, Guritnaningsih, and Tjahjono [42], Ambarwati [43]), and trade (Kojima [44] and Miller et al. [45]). Only two studies present public perception in the energy area in the Indonesian context, namely Lensink, Raster and Timmer [46] with observations about the WTP for solar lamps, and Kumashiro et al. [47], which evaluated geothermal energy. However, both studies are not suitable for this work.
3. Research Questions and Methods
3.1. Research Questions
The main question of this paper is: “How reliable is the electric power supply by distribution networks (DN) in Indonesia from the perspective of users, and how does this compare to official data?” In this context, the following sub-questions are explored:
- What is the officially-reported reliability of the power supply in Indonesia?This is answered through a desk study by analysis of PLN’s annual reports containing SAIDI and SAIFI values for each province in Indonesia. The results of the analysis are presented in Section 4.1.
- How do users in urban areas of Indonesia experience their power supply in practice?This question aims to discover the actual experiences of PLN customers in urban areas regarding the reliability of the electricity supply. To answer this question, a user study on households’ experiences was executed in three locations in Indonesia, including the cities of Pekanbaru in the Province of Riau, Kupang in the Province of ENT, and Jayapura in the Province of Papua. The results are reviewed in Section 4.2.
- What is the actual power quality in distribution grids in Indonesia?This question is for providing evidence on the existence of outages and voltage fluctuation at the three study locations by conducting short-term measurements of power quality of the PLN distribution networks. The results are outlined in Section 4.3.
3.2. Methods
3.2.1. Desk Study
Annual reports from PLN during 2010 to 2015 [2,48,49,50,51,52] were analyzed through a desk study to examine sub-question 1 of the research questions. PLN’s annual reports contain statistics about the company’s annual performance and data on distribution grid operation. These reports were published in the Indonesian language, and, therefore, it is useful to evaluate the data they contain for a broader global audience. The official data on SAIDI and SAIFI in different provinces of Indonesia were analyzed, and the trends in the reliability of the electricity supply in Indonesia were observed. The result from the desk study became input to select three appropriate locations for this study with the lowest, medium, and highest values of reliability indices, as is explained in the next section and shown in Table 1.
3.2.2. Experimental Set up of Field Research
For the exploration of sub-questions 2 and 3 of the research questions, a field research study was established from 27 March 2017 to 9 May 2017. The field research consisted of end-user studies with questionnaires and measurements of power on the grid that were subsequently performed at the three study cities (see Figure 1).
The selection of the study locations was based on three criteria. First, the study locations should give a regional representation of the country. Therefore, Riau was selected among the provinces in the west, ENT in the central, and Papua in the eastern part of Indonesia. Second, the reliability of the power supply in the locations should range from the level of worst, to moderate, to best. The ERs were used as inputs to make initial assumptions about the level of supply reliability. With an ER of 71%, it was assumed that Riau had the best reliability of power supply. Similarly, with ERs of 52% and 36%, ENT and Papua were assumed to have a moderate and the worst reliability for power supply, respectively. Table 1 shows the quantified data and the periods in which the field research occurred for each location.
End-User Survey
To obtain the stated perceptions of respondents, data were collected through a structured questionnaire utilizing open-ended and closed-ended questions in combination with “face-to-face” semi-structured interviews [53]. The stated-perception data extracted from the questionnaires express the respondents’ hypothetical responses about their experience regarding electricity services and willingness to pay (WTP) extra cost for improved reliability of power supply. The questionnaire contained 62 questions covering various topics regarding household experience living with and without electricity, the level of satisfaction about the electricity supply, WTP a higher electricity bill, willingness to accept PV systems, and an energy use profile at home. Also, aspects such as income, gender, and profession were recorded. For this paper, nine questions from the questionnaire were presented as shown below (see Appendix B).
- Would you accept an increase in your electricity bill for better electricity service?
- How much increase in your electricity bill would you find acceptable?
- Do you have a backup generator at home?
- Do you experience a stable electricity voltage at home? (in this paper, the “stable electricity voltage” is used as a general phrase in the questionnaires, which refers to a minimum level of voltage fluctuation. See also Section 4.2.1.)
- Have you ever experienced a blackout at home?
- On average, how often in a month do you experience blackouts?
- On average, how long is the duration of the blackouts you experience?
- At what time of day would a blackout event incur the most losses for you?
- On average, what is the duration of a blackout that would incur economic losses for you?
According to the Theory of Value (Lancaster, in Bernués et al. [27]), the attributes or characteristics of a good or service determine its value for the individual who obtained it. To capture insight into end-user perception, respondents were asked to identify and rank each characteristic of the power supply they experienced. These rankings were translated into scores, rescaled, and averaged as presented in Section 4. The responses were used to estimate the P-SAIFI and P-SAIDI, the two new indices we defined in this paper, to estimate the reliability of the power supply based on the user experiences. P-SAIFI is the average frequency of interruption experienced by the respondents in a number of outage events per customer per year, where the initial letter stands for “perceived”. P-SAIDI represents the user experience of the average duration of each interruption in hours per customer per year.
The P-SAIFI and the P-SAIDI are calculated by applying the mean of the frequency distribution (MFD) statistical method using the results of the user survey. The P-SAIFI is calculated based on the respondents’ answers to the question “on average, how often do you experience blackouts in a month?” The P-SAIDI is calculated based on the users’ responses to the question “on average, how long is the duration of the blackouts that you experience?” Standard deviations of the estimated P-SAIFI and P-SAIDI are also calculated.
Honest answers can be expected from the respondents if they believe their response could affect outcomes and if questions are associated with public goods [26], which is relevant to this study. However, users might still overstate their perception towards the questions compared to their real behavior or situation [26]. Therefore, we applied a correction factor, C, to produce more accurate values of P-SAIFI and P-SAIDI. The correction factor is based on an empirical finding by List and Gallet [54], who addressed the “hypothetical bias” of people in preference-related studies using the meta-analysis statistical method. They examined data from 29 experimental studies and suggested: “on average, subjects overstate their preferences by a factor of about 3 in hypothetical settings”. As such, the formulas applied to determine the P-SAIFI and P-SAIDI take a 30% correction factor into consideration (see Equation (4)).
The calculation of the P-SAIFI starts with classifying the monthly interruption frequencies experienced by the respondents, fFi, into four groups of fF1: less than 3 times, fF2: 3 to 5 times, fF3: 6 to 10 times, and fF4: more than 10 times. Then, the mid-values, xFi, of each group of interruption frequency, fFi, are found as xF1: 1.5 times, xF2: 4 times, and xF3: 8 times. Because there is no mid-value for fF4, we use an interruption frequency of 11 times to represent xF4. Next, each mid-value is multiplied by the number of users, N_fFi who responded in the corresponding category, fFi, to find the frequency distribution of the data. The next step is to calculate the MFD using Equation (3) [55].
where N is the number of respondents at each location. The values of the MFD are based on answers to the question “on average, how often do you experience blackouts in a month?” Therefore, they represent the number of perceived interruption events per month for each city. The final step is to multiply the MFDs by the number of months in the year. The correction factor, C, is applied to find the average annual P-SAIFI.
Equation (4) is built from the above steps and is used for calculating the P-SAIFI:
where the constant, C, is the correction factor and i represents the outage frequency groups.
Similarly, calculation of the average annual P-SAIDI for each customer is based on answers to the question “on average, how long is the duration of the blackouts that you experience?” It starts with categorizing the monthly outage duration experienced by the respondents, fDi, into five groups of fD1: less than 5 min, fD2: 5 to 15 min, fD3: 15 to 60 min, fD4: 1 to 2 h, and fD5: longer than 2 h. Then, the mid-values of each group of interruption durations, xDi, are calculated as xD1: 2.5 min, xD2: 10 min, xD3: 37.5 min, and xD4: 90 min. Because there is no mid-value for fD5, an outage duration of 125 min is used to represent xD5. Next, each mid-value is multiplied by the number of users, N_fDi, who responded in the corresponding category, fDi, to find the frequency distribution of the data. The next step is to calculate the MFD using Equation (5):
The final step is to calculate P-SAIDIs by multiplying the MFDs by the above P-SAIFI, and the results are divided by 60 to obtain the number of hours of interruption per customer.
Equation (6) is used for calculating the P-SAIDI:
Power Quality Measurements
For power measurements, a 3169-21 Clamp-On Power HiTester (Hioki, Nagano, Japan) was installed on three-phase main distribution panels at office buildings in urban areas of the three locations. The Hioki device measured many power quality parameters, including the voltage level, with a recording interval of 1 min. The accuracy of the voltage level measurement is ±2%.
In Pekanbaru, measurements were performed for 15 days at the office building of the Faculty of Science and Technology of UIN Suska Riau University. In Kupang and Jayapura, the local Bureau of Meteorology offices hosted the measurements for five and seven days, respectively. Measurements in Kupang covered workdays only, while in Pekanbaru and Jayapura both weekdays and weekends were included. During measurements, each office ran with their usual routine from 7:30 a.m. to 4:30 p.m. After working hours, only some lamps and measurement equipment were in operation. Figure 2 shows the measuring instruments used and the connection points.
4. Results
4.1. SAIDI and SAIFI
Table 2 and Figure 3 show the SAIDI and SAIFI at various locations in Indonesia based on averaged historical data from 2010 to 2015 in the Statistic PLN [2,48,49,50,51,52]. Regarding SAIDI, as shown in Table 2, each customer in Riau experienced 11.8 h of outage per year or around 59 min per month. In Papua and ENT, each customer experienced shorter outage durations of 38 and 17 min/month, respectively, during the same period. Regarding the SAIFI, customers in Riau and Papua experienced outages more often (7.9 events per year) compared to those in ENT (6.1 events per year).
Using the below SAIDI and SAIFI values, it can be concluded that among the three provinces, Riau has the worst reliability of electricity supply, followed by Papua in the middle with customers in ENT having the highest reliability level. This contradicts the initial assumption by the authors, as shown in Table 1, that Riau would have the best reliability of power supply among the three provinces. Also, it is somewhat surprising that the reported SAIDI for Papua in 2015 was only 1.4 h per year, which contradicts the narratives of end-users. Therefore, we conclude that these official figures could be questionable.
For further illustration, in Figure 3, the SAIDI and SAIFI are shown in small graphs for the eight regions of Sumatra, WNT, Kalimantan, Sulawesi and Maluku, Java and Bali, ENT, Papua, and the “Riau and Riau Islands”. As shown, from 2010 to 2015, the SAIDI slightly decreased in Sumatra and Kalimantan, whereas in Papua, they decreased rapidly. Conversely, the SAIDI in Java and Bali as well as for the whole of Indonesia only changed slightly during this period, whereas in Sulawesi and Maluku a significant increase of SAIDI took place in 2015. It can be concluded that outside the islands of Java and Bali, the SAIDI and SAIFI can vary strongly depending on the location and the year of reporting because in Indonesia the majority of the power production capacity is located on Java and Bali (see Section 2.1).
4.2. Household Experiences
For the user survey, 300 questionnaires were distributed in the cities of Pekanbaru (Riau Province), Kupang (ENT Province), and Jayapura (Papua Province) with an average response rate of 68%. The target households were selected randomly, but the respondents were required to be household members who are responsible for the electricity service at home, such as contracting and payment. In Pekanbaru, 114 questionnaires were filled out in 19 days, in Kupang 65 questionnaires in 6 days, and in Jayapura 26 questionnaires in 8 days.
The statistics of the respondents could be improved by increasing the quantity and having a more equal distribution over the three cities and other demographic variables to minimize bias. However, at the remote location of Jayapura, it was challenging to involve end-users due to transportation constraints and low population density. Since the number of respondents in Jayapura is significantly lower than those in Pekanbaru and Kupang, information from Jayapura appears to be less significant in this study, although it remains valuable as complementary information. Thus, the results of the user study for Jayapura are presented differently and shown in italic fonts in the tables and with slightly transparent color in the figures.
The demographics of the respondents are outlined in Appendix A (Table A1), and the distribution of respondents by city address is shown in Figure 4. Most of the respondents in Pekanbaru and Jayapura were upper-middle-income households, but in Kupang, they originated from lower-middle income groups. A significant number of high-income households also participated in Pekanbaru (respondents are classified into four groups of income based on the World Bank criteria (2016); for 2016, low-income economies are defined as those with gross national income (GNI) per capita of $85 or less in 2015, lower middle-income between $86 and $335, upper middle-income between $336 and $1040, and high-income economies are those with a GNI per capita of > $1040 or more).
Also, in the three cities, most respondents (54% to 63%) were aged 30 to 49 years followed by the age group of 50 to 64 years. In Jayapura, a significant number of younger respondents with an age of 18 to 29 years participated. Regarding the level of education, most of the respondents were well-educated, which means they attended high school or higher education. However, in Jayapura, 85% of respondents were postgraduate degree holders because the questionnaires were delivered at a university. Finally, the respondents were classified as citizens living in urban-core or sub-urban areas. Urban cores are the most densely populated areas in a city with average population densities of 1000 persons/km2, while suburban areas are those with 60% lower population density or less. In Kupang and Jayapura, most respondents live in suburban areas (55% in Kupang and 77% in Jayapura), whereas in Pekanbaru, 47% of participants live in suburban areas.
4.2.1. The Perceived Importance of Reliable Electricity Supply and Stable Voltage
The first set of questions on the survey considered the importance of reliable electricity supply to the respondents. They expressed the importance of reliable electricity supply by their WTP a higher electricity bill to obtain better electricity service and by ownership of a backup generator at home.
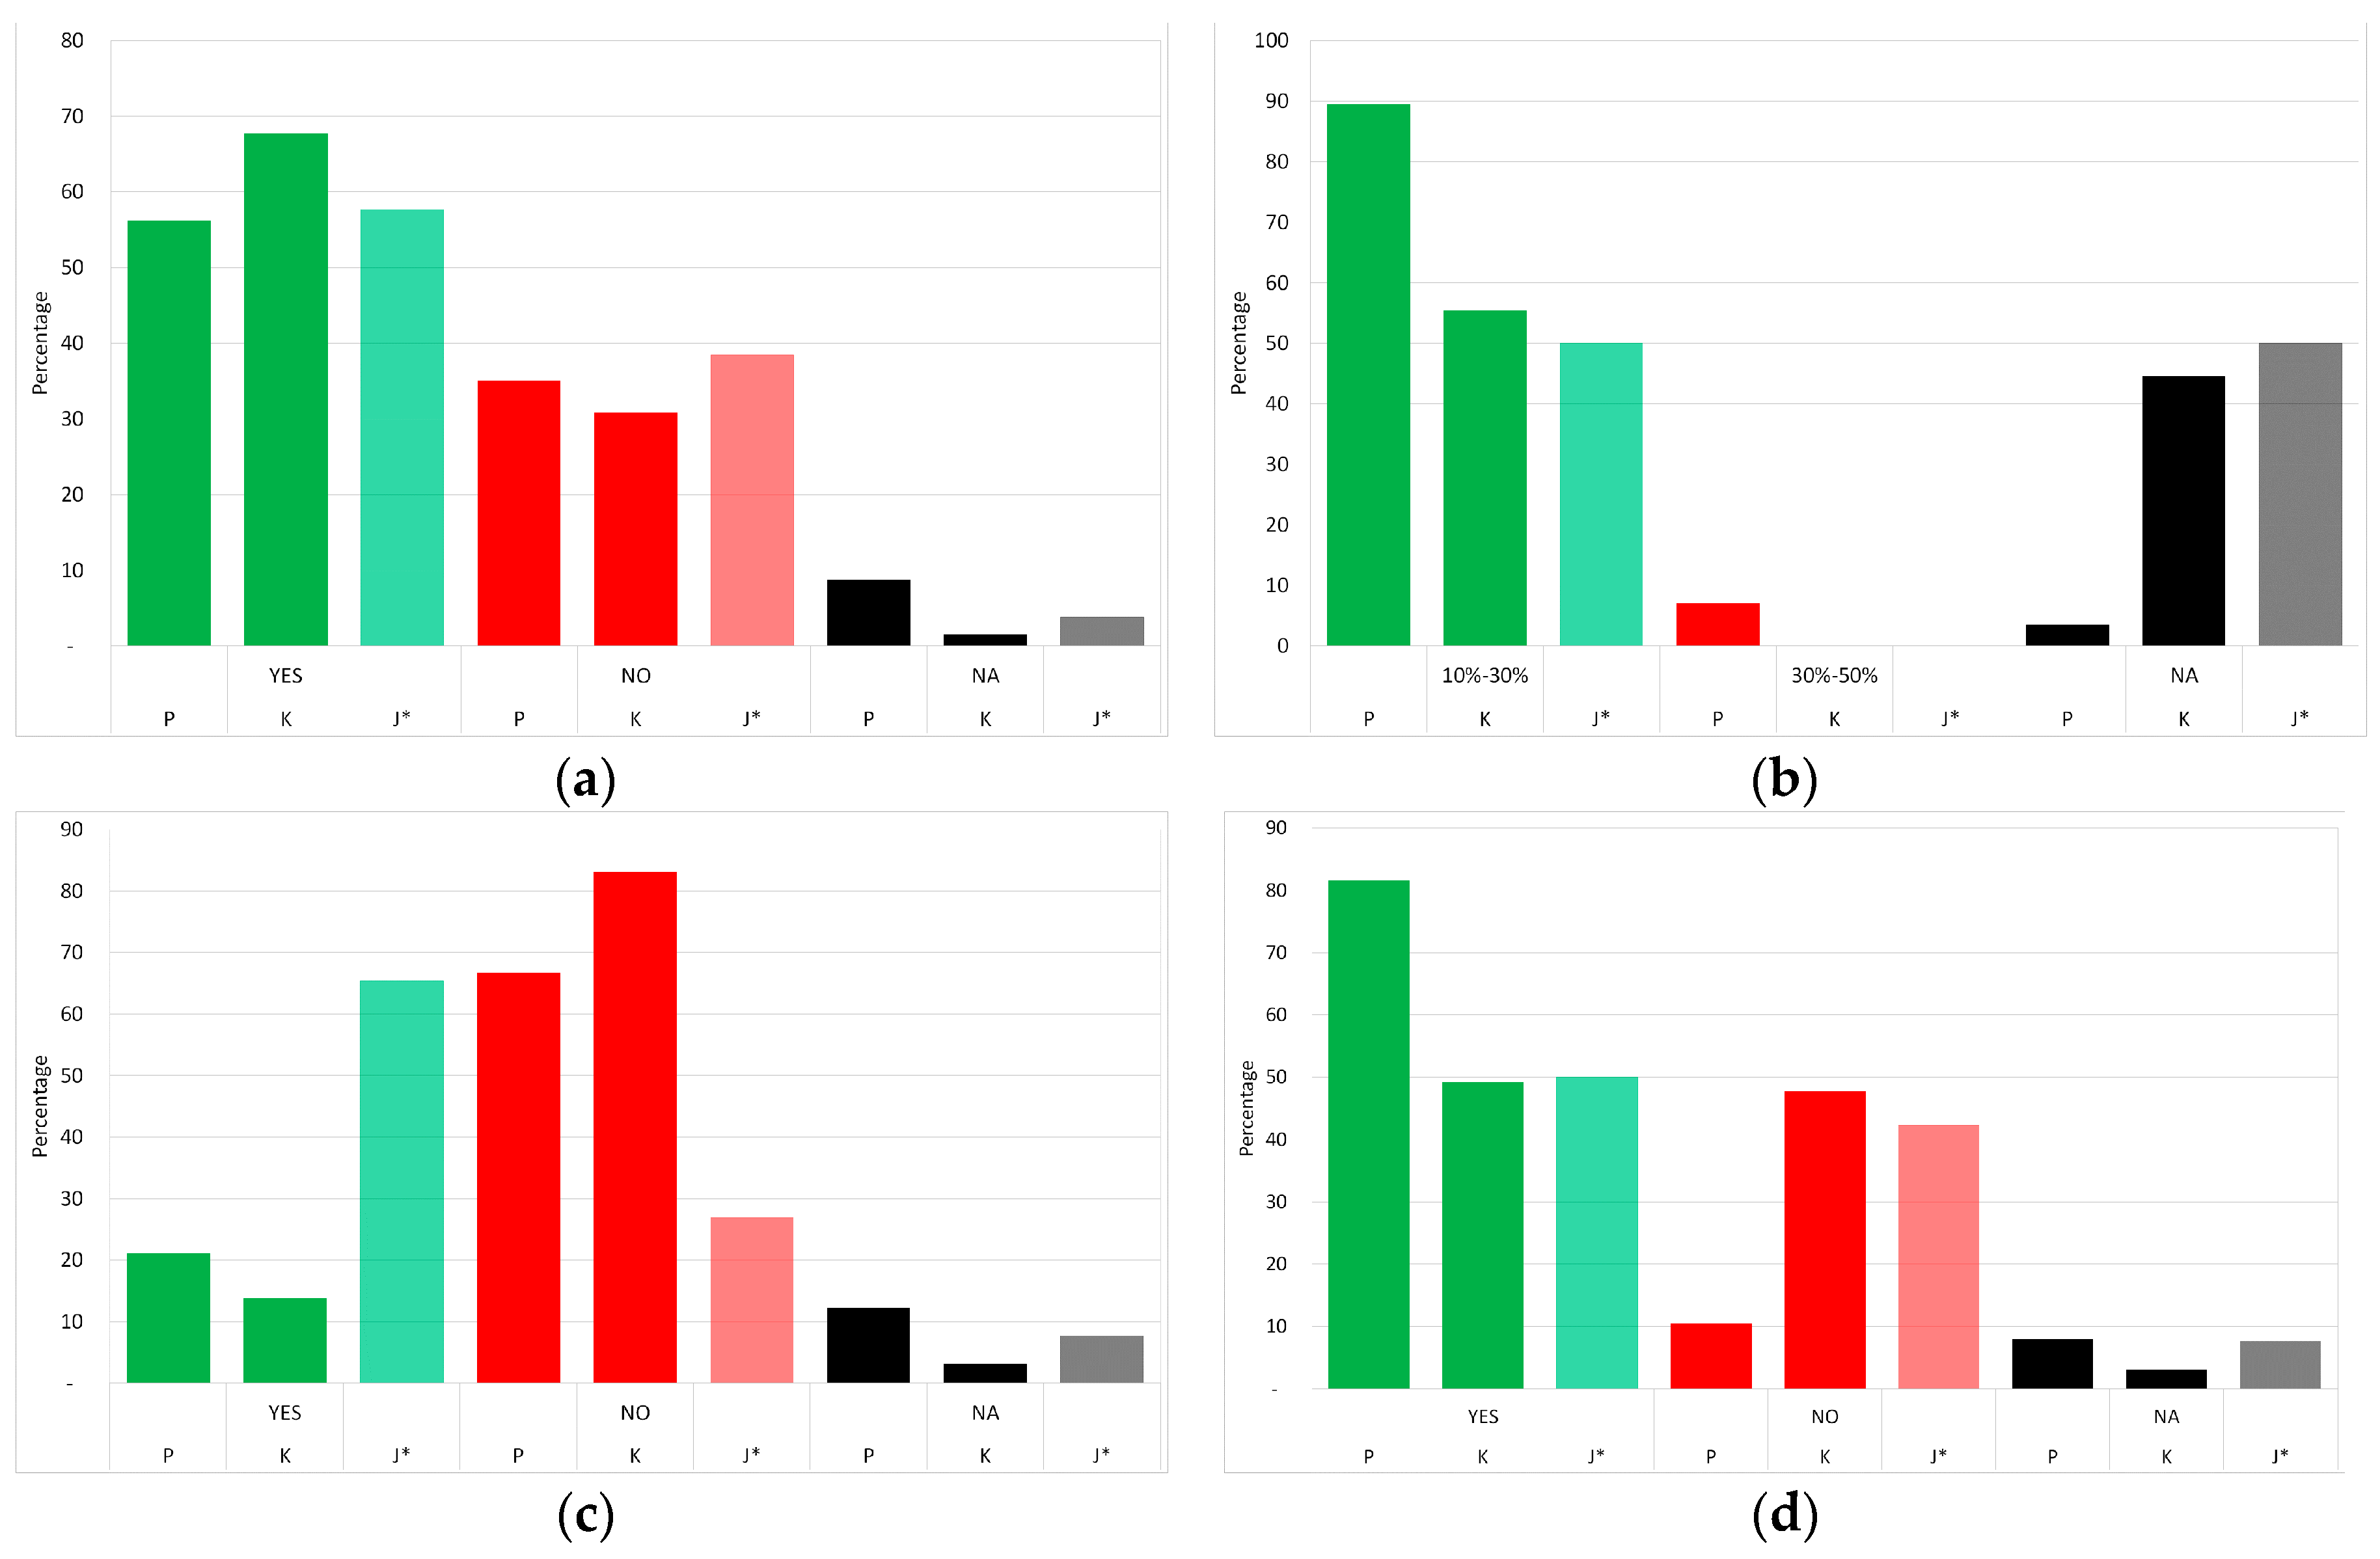
It was shown by the results of the survey that most of the respondents recognize that electricity is an important good for them. Because the continuity of delivery of electricity is vital to them, respondents are willing to pay more for better electricity services or to buy and operate gensets. This is represented by more than half of respondents being willing to pay a higher electricity bill for better electricity services with 68% in Kupang and 56% in Pekanbaru (Figure 5a and Appendix C (Table A2)).
To avoid the cost of outages, households in Pekanbaru and Kupang are willing to bear a 10% to 30% increase in their monthly electricity bill (Figure 5b). Based on the data from PLN PWP, the average electricity expenditure of households in the urban-core of Jayapura is IDR 350,000 (≈$27) per month. Using this value and assuming a similar monthly cost of electricity for households in Pekanbaru and Kupang, it can be estimated that households are willing to pay $3 to $8 extra (above their average monthly expenditure) per month or $1c to $3c per kWh for improved reliability of their electricity supply. Regarding the possession of a backup generator at home, the majority of respondents in Pekanbaru and Kupang do not have gensets, but in Jayapura, 65% of respondents do (Figure 5c). However, 21% of respondents in Pekanbaru have gensets with only 14% in Kupang. Regarding the voltage stability experienced, the survey results show that 82% of households in Pekanbaru experience stable electrical voltage in their homes compared to 49% in Kupang (Figure 5d). This is based on visual observations by the users in the form of a decrease in the brightness of lamps or sudden changes of the television screen’s light output. Indeed, changes in appliance behaviors could also be caused by problems with the appliances themselves or due to human errors. Therefore, visual observation takes only the temporary and repeated changes in appliance behaviors into account.
4.2.2. Blackout Events
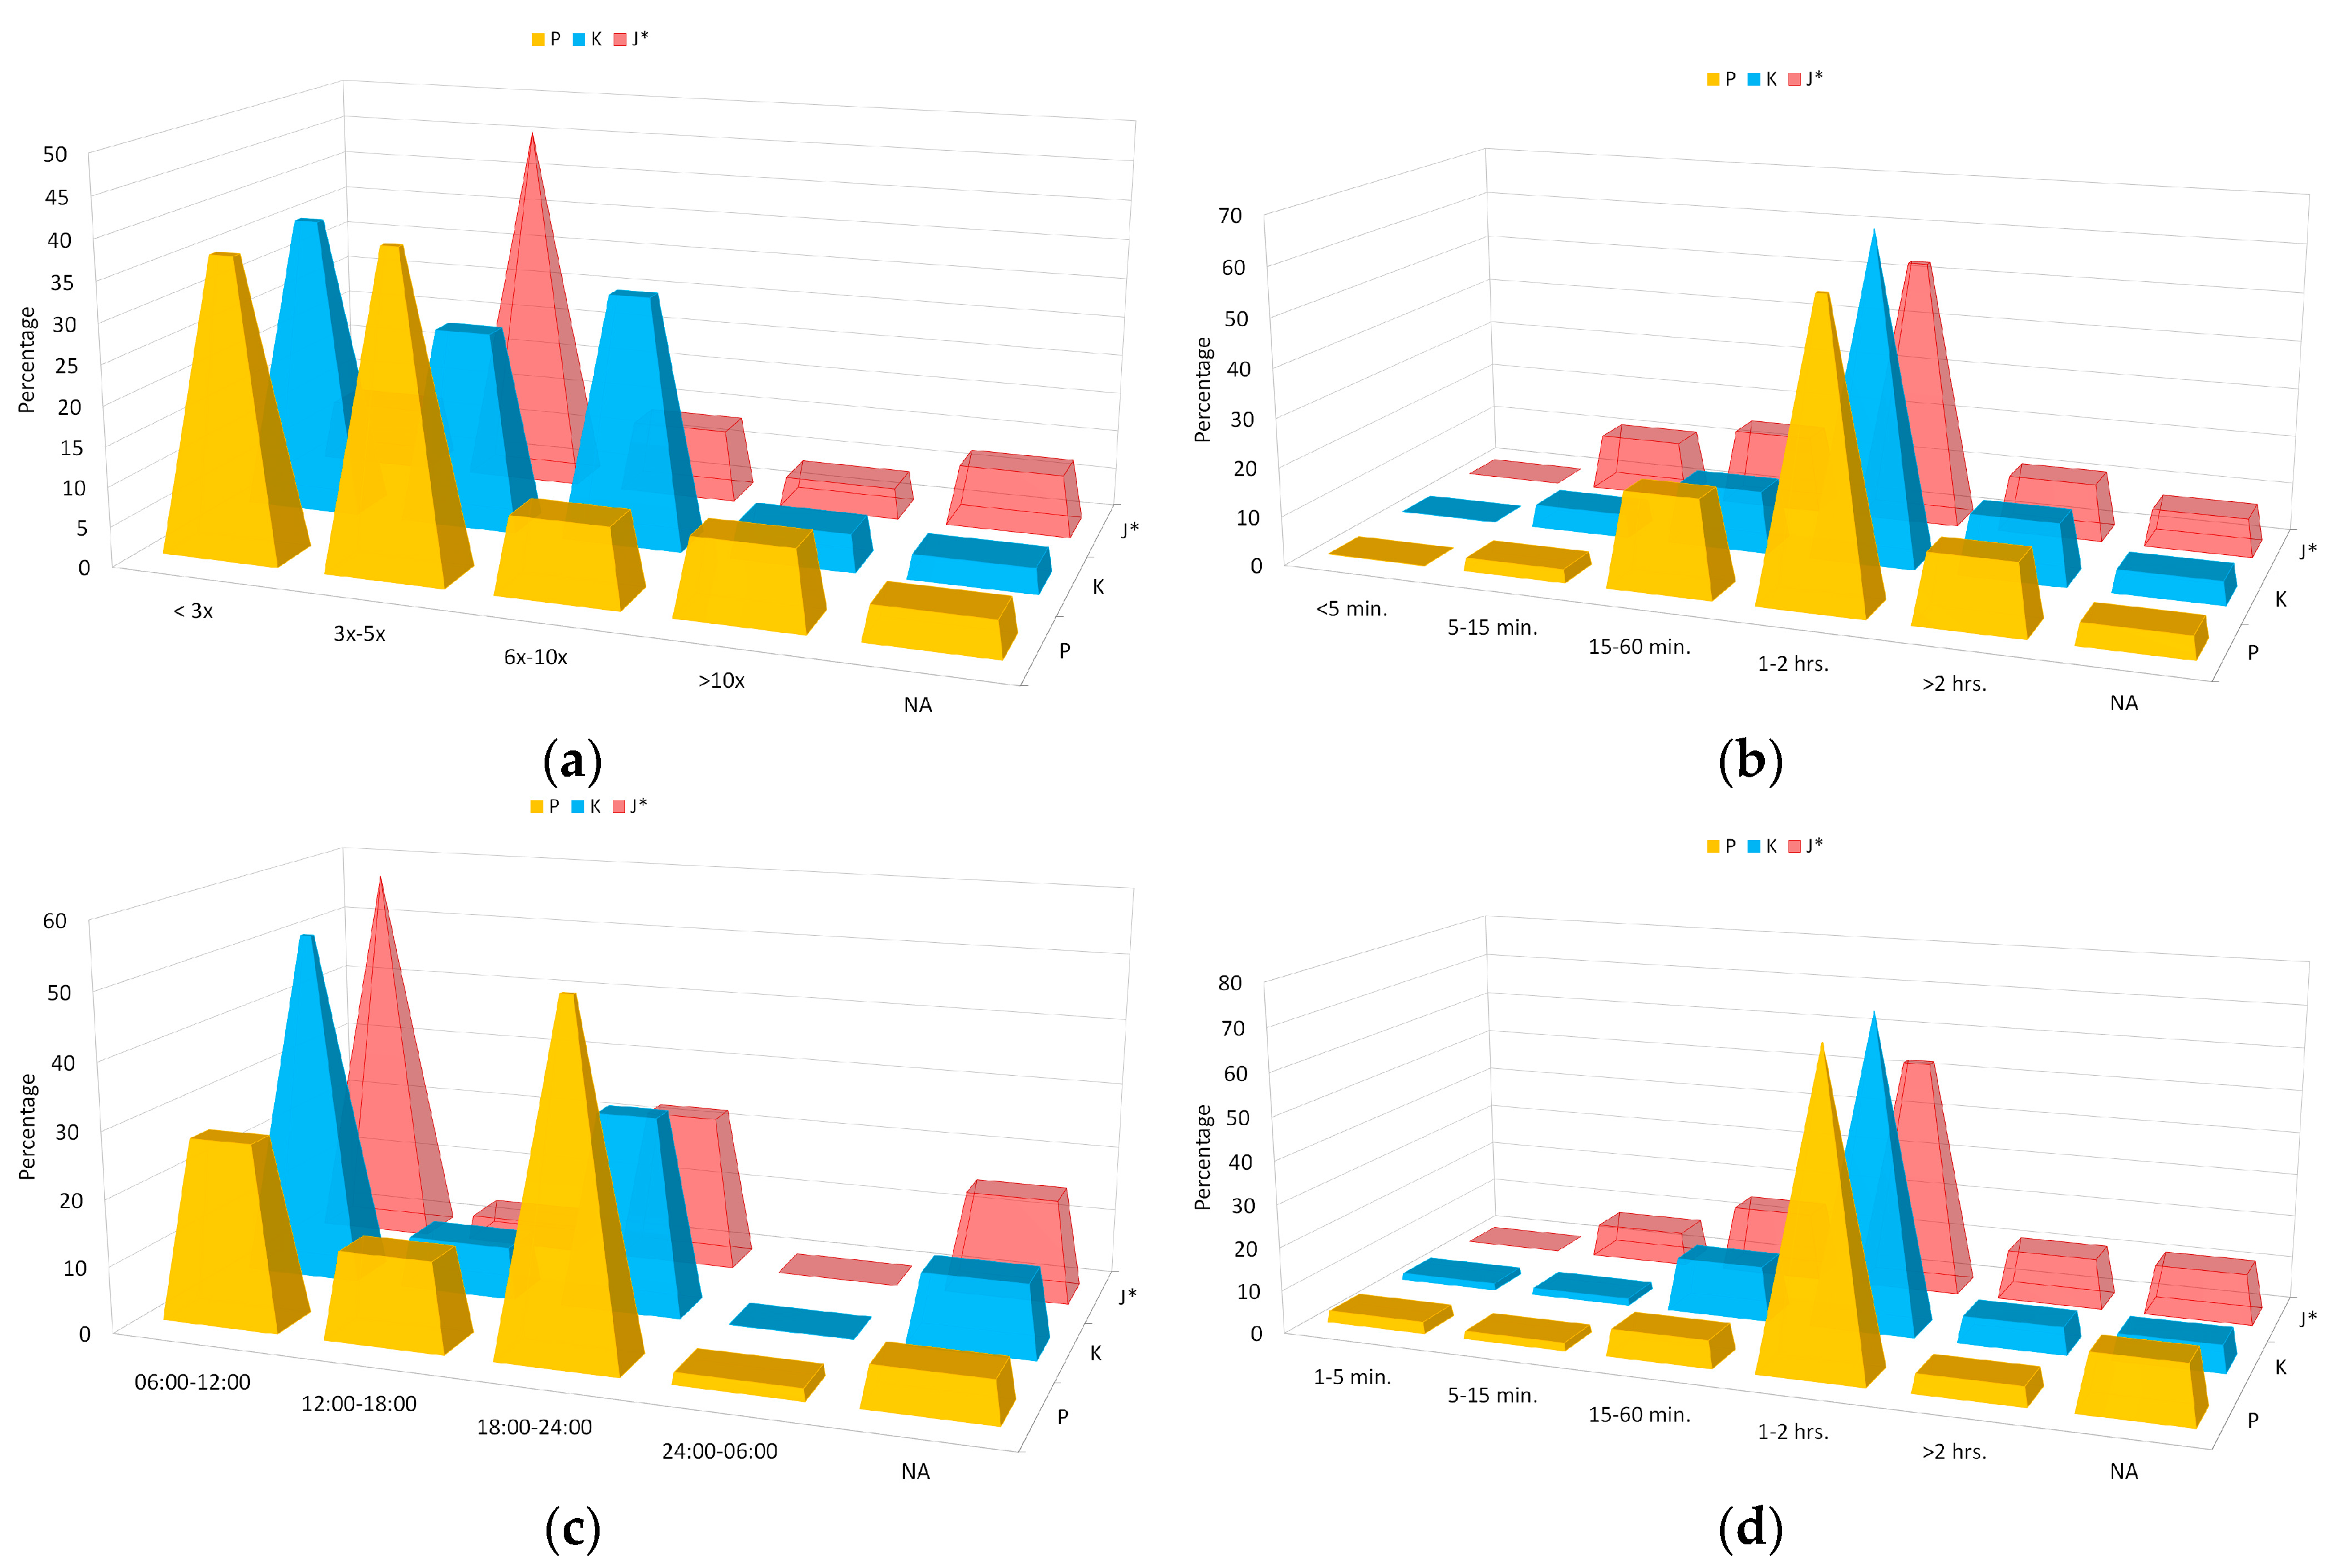
The final set of questions focuses on the respondents’ experiences with blackout events at home. As shown in Figure 6a, most respondents in Pekanbaru and Kupang experience three to five blackouts or less per month. However, in Kupang, 31% of the respondents experience six to ten blackouts per month.
Only two households of all the respondents in the three cities stated that they never encountered any outage. The average duration of each blackout event typically is one to two hours for more than half of the respondents in each city (Figure 6b). Around 12% to 15% of respondents experienced an outage with a duration of more than two hours each. None of the respondents experienced a blackout less than five minutes.
If a blackout reaches one hour in length, it begins to incur losses for most of the respondents (Figure 6d). The timing of interruptions that could incur losses for users are those occurring between 6 a.m. to 12 p.m., and 6 p.m. to 12 a.m. Within these periods, electricity is highly required for work, business, and domestic activities.
4.2.3. P-SAIFI and P-SAIDI
To compare the officially reported SAIDI and SAIFI as presented in Section 4.1 with the user experiences, two new indices of the reliability of power supply, P-SAIDI and P-SAIFI, are defined as described in Section 3.2.2. The calculations of the P-SAIDI and the P-SAIFI are based on the results of the user survey (Appendix C (Table A2)).
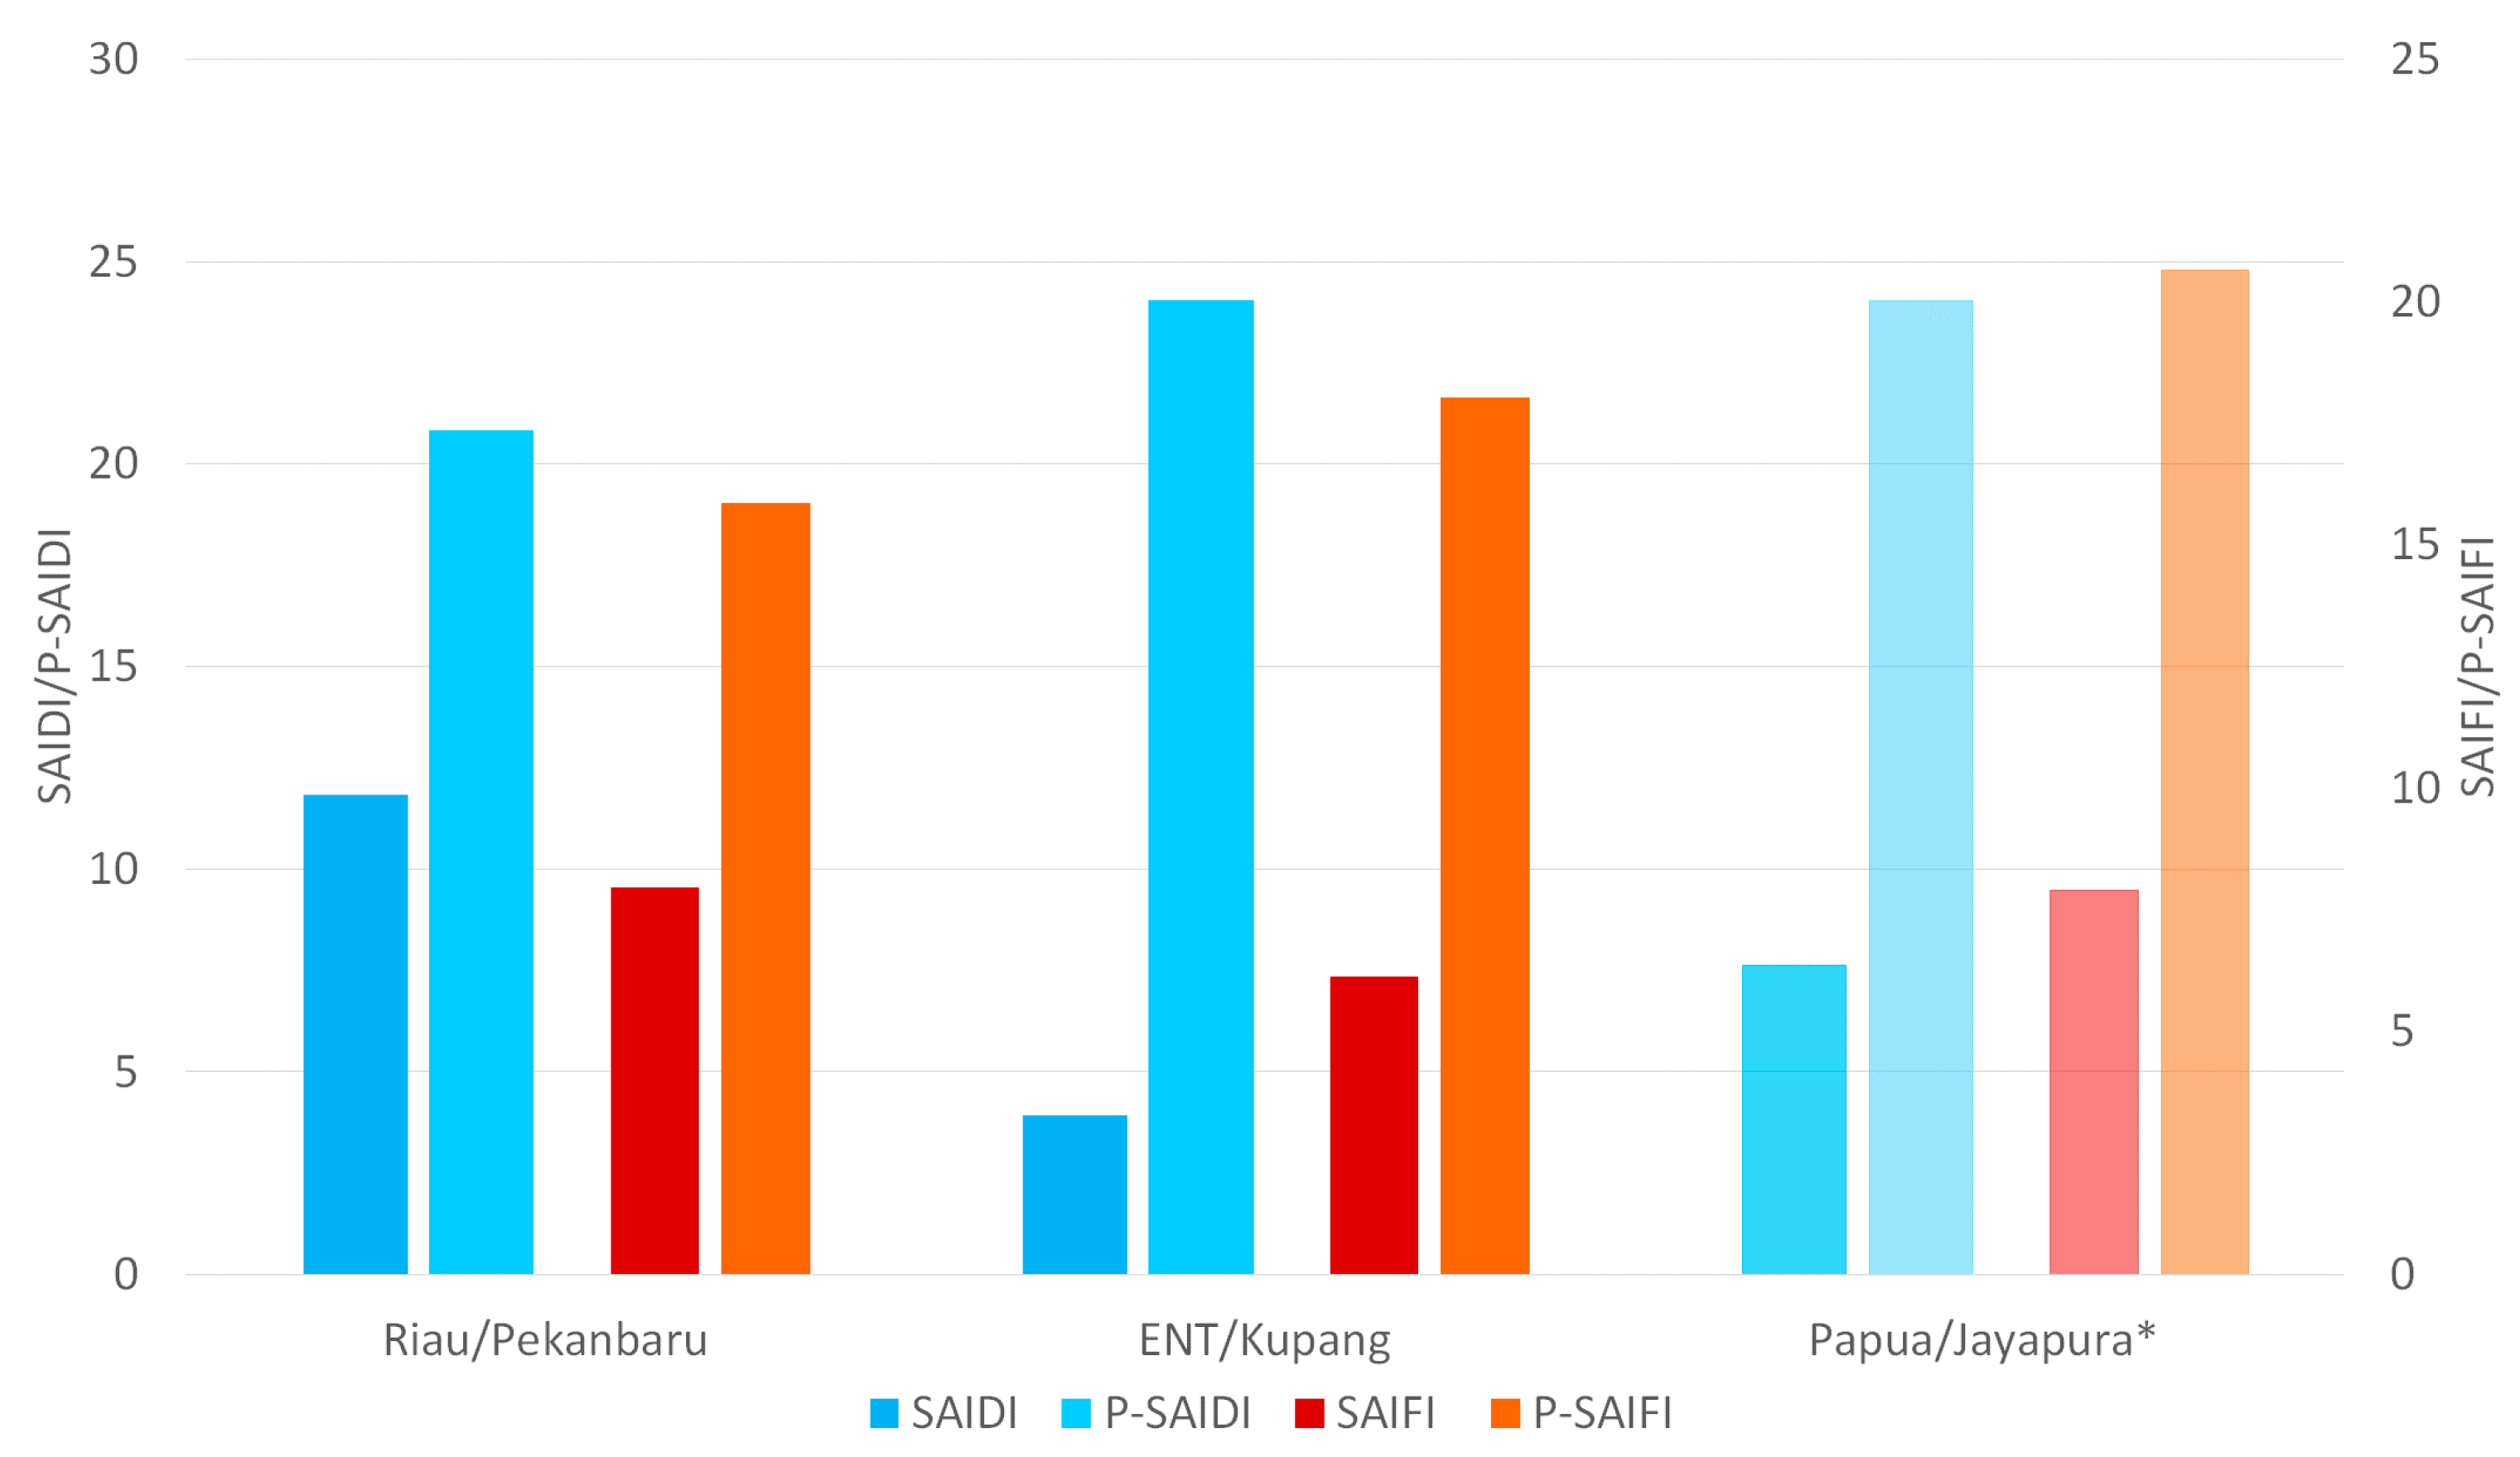
Figure 7 and Table 3 summarize the results of the P-SAIDI and P-SAIFI calculations. In Table 3, standard deviations are provided to the right of the estimated P-SAIDI and P-SAIFI. P-SAIDI in Pekanbaru and Kupang is 21 and 24 h/customer per year, respectively. Compared to SAIDI values from PLN for the respective provinces, the P-SAIDI in Pekanbaru and Kupang is 2.6-fold and 3.9-fold higher than PLN’s SAIDIs. Also, P-SAIFI in Pekanbaru and Kupang are 16 and 18 outage events/customer per year, respectively. This corresponds to 1.3-times and 4.6-times higher than the PLN SAIFI for the respective provinces. Because statistical extrapolation was used to find the P-SAIDI and the P-SAIFI, the s of P-SAIDI is 33 h/customer per year in Pekanbaru and 33 h/customer per year in Kupang. The s for P-SAIFI in Pekanbaru is three interruptions/customer per year and 3.1 interruptions/customer per year in Kupang.
4.3. Results from Measurements at the Distribution Grid
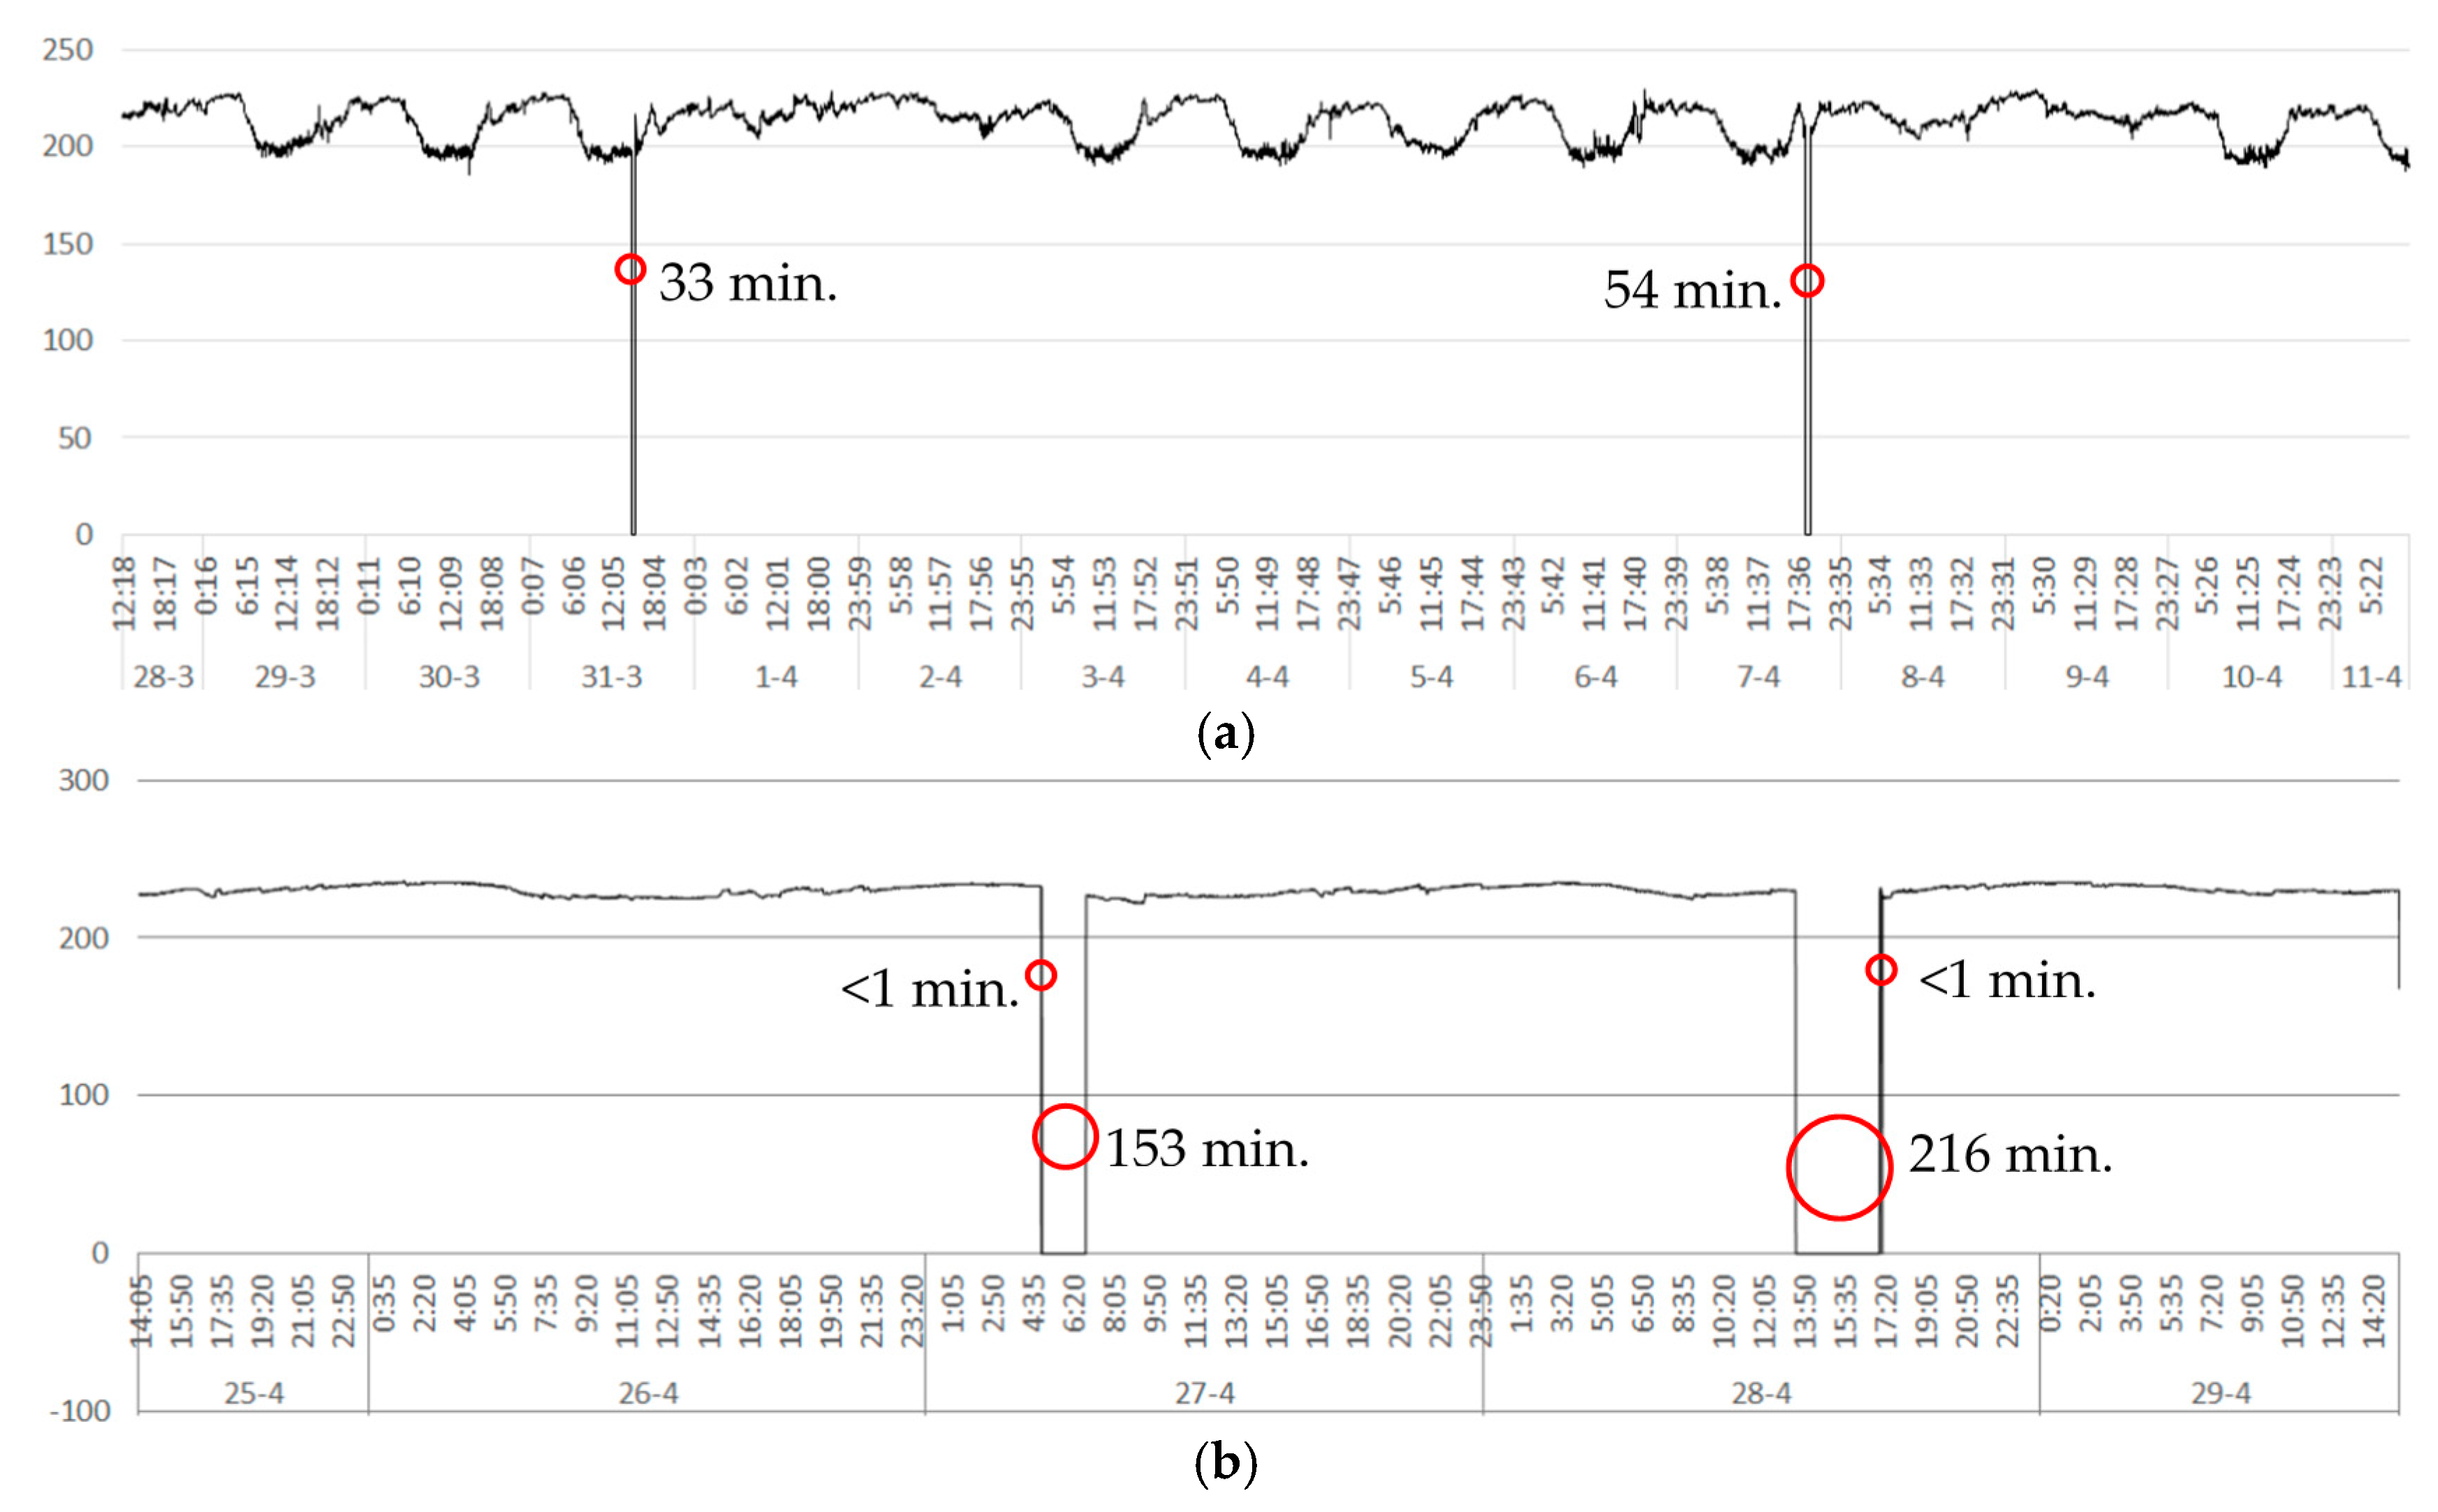
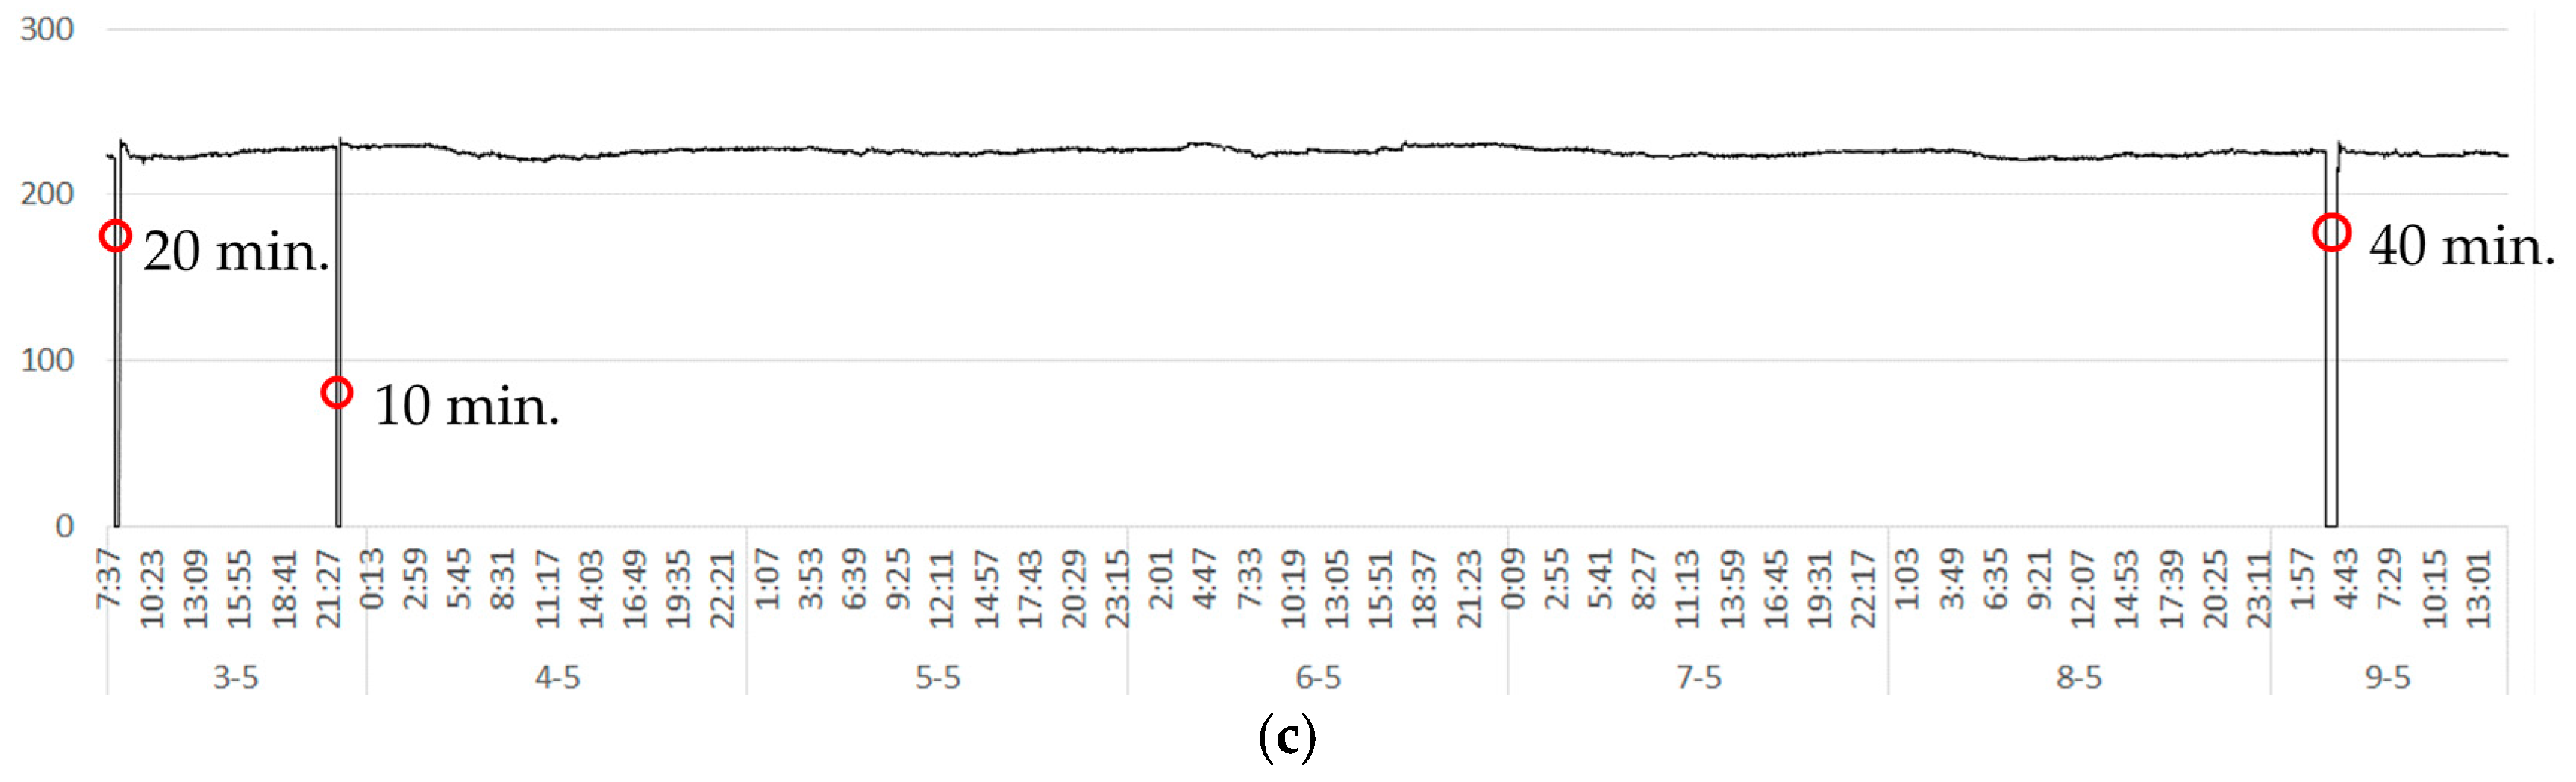
As described in Section 3.2.2, the voltage at the distribution grid was recorded at 1 min intervals for 15 days in Pekanbaru, 5 days in Kupang, and 7 days in Jayapura. Figure 8 shows the time series of voltage measurements at the three locations. As shown, based on the Ministry of Energy and Mineral Resources guideline [57], the average nominal voltage is 220 V, the highest allowable voltage limit is 242 V, and the lowest allowable limit is 198 V. the voltage level at the measurement point in Pekanbaru tends to be lower than the average nominal voltage (Figure 8a). During 15 days of measurement in Pekanbaru, there were 10 days when the voltage dropped below the lowest allowable voltage limit. Unlike in Pekanbaru, during the 5-day and 7-day measurement in Kupang (Figure 8b) and Jayapura (Figure 8c), voltages were always within the allowable limits, although they tended to be higher than the nominal voltage, except for two days where the voltage in Jayapura was lower than the average nominal voltage. Figure 9 presents blackout events in the three locations at which power was measured at the distribution grid. Several blackout events with different durations occurred in each city during the relatively short measurement period.
It is shown in Figure 9a that two blackouts were recorded in Pekanbaru during the 15 days of measurement. Outage events in Pekanbaru lasted 33 min or longer. Further, in Kupang (Figure 8b), within a shorter period of measurement of 5 days, two blackout events were observed. Outage events in Kupang lasted longer than those in Pekanbaru (more than 153 min). Also, in Jayapura, three blackouts were captured within 7 days of measurement, ranging from 10 to 40 min. By combining the daily-averaged outage durations from measurements in the three cities, it can be concluded that the outage duration in Kupang was worst, with 74.2 min of outage per day on average, whereas in Jayapura only 10 min of outage per day was measured and only 5.8 min per day in Pekanbaru. It must be said here that these outage duration values are very high compared to many other places in the world and Indonesia. Also, it is useful that the findings from Figure 9 were confirmed by the results of the user survey (see Section 4.2.3).
5. Discussion and Conclusions
This paper explores end-user experiences regarding the reliability of electricity supply in their homes and compares the reliability indices reported by the national utility company for the cities of Pekanbaru in the Province of Riau, Kupang in the Province of ENT, and Jayapura in the Province of Papua, Indonesia. The research was conducted using a desk study and a user survey.
5.1. Desk Study, User Study, and Grid Measurements
The results of the desk study can be seen in Section 4.1, which reviews SAIDI, SAIFI, and ER. Using a regression analysis, it was shown that there is a significant positive relationship between SAIDI and SAIFI, r(5) = 0.85, p < 0.0015 (Figure 10) (the “r” is the correlation coefficient of two variables for which values range from −1.0 to +1.0; the closer r is to +1.0 or −1.0, the closer the two variables are related; there is no evidence of correlation if r is close to 0. A positive linear correlation exists if r is positive, and a negative linear correlation exists if r is negative. The “p” value is used to check whether the calculated “r” is significant. If the p < 0.05, then the result is statistically significant, and if p > 0.05, then the result is nonsignificant). However, SAIDI and ER and SAIFI and ER show less significant negative correlations, respectively, with r(5) = −0.1, p < 0.8 and r(5) = −0.3, p < 0.5. Therefore, the ER values of a province cannot be used as an indicator of the level of reliability of the power supply.
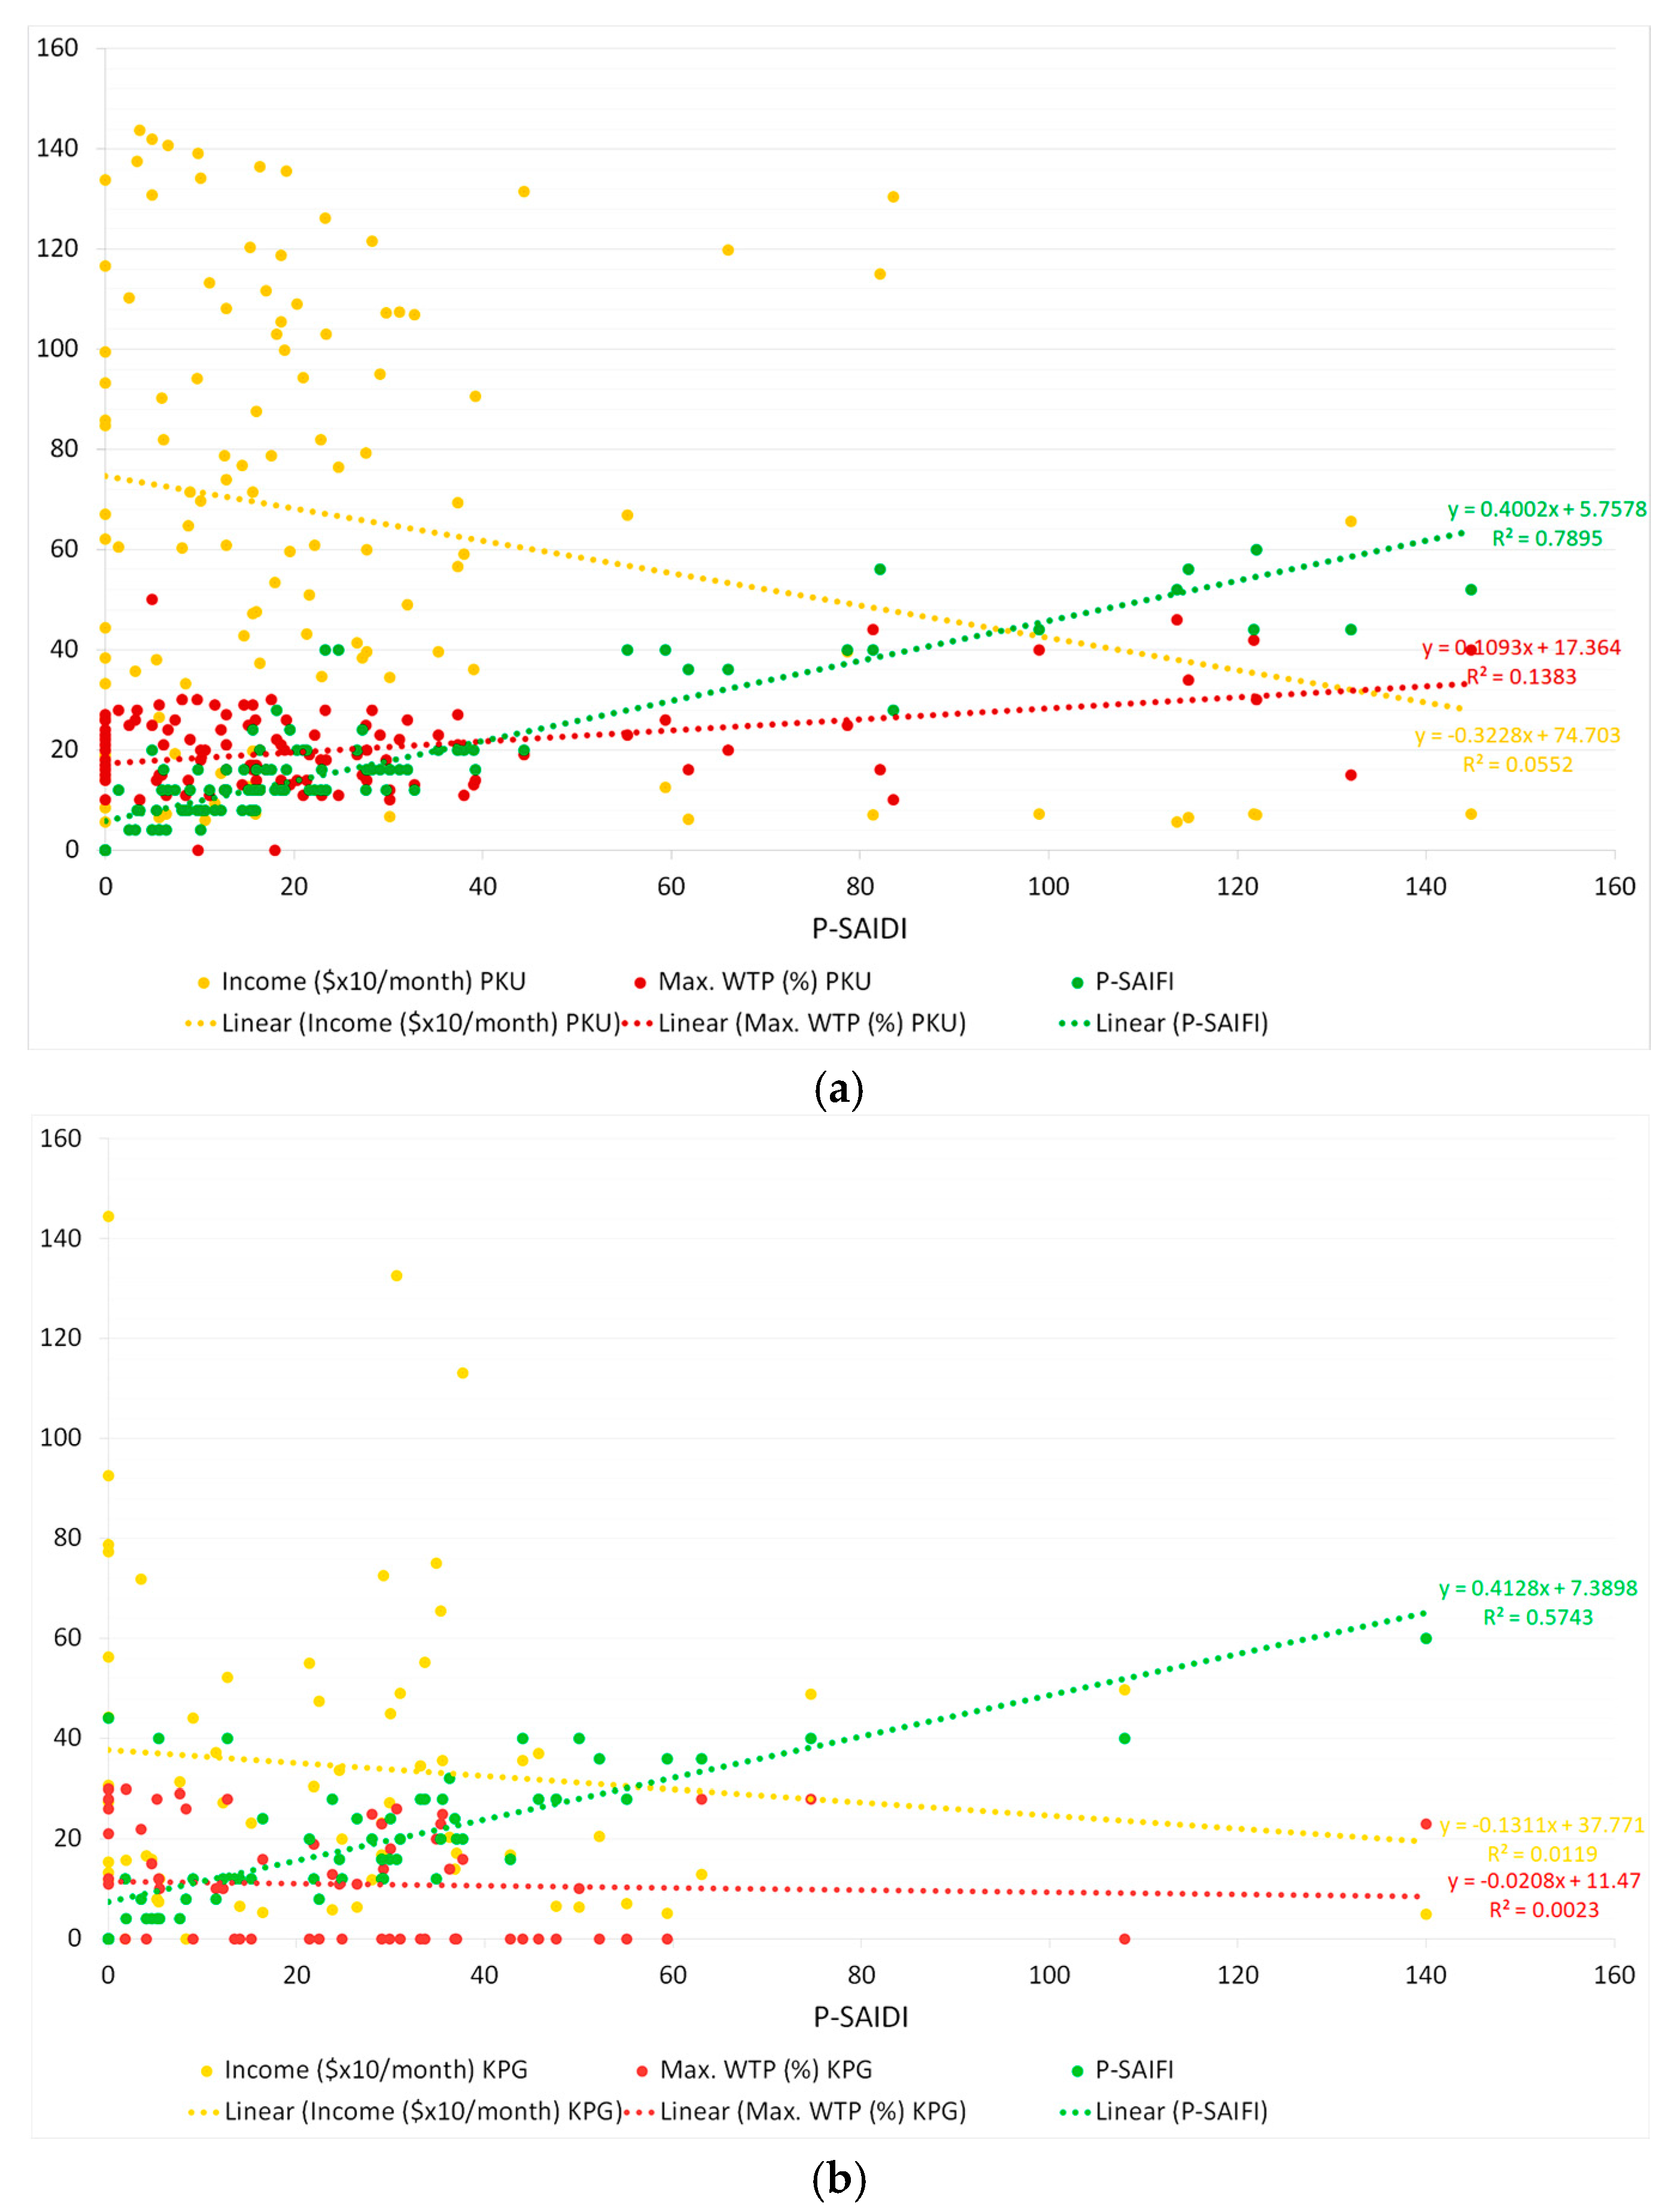
In Section 4.2, the results from the user study were presented with a comparison of the reported and perceived SAIDI and SAIFI. Also presented are the WTP, households’ incomes, and genset possession. The results from the user study show there are significant gaps between the official and perceived reliability indices. The implication of these gaps is clear: the reported reliability indices do not always demonstrate the experience of the grid users. It is obvious that both reliability indices, those reported by PLN and those introduced in this study, have advantages and drawbacks. On the one hand, the PLN SAIFI and SAIDI data are likely generated based on careful documentation of actual outages, which could offer more reliable information. However, because they are based on large provincial areas ranging from 664 km2 to 154,000 km2, they do not distinguish between urban and rural areas. On the other hand, the perceived reliability indices introduced in this study are based at the city level with smaller resolution areas of 180 km2 to 936 km2, which could result in better accuracy. However, our indices are based on the user’s perspective, which could be biased, but it can be enhanced using a correction factor as presented above. Further, it is interesting to observe the relations between different variables, such as P-SAIDI, P-SAIFI, households’ income, and WTP (Figure 11). Relations are shown in the scatter graphs (Figure 11), which were generated using the “randbetween” function in Microsoft Excel based on ranges of corresponding data originated from the questionnaires (because the monthly incomes of some respondents can reach above $1500, whereas the values of other variables are much lower, the household incomes in Figure 11 are shown in multiples of 10 to allow for the same scaling on other variables.). This approach was also used by DeCaria et al. [58], Sterbova et al. [59], and Stout and Tawney [60]. As shown, there are strong positive correlations between P-SAIDI and P-SAIFI in Pekanbaru and Kupang with the R2 values of 0.8 and 0.6, respectively, as is also valid for the correlation between the reported SAIDI and SAIFI (Figure 10).
As shown in Figure 11, P-SAIDI have weak negative correlations to household income in Pekanbaru and Kupang, with R2 values of −0.06 and −0.01, respectively. Our analysis found that high-middle income and high-income households experience a slightly higher P-SAIDI than those from low-middle and low-income households. In Kupang, higher P-SAIDI are experienced by low-income households, which are followed by high-middle income households, but low-middle income and high-income households experience fewer outages than the other income groups.
Weak positive correlation can be found between P-SAIDI and WTP in Pekanbaru with the R2 value of 0.14. However, in Kupang, a weaker correlation between the two variables exists with the R2 value of −0.002. This finding is somewhat similar to the results of a study by Sagebiel and Rommel (2014) in India [30]. An interesting finding of our analysis shows that in Pekanbaru and Kupang more low-medium income households are willing to pay extra for improved power reliability, although this income group experiences fewer outages. The WTP among high-income households is rather low. Even in Kupang, the low-income households have higher WTP than high-income households. This is because high-income households often own gensets, which incur an extra cost of operation and maintenance, and this makes them rather reluctant to spend even more for improved electricity service. The increase in the monthly electricity bill for improved electricity service in the cities in Indonesia of 10% to 30% is somewhat higher than those in other countries. However, the values in dollars, a $3 to $8 increase for a comparable outage duration, can also be found in other countries, such as Cyprus [25] and Sweden [61]. Therefore, it can be concluded that the WTP is a factor of the outage duration [61] as well as the factor of genset ownership. The latter is due to the assumption among respondents that “improved reliability” does not imply a complete escape from outages, which means an expenditure for gensets and other costs may still be needed. This conclusion agrees with Murphy et al. [6] that users demanding more reliable electricity can expect an increased, and “justifiable”, cost of energy. This is because to achieve the desired level of reliability, additional costs to add other equipment to the existing systems is needed. However, financial incentives, which are usually provided for renewable electricity, could help customers deal with additional costs to achieve a reliable electricity supply [62].
5.2. Methods
The use of P-SAIDI and P-SAIFI indicators is relevant because it evaluates smaller areas of cities with known distribution network configurations. Measurements in the distribution grids verified the results from the user surveys. Because of the use of radial configurations in the local distribution networks, low reliability can be expected. Radial configuration offers a simple topology and is cost-effective, but has lower reliability [63]. The local nature of this study, therefore, could represent the situation in a larger area because depending on the point where an interruption occurs in the radial network, it could affect a larger area along the network lines. However, a more detailed study concerning factors that contribute to the low reliability of the distribution networks in the Indonesia supply would be valuable.
The method applied in calculating SAIDI and SAIFI and the approach to estimate P-SAIDI and P-SAIFI are relatively similar. SAIDI and SAIFI are calculated by dividing the total minutes of outages and the total frequency of outages, respectively, in the study area by the number of customers served by the grid (see Equations (1) and (2)). The final results of the calculations are outage duration per customer per year, for SAIDI, and outage frequency per customer per year, for SAIFI. Therefore, it is not surprising that the unit of SAIDI is same as the unit of P-SAIDI, as also applies to the units of SAIFI and P-SAIFI. The main difference between the two types of indices is the source of data input for the calculations. The SAIDI and SAIFI calculations use data collected by the utility, whereas the calculations of P-SAIDI and P-SAIFI are based on the end-user experiences.
5.3. Limitations of the Study
Like all studies involving field research, our research also includes limitations due to the availability of time and person-hours for the execution of the research at three locations geographically located far from each other. This situation and a few other factors that could affect our results are explained as follows:
- 1)
- While the values for SAIDI and SAIFI are provincial values, our study occurred at specific locations, namely in the capital cities of the three provinces. However, it is still surprising that the officially reported values of reliability indices are lower than those recorded by measurements on the grid and reported by end-users. In fact, higher values can be expected for the officially reported SAIDI and SAIFI because they cover the whole province, which contains urban areas, with a relatively high-quality supply of electricity, and rural areas, which tend to have a lower power quality. It would, therefore, be valuable to expand this study to other locations in these provinces and other provinces to produce more evidence. This study offers a good start, which might be continued by other researchers.
- 2)
- The 26 respondents in Jayapura are not a representative sample for this study. Therefore, given the importance of the opinions from the end-users regarding the reliability of the electricity supply, the quantity of respondents in a future follow-up study should be increased to improve the statistics. Then, the statistic of respondents could also be more equally distributed over the three locations, levels of income, and other demographic variables to minimize any bias. Similarly, the duration of the measurements of the electricity grid could be increased.
- 3)
- In our study, an income-bias of the respondents was not accounted for. As a result, this study mostly represents high and upper-middle income classes.
However, apart from these potential points of improvement, this study is unique and fills a void in existing real-life data on experienced power quality, and it confirms our initial hypothesis that the reported indices of the reliability of the power supply from PLN are lower than the user experience. Using the Perceived- (P) SAIDI and P-SAIFI we introduced for the Provinces of Riau, ENT, and Papua, end-users experience more frequent and longer duration outages compared to the reported SAIDI and SAIFI. Users experience a larger number of outages and longer duration for each interruption than those that are reported by the authority. P-SAIFIs are 4-fold to 14-fold higher than the PLN’s SAIFIs. Also, P-SAIDIs are 8-times to 12-times the PLN’s SAIDIs for the corresponding provinces. As far as we know, this is the first independent study in Indonesia to evaluate the user experiences on the reliability of the power supply by the distribution grid and how the user experiences compare to the reported data from the utility. It can be concluded that the reliability of the power supply in these three cities in Indonesia could be improved considerably.
Acknowledgments
We gratefully acknowledge the financial support provided for this project by the Indonesia Endowment Fund for Education (LPDP). Also, we highly appreciate the expert support provided by the Advanced Research on Innovations in Sustainability and Energy (ARISE) of the University of Twente (The Netherlands) and constructive comments by the editors and anonymous reviewers. Data were supported by PLN offices in Riau, ENT, and Papua. Measurements were accommodated by the Faculty of Science and Technology of UIN Suska Riau University in Pekanbaru and BMKG Offices in Kupang and Jayapura. Questionnaires were delivered with access to respondents arranged by students at the Department of Electrical Engineering at UIN Suska Riau University in Pekanbaru, Kumar Saputra and Ansel Mustalo in Kupang, and Jusuf Haurissa and Suyatno of the USTJ in in Jayapura.
Author Contributions
Kunaifi and Angèle Reinders conceived and designed the research problems and method. Kunaifi performed the field surveys, analyzed the data and wrote the paper. Angèle Reinders guided the writing process as well as reviewing the presented concepts and outcomes.
Conflicts of Interest
The authors declare no conflicts of interest.
Appendix A
Demographics of respondents who participated in the user study.

Table A1.
Demographics of respondents who participated in the user study.
| No. of Respondents | Pekanbaru | Kupang | Jayapura |
| 114 | 65 | 26 | |
| The Distribution of Respondents by City Address (%) | |||
| - Urban-core | 53 | 45 | 23 |
| - Sub-Urban | 47 | 55 | 77 |
| Monthly Income (%) | |||
| - High | 28 | 5 | 4 |
| - Upper-Middle | 43 | 28 | 50 |
| - Lower-Middle | 17 | 49 | 27 |
| - Low | 6 | 15 | 0 |
| - Not answer | 6 | 3 | 19 |
| Sex (%) | |||
| - Male | 49 | 51 | 42 |
| - Female | 51 | 49 | 58 |
| Age Groups (%) | |||
| - 18–29 | 11 | 5 | 31 |
| - 30–49 | 63 | 54 | 58 |
| - 50–64 | 23 | 35 | 12 |
| - 65+ | 4 | 6 | 0 |
| Education (%) | |||
| - No school | 0 | 2 | 0 |
| - Basic school | 8 | 14 | 0 |
| - High school | 50 | 42 | 0 |
| - Undergraduate | 30 | 38 | 8 |
| - Postgraduate | 5 | 3 | 85 |
| - No answer | 7 | 2 | 8 |
Appendix B
The survey sheet (English-translated).
A. General Information
Respondent Information
Income group : ET/EM/ES/ER (to be filled by the surveyor)
Sex : M/F (circle an answer)
Age : ______________ years
Occupation : _________________________________________________
Education : No formal school/Primary/Junior H./Senior H./Diploma/UG/M/PhD (circle an answer)
Marital status : Nor married/Married/Widow (circle an answer)
Ethnic group : __________________________________________________________________________________
Address : Village : _______________________, District : ___________________________________
Regency/City : _______________________, Province : ___________________________________
Confidentiality
Your personal information will be kept confidential and be treated based on standard practice. You can also mention below if there are other information you will provide that you would like to be confidential as well.
________________________________________________________________________________________________
________________________________________________________________________________________________
_____________________________________________________________________Signature___________________
B. Questions
Please circle (O) on the most proper answers.
- Would you accept an increase in your electricity bill for better electricity service?
- Yes
- No
- How much increase in your electricity bill would you find acceptable?
- 10%–30%
- 30%–50%
- 50%–70%
- Do you have a backup generator at home?
- Yes
- No
- Do you experience a stable electricity voltage at home?
- Yes
- No
- Have you ever experienced a blackout at home?
- Yes
- No
- On average, how often in a month do you experience blackouts?
- less than 3 x
- 3–5 x
- 6–10 x
- more than 10 x
- On average, how long is the duration of the blackouts you experience?
- <5 min
- 5–15 min
- 15–60 min
- >120 min
- At what time of day would a blackout event incur the most losses for you?
- 6 a.m.–12 a.m.
- 12 a.m.–6 p.m.
- 6 p.m.–12 p.m.
- 12 p.m.–6 a.m.
- On average, what is the duration of a blackout that would incur economic losses for you?
- less than 5 min
- 5–15 min
- 15–60 min
- more than 120 min
Appendix C
The proportion of respondents’ answers to survey questions, in percentages.
Table A2.
The proportion of respondents’ answers to survey questions, in percentages.
| Question 1 | Would you accept an increase in your electricity bill for better electricity service? | |||||||||||||||||
| Answer | Yes | No | NA | |||||||||||||||
| P | K | J | P | K | J | P | K | J | ||||||||||
| 56 | 68 | 58 | 35 | 31 | 38 | 9 | 2 | 4 | ||||||||||
| Question 2 | How much increase in your electricity bill would you find acceptable? | |||||||||||||||||
| Answer | 10%–30% | 30%–50% | 50%–70% | NA | ||||||||||||||
| P | K | J | P | K | J | P | K | J | P | K | J | |||||||
| 89 | 55 | 50 | 7 | 0 | 0 | 0 | 0 | 0 | 4 | 45 | 50 | |||||||
| Question 3 | Do you have a backup generator at home? | |||||||||||||||||
| Answer | Yes | No | NA | |||||||||||||||
| P | K | J | P | K | J | P | K | J | ||||||||||
| 21 | 14 | 65 | 67 | 83 | 27 | 12 | 3 | 8 | ||||||||||
| Question 4 | Do you experience a stable electricity voltage at home? | |||||||||||||||||
| Answer | Yes | No | NA | |||||||||||||||
| P | K | J | P | K | J | P | K | J | ||||||||||
| 82 | 49 | 50 | 11 | 48 | 42 | 8 | 3 | 8 | ||||||||||
| Question 5 | Have you ever experienced a blackout at home? | |||||||||||||||||
| Answer | Yes | No | NA | |||||||||||||||
| P | K | J | P | K | J | P | K | J | ||||||||||
| 89 | 97 | 85 | 2 | 0 | 8 | 10 | 3 | 8 | ||||||||||
| Question 6 | On average, how often in a month do you experience blackouts? | |||||||||||||||||
| Answer | <3 x | 3–5 x | 6–10 | >10 x | NA | |||||||||||||
| P | K | J | P | K | J | P | K | J | P | K | J | P | K | J | ||||
| 37 | 37 | 8 | 39 | 25 | 46 | 10 | 31 | 35 | 10 | 5 | 4 | 4 | 3 | 8 | ||||
| Question 7 | On average, how long (in minutes) is the duration of the blackouts you experience? | |||||||||||||||||
| Answer | <5 | 5–15 | 15–60 | 60–120 | >120 | NA | ||||||||||||
| P | K | J | P | K | J | P | K | J | P | K | J | P | K | J | P | K | J | |
| 0 | 0 | 0 | 3 | 5 | 12 | 19 | 12 | 15 | 60 | 66 | 54 | 14 | 12 | 12 | 4 | 5 | 8 | |
| Question 8 | At what time of day would a blackout event incur the most losses for you? | |||||||||||||||||
| Answer | 6 a.m.–12 a.m. | 12 a.m.–6 p.m. | 6 p.m.–12 p.m. | 12 p.m.–6 a.m. | NA | |||||||||||||
| P | K | J | P | K | J | P | K | J | P | K | J | P | K | J | ||||
| 27 | 52 | 58 | 13 | 8 | 4 | 52 | 29 | 23 | 2 | 0 | 0 | 6 | 11 | 15 | ||||
| Question 9 | On average, what is the duration (in minutes) of a blackout that would incur economic losses for you? | |||||||||||||||||
| Answer | <5 | 5–15 | 15–60 | 60–120 | >120 | NA | ||||||||||||
| P | K | J | P | K | J | P | K | J | P | K | J | P | K | J | P | K | J | |
| 3 | 2 | 0 | 2 | 2 | 8 | 6 | 12 | 15 | 72 | 72 | 54 | 4 | 6 | 12 | 13 | 6 | 12 | |
P: Pekanbaru, K: Kupang, J: Jayapura, NA: No Answer.
References
- International Energy Agency. World Energy Outlook 2016 Executive Summary; International Energy Agency: Paris, France, 2016. [Google Scholar]
- Perusahaan Listrik Negara (PLN). Statistik PLN 2015; PLN: Jakarta, Indonesia, 2016. [Google Scholar]
- Khoury, J.; Mbayed, R.; Salloum, E.; Monmasson, E. Optimal sizing of a residential PV-battery backup for an intermittent primary energy source under realistic constraints. Energy Build. 2015, 105, 206–216. [Google Scholar] [CrossRef]
- Alramlawi, M.; Gabash, A.; Li, P. Optimal operation strategy of a hybrid PV-battery system under grid scheduled blackouts. In Proceedings of the IEEE International Conference on Environment and Electrical Engineering and 2017 IEEE Industrial and Commercial Power Systems Europe (EEEIC/I&CPS Europe), Milan, Italy, 6–9 June 2017. [Google Scholar]
- Hasan, M.H.; Mahlia, T.M.I.; Nur, H. A review on energy scenario and sustainable energy in Indonesia. Renew. Sustain. Energy Rev. 2012, 16, 2316–2328. [Google Scholar] [CrossRef]
- Murphy, P.M.; Twaha, S.; Murphy, I.S. Analysis of the cost of reliable electricity: A new method for analyzing grid connected solar, diesel and hybrid distributed electricity systems considering an unreliable electric grid, with examples in Uganda. Energy 2014, 66, 523–534. [Google Scholar] [CrossRef]
- World Bank. Enterprise Surveys Data for Indonesia. Available online: http://www.enterprisesurveys.org/ (accessed on 26 November 2017).
- Institute of Electrical and Electronics Engineers. IEEE Guide for Electric Power Distribution Reliability Indices; IEEE: New York, NY, USA, 2012. [Google Scholar]
- Government of Indonesia. President Decree Regarding National Energy General Plan, 2016–2050; Government of Indonesia: Jakarta, Indonesia, 2016. [Google Scholar]
- Dalet, D. Indonesia, D-Maps. Available online: http://www.d-maps.com/ (accessed on 12 July 2017).
- Asian Development Bank. Achieving Universal Electricity Access in Indonesia; Asian Development Bank: Metro Manila, Philippines, 2016; p. 113. Available online: https://www.adb.org/sites/default/files/publication/182314/achieving-electricity-access-ino.pdf (accessed on 21 July 2017).
- The World Bank. Acess to Electricity. Available online: http://data.worldbank.org/indicator/EG.ELC.ACCS.ZS (accessed on 23 July 2017).
- International Energy Agency. Electricity access in Developing Asia—2016. Available online: www.worldenergyoutlook.org/media/weowebsite/2015/WEO2016Electricity.xlsx (accessed on 23 17).
- Knoema, Quality of Electricity Supply. The World Bank. Available online: https://knoema.com/WFGCI2014/the-global-competitiveness-index-2014-2015-data-platform-2014?tsId=1074960 (accessed on 8 November 2016).
- CRO Forum. Power Blackout Risks: Risk Management Options. Available online: https://www.allianz.com/v_1339677769000/media/responsibility/documents/position_paper_power_blackout_risks.pdf (accessed on 3 November 2016).
- Erahman, Q.F.; Purwanto, W.W.; Sudibandriyo, M.; Hidayatno, A. An assessment of Indonesia’s energy security index and comparison with seventy countries. Energy 2016, 111, 364–376. [Google Scholar] [CrossRef]
- Hashim, J.H.; Hashim, Z. Climate Change, Extreme Weather Events, and Human Health Implications in the Asia Pacific Region. Asia Pac. J. Public Health 2016, 28, 8S–14S. [Google Scholar] [CrossRef] [PubMed]
- Zoro, R.; Mefiardhi, R. Insulator Damages due to Lightning Strikes in Power System: Some Experiences in Indonesia. In Proceedings of the 2006 IEEE 8th International Conference on Properties & Applications of Dielectric Materials, Bali, Indonesia, 26–30 June 2006. [Google Scholar]
- Christian, H.J.; Blakeslee, R.J.; Boccippio, D.J.; Boeck, W.L.; Buechler, D.E.; Driscoll, K.T.; Goodman, S.J.; Hall, J.M.; Koshak, W.J.; Mach, D.M.; et al. Global frequency and distribution of lightning as observed from space by the Optical Transient Detector. J. Geophys. Res. Atmos. 2003, 108, ACL 4-1–ACL 4-15. [Google Scholar] [CrossRef]
- Bi, C.; Qi, B. Reliability improvement of long distance transmission line protection in Indonesia. In Proceedings of the 2016 China International Conference on Electricity Distribution (CICED), Xi’an, China, 10–13 August 2016. [Google Scholar]
- National Aeronautics and Space Administration (NASA). Lightning Flash Rate. Available online: https://www.nasa.gov/vision/earth/lookingatearth/intense_storms.html (accessed on 11 July 2017).
- Chattopadhyay, S.; Mitra, M.; Sengupta, S. Electric Power Quality; Springer: Dordrecht, The Netherlands, 2011. [Google Scholar]
- Pontt, J.; Rodríguez, J.; Valderrama, W.; Sepúlveda, G.; Alzamora, G. Resonance effects, power quality and reliability issues of high-power converters-fed drives employed in modern SAG circuits. Miner. Eng. 2004, 17, 1125–1134. [Google Scholar] [CrossRef]
- Sjöberg, L. Political decisions and public risk perception. Reliab. Eng. Syst. Saf. 2001, 72, 115–123. [Google Scholar] [CrossRef]
- Ozbafli, A.; Jenkins, G.P. Estimating the willingness to pay for reliable electricity supply: A choice experiment study. Energy Econ. 2016, 56, 443–452. [Google Scholar] [CrossRef]
- Jimenez, R.; Serebrisky, T.; Mercado, J. What does “better” mean? Perceptions of electricity and water services in Santo Domingo. Util. Policy 2016, 41, 15–21. [Google Scholar] [CrossRef]
- Bernués, A.; Rodríguez-Ortega, T.; Ripoll-Bosch, R.; Alfnes, F. Socio-Cultural and Economic Valuation of Ecosystem Services Provided by Mediterranean Mountain Agroecosystems. PLoS ONE 2014, 9, e102479. [Google Scholar] [CrossRef] [PubMed]
- O’Connor, B.; Balasubramanyan, R.; Routledge, B.R.; Smith, N.A. From Tweets to Polls: Linking Text Sentiment to Public Opinion Time Series. In Proceedings of the Fourth International AAAI Conference on Weblogs and Social Media, Washington, DC, USA, 23–26 May 2010. [Google Scholar]
- Matsukawa, I.; Fujii, Y. Customer Preferences for Reliable Power Supply: Using Data on Actual Choices of Back-Up Equipment. Rev. Econ. Stat. 1994, 76, 434–446. [Google Scholar] [CrossRef]
- Sagebiela, J.; Rommel, K. Preferences for electricity supply attributes in emerging megacities—Policy implications from a discrete choice experiment of private households in Hyderabad, India. Energy Sustain. Dev. 2014, 21, 89–99. [Google Scholar] [CrossRef]
- Sagebiel, J.; Müller, J.R.; Rommel, J. Are consumers willing to pay more for electricity from cooperatives? Results from an online Choice Experiment in Germany. Energy Res. Soc. Sci. 2014, 2, 90–101. [Google Scholar] [CrossRef] [Green Version]
- Kalkbrenner, B.J.; Yonezawa, K.; Roosen, J. Consumer preferences for electricity tariffs: Does proximity matter? Energy Policy 2017, 107, 413–424. [Google Scholar] [CrossRef]
- Bartczak, A.; Chilton, S.; Czajkowskia, M.; Meyerhoff, J. Gain and loss of money in a choice experiment. The impact of financial loss aversion and risk preferences on willingness to pay to avoid renewable energy externalities. Energy Econ. 2017, 65, 326–334. [Google Scholar] [CrossRef]
- Sagebiel, J. Preference heterogeneity in energy discrete choice experiments: A review on methods for model selection. Renew. Sustain. Energy Rev. 2017, 69, 804–811. [Google Scholar] [CrossRef]
- Shina, J.; Hwang, W.-S. Consumer preference and willingness to pay for a renewable fuel standard (RFS) policy: Focusing on ex-ante market analysis and segmentation. Energy Policy 2017, 106, 32–40. [Google Scholar] [CrossRef]
- Harapan, H.; Anwar, S.; Bustamam, A.; Radiansyah, A.; Angraini, P.; Fasli, R.; Salwiyadi, S.; Bastian, R.A.; Oktiviyari, A.; Akmal, I.; et al. Willingness to pay for a dengue vaccine and its associated determinants in Indonesia: A community-based, cross-sectional survey in Aceh. Acta Trop. 2017, 166, 249–256. [Google Scholar] [CrossRef] [PubMed]
- Vollmer, D.; Ryffel, A.N.; Djaja, K.; Grêt-Regamey, A. Examining demand for urban river rehabilitation in Indonesia: Insights from a spatially explicit discrete choice experiment. Land Use Policy 2016, 57, 514–525. [Google Scholar] [CrossRef]
- Suparman, Y.; Folmer, H.; Oud, J.H.L. The willingness to pay for in-house piped water in urban and rural Indonesia. Pap. Reg. Sci. 2016, 95, 407–426. [Google Scholar] [CrossRef]
- Ghozali, A.; Kaneko, S. Climate Change Policies and Challenges in Indonesia Consumer Behavior and Ecolabeling; Springer: Tokyo, Japan, 2016. [Google Scholar]
- Tan Soo, J.S. Valuing Air Quality in Indonesia Using Households’ Locational Choices. Environ. Resour. Econ. 2017, 1–22. [Google Scholar] [CrossRef]
- Anna, Z.Z.Z. Economic valuation of whale shark tourism in Cenderawasih Bay National Park, Papua, Indonesia. Biodiversitas 2017, 18, 1026–1034. [Google Scholar] [CrossRef]
- Hendratmoko, P.; Guritnaningsih, G.; Tjahjono, T. Analysis of interaction between preferences and intention for determining the behavior of vehicle maintenance pay as a basis for transportation road safety assessment. Int. J. Technol. 2016, 7, 105–113. [Google Scholar] [CrossRef]
- Ambarwati, L.; Verhaeghe, R.; Arem, B.V.; Pel, A.J. Assessment of transport performance index for urban transport development strategies—Incorporating residents’ preferences. Environ. Impact Assess. Rev. 2017, 6, 107–115. [Google Scholar] [CrossRef]
- Kojima, R.; Ishikawa, M. Consumer willingness-to-pay for packaging and contents in Asian countries. Waste Manag. 2017, 68, 724–731. [Google Scholar] [CrossRef] [PubMed]
- Miller, S.; Tait, P.; Saunders, C.; Dalziel, P.; Rutherford, P.; Abell, W. Estimation of consumer willingness-to-pay for social responsibility in fruit and vegetable products: A cross-country comparison using a choice experiment. J. Consum. Behav. 2017, 16, 13–25. [Google Scholar] [CrossRef]
- Lensink, R.; Raster, T.; Timmer, A. Liquidity Constraints and Willingness to Pay for Solar Lamps and Water Filters in Jakarta. Eur. J. Dev. Res. 2017, 1–11. [Google Scholar] [CrossRef]
- Kumashiro, H.; Kharisma, V.; Sianipar, C.P.M.; Koido, K.; Takahashi, R.; Dowaki, K. The design of an appropriate geothermal energy system. In Proceedings of the 5th International Conference on Energy and Sustainability, Putrajaya, Malaysia, 16–18 December 2014. [Google Scholar]
- Perusahaan Listrik Negara (PLN). Statistik PLN 2010; PLN: Jakarta, Indonesia, 2011. [Google Scholar]
- Perusahaan Listrik Negara (PLN). Statistik PLN 2011; PLN: Jakarta, Indonesia, 2012. [Google Scholar]
- Perusahaan Listrik Negara (PLN). Statistik PLN 2012; PLN: Jakarta, Indonesia, 2013. [Google Scholar]
- Perusahaan Listrik Negara (PLN). Statistik PLN 2013; PLN: Jakarta, Indonesia, 2014. [Google Scholar]
- Perusahaan Listrik Negara (PLN). Statistik PLN 2014; PLN: Jakarta, Indonesia, 2015. [Google Scholar]
- Matthews, B.; Ross, L. Research Methods: A Practical Guide for the Social Sciences; Pearson Longman: Harlow, UK, 2010. [Google Scholar]
- List, J.A.; Gallet, C.A. What Experimental Protocol Influence Disparities Between Actual and Hypothetical Stated Values? Environ. Resour. Econ. 2001, 20, 241–254. [Google Scholar] [CrossRef]
- Manikandan, S. Measures of central tendency: The mean. J. Pharmacol. Pharmacother. 2011, 2, 140–142. [Google Scholar] [CrossRef] [PubMed]
- Mathcentre. Variance and Standard Deviation (Grouped Data). Available online: http://www.mathcentre.ac.uk (accessed on 22 October 2017).
- Ministry of Energy and Mineral Resources. Minister of Energy and Mineral Resources Decree No. 18/2016 Regarding Sumatra Electric Power System Regulation; Ministry of Energy and Mineral Resources: Jakarta, Indonesia, 2016. [Google Scholar]
- DeCaria, J.E.; Montero-Odasso, M.; Wolfe, D.; Chesworth, B.M.; Petrella, R.J. The effect of intra-articular hyaluronic acid treatment on gait velocity in older knee osteoarthritis patients: A randomized, controlled study. Arch. Gerontol. Geriatr. 2012, 55, 310–315. [Google Scholar] [CrossRef] [PubMed]
- Štěrbová, V.; Kupka, J.; Thomas, J.; Lichnovský, J.; Andráš, P. Land snail assemblages of production forest in relation to selected environmental factors (HrabĚtice forest, Czech republic). In Proceedings of the 15th International Multidisciplinary Scientific GeoConference on Surveying Geology and Mining Ecology Management, SGEM, Albena, Bulgaria, 18–24 June 2015; Volume 2, pp. 295–299. [Google Scholar]
- Stout, W.A., Jr.; Tawney, B. An excel forecasting model to aid in decisionmaking that affects hospital resource/bed utilization-hospital capability to admit emergency room patients. In Proceedings of the 2005 IEEE Systems and Information Engineering Design Symposium, Charlottesville, VA, USA, 29 April 2005; pp. 222–228. [Google Scholar]
- Carlsson, F.; Martinsson, P. Willingness to pay among Swedish households to avoid power outages: A random parameter Tobit model approach. Energy J. 2007, 28, 75–89. [Google Scholar] [CrossRef]
- Kirubi, C.; Jacobson, A.; Kammen, D.M.; Mills, A. Community-Based Electric Micro-Grids Can Contribute to Rural Development: Evidence from Kenya. World Dev. 2009, 37, 1208–1221. [Google Scholar] [CrossRef]
- Goel, L. A Comparison of Distribution System Reliability Indices for Different Operating Configurations. Electr. Mach. Power Syst. 1999, 27, 1029–1039. [Google Scholar] [CrossRef]
Figure 1.
Map of Indonesia showing ERs for 34 provinces in 2015. Data is based on Perusahaan Listrik Negara (PLN) (2016) [2], and the map is based on Dalet (2007) [10].
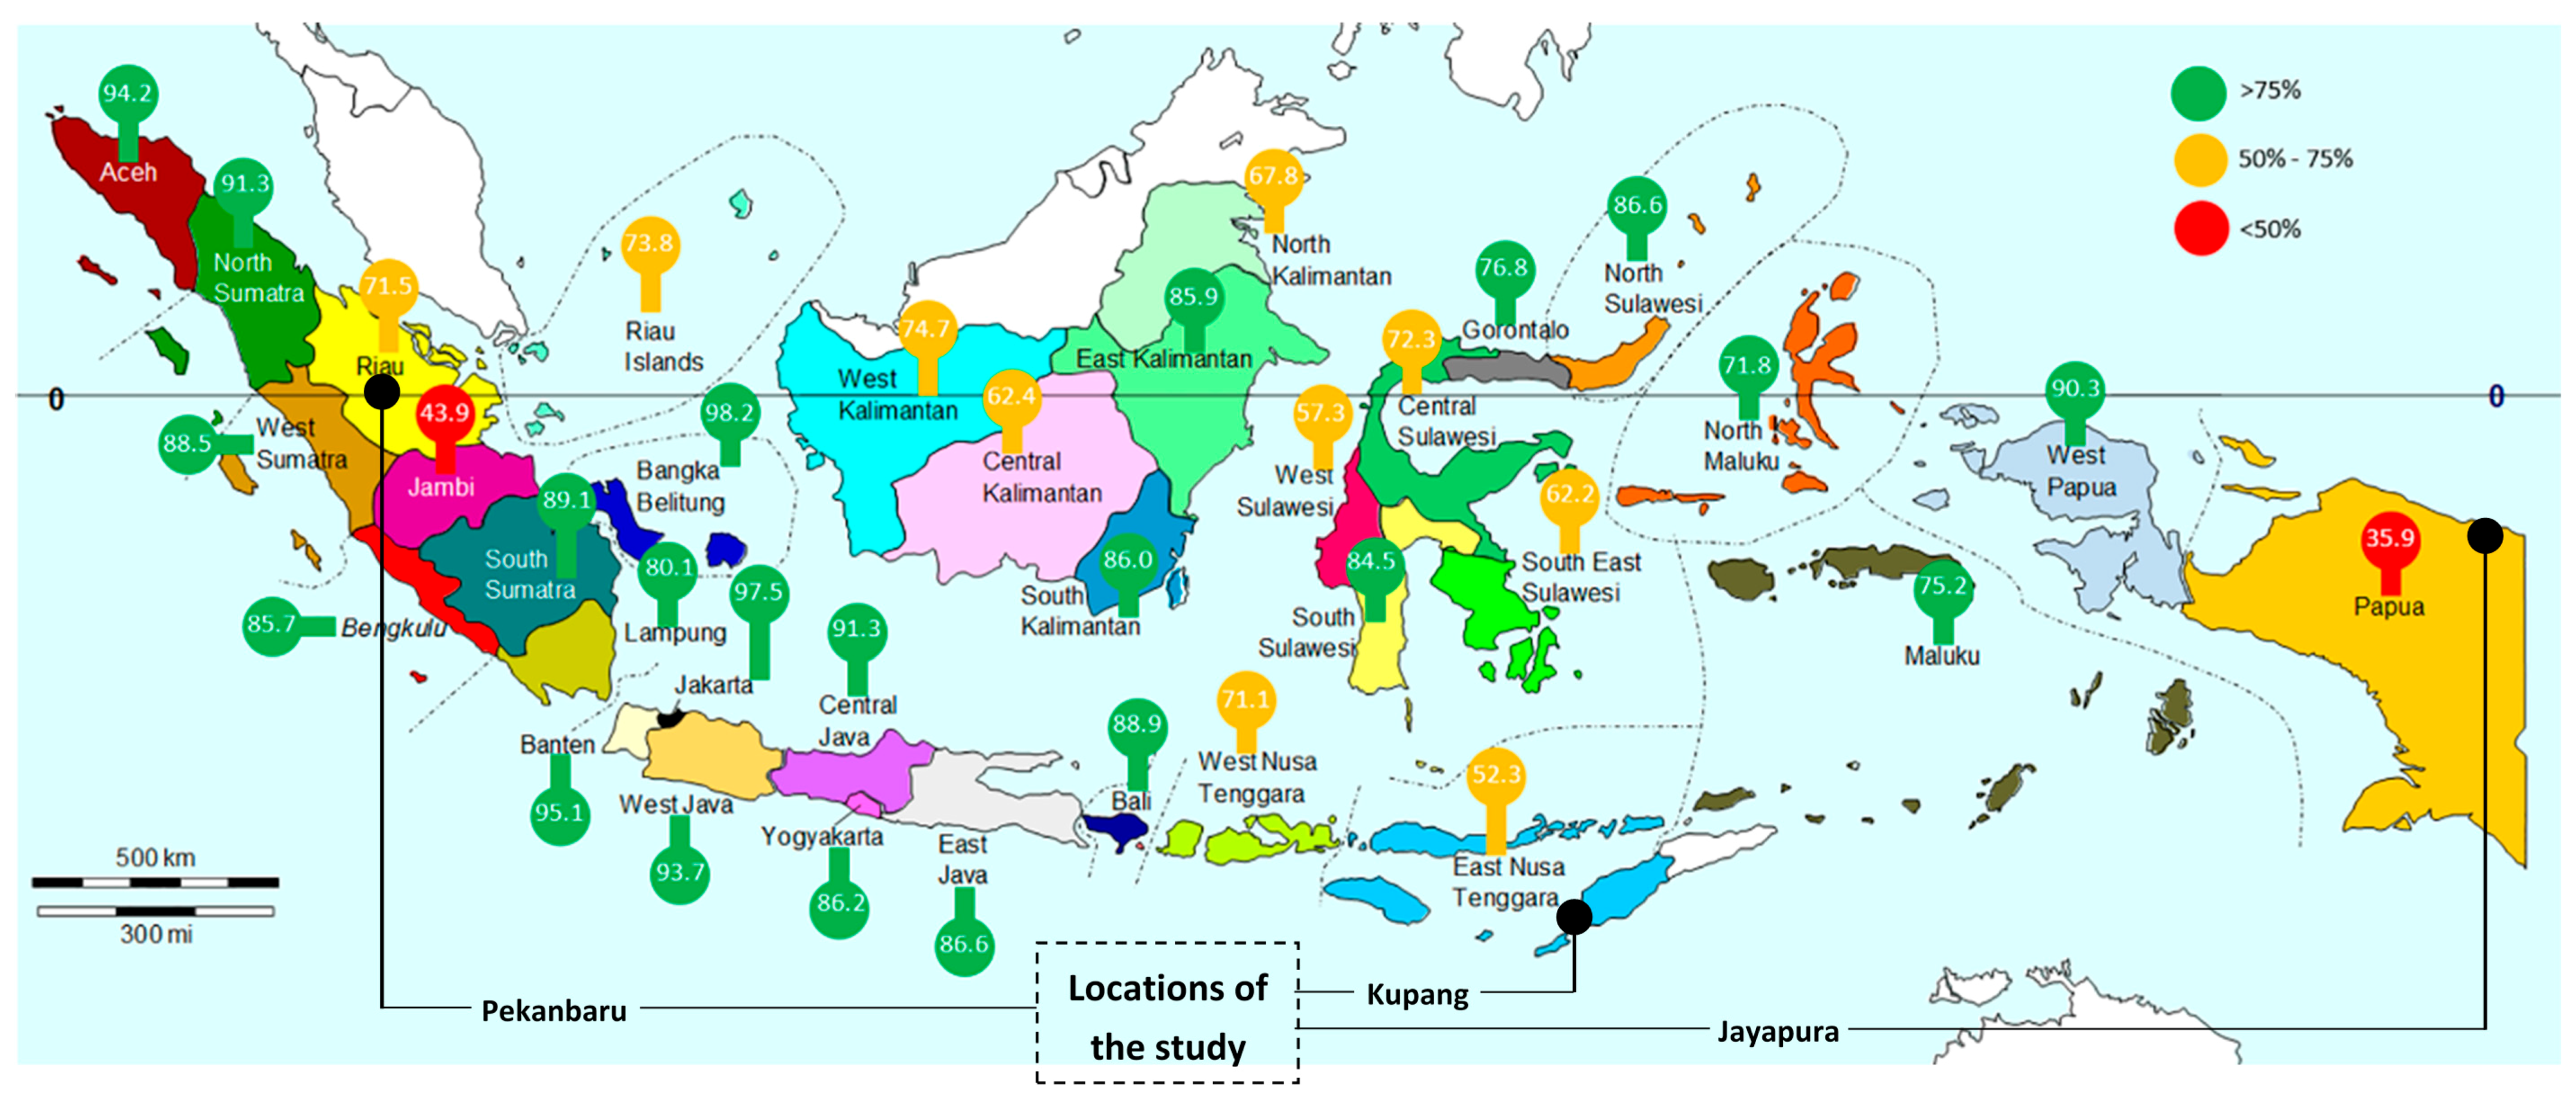
Figure 2.
Hioki 3169-21 Clamp-On Power HiTester measuring power quality (PQ).
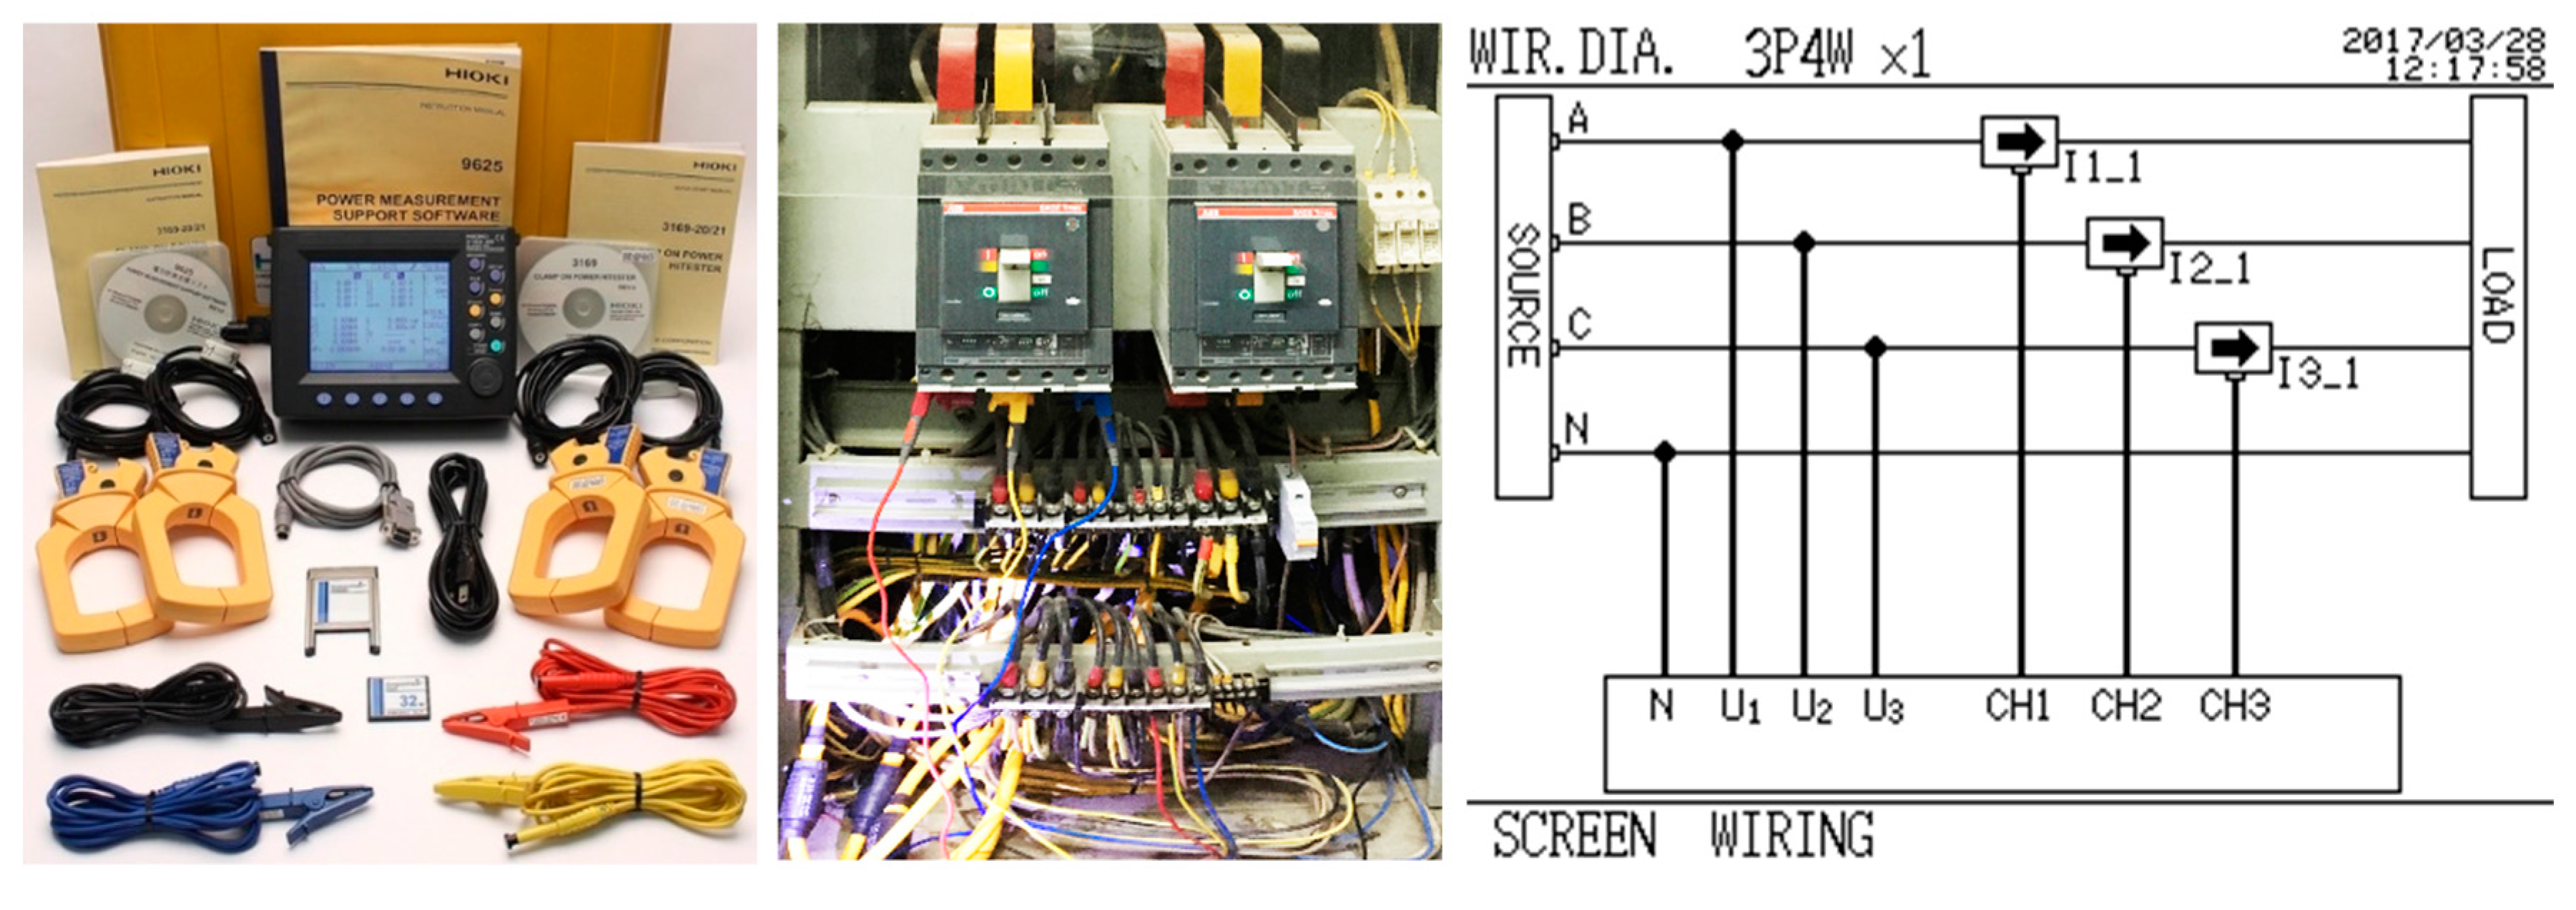
Figure 3.
SAIDI in hours of outage per customer per year and SAIFI in a number of outage events per customer per year for various locations in Indonesia for 2010 to 2015. Data sources: PLN (2011–2016) [2,48,49,50,51,52].
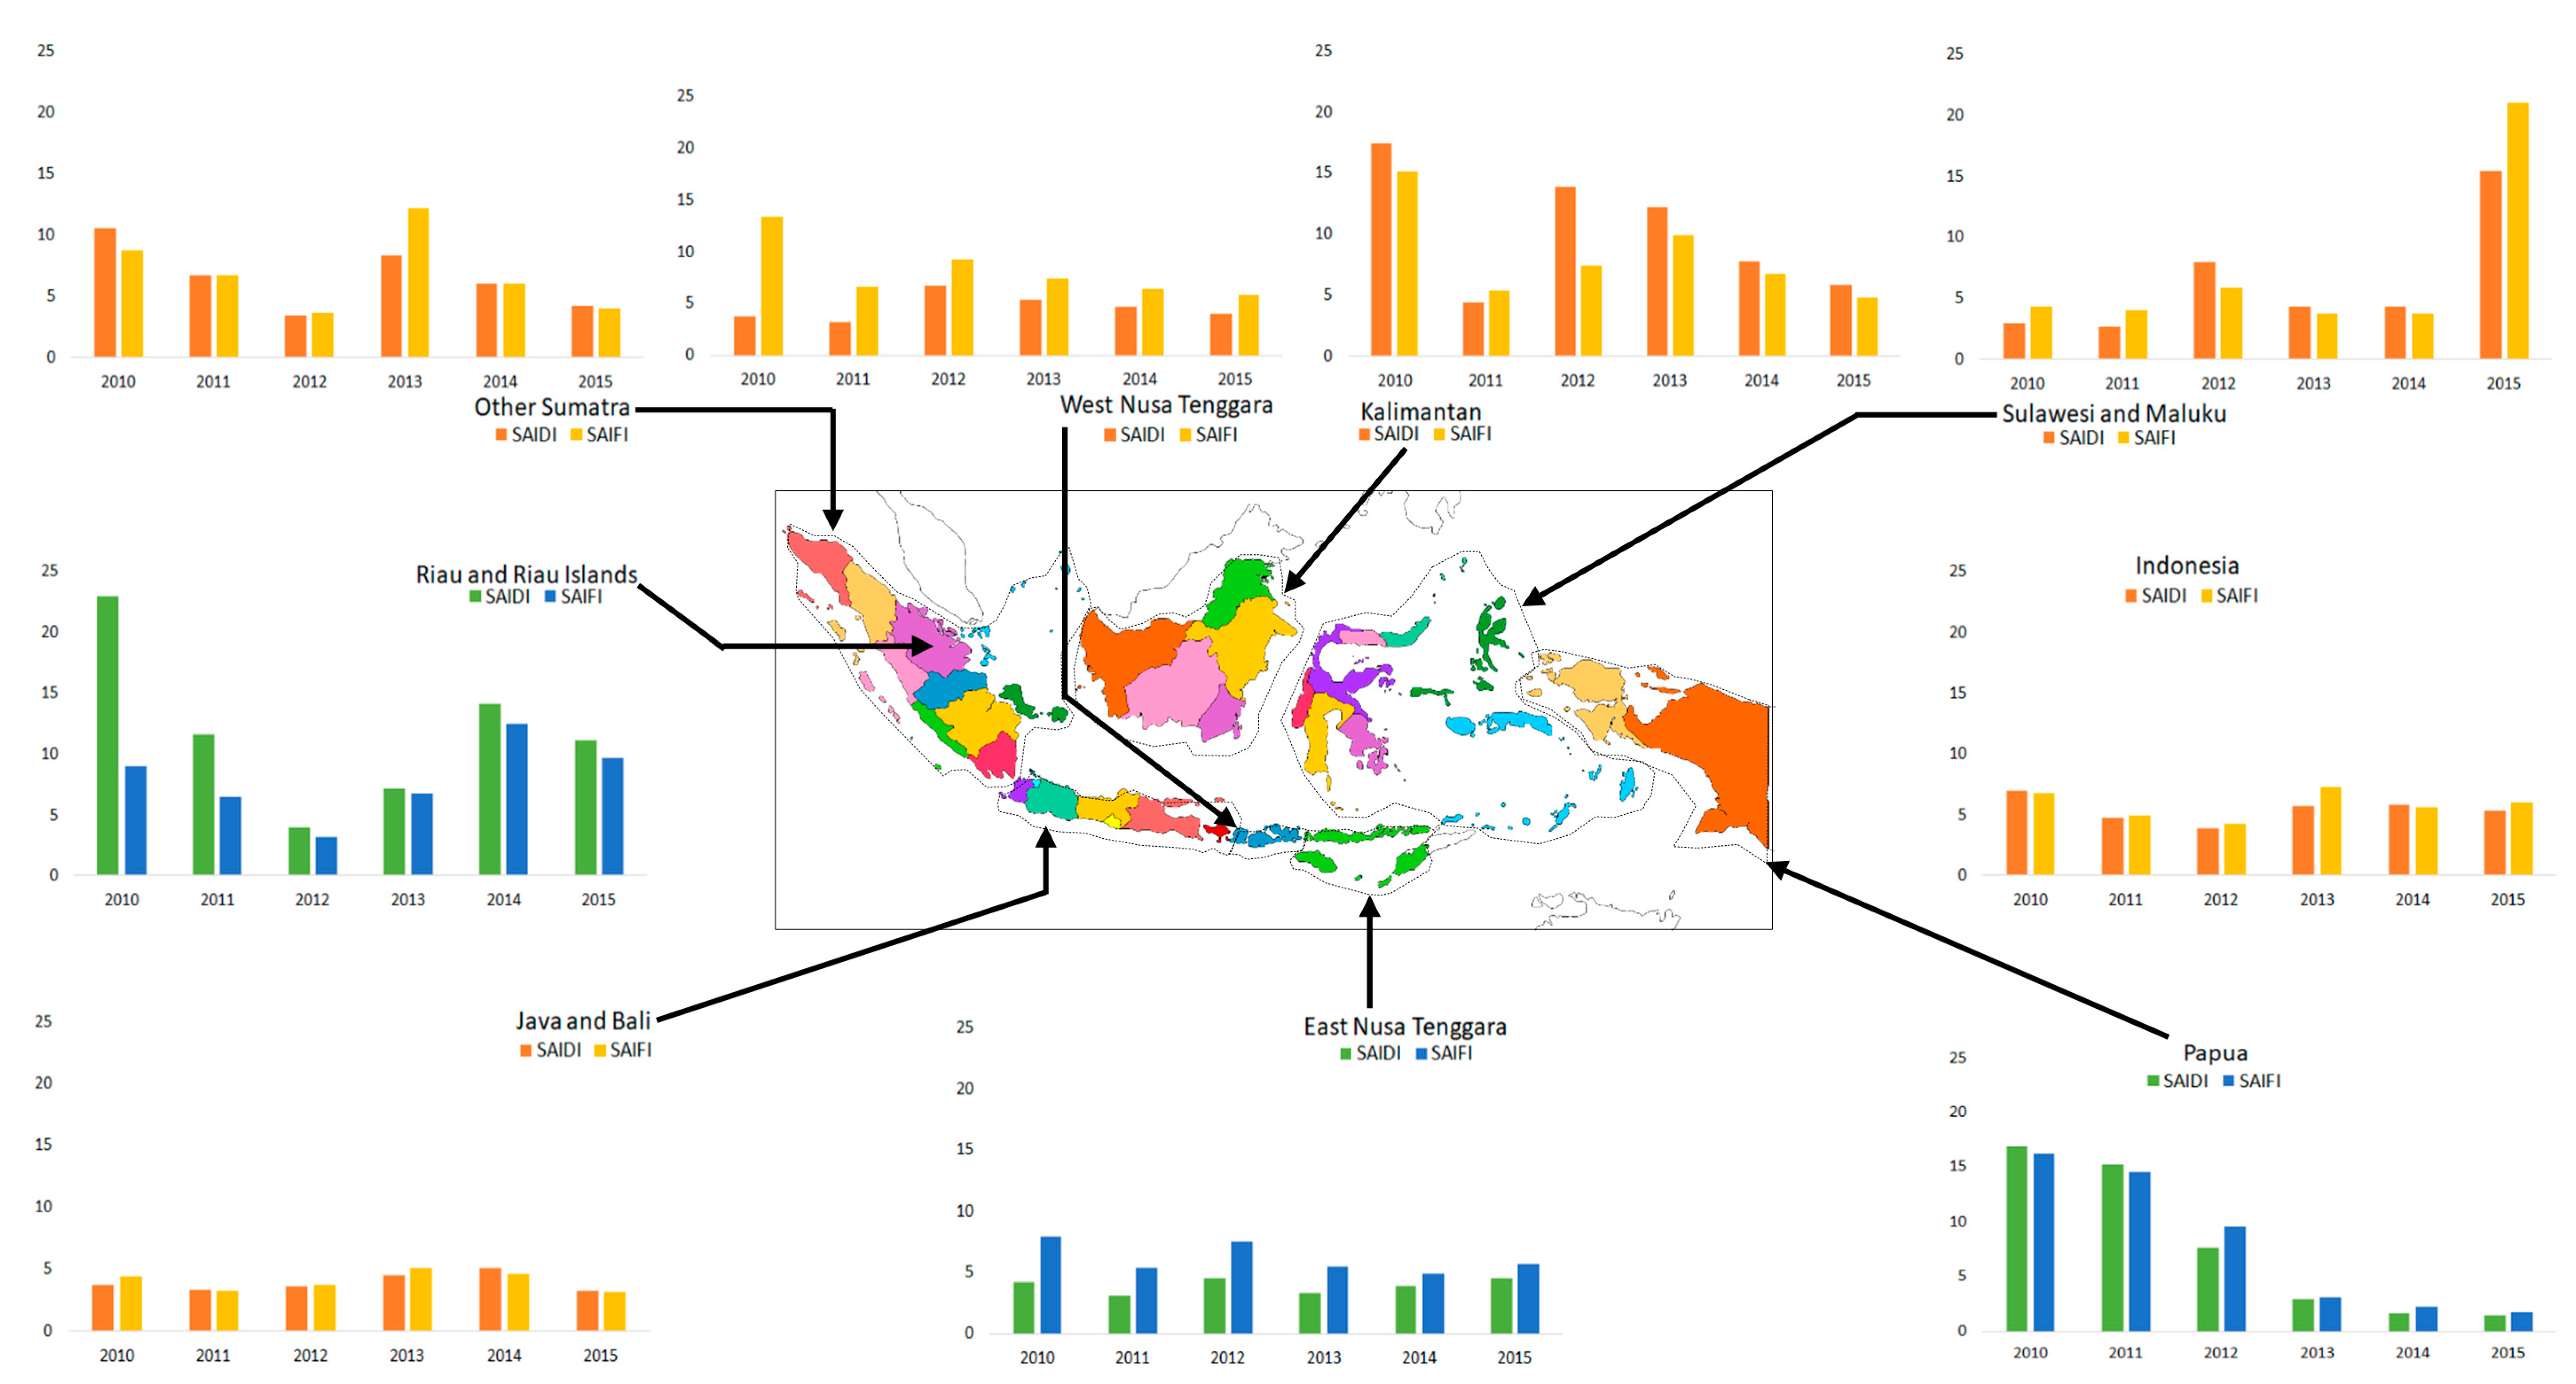
Figure 4.
The distribution of respondents by city address in the study locations.
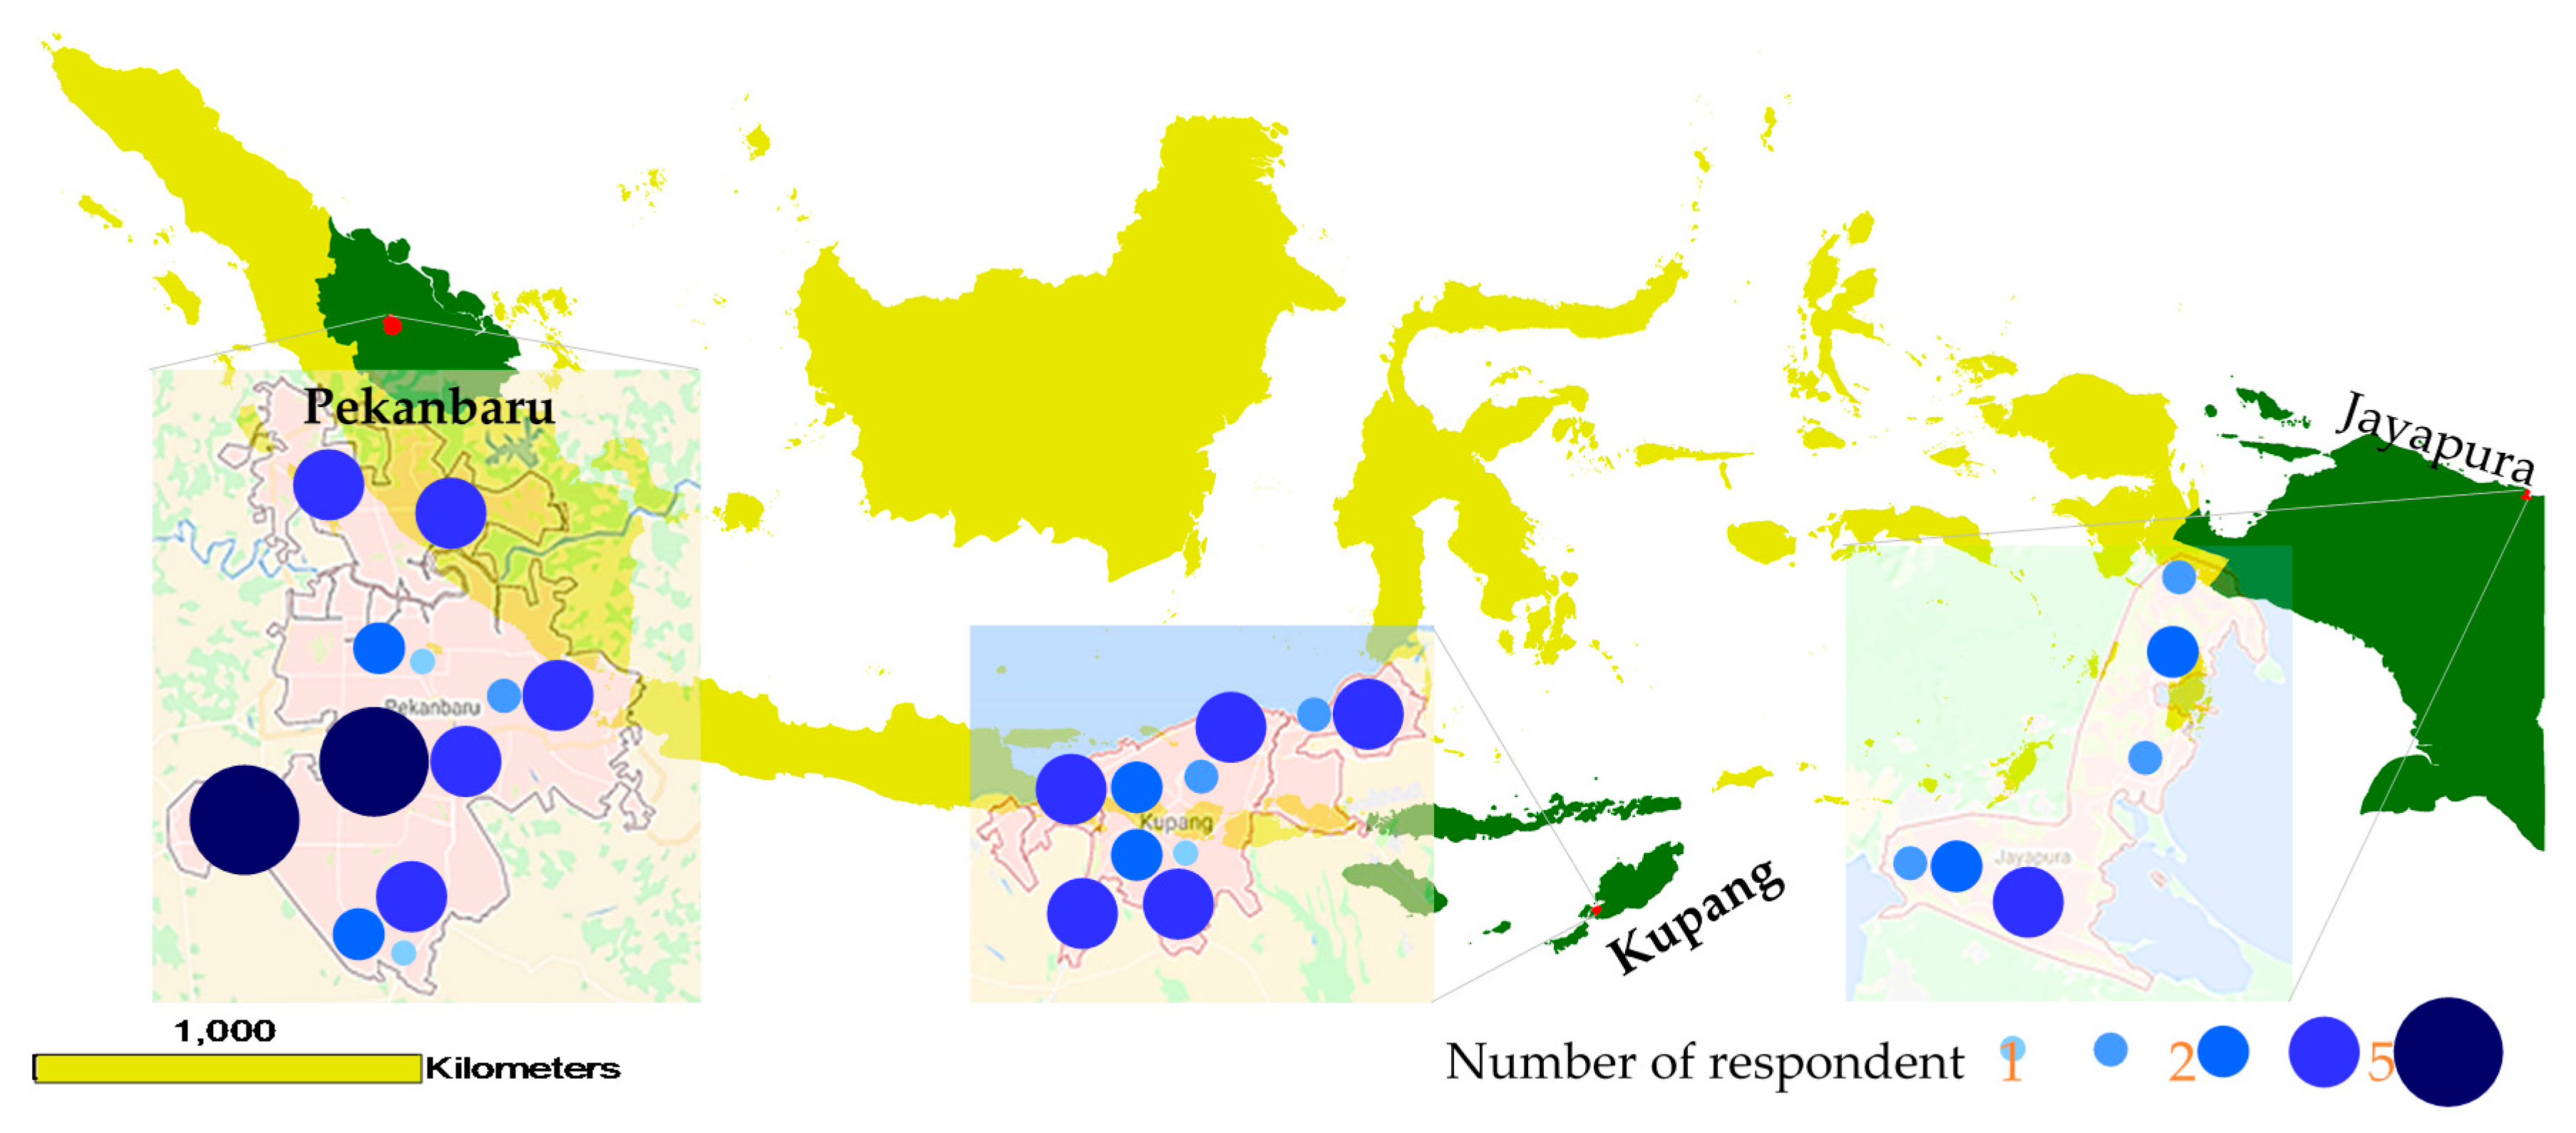
Figure 5.
The proportion of respondents’ answers to survey questions in percentages: (a) Would you accept an increase in your electricity bill for better electricity service? (b) How much increase in your electricity bill would you find acceptable? (c) Do you have a backup generator at home? (d) Do you experience stable electricity voltage at home? P: Pekanbaru, K: Kupang, J: Jayapura *, NA: No answer. * Data from Jayapura is less representative.

Figure 6.
The proportion of respondents’ answers to the following questions, in percentages: (a) On average, how often do you experience blackouts in a month? (b) On average, how long is the duration of the blackouts that you experience? (c) At what time of day would a blackout event incur the most losses for you? (d) On average, how long is the duration of a blackout that would incur any losses for you? P: Pekanbaru, K: Kupang, J: Jayapura *, NA: No answer. * Data from Jayapura is less representative.

Figure 7.
SAIDI vs. P-SAIDI and SAIFI vs. P-SAIFI for the three locations.

Figure 8.
The voltage level on the grid during the measurement period in (a) Pekanbaru, (b) Kupang, and (c) Jayapura. Note the different time scales between the measurement locations. Red line: Highest limit for voltage, Yellow line: Average voltage, and Green line: Lowest limit for voltages.
Figure 8.
The voltage level on the grid during the measurement period in (a) Pekanbaru, (b) Kupang, and (c) Jayapura. Note the different time scales between the measurement locations. Red line: Highest limit for voltage, Yellow line: Average voltage, and Green line: Lowest limit for voltages.
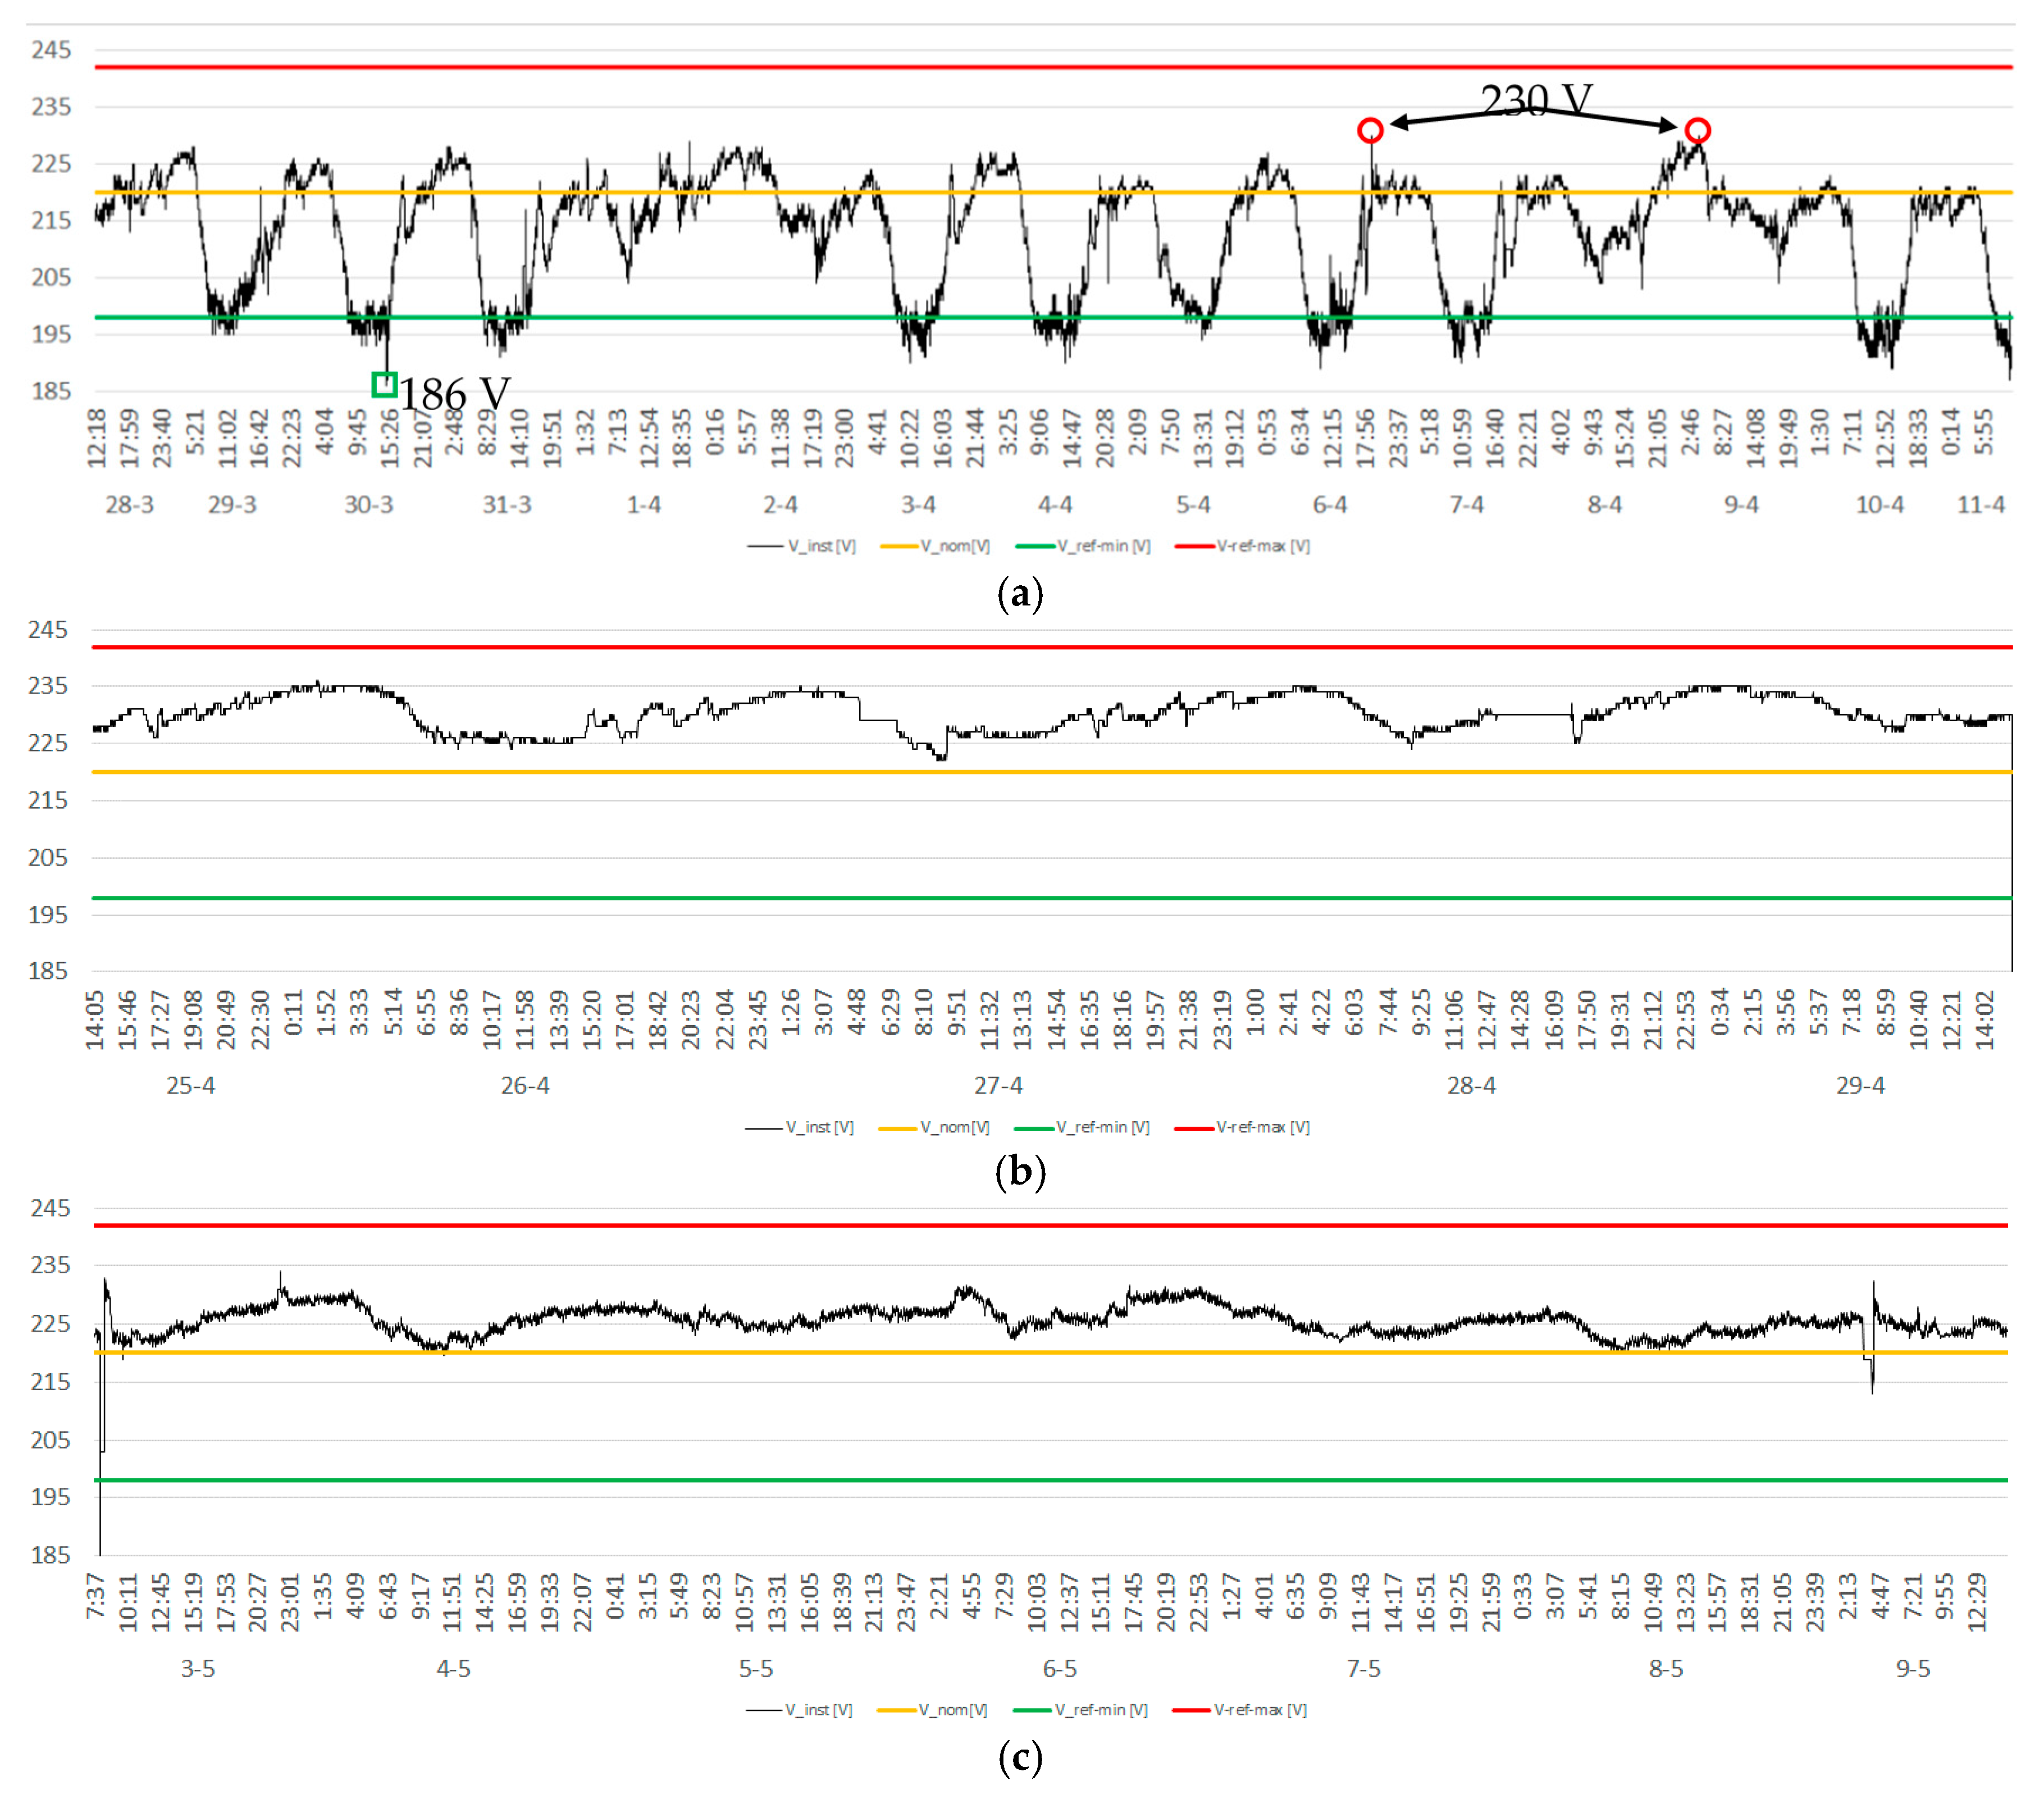
Figure 9.
Blackout events during the measurement period in (a) Pekanbaru, (b) Kupang, and (c) Jayapura. Note the different time scales between the measurement locations. Red circles indicate blackout events and its duration in minutes.
Figure 9.
Blackout events during the measurement period in (a) Pekanbaru, (b) Kupang, and (c) Jayapura. Note the different time scales between the measurement locations. Red circles indicate blackout events and its duration in minutes.


Figure 10.
Correlations between SAIDI (blue bar) and SAIFI (orange bar), the electrification ratio (grey line), and SAIFI and electrification ratio.
Figure 10.
Correlations between SAIDI (blue bar) and SAIFI (orange bar), the electrification ratio (grey line), and SAIFI and electrification ratio.
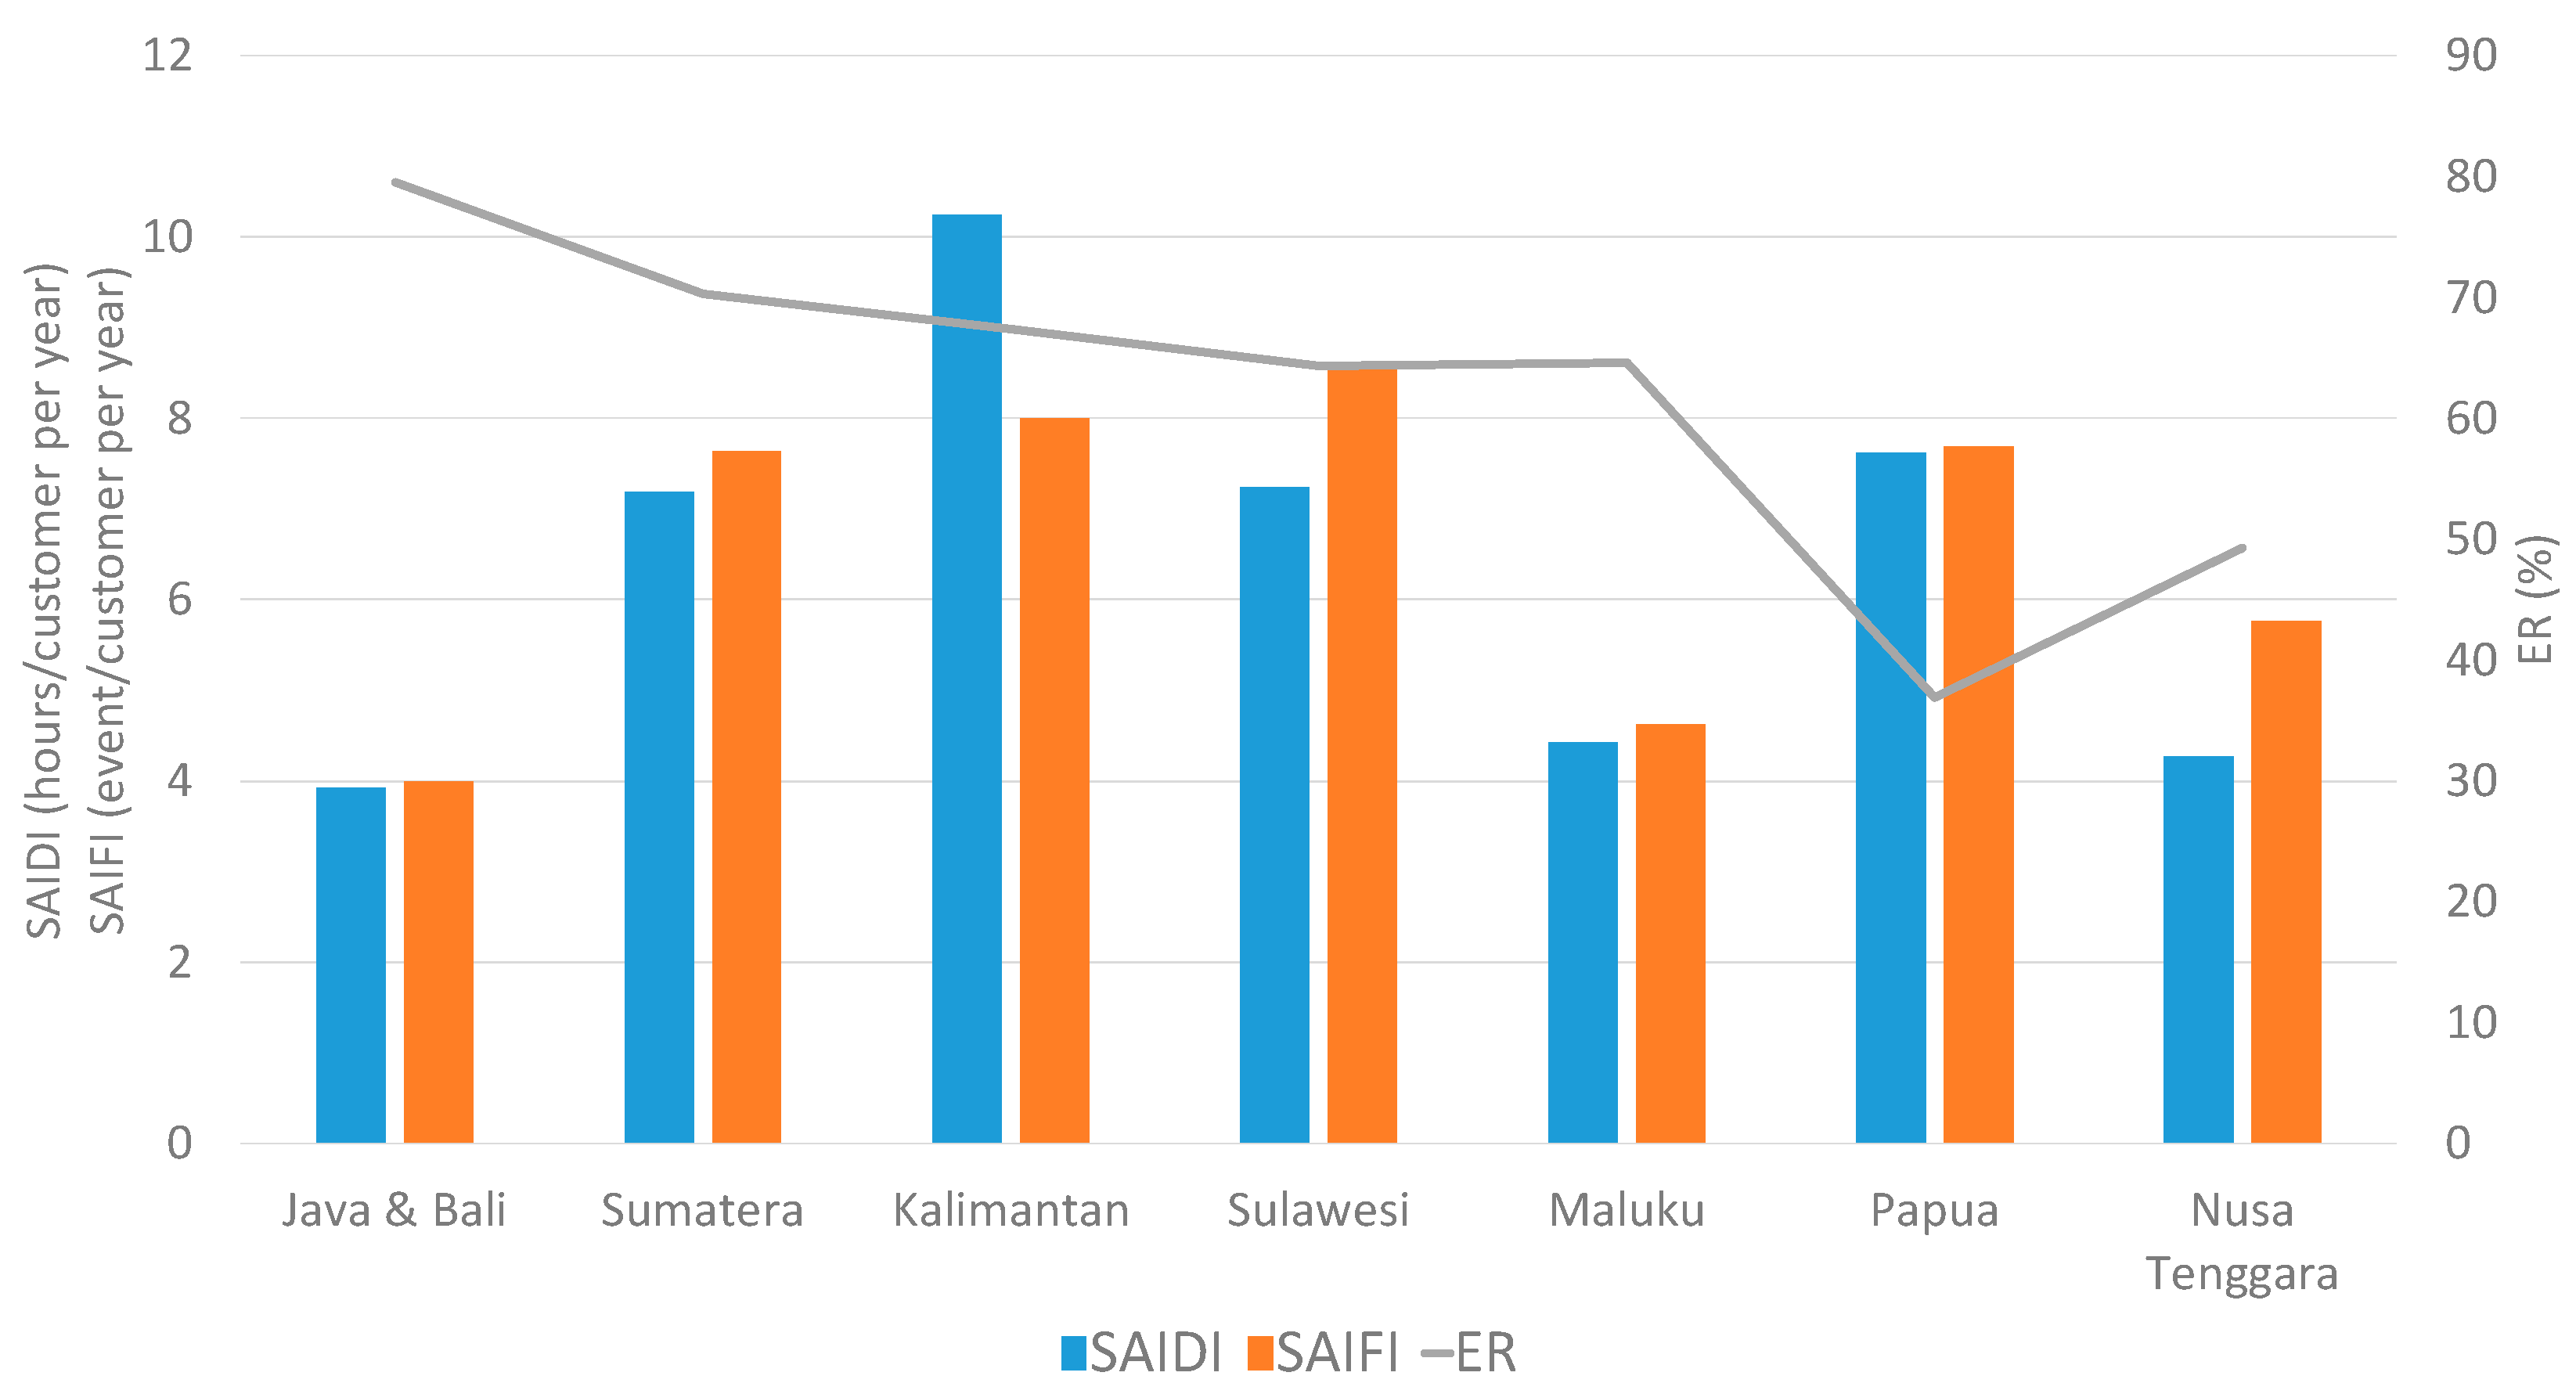
Figure 11.
Correlations between P-SAIDI and P-SAIFI, the income of households, and WTP in (a) Pekanbaru and (b) Kupang.
Figure 11.
Correlations between P-SAIDI and P-SAIFI, the income of households, and WTP in (a) Pekanbaru and (b) Kupang.

Table 1.
Study locations and reasons for selection.
| City | Province | Regional Location in Indonesia | Electrification Ratios of the City’s Provinces in 2015 * | Assumption About the Level of DN Reliability | Period of the Field Survey |
|---|---|---|---|---|---|
| Pekanbaru | Riau | West | 71 | Best | 27/03–14/04 |
| Kupang | ENT | Central | 52 | Moderate | 24/04–29/04 |
| Jayapura | Papua | East | 36 | Worst | 02/05–09/05 |
* PLN [2].
Table 2.
SAIDI and SAIFI in Riau, ENT and Papua, 2010–2015.
| Regional Area | 2010 | 2011 | 2012 | 2013 | 2014 | 2015 | Average 2010–2015 | |||||||
|---|---|---|---|---|---|---|---|---|---|---|---|---|---|---|
| SAIDI | SAIFI | SAIDI | SAIFI | SAIDI | SAIFI | SAIDI | SAIFI | SAIDI | SAIFI | SAIDI | SAIFI | SAIDI | SAIFI | |
| Riau & Riau Islands | 22.9 | 9.0 | 11.6 | 6.5 | 3.9 | 3.2 | 7.2 | 6.7 | 14.1 | 12.5 | 11.1 | 9.6 | 11.8 | 7.9 |
| Papua | 16.8 | 16.1 | 15.2 | 14.5 | 7.6 | 9.5 | 3.0 | 3.1 | 1.7 | 2.3 | 1.4 | 1.8 | 7.6 | 7.9 |
| ENT | 4.2 | 7.8 | 3.1 | 5.3 | 4.5 | 7.5 | 3.3 | 5.5 | 3.9 | 4.9 | 4.5 | 5.6 | 3.9 | 6.1 |
| Indonesia | 7.0 | 6.8 | 4.7 | 4.9 | 3.85 | 4.22 | 5.76 | 7.26 | 5.81 | 5.58 | 5.31 | 5.97 | 5.4 | 5.8 |
Table 3.
Perceived and reported SAIDI and SAIFI.
| Parameter | Unit | P | K | J * | ||||||
|---|---|---|---|---|---|---|---|---|---|---|
| SAIDI | hours/customer per year | 7.9 | 6.1 | 7.9 | ||||||
| SAIFI | number of interruption/customer per year | 11.8 | 3.9 | 7.6 | ||||||
| P-SAIDI | hours/customer per year | 21 | ± | 33 | 24 | ± | 33 | 24 | ± | 39 |
| P-SAIFI | number of interruption/customer per year | 16 | ± | 3 | 18 | ± | 3 | 21 | ± | 3 |
* Data from Jayapura is less representative.
© 2018 by the authors. Licensee MDPI, Basel, Switzerland. This article is an open access article distributed under the terms and conditions of the Creative Commons Attribution (CC BY) license (http://creativecommons.org/licenses/by/4.0/).
Share and Cite
MDPI and ACS Style
Kunaifi; Reinders, A. Perceived and Reported Reliability of the Electricity Supply at Three Urban Locations in Indonesia. Energies 2018, 11, 140. https://doi.org/10.3390/en11010140
AMA Style
Kunaifi, Reinders A. Perceived and Reported Reliability of the Electricity Supply at Three Urban Locations in Indonesia. Energies. 2018; 11(1):140. https://doi.org/10.3390/en11010140
Chicago/Turabian StyleKunaifi, and Angèle Reinders. 2018. "Perceived and Reported Reliability of the Electricity Supply at Three Urban Locations in Indonesia" Energies 11, no. 1: 140. https://doi.org/10.3390/en11010140
Note that from the first issue of 2016, this journal uses article numbers instead of page numbers. See further details here.