Entropy-Based Voltage Fault Diagnosis of Battery Systems for Electric Vehicles


1
National Engineering Laboratory for Electric Vehicles, Beijing Institute of Technology, Beijing 100081, China
2
Beijing Co-Innovation Center for Electric Vehicles Lecturer, Beijing 100081, China
*
Authors to whom correspondence should be addressed.
Energies 2018, 11(1), 136; https://doi.org/10.3390/en11010136
Submission received: 13 November 2017
/
Revised: 2 January 2018
/
Accepted: 3 January 2018
/
Published: 5 January 2018
(This article belongs to the Special Issue The International Symposium on Electric Vehicles (ISEV2017))
Abstract
:The battery is a key component and the major fault source in electric vehicles (EVs). Ensuring power battery safety is of great significance to make the diagnosis more effective and predict the occurrence of faults, for the power battery is one of the core technologies of EVs. This paper proposes a voltage fault diagnosis detection mechanism using entropy theory which is demonstrated in an EV with a multiple-cell battery system during an actual operation situation. The preliminary analysis, after collecting and preprocessing the typical data periods from Operation Service and Management Center for Electric Vehicle (OSMC-EV) in Beijing, shows that overvoltage fault for Li-ion batteries cell can be observed from the voltage curves. To further locate abnormal cells and predict faults, an entropy weight method is established to calculate the objective weight, which reduces the subjectivity and improves the reliability. The result clearly identifies the abnormity of cell voltage. The proposed diagnostic model can be used for EV real-time diagnosis without laboratory testing methods. It is more effective than traditional methods based on contrastive analysis.
1. Introduction
Hybrid electric vehicles (HEVs), plug-in hybrid electric vehicles (PHEVs) and battery electric vehicles (BEVs) are being actively developed and deployed to achieve significant fuel consumption and carbon emission reductions in many markets throughout the world [1,2,3,4]. As a key component of electric vehicles (EVs), the power battery is one of the main sources of EV failure due to the complex working conditions and other reasons, and its performance has a crucial influence on the safety of the EVs. Moreover, the advance of battery application in EVs is conspicuously hindered by the deficiency of methods and technologies addressing battery safety issues [5]. Because the voltage faults such as overvoltage and undervoltage can cause serious internal faults including internal short-circuit, overcharge, thermal runaway and so on, safe technologies and fault diagnosis for power battery application in EVs have gradually attracted the public’s attention [6,7,8], making accurate fault diagnosis of great importance for the efficient operation of EVs.
A number of methods to estimate faults have been proposed and studies on this topic are mainly based on process parameter estimations, state estimations, experience knowledge and other methods [9,10,11,12]. Sun et al. [13] described a method to diagnose the degradation of lead-acid battery units caused by internal shorts, opening of internal shorts or cell reversal. The potential failure of battery packs was identified by observing the change of the charge and discharge curve. Liu et al. [14] presented an effective model-based sensor fault detection and isolation (FDI) scheme for a series battery pack. The proposed scheme consisted of two parts: on-line monitoring and off-line estimation. Then an adaptive extended Kalman filter (AEKF) algorithm was applied to generate the residual evaluated by a statistical inference method. The fault isolation strategy based on residuals responses could isolate the occurred fault. Chen et al. [15] investigated the external short circuit (ESC) fault characteristics of lithium-ion batteries experimentally, and a two-layer model-based ESC fault diagnosis algorithm was suggested. Kim et al. [16] employed a simple RC model for lithium-battery modeling to describe the characteristics of battery charge and discharge. A dual-sliding-mode observer was used to estimate state of health (SOH) and state of charge (SOC), and its performance was verified by an environmental test. Kim et al. [17] analyzed multi-battery packs by making use of an internal short circuit response model. A fail-safe design methodology for lithium-ion battery systems was proposed to locate the defective cell(s) in a module. Chen et al. [18] designed Luenberger observers to produce fault-isolation residuals and locate a specific fault source, and they utilized learning observers (LOs) to reconstruct the faults. Then a synthesized design based on observers to isolate and estimate battery faults simultaneously was proposed. Hwang et al. [19] introduced batteries’ basic characteristics with an equivalent circuit and battery residual capacity test method. They developed an online battery monitoring method to detect battery packs and cells, which could predict cell and system performance. Chen et al. [20] presented a multi-scale dual H infinity filters (HIF) method to estimate battery SOC and capacity in real-time. Compared to the single/multi-scale dual Kalman filters, this multi-scale dual HIF method had better robustness and higher estimation accuracy with experimental data of a LiMn2O4 (LMO) battery. Finally, the battery-in-the-loop approach was made to verify the stability and accuracy of SOC estimation. He et al. [21] employed an unscented Kalman filter (UFK) method to estimate SOC in real time. Nevertheless, there is no way to verify the accuracy of those methods in the actual operation for EVs, because the method is only validated in the laboratory.
In recent years, data mining, machine learning and artificial intelligence methods have been applied to fault detection. Each has its own advantages and disadvantages. Panchal et al. [22] collected real-world drive cycle data for different modes and different temperatures to show the degree of capacity fade, but this paper focused on the analysis of battery degradation and didn’t express exactly how to find abnormal cells. Yang et al. [23] used dynamic principal component analysis (DPCA) to reduce the effects of autocorrelation on the variables and determine feature space in order to solve the problem of fault identification. Twenty four support vector machine (SVM) classifiers were developed for the multi-SVM model by cross-correlation analysis. Then, Dempster-Shafer theory was applied to monitor water quality and achieve fault diagnosis. However, the method cannot be used directly because the performance of the battery is different from that of water. Considering the battery fault diagnosis characteristics, Liu [24] designed an open knowledge base to overcome the shortcoming of poor adaptability of traditional fault diagnosis systems. His method effectively realized the independence between the inference machine and the knowledge base, but the enriched degree of information for the knowledge base is the key to determining systematic function and level. He et al. [25] handled the small sample data with the help of relevance vector machine (RVM) whose parameters are optimized through a combination of particle swarm optimization (PSO) algorithm and differential evolution (DE) algorithm. Nevertheless, the choice of kernel functions for RVM is extremely difficult, and abundant sample is needed to train. You et al. [26] presented a data-driven approach to trace SOH using battery management system (BMS) data, such as current, voltage and temperature, which was collected those datasets for more than a year in four ambient temperatures (10/25/45/60 °C) and time-varying temperature (45–25 °C and 60–25 °C). However, this method requires many different parameters, such as voltage, current and so on. Sun et al. [27] developed a health auxiliary diagnosis method based on Sample Entropy (SampEn) for the lead–acid battery unit by imposing a specific discharge pulse on the battery and calculating the SampEn of the battery current and voltage, to achieve the qualitative analysis of the battery SOH. Due to the short external load pulse time, this method is relatively easy to implement, but it can only qualitatively analyze the health of the battery rather than accurately provide capacity estimation. Widodo et al. [28] utilized machine learning methods namely support vector machine (SVM) and RVM to predict battery SOH after being trained. They regarded the SampEn feature of discharge voltage and estimated SOH as data input and target vector, respectively. Finally, RVM outperforms SVM-based battery health prognostics by experiments. Although the capacity value can be estimated, the voltage sampling period is long, the calculation is large and the cost is high. Zheng et al. [5] discovered the battery power fade fault in a demonstrated EV with 96 cells in series. The proposed diagnostic method clearly identifies the cause of the power fade fault. Shannon [29] associated information with entropy and introduced the term bit as a unit of information. His proposed entropy can solve a measure of uncertainty. Nahodil [30] solved the problem of predictability in financial time series with an entropy method. Yao et al. [31] conducted an experiment to get voltage and used ensemble Shannon entropy to predict battery fault of battery connection failure. Wang [6] explained a novel voltage fault diagnosis method based on the modified Shannon entropy and found a security management strategy on the basis of Z-score approach. This paper showed the detected abnormal cell could be seen intuitively through voltage curve. And the voltage of abnormal cells was far away from its average. Besides, this modified Shannon entropy method focused on the time series iteration. However, they did not accurately locate the abnormal cell of the power battery in real-time operation.
In this study, the data are collected from the National Monitoring and Management Center (NMMC) for new energy vehicles. All cells’ voltage values at each moment are regarded as an index. Entropy weight method is implemented to obtain objective weight of each index. A new evaluation system is developed to detect cell voltage abnormity and locate the source of fault with the help of the weight. The remainder of the paper is organized as follows: Section 2 introduces the big data platform. The entropy method and fault diagnosis model are introduced in Section 3. The results and analysis of fault diagnosis approach are given in Section 4. Section 5 concludes the paper.
2. Data Acquisition
The NMMC for new energy vehicles in China is established to solve the problem of national EVs’ security while the primary security objective is to guarantee operational safety. Its collected data can be used for further research with big data techniques, such as real-time fault monitoring and safeguard system, driving behavior and energy consumption analysis. When the NMMC collects anomalous information, a fault alarm will be sent to the relevant vehicle promptly to warn the driver. Then, the running data including the anomalous statistics will be collected in the statistical statements daily, weekly and annually and the managers have access to check them. Therefore, a lot of research and analysis can lead to improvement of EV technologies. The cloud service platform architecture of big data platform for the NMMC is explained in Figure 1.
The big data platform of the NMMC is built by using a Hadoop system based on Linux and Java, providing a standardized data interface of multiple vehicle model compatibility and multi-source information fusion. It also constructs a one-stop management and distributed processing system for EV monitoring. In addition, the platform can realize administrative supervision and management. The roles it played in the management of EVs are listed in Figure 2. Based on the reliable and safe requirement, data storage platform of the NMMC is established to ensure the data security and confidentiality. For different users, the platform provides personalized service in virtue of data mining theory. It has realized data statistics, forming reports automatically and fault forecast based on a large number of EVs’ technical status analysis and forecast model. Besides, it has provided 7 × 24 h monitoring service for more than 7000 units of EVs, including taxis, buses and sanitation vehicles.
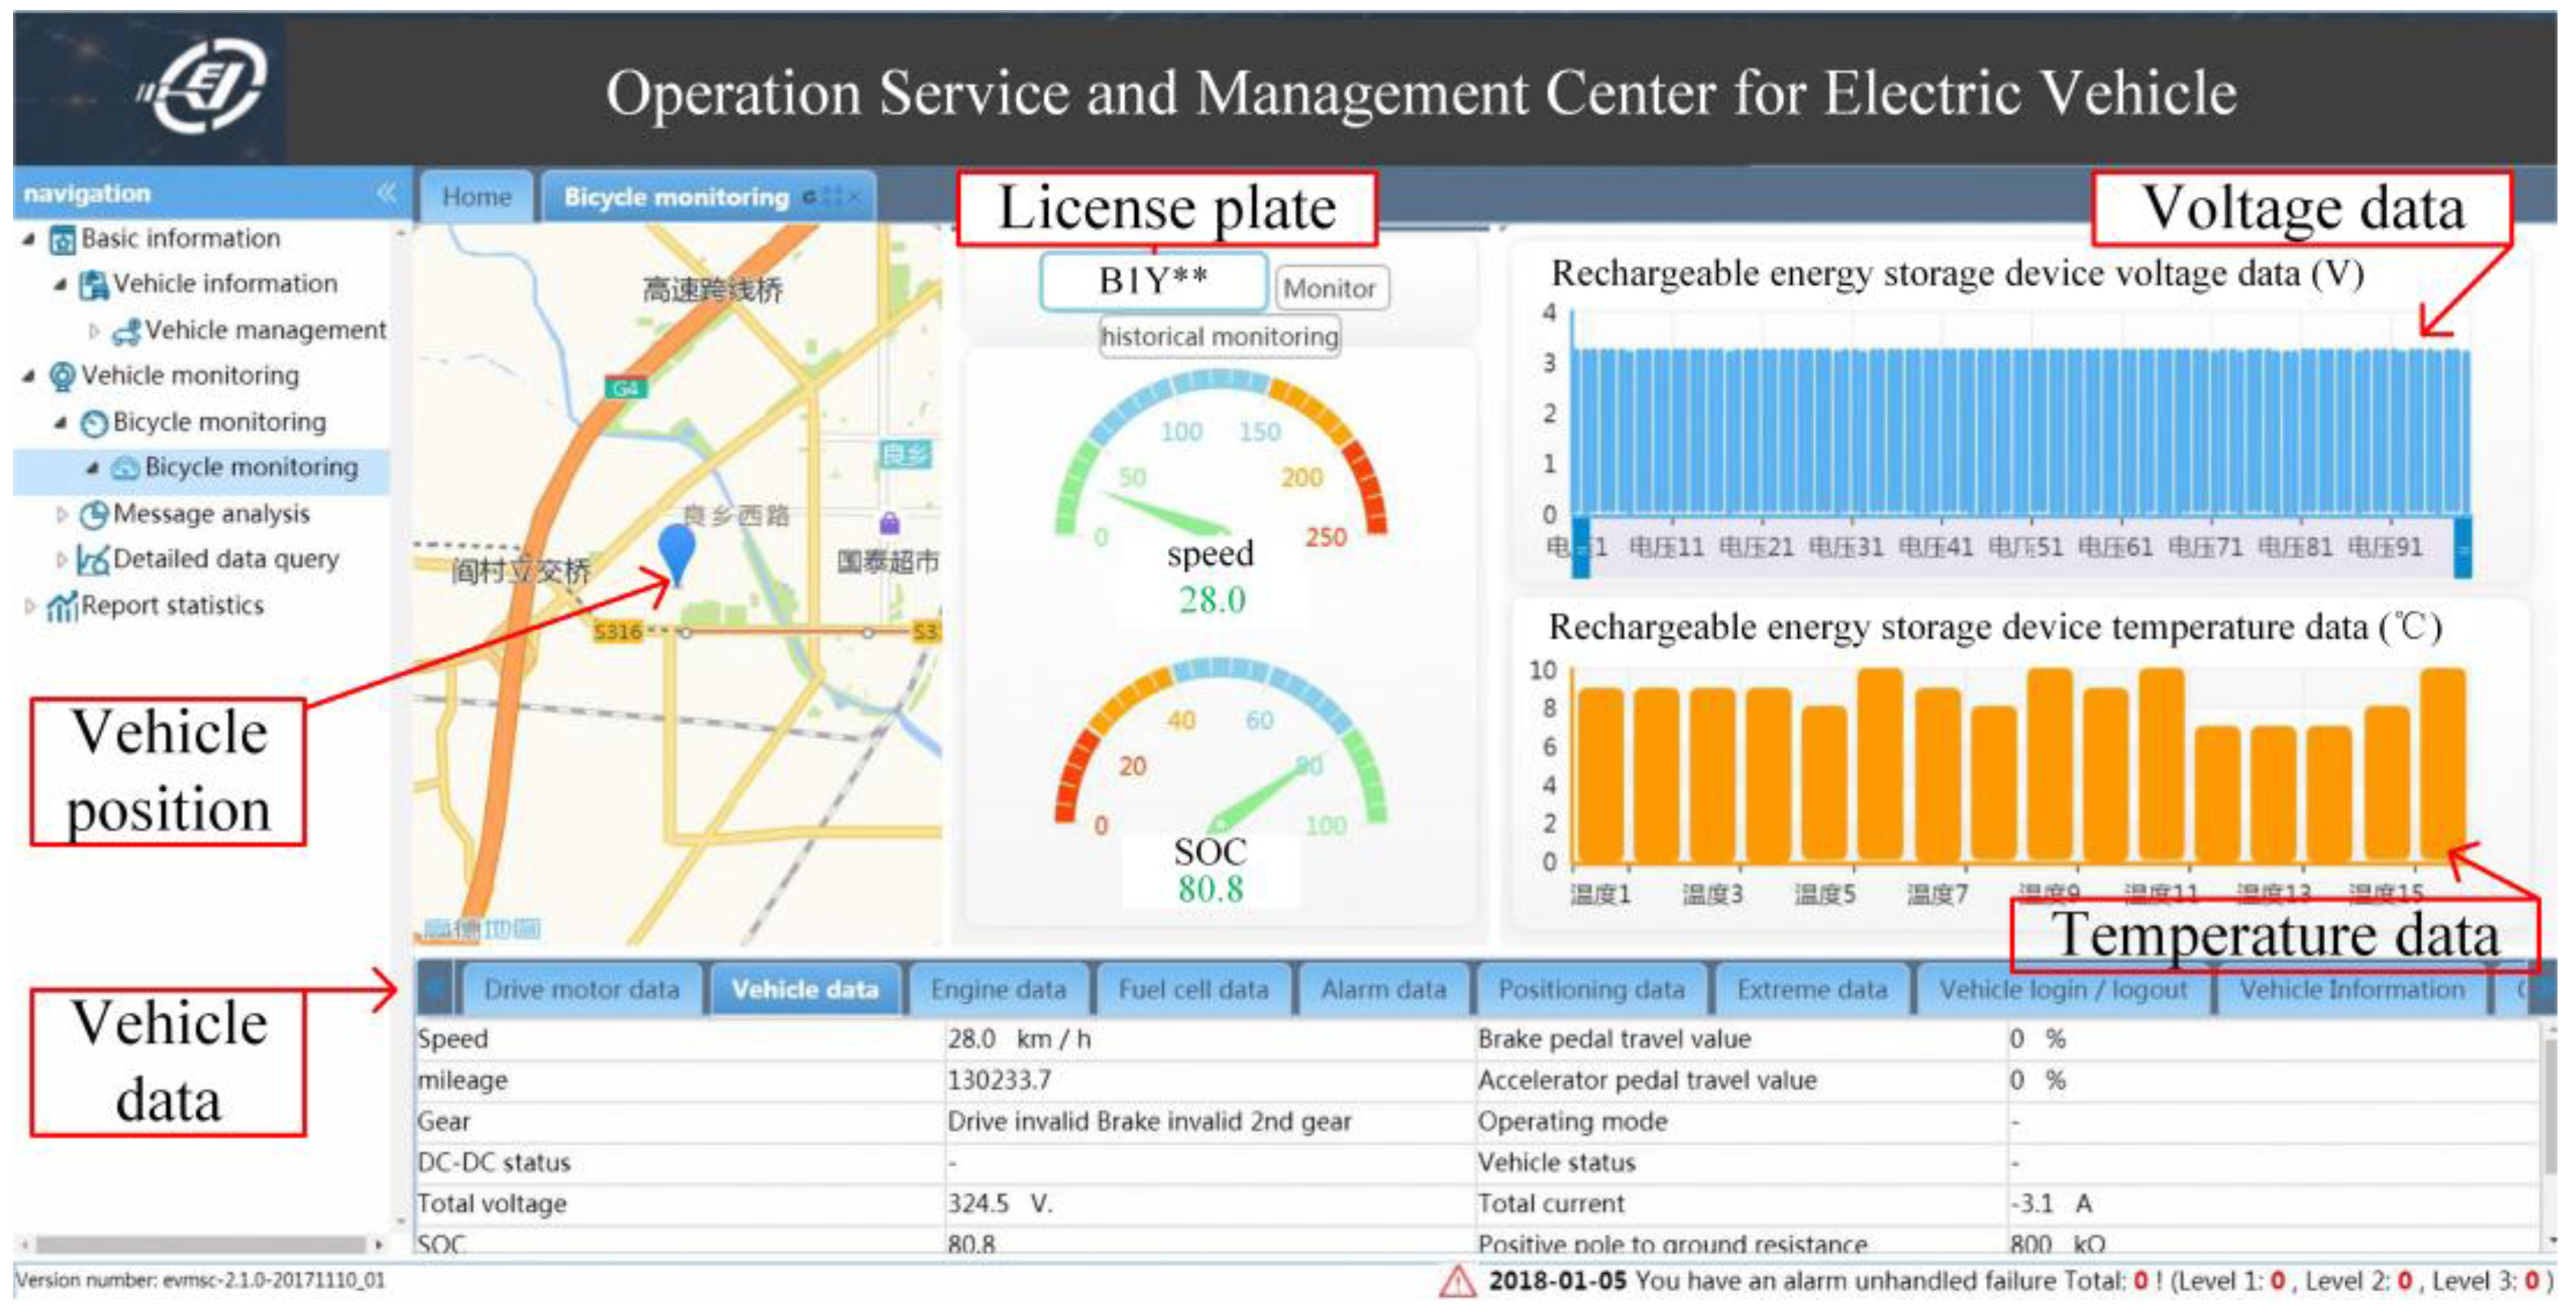
Operation Service and Management Center for Electric Vehicle (OSMC-EV) in Beijing is an important part of the NMMC. Its operation interface is shown in Figure 3. Monitoring data type is based on Chinese standard (GB/T 32960-2016) for OSMC-EV in Beijing. The data types mainly consist of two parts: static data and dynamic real-time data. Specific data items are shown in Table 1.
3. Entropy Method
Entropy is a concept in theory of communication, which was introduced to measure information by Claude Elwood Shannon in 1948 [29]. Shannon entropy is also the measurement of the ordering of one system because it can reflect the amount of information carried. The lower Shannon value indicates that the system is more orderly, which means data concentration. Thus, Shannon entropy is able to express the discrete situation of data. Since Shannon’s work in the 1940s, many related entropies found their use in other fields of science, such as battery health monitoring [31], medicine [32,33] and finance [30]. The classical equation for the Shannon entropy [29,30] is:
where is a probability of a state i for all n. And b whose common value is 2, is a base of the logarithm. When b = 2, the units of entropy are also commonly referred to as bits. Entropy has the following properties:
- (1)
- Monotonicity, that is, the event brings less entropy, with its possibility raising. From the point of view of information theory, there is no uncertainty about certain event;
- (2)
- Non-negativity, that is, entropy can’t be negative;
- (3)
- Summative, that is, the total uncertainty measurement of the multiple simultaneous random events can be expressed as the sum of the each.
A probability distribution of discrete random variables X is:
Its entropy H can be expressed by Equation (3):
where H(X) is the Shannon entropy, p(xi) is a probability of a state xi for all i.
As entropy depends on more parameters of a probability distribution than variance and is related to higher-order moments, it may offer a better characterization of uncertainty and better predictions. Entropy is highest for uniformly distributed outcomes and zero for a sure outcome. Using entropy method is to detect fault voltage. Larger entropy indicates the data is scattered. On the contrary, the smaller Shannon entropy value means that fewer data changes.
3.1. Entropy Weight Method
A scientific and quantitative evaluation model based on entropy is established to obtain objective weight, getting the equivalence of entropy and weight. When the larger weight of an index for evaluation object will have a significant effect on the evaluation. If the cell voltage is exactly the same value, the weight at this index will be zero without any help for evaluation. A new evaluation system based on entropy is developed to detect voltage abnormity. It can be used in the evaluating problems with different kinds of indexes and also give a single evaluating object a quantitative value [34]. According to the entropy weight method, each time is regarded as an index which contains the voltage value of each cell. First, matrix can be built by the collected voltage data in time series from OSMC-EV. The mode and standard deviation of all cell voltages can be calculated at each index :
where are total number of cell and index respectively. represents the voltage value of the -th cell at index . And .
The distance between the mode as the center of mass and the standard deviation for voltage is regarded as the standard of the partition interval at index. We get the statistical matrix by falling into these five intervals whose settings are derived from 3σ-rule:
where , , , , .
The probability matrix is obtained by calculating the probability of each interval by Equation (6):
where :
The entropy describes the difference of all cells’ voltages at each index . Entropy of the j index is explained by Equation (8). Its value is closely related to the evaluation result. When the battery voltage has a perfect consistency, is equal to 0, which does not make any sense for distinguishing battery performance. A larger value of contributes to a greater weight in the battery cell evaluation system:
where .
The weight value of each index is also called contribution rate expressed by , which indicates the importance to the evaluation system. The is calculated as follows:
The comprehensive score of each cell can be calculated by Equation (10). The contribution rate of all cells under the same index is consistent. The difference between the comprehensive scores for all cells is mainly caused by initial voltage value , which fully reflects the difference between data. The average comprehensive score for cells can be calculated by Equation (11):
A larger difference between the comprehensive score of each cell and average can locate an abnormal cell:
The 95th percentile of differences for all cells is , which can be calculated by the Equation (13). If is greater than , the number of the abnormal cell is . The battery abnormity diagnosis evaluation system will be established:
where Q is equal to 95.
3.2. Fault Diagnosis Model
Outliers and dispersion affect the values of the mean and standard deviation. It is relatively easy to select and locate abnormal data for the normal distribution. When calculating the standard deviation, we find that the values within three standard deviations of the mean account for 99.73% of the set in statistics. 0.27% of the set is defined as abnormal data.
The method of using 3σ-rule for normal distribution data is efficient to test abnormal data, and it has a great advantage in engineering practice. However, cell voltage data don’t obey a normal distribution because they are not random variables under the interaction between cells. Facing this situation a new abnormal battery fault diagnosis method is required to find an abnormal cell. Thus, a battery fault diagnosis model is established for different distributions, as shown in Figure 4.
4. Discussion
4.1. Data Distribution
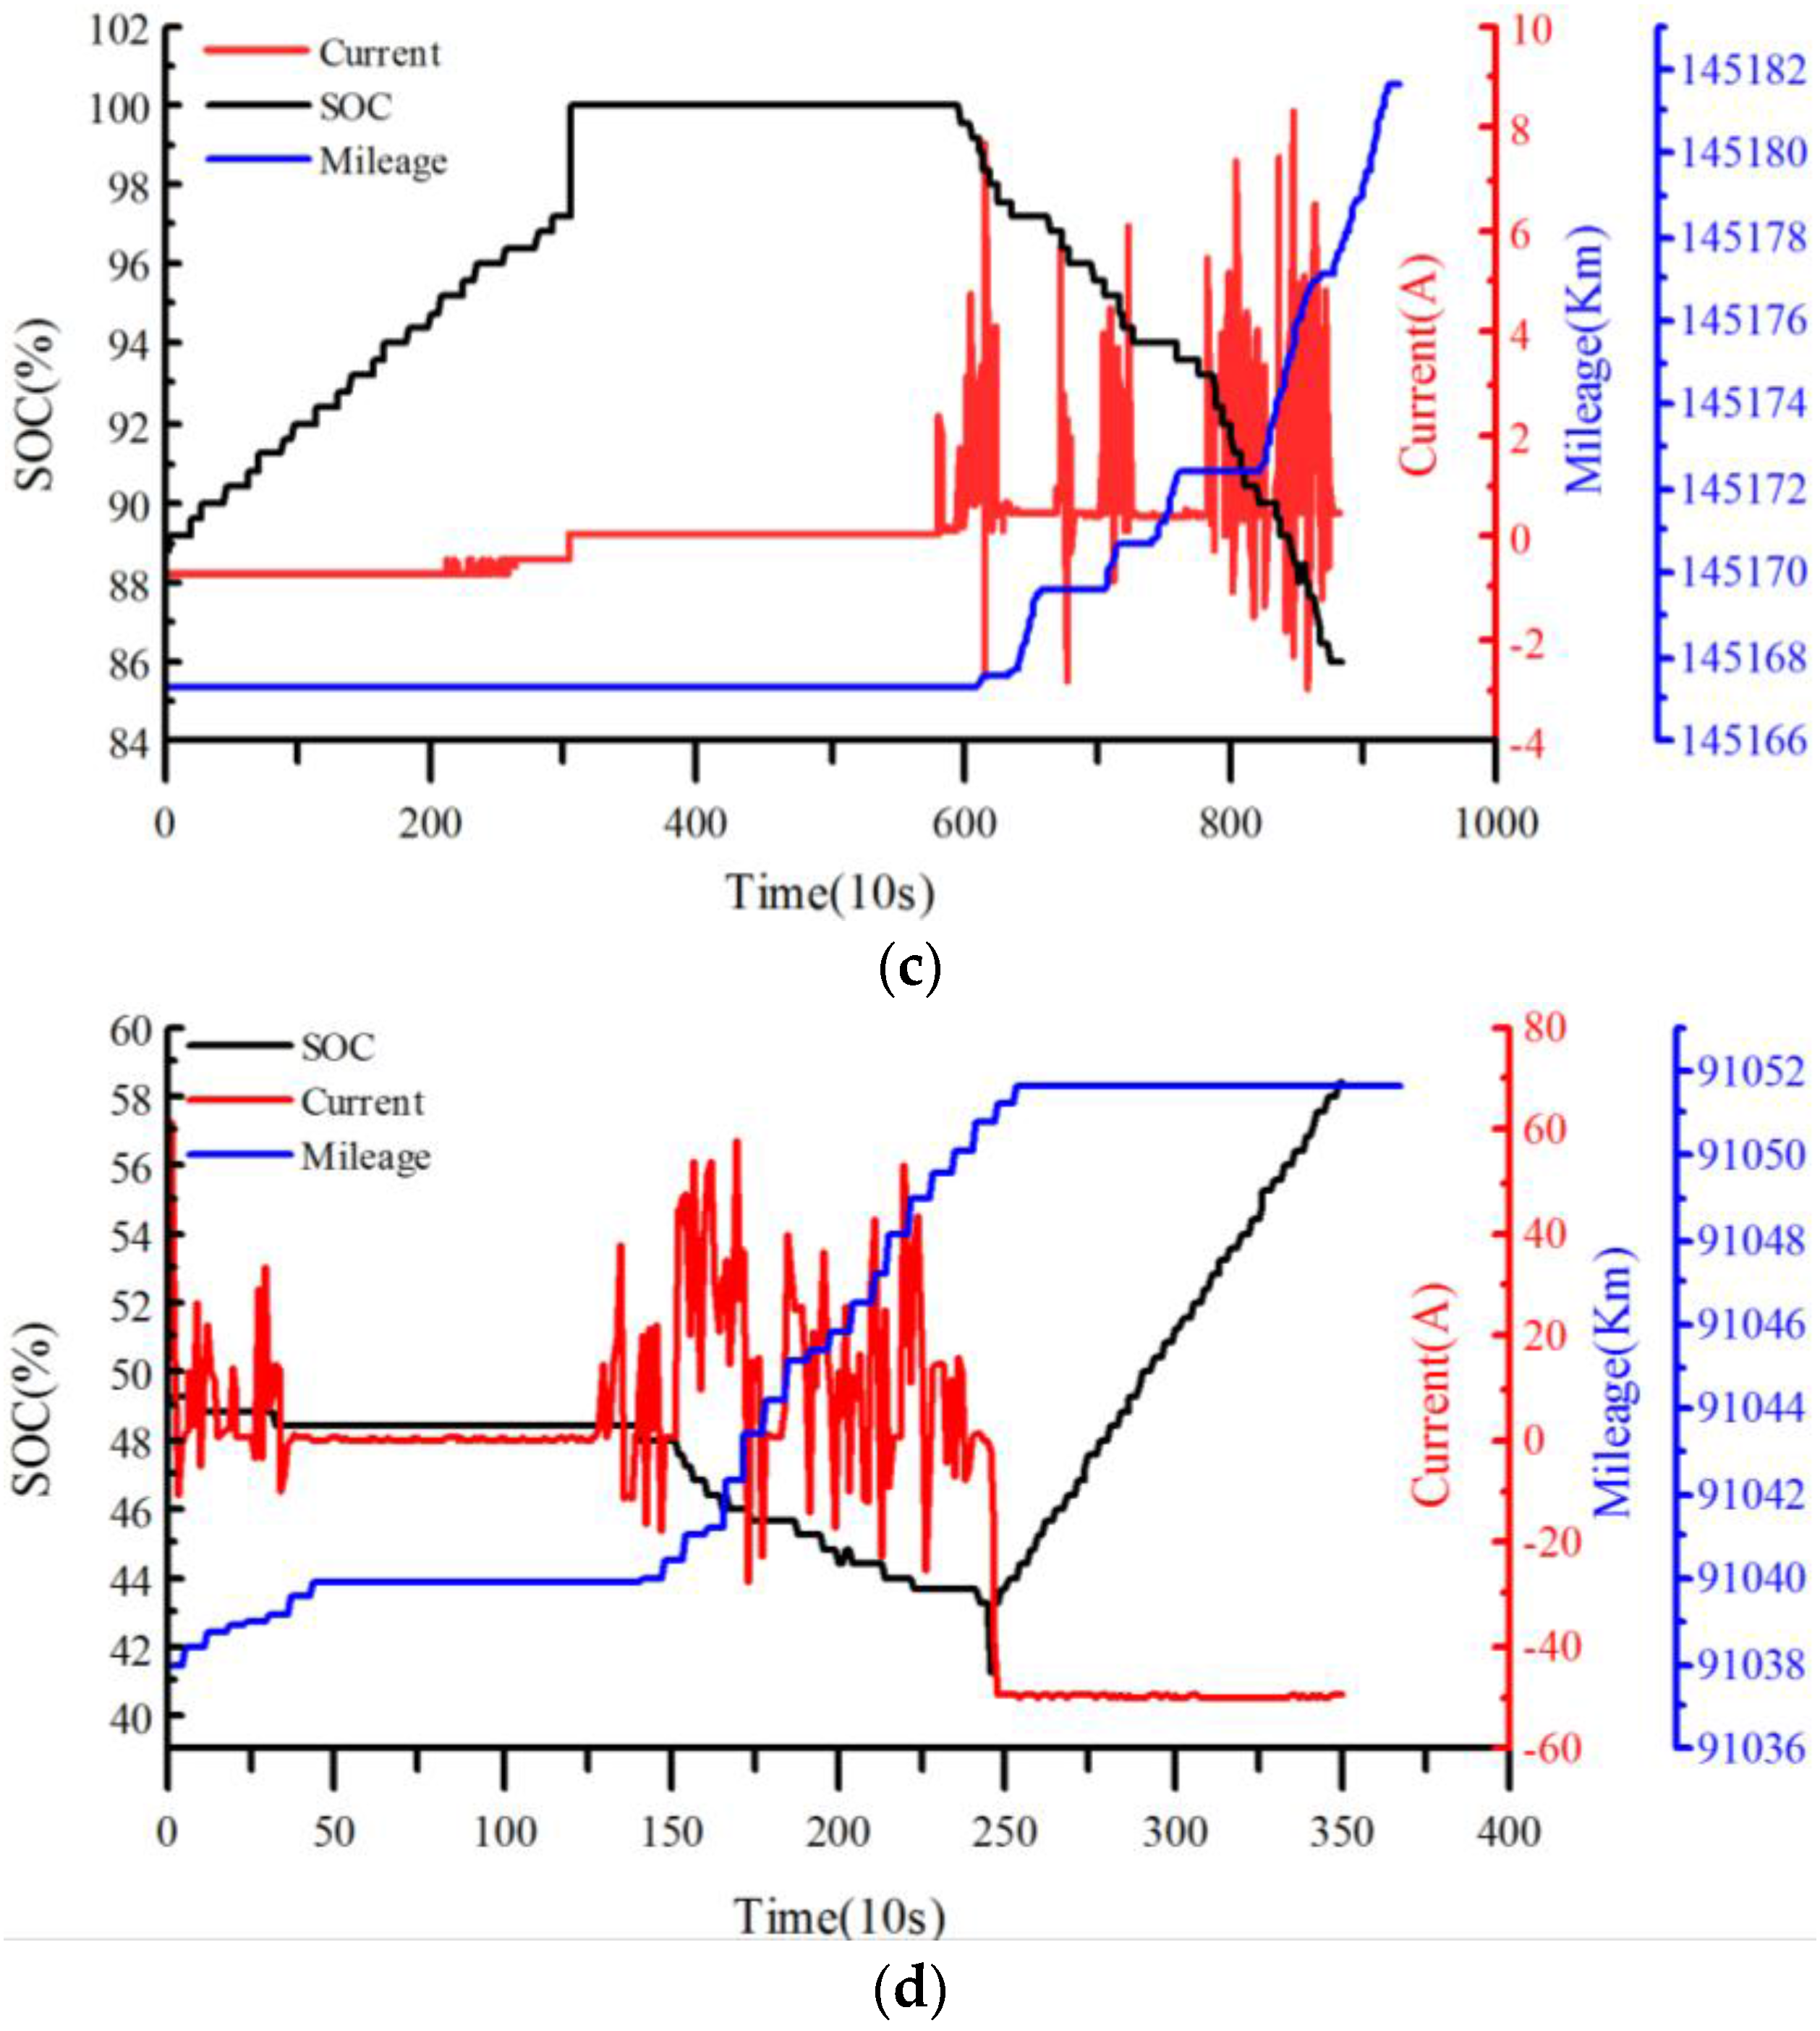
Two cars are selected from OSMC-EVs. Vehicle 1 and Vehicle 2 adopt lithium iron phosphate (LiFePO4) batteries to supply power, and their battery pack consists of 100 prismatic battery cells. What is more, their types are EV150 made in Baic International Corporation (Beijing, China) and E30 made in Changan Automobile Co., Ltd. (Chongqing, China). All the processed data come from the real-time running vehicles without any influence by experimental or human factors, and the sampling frequency is 0.1 Hertz. We get voltage data of Vehicle 1 on 30 December 2016, called period 1, so the voltage curve of Vehicle 1 can be obtained as shown in Figure 5a. We get the voltage curve of Vehicle 2 on 9 May 2016 (Figure 5b). At the same time, the variation curves of current, and mileage of Vehicle 1 and Vehicle 2 are shown in Figure 5c,d separately. The data curve could show vehicle running status. It is clearly observed from the graph that the mileage increases gradually, the SOC decreases gradually, and the current appears to fluctuate significantly in the driving state. During the constant current charging stage, the SOC increases and the mileage is invariable.
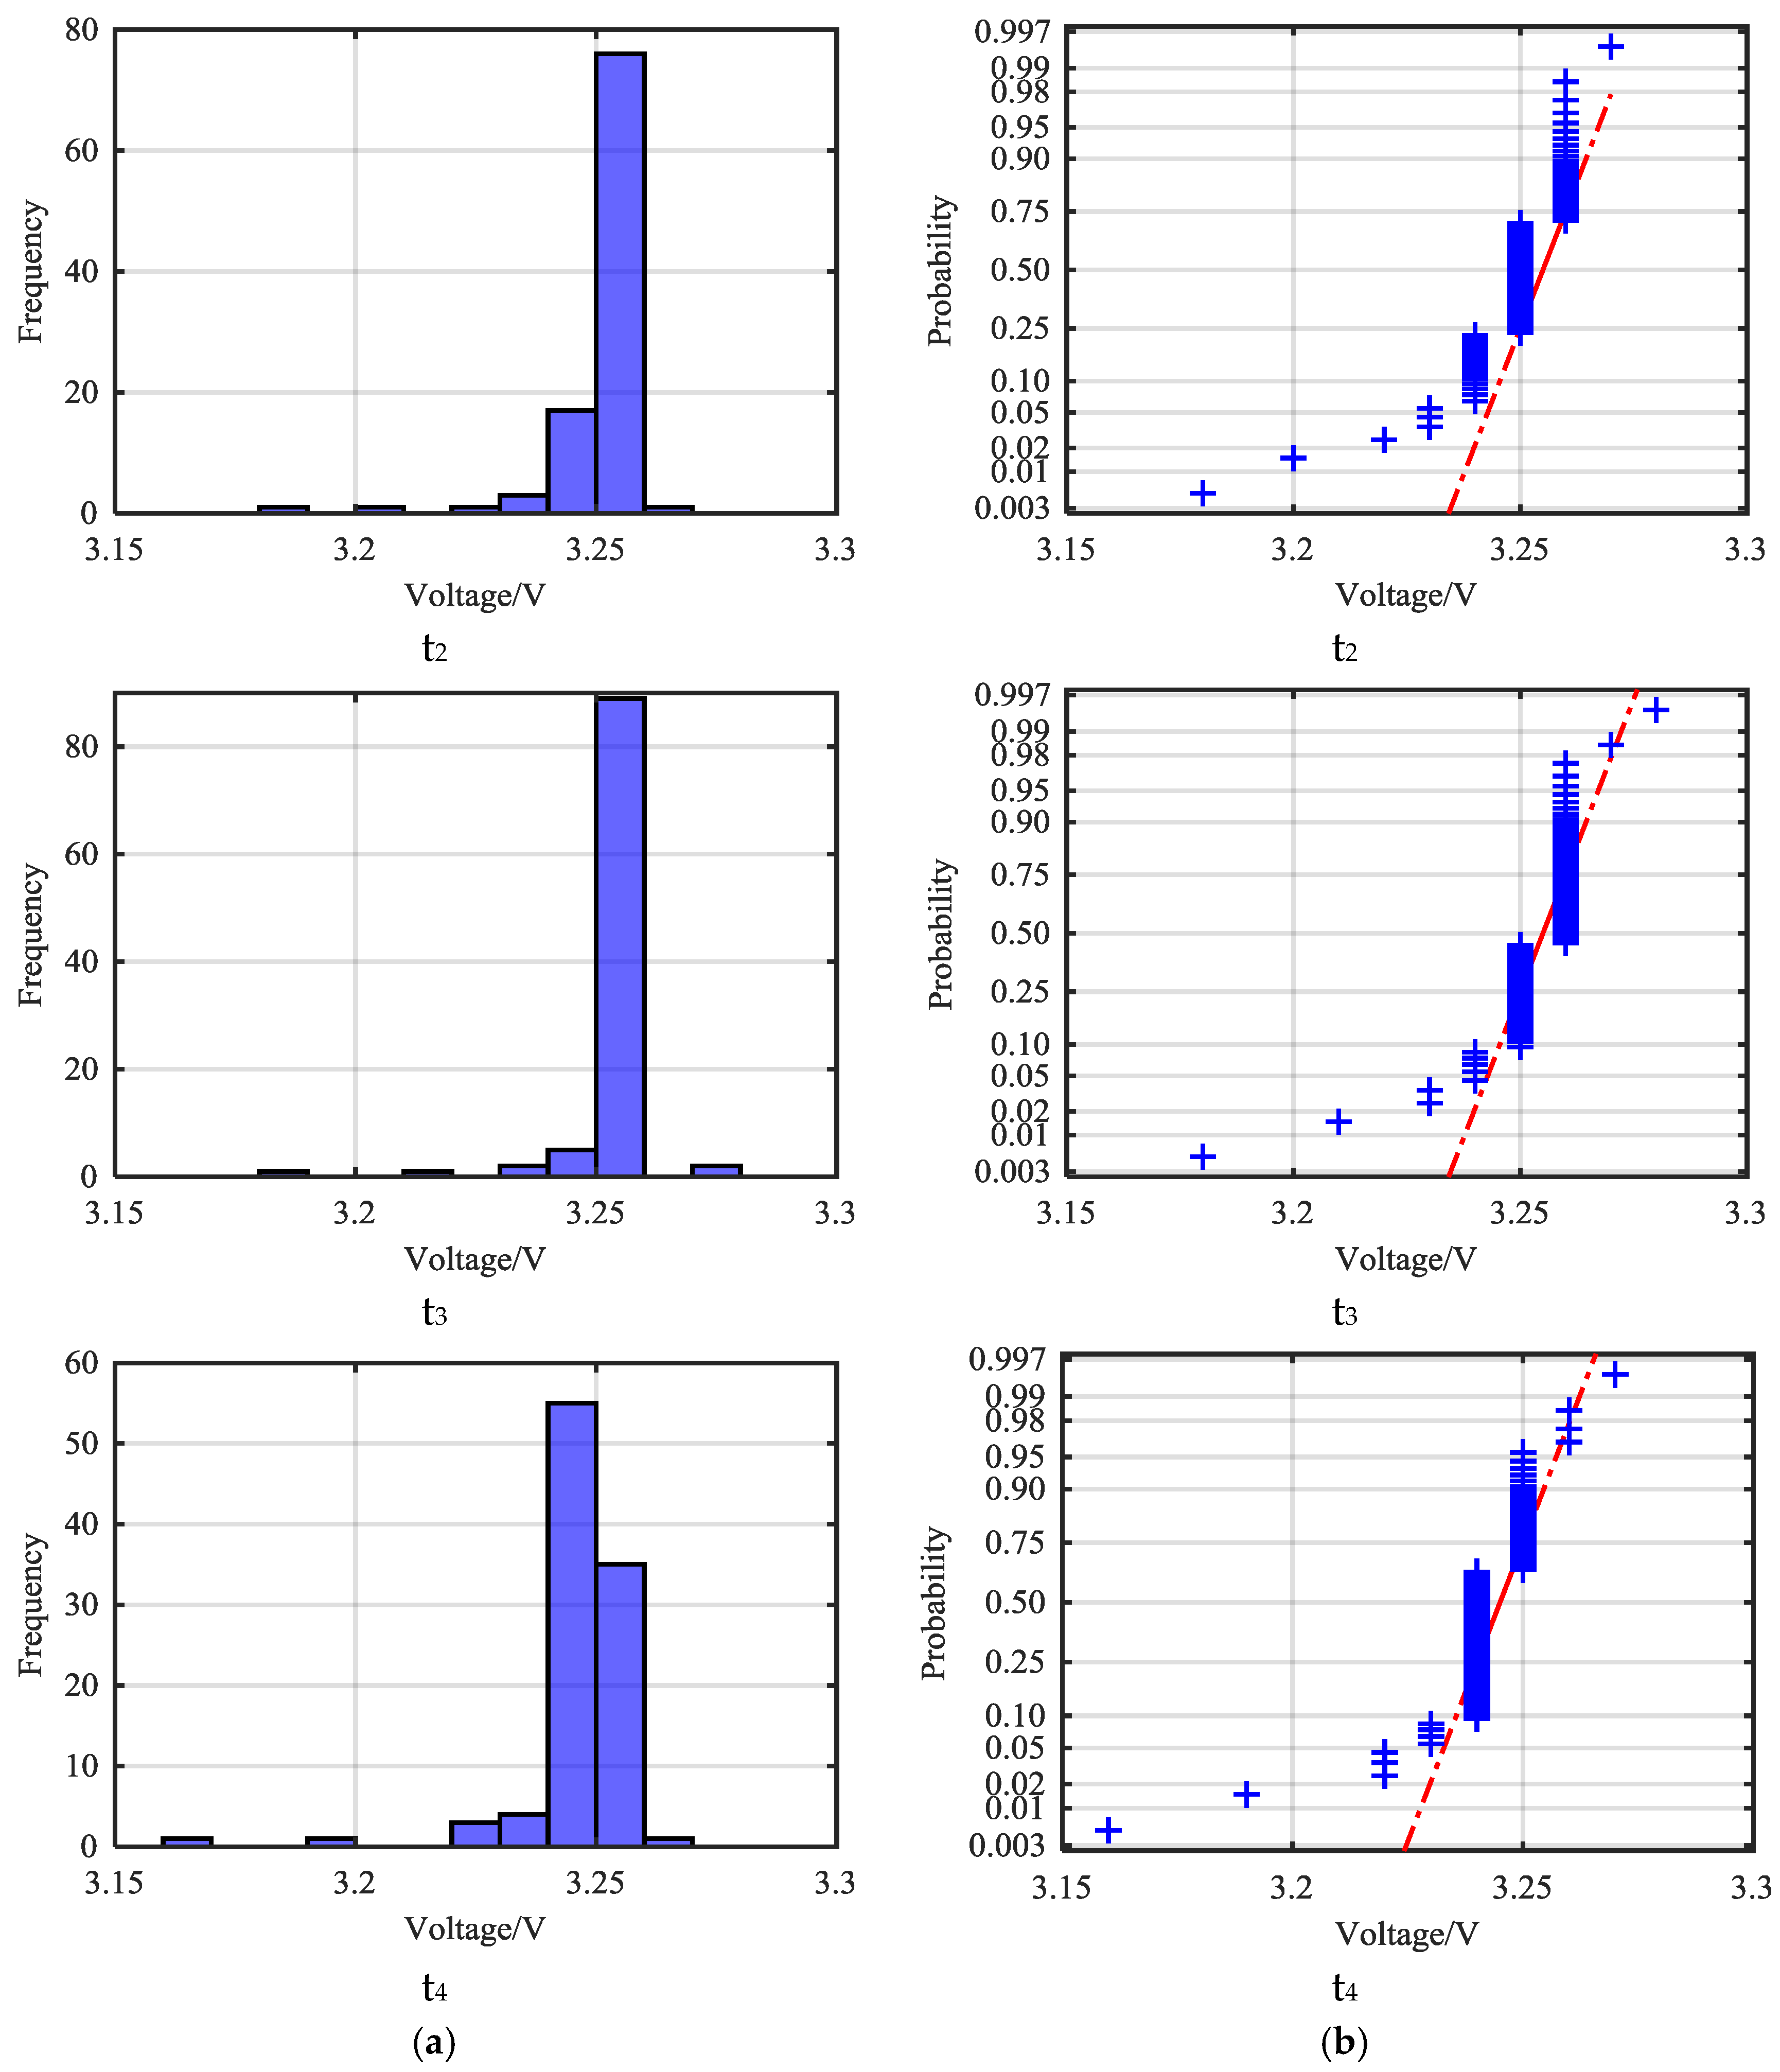
The voltage data of Vehicle 2 are randomly selected at different times, and their histograms of the frequency distribution are shown in Figure 6a. Normal probability plots are used to visually assess whether the sample data obey a normal distribution in Figure 6b. If the sample data has a normal distribution, they will appear along the reference line. In fact, the plot indicates that the data don’t follow a normal distribution. Therefore, the 3σ-rule application is very inaccurate.
4.2. Validation Verification
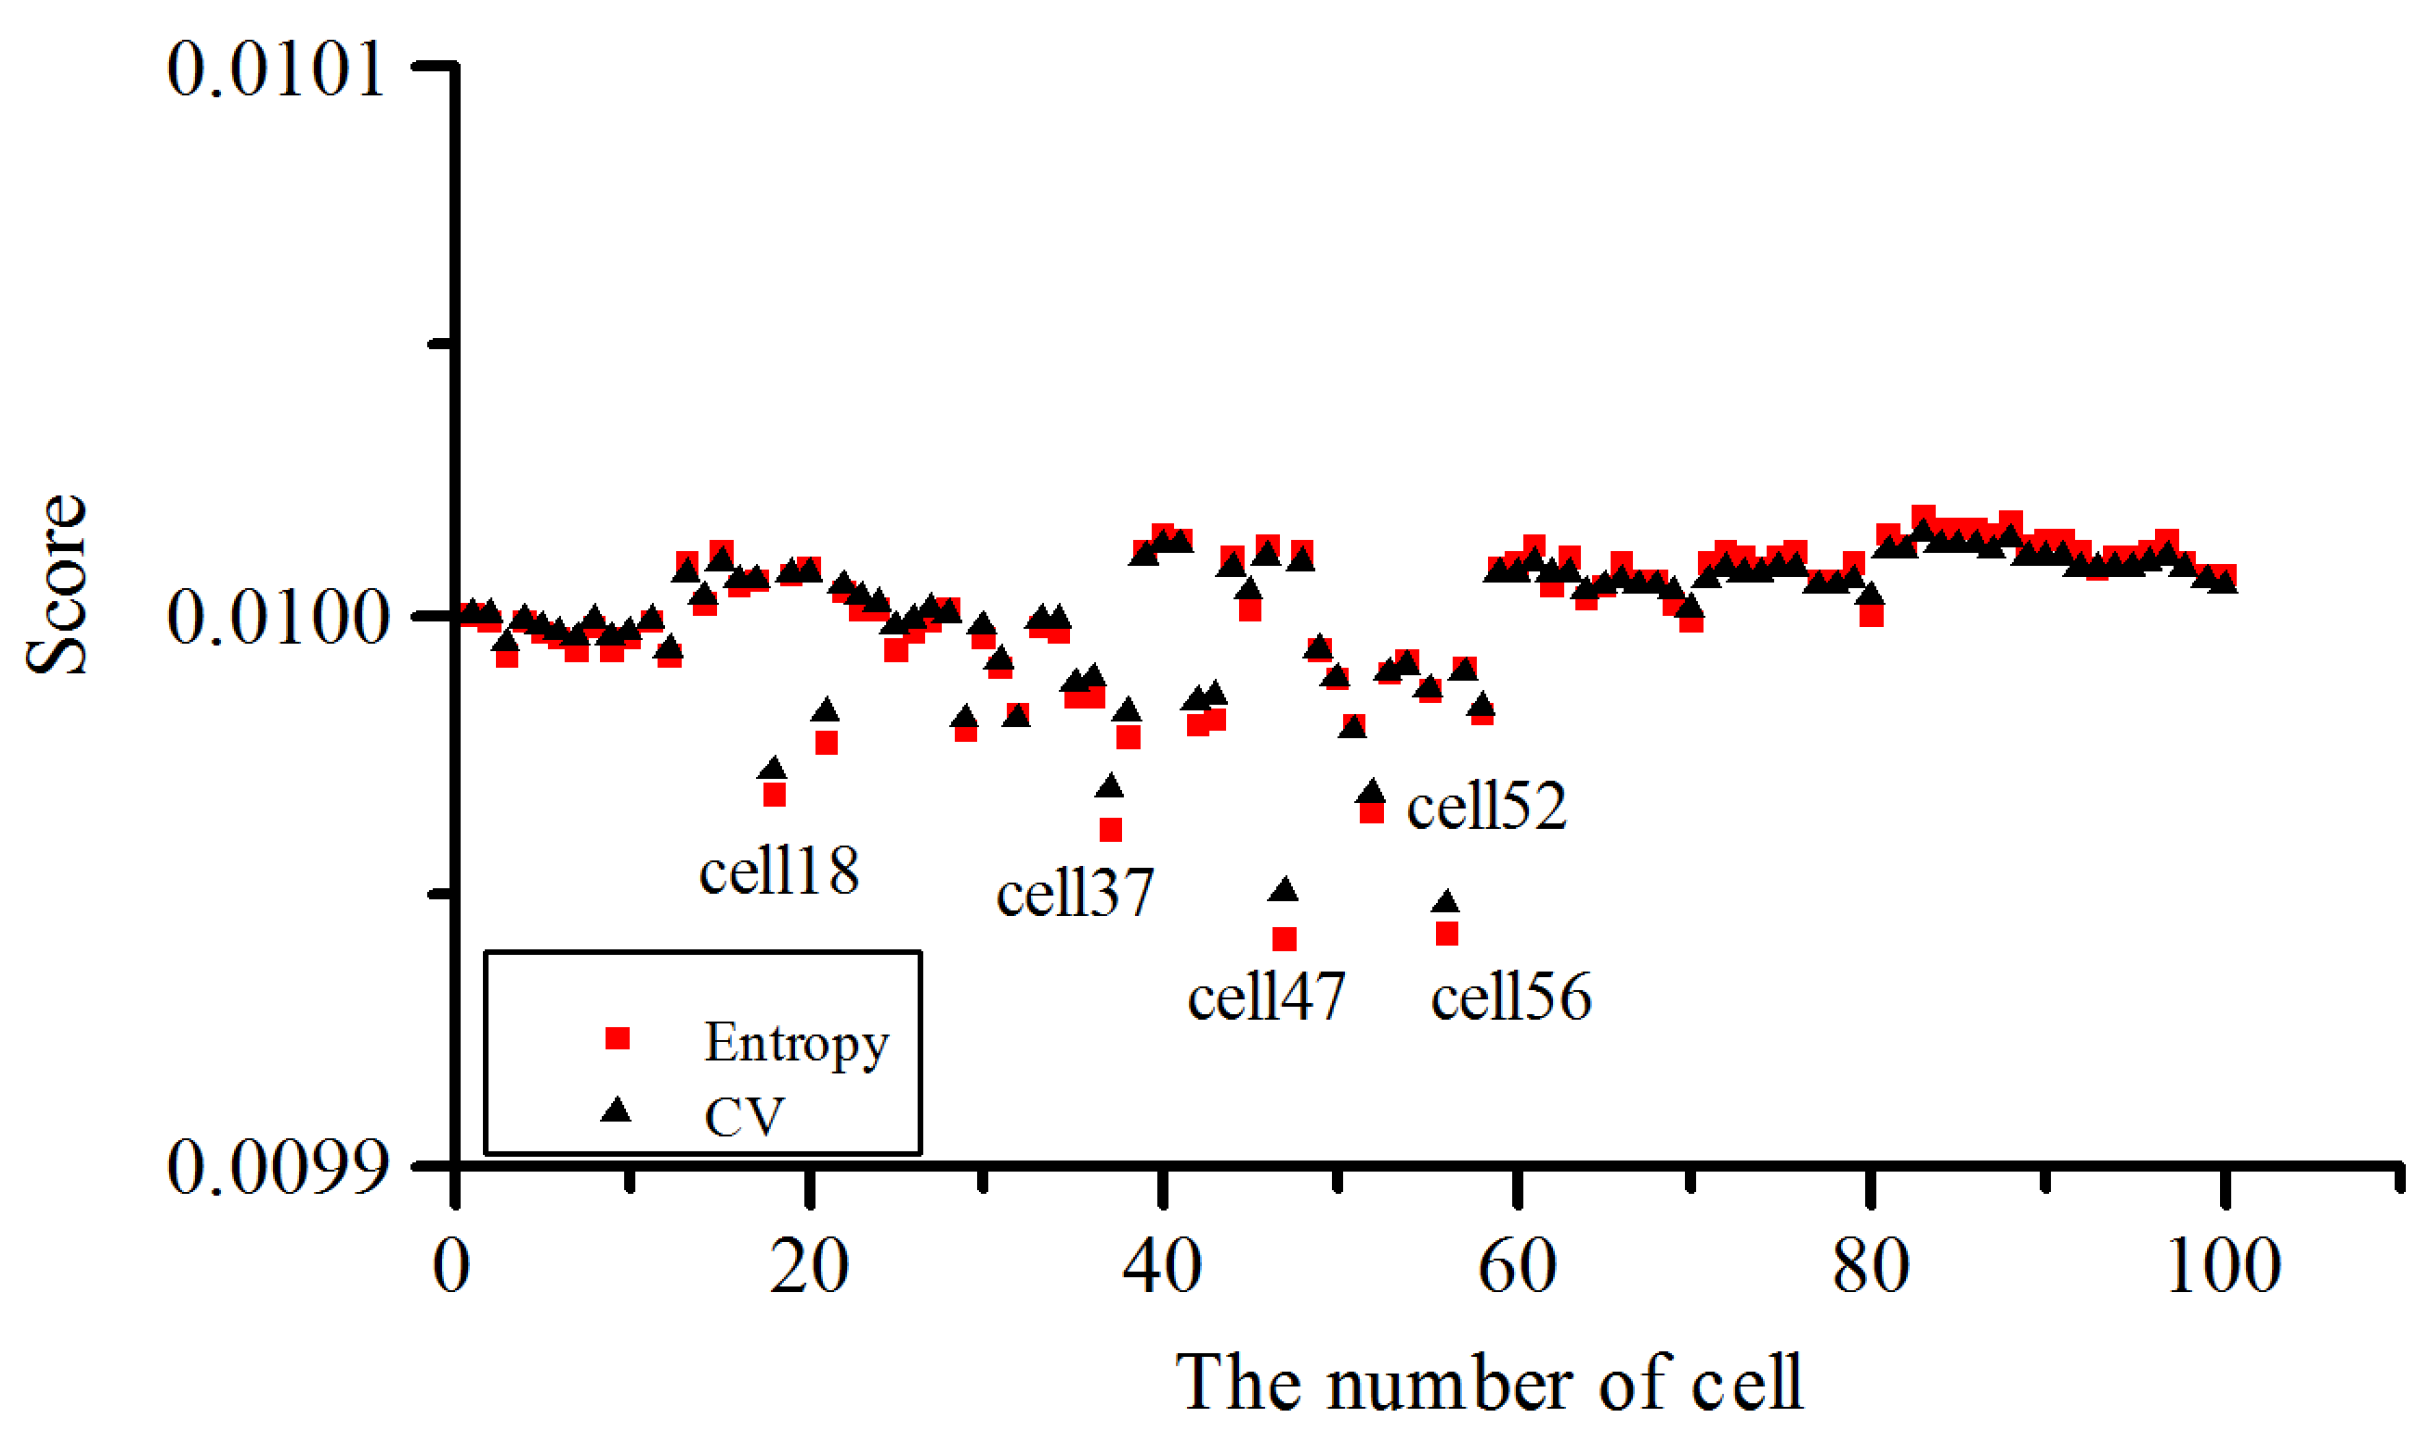
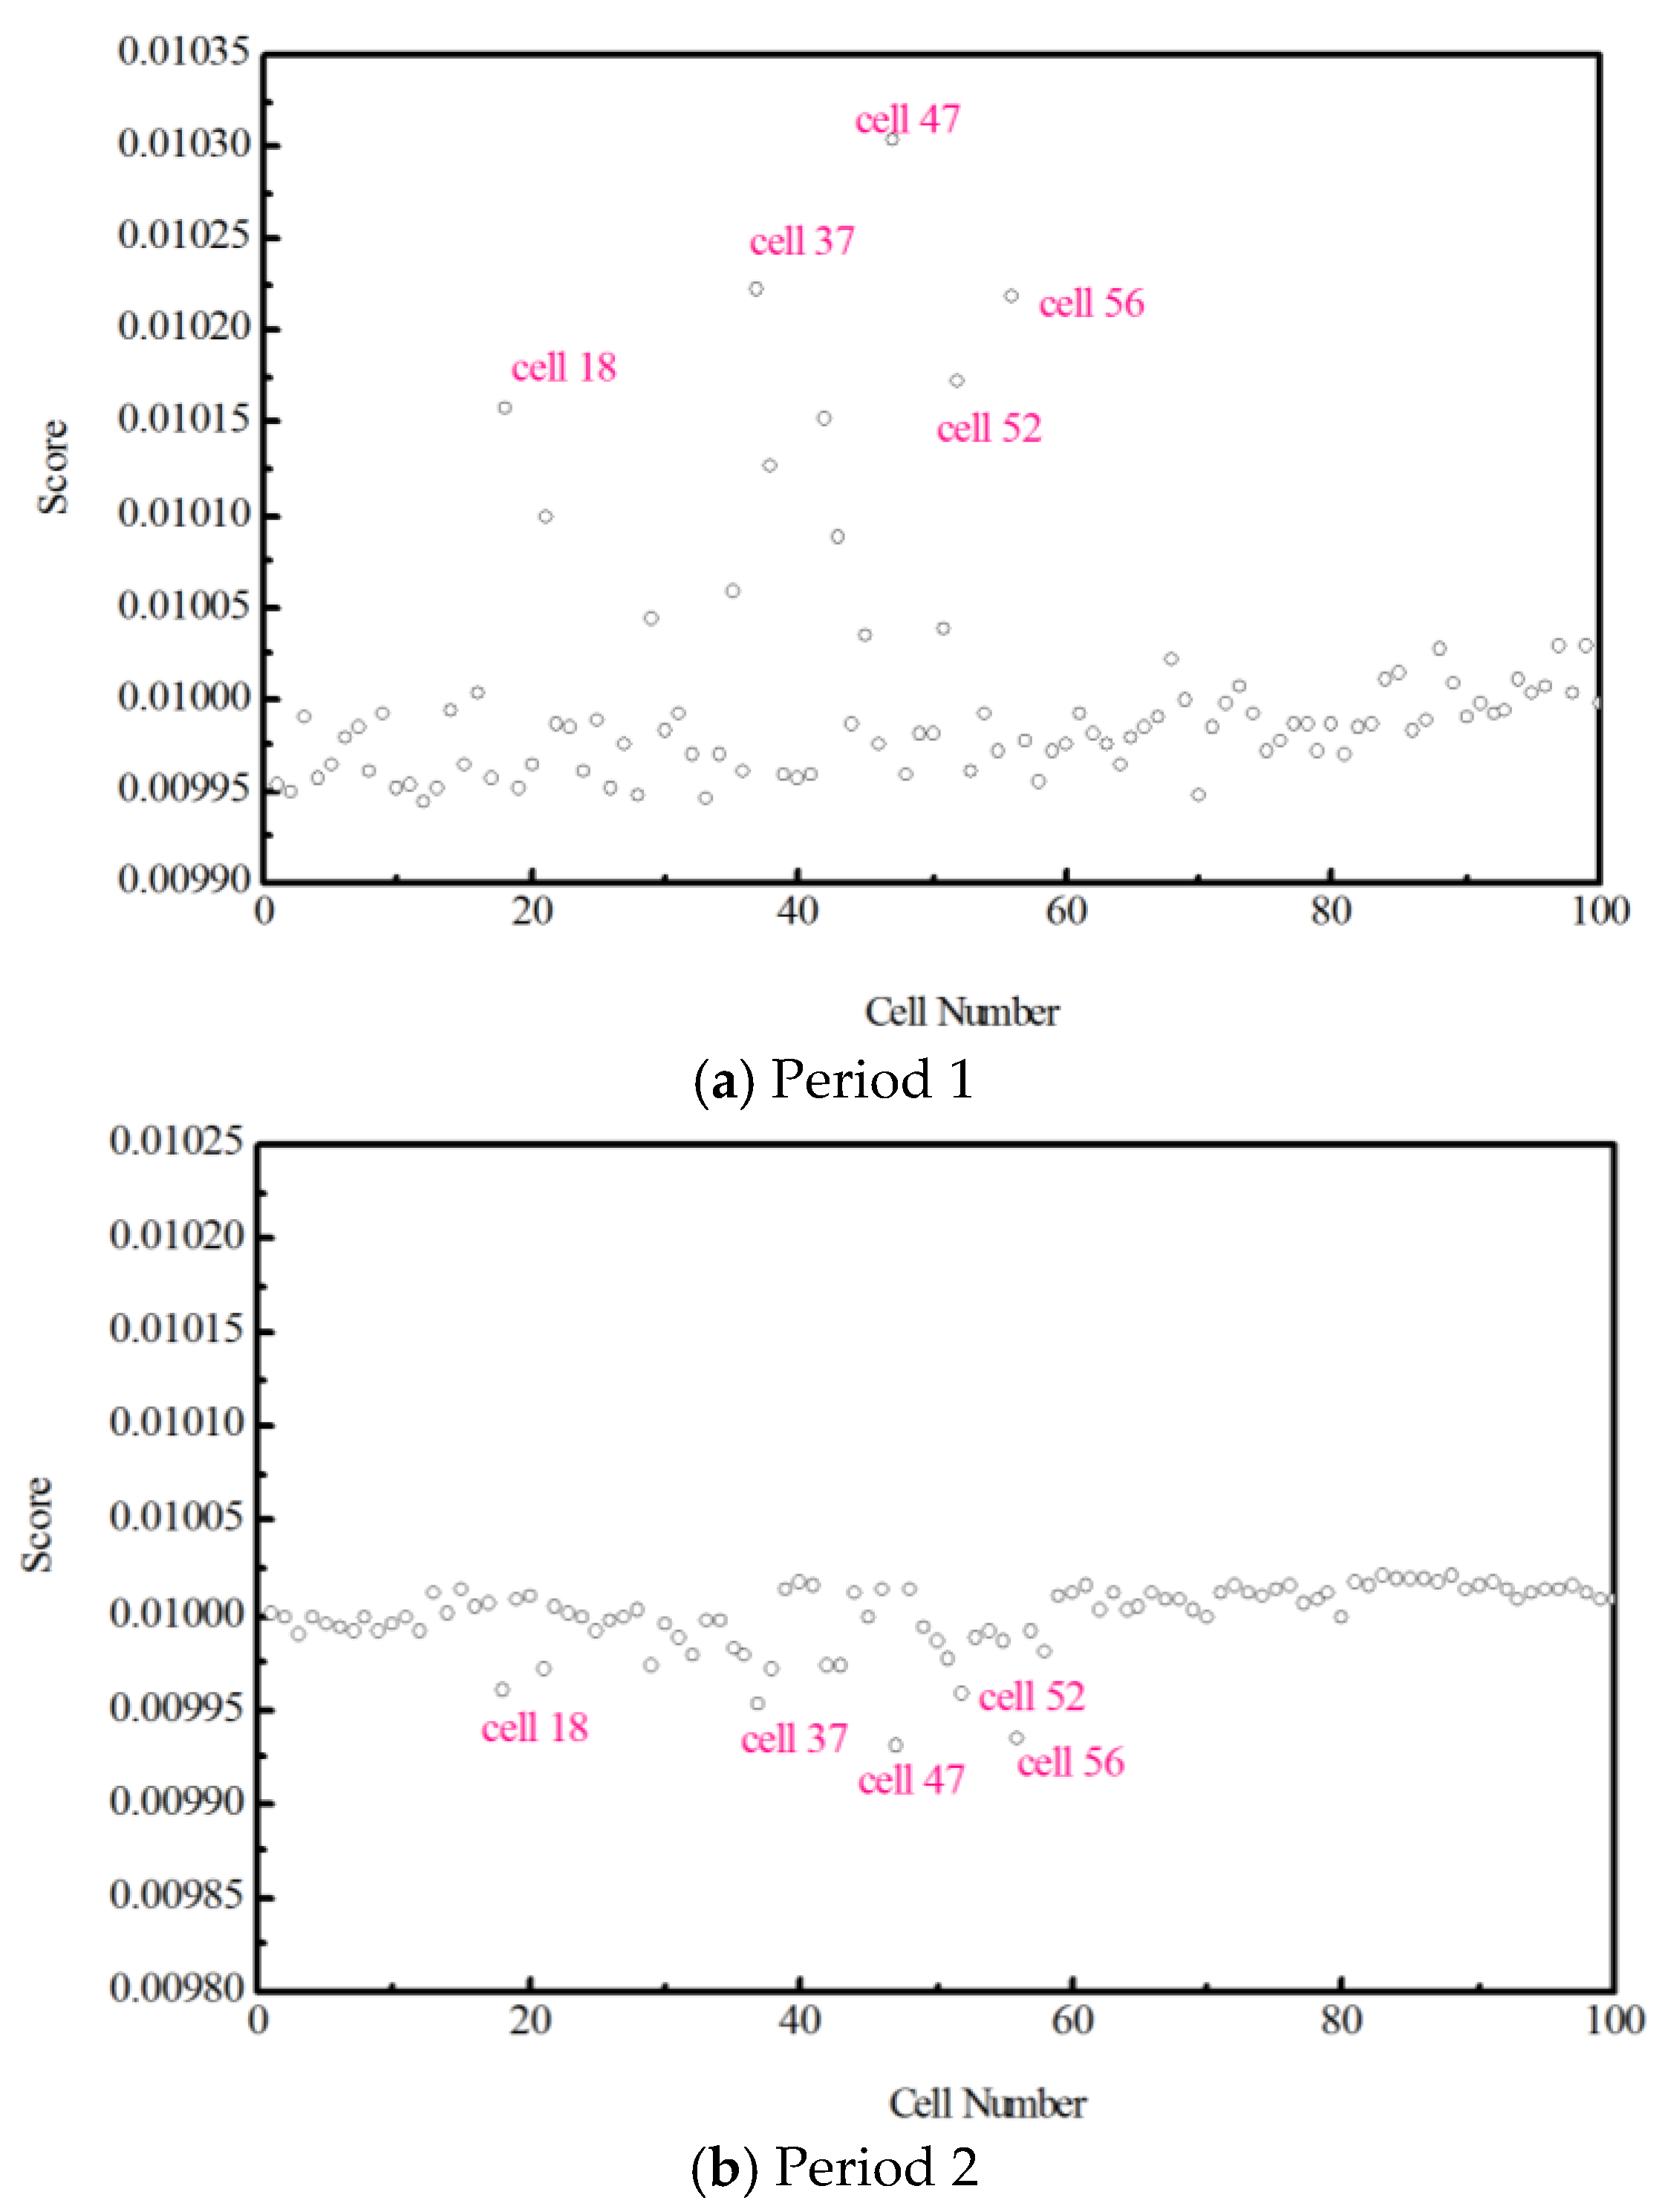
Vehicle 1 has an obvious over-voltage warning during the selected period, because the battery voltages for more than half of the cells are above 3.65 V, exceeding the set threshold voltage (3.6 V). The preliminary analysis may be triggered by accidental factors because the over-voltage warning disappears in a short time in Figure 5a. According to the method of voltage abnormity diagnosis, the score can be calculated based on entropy weight method as shown in Figure 7a. It can be discerned that anomaly occurs in several cells such as cell 47, cell 56, cell 37, cell 52, cell 18. This can also be confirmed by Table 2 ( ranges from high to low). Abnormal cells can be accurately located by entropy weight method.
In order to ascertain whether cell47 has always been abnormal, voltage data of Vehicle 1 are got from OSMC-EVs in Beijing on 12 October 2016 called period 2. Figure 8a shows the voltage curve of Vehicle 2. With voltage abnormity diagnosis method, Figure 7b shows the score distribution of all cells. As shown in Figure 7b, cell 47, cell 56, cell 37, cell 52, cell 18 are obviously different from other cells by Equation (9). We can see that the score of cell 47 obviously deviates from the average. Compared to Figure 5c and Figure 8b, we find the driving conditions of Vehicle 2 during period 2 are more complicated. Furthermore, in the first period is much larger than that in the second period, which indicates that abnormality of the cell 47 becomes noticeable over time in Table 3. There is always a voltage anomaly in cell 47 in these two periods, which verifies the validity.
4.3. Comparison with Traditional Methods
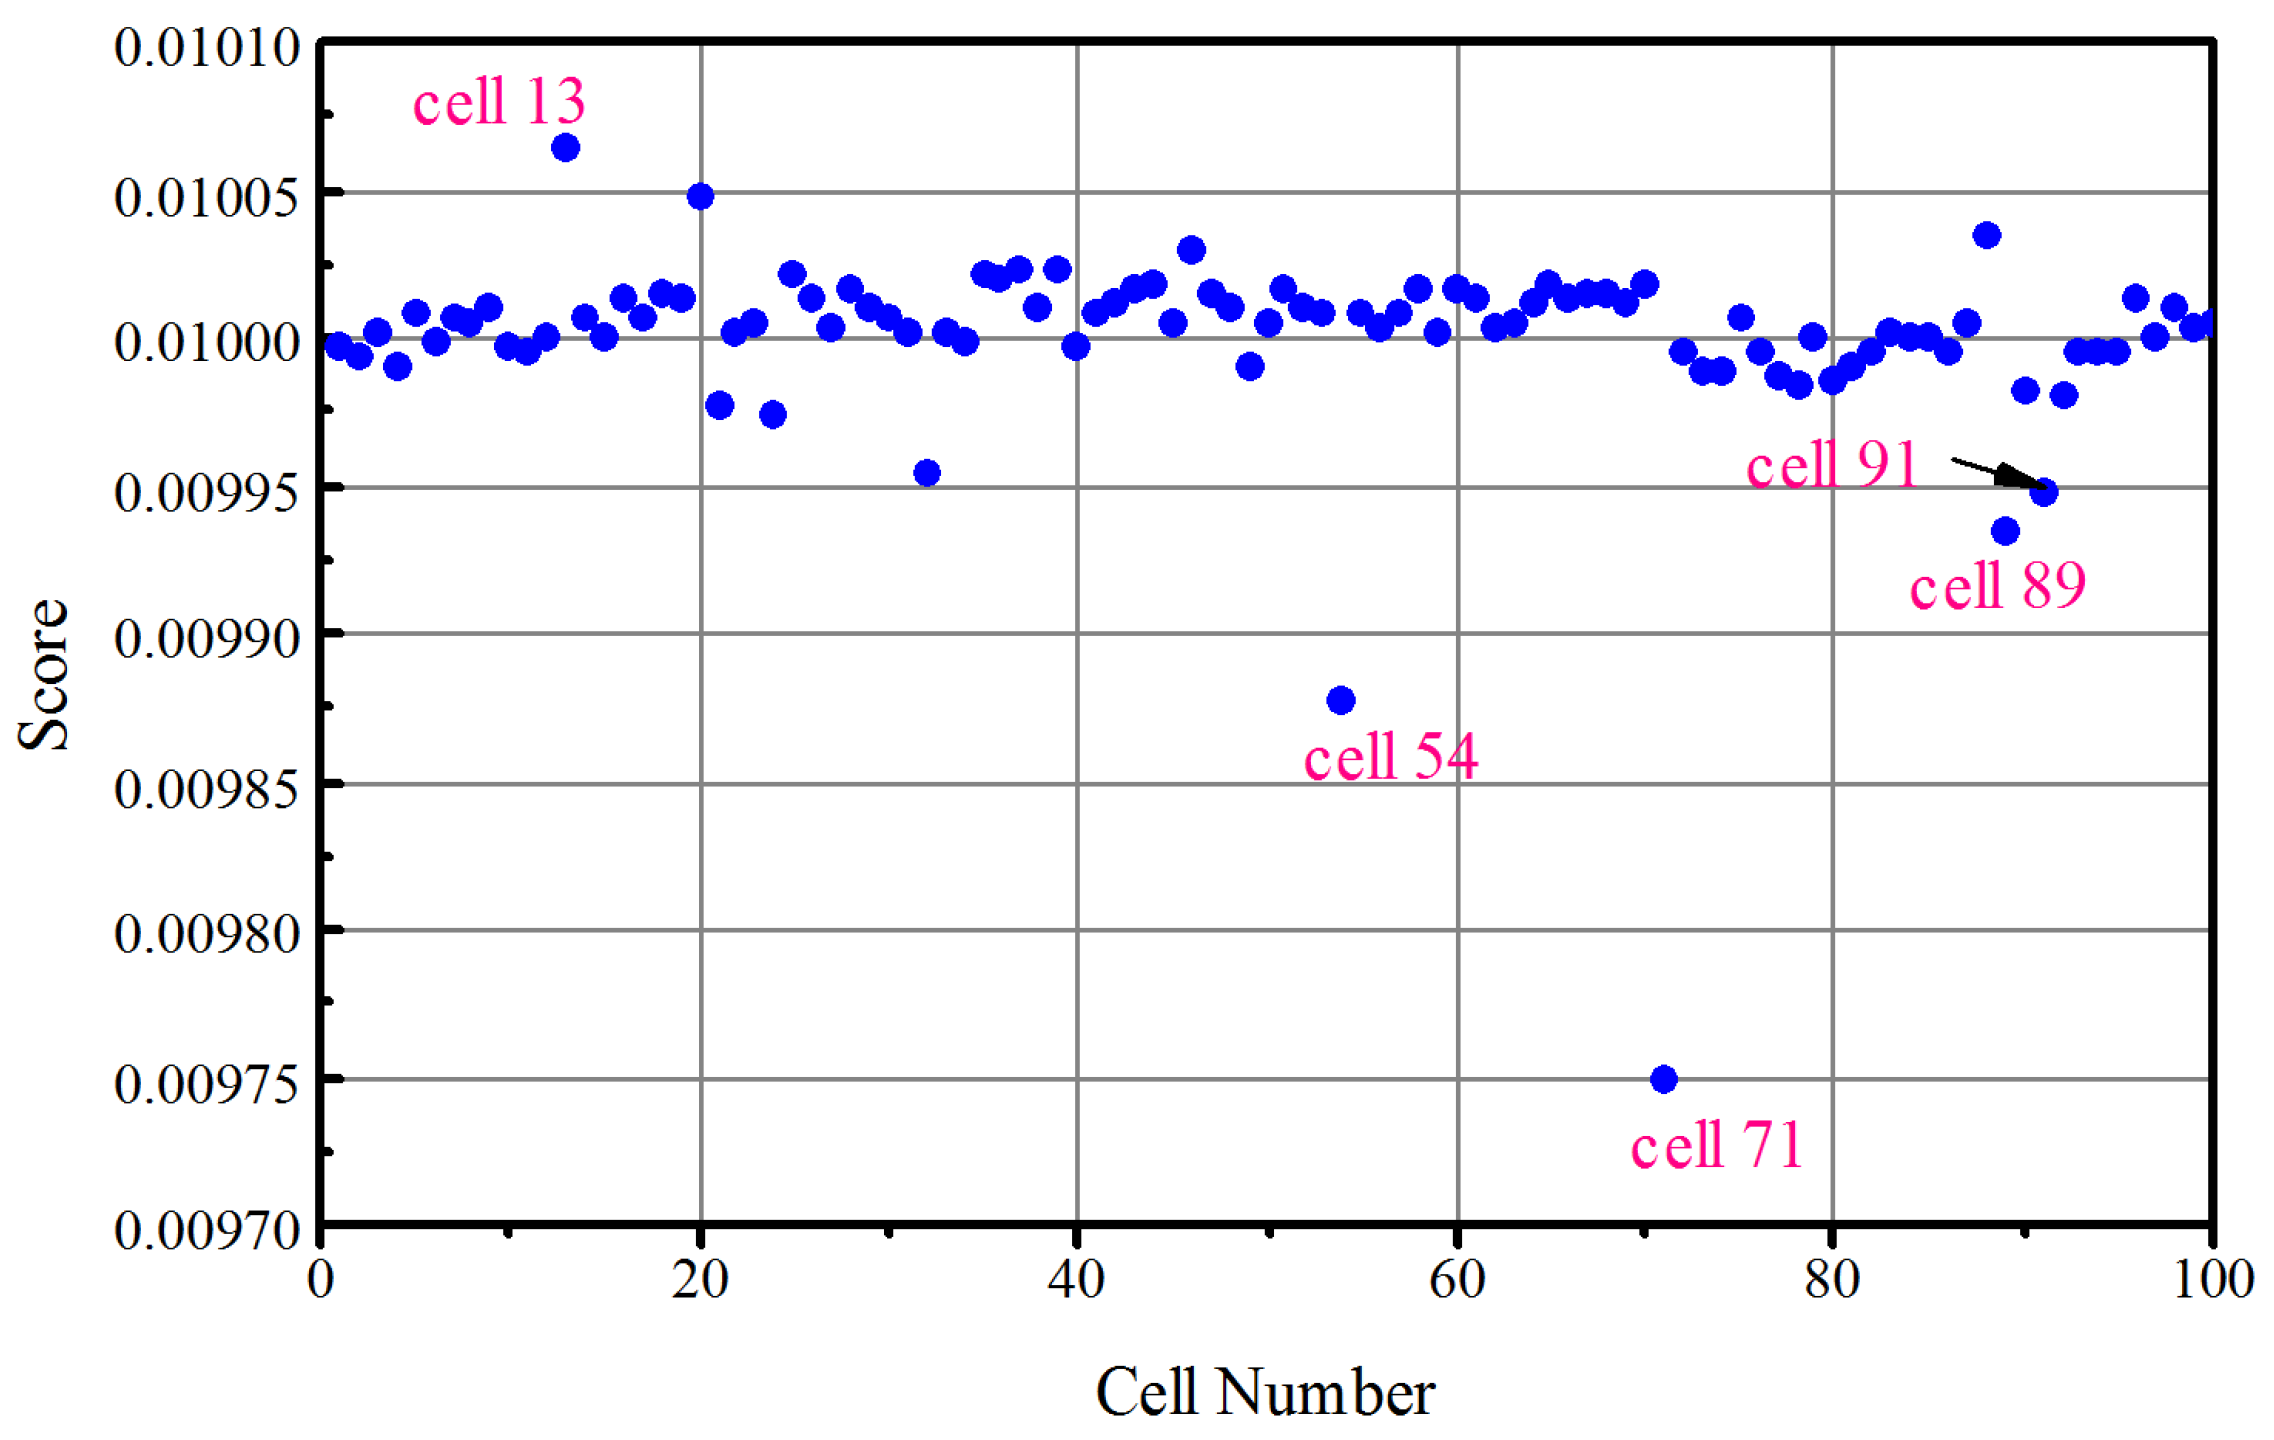
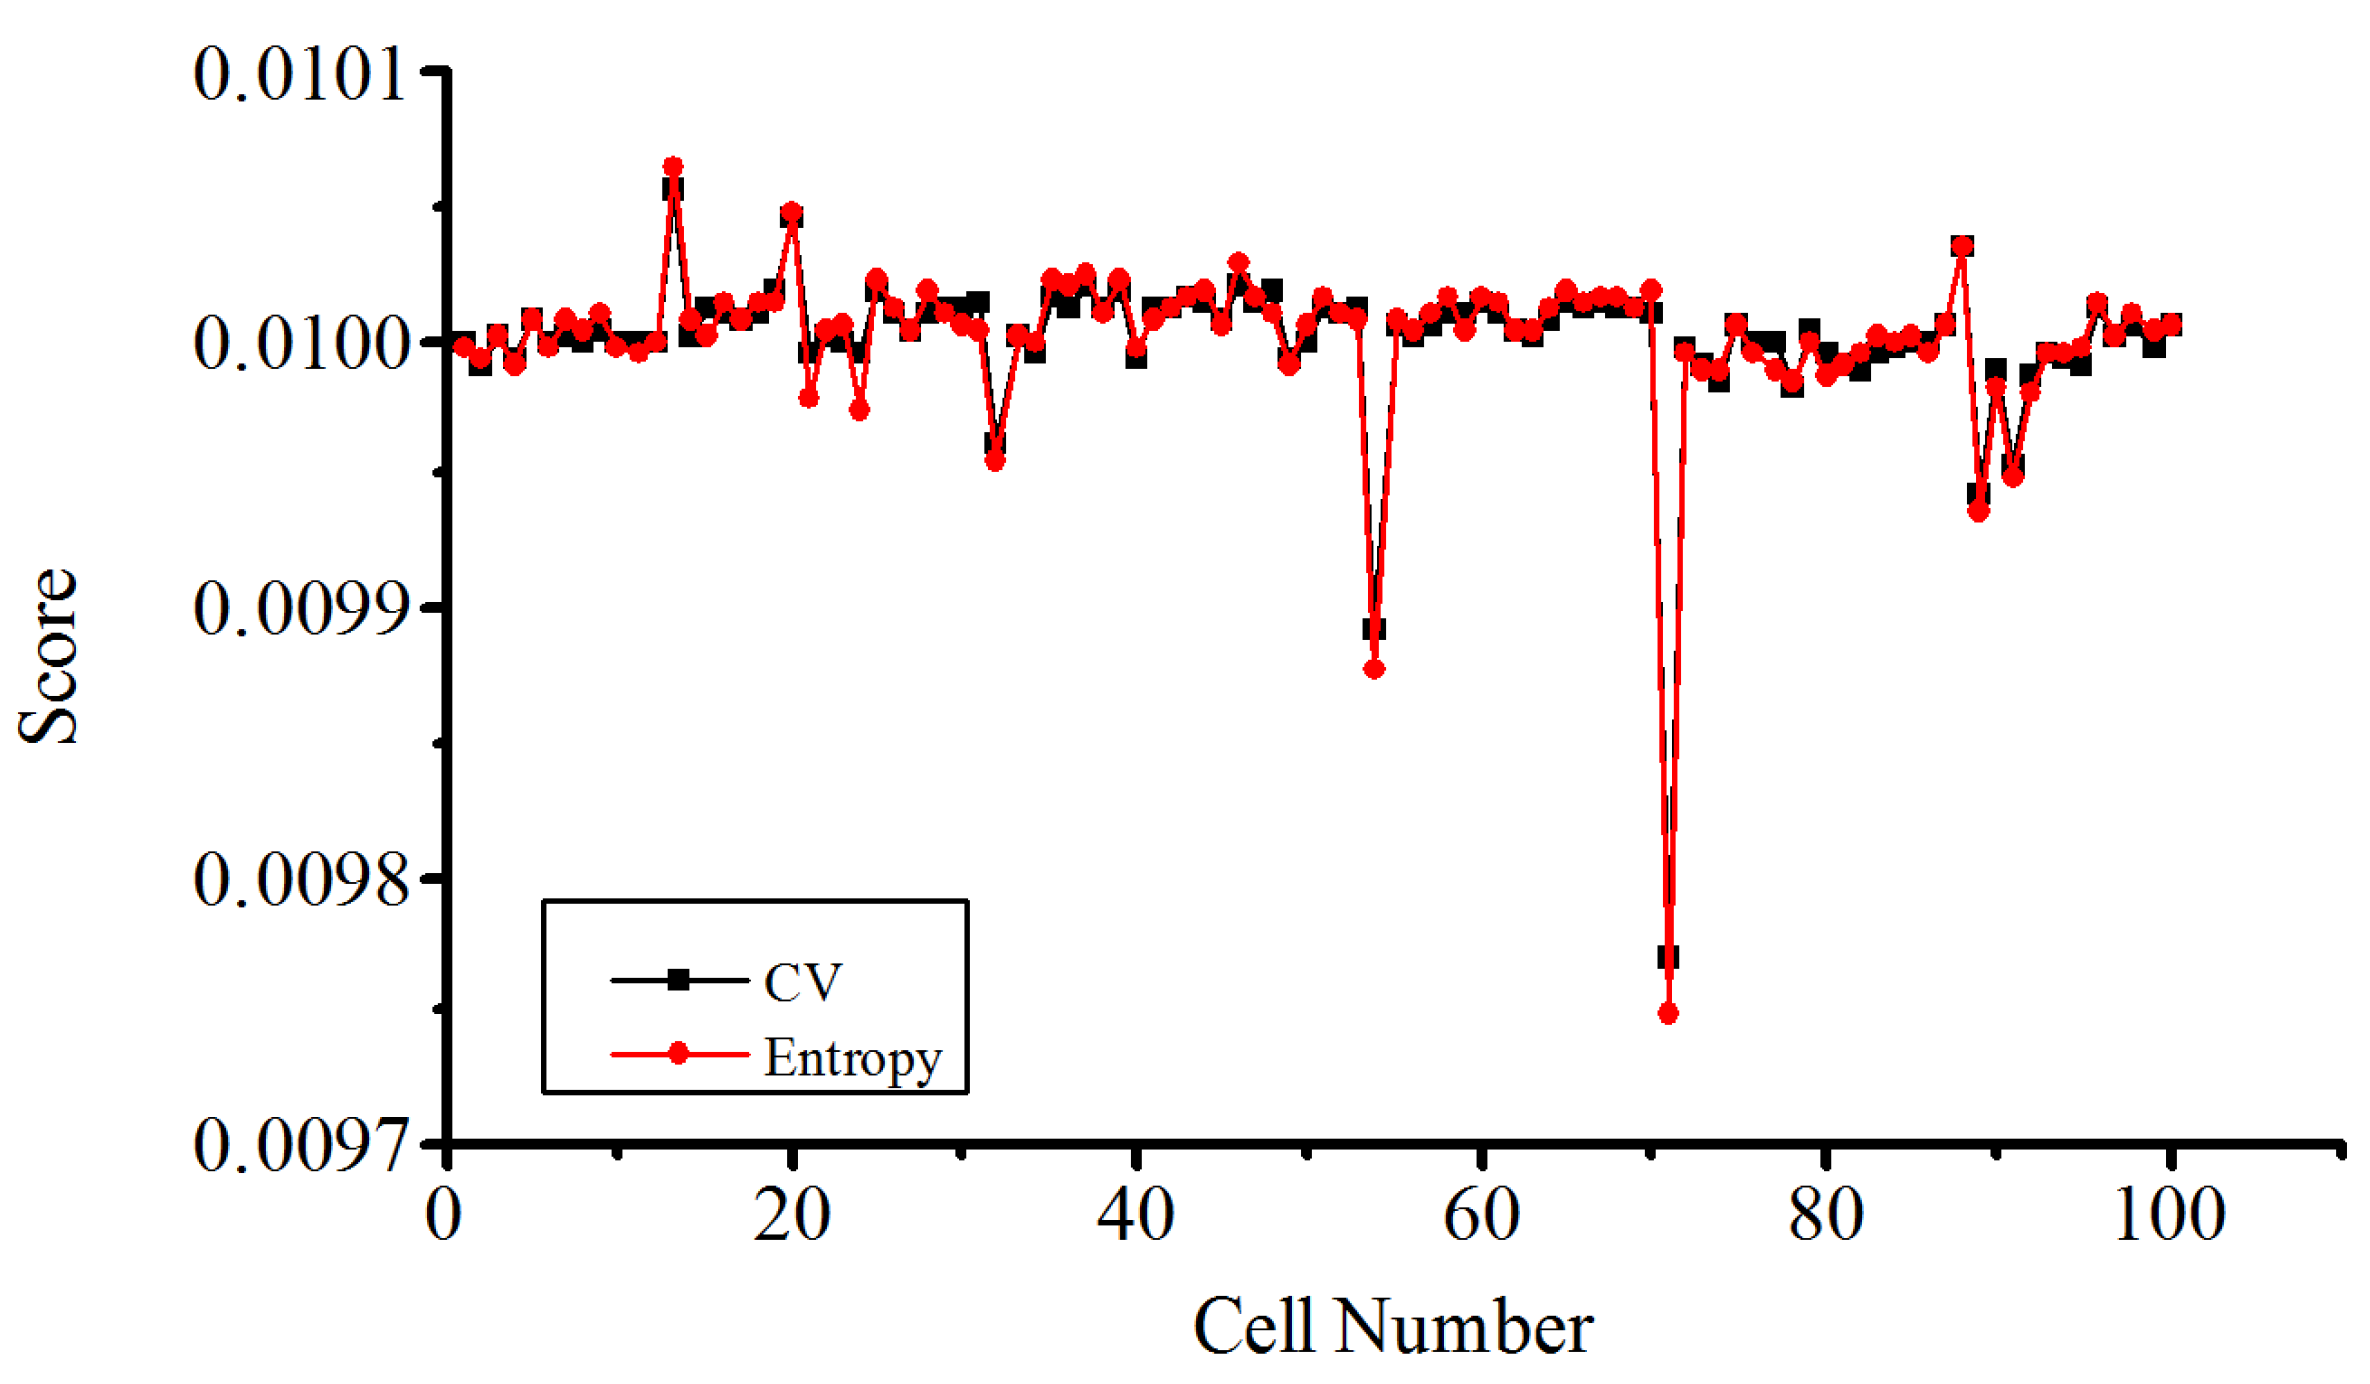
In [6], Vehicle 2 was also selected for fault diagnosis. Abnormal voltage is detected from the cell 71 on 8 May 2016. Entropy-based fault diagnosis can also locate the abnormal cell a day in advance in Figure 9. It does not need to make a statistical method after calculating the entropy. Therefore, the computational efficiency is improved. The coefficient of variation (CV) is a standardized measure of dispersion of a probability distribution or frequency distribution in statistics. And it is free of units and is used in numerous areas of science such as biology, economics, psychology, engineering and reliability theory [35].
The ratio of the standard deviation to the mean is CV, which is often expressed as a percentage:
where , represents the standard deviation and the mean, respectively.
We take the data of Vehicle 2 on 8 May 2016. As can be seen from Figure 10, both methods have effects on the most unusual cell positioning. However, compared with the evaluation score of the CV, the effect of entropy is obviously significant because the entropy is better at enlarging the abnormal cell value. The cell 47 of Vehicle 1 during period 2 has weak abnormality. In Figure 11, we can find that abnormal cells, such as cell 18, cell 37, cell 47, cell 56 and cell 52, are discovered by the entropy weight method which has a more obvious effect than the CV method. Therefore, different from the CV method, the entropy weight method has sensitivity to the abnormal data, calculating the objective weight to avoid the evaluation error due to subjective factors.
5. Conclusions
A method for voltage fault diagnosis and prediction based on an entropy method is suggested in this paper. Objective weights are obtained from the entropy method. The scores of all cells are calculated and compared with the mean. The more the score deviates from the average, the greater the abnormality is. All data in this paper come from real-world vehicles monitored by OSMC-EV in Beijing, which could accurately reflect the characteristics of EVs in actual operation. The analysis results showed that the entropy weight method was able to detect the abnormal cells. The proposed method can be widely used to diagnose the number of abnormal cells and handle the anomaly, which cannot be directly achieved by observing the voltage curves. Furthermore, it can be applied to the performance evaluation system of an EV battery pack.
Acknowledgments
The project was supported by the State Key Program of Natural Science Foundation of China (No. U1564206).The project is supported by the Application and Demonstration of Innovative Methods in New Energy Vehicle Industry (No. 2015IM030100).
Author Contributions
Zhenyu Sun provided algorithms, analyzed the data and wrote the paper; and Zhenpo Wang, Peng Liu and Jin Zhang conceived the structure and research direction of the paper.
Conflicts of Interest
The authors declare no conflict of interest.
Abbreviations
| Nomenclature | |
| Abbreviation | Description |
| EVs | Electric vehicles |
| HEVs | Hybrid electric vehicles |
| PHEVs | Plug-in hybrid electric vehicles |
| BEVs | Battery electric vehicles |
| NMMC | National Monitoring and Management Center |
| OSMC-EVs | Operation Service and Management Center Electric Vehicles |
| SOH | State of health |
| SOC | State-of-charge |
| FDI | Fault detection and isolation |
| BMS | Battery management systems |
| HIF | H infinity filters |
| SampEn | Sample Entropy |
| AEKF | Adaptive extended Kalman filter |
| LOs | Learning observers |
| ESC | External short circuit |
| SOC | State-of-charge |
| CV | Coefficient of variation |
| UFK | Unscented Kalman filter |
| DPCA | Dynamic principal component analysis |
| SVM | Support vector machine |
| PSO | Particle swarm optimization |
| DE | Differential evolution |
| SVM | Support vector machine |
| LMO | LiMn2O4 |
| DC | Direct Current |
| Symbol | Description |
| m | mode |
| w | The contribution rate of the evaluation system. |
| p | Probability |
| H/h | Shannon entropy value |
| n | The total number of cells |
| s | Comprehensive score |
| q | The 95th percentile |
| σ | Standard deviation |
| Subscript | Description |
| i | The cell number |
| j | The index number |
| n | The total number of cell |
| t | The total number of index |
| K | The interval number |
| Superscript | Description |
| j | The index number |
References
- Hu, X.; Li, S.; Peng, H. A comparative study of equivalent circuit models for Li-ion batteries. J. Power Sources 2012, 198, 359–367. [Google Scholar] [CrossRef]
- Xiong, R.; He, H.; Sun, F.; Zhao, K. Online Estimation of Peak Power Capability of Li-Ion Batteries in Electric Vehicles by a Hardware-in-Loop Approach. Energies 2012, 5, 1455–1469. [Google Scholar] [CrossRef]
- Xiong, R.; Zhang, Y.; He, H.; Pecht, M.G. A double-scale, particle-filtering, energy state prediction algorithm for lithium-ion batteries. IEEE Trans. Ind. Electron. 2018, 65, 1526–1538. [Google Scholar] [CrossRef]
- Xiong, R.; Cao, J.Y.; Yu, Q.Q.; He, H.; Sun, F.C. Critical Review on the Battery State of Charge Estimation Methods for Electric Vehicles. IEEE Access 2017. [Google Scholar] [CrossRef]
- Zheng, Y.; Han, X.; Lu, L.; Ouyang, M. Lithium ion battery pack power fade fault identification based on Shannon entropy in electric vehicles. J. Power Sources 2013, 223, 136–146. [Google Scholar] [CrossRef]
- Wang, Z.; Hong, J.; Liu, P.; Zhang, L. Voltage fault diagnosis and prognosis of battery systems based on entropy and Z-score for electric vehicles. Appl. Energy 2017, 196, 289–302. [Google Scholar] [CrossRef]
- Li, X.; Wang, Z. A novel fault diagnosis method for lithium-Ion battery packs of electric vehicles. Measurement 2018, 116, 402–411. [Google Scholar] [CrossRef]
- Panchal, S.; Dincer, I.; Agelin-Chaab, M.; Fraser, R.; Fowler, M. Design and Simulation of a Lithium-ion Battery at Large C-Rates and Varying Boundary Conditions through Heat Flux Distributions. Measurement 2018, 116, 382–390. [Google Scholar] [CrossRef]
- Lu, L.; Han, X.; Li, J.; Hua, J.; Ouyang, M. A review on the key issues for lithium-ion battery management in electric vehicles. J. Power Sources 2013, 226, 272–288. [Google Scholar] [CrossRef]
- Xiong, R.; Yu, Q.Q.; Wang, L.Y.; Lin, C. A novel method to obtain the open circuit voltage for the state of charge of lithium ion batteries in electric vehicles by using H infinity filter. Appl. Energy 2017, 207, 341–348. [Google Scholar] [CrossRef]
- Xiong, R.; Tian, J.P.; Mu, H.; Wang, C. A systematic model-based degradation behavior recognition and health monitor method of lithium-ion batteries. Appl. Energy 2017, 207, 367–378. [Google Scholar] [CrossRef]
- Xiong, R.; Cao, J.Y.; Yu, Q.Q. Reinforcement learning-based real-time power management for hybrid energy storage system in the plug-in hybrid electric vehicle. Appl. Energy 2018, 211, 538–548. [Google Scholar] [CrossRef]
- Sun, Y.; Jou, H.; Wu, J. Diagnosis method for the degradation of lead-acid battery. In Proceedings of the IEEE International Symposium on Industrial Electronics, Seoul, Korea, 5–8 July 2009; pp. 1397–1402. [Google Scholar]
- Liu, Z.; He, H. Sensor fault detection and isolation for a lithium-ion battery pack in electric vehicles using adaptive extended Kalman filter. Appl. Energy 2017, 185, 2033–2044. [Google Scholar] [CrossRef]
- Chen, Z.; Xiong, R.; Tian, J.; Lu, J. Model-based fault diagnosis approach on external short circuit of lithium-ion battery used in electric vehicles. Appl. Energy 2016, 184, 365–374. [Google Scholar] [CrossRef]
- Kim, I.-S. A technique for estimating the state of health of lithium batteries through a dual-sliding-mode observer. IEEE Trans. Power Electron. 2010, 25, 1013–1022. [Google Scholar]
- Kim, G.H.; Smith, K.; Ireland, J.; Pesaran, A. Fail-safe design for large capacity lithium-ion battery systems. J. Power Sources 2012, 210, 243–253. [Google Scholar] [CrossRef]
- Chen, W.; Chen, W.; Saif, M.; Li, M.; Wu, H. Simultaneous fault isolation and estimation of lithium-ion batteries via synthesized design of Luenberger and learning observers. IEEE Trans. Control Syst. Technol. 2013, 22, 290–298. [Google Scholar] [CrossRef]
- Hwang, J.C.; Chen, J.C.; Pan, J.S.; Huang, Y.C. Measurement method for online battery early faults precaution in uninterrupted power supply system. IET Electr. Power Appl. 2011, 5, 267–274. [Google Scholar] [CrossRef]
- Chen, C.; Xiong, R.; Shen, W. A lithium-ion battery-in-the-loop approach to test and validate multi-scale dual H infinity filters for state of charge and capacity estimation. IEEE Trans. Power Electron. 2018, 33, 332–342. [Google Scholar] [CrossRef]
- He, H.; Xiong, R.; Peng, J. Real-time estimation of battery state-of-charge with unscented Kalman filter and RTOS μCOS-II platform. Appl. Energy 2015, 162, 1410–1418. [Google Scholar] [CrossRef]
- Panchal, S.; McGrory, J.; Kong, J.; Dincer, I.; Agelin-Chaab, M.; Fraser, R.; Fowler, M. Cycling degradation testing and analysis of a LiFePO4 battery at actual conditions. Int. J. Energy Res. 2017, 41, 2565–2575. [Google Scholar] [CrossRef]
- Yang, H.; Hassan, S.G.; Wang, L.; Li, D. Fault diagnosis method for water quality monitoring and control equipment in aquaculture based on multiple SVM combined with D-S evidence theory. Comput. Electron. Agric. 2017, 141, 96–108. [Google Scholar] [CrossRef]
- Liu, X. Research and Application of Intelligent Battery Fault Diagnosis System. Master’s Thesis, Beijing University of Posts and Telecommunications, Beijing, China, 2010. [Google Scholar]
- He, S.; Xiao, L.; Wang, Y.; Liu, X.; Yang, C.; Lu, J.; Gui, W.; Sun, Y. A novel fault diagnosis method based on optimal relevance vector machine. Neurocomputing 2017, 267, 651–663. [Google Scholar] [CrossRef]
- You, G.W.; Park, S.; Oh, D. Real-time state-of-health estimation for electric vehicle batteries: A data-driven approach. Appl. Energy 2016, 176, 92–103. [Google Scholar] [CrossRef]
- Sun, Y.; Jou, H.; Wu, J. Auxiliary diagnosis method for lead-acid battery health based on sample entropy. Energy Convers. Manag. 2009, 50, 2250–2256. [Google Scholar] [CrossRef]
- Widodo, A.; Shim, M.C.; Caesarendra, W.; Yang, B.S. Intelligent prognostics for battery health monitoring based on sample entropy. Expert Syst. Appl. 2011, 38, 11763–11769. [Google Scholar] [CrossRef]
- Shannon, C.E. A Mathematical Theory of Communication. Bell Syst. Tech. J. 1948, 27, 623–656. [Google Scholar] [CrossRef]
- Nahodil, V. Entropy as a Measure of Predictability in Financial Time Series. Bachelor’s Thesis, Charles University, Prague, The Czech Republic, 2017. [Google Scholar]
- Yao, L.; Wang, Z.; Ma, J. Fault detection of the connection of lithium-ion power batteries based on entropy for electric vehicles. J. Power Sources 2015, 293, 548–561. [Google Scholar] [CrossRef]
- Shi, B.; Zhang, Y.; Yuan, C. Entropy Analysis of Short-Term Heartbeat Interval Time Series during Regular Walking. Entropy 2017, 19, 568. [Google Scholar] [CrossRef]
- Richman, J.S.; Moorman, J.R. Physiological time-series analysis using approximate entropy and sample entropy. Am. J. Physiol. Heart Circ. Physiol. 2000, 278, H2039–H2049. [Google Scholar] [CrossRef] [PubMed]
- Luo, J. Principles and Examples of Using Information Entropy to Calculate Weight. J. Wuhan Text. Univ. 2014, 27, 86–89. [Google Scholar]
- Groeneveld, R. Influence Functions for the Coefficient of Variation, Its Inverse, and CV Comparisons. Commun. Stat. 2011, 40, 4139–4150. [Google Scholar] [CrossRef]
Figure 1.
Cloud service platform architecture of big data platform for the National Monitoring and Management Center (NMMC).
Figure 1.
Cloud service platform architecture of big data platform for the National Monitoring and Management Center (NMMC).
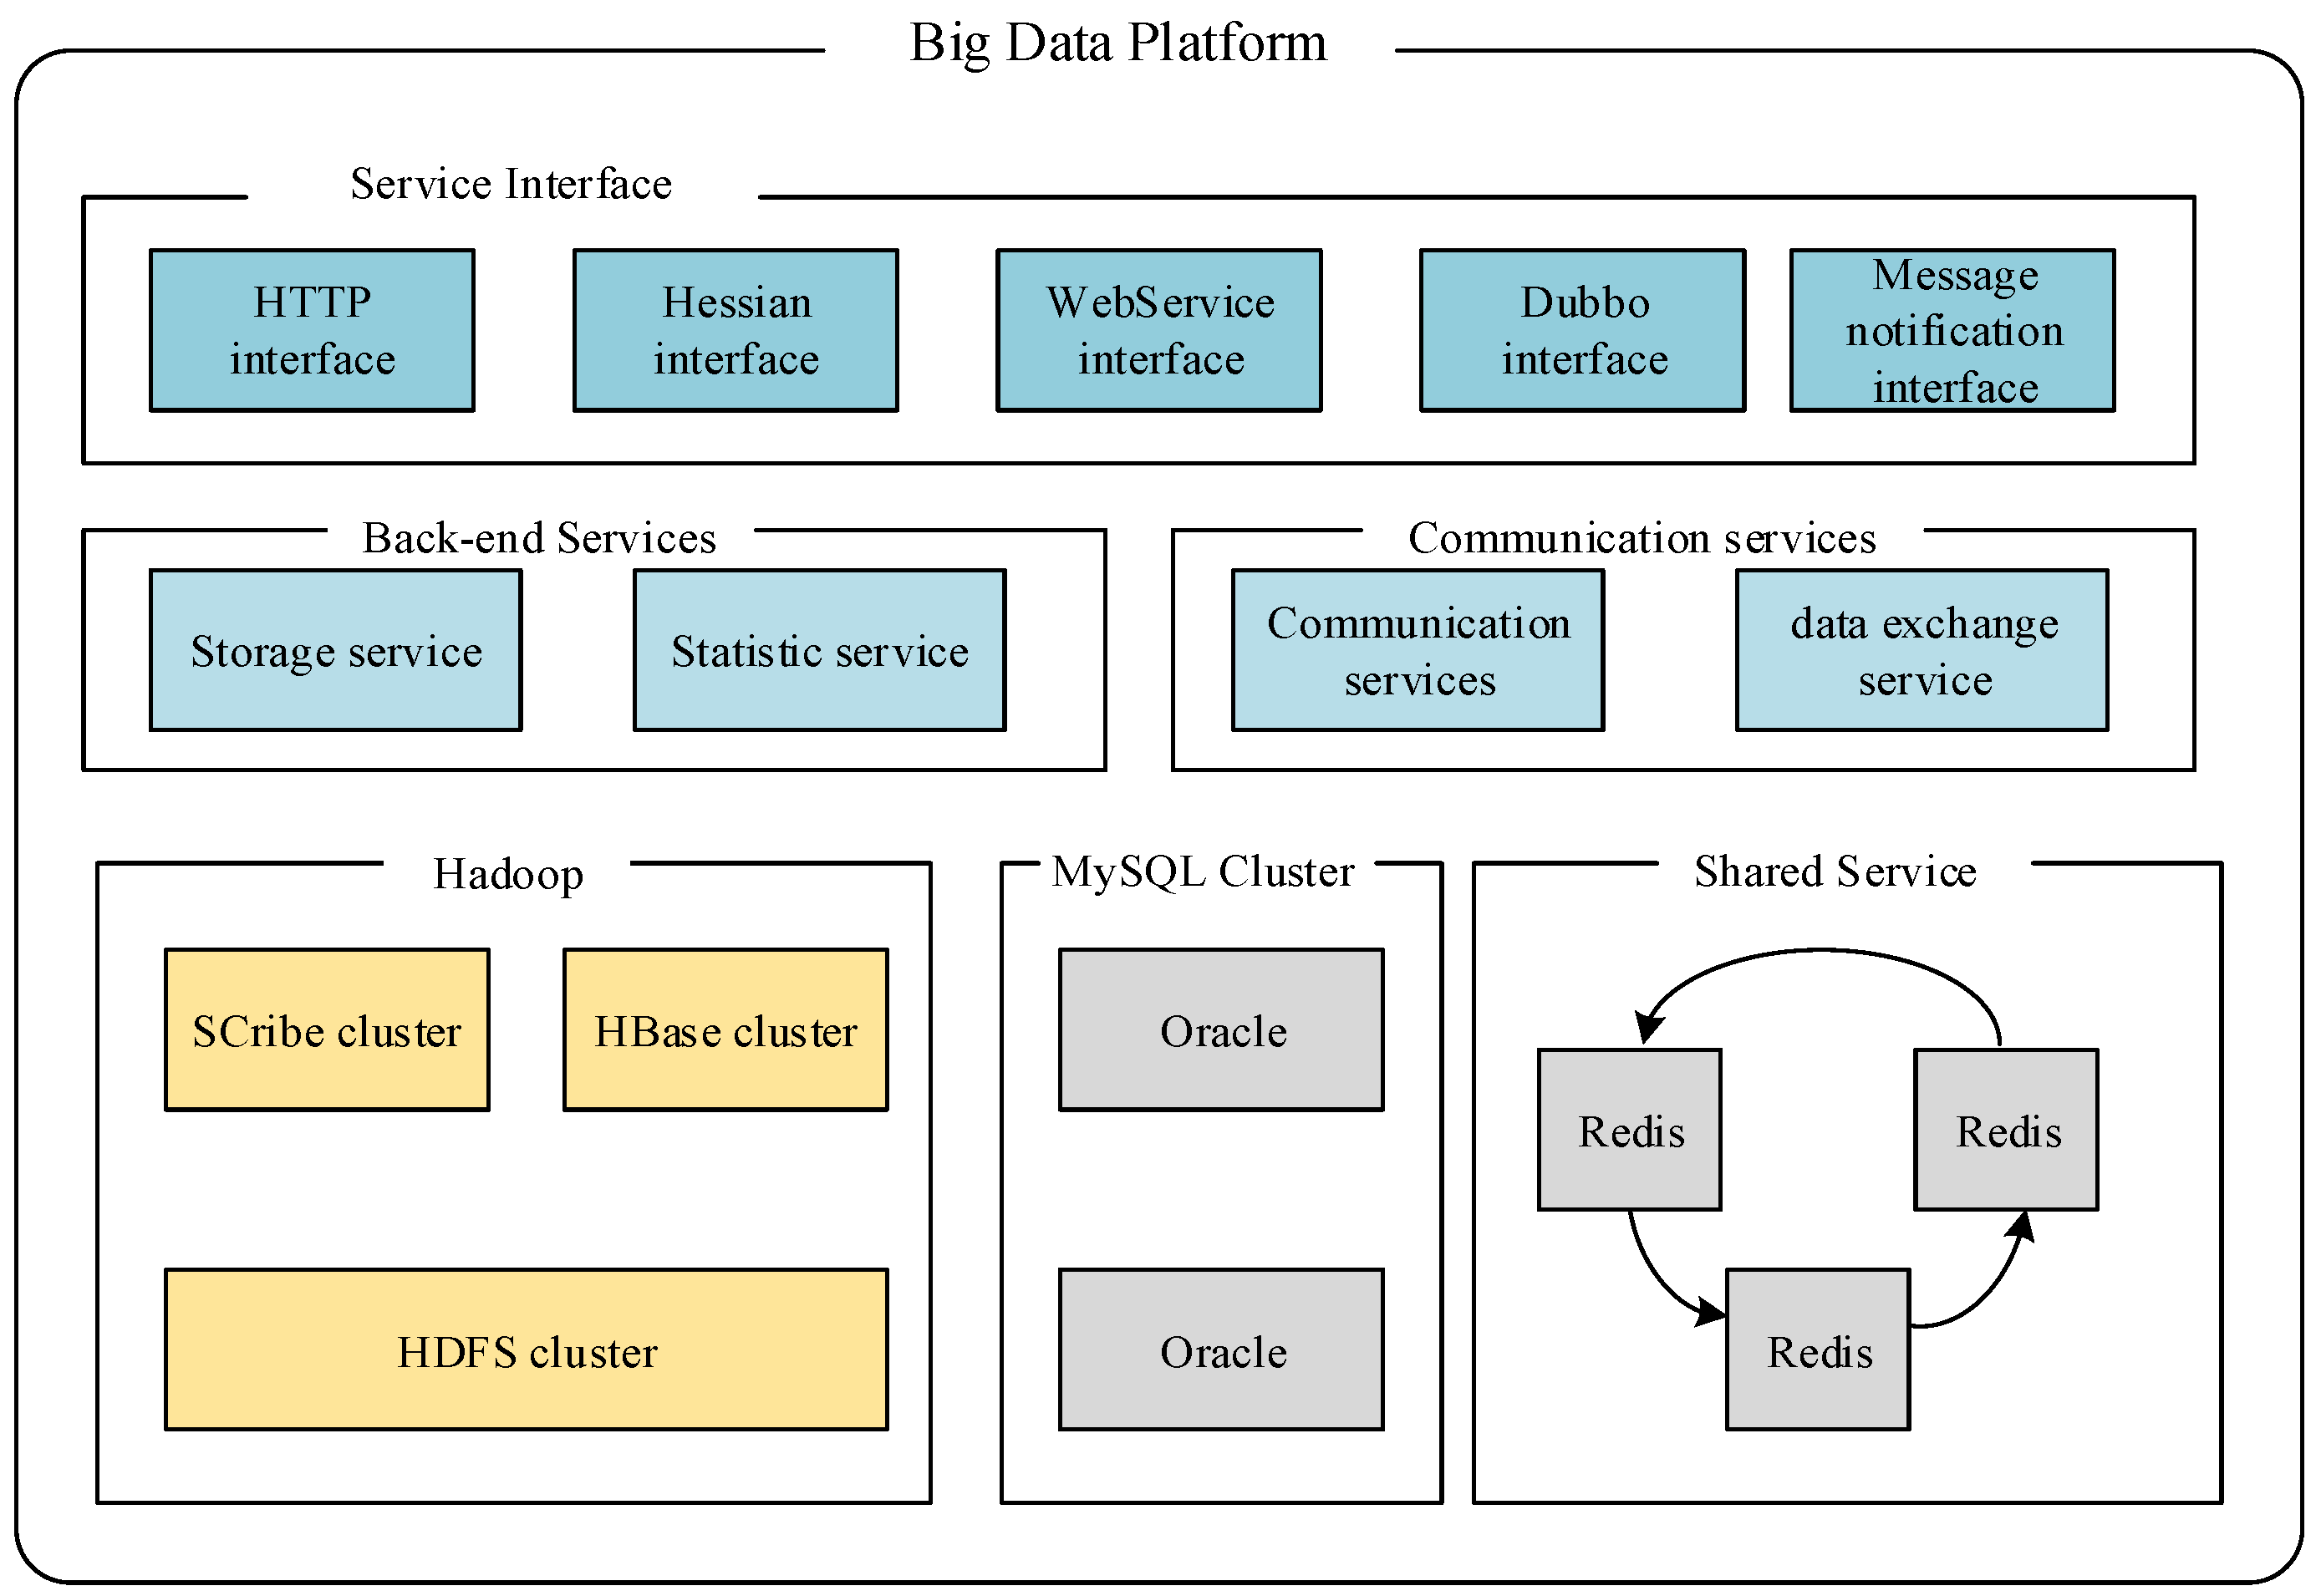
Figure 2.
The function of the big data platform.
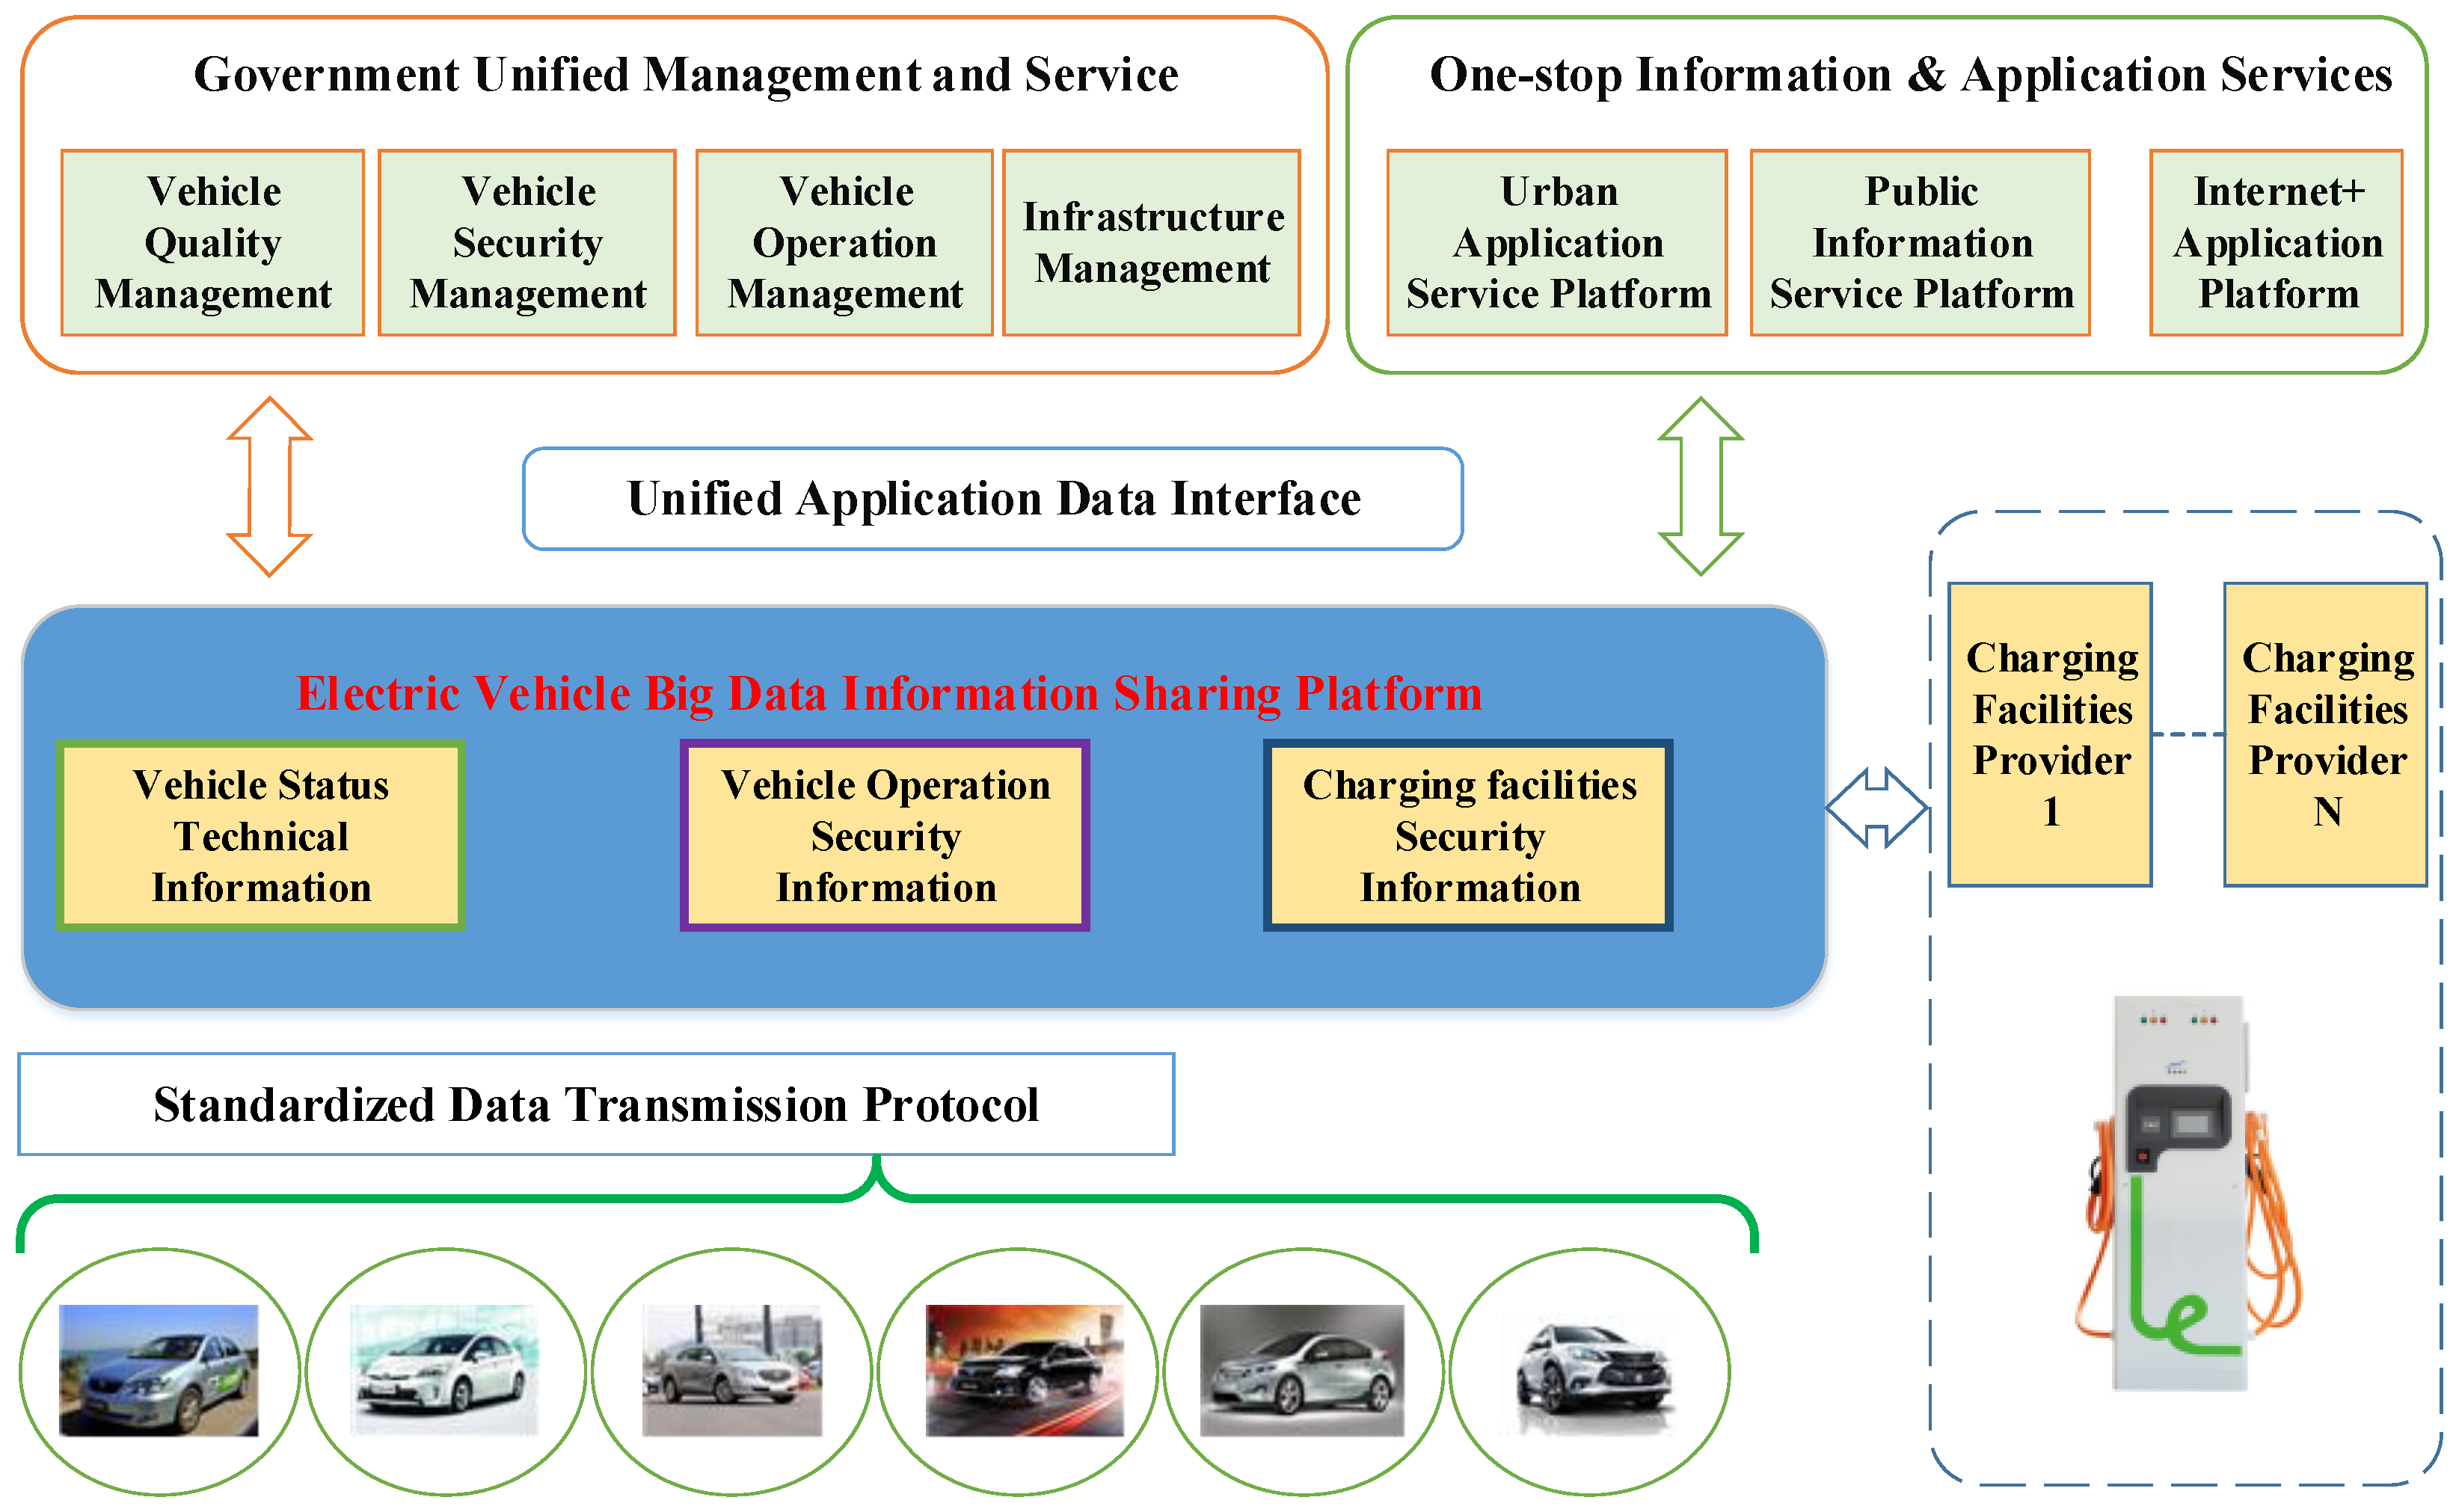
Figure 3.
Operation interface in Operation Service and Management Center for Electric Vehicle (OSMC-EV).
Figure 3.
Operation interface in Operation Service and Management Center for Electric Vehicle (OSMC-EV).

Figure 4.
Flow chart of battery fault diagnosis model.
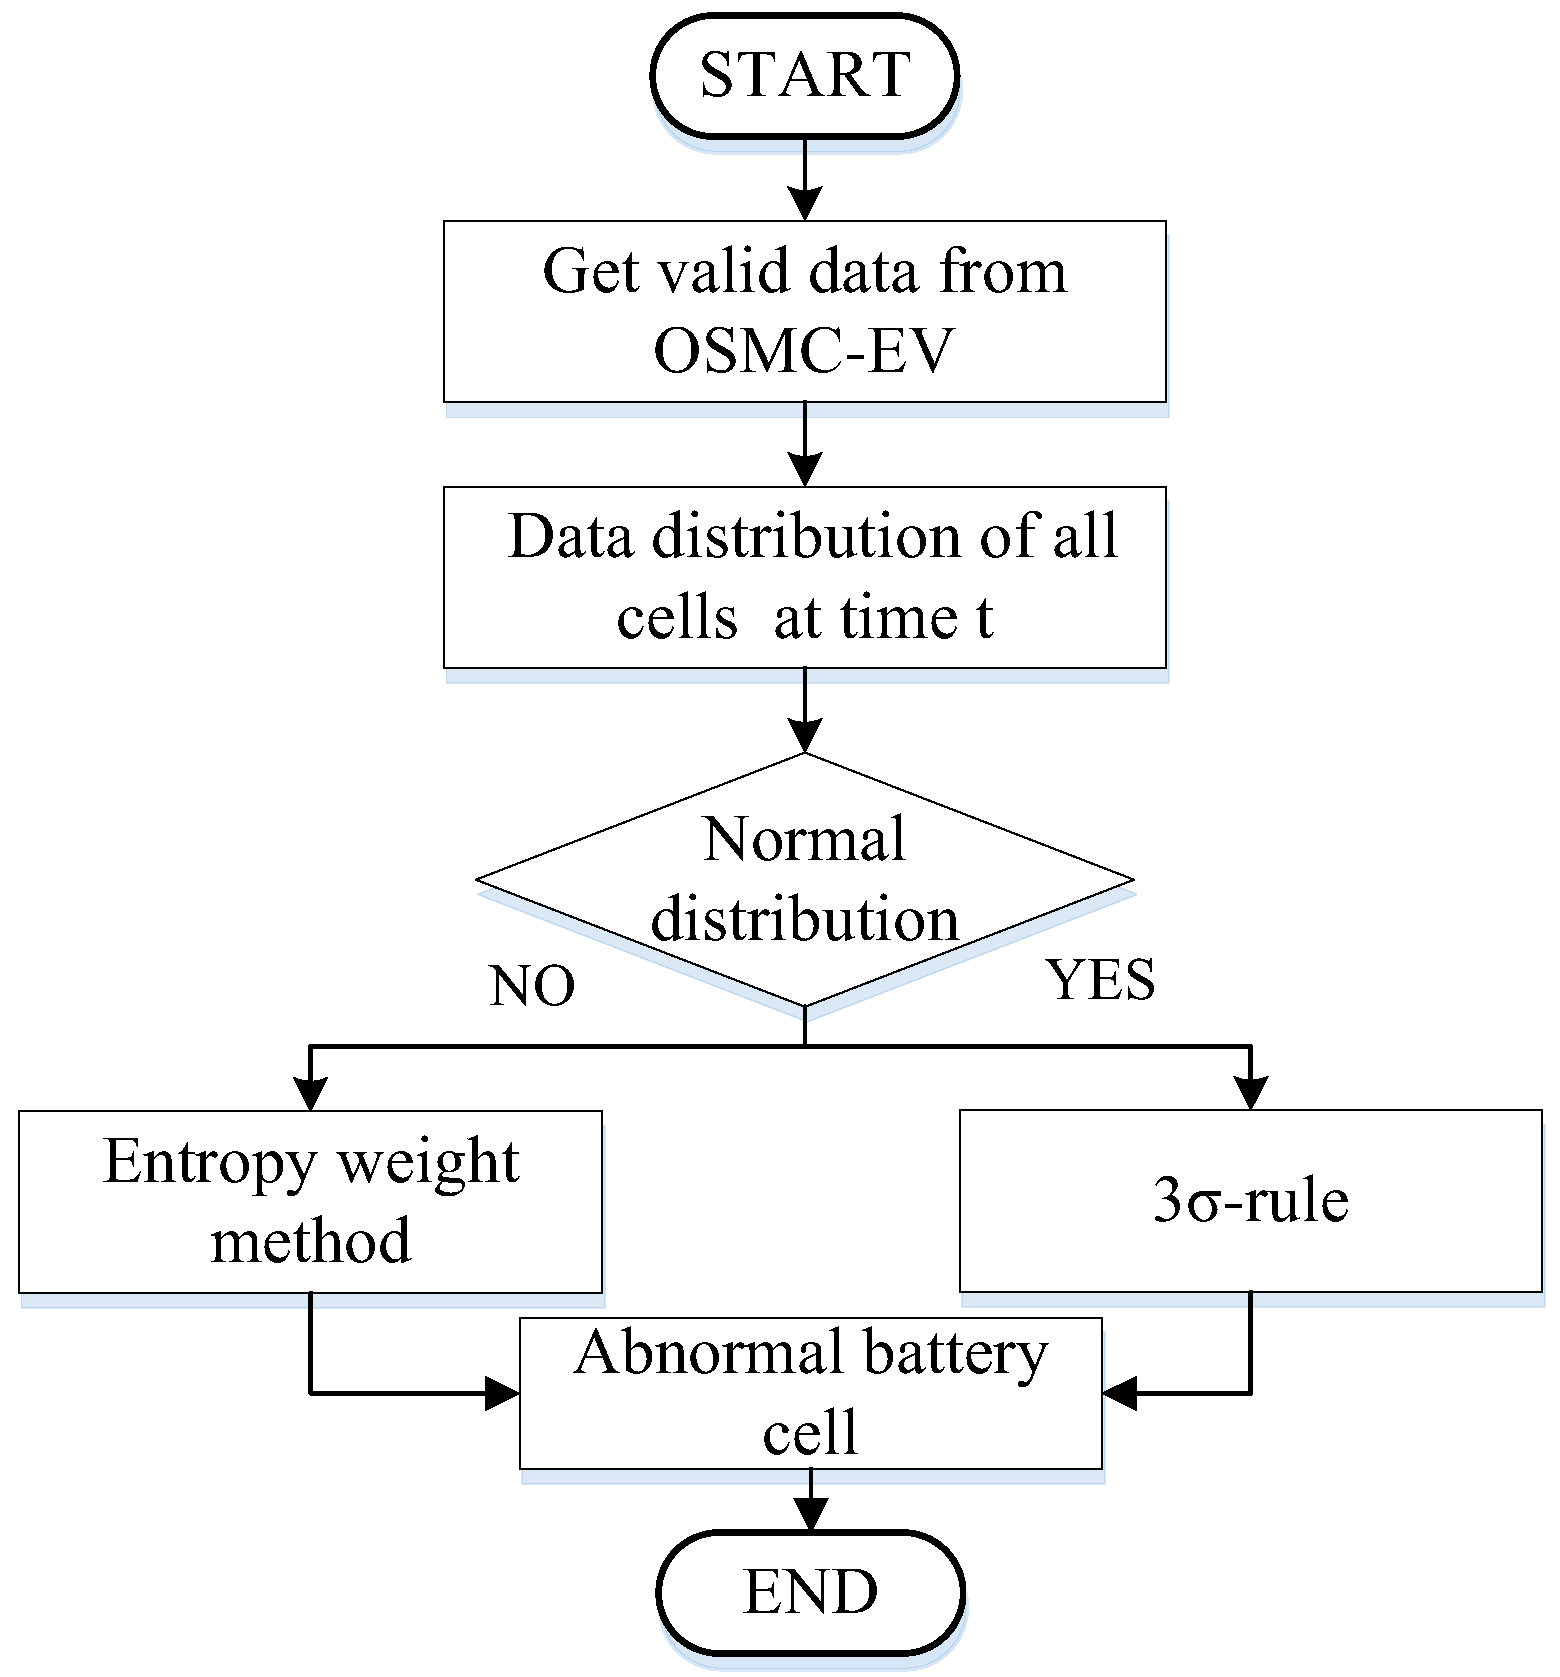
Figure 5.
(a) The voltage curve of Vehicle 1; (b) The voltage curve of Vehicle 2; (c) The curves of current, state of charge (SOC) and mileage of Vehicle 1; (d) The curves of current, SOC and mileage of Vehicle 2.
Figure 5.
(a) The voltage curve of Vehicle 1; (b) The voltage curve of Vehicle 2; (c) The curves of current, state of charge (SOC) and mileage of Vehicle 1; (d) The curves of current, SOC and mileage of Vehicle 2.
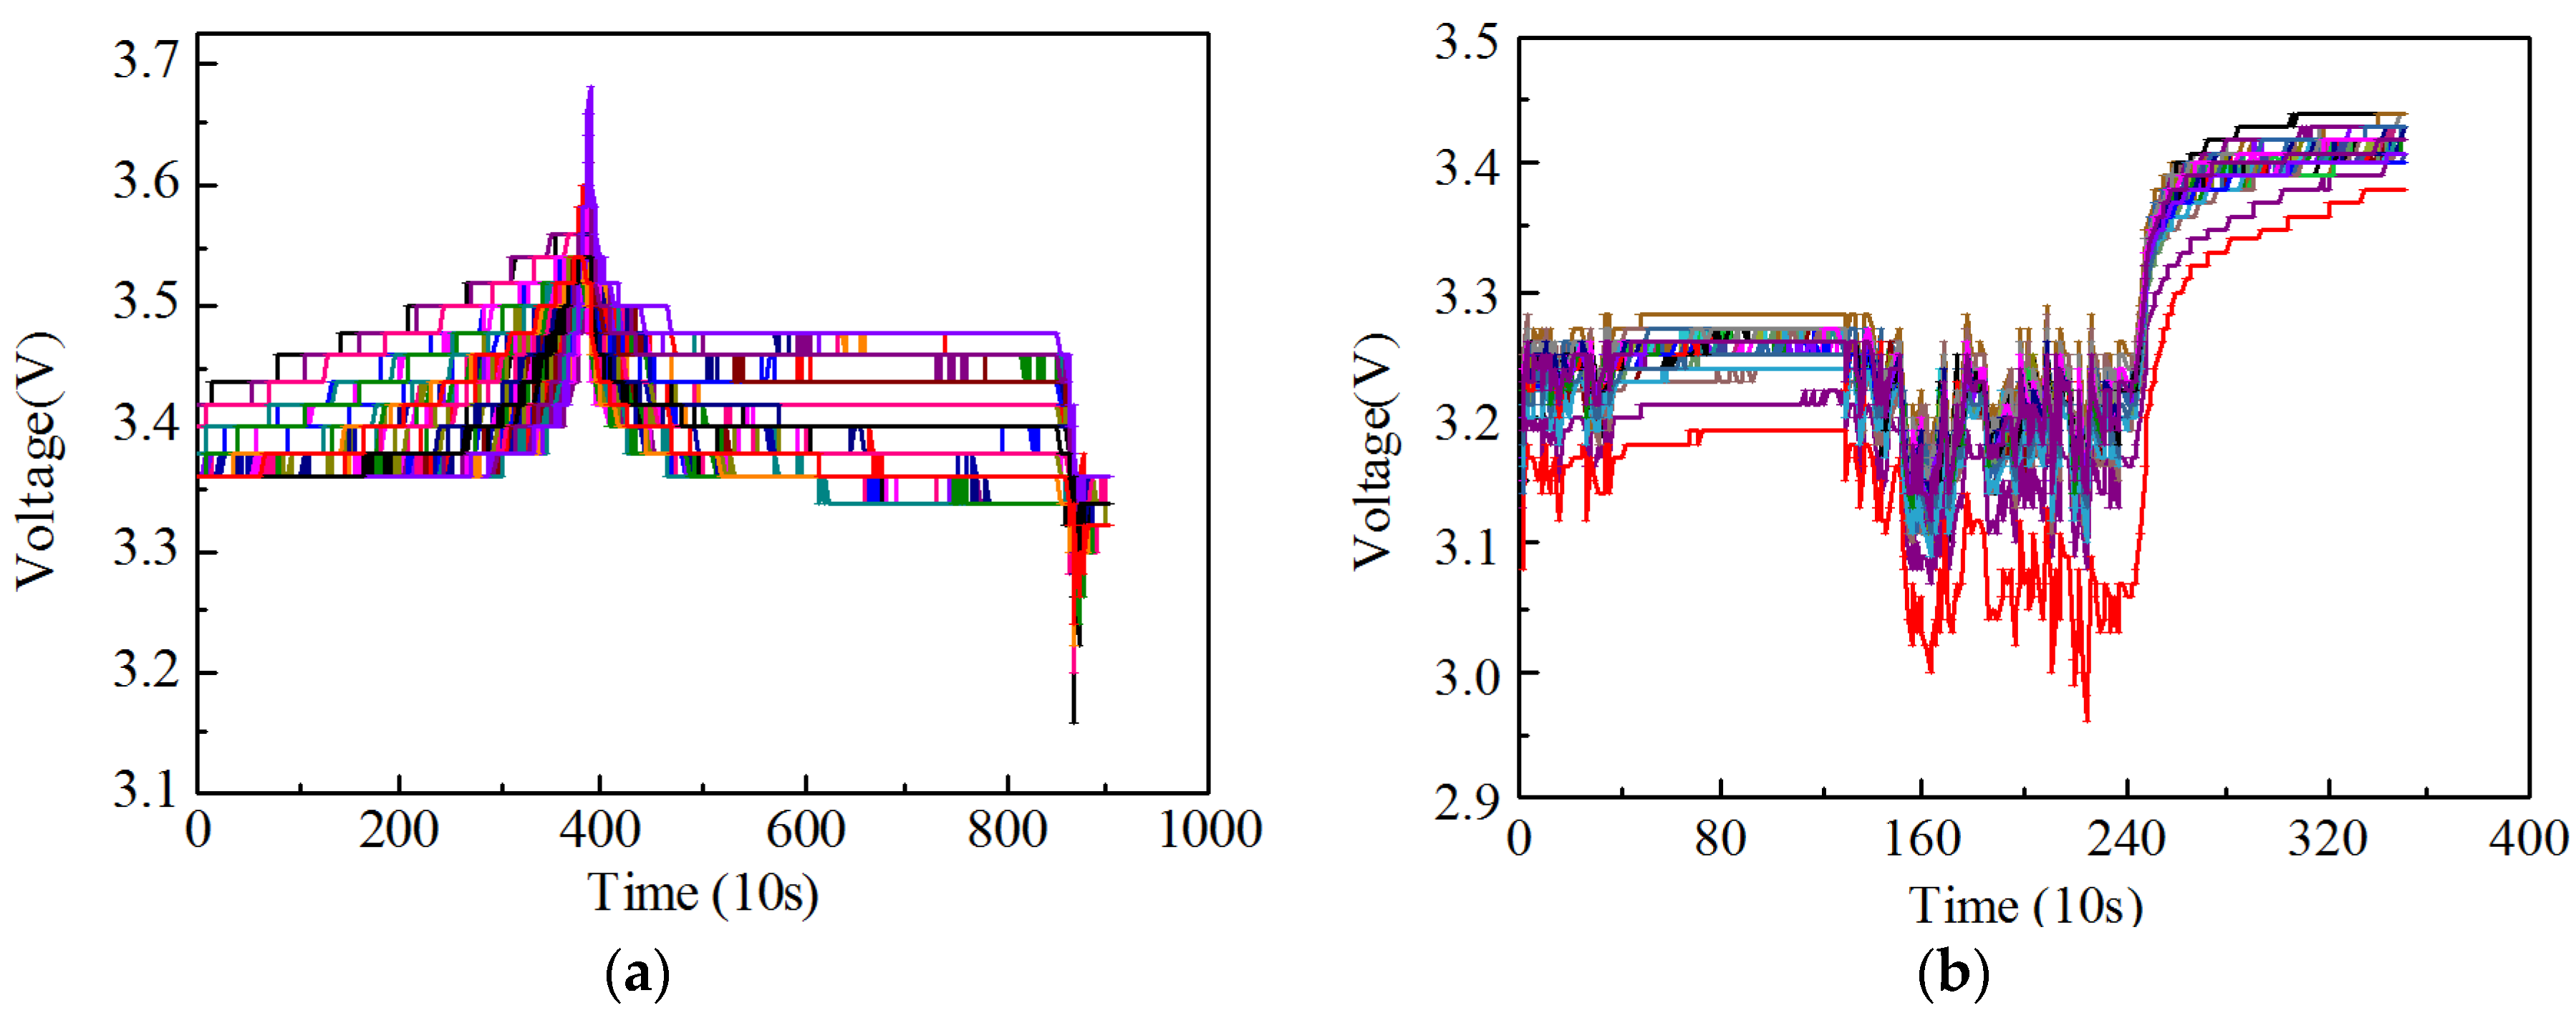

Figure 6.
(a) The histogram of the frequency distribution at different time; (b) The normal distribution test at different time.
Figure 6.
(a) The histogram of the frequency distribution at different time; (b) The normal distribution test at different time.
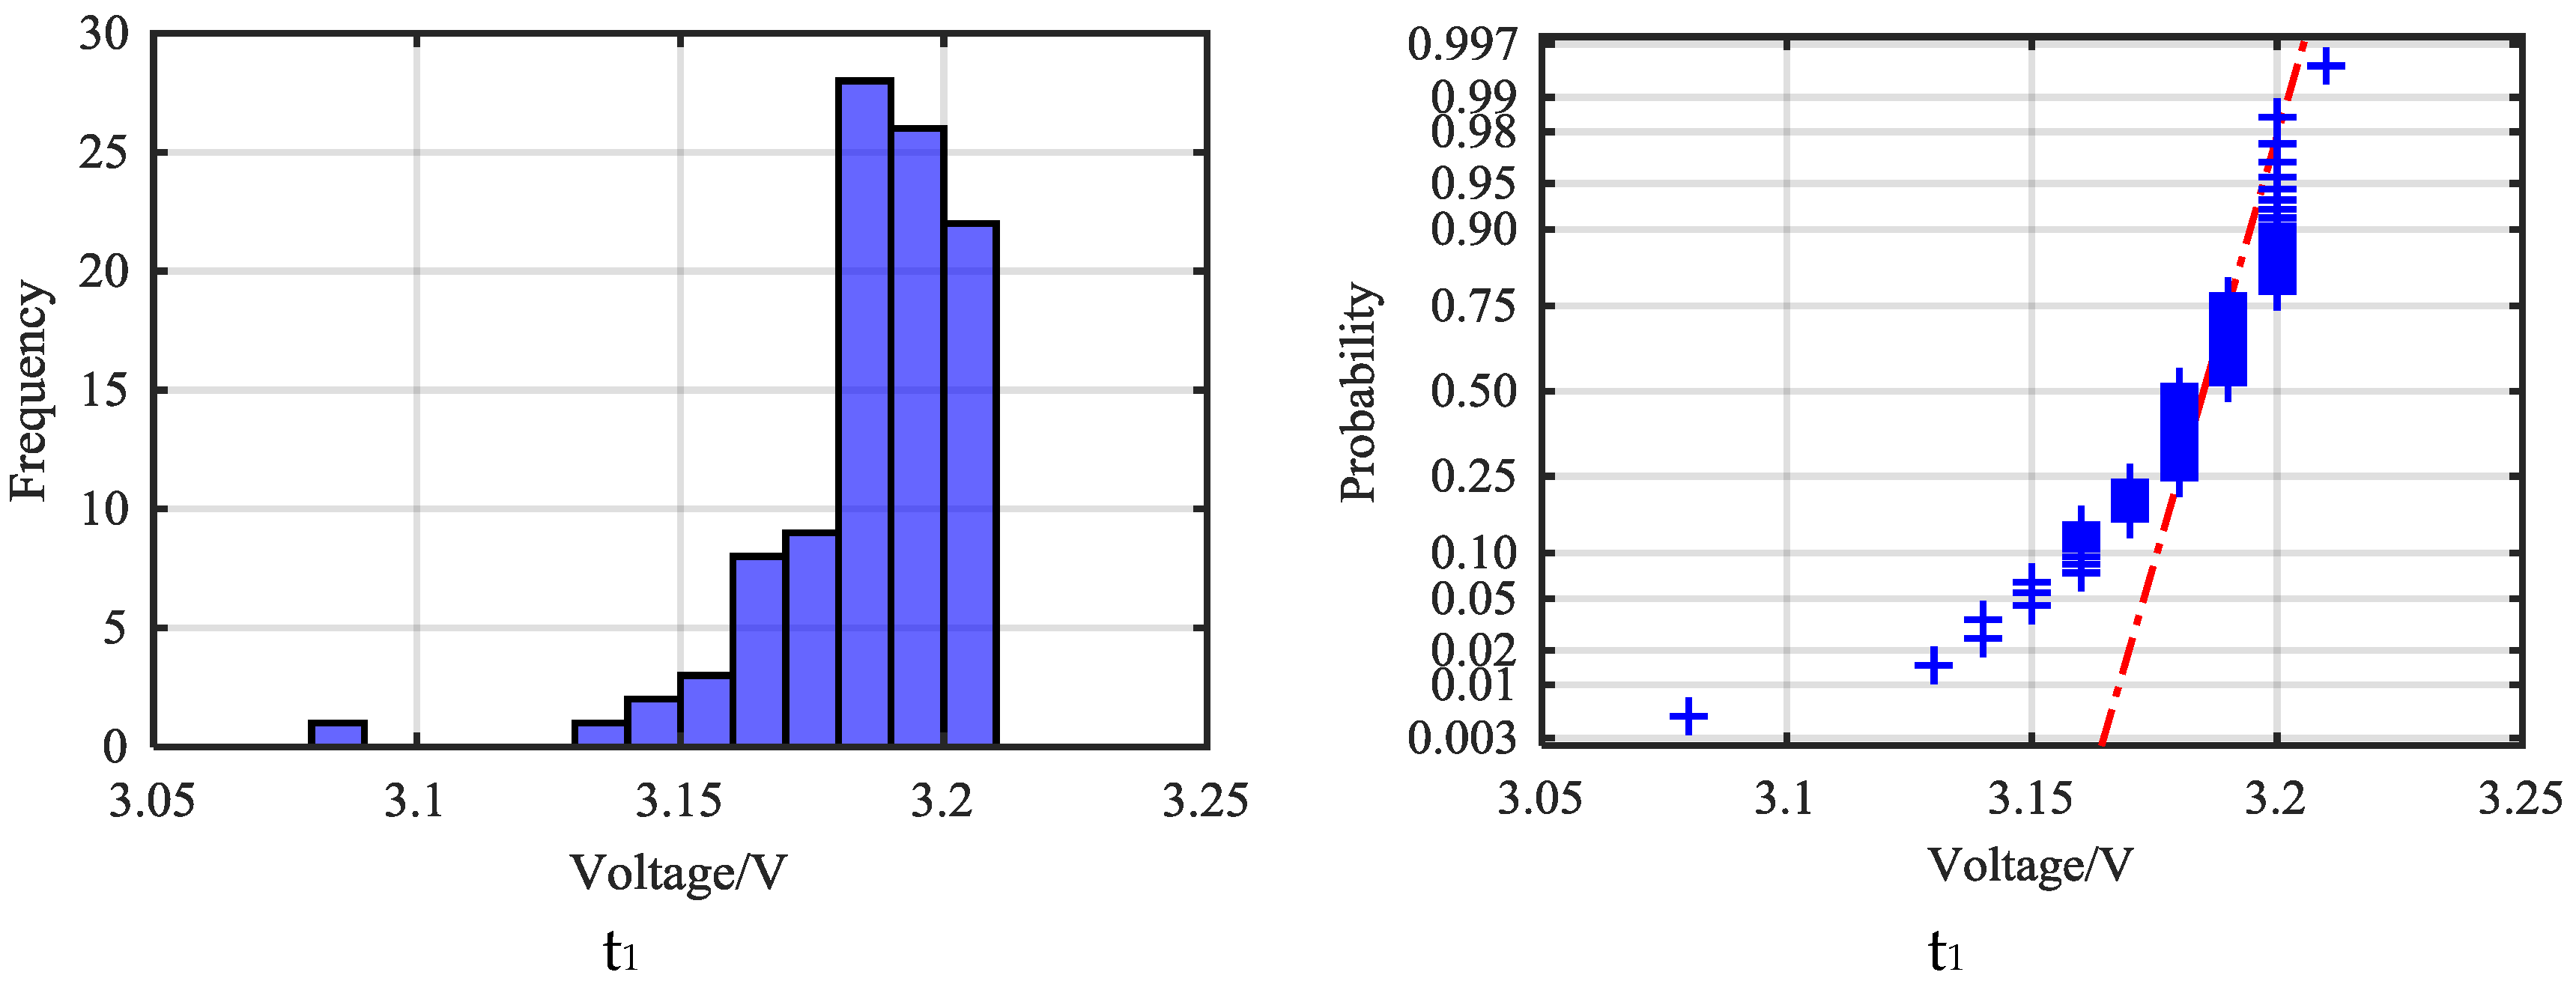

Figure 7.
Scores of all cells at different periods.

Figure 8.
(a) The curve of voltage of Vehicle 1; (b) The curves of current, SOC and mileage of Vehicle 1.
Figure 8.
(a) The curve of voltage of Vehicle 1; (b) The curves of current, SOC and mileage of Vehicle 1.
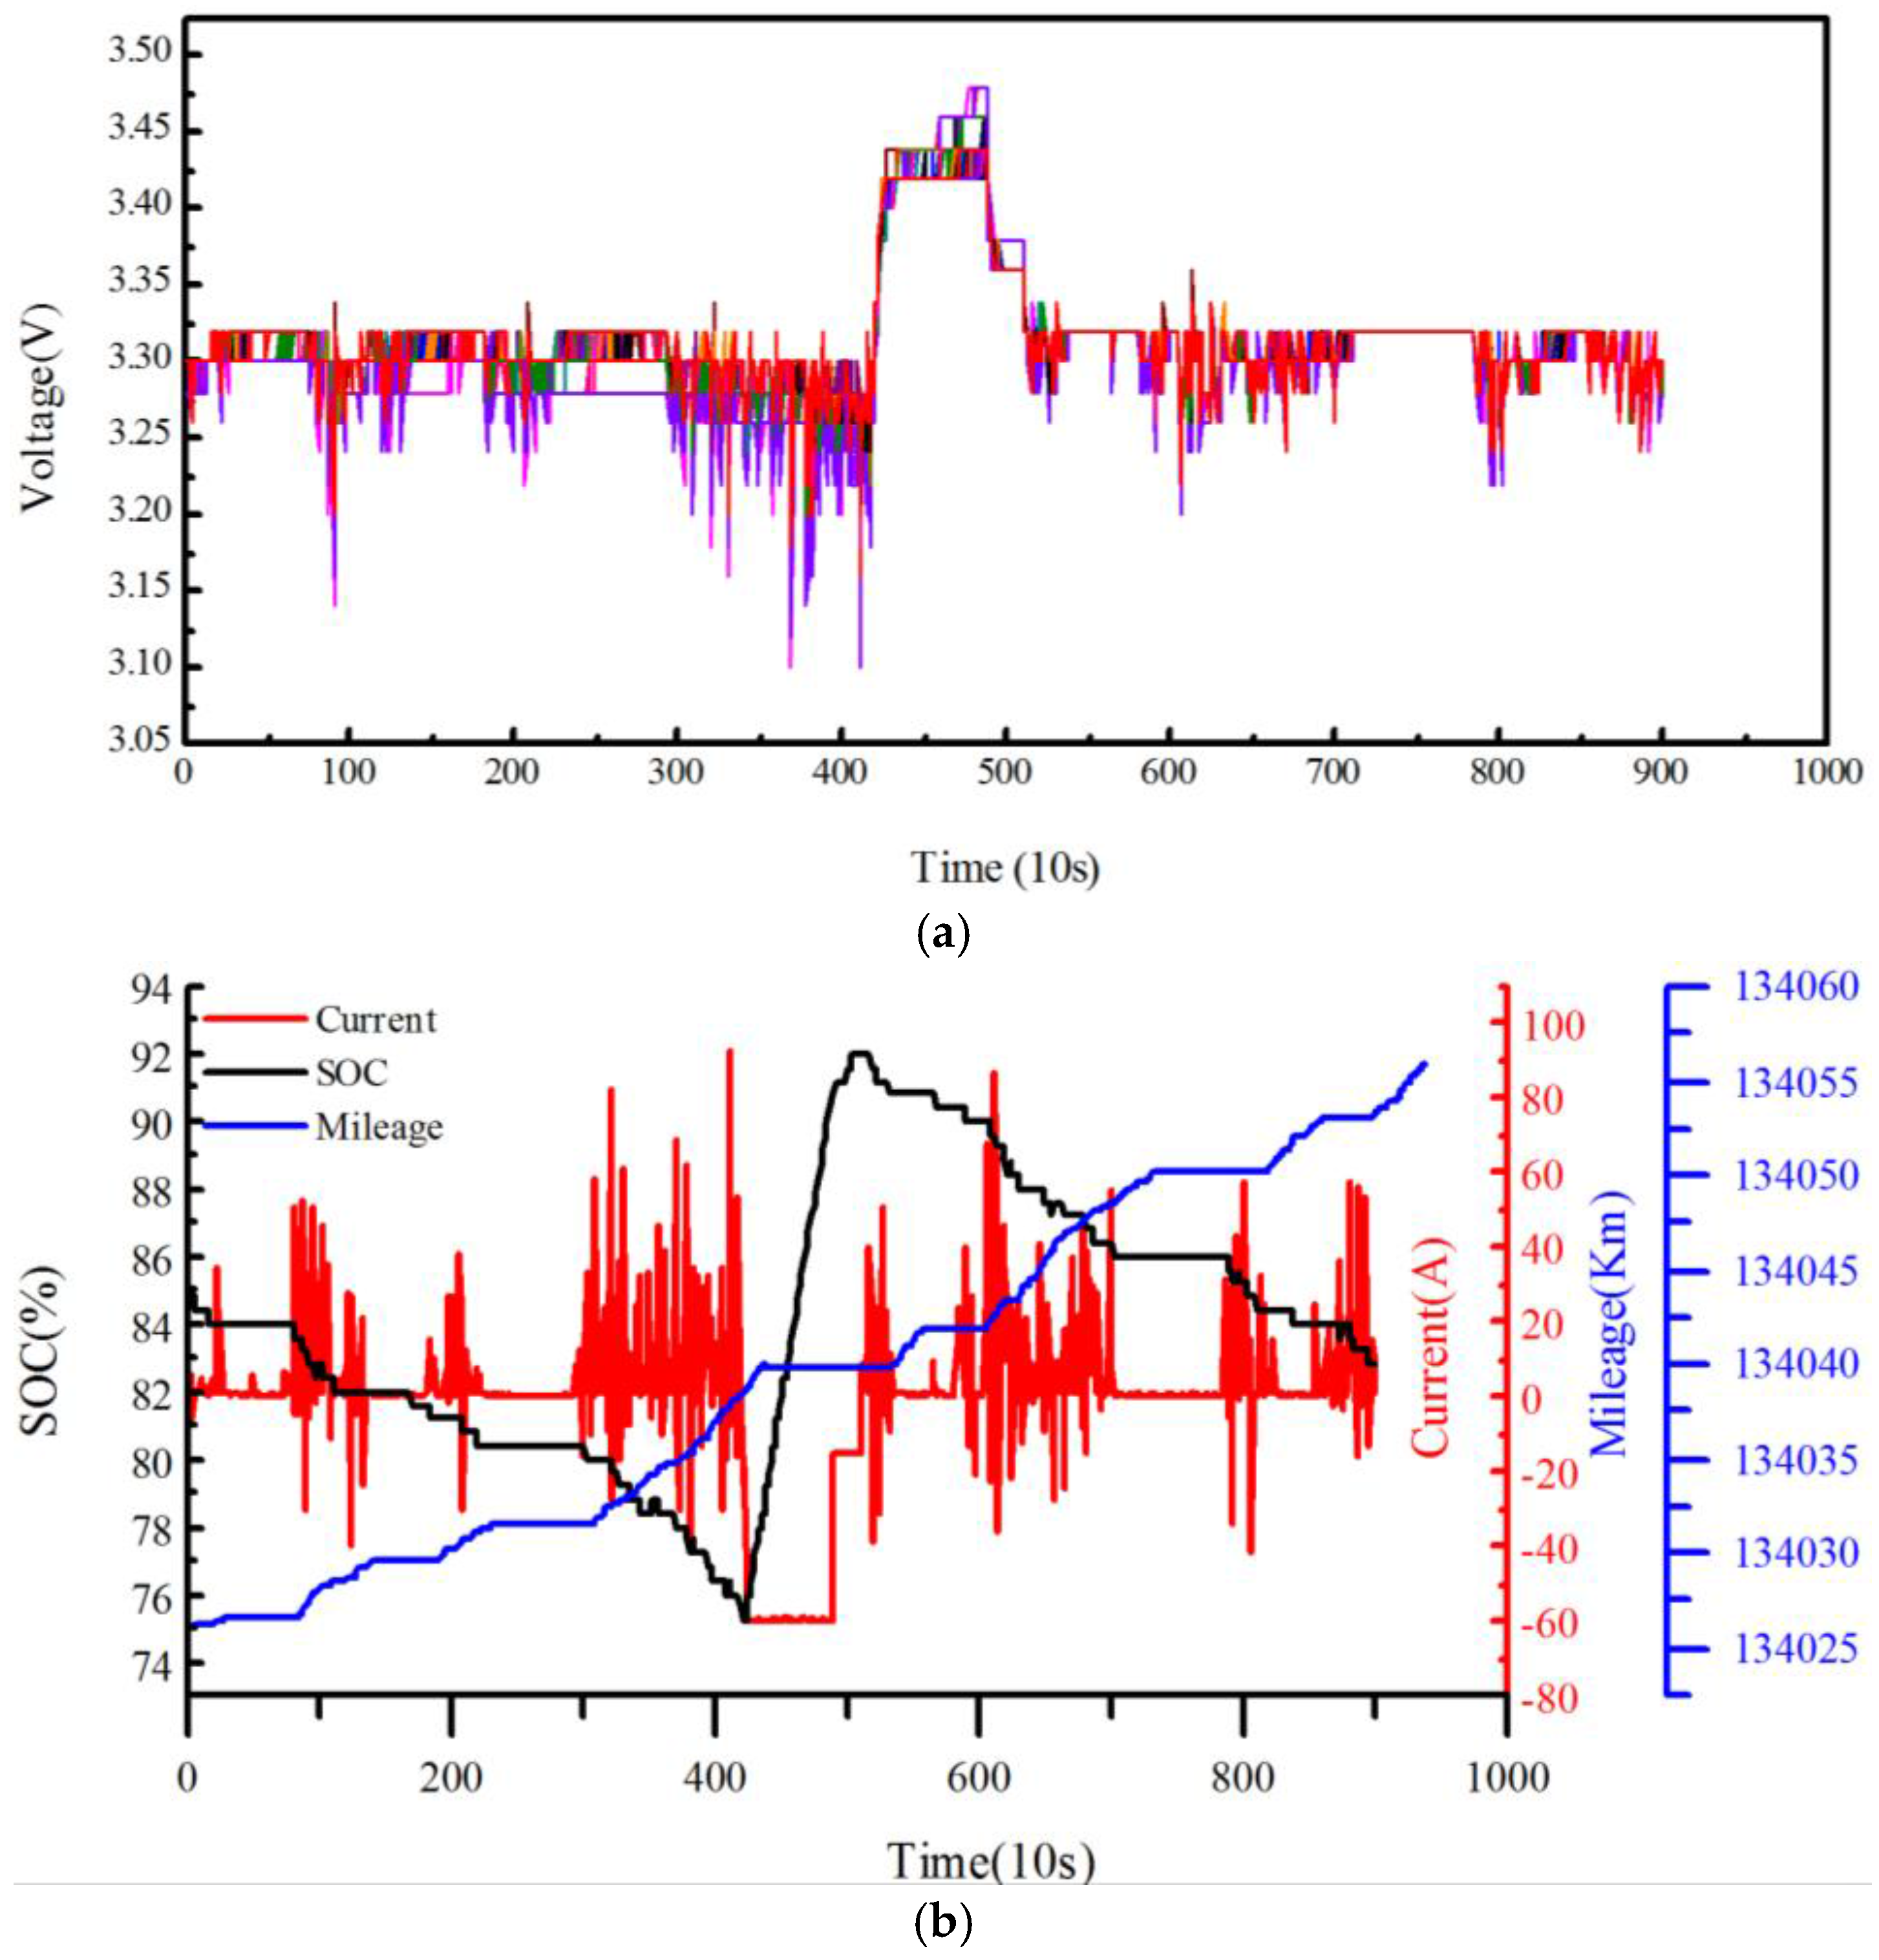
Figure 9.
Score of all cells for Vehicle 2.

Figure 10.
Comparison curve of the coefficient of variation (CV) and entropy method of Vehicle 2 on 8 May 2016.
Figure 10.
Comparison curve of the coefficient of variation (CV) and entropy method of Vehicle 2 on 8 May 2016.

Figure 11.
Comparison curve of CV and entropy method of Vehicle 1 during period 2.

Table 1.
National standard information collection items. DC: Direct Current; SOC: state of charge.
| Data Type | Data Item | Specific Items |
|---|---|---|
| Static data | Registration information | registration date, license plate, vehicle power type, the total number of power battery packs, vehicle terminal number, and so on |
| Dynamic real-time data | Cell voltage data | cell voltage, total voltage |
| Cell temperature data | temperature probe number, cell temperature | |
| Vehicle state data | vehicle speed, mileage, gears, running mode, DC-DC state, SOC, and so on | |
| Electric part data | driving motor number, driving motor state, driving motor serial number, motor voltage, motor temperature, and so on | |
| Extremum data | maximum cell voltage, minimum cell voltage, maximum temperature probe serial number, maximum temperature, minimum temperature probe serial number,minimum temperature, and so on |
Table 2.
of Vehicle 1.
| Cell Number | |
|---|---|
| 47 | 0.00030 |
| 56 | 0.00022 |
| 37 | 0.00022 |
| 52 | 0.00017 |
| 18 | 0.00016 |
Table 3.
of Vehicle 1 at different periods.
| Date | Cell Number | |
|---|---|---|
| 30 December 2016 | 47 | 0.00030 |
| 12 October 2016 | 47 | 0.00007 |
© 2018 by the authors. Licensee MDPI, Basel, Switzerland. This article is an open access article distributed under the terms and conditions of the Creative Commons Attribution (CC BY) license (http://creativecommons.org/licenses/by/4.0/).
Share and Cite
MDPI and ACS Style
Liu, P.; Sun, Z.; Wang, Z.; Zhang, J. Entropy-Based Voltage Fault Diagnosis of Battery Systems for Electric Vehicles. Energies 2018, 11, 136. https://doi.org/10.3390/en11010136
AMA Style
Liu P, Sun Z, Wang Z, Zhang J. Entropy-Based Voltage Fault Diagnosis of Battery Systems for Electric Vehicles. Energies. 2018; 11(1):136. https://doi.org/10.3390/en11010136
Chicago/Turabian StyleLiu, Peng, Zhenyu Sun, Zhenpo Wang, and Jin Zhang. 2018. "Entropy-Based Voltage Fault Diagnosis of Battery Systems for Electric Vehicles" Energies 11, no. 1: 136. https://doi.org/10.3390/en11010136
Note that from the first issue of 2016, this journal uses article numbers instead of page numbers. See further details here.