
Optimal Scheduling Strategy for Domestic Electric Water Heaters Based on the Temperature State Priority List


1
Key Laboratory of Smart Grid of Ministry of Education, Tianjin University, Tianjin 300072, China
2
China Electric Power Research Institute, Beijing 100192, China
3
Department of Electrical Engineering, Northeast Electric Power University, Jilin 132012, China
*
Author to whom correspondence should be addressed.
Energies 2017, 10(9), 1425; https://doi.org/10.3390/en10091425
Submission received: 30 August 2017
/
Revised: 12 September 2017
/
Accepted: 14 September 2017
/
Published: 18 September 2017
(This article belongs to the Section F: Electrical Engineering)
Abstract
:With the rapid growth of thermostatically controlled loads, active power fluctuation and peak demand growth within an autonomous micro-grid become serious problems. This paper tries to suppress power fluctuation and shave peak demand for a micro-grid through optimizing domestic electric water heaters (controllable load). In this paper, domestic electric water heater models are first built to optimize power flow within a single water heater. Subsequently, the Monte Carlo method is proposed to simulate power consumption of a cluster of domestic electric water heaters. After that, the temperature state priority list method is presented to suppress power flow and shave peak demand for a given micro-grid. Optimization results show that the proposed temperature state priority list method can reduce peak demand by 12.5%. However, it has a wider active power fluctuation range and needs a longer reaction time compared with the simplified temperature state priority list method. In addition, the optimization results show that by increasing the number of controllable loads participating in load scheduling, active power fluctuation can be reduced and the maximum active power of the given micro-grid can be cut. However, to achieve this, about 1.2% of extra electrical energy needs to be generated by the external grid.
1. Introduction
In recent years, the rapid growth of residential loads, especially for thermostatically controlled loads, has caused serious problems for power systems’ stable and economical operation [1,2]. Therefore, an effective thermostatically controlled load control strategy is urgently needed, because it is not only conducive to optimize energy utilization, but also helpful for relieving power system operational stress.
As a major form of thermostatically controlled loads, domestic electric water heater has distinct advantages of easy control and stable power consumption. In addition, it has the great potential to store energy in advance, to suppress power system power fluctuation and to shave peak demand for systems [3]. Because of the aforementioned advantages, a growing number of research that is related to the optimization of domestic electric water heater schedule strategy have been conducted.
To make an effective thermostatically controlled load control strategy, it is important to change domestic users’ power consumption habits with the help of demand response technology [4]. Meanwhile, it is necessary to schedule controllable loads to meet power system requirements quickly. Direct load control is a typical demand response technology which is based on the incentive mechanism. To be specific, direct load control strategy tries to reduce power consumption at peak demand/price time in a day through monitoring of the power signal or price signal. However, to effectively control thermostatically controlled loads, an outstanding thermostatically controlled load model should be built in advance.
At present, existing thermostatically controlled load models are good enough to solve energy-related problems; however, more advanced models are being proposed to improve previous models. In [5], a residential load scheduling model is developed and it considers psychological factors which can affect domestic users’ power consumption habits. In [6], a thermodynamic model representing the power system load due to hot water consumption from storage water heaters is provided. This model makes it possible to predict the effects of load control and is also useful for evaluation of the response which could be expected from demand-side management options. Luo et al. develops an operational planning framework for large-scale thermostatically controlled load dispatch in [7]. To achieve this goal, a thermal comfort model is employed to estimate the occupants’ thermal comfort degree. Based on domestic electric water heater’s thermodynamic characteristics, a precise model of single domestic electric water heater is proposed in [8,9]. This model can reflect different operation conditions of a domestic electric water heater, but is too complex to be used for load scheduling.
Based on the proposed thermostatically controlled loads models, different thermostatically controlled load control strategies have been presented for load scheduling or frequency regulation and have been verified in [10,11,12,13,14,15,16], respectively. In [10], a novel decentralized demand control strategy for family-friendly controllable refrigerators considering customer comfort level is proposed to regulate the frequency of an autonomous micro-gird in coordination with the energy storage system, and a benchmark low voltage autonomous micro-gird is established as a test system to verify the effectiveness of the proposed decentralized demand control strategy. A dynamic frequency regulation strategy, which uses residential thermostatically controlled appliances to alleviate frequency deviations caused by high penetration of renewable energy sources in the power system, is demonstrated in [11]. A demand-side response system for frequency control in agreement with suggestions proposed by the European Network of Transmission System Operators for Electricity is illustrated in [12]. Masuta et al. proposes a new supplementary load frequency regulation method through the use of a number of electric vehicles and heat pump water heaters as controllable loads in [13]. The effectiveness of the proposed load frequency regulation method is shown by numerical simulations conducted on the power system model with a large integration of wind power generation and photovoltaic generation. In [14], a direct load control strategy for domestic electric water heater is proposed to accommodate wind power generation in Hokkaido, which indicates that the acceptable wind power generation increases almost three times. Belov et al. proposes a way to alleviate customer comfort concerns by pre-storing additional energy in electric loads before their disconnection from the grid in [15].
The aforementioned works provide basic theory for load scheduling; however, there are still some issues that need to be tackled. To be specific, most of existing studies try to apply demand response technology through changing domestic users’ power consumption pattern. However, few of the proposed strategies take domestic users’ comfortable level into account, which may drop off domestic users’ interest in participating in demand response.
Therefore, it is necessary to analyze domestic users’ power consumption patterns and to effectively optimize domestic electric water heater systems without influence users’ comfort level. More recently, the state list-based method and the Monte Carlo simulation method have been introduced in [16,17] to predict short-term loads and to optimize power plants. The Monte Carlo simulation method is employed to create a short-term load forecast of an individual domestic electric water heaters in [16]. It simulates load characteristics with full consideration of the randomness of residential loads; moreover, it presents a model to estimate the relative error of the aggregated load forecast. On the basis of the state-queuing control strategy, [17] proposes a queuing-controlled strategy with lock on and off constraints for controlling an efficient power plant consisting of water heaters.
Based on the aforementioned papers, this paper first simplifies the equivalent thermodynamic parameter model of a domestic electric water heater, and then applies the Monte Carlo method to simulate users’ power consumption behavior. After that, this paper proposes a load scheduling strategy which is based on the temperature state priority list to suppress active power fluctuation in an autonomous micro-grid. Therefore, the contributions of this paper can be summarized as follows:
- (1)
- The priority list strategy is first proposed, incorporating domestic electric water heaters’ temperature state and domestic users’ comfort level. In addition, to validate the effectiveness of the proposed temperature state priority list method, a simplified temperature state priority list method is applied to compare simulation results.
- (2)
- The Monte Carlo method is proposed to model power consumption of a cluster of domestic electric water heaters, and in this progress, the uncertainty of water heaters has been fully considered by analyzing probability distribution of different water heaters’ parameters.
- (3)
- The state of the art of domestic electric water control system is first introduced in this paper, and this paper reveals how to monitor and control loads and power generation systems by Colorbox and energy manage systems.
2. Domestic Electric Water Heater Models
As mentioned in the previous section, domestic electric water heaters have great potential in peak shaving. In addition, an optimal domestic electric water heater control strategy can reduce domestic users’ total electricity consumption and bills [18]. Therefore, it is critical to propose a domestic electric water heater power flow model and an electric water heater load control model for optimizing the operation of electric water heater systems in domestic buildings. In this section, two simplified domestic electric water heater models are introduced.
2.1. Domestic Electric Water Heater Power Flow Model
Figure 1 shows power flow in a domestic electric water heater, and it reveals that electric power injected into a domestic electric water heater can be used to heat cold water and compensate for thermal loss. Therefore, the equivalent thermodynamic model of a domestic electric water heater can be expressed as:
where Ee represents for the input electrical energy (J), Eout and Ein are the output hot water thermal energy (J) and the input cold water thermal energy (J), and L is the thermal loss (J) of the tank.
Considering the fact that domestic electric water heater has relatively good performance on thermal insulation and normally takes a very short time to heat water, therefore, heat exchange between inside and outside of the tank (L) can be neglected when the water is heating. In addition, due to the fact that water temperature in a domestic electric water tank has a very small difference [5], water temperature in the tank is supposed to be uniform in this paper. Therefore, a simplified equivalent thermodynamic model of a domestic electric water heater in time domain can be expressed as:
where Q(t) is the power consumption rate (J/s), ρ is density of the water (kg/m3), c is specific heat capacity of water (J/kg·°C), V is volume of the tank (m3/s), V(t) is the user’s water consumption rate (m3/s), T(t) is the real-time water temperature (°C) and Tin is the input cold water temperature (°C).
For a time period [t0, t], given Q(t) = Q and V(t) = VD, then the real-time water temperature can be formulated as:
In (3) τ and K are the time constant and coefficient, which can be expressed as:
2.2. Domestic Electric Water Heater Load Control Model
It is always preferable to keep water in a domestic electric water heater within a preset range [TL, TH], and water in the tank is normally heated when its temperature is lower than the minimum desirable temperature. Therefore, domestic electric water tank power consumption at time t can be described as:
In (6), Ph refers to electrical power used to heat water (J/s), and when the domestic electric water heater is switched on, Ph equals to Q. TL and TH represent the minimum desirable temperature and maximum desirable temperature (°C), respectively. However, this load control model may result in frequent switching and reduce energy efficiency. Therefore, to reduce the number of switching and to keep the water temperature within the desirable temperature after it reaches the targeted value, in this paper Pk is the electrical power designed to compensate the thermal loss when the water temperature is between the minimum and the maximum preset water temperature. Therefore, domestic electric water heater power consumption at time t can be modified as:
This section introduces the domestic electric water heater power flow and load control model. In the next section, physical structure of domestic electric water heater control system will be introduced.
3. Domestic Electric Water Heater Control System
To achieve precise domestic electric water heater control, the temperature of the water in the tank and the states of the domestic electric water heater should be recorded accurately. Colorbox is a device that can be used to collect and record room temperature, real-time air conditioner switch states and temperature, and it has been widely used in the direct load control of air conditioners [19].
In this paper, a similar device with the same function is supposed to be equipped in the demand side to collect and to record the domestic electric water heater’s temperature and operation states, however, this device has not yet been produced in real world. In addition, this device has other two functions: selecting demand response levels and controlling the domestic electric water heater. Figure 2 shows a domestic electric water heater control system with the Colorbox installation.
In Figure 2, there are four buttons in the Colorbox that can be used to control demand response levels. Users can convey their level of involvement into demand response by selecting different colors. Also, the Colorbox can collect and record the controllable load’s (domestic electric water heater) information, and then deliver it to the energy management system. The energy management system receives information from the Colorbox, uncontrollable loads and distributed energy generators. After that, the management system begins to analyze these data, decide the state of the domestic electric water heater and then send the state back to the Colorbox. Finally, the Colorbox implements the demand to realize the domestic electric water heater control.
4. Monte Carlo Simulation for a Cluster of Domestic Electric Water Heaters
The previous two sections have introduced single domestic electric water heater control models and the physical structure of the control system of a single domestic electric water heater. However, the operation of a single domestic electric water heater has great uncertainty; therefore, it is inappropriate to use a single domestic electric water heater load curve to represent water heater load characteristics. In addition, the great uncertainty of a single domestic electric water heater operation makes it difficult to predict the load, which makes it difficult to implement day-ahead load control for power systems.
In this paper, multiple domestic electric water heaters grouped in a cluster are used as samples to simulate load characteristics by the Monte Carlo method based on the single domestic electric water heater models proposed in Section 2. Then, the simulation result will be used to schedule a cluster of domestic electric water heaters in Section 5.
According to Equations (3)–(5), power consumption of the nth domestic electric water heater can be expressed as:
where Pn is the power consumption rate of the nth domestic electric water heater (J/s), Vn is volume of the nth tank (m3/s), Vn(t) is the nth user’s water consumption rate (m3/s), Tn(t) is the nth domestic electric water heater real-time water temperature (°C), and Tin.n is input cold water temperature of the nth domestic electric water heater (°C).
Equation (8) reveals that the power consumption rate of the nth domestic electric water heater can be affected by the operation time, the amount of hot water consumption, the preset hot water temperature and the input cold water temperature. To simplify calculation and improve the accuracy of Monte Carlo simulation results, all the parameters used for simulation have been pre-processed while taking the system’s uncertainty into account. Table 1 shows important domestic electric water heater system parameters’ probability distributions. The parameters in Table 1 are based on specifications (handbook), users’ preference and experiment validation, and the main reason for selecting normal distribution is that it can clearly show the mean and the standard deviation of samples.
In Table 1, α is a coefficient, Taim.n is the nth water heater’s targeted temperature (°C) and ΔVn.n is water demand of the nth water heater (L). Before simulation, two assumptions need to be highlighted:
- Based on experiment measurements, the domestic electric water heater’s power consumption is nearly directly proportional to the volume of the hot water tank. Therefore, for the simplification of calculation, the domestic electric water heater’s power consumption used for the Monte Carlo simulation is assumed to be directly proportional to the volume of the hot water tank in this paper.
- Tap water temperature is approximately the same in a certain region. However, considering the fact that ambient room temperature may fluctuate, the input water temperature is set as 17 °C and the variance is set as 0.15 °C.
In this section, the Monte Carlo load characteristics simulation method has been introduced to model controllable loads. In the next section, the Temperature State Priority List method is proposed to optimize load scheduling for a cluster of domestic electric water heaters.
5. Temperature State Priority List Method for Load Scheduling
As shown in Figure 2, there are four buttons, which are Green, Yellow, Red and Black, in the Colorbox that can be used to control demand response levels. The order of colors (green, yellow, red and black) represents response (priority) levels from high to low. In this paper, water heaters can be categorized as follows:
In (9), Gt, Yt, Rt and Bt represent sets of domestic electric water heaters which are categorized into green, yellow, red and black response levels at time t. gtn, ytn, rtn and btn represent the index of nth water heaters allocated in the green, yellow, red and black sets, respectively. N1t, N2t, N3t and N4t are the numbers of domestic electric water heaters in each set, respectively and satisfy:
where N is the sum of the number of domestic electric water heaters in each set.
Now, the temperature state values (ε) for domestic electric water heaters are introduced to reorder the elements within each set. To determine the order of domestic electric water heaters in each set, water temperature, the time interval from the present to user’s expected operation time and the current domestic electric water heater operation state need to be considered. Therefore, the mathematical expression of temperature state values can be written as follows:
In (11), Tnt is the nth water heater’s temperature at time t (°C), tn.s and tn.e are the start time and the end time that the domestic electric water heater is used for taking a shower by domestic users (s), Taim.n is the nth water heater’s targeted temperature, and td is the total sampling time of a day (s).
Equation (11) reveals that domestic electric water heater’s temperature state value is close to 1 if the water temperature in the tank is close to the targeted temperature and time t is close to the time that domestic electric water heater is occupied by users. In other words, the water heater is in high response (priority) level if its water temperature is low and it has longer time interval from the present time to the user’s expected operation time. Therefore, temperature state priority list can be formulated as:
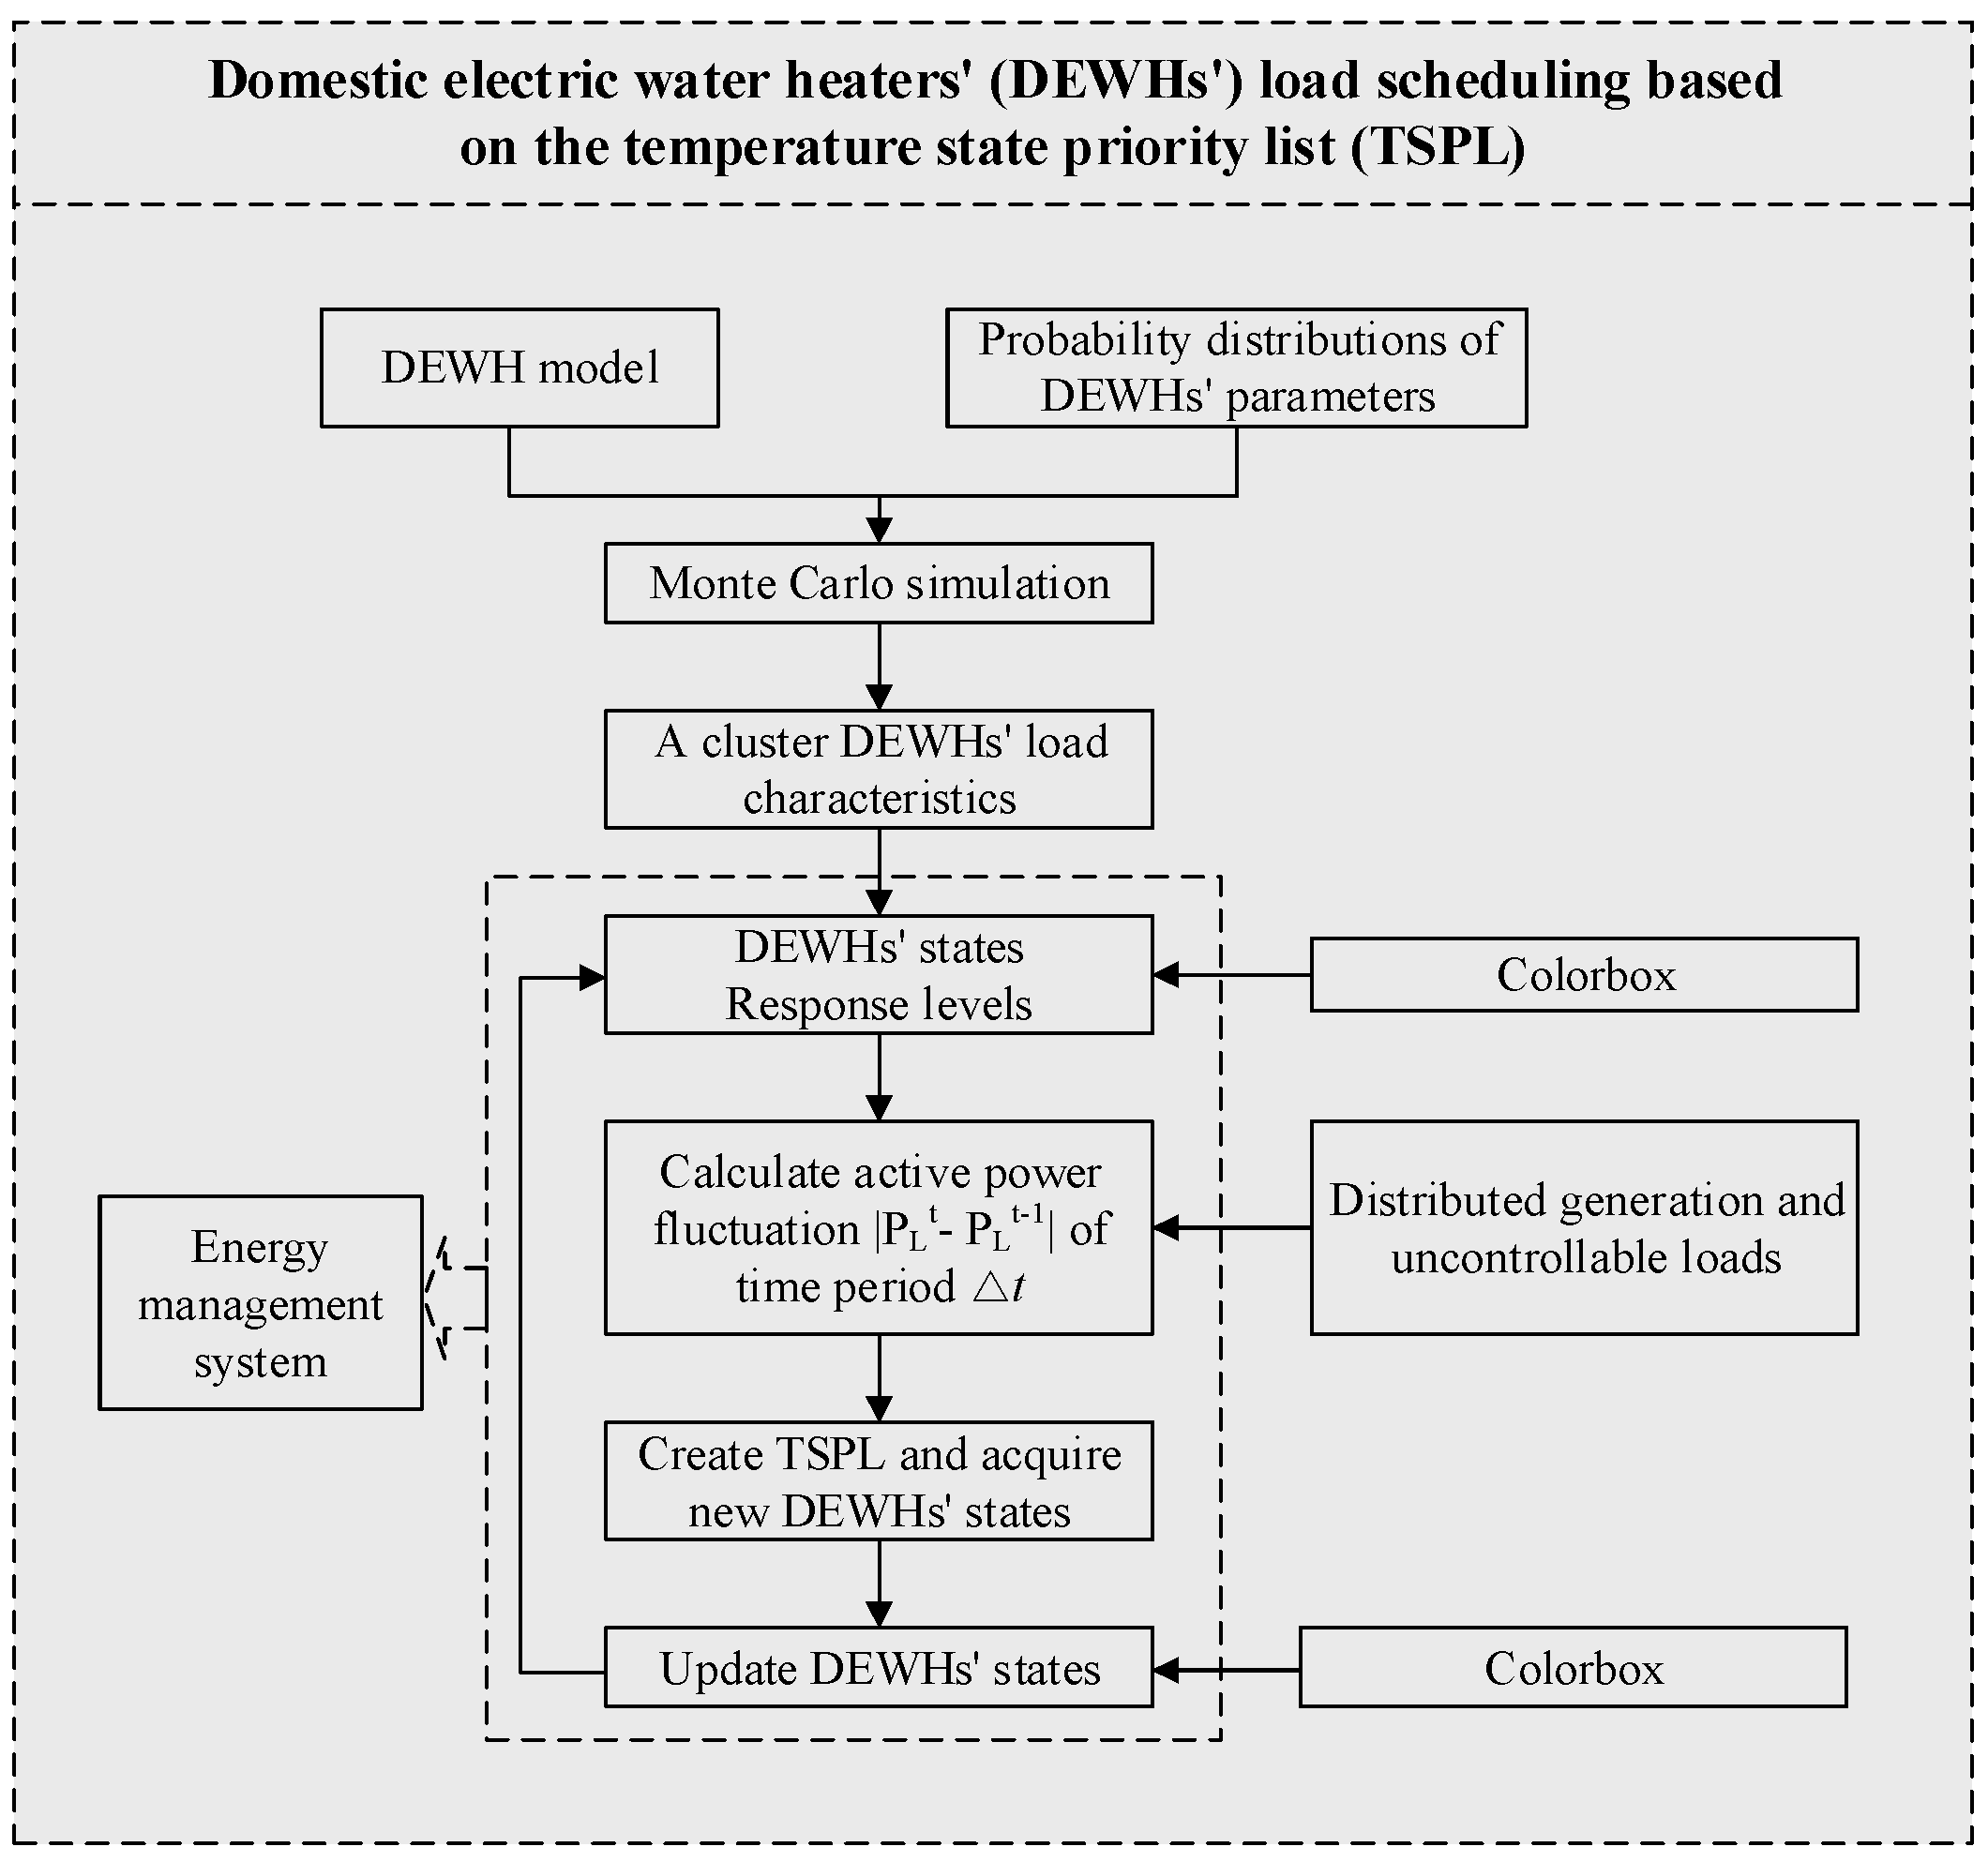
In (12), , , and represent the nth elements in the reordered green, yellow, red and black sets, respectively. To suppress power system active power fluctuation and shave peak demand, this paper proposes a load scheduling strategy shown in Figure 3 based on the temperature state priority list.
As shown in Figure 3, the temperature state priority list load scheduling method can be summarized as:
Step 1: The energy management system receives domestic electric water heaters’ current response levels and current status from domestic Colorboxes, confirms load scheduling levels and divides domestic electric water heaters into different sets.
Step 2: Calculate the active power fluctuation rate based on Equation (13).
where PLt is the net active power at time t and δ is the power fluctuation rate. If , the net active power at time t tends to increase, otherwise the net active power tends to decrease. Therefore, domestic electric water heaters should be switched off to shave peak demand when the net active power tends to increase and switched on to fill valley demand when the net active power tends to decrease. This control method can be applied to reduce power system active power fluctuations.
Step 3: Calculate the temperature state value of each domestic electric water heater and reorder these values from low to high in each group. Then, change the states of domestic electric water heaters based on the temperature state priority list, and record all changes. Finally, stop change water heaters’ state when the total active power used to load schedule equals to power system active power fluctuation, which can be summarized as:
Step 4: Update and adjust domestic electric water heaters’ operation states, and return to Step 1 to schedule domestic electric water heaters for the next time period.
6. Case Study
This paper tries to schedule a cluster of domestic electric water heaters in a micro grid with the proposed temperature state priority list method. In this micro grid, 2000 domestic electric water heaters are treated as controllable loads and the load curve of 2000 water heaters is simulated by the Monte Carlo method, which has been demonstrated in Section 4. Figure 4 shows 2000 water heaters’ daily power consumption curve.
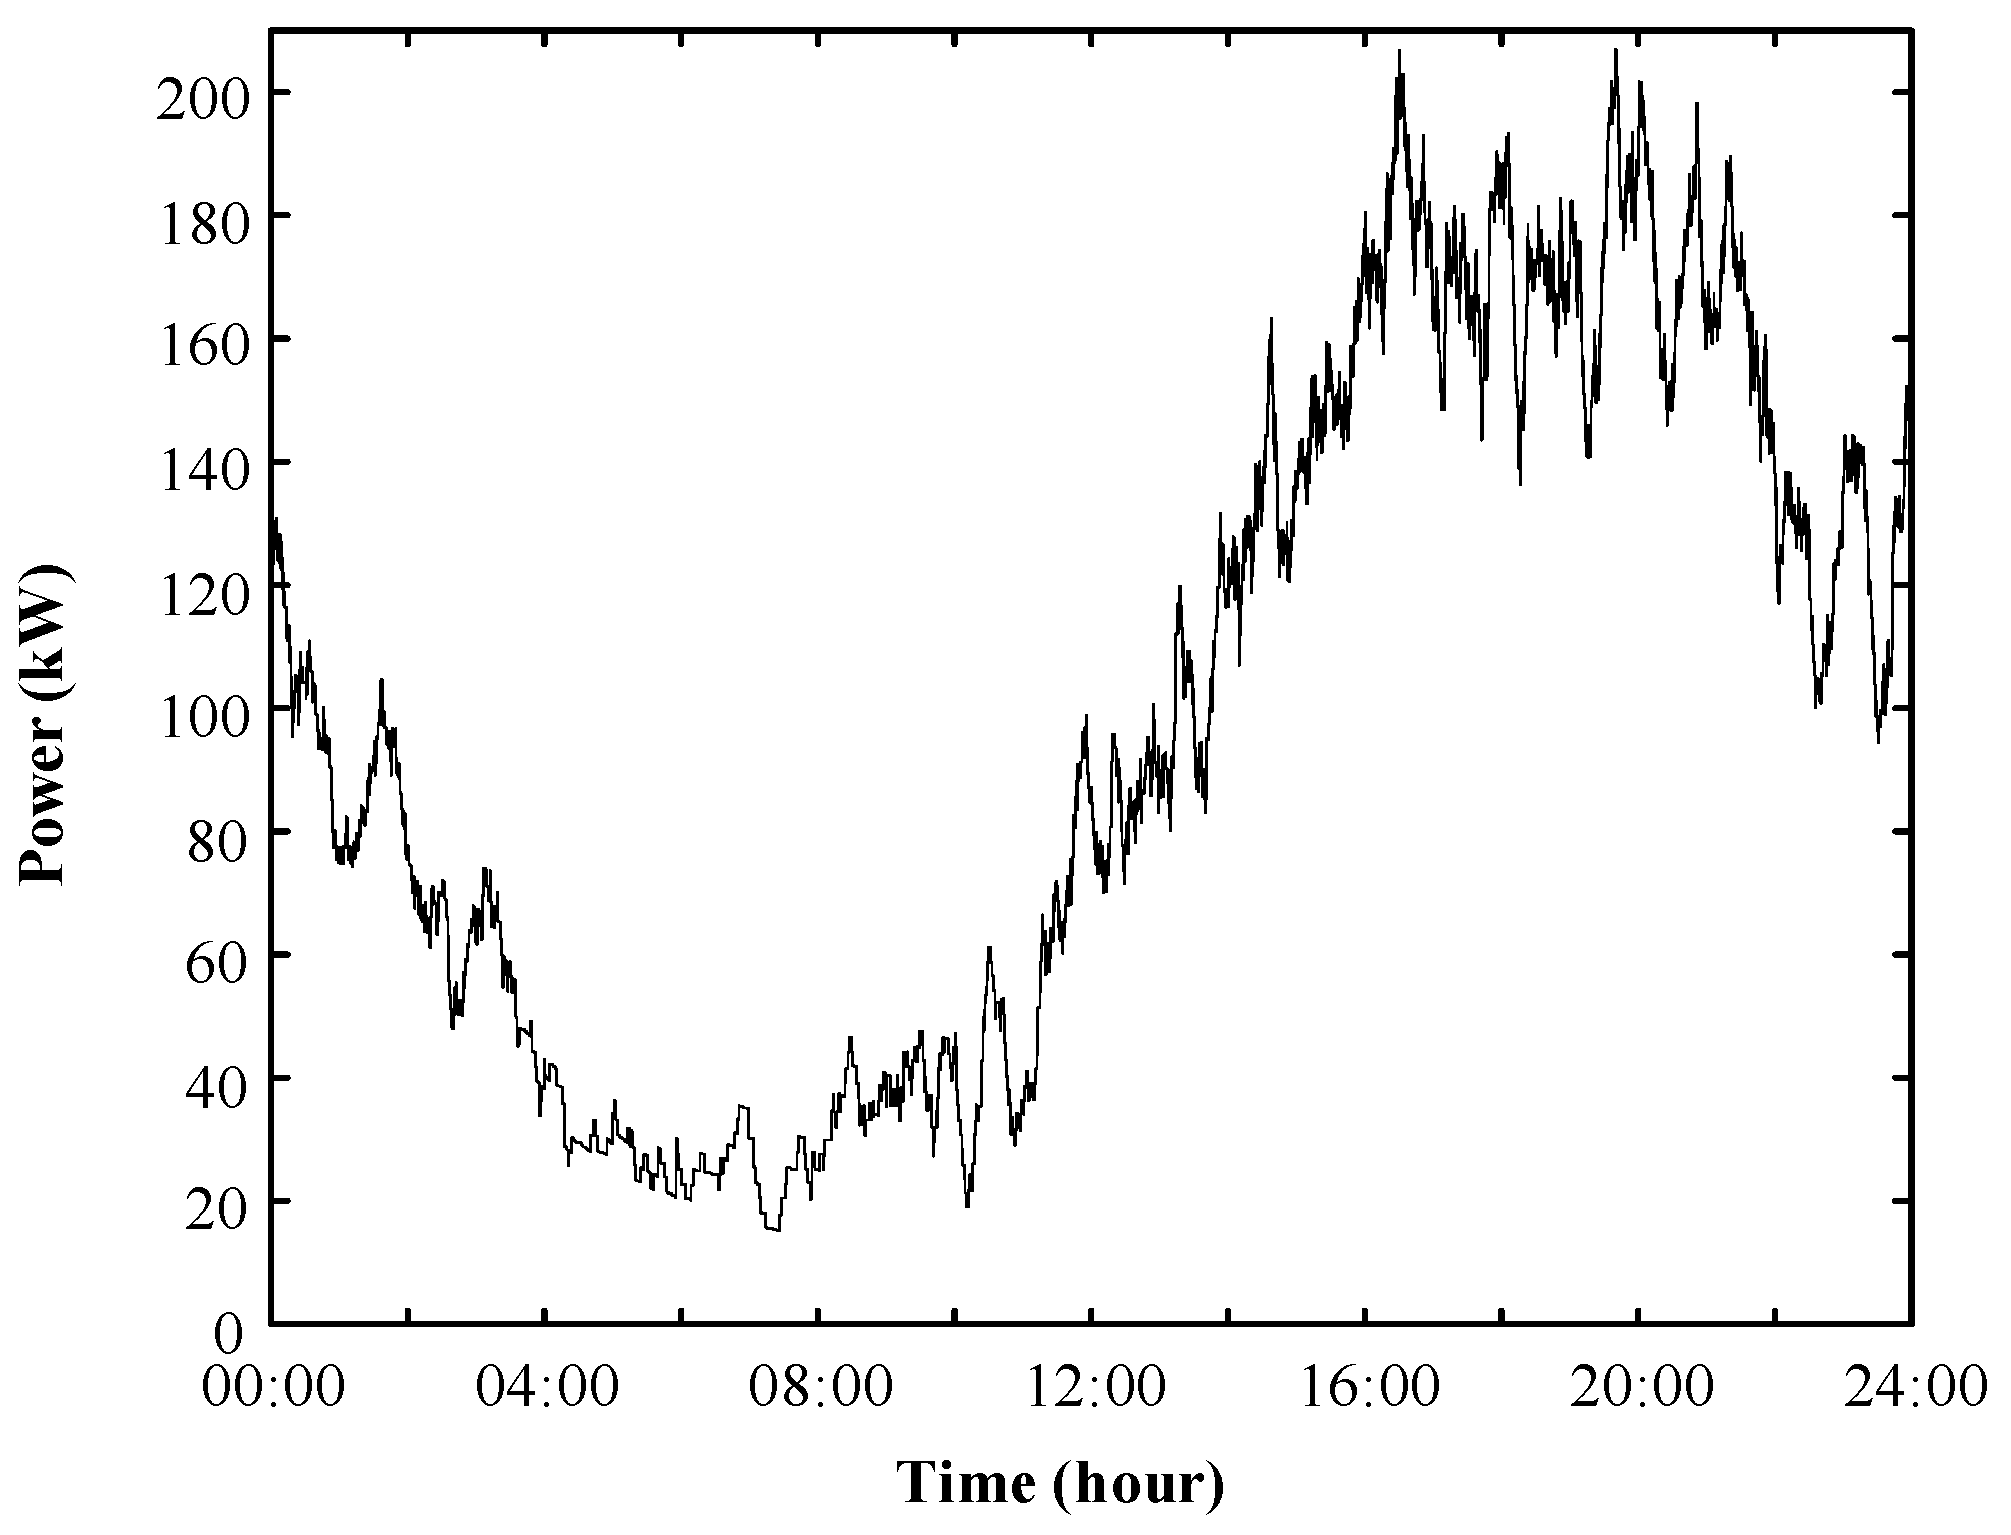
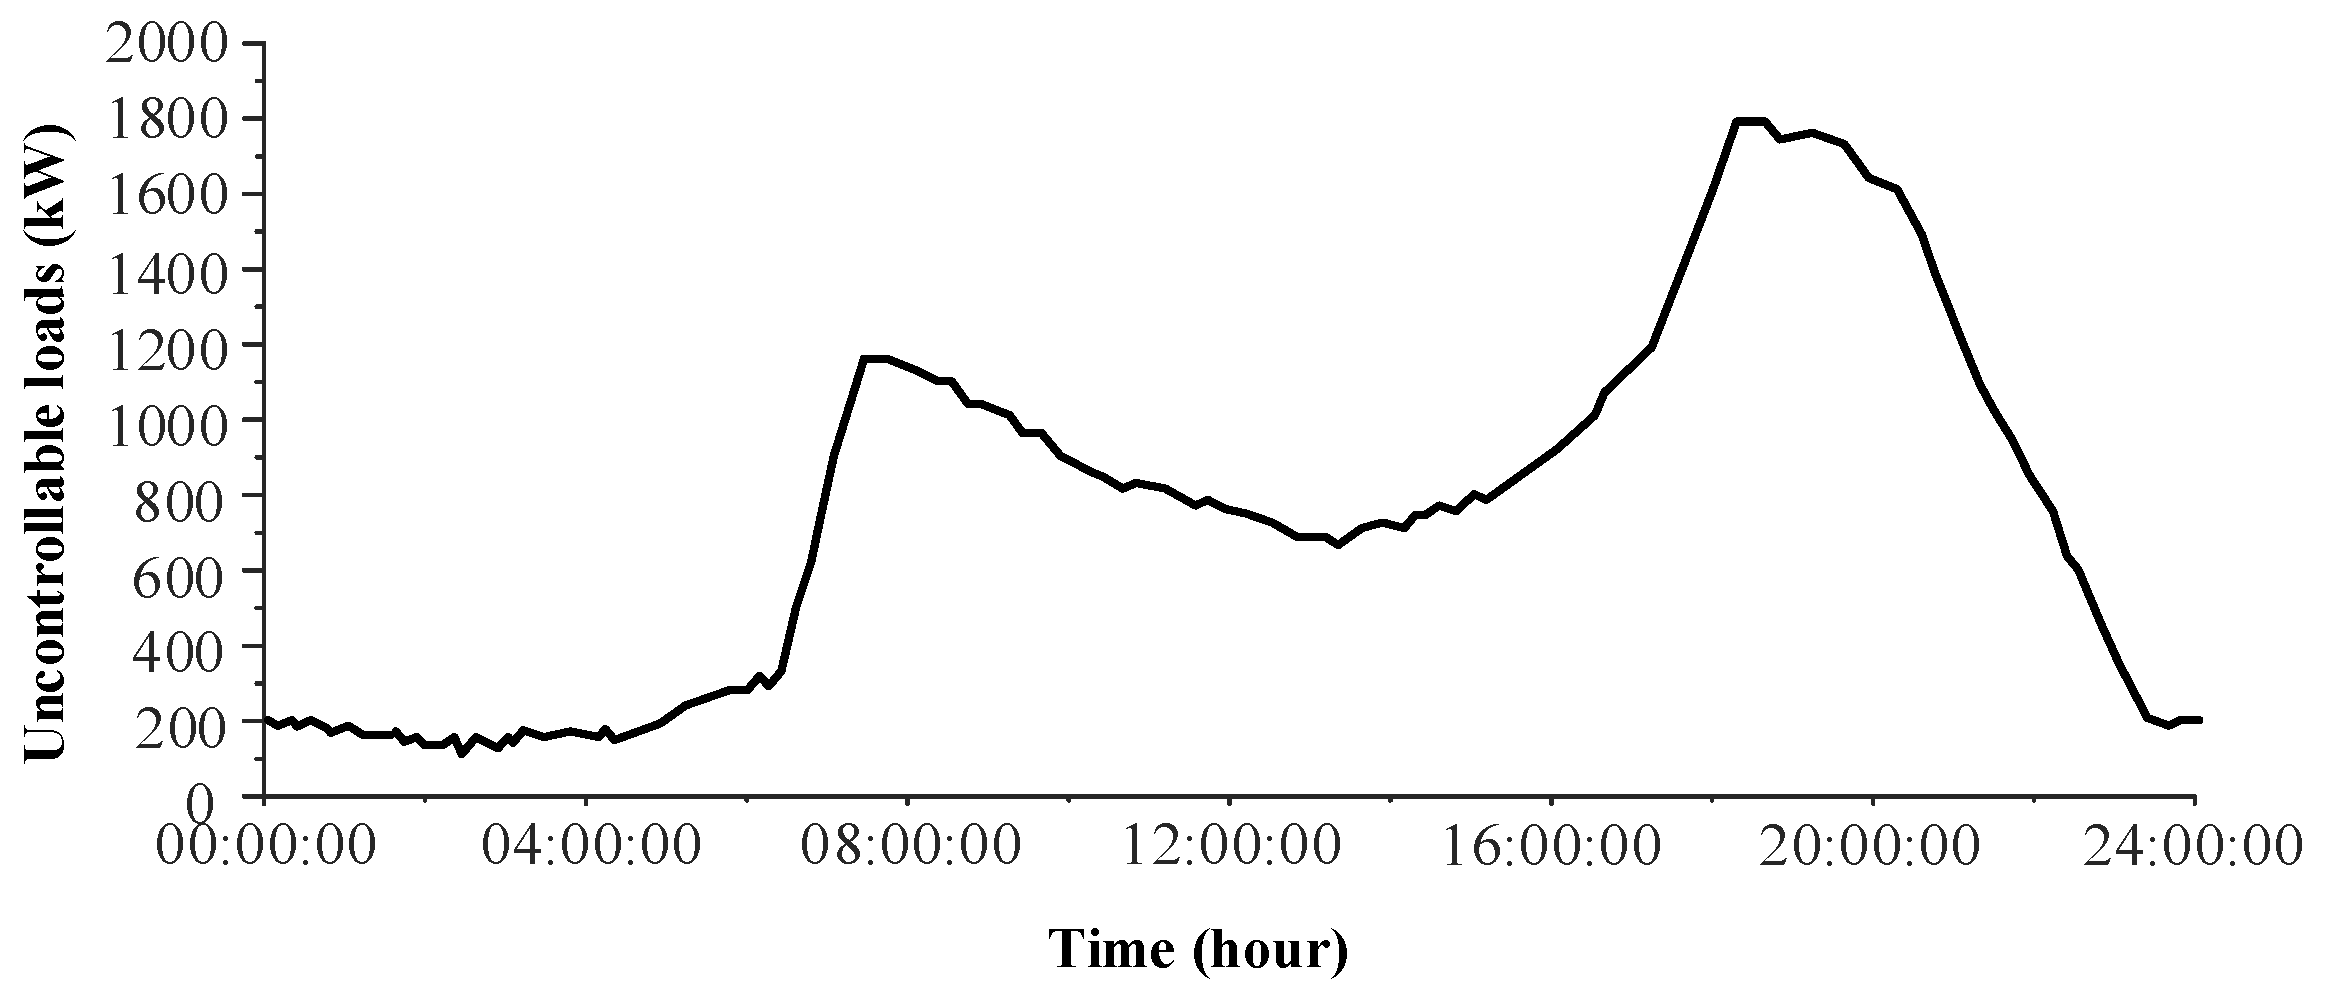
In addition, in this micro grid, distributed generations (photovoltaic power PS and wind power PW) and residential uncontrollable loads measured by Tianjin University will be jointly used to verify the efficacy of the proposed load scheduling method. Table 2 and Table 3 are the data sheet of the photovoltaic (PV) system and the wind power system. Figure 5 shows the daily renewable power generation curves and Figure 6 shows the micro-grid daily uncontrollable electrical load curve.
Therefore, extra power needs to be supplied by the external electricity grid system (Pex), which can be expressed as:
where PC and PUC are the daily controllable power consumption and the daily uncontrollable power consumption, respectively.
In the next section, the simplified temperature state priority list and the temperature state priority list control strategy are used to shave peak demand for the external grid system. Similar to the temperature state priority list method proposed in Section 5, the simplified temperature state priority list method also attempts to control domestic electric water heaters’ operation time for load scheduling, however, the main difference between the two methods is that the simplified temperature state priority list method ignores the states of a single domestic electric water heater. In other words, the simplified temperature state priority list method does not calculate the temperature state value for each individual water heater and does not sort the order of water heaters. Instead, water heaters that can participate in peak shaving are set in advance.
For the simplified temperature state priority list method, domestic electric water heaters labeled as 1751–2000 are set to participate in valley filling, and water heaters labeled as 1–2000 are set to participate in peak shaving. To effectively shave peak demand, all of the domestic water heaters are supposed to participate in peak shaving. However, to avoid introducing another peak in the daily load curve, only 250 water heaters are supposed to participate in valley filling. In addition, the simulation time step (∆t) is set as 300 s. The simulation time step selection compromises the conflict between optimization time and the accuracy of optimization results.
For the temperature state priority list method, two groups of data have been established to verify the efficacy of the proposed method. In group A, 1000 domestic electric water heaters are categorized in the green, yellow and red groups to participate in load scheduling and the rest of heaters are allocated in the black group, which does not participate in load scheduling. In group B, the number of heaters which participate in load scheduling is increased to 1500, and the number of heaters allocated in the black group is reduced to 500.
7. Result and Analysis
7.1. Active Power Supplied by the External Grid System
Figure 7 shows the real time active power supplied by the external grid system based on Equation (13). In case 1, renewable power generations (solar and wind) and controllable load are excluded. In cases 2 and 3, renewable power generations have been considered, however, case 2 ignores daily controllable power consumption.
According to cases 1 and 2 shown in Figure 7, the gap between maximum and minimum active power supplied by the external grid system is increased if renewable power generations are available. In addition, cases 2 and 3 indicate that without an appropriate schedule strategy, the access of controllable load (2000 domestic electric water heaters) can enlarge external grid active power fluctuation to some extent. Therefore, it has a great potential to reduce the gap between maximum and minimum active power supplied by the external grid system when domestic electric water heaters are scheduled in a proper way.
7.2. Simplified Temperature State Priority List Optimization
Figure 8 shows the simulation results of the simplified temperature state priority list method. Figure 8 indicates that the proposed simplified temperature state priority list method successfully reduces the maximum active power supplied by the external grid system. Moreover, this method can minimize the differences between the maximum power and the minimum power supplied by the external grid.
Figure 9 shows the real-time active power consumption of 100 domestic electric water heaters that participate in load scheduling. In Figure 9, the height of each color represents the real time active power consumption of a given domestic electric water heater, and the summit of the curve at a particular time represents the total power consumption of 100 domestic electric water heaters.
Figure 9 reveals that the proposed simplified temperature state priority list method has successfully shifted the controllable load (100 domestic electric water heaters) and has shaved peak demand for the micro-grid. However, this method can make a single domestic electric water heater stay in working condition for a long time, and this is undesired in practical operation.
7.3. Temperature State Priority List Optimization
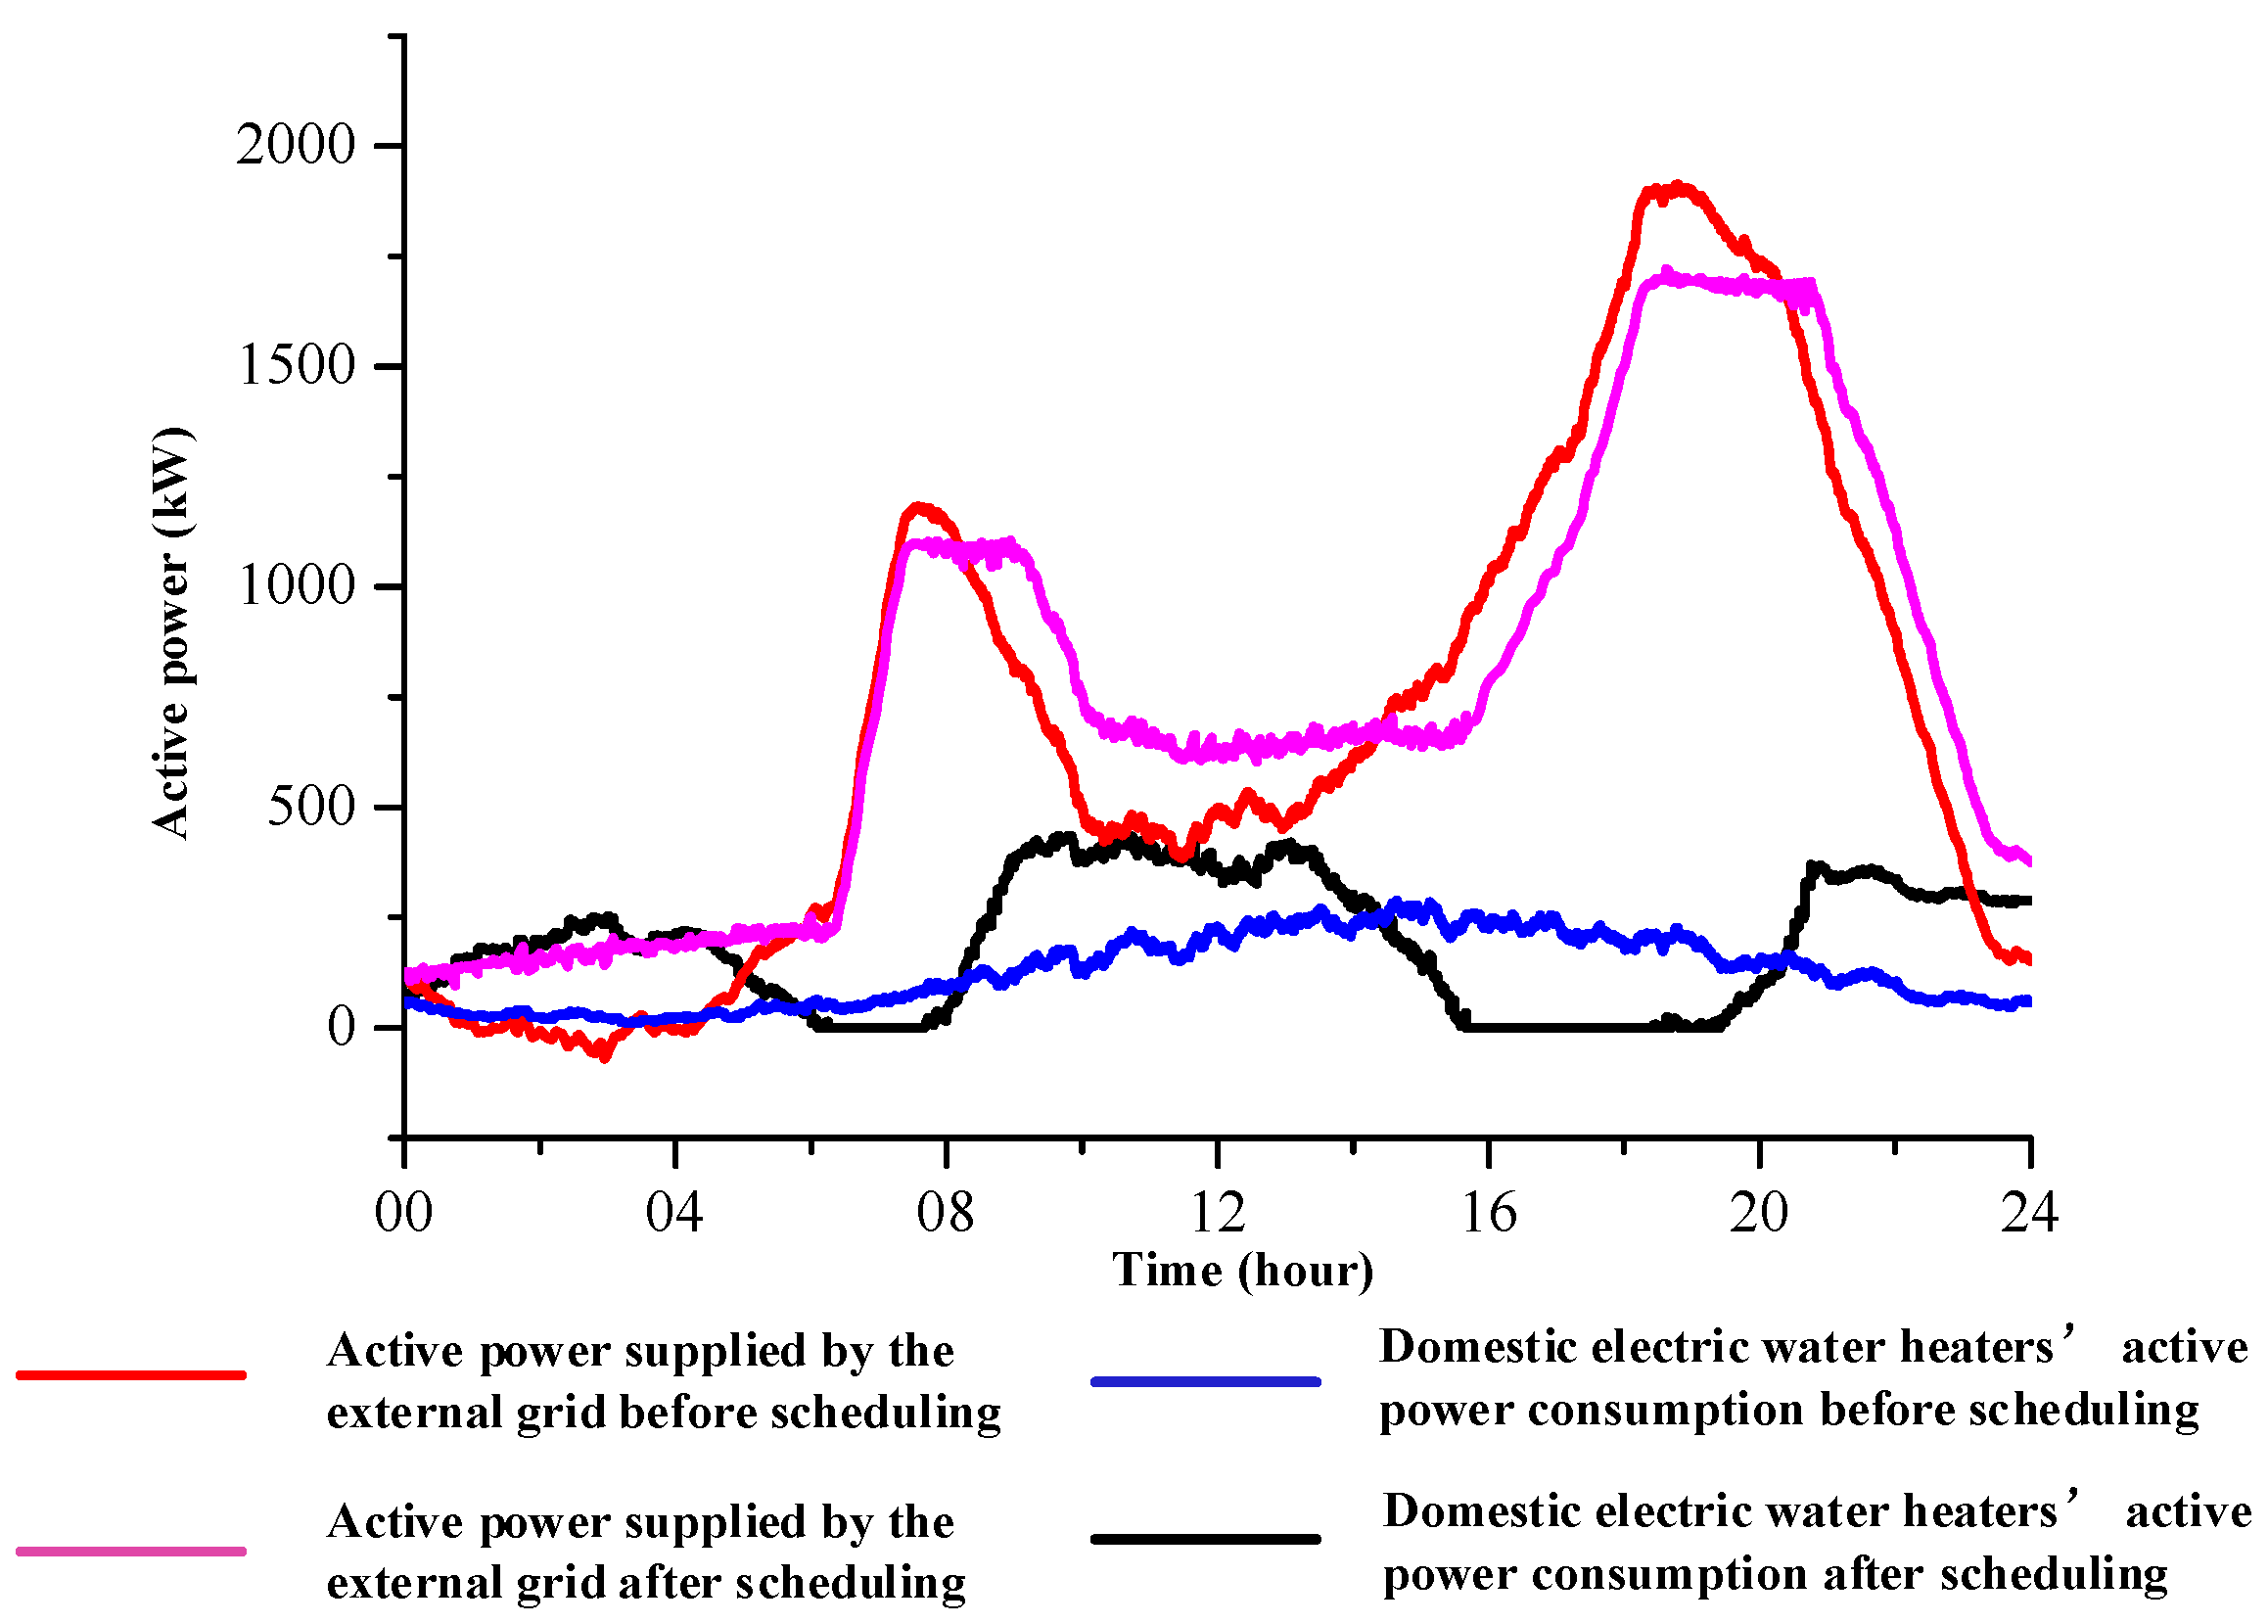
Figure 10 compares the optimization results of the simplified temperature state priority list and the temperature state priority list control strategies. Figure 10 indicates that both control strategies have good performance in suppressing power fluctuation and shaving peak demand for the micro-grid system. Through optimization, these two methods achieve about 12.5% of peak demand reduction. However, compared to the simplified temperature state priority list control strategies, the temperature state priority list method has a wider active power fluctuation range and takes a longer reaction time, which proves that setting the order for domestic electric water heaters can affect scheduling results to some extent.
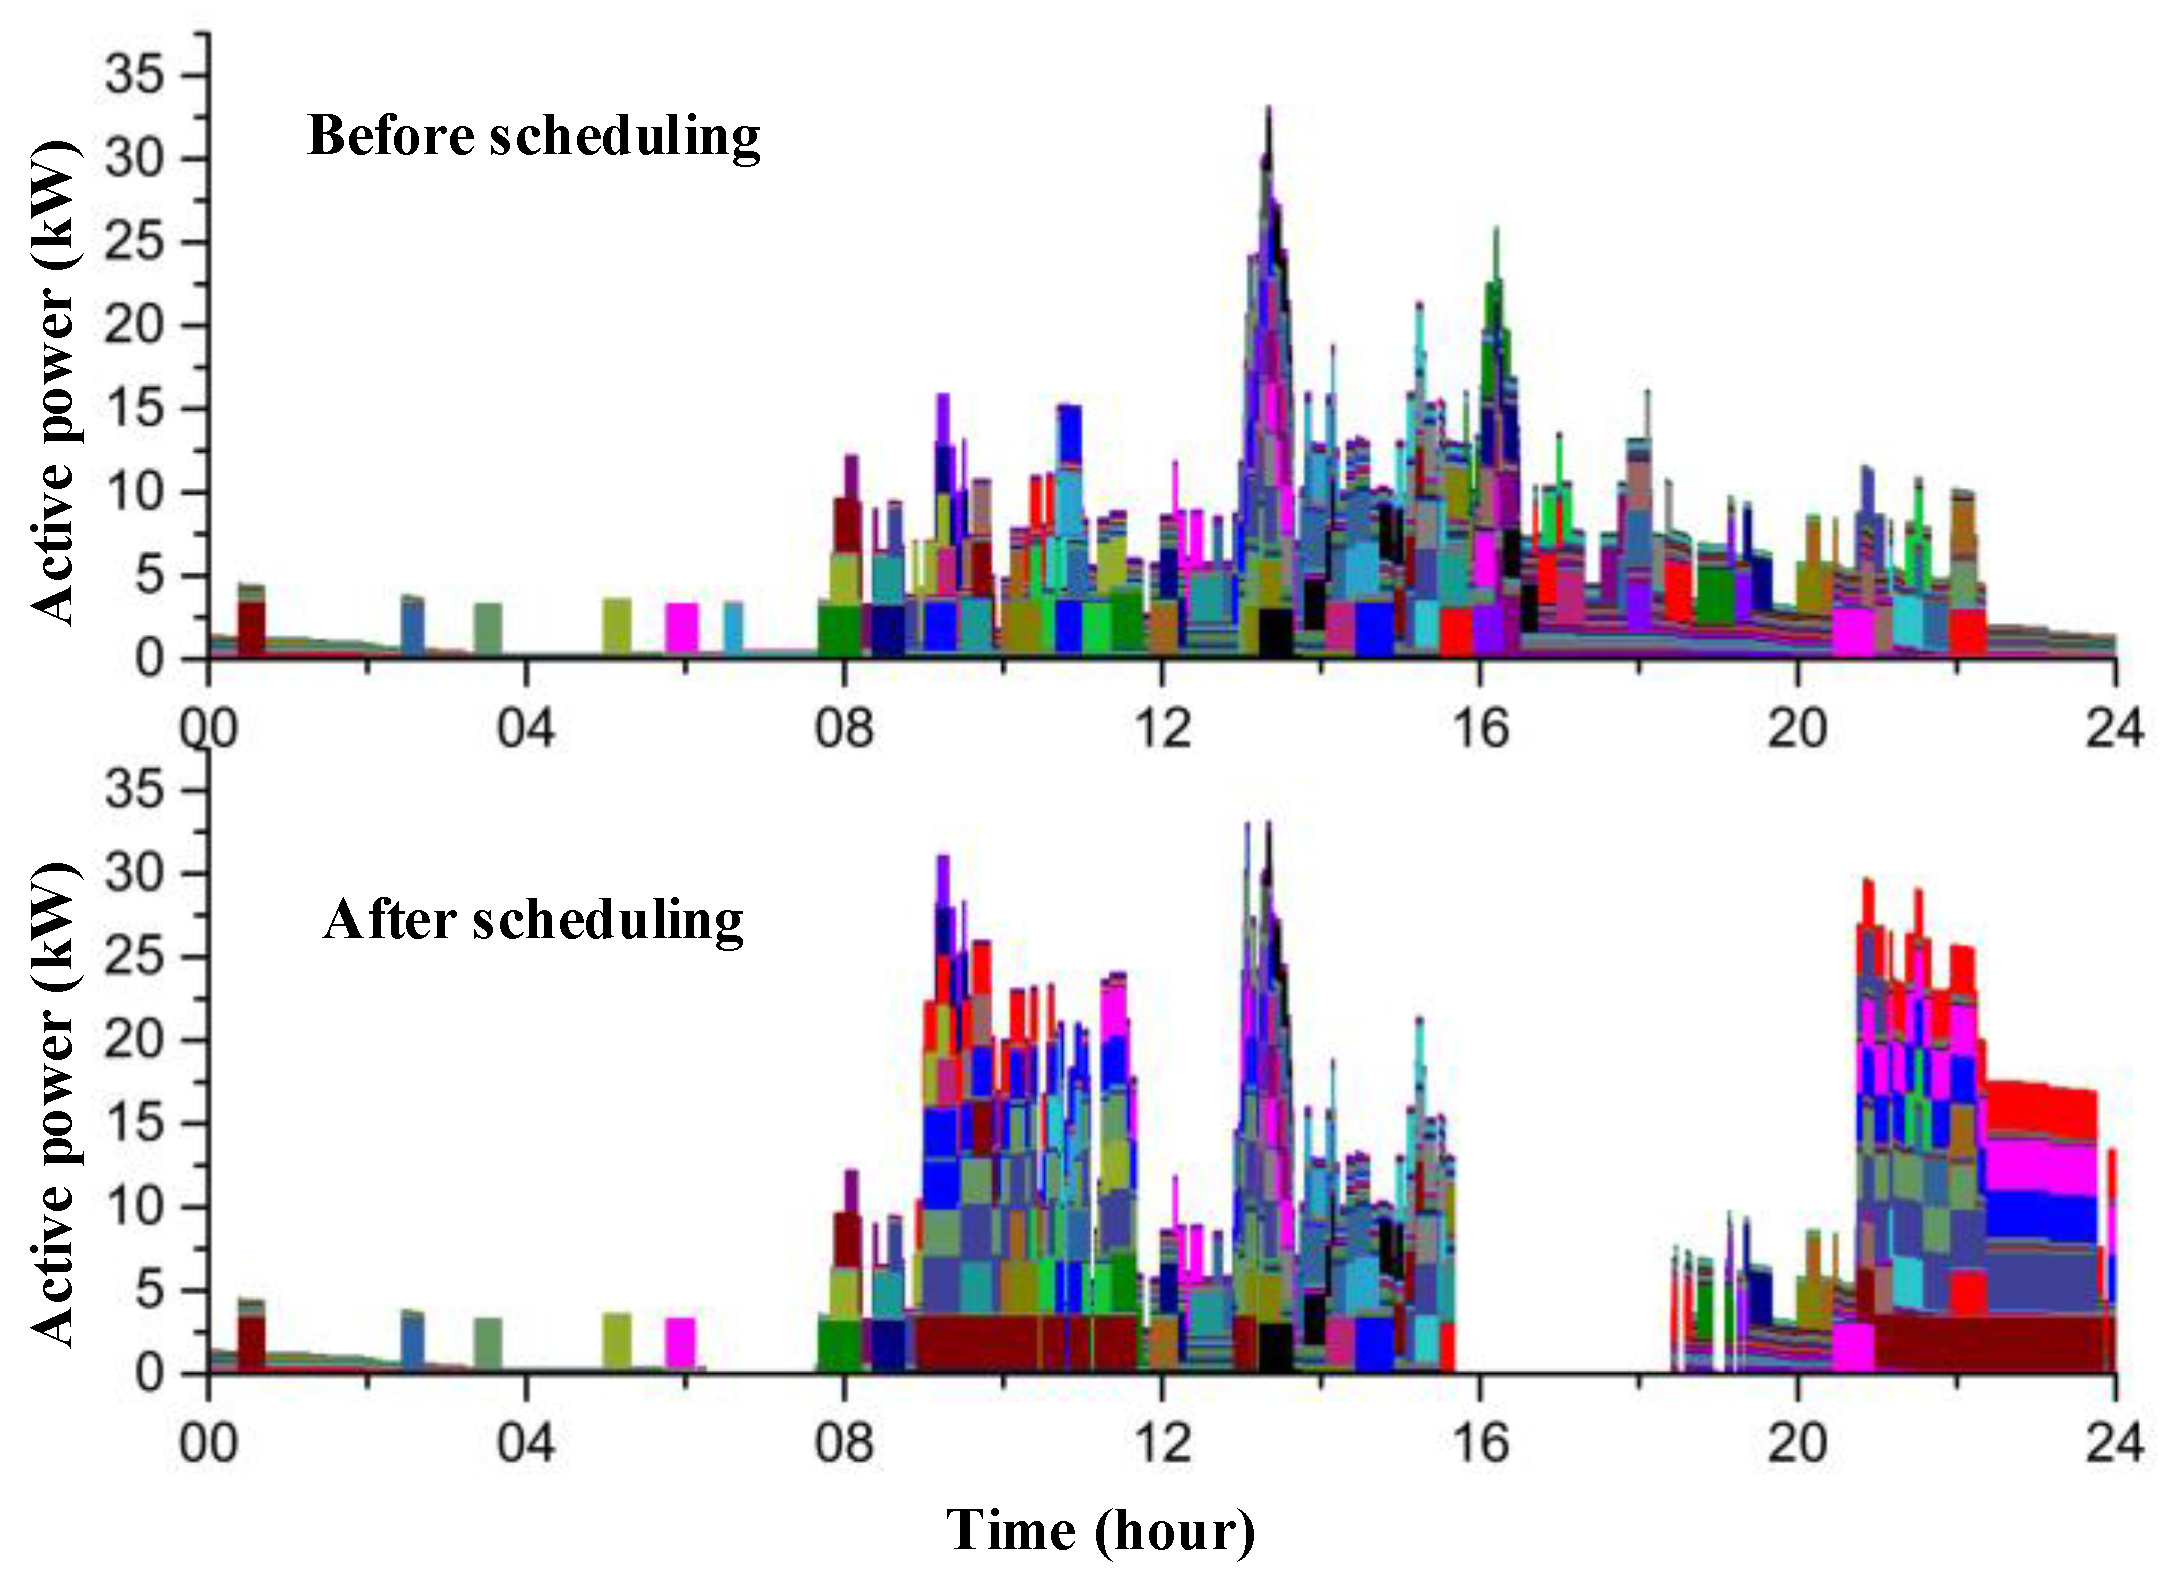
Figure 11 shows real time active power consumption of 100 domestic electric water heaters that are categorized in the green, yellow and red groups to participate in load scheduling based on the temperature state priority list method.
Figure 11 reveals that the proposed temperature state priority list method has successfully shifted controllable load. In addition, compared to Figure 9, Figure 11 shows that the operation time of a single domestic electric water heater is significantly reduced. This has more real-world feasibility compared to the simplified temperature state priority list method.
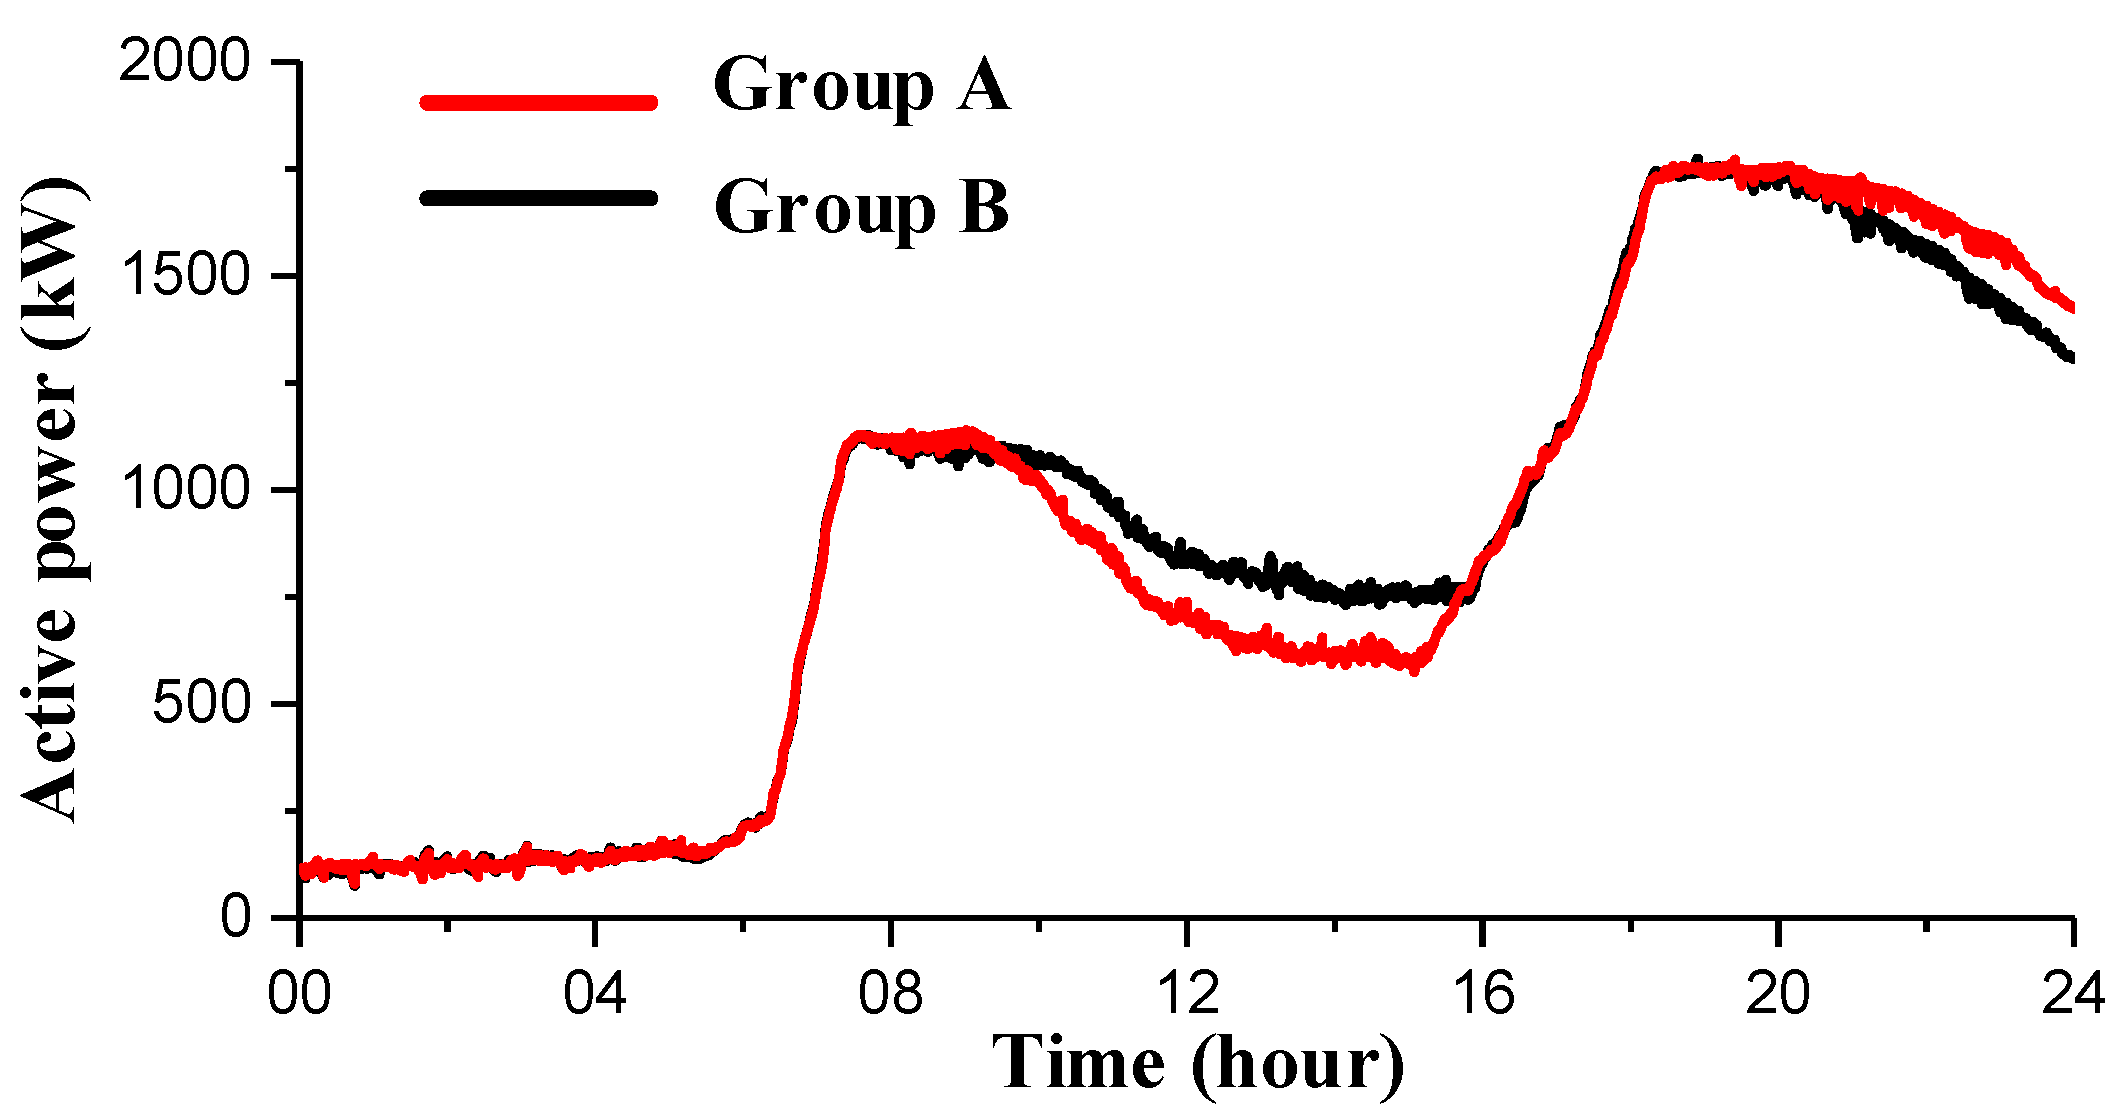
With the increase of domestic electric water heaters which participate in load scheduling, the optimization results can be different. Figure 12 shows optimization results of real time total active power supplied by the external grid system of group A and group B (defined in Section 6).
Figure 12 reveals that with the increase of domestic electric water heaters which participate in load scheduling, the given micro-grid system power fluctuation can be further suppressed. Meanwhile, the maximum active power needs to be supplied by the external grid system can be slightly reduced. With the increase of water heaters which participate in load scheduling, system flexibility has been improved to some extent, and this is the key reason for further suppressing active power fluctuation and further shaving peak demand. However, to achieve this, about 1.2% of extra electrical energy needs to be supplied by the external grid.
8. Conclusions
This paper tries to suppress power fluctuation and shave peak demand for a micro-grid through optimizing domestic electric water heaters (controllable load). To achieve this, this paper first proposes a domestic electric water heater models to optimize the operation of a single domestic electric water heater system. Then, the Monte Carlo method is used to simulate the daily power consumption of a cluster of domestic electric water heaters. After that, the temperature state priority list method is proposed to suppress power flow and shave peak demand for the given micro-grid.
The optimization results show that the proposed simplified temperature state priority list and the temperature state priority list methods both have good performance on suppressing power fluctuation for the micro-grid system. Simulation results also show that both of the proposed methods can achieve 12.5% of peak demand reduction. However, for the simplified temperature state priority list method, it requires keeping some of domestic electric water heaters in an operational state for a long time, which does not have real-world feasibility and, for the temperature state priority list method, it gives a wider active power fluctuation range and needs a longer reaction time. To reduce active power fluctuation and to suppress maximum active power, it is necessary to increase the number of domestic electric water heaters that can participate in load scheduling. However, optimization results show that about 1.2% of extra electrical energy needs to be generated if the number of domestic electric water heaters participating in load scheduling is increased to 1500 from 1000.
Therefore, the proposed temperature state priority list method does have good performance on peak shaving and suppressing power fluctuation. However, how to reduce active power fluctuation range and reduce system reaction time without significantly increasing extra electrical energy imported from the external grid system may need to be studied in future work. In addition, it is meaningful to schedule domestic loads with considering different load generation/usage patterns.
Acknowledgments
This project is supported by Research on Flexible Interface and Interactive Service Technology for Intelligent Power Consumption under Demand Side Energy Interconnection Circumstance of SGCC (YD-17-004).
Author Contributions
Zhaojing Yin designed the study; Dezhi Li conducted the simulation; Zhaojing Yin and Huanan Liu measured data of distributed generations and uncontrollable loads; Yanbo Che analyzed the data; Dongmin Yu wrote the paper.
Conflicts of Interest
The authors declare no conflict of interest.
References
- Wang, D.; Parkinson, S.; Miao, W. Online voltage security assessment considering comfort-constrained demand response control of distributed heat pump systems. Appl. Energy 2012, 96, 104–114. [Google Scholar] [CrossRef]
- Callaway, D.; Hiskens, I. Achieving Controllability of Electric Loads. Proc. IEEE 2011, 99, 184–199. [Google Scholar] [CrossRef]
- Moreau, A. Control strategy for domestic water heaters during peak periods and its impact on the demand for electricity. Energy Procedia 2011, 12, 1074–1082. [Google Scholar] [CrossRef]
- U S Department of Energy. Benefits of demand response in electricity markets and recommendations for achieving them. In A Report to the United States Congress Pursuant to Section 1252 of the Energy Policy Act of 2005; DOE.US: Washington, DC, USA, 2006. [Google Scholar]
- Walker, C.; Pokoski, J. Residential load shape modelling based on customer behavior. IEEE Trans. Power Appar. Syst. 1985, PAS-104, 1703–1711. [Google Scholar] [CrossRef]
- Lane, I.; Beute, N. A model of the domestic hot water load. IEEE Trans. Power Sys. 1996, 11, 1850–1855. [Google Scholar] [CrossRef]
- Luo, F.; Dong, Z.; Meng, K. An operational planning framework for Large-Scale thermostatically controlled load dispatch. IEEE Trans. Ind. Inf. 2017, 13, 217–227. [Google Scholar] [CrossRef]
- Nehrir, M.; Jia, R.; Pierre, D. Power management of aggregate electric water heater loads by voltage control. In Proceedings of the 2007 IEEE Power Engineering Society General Meeting, Tampa, FL, USA, 24–28 June 2007. [Google Scholar]
- Orphelin, M.; Adnot, J. Improvement of methods for reconstructing water heating aggregated load curves and evaluating demand-side control benefits. IEEE Trans. Power Syst. 1999, 14, 1549–1555. [Google Scholar] [CrossRef]
- Jia, H.; Qi, Y.; Mu, Y. Frequency response of autonomous microgrid based on family-friendly controllable loads. Sci. China Technol. Sci. 2013, 56, 693–702. [Google Scholar] [CrossRef]
- Rui, X.; Liu, X.; Meng, J. Dynamic frequency regulation method based on thermostatically controlled appliances in the power system. Energy Procedia 2016, 88, 382–388. [Google Scholar] [CrossRef]
- Ciapessoni, E.; Cirio, D.; Conte, F. Demand side response for frequency control in a regional power system. In Proceedings of the IEEE International Conference on Clean Electrical Power, Taormina, Italy, 16–18 June 2015. [Google Scholar]
- Masuta, T.; Yokoyama, A. Supplementary load frequency control by use of a number of both electric vehicles and heat pump water heaters. IEEE Trans. Smart Grid 2012, 3, 1253–1262. [Google Scholar] [CrossRef]
- Kondoh, J. Direct load control for wind power integration. In Proceedings of the IEEE Power & Energy Society General Meeting, Detroit, MI, USA, 24–29 July 2011. [Google Scholar]
- Belov, A.; Vasenev, A.; Havinga, P. Reducing user discomfort in direct load control of domestic water heaters. In Proceedings of the Innovative Smart Grid Technologies-Asia (ISGT ASIA), Bangkok, Thailand, 3–6 November 2015. [Google Scholar]
- Shaad, M.; Momeni, A.; Diduch, C. Forecasting the power consumption of a single domestic electric water heater for a direct load control program. In Proceedings of the 2015 IEEE 28th Canadian Conference on Electrical and Computer Engineering (CCECE), Halifax, NS, Canada, 3–6 May 2015. [Google Scholar]
- Qi, Y.; Wang, D.; Wang, X. Frequency control ancillary service provided by efficient power plants integrated in Queuing-Controlled domestic water heaters. Energies 2017, 10, 559. [Google Scholar] [CrossRef]
- Klein, L.; Kwak, J.; Kavulya, G. Coordinating occupant behavior for building energy and comfort management using multi-agent systems. Autom. Constr. 2012, 22, 525–536. [Google Scholar] [CrossRef]
- Ranade, V. Model and Control for Cooperative Energy Management. Master’s Thesis, Massachusetts Institute of Technology, Cambridge, MA, USA, 2010. [Google Scholar]
Figure 1.
Power flow in a domestic electric water heater.
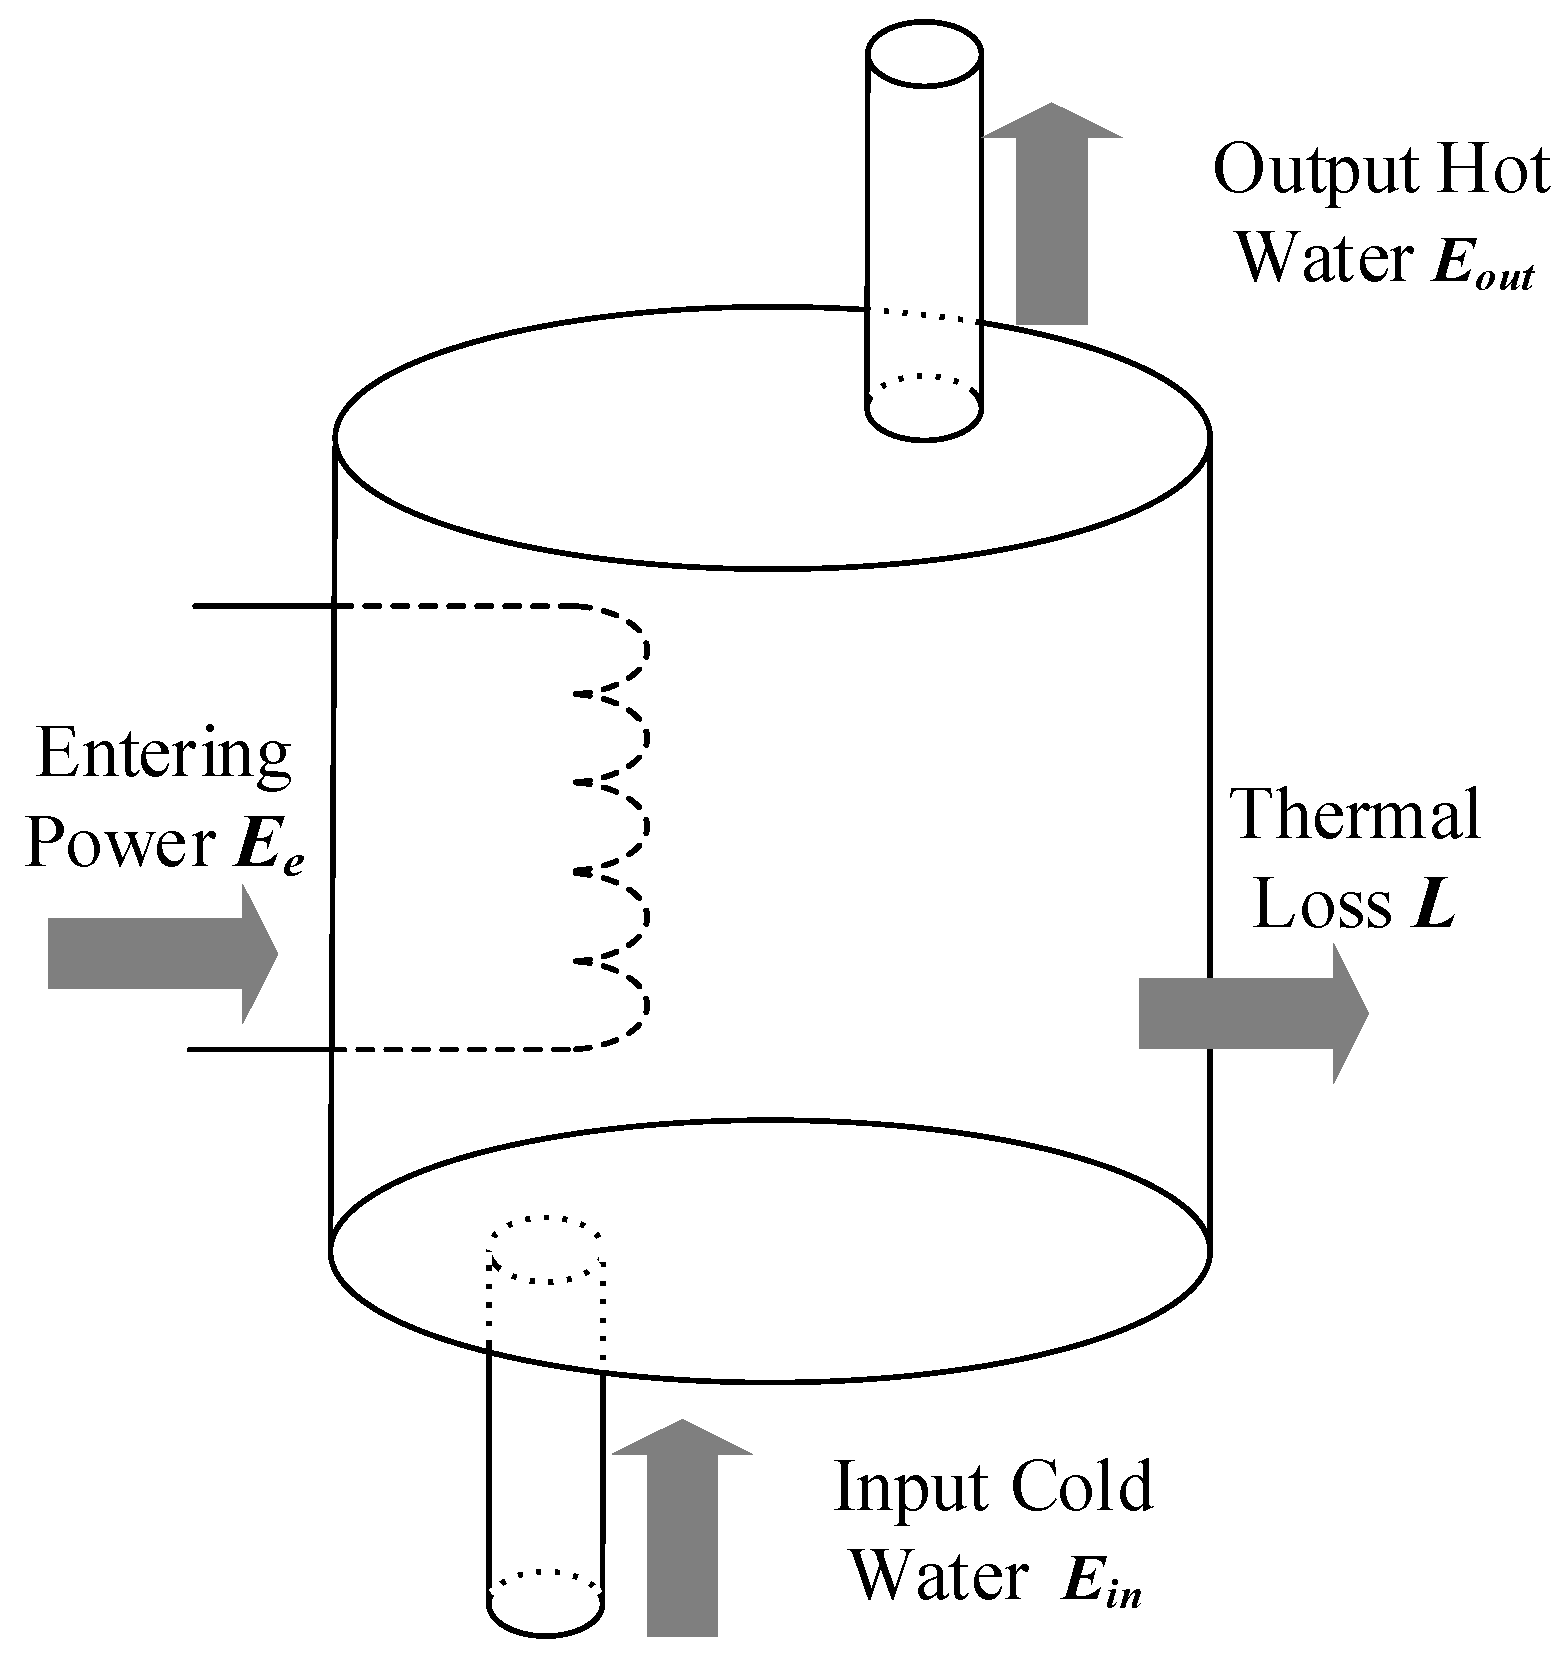
Figure 2.
Domestic electric water heater control system.
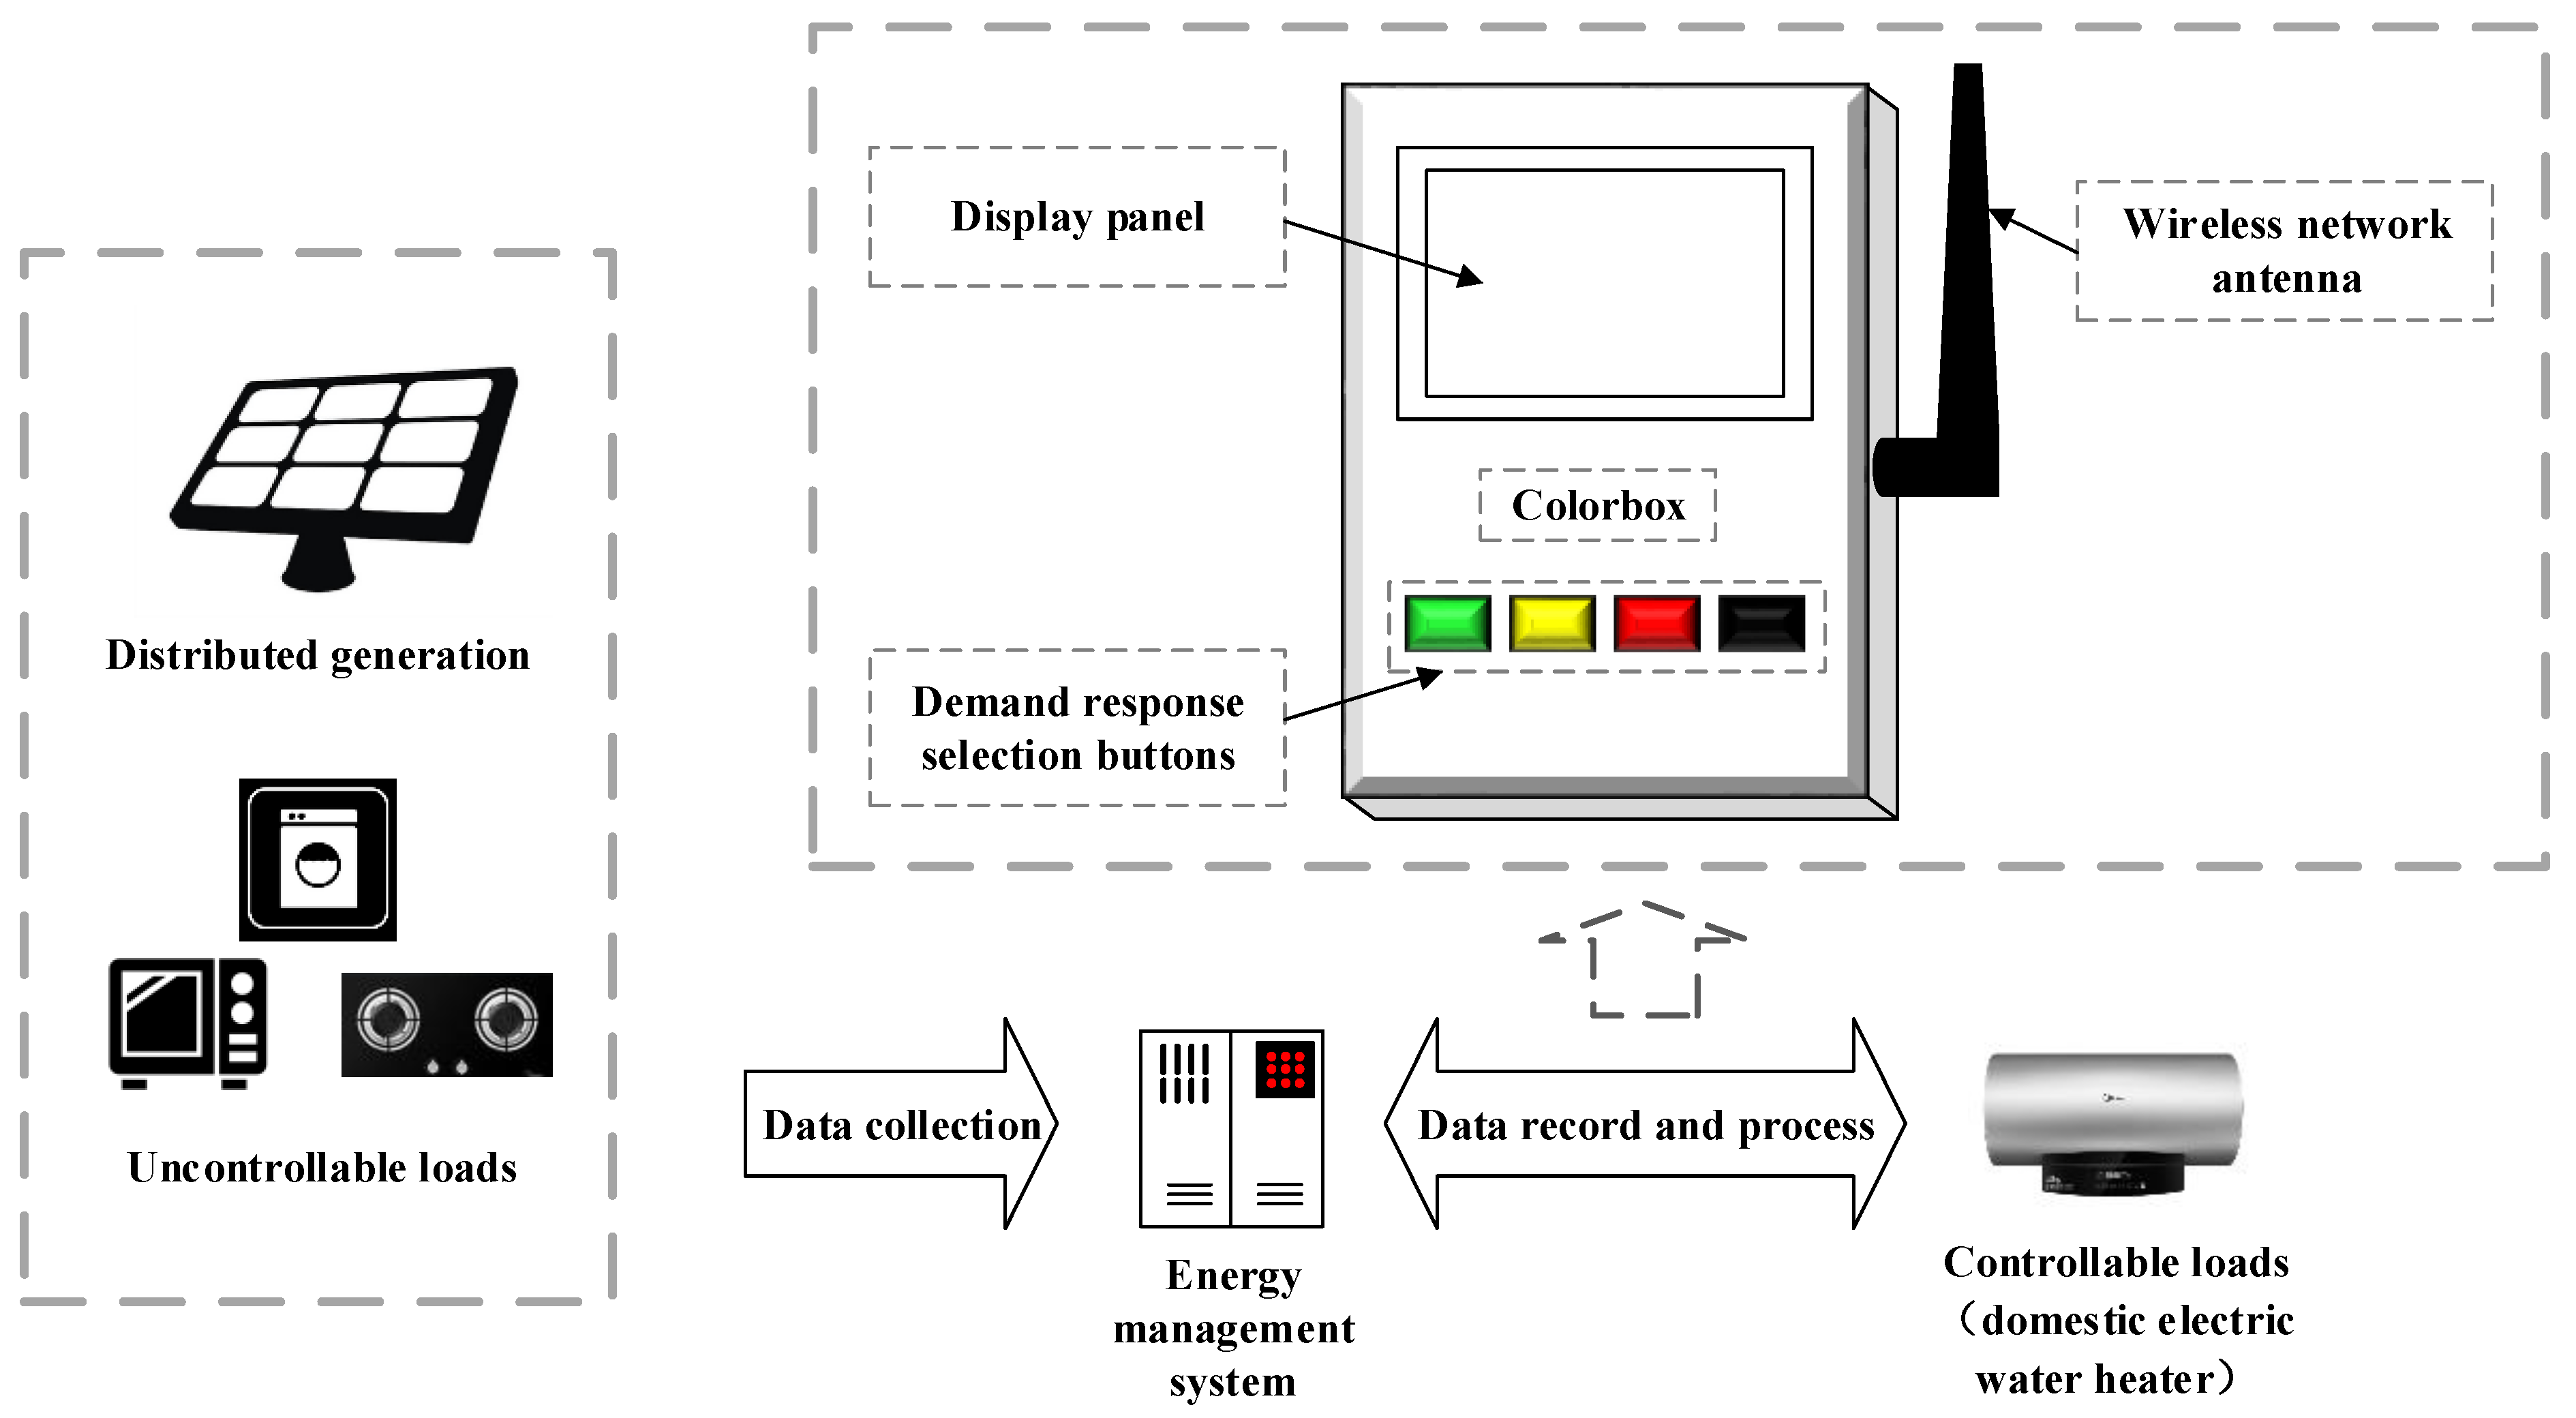
Figure 3.
Domestic electric water heaters’ load scheduling strategy based on the temperature state priority list.
Figure 3.
Domestic electric water heaters’ load scheduling strategy based on the temperature state priority list.

Figure 4.
Two thousand domestic electric water heaters’ daily power consumption curve.

Figure 5.
Daily renewable power generation curves.
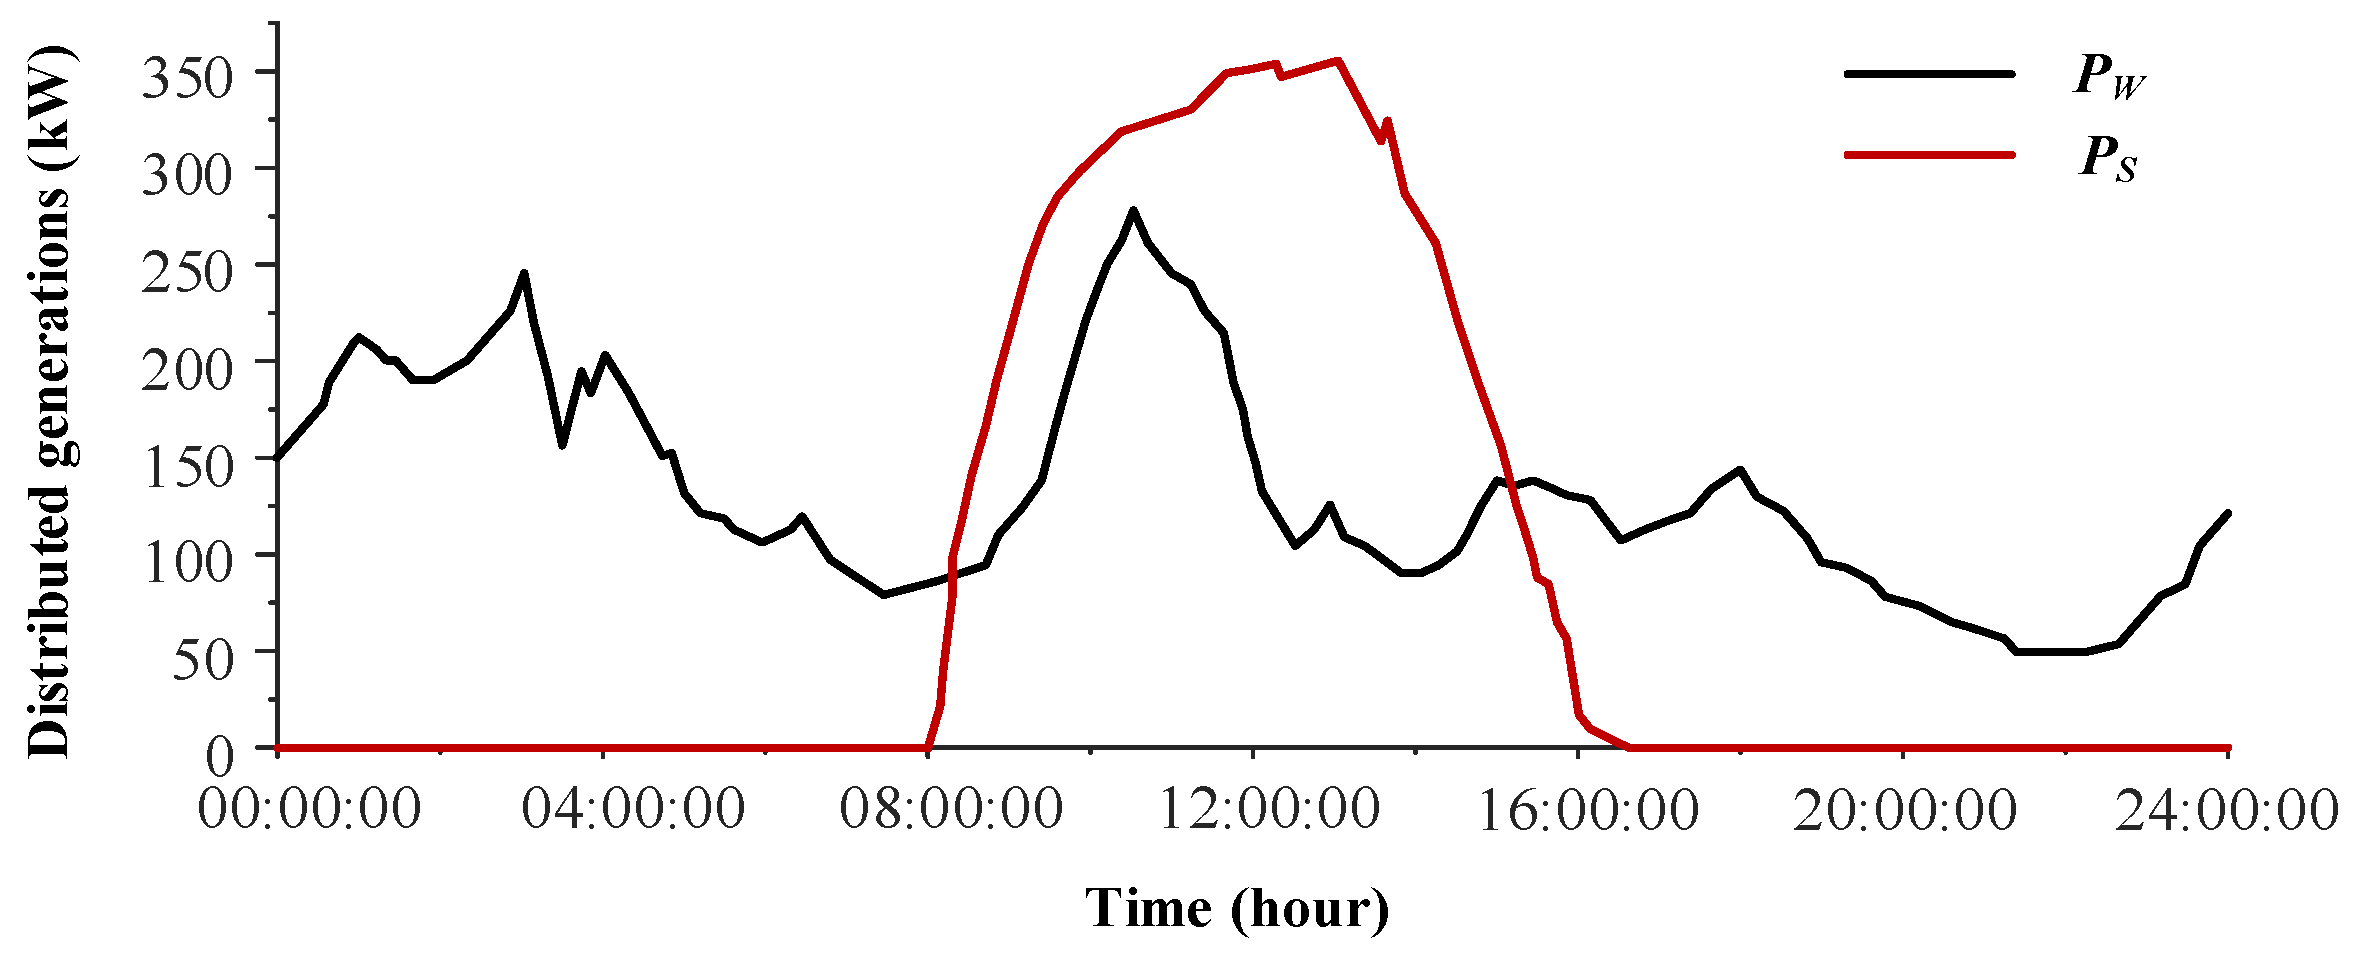
Figure 6.
Daily uncontrollable electrical load curve.

Figure 7.
Active power supplied by the external grid system.
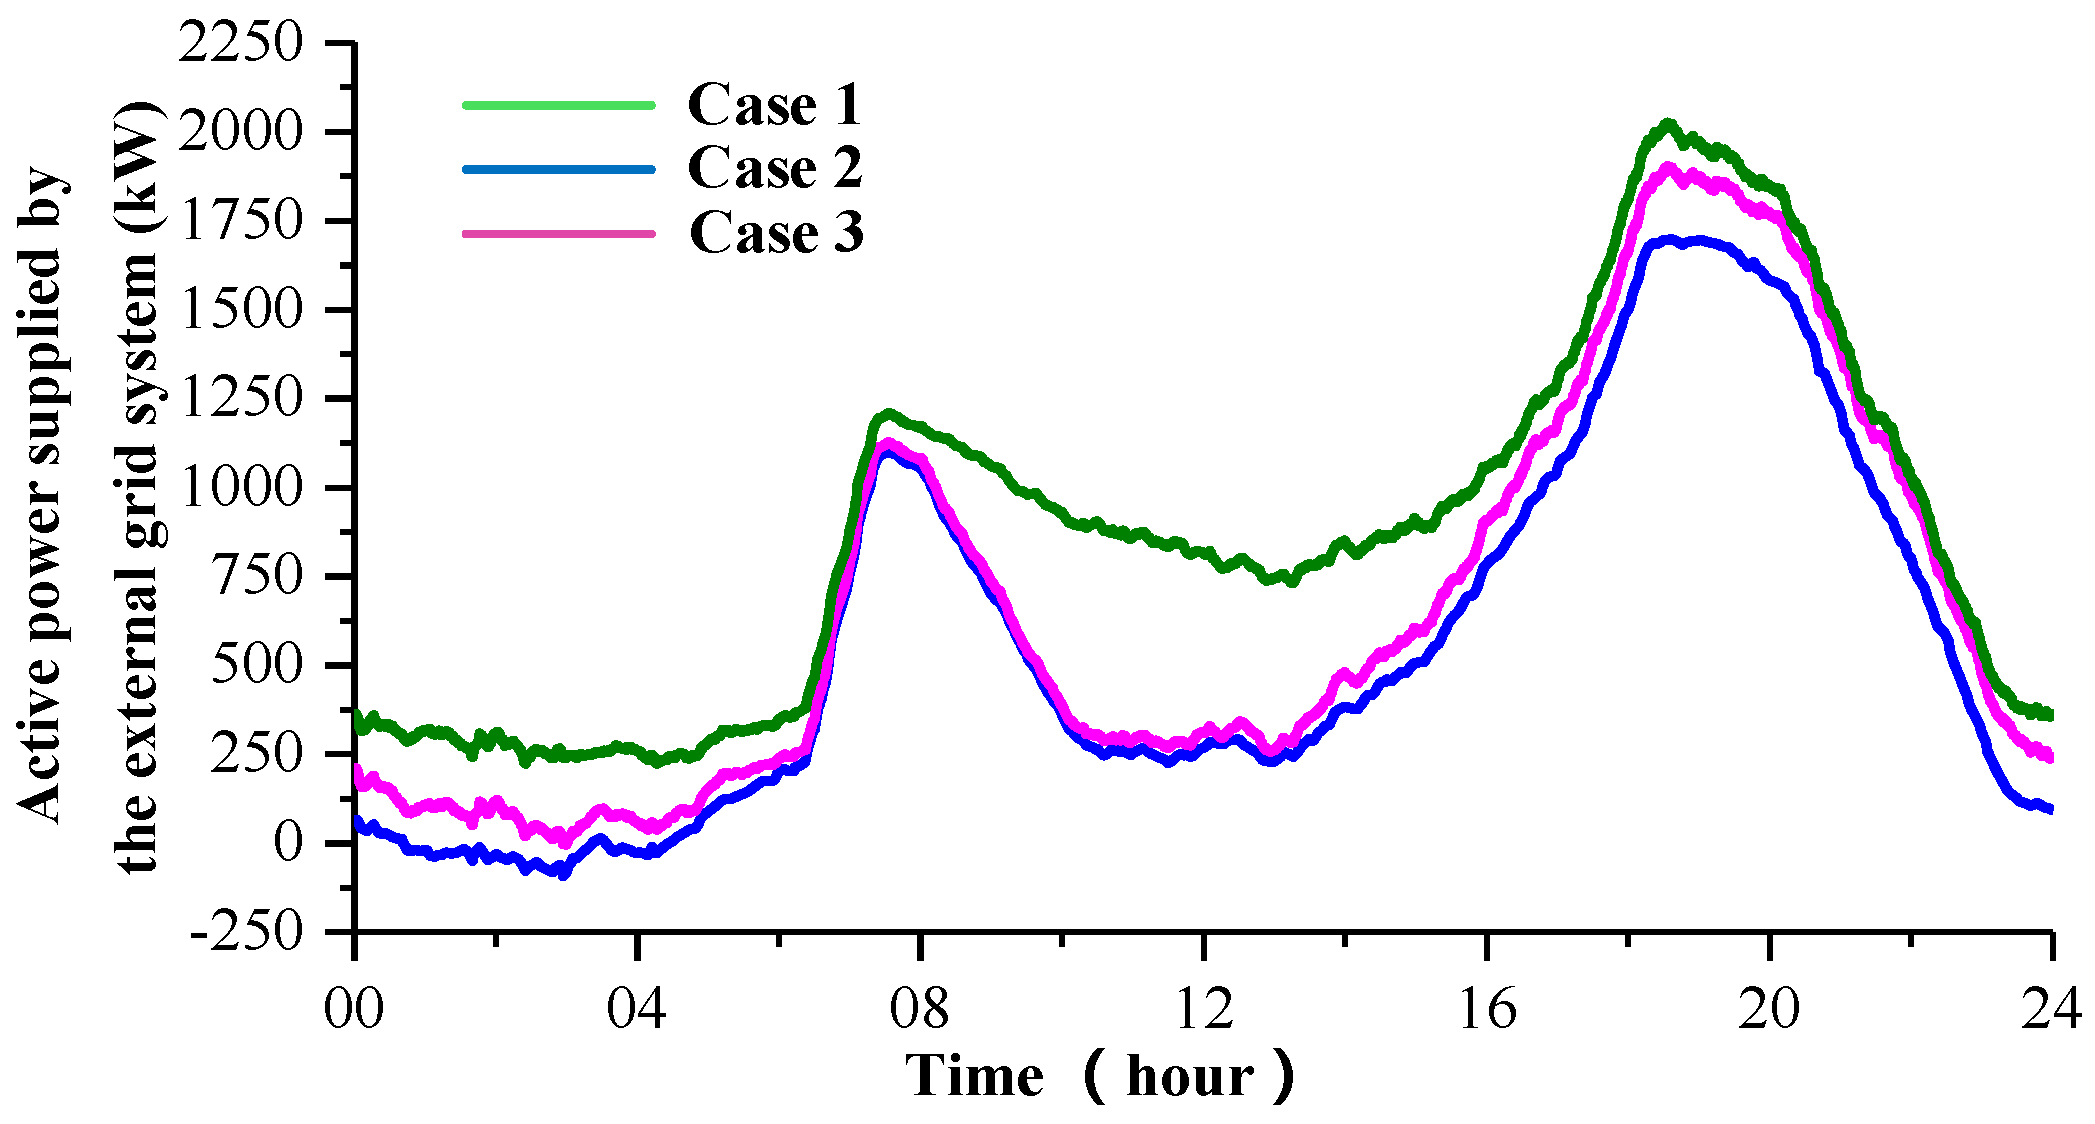
Figure 8.
Simulation results of the simplified temperature state priority list control strategy.

Figure 9.
Real time active power consumption of 100 domestic electric water heaters based on the simplified temperature state priority list method.
Figure 9.
Real time active power consumption of 100 domestic electric water heaters based on the simplified temperature state priority list method.

Figure 10.
Optimization results of the simplified temperature state priority list and the temperature state priority list control strategies.
Figure 10.
Optimization results of the simplified temperature state priority list and the temperature state priority list control strategies.
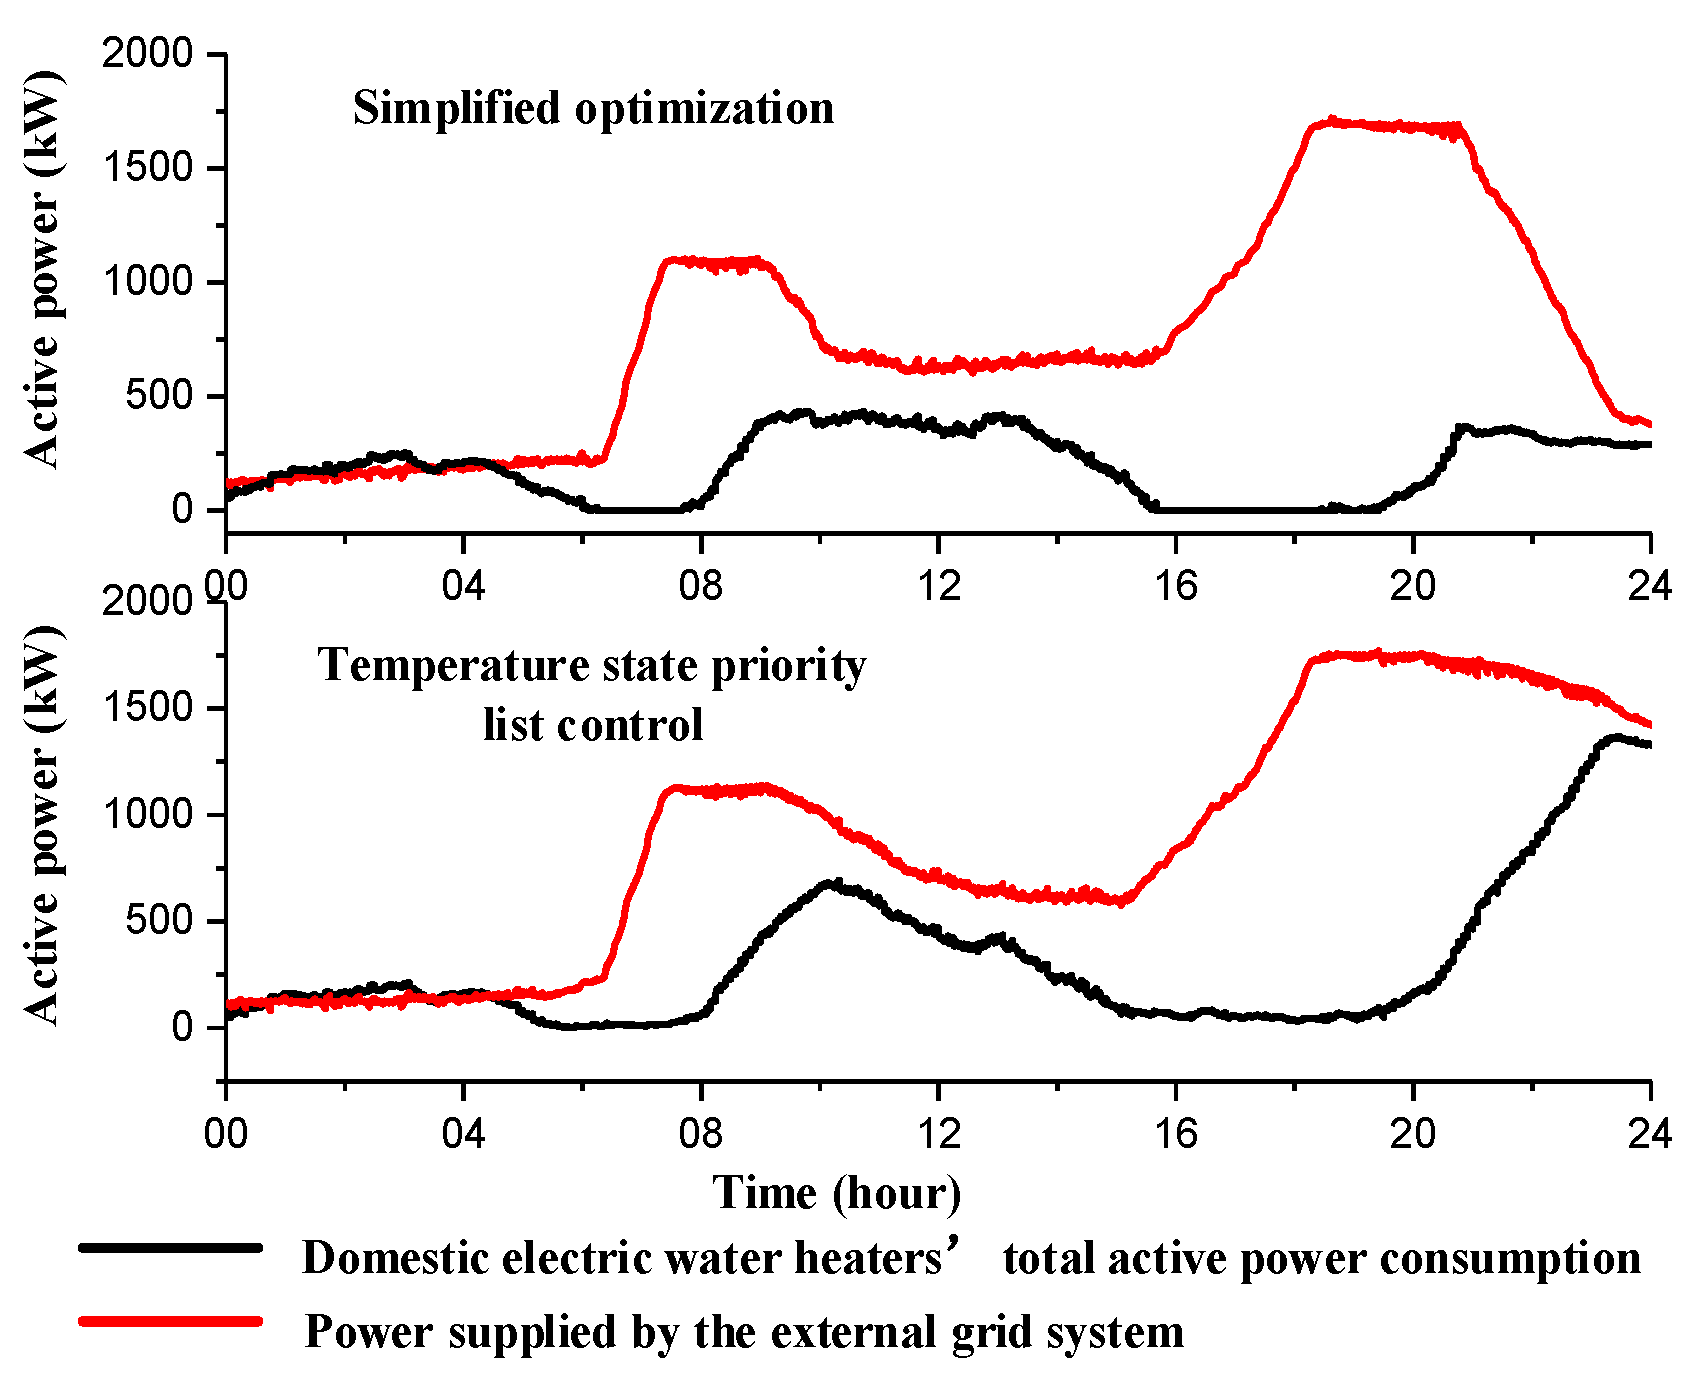
Figure 11.
Real time active power consumption of 100 domestic electric water heaters based on the temperature state priority list method.
Figure 11.
Real time active power consumption of 100 domestic electric water heaters based on the temperature state priority list method.
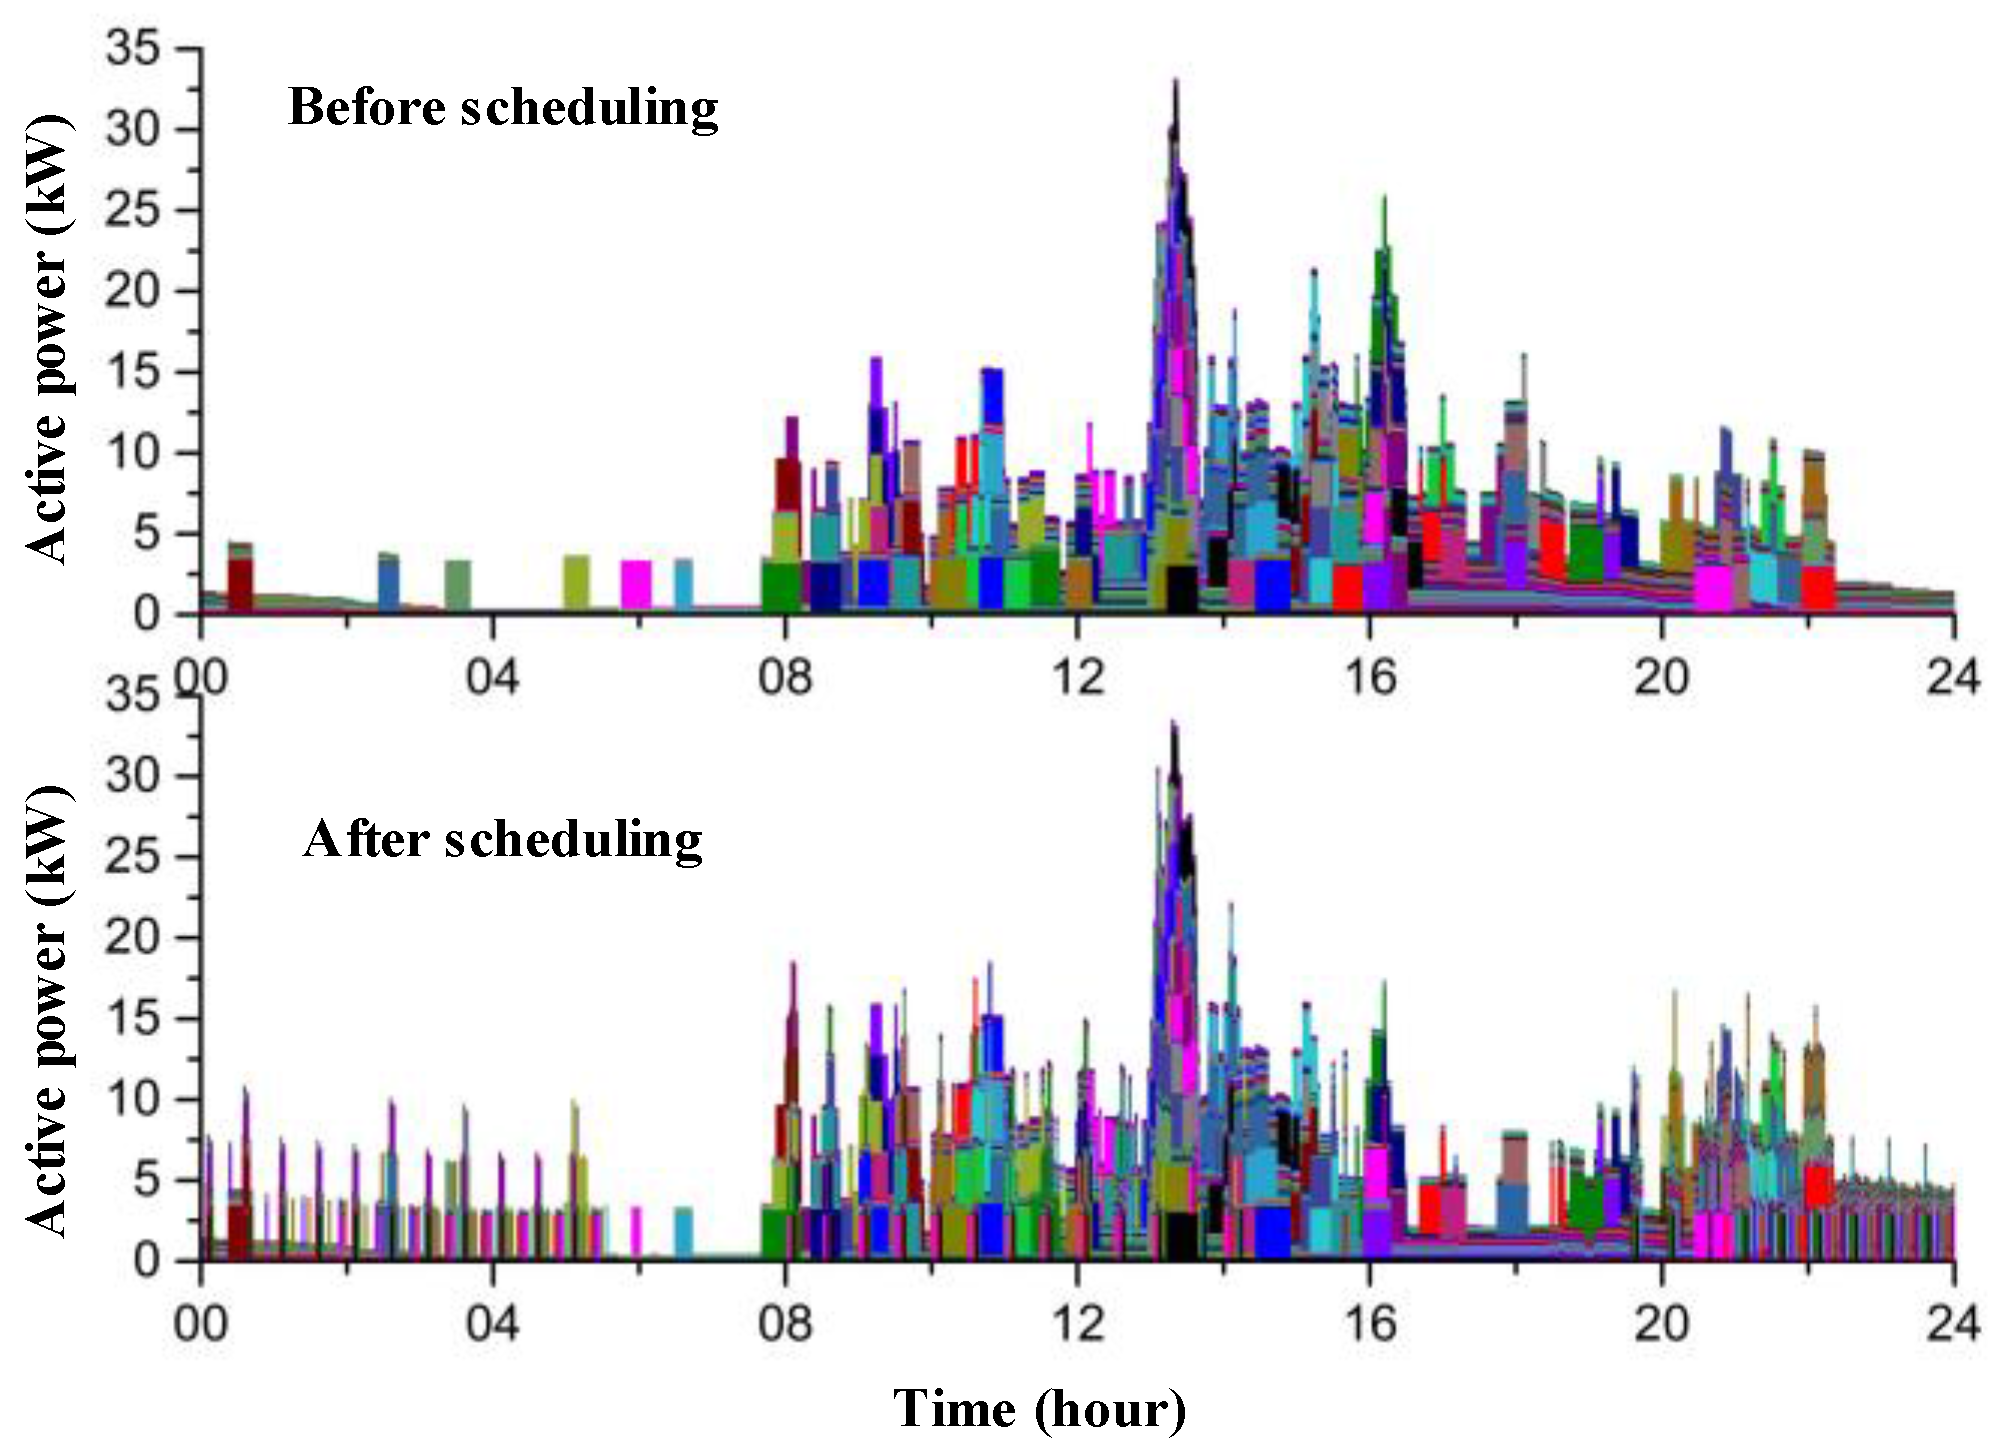
Figure 12.
Optimization results of real time total active power consumption of groups A and B.

Table 1.
Domestic electric water heater system parameters’ probability distributions.
| Parameter Symbols | Distribution |
|---|---|
| Pn (kW) | Pn = α∙Vn |
| Vn (L) | N (50,0.15) |
| Taim.n(°C) | N (45,0.05) |
| Tin.n (°C) | N (17,0.15) |
| ΔVn.n (L) | N (25,0.15) |
Note: N(u,v) represents standard normal distribution, u is expectation and v is variance. The power consumption rate of the nth domestic electric water heater (Pn); the volume of the nth tank (Vn); the nth user’s water consumption rate (Vn(t)); the nth domestic electric water heater real-time water temperature (Tn(t)), the input cold water temperature of the nth domestic electric water heater (Tin.n).
Table 2.
Three main types of photovoltaic (PV) panel data sheet.
| Parameters | PLUTO200-Ada* | STP037d-18TJD1* | STP030B-6/TJD5* |
|---|---|---|---|
| Rated power (Pmax) | 200 W | 37 W | 30 W |
| Maximum power point current (Imp) | 5.21 A | 1.25 A | 2.5 A |
| Maximum power point voltage (Vmp) | 38.4 V | 30 V | 12 V |
| Short circuit current (Isc) | 5.50 A | 1.35 A | 2.7 A |
| Open circuit voltage (Voc) | 46.1 V | 37 V | 15 V |
| Operating temperature (To) | −40 °C to +85 °C | ||
| Efficiency | 15.7% | ||
* represents the type of PV panel.
Table 3.
Wind power plant data sheet.
| Parameters | Value |
|---|---|
| Rated power | 600 kW |
| Rated speed | 1780 rpm |
| Cut-in speed | 4 m/s |
| Wind wheel radius | 20 m |
| Moment of inertia of wind wheel | 549206.4 kg·m2 |
| Generator rotor inertia | 34.4 kg/m2 |
| Total moment of inertia | 329.2 kg/m2 |
| Gear box ratio | 43.165 |
| Damping coefficient | 0 Nm∙rad−1∙s−1 |
| Maximum wind power coefficient | 0.4603 |
| Air density | 1.225 kg/m3 |
© 2017 by the authors. Licensee MDPI, Basel, Switzerland. This article is an open access article distributed under the terms and conditions of the Creative Commons Attribution (CC BY) license (http://creativecommons.org/licenses/by/4.0/).
Share and Cite
MDPI and ACS Style
Yin, Z.; Che, Y.; Li, D.; Liu, H.; Yu, D. Optimal Scheduling Strategy for Domestic Electric Water Heaters Based on the Temperature State Priority List. Energies 2017, 10, 1425. https://doi.org/10.3390/en10091425
AMA Style
Yin Z, Che Y, Li D, Liu H, Yu D. Optimal Scheduling Strategy for Domestic Electric Water Heaters Based on the Temperature State Priority List. Energies. 2017; 10(9):1425. https://doi.org/10.3390/en10091425
Chicago/Turabian StyleYin, Zhaojing, Yanbo Che, Dezhi Li, Huanan Liu, and Dongmin Yu. 2017. "Optimal Scheduling Strategy for Domestic Electric Water Heaters Based on the Temperature State Priority List" Energies 10, no. 9: 1425. https://doi.org/10.3390/en10091425
Note that from the first issue of 2016, this journal uses article numbers instead of page numbers. See further details here.