
Experimental Investigation of Flow Domain Division in Beds Packed with Different Sized Particles


1
Center of Rock Instability and Seismicity Research, School of Resources and Civil Engineering, Northeastern University, Shenyang 110819, China
2
Key Laboratory of Ministry of Education on Safe Mining of Deep Metal Mines, Northeastern University, Shenyang 110819, China
*
Author to whom correspondence should be addressed.
Energies 2017, 10(9), 1401; https://doi.org/10.3390/en10091401
Submission received: 14 August 2017
/
Revised: 3 September 2017
/
Accepted: 11 September 2017
/
Published: 14 September 2017
Abstract
:Seepage in a medium packed with particles of variable granular size can be seen in many fields of engineering applications. Due to the relative complex spatial aspect of pore geometry, there are notable differences in the critical parameters of flow transition (Reynolds number and Forchheimer number) between different structures. It is difficult to distinguish the available range of seepage equations and predict the water flux accurately. This work aims to establish the relationship between particle size and flow transition. This is conducted according to the results of flow region division, which obtains the application range for seepage equations. Experiments were carried out in sand columns with nine different particle sizes of sand with mean diameters of 0.0375, 0.1125, 0.225, 0.45, 0.8, 1.5, 2.18, 3.555 and 7.125 mm. Four flow regimes were identified (pre-Darcy regime, Darcy regime, Forchheimer regime and turbulent regime). The experimental data indicate that the permeability increases exponentially and the inertia factor reduces exponentially with an increase in particle diameter. The inertial effect becomes more significant in the medium with larger particles than with finer particles when the flow transition occurs.
1. Introduction
Water flow through a porous medium packed with particles is seen everywhere in engineering practices. The permeable medium is comprised of loose or consolidated granules with abundant lithology and a relatively complicated granular composition. For instance, the groundwater flows towards injection/pumping wells in the multiple-layer system, which is comprised of aquifers and aquitards [1,2,3]. In another example, the groundwater rushes in accidents towards the bottom of the foundation pit, with seepage leaking through the clay or sand-gravel layer, silty clay or silty soil layer and miscellaneous fill soil layer [4]. Due to the permeability differences in each layer, the flow is not a simple laminar Darcy flow or inertial Forchheimer flow [5,6]. Furthermore, the rush of water in a collapsed pillar is a typical physical process of water flow in multi-flow field coupling [7]. The groundwater of the aquifer is able to burst through the water-flowing fractured zone, before rushing into the roadway [8,9]. The pore volume grows larger, the seepage velocity becomes greater and the flow regime transitions from laminar to turbulence further down the pathway. Due to the relatively complex spatial characteristics of pore geometry, a multi-flow field was formed to have a mutual transformation of flow behavior among three regimes. Therefore, Darcy’s law or Forchheimer equation may be invalid in the forecasting of water inflow [10,11].
For the sake of improving the prediction accuracy, non-Darcy equations have been recommended for numerical calculations and a multiple-region flow field has been established. A considerable amount of effort has been devoted in studying a two-region model of water flow towards pumping well, where the critical radius represents the location separating the non-Darcy region and Darcy region [10,11,12,13,14,15]. Furthermore, Shi et al. presented a three-region coupled model to simulate the flow behavior of the water inrush induced by the karst collapse column, where the Darcy flow occurs in the aquifer, Forchheimer flow begins in fractured rock and the turbulent flow starts in the roadway [16]. In addition, Ma et al. considered the effect of migration of fine grains on flow type [17]. However, all above-mentioned studies demarcated the flow-filled boundary based on the critical radius or the spatial position without considering the influence of pore structure. However, the flow regime transition is significantly dependent on the various pore structures. Thus, a criterion needs to be established to divide the flow area, which should include the pore structure information.
Particle diameter is one of the most important basic parameters of pore structure for a particle-packed medium. This is combined with gradation, grain shape and surface roughness of the granular to describe the pore geometry character [18,19,20]. Several researchers have tried to quantify the influence of particle diameter on flow resistance force. For example, Carman et al. depicted the diameter of grains and porosity as a function of the Kozeny–Carman equation’s coefficient [21]. In another example, the linear term and quadratic term coefficients of the well-known Ergun equation both can be expressed as a function of the diameter of grains and porosity, which still used the Kozeny–Carman expression for the linear term coefficient [22]. Numerous semi-empirical non-linear equations have been presented, which are based on laboratory experiments or investigation of available data in literature that considered the effect of particle size [22,23,24,25,26,27,28]. In addition, porosity can be expressed as a function of grain diameter [21,26]. Consequently, particle diameter is suitable as an important criterion for flow field division.
Flow field division relies on flow behavior. Up to now, the relationship of flow behavior and particle diameter has mainly focused on either the ‘wall effect’ [29,30,31] or the functional relationship with linear term and quadratic term coefficients [27,32,33,34]. Several investigators have studied the connection of porosity of packed beds and the ratio of bed-to-particle diameter [35,36]. There is a lack of research examining the relationship between flow transition criterion and particle diameter. Obviously, the variation of particle size has a significant influence on flow transition [37] and is an important factor for flow field division. Therefore, more studies of the relationship between flow transition criterion, especially turbulent onset, and particle diameter should be carried out.
The current work aims to establish the relationship between particle size and flow transition. Based on the results of flow region division, we obtained the application range for seepage equations. Thus, the accuracy of the water flux prediction would be enhanced. According to the purpose of this work, experimental flows in nine different sizes of granular packed columns are conducted. Firstly, the flow regimes were divided based on RPD-v (Reduced Pressure Drop plot against superficial velocity) graphs. Secondly, the function of permeability versus grain diameter and inertia factor versus particle diameter were both created. Following this, the relationships between each critical parameter and particle diameter were discussed. Finally, the flow equation of each flow region was verified and the relationships between particle diameter and flow transition were established.
2. Materials and Methods
2.1. Equipment Set-Up and Method
A schematic diagram of the experimental device is shown in Figure 1. It mainly consists of four parts: experimental unit, water supply system, data measurement and recording equipment.
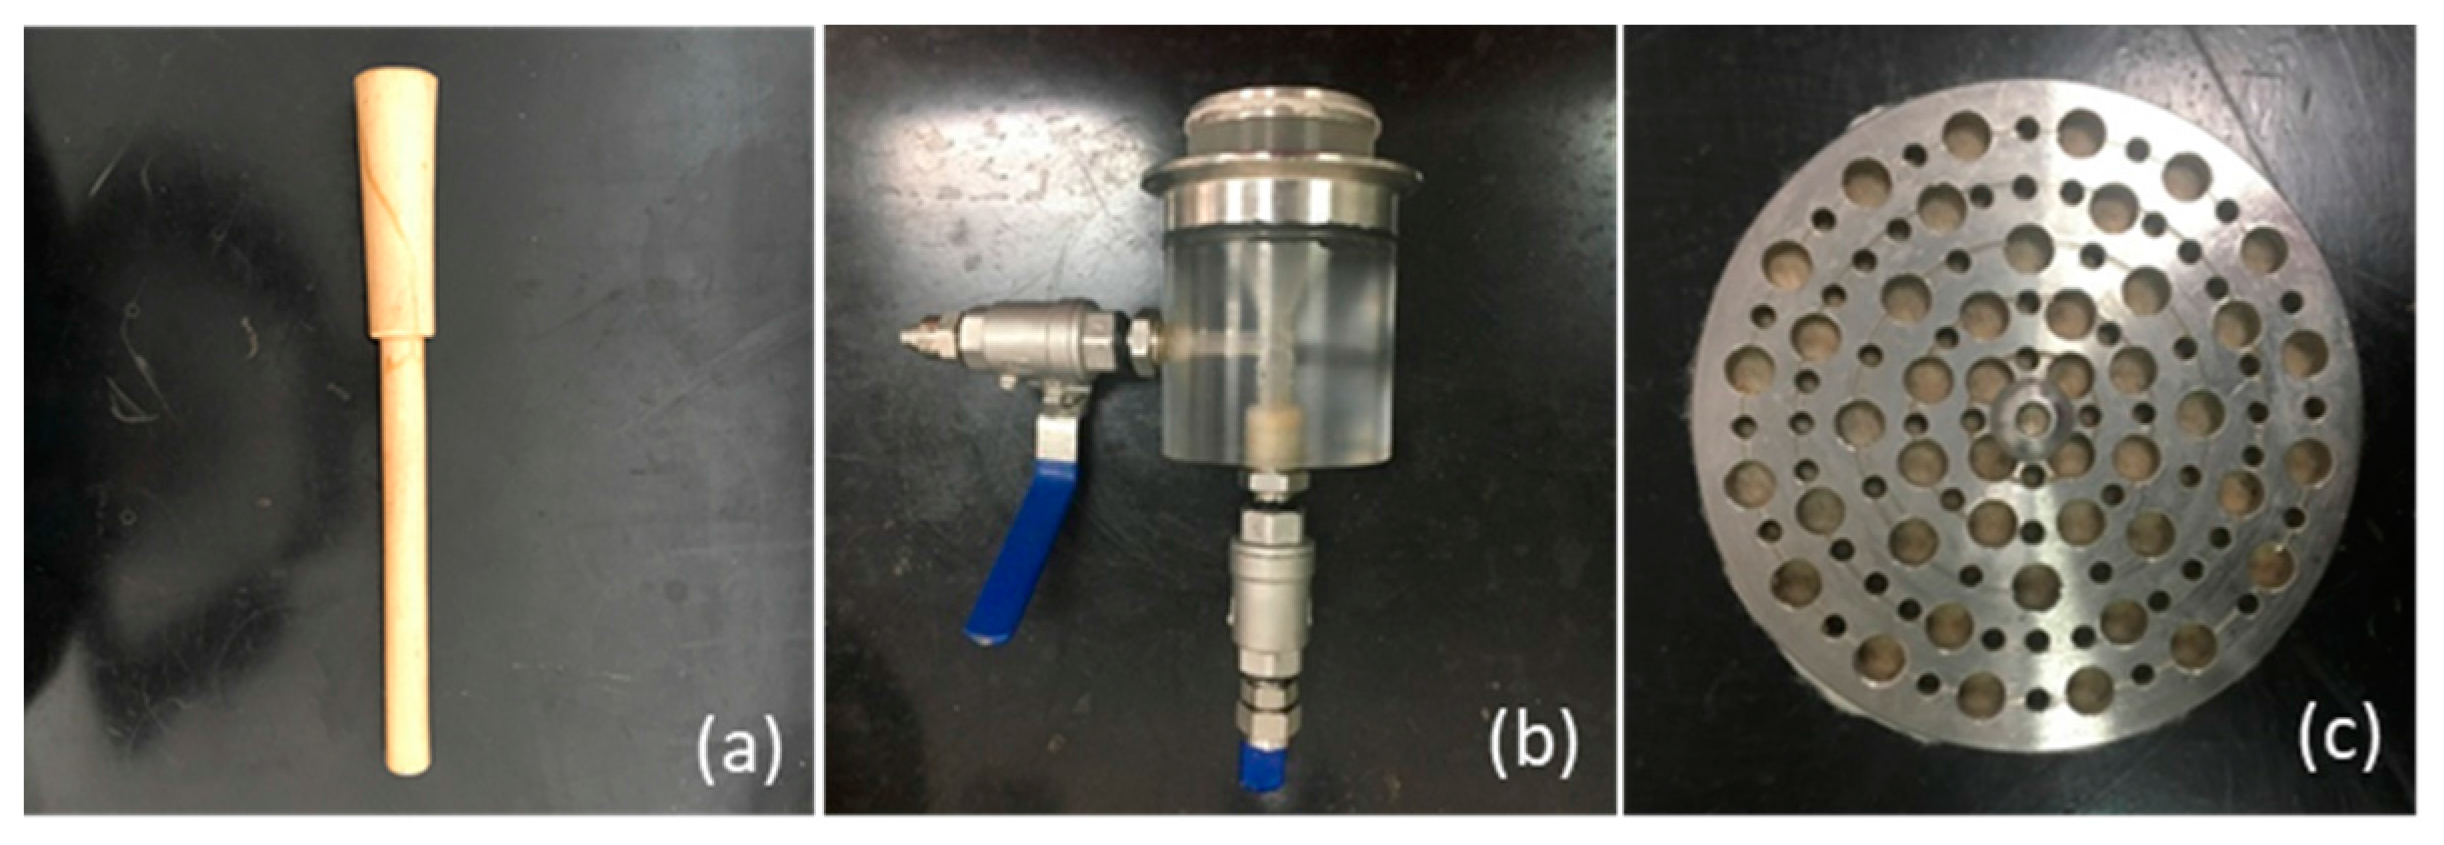
The core component of the experimental unit was a vertical cylindrical column made of plexiglass. The middle part of column was the test tube (height of 0.2 m, diameter of 0.06 m and wall thickness of 0.007 m), which was filled with selected granular materials and compacted uniformly by a mallet (Figure 2a). The upper and lower parts of the column were cone-shape reducing pipes (Figure 2b), which serve as diffusers to create uniform flow conditions. The porous plates (Figure 2c) with a filter cloth in the middle, which has a thickness of 4 mm and bore diameter of 2 or 4 mm, were fastened to the bellbottom of the reducing pipe. The bores had a circular arrangement in the plates and there were shallow channels between two bores on each ring, which also contribute to the creation of a uniform velocity field. At the periphery of the test tube, two piezometer interfaces are placed, which form an angle of 90° to the center line of the column. Measurements were carried out after a steady state of flow was reached and continues at least one minute.
A plunger-type constant pressure water pump was used in the water supply system powered by an air compressor. By adjusting the pressure regulating valve, various flow rates and pressure gradients were established. The key component of the measurement section was a backpressure device, which was connected to the water outlet joint. It has three functions. Firstly, it keeps the air bubbles out of the experimental section. Secondly, it contributes to the formation of a stable water head difference. Thirdly, it reduces the impact of water on the electronic scales. This quality method was adopted for measuring flow rate experimentally. In other words, the flow mass was measured using an electronic balance with a storage tank on it. The experimental data were recording by a data collection software in the computer every 3 s.
Water was pumped from the bottom of the experimental column, which flowed upwards through the test tube, before falling into the backpressure device. Finally, we swapped out extra water into the tank on the balance. It should be noted that at the beginning of test, the granular medium need to be completely saturated by distilled water.
2.2. Experiment Materials and Scheme
Nine different size granular media were selected for the seepage test. The wind-blown sand, river sand and crushed quartz specimens were used in the seepage properties test, as shown in Figure 3, which were separated by a high-frequency vibration screening test sieve machine [38]. The material properties of the specimens are shown in Table 1.
As mentioned above, the “wall effect” should be considered as an important factor in water flow through the particle-packed type of medium. The void distribution within a particle-packed bed is essentially dependent on the ratio of bed-to-particle diameter. The porosity oscillates around the mean value (e.g., 39% with a randomly packed bed of uniform spheres [39]), and dampens out from the wall to the center of the bed [35]. Thus, the ratio of bed-to-particle diameter has a great influence on the permeability of a particle-packed porous medium. Beavers et al. indicated that the permeability was not apparently influenced by the “wall effect” when the diameter of the bed was greater than 12 times of the particle diameter [36]. Hayes et al. suggested that the ratio should be about 10 [29]. That means the wall effect should be ignored when the ratio of column diameter to particle diameter was no less than 10. Accordingly, the mean specimen granular size in this study were basically smaller than 6 mm to minimize the wall effect.
It should be noted that the target zone of hydraulic gradient was between 0 and 50. However, in practice, the seepage velocity in 0–0.075 mm of wind-blown sand packed into a column was too small to be measured until the hydraulic gradient reaches 25. Consequently, we enhanced the water pressure to make sure that the value of velocity belongs to the best measurement range.
3. Flow Regime Identification
In order to describe the flow character in each seepage field accurately, the seepage equation should be confirmed, which is primarily dependent on the identification of flow regimes. In experimental studies, some investigators distinguished the flow pattern by the graphical demarcation method. For instance, Basak et al. and Soni et al. used the hydraulic gradient i versus velocity v curve (i-v graph) to define the flow regime [32,40]. Darcy’s law expressed a linear relationship between velocity and gradient, while the non-Darcy flow under low and high gradients exhibited pre-linear and post-linear characters, respectively.
Unfortunately, with the development of non-Darcy flow investigations, some researchers pointed out that superficial velocity alone cannot regarded as a criterion for characterizing the non-Darcy behavior [41]. In the majority of situations, the Reynolds number (Re) would be used as a criterion for flow regime division. The Reynolds number is usually defined as: Re = ρdv/μ, where v is the superficial flow velocity, d is the characteristic diameter of the particles that constitute the porous column, ρ is the fluid density and μ is the fluid dynamic viscosity [42].
Curves of the friction factor (f) plotted against the Reynolds number (Re) in a double logarithmic coordination (Moody-type diagram for short) were used as a flow regime–division scheme to identify the flow regime. Three flow regimes could be distinguished from the Moody-type diagram. (1) At the low Reynolds numbers, there is a straight-line portion of the curve, where the Darcy law is valid. (2) As Re increases, the flow behavior deviates from linear, where Forchheimer equation is more suitable. (3) When Re is high, the friction factor approached an asymptotic value independent of Re, where turbulent flow appeared [43,44,45,46]. Nevertheless, the flow region before Darcy regime could not be traced from the Moody-type diagram, which could be identified in the RPD-v curve.
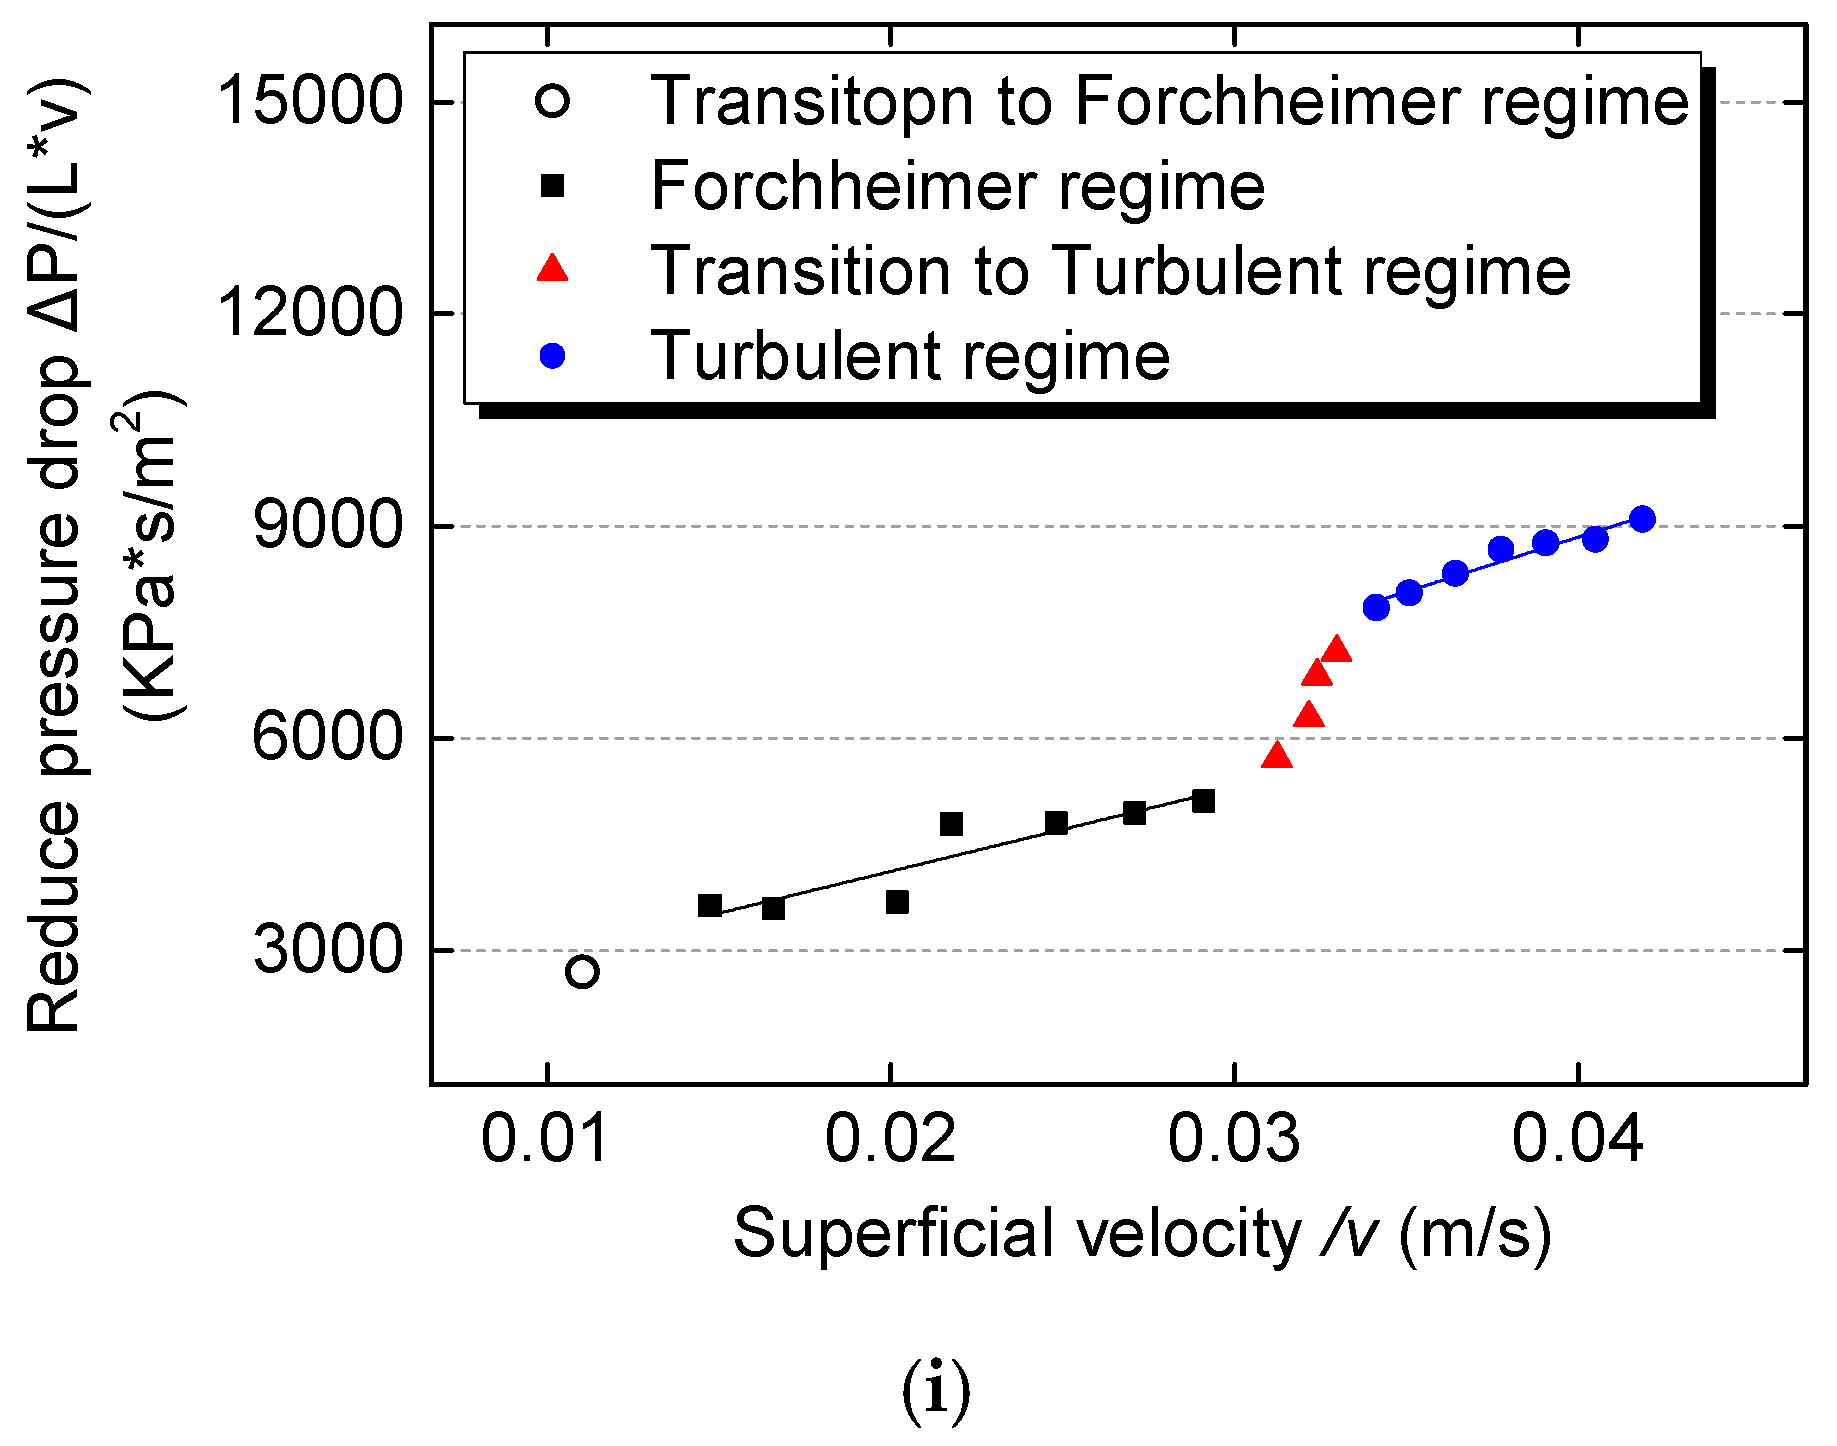
Various researchers have proposed using the curve of dimensionless pressure drop versus Reynolds number or reduce pressure drop (RPD)-velocity v as the criterion to distinguish flow regimes [47,48,49,50,51]. The formula was derived from Darcy’s law and Forchheimer equation. Taking the RPD-v curve for instance, flow patterns can be divided by observing the change in the slope of the curve. When RPD remains constant with an increase in v, Darcy’s law is suitable where the slope is equal to zero. Pre-Darcy regime is located before the upper boundary of Darcy regime. A positive slope can be observed in the post-linear regimes. Furthermore, comparing with turbulent regime a steeper slope should be found in Forchheimer regime.
The flow regimes would be marked by Reynolds number, Forchheimer number or Knudsen number in different research fields [52,53]. In the current work, the flow regime has been identified based on RPD-v curves (see Figure 4) and the flow regimes had been marked by the Reynolds number and Forchheimer number (see Figure 2). It is widely accepted that transitions in particle-packed medium are expected to be gradual. Consequently, in our study, it is appropriate to select the stationary points (the peak points) as the lower boundary of Forchheimer regime and the upper boundary of the turbulent onset.
In this research, water flow through particle-packed bed experiences four different regions: (i) pre-Darcy region, (ii) Darcy region (or linear laminar region), (iii) Forchheimer region (or non-linear laminar region) and (iv) turbulent region (shown in Figure 4). Under the given water pressure range, the main flow behavior in a finer granular packed medium (particle size 0–0.6 mm) change between pre-Darcy flow, Darcy flow and Forchheimer flow. The regime of water flow in a coarser granular packed column (particle diameter range of 0.6–9.5 mm) changes from Forchheimer flow to turbulent flow. The onset points of each regime of nine group tests are shown in Table 2.
As shown in Table 2, the flow behavior is dominated by viscous forces during the creeping flow (pre-Darcy and Darcy flow) stage, while the critical pressure gradient of flow transition reduces with an increase in particle diameter. This is the case with flow transition columns (a)–(c) with the porosity of 0.35 ± 0.01. Column (c) is packed with larger granules and thus, the critical pressure value was 0.125 MPa. Column (b) is packed with smaller granules and thus, critical pressure value was 0.0175 MPa. Column (a) with the smallest granules has the largest value of critical water pressure of 0.0814 MPa. As the flow velocity increases, the flow pattern transitions from the Darcy regime to Forchheimer regime. In this process, the inertial resistance is comparable to viscous resistance and gradually becomes more pronounced. The critical pressure value of column (c) and (d) are both 0.03 MPa. In comparison, the critical pressure values of columns (e)–(i) were much smaller in the range of 0.009–0.01 MPa. When the flow pattern transformed into turbulence, the viscous resistance should be neglected and the critical pressure value of columns (e)–(i) were practically same at around 0.045 MPa.
There are three transition zones included in the whole flow domain:
- Transition from pre-Darcy flow to Darcy flow;
- Transition from Darcy flow to Forchheimer flow;
- Transition from Forchheimer flow to turbulent flow.
The constitution of seepage resistance significantly depends on the particle size. When flow transition begins, the critical Reynolds number and Forchheimer number value increase with an increasing particle size when the porosity remains constant. These data lead us to a conclusion that for critical flow transition, the inertia effect is more pronounced for a column with larger grains than that with finer grains. In comparison, the friction factor increased with an increase in grain diameter for columns (e)–(i), when there is turbulence. A similar behavior has been reported by some investigators, which will be discussed later. In the next section, the relationship between four parameters (e.g., permeability, inertia factor, Reynolds number and Forchheimer number) and particle diameter will be exhibited, while the illustration of affection on flow transition by pore structure will be discussed.
4. Influence of Particle Diameter on Key Parameters
4.1. Influence of Particle Diameter, Shape and Roughness on Permeability k and Inertia Factor β
Permeability k and inertia factor β are the natural properties of porous media, which describe the microstructure characteristics. In addition, they are also the key parameters for the development of Forchheimer equation presentation [43]. Many researchers have proposed the general formula of k and β. One of the most well-known equations was the Kozeny–Carmen equation. Carman discussed that the permeability derived from Darcy’s law relies on four factors, such as particle diameter d, porosity n, the sinuous track of length Le and particle shape (or called surface factor) ϕ. Eventually, the permeability could be summarized as a function of particle diameter and porosity [21]. As the fluid flow deviates from Darcy’s law, one of the most famous extension of the Kozeny–Carmen equation was made by Ergun (1952), which is suitable in the Forchheimer regime [22]. Ergun followed the representation of the viscous term in the Kozeny–Carman equation and added one inertia term that was closely analogous to the viscous term. The main drawback to both above-mentioned expressions is the basic assumption of the granular bed being equivalent to a bunch of capillary. Thus, a series of modified equations has been proposed with abundant geometrical characteristics, while the empirical formula of permeability and inertia factor are exhibited in Table 3 [23,24,26,28].
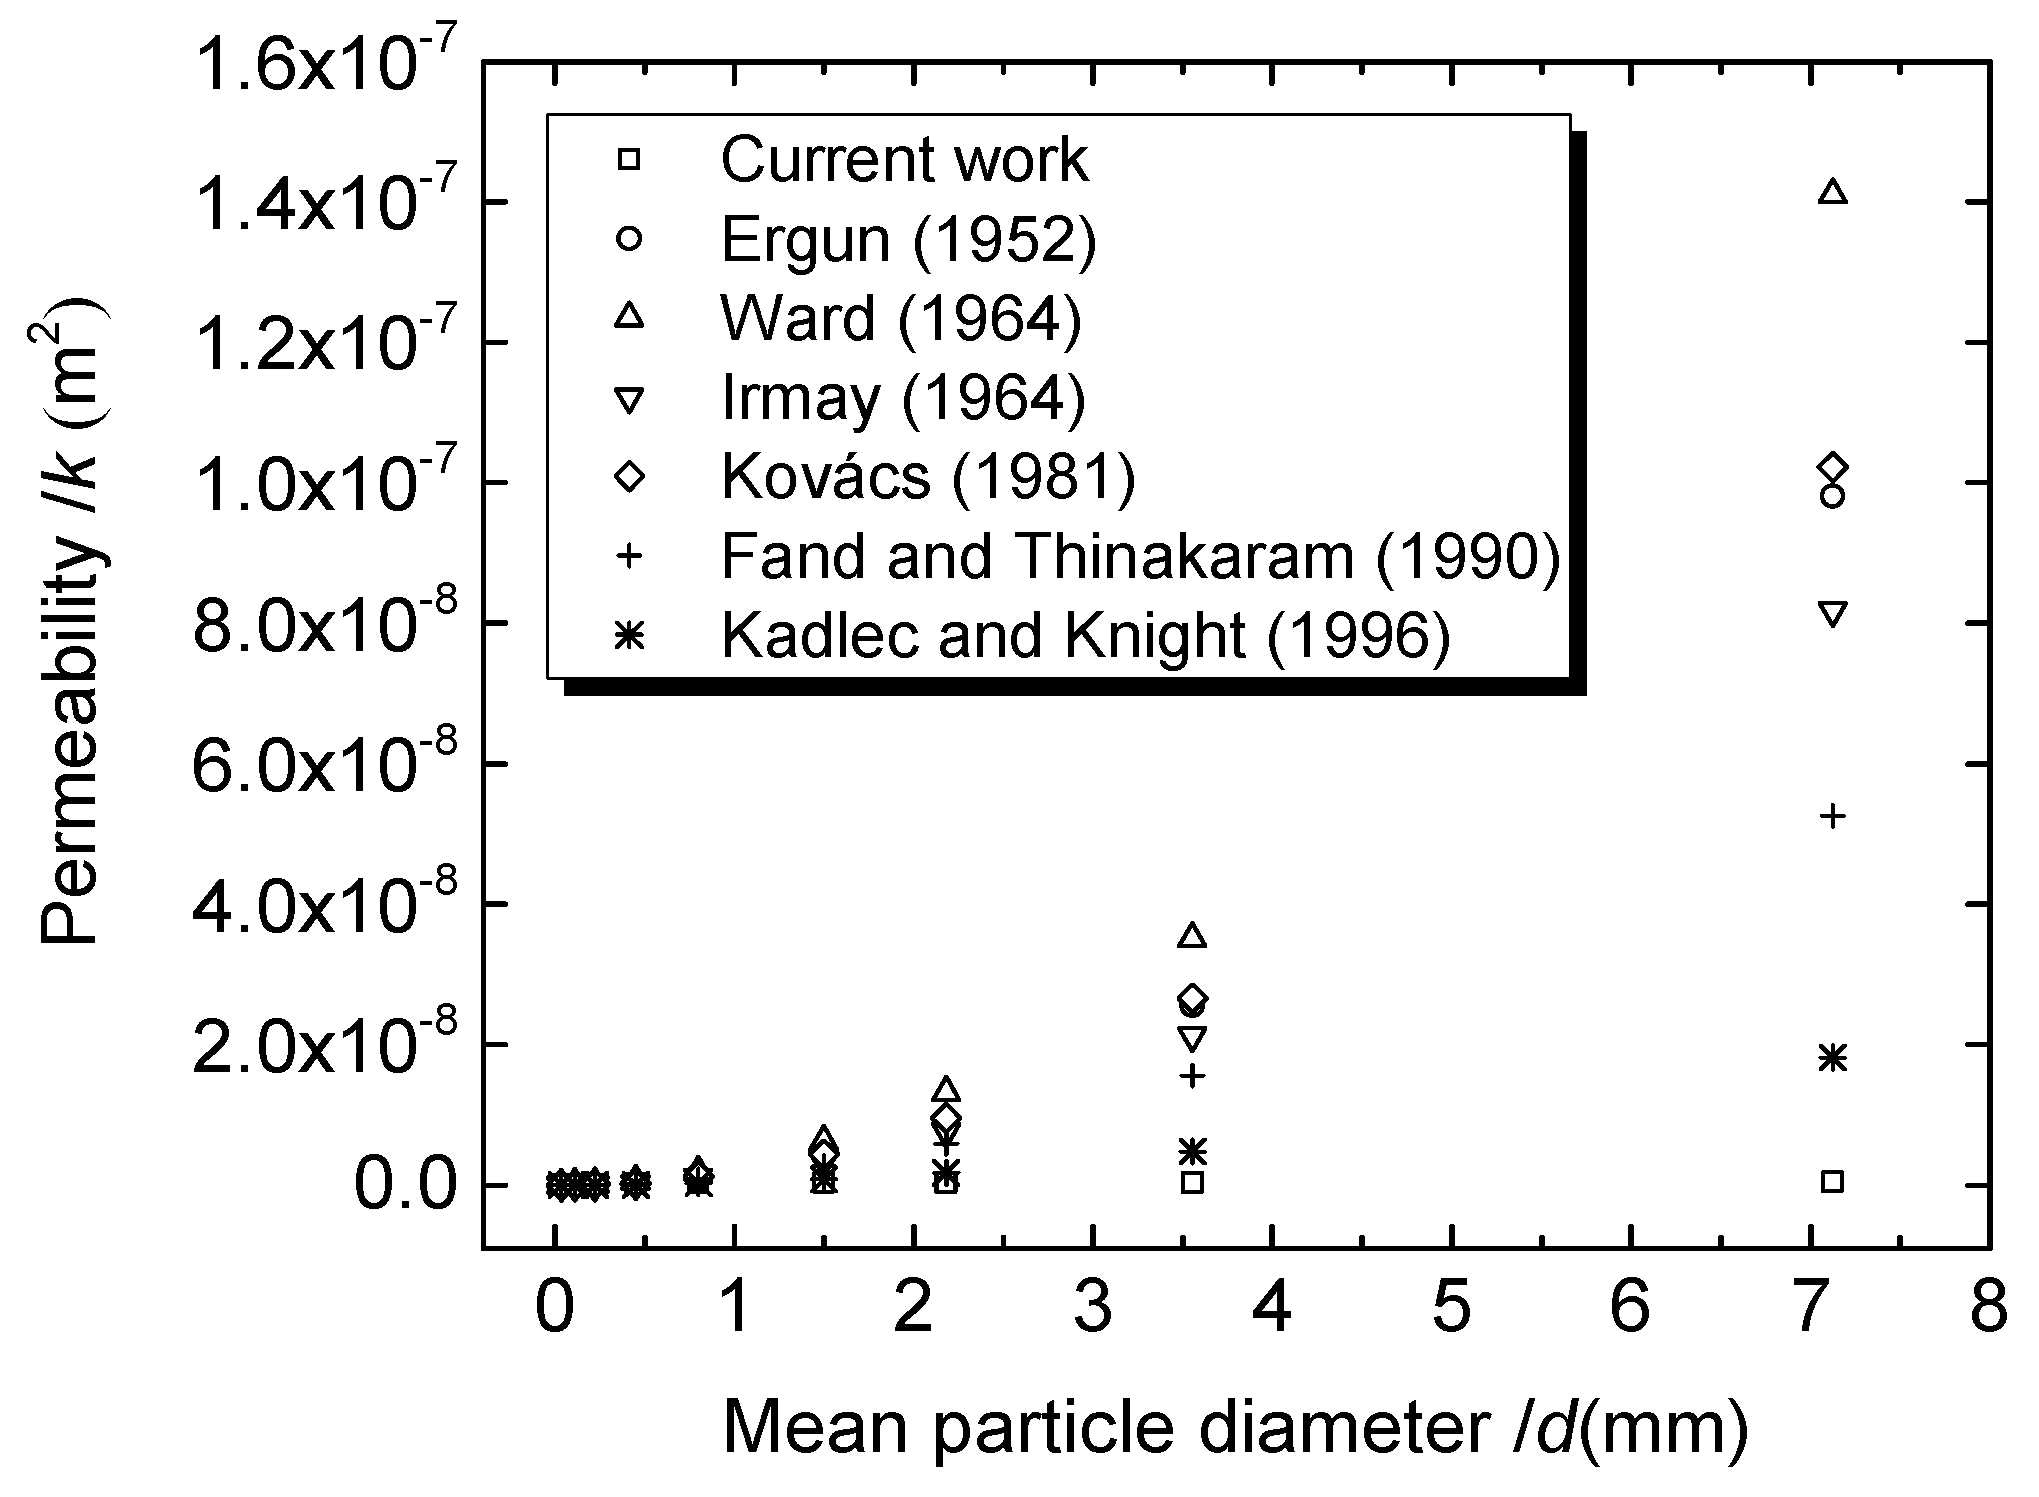
In this study, nine groups of tests were carried out, while k and β were obtained. The graphical presentation of results for various empirical formulas compared to our experimental data are presented in Figure 5 and Figure 6, respectively. Due to these equations being based on assumptions and simplifications of the geometry of the pore space, there are varying degrees of accuracy in their applications. For instance, compared with the other five formulas in Table 3, Ward’s equation had the biggest difference from the measured data. The major reason for this great difference lies in Ward considering k and β to depend solely on the particle diameter. The other factors mentioned above are not taken into account.
Moreover, as the particle diameter increases, the differences become more significant. As shown in Figure 5, there is little difference between the measured and calculated values for the wind-blown sand columns (a)–(d). In comparison, for the river sand columns (e)–(g) and crushed quartz columns (h) and (i), the formulae presented in Table 3 are overestimating the permeability. The possible reason for this behavior is related to the particle shape of the porous medium. Due to the formation of boundary layer separation and recirculation eddies, the particle shape has a significant effect on the flow character. It is important to consider that the equations mentioned above are based on simplifications of the geometry. Consequently, comparing these three types of sand granules, crushed quartz had the roughest surface and most irregular non-spherical shape particles, which exhibit the maximum errors of permeability between experimental and computational values.
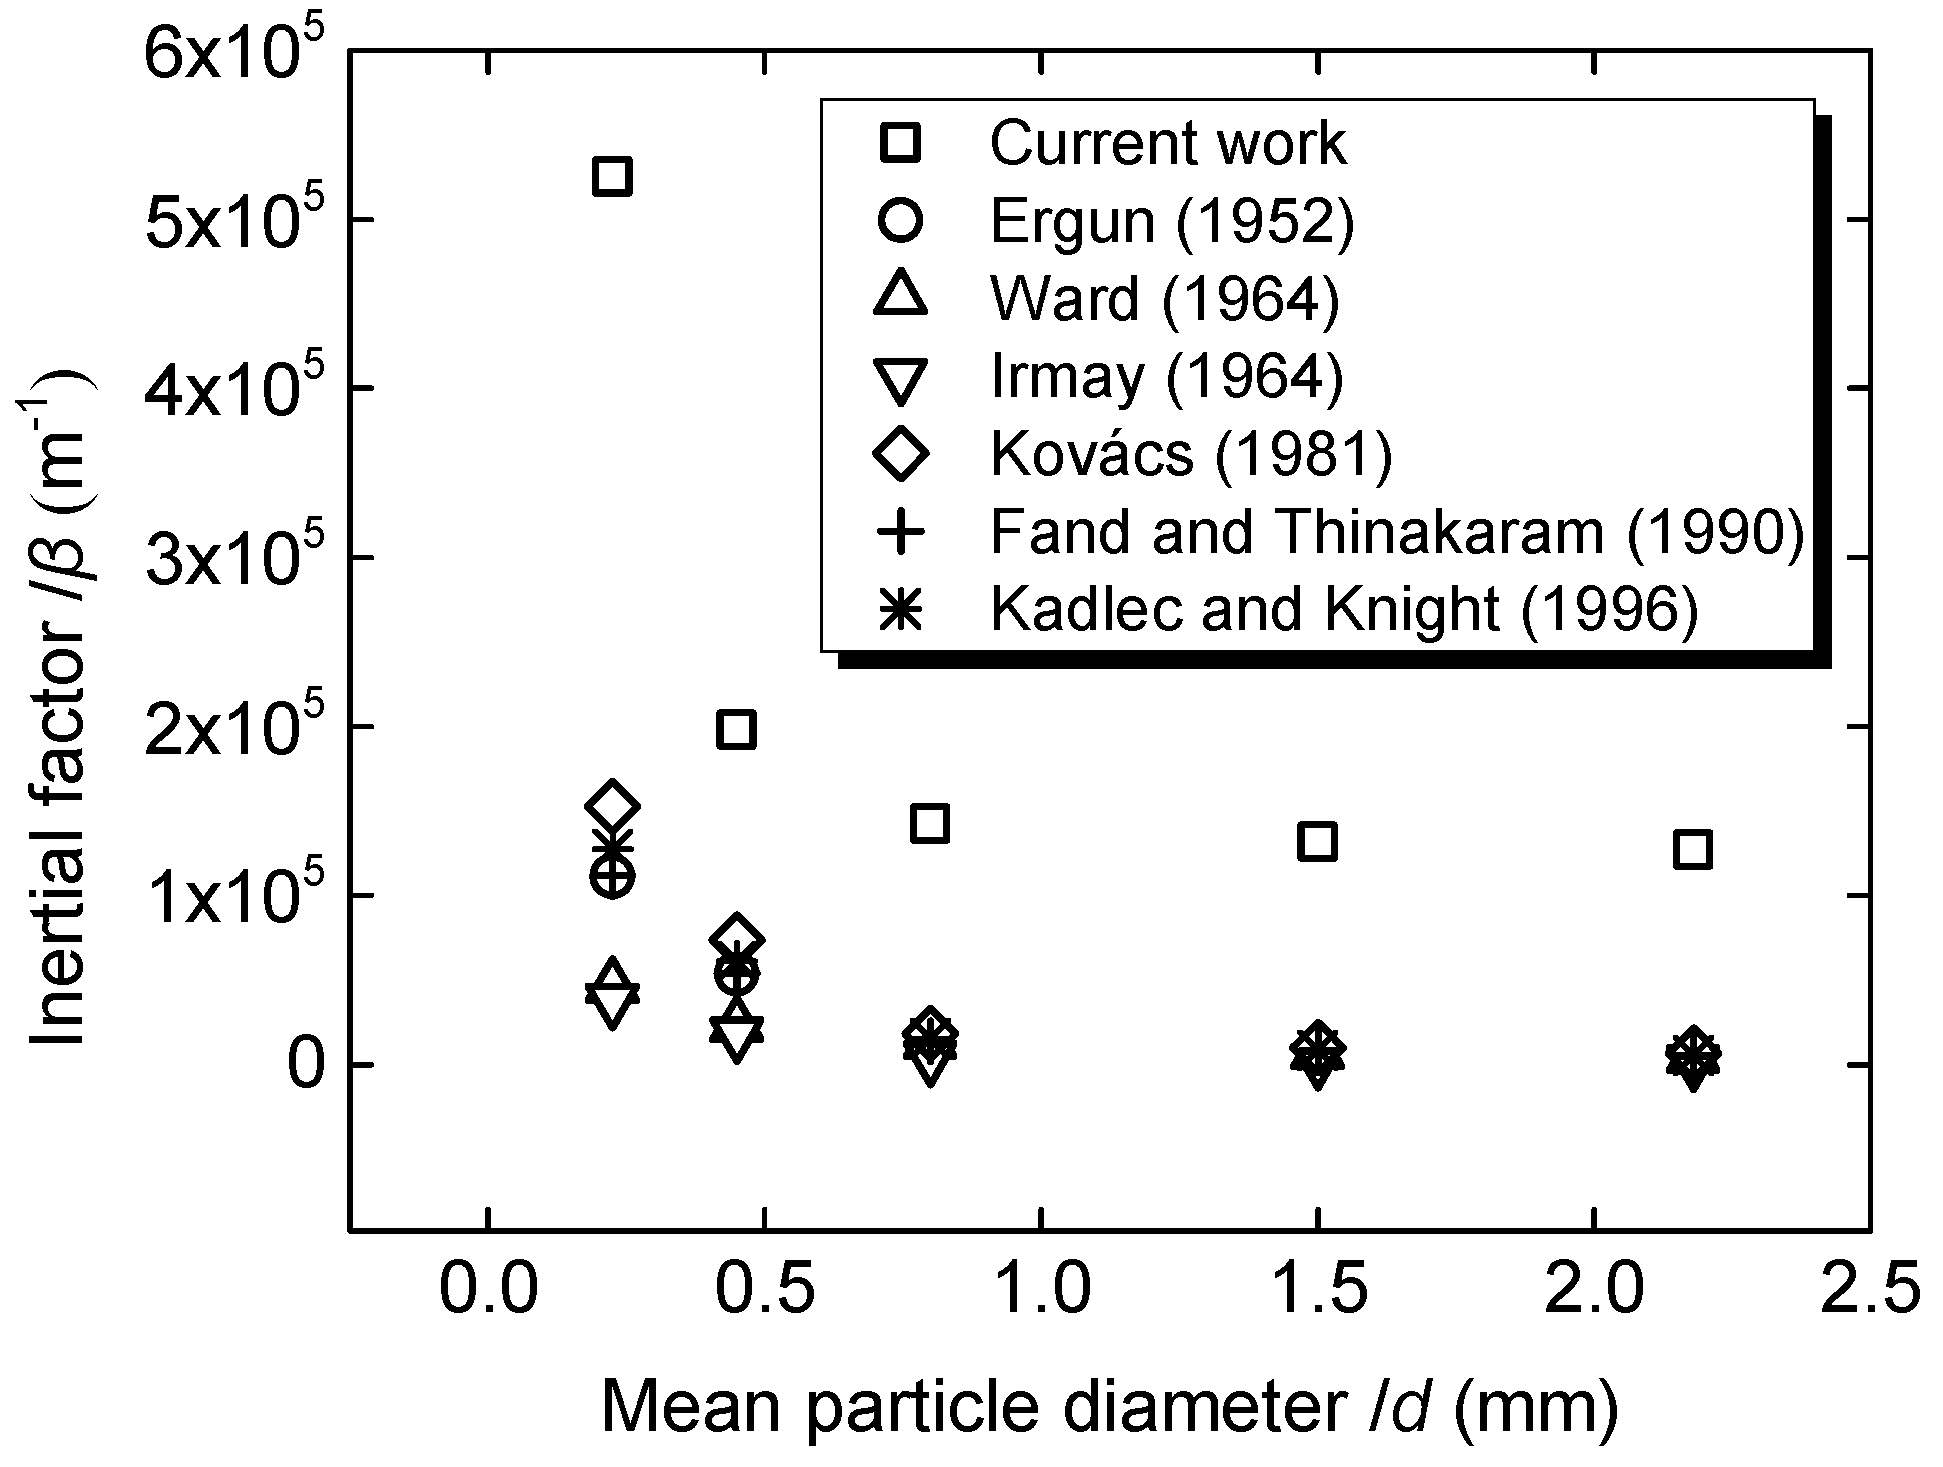
The inertia factor is negatively correlated to the permeability (see Table 2) [54]. The results of the inertia factor had an inverse correlation to the permeability (Figure 6). The particle shape plays a crucial role for the inertia effect. Fourar et al. indicated that the major influence on inertia forces in porous media is derived from asymmetric streamlines induced by formation of eddies in re-circulation zones [55]. Another theoretical analysis suggested that the inertial energy losses strongly localized around the boundary layer [56]. Chen et al. and Tzelepis et al. point out that a rough surface will lead to the chaotic flow being more easily formed and results in more inertia energy losses than smooth surfaces [46,57]. Consequently, the inertia effect had a greater impact on a rough pore space, i.e., the measurement results within rough particles should be larger than empirical values based on assumptions and simplification of the geometry of pore structure.
The flow resistance, imposed to a fluid by any solid surface, is caused by two distinct physical origins [58]:
- Fluid adherence, no-slip resistance between fluid and solid surface; as well as
- Form force, responsible for the quadratic term of Forchheimer equation.
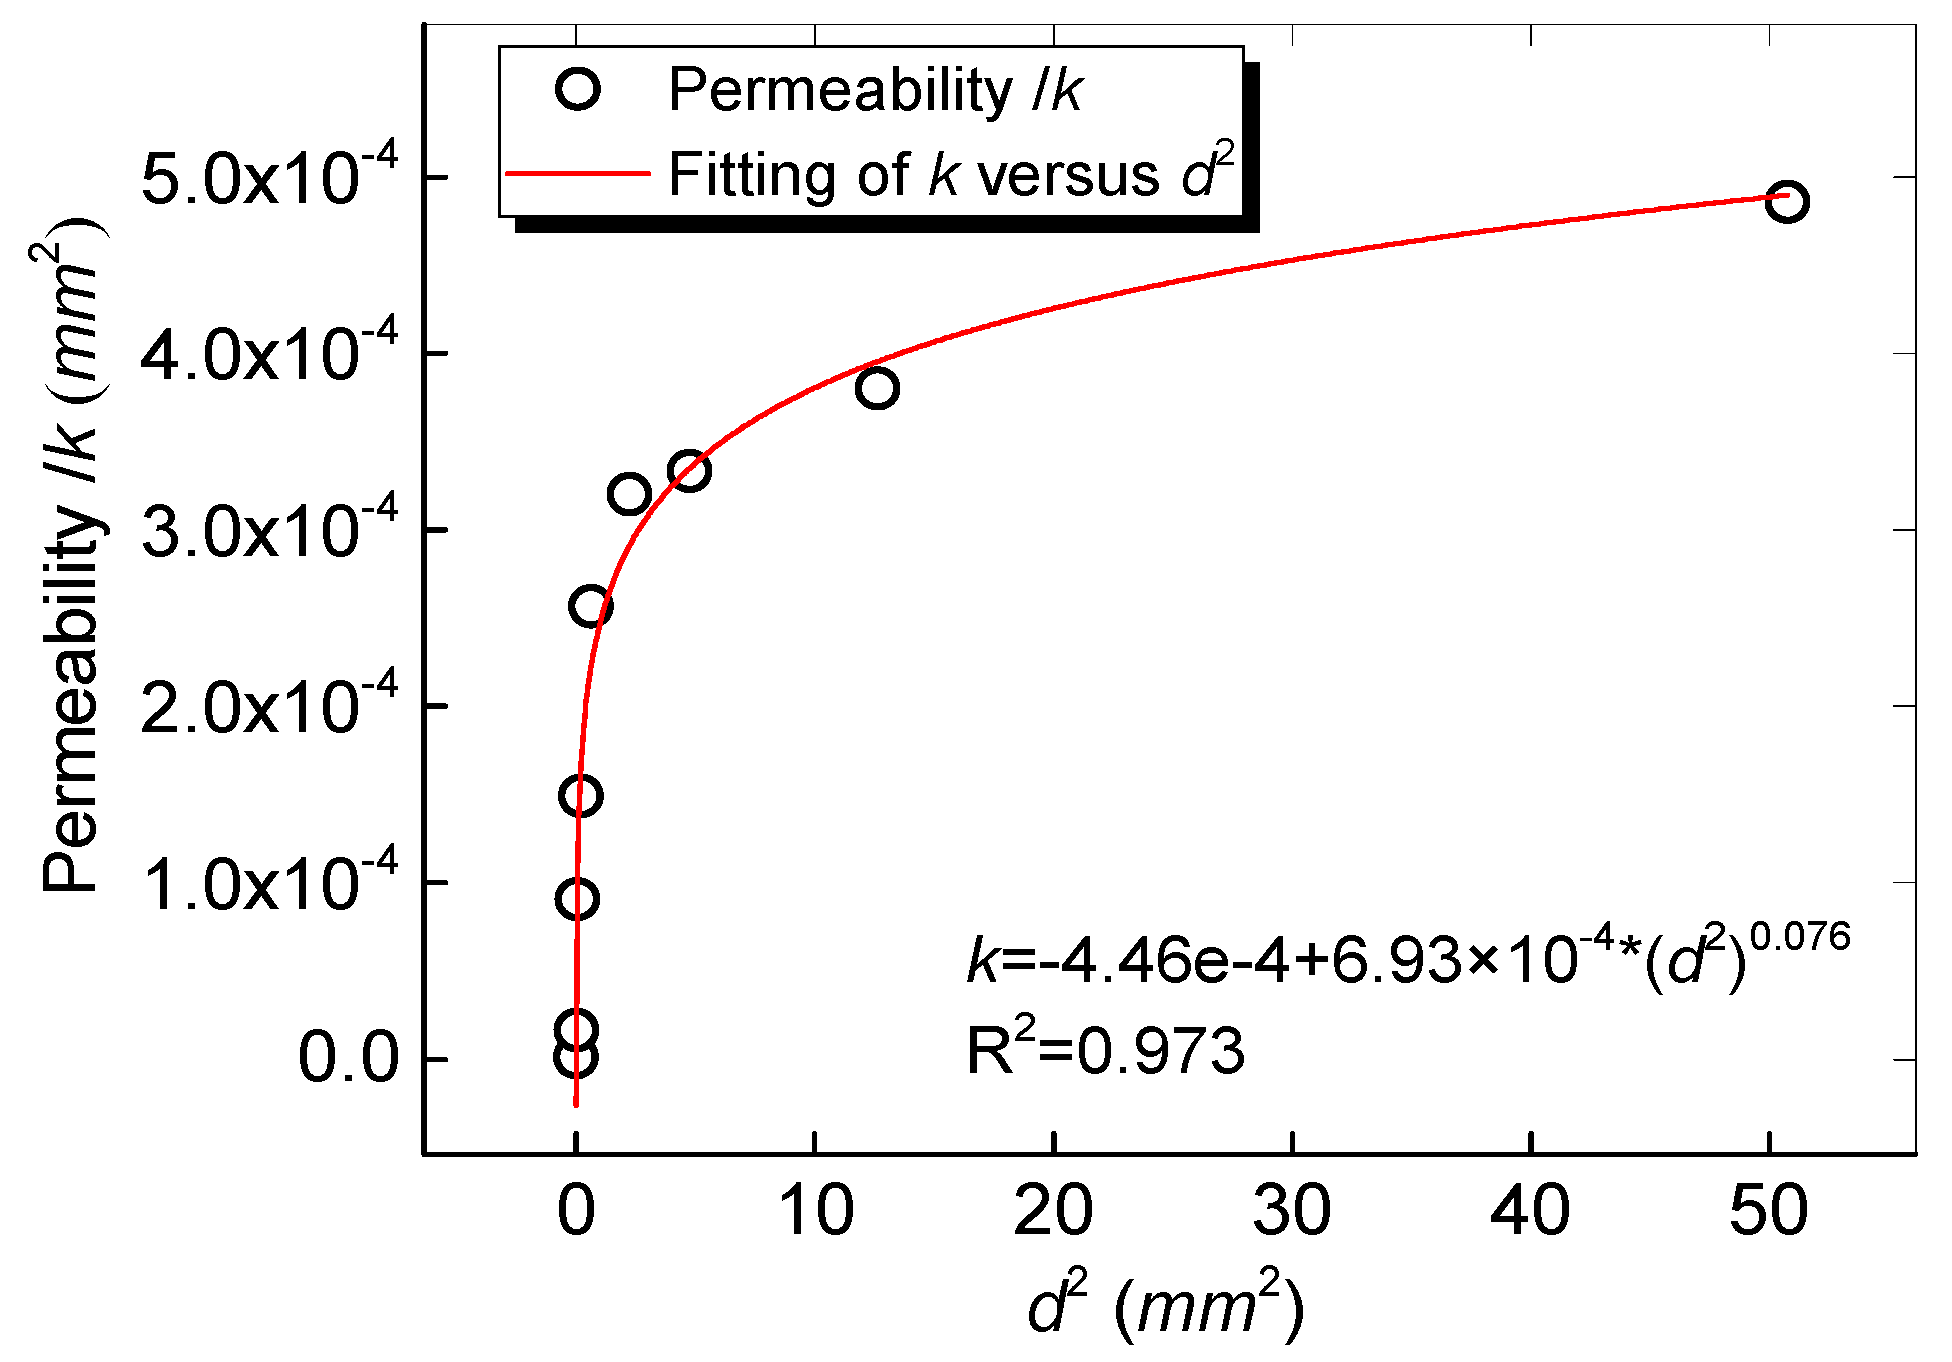
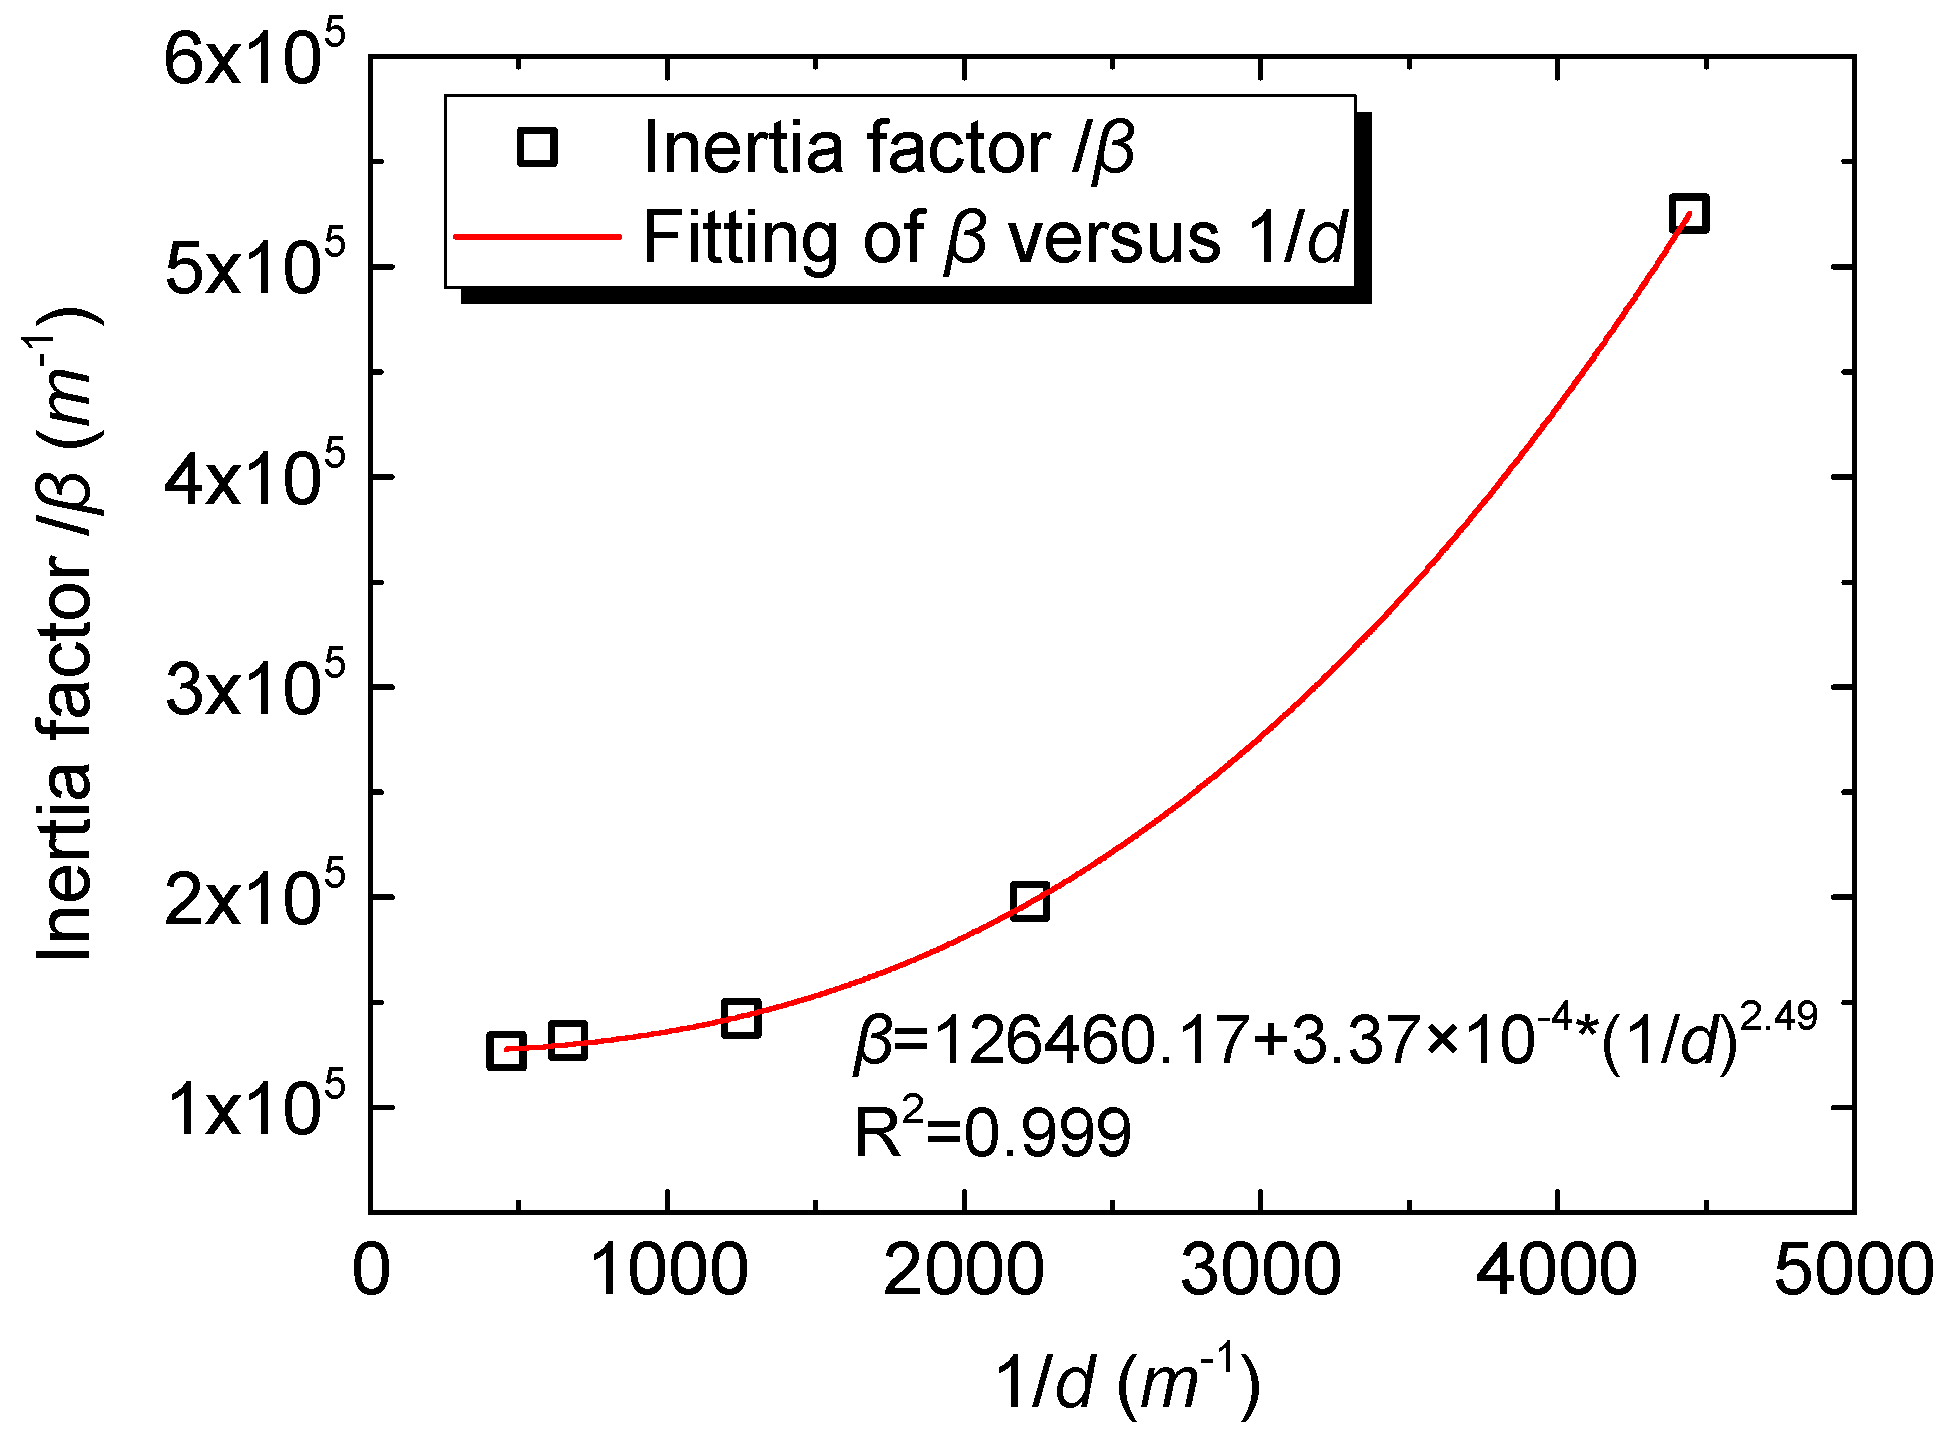
The coefficient of the quadratic term, also known as the inertia factor, is related to the geometry of the solid porous medium, which contains the information of tortuosity in flow path [59]. For the case of the porosity media in the matrix of spheres, the denser packing in smaller spheres results in smaller flow passages and larger solid surfaces, even though the porosity remains practically the same as the porous media with larger spheres, which is likely to increase fluid adherence to flow. In addition, the winding of flow passages is considerably greater within smaller spheres, which is likely to increase form force to flow. Hence, the permeability k is proportional to the particle diameter square d2. In contrast, the inertia effect reduced with an increase in particle diameter, i.e., the inertia factor β is inversely proportional to the particle diameter d. These relationships had been verified by Huang et al. [33] (see their Figure 7 and Figure 8) in their experiment for the case of fluid flow in cubic arrays of smooth spheres. A similar result has been reported by Sedghi-Asl et al. [34] (see their Figure 5) for the case of rounded aggregates packed into a column.
In this study, fitting curves of k–d2 and β–1/d are presented in Figure 7 and Figure 8. Apparently, the directly proportional relationship was not available, which is caused by two elements: the arrangement and roughness. For the case of a medium consisting of a random arrangement of sand particles with coarse surfaces, the fluid adherence would be more evident than that in medium with smooth and well-arranged spheres, which means a ‘discount effect’ for permeability. At the same time, the form force would be higher and an ‘additive effect’ for inertia factor will be revealed. We presented the relationship of k–d2 and β–1/d as:
where a, b and c are constant; α is discount effect coefficient; and γ is additive effect coefficient.
Table 4 represented the fitting results of α and γ for three different porous mediums cited by Huang et al., Sedghi-Asl et al. (recalculated k and β based on existing data in their Table 1) and our research [33,34]. The discount effect and additive effect could be observed clearly.
In summary, the arrangement and roughness of the particle could actually discount or add to the value of permeability and inertia factor, respectively. However, the main tendency is that permeability increases with increasing particle diameter and inertia factor decreases with an increase in grain diameter. Permeability and inertia factor describe the flow characters from the microstructure perspective. For the micro- or macroscopic mechanical perspective, the transformation between viscous force and inertia force could be expressed by Re and Fo, which is also used as critical criteria of flow regime transition.
4.2. Influence of Particle Diameter on Friction Factor
When the flow becomes completely turbulent, the friction factor f becomes independent of Re and tends to remain constant [44]. As mentioned above in Section 3, even though the inertia effect was more pronounced for columns with larger particles, the friction factor of the turbulent onset point increased with an increasing grain size.
A similar behavior to this is essentially depicted in Figure 3 of Sedghi-Asl et al. and Rahimi et al. [60]. They suggested that the voids and the angular sediment edges become larger, which leads to an increase in flow resistance. Furthermore, some similar reports have been presented by Chen et al. [46] (see their Figure 2, Figure 3 and Figure 4) and Tzelepis et al. [57] (see their Figure 3) for the case of fluid flow through fractures. Their experimental data show that the friction factor become larger within wider fractures when turbulence occurred, while it becomes easier to have turbulence when there is a rougher surface.
In our study, although the porosity of the columns (e)–(i) is roughly equal, larger granules created a larger pore body and more sharper corners, as suggested by Chaudhary et al. [61]. Thus, there are more obstructions, which occupied part of the pore space and constrict the seepage path. Thus, the flow resistance increased.
4.3. Influence of Particle Diameter on Critical Re and Fo
In Figure 9, friction factor is plotted as a function of Reynolds number by experimental data of columns (e)–(i). The red data points represent turbulent onset. As depicted in Figure 9, friction factor does not depend monotonically on the Re. The friction factor increases with an increase Re for a narrow range. A similar situation has been reported by many investigators. They suggested that the behavior represents the transition zone between Forchheimer and turbulent regimes [57,62,63].
According to Figure 9, the critical Re (Reynolds number values of turbulent onset) increasing with an increase in granular size. A similar behavior for the case of deviation point from Darcy flow has been reported by Li et al. (e.g., the critical Re = 3.90, 7.08, 9.1 and 10.78 corresponds to particle diameters of 1.075, 1.475, 1.85 and 2.5 mm) [37]. In current work, the values of critical Re were 42.39, 87.59, 127.32, 212.64 and 322.55 in the case of turbulent onset. Obviously, the flow transition comes faster for fine particle-packed columns, which might be as a result of energy transfer occurring faster in small-scale pore structure [64].
A larger Reynolds number means a stronger inertial effect. It can be found that the inertia effect is more pronounced for the column with larger grains than that with finer grains when the flow regime transitions from Forchheimer to turbulence.
This behavior can also be described with Forchheimer number Fo. Following Ruth and Ma [65], it can be expressed as:
This could be explained as the ratio of liquid–solid interaction to viscous resistance by Zeng et al. and Grigg et al. [42], which is derived from Forchheimer equation. As mentioned above in Table 3, k and β could be written as a function of d and n. Taking Ergun’s expression for instance, the Fo number could re-written as:
where C is constant.
Equation (3) indicates that the grain diameter, porosity and flow velocity are the main contributing factors for the value of critical Fo. In our research, the porosity of columns (e)–(i) roughly remain constant. As shown in Table 2, the superficial velocity is nearly equal when turbulent flow begins. Consequently, the critical Fo increases with an increase in particle diameter, i.e., inertia effect becomes more pronounced for the column with larger granules when the flow transitions from the Forchheimer to turbulent regime.
5. Determination of Various Flow Domain Equations
The well-known Darcy’s law (Equation (5)) is applicable in Darcy regime. There are two different types of formula have been proposed to describe the non-linear flow through particle-packed media: the Forchheimer equation, also known as quadratic law (Equation (6)), and Izbash’s equation or namely power law (Equation (7)):
where A, B and λ are constant. Although the empirical Forchheimer equation has been shown to be derived from a theoretical point of view [66,67], the power law is more of the empirical nature and is likely to fit well for the high-velocity flow in many experimental studies [34,68,69]. The exponential value of the power law is mostly related to the flow regime: m = 1 for case of the Darcy regime, while m reaching 2 indicates that the flow has become fully turbulent [58,68,70].
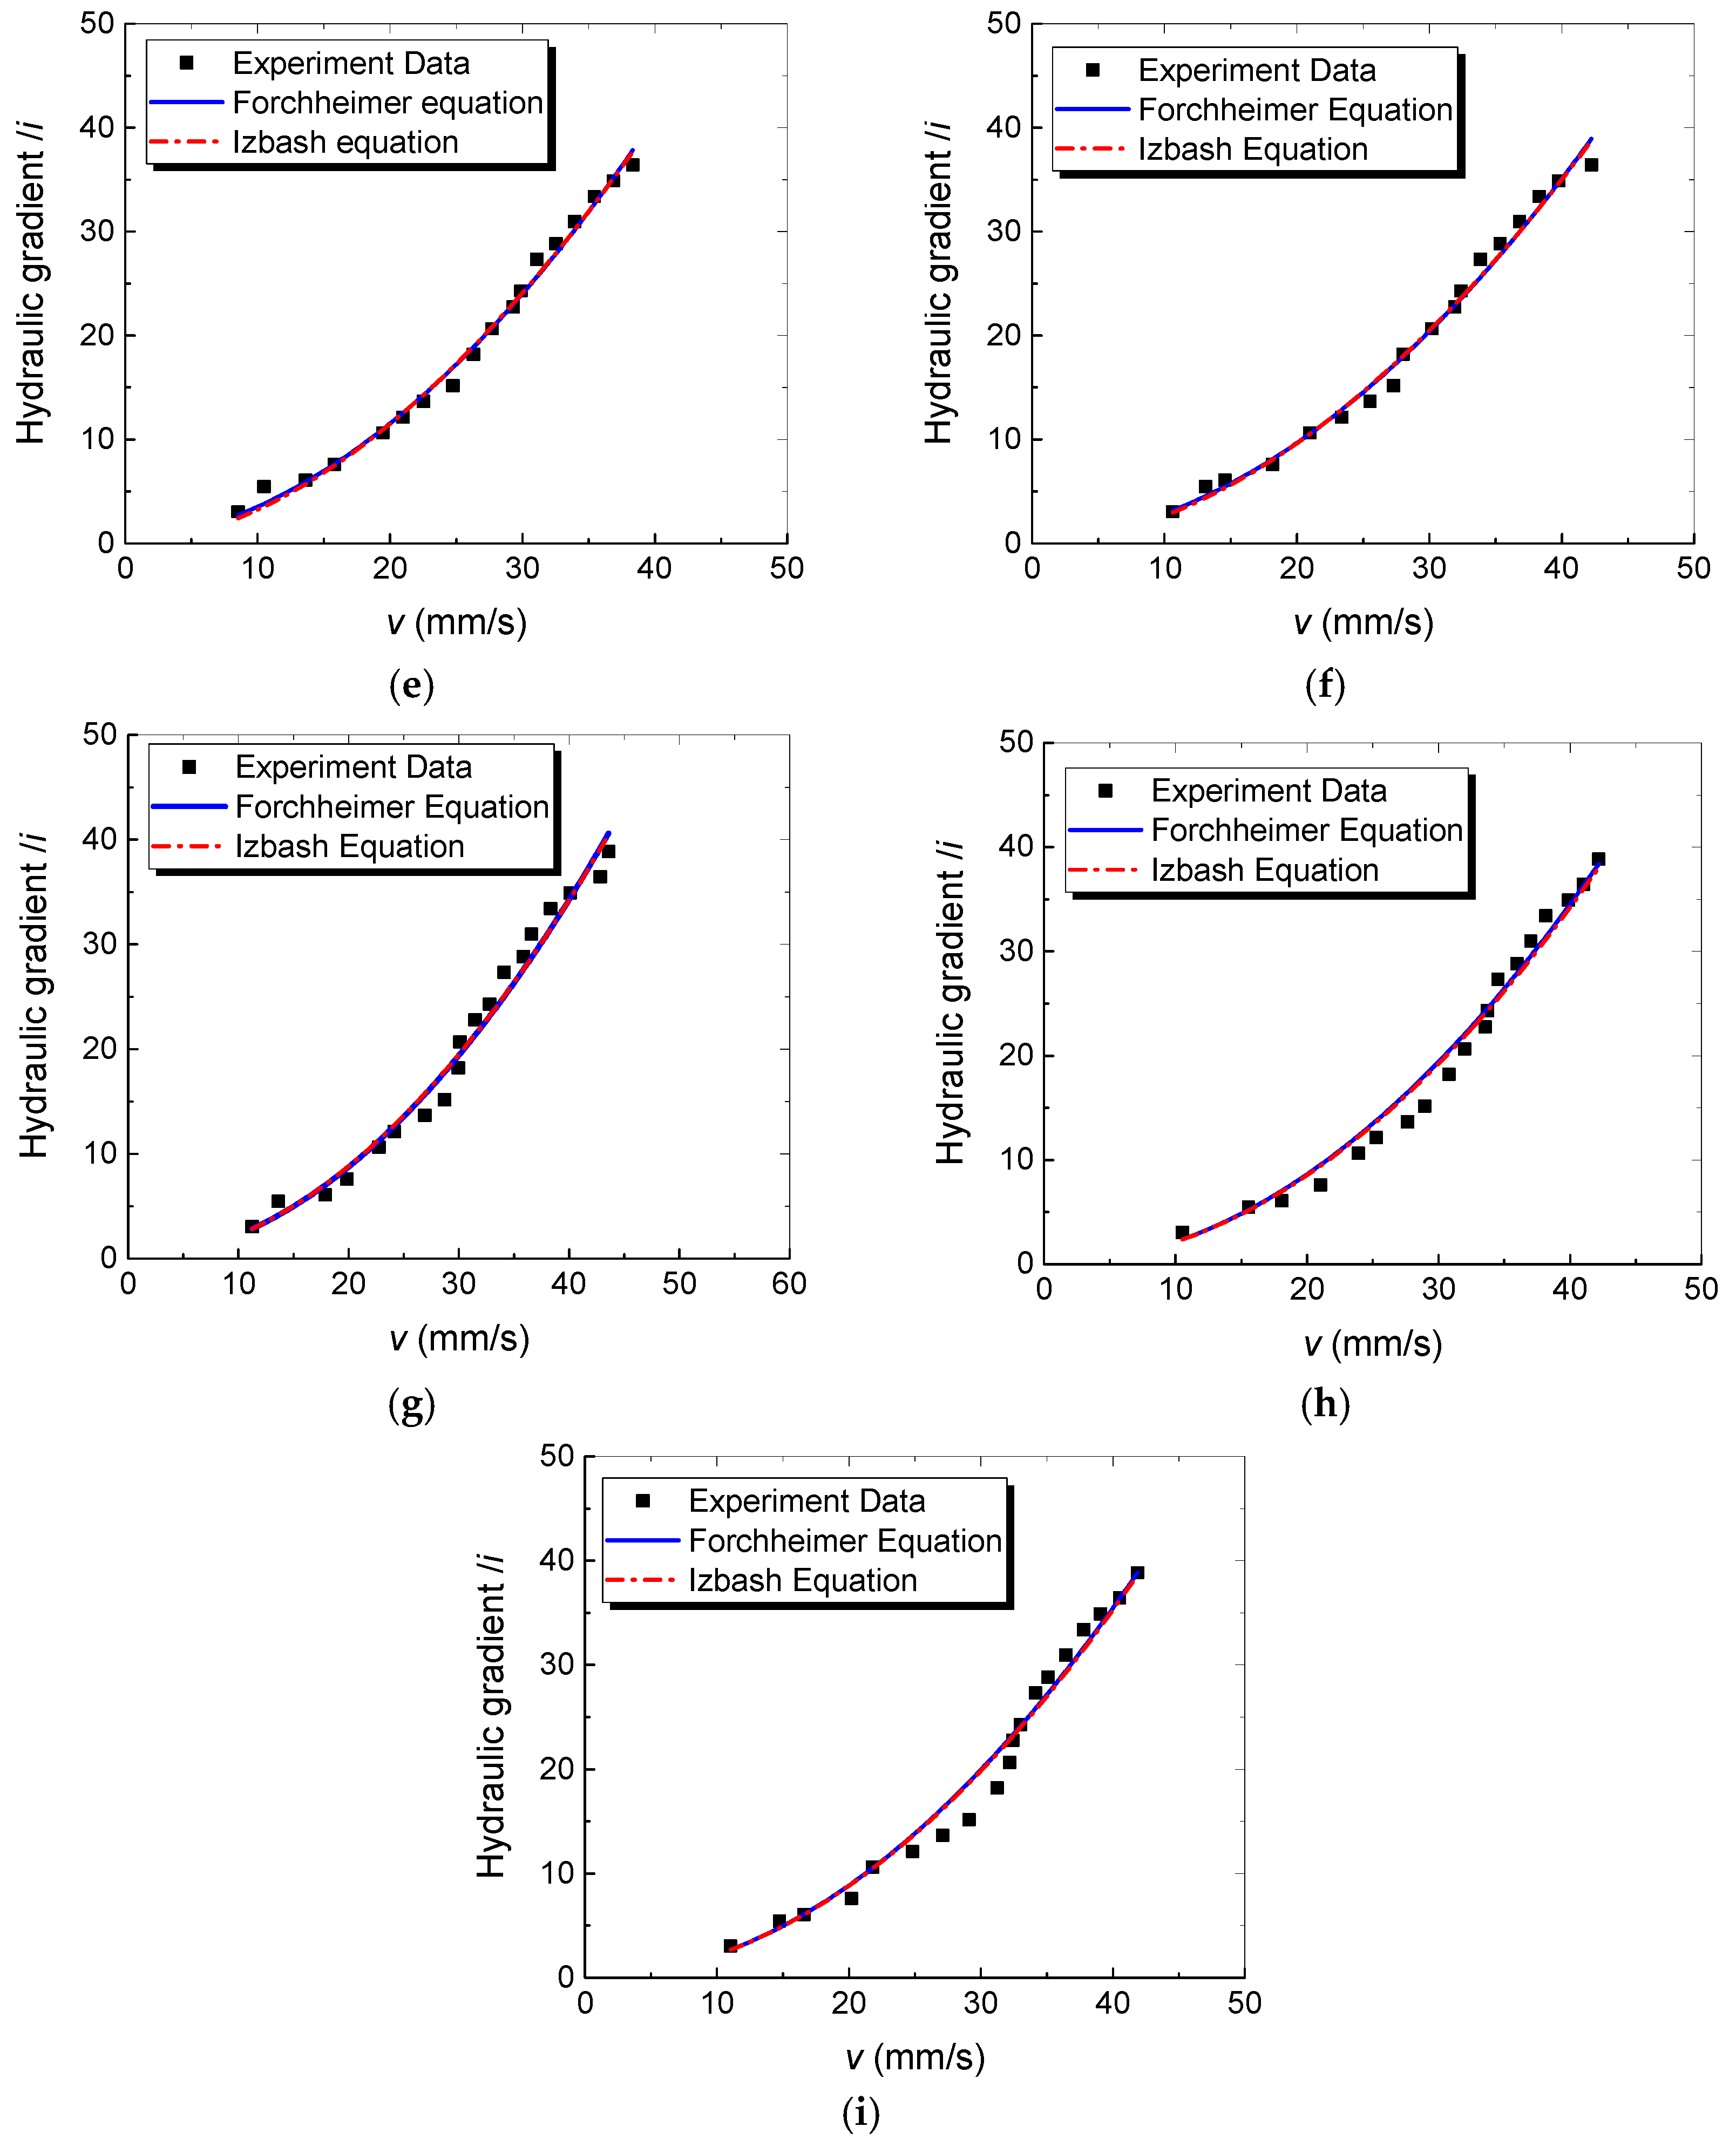
Figure 10 presents the hydraulic gradient i compared to superficial velocity v, which is correlated using three fulmars: Darcy’s law (Equation (5) shown in Table 5), Forchheimer equation (Equation (6)) and power law (Equation (7)). It is worth noting that in our test, the flow regime of packed column (a) is mostly pre-Darcy regime with a particle diameter range of 0–0.075mm. To date, there is no precise information regarding the lower boundary and there is a lack of experimental data for the pre-Darcy regime. Fand et al. [47] point out that the published data indicated that the lower limit of Darcy region is less than Re = 10−5. Some investigators suggest that the pre-Darcy regime has a wider range than Darcy’s law and proposed the upper limits based on seepage tests in columns packed with spheres of different sizes (e.g., Re < 0.3 for 3 mm beads; Re < 0.6 for 6 mm beads obtained by Kececioglu et al. and Jiang et al. [48]; and Re < 0.72 for 3 mm spheres and Re < 9.65 for 1 mm spheres obtained by Bağcı et al. [50]). However, the lower limits and the expression of the pre-Darcy regime is still controversial. Therefore, we described the pre-Darcy regime using Darcy’s law for the meantime, with the results listed in Table 5.
From the presented results in Figure 10, it is evident that for the experimental data of column (a) and (b), the hydraulic gradient increases in a linear relationship with velocity and Darcy’s law was more suitable than the Forchheimer equation. Thereafter, for the rest of the columns, there are non-linear relationships between the hydraulic gradient and superficial velocity. Furthermore, the non-linear effect becomes more remarkable with an increase in granular size, which corresponds with the change in critical Forchheimer number Fo and the critical Reynolds number. As shown in Table 5, an excellent agreement for the Forchheimer equation with column (b) to sample (e) was obtained; the power law is more suitable for columns (h) and (i); while Forchheimer equation and power law are both applied for columns (f) and (g).
Taking into account the results of flow regime identification and the inertia effect analysis in Section 4.3, it can be concluded that Darcy’s law was suitable for the wind-blown sand packed columns (a) and (b) with the particle size of 0–0.15 mm. The Forchheimer equation should be selected for columns (c)–(g) with the granular size of 0.15–2.36 mm. As the flow behavior becomes completely turbulent in columns (h) and (i), we suggest using the power law with exponential equals 2.0 describing flow character and the expression could be written as:
where ψ represents the turbulence coefficient.
It is important to notice that there is a conspicuous ‘sunken region’ of experimental data below the fitting lines for columns (g)–(i) and an inconspicuous ‘sunken region’ for columns (e) and (f) in Figure 10. Compared with the flow regime identification results (in Figure 4), the data of the sunken region basically correspond to the flow transition zone between the Forchheimer and turbulent regimes. When there is only turbulence, the inertia force dominates and leads to energy loss and an increase in pressure, i.e., the hydraulic gradient is proportional to the flow velocity squared. A higher hydraulic gradient is required for this turbulent regime. Thus, a ‘sunken region’ was revealed just before this turbulent regime.
6. Flow Region Division and Seepage Equation Selection
In the engineering practices, the particle diameter and fluid flow velocity are easily accessible. For the current work, a relationship between the critical velocity of flow transition and the mean particle diameter is displayed in Figure 11, with three flow fields exhibited. The Darcy’s law region has very low velocity in the range of 0 < v < 0.015 m/s. As the velocity gradually increases, the Forchheimer equation begins to dominate with the lower boundary being v = 0.018 m/s and the upper boundary being 0.035 m/s. However, the critical velocity begins earlier (e.g., at v = 0.011 m/s) for finer particles. Following the upper boundary of the Forchheimer region, the flow regime moves gradually into turbulent flow and the velocity becomes larger than 0.031–0.0345 m/s, which is more suitable for Equation (8). According to the changes in trends displayed in Figure 11, the critical velocity of the Forchheimer flow or turbulent flow might be lower when there are finer granules. However, by increasing the particle diameter, the critical velocity tends to remain constant.
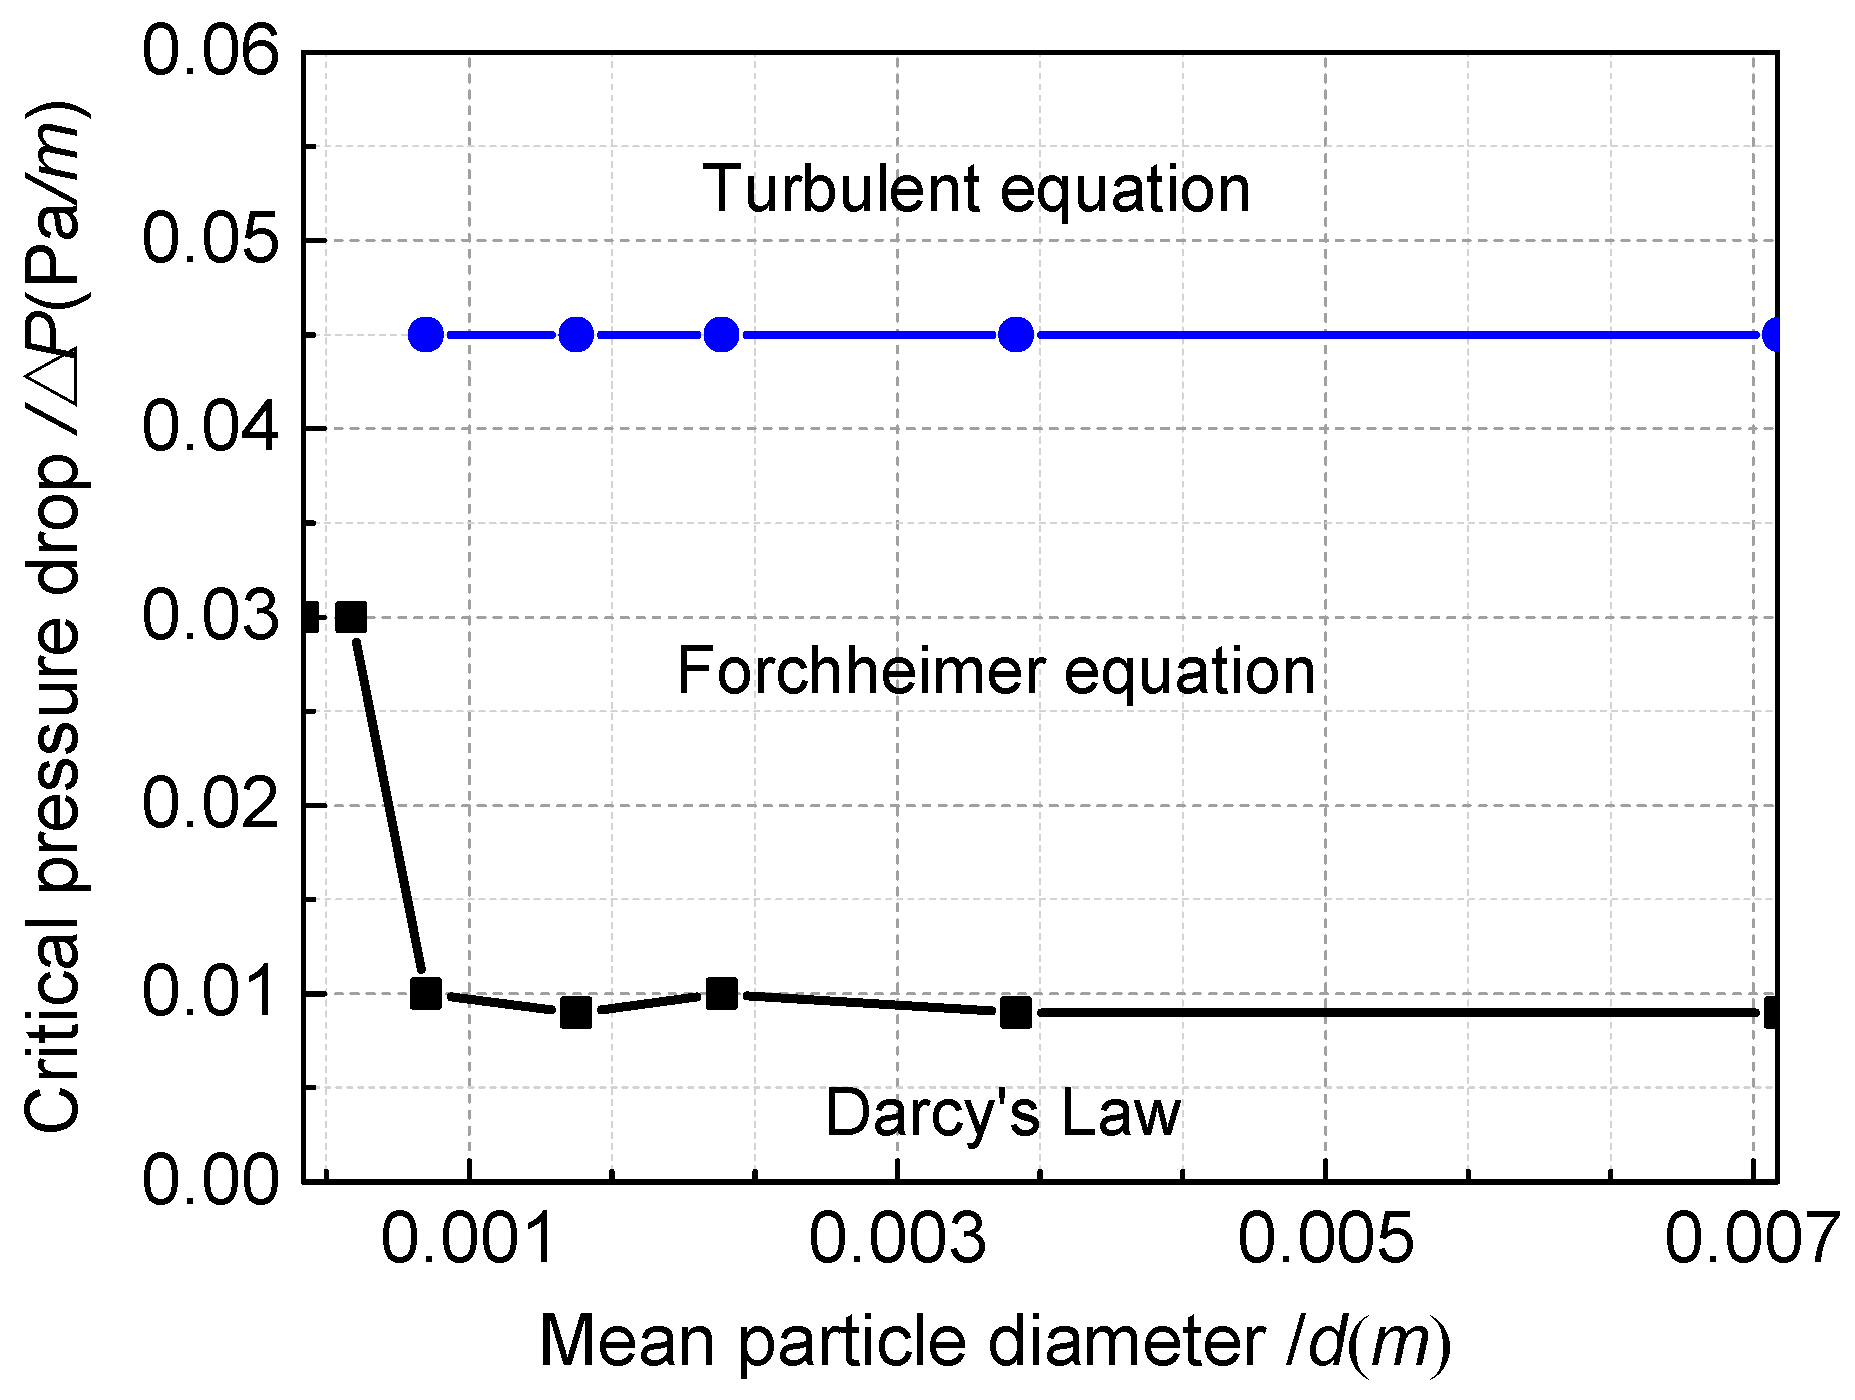
Flow fields based on the critical pressure drop against particle diameter are displayed in Figure 12. The critical pressure drop between Darcy flow and Forchheimer flow was 0.03 MPa for the wind-blown sand (0–0.6 mm granular size) and 0.009–0.01 MPa for the river sand and crushed quartz (0.6–9.5 mm granular size), respectively. As the flow pattern becomes completely turbulent, the values of pressure drop criterion was 0.045 MPa for a granular size of 0.6–9.5 mm. Furthermore, the value should be much higher than 0.06 MPa for the wind-blown sand (0–0.6 mm granular size). Concerning the results displayed in Figure 12, we could conclude that the particle-packed medium with finer particles consumed much higher energy than that with larger granules during the flow transition.
7. Conclusions
The present study deals with nine groups of experimental investigations that arise from granular size influencing flow regime transition in particle-packed media. The relationship between critical parameters of flow transition and the granular size of particle-packed medium was discussed. The equations used to describe various flow domains were determined. The following can be stated:
- The permeability increases exponentially with particle diameter for the case of fluid flow through a particle-packed medium. A ‘discount effect’ for permeability should be caused by the non-spherical shape and roughness of the particle. A suitable equation of permeability was obtained experimentally:
- In contrast with permeability, the inertia factor reduces exponentially with an increase in particle diameter. An ‘additive effect’ should be caused by the non-spherical shape and roughness of particles for the inertia factor. The relationship between inertia factor and mean particle diameter was obtained:
- Three different flow regions have been divided. The availability range of seepage equation was verified based on the division results, which is shown in the graph of superficial velocity against mean particle diameter. The Darcy region is located at the creeping velocity in the range of 0 < v < 0.011 m/s with Darcy’s law being more suitable (Equation (5)). The Forchheimer region is found at 0.018 < v < 0.0345 m/s with the quadratic law suitable in this case (Equation (6)). The turbulent flow domain occurred at v > 0.0345 m/s with the power law being applied in this case with an exponential value of 2 (Equation (8)).
- According to the results of flow region–division, the availability range for seepage equation was obtained, which is shown in the curve of pressure drop (ΔP) plot against mean grain diameter. The Darcy domain should be found at ΔP < 0.03 MPa for a granular size of 0–0.6 mm and at ΔP < 0.009–0.01 MPa for a granular size of 0.6–9.5 mm. The Forchheimer domain is located in 0.01 < ΔP <0.045 MPa for a granular size of 0.6–9.5 mm. Turbulent flow occurred at ΔP ≥ 0.045 MPa for a granular size of 0.6–9.5 mm.
- The inertia effect becomes more pronounced with an increase in the particle diameter when the flow transition occurs. Furthermore, the particle-packed medium with smaller granules had a greater energy loss during this process.
Acknowledgments
This work was supported by the National Basic Research Program of China (2013CB227900), the National Natural Science Foundation of China (51574059). The authors would like to acknowledge Lianchong Li for his modification suggestion, as well as the anonymous reviewers for their valuable comments, which have greatly improved this paper.
Author Contributions
Xin Yang, Tianhong Yang and Zenghe Xu conceived and designed the experiments; Xin Yang and Bin Yang performed the experiments; Xin Yang analyzed the data; Xin Yang and Tianhong Yang wrote the paper.
Conflicts of Interest
The authors declare no conflict of interest.
References
- Li, Y.; Neuman, S.P. Flow to a well in a five-layer system with application to the Oxnard Basin. Ground Water 2007, 45, 672–682. [Google Scholar] [CrossRef] [PubMed]
- Wen, Z.; Huang, G.; Zhan, H. An analytical solution for non-darcian flow in a confined aquifer using the power law function. Adv. Water Resour. 2008, 31, 44–55. [Google Scholar] [CrossRef]
- Wen, Z.; Huang, G.; Zhan, H. Non-darcian flow to a well in an aquifer-aquitard system. Adv. Water Resour. 2008, 31, 1754–1763. [Google Scholar] [CrossRef]
- Wang, J.; Liu, X.; Xiang, J.; Jiang, Y.; Feng, B. Laboratory model tests on water inrush in foundation pit bottom. Environ. Earth Sci. 2016, 75, 1072. [Google Scholar] [CrossRef]
- Sen, Z. Nonlinear flow toward wells. J. Hydraul. Eng. 1989, 115, 193–209. [Google Scholar] [CrossRef]
- Wen, Z.; Huang, G.; Zhan, H. Non-darcian flow in a single confined vertical fracture toward a well. J. Hydrol. 2006, 330, 698–708. [Google Scholar] [CrossRef]
- Ma, D.; Bai, H.; Miao, X.; Pu, H.; Jiang, B.; Chen, Z. Compaction and seepage properties of crushed limestone particle mixture: An experimental investigation for Ordovician karst collapse pillar groundwater inrush. Environ. Earth Sci. 2016, 75, 11. [Google Scholar] [CrossRef]
- Yin, S.X.; Zhang, J.C. Impacts of karst paleo-sinkholes on mining and environment in Northern China. Environ. Geol. 2005, 48, 1077–1083. [Google Scholar] [CrossRef]
- Miao, X.; Li, S.; Chen, Z.; Liu, W. Experimental study of seepage properties of broken sandstone under different porosities. Transp. Porous Media 2011, 86, 805–814. [Google Scholar] [CrossRef]
- Wang, Q.; Zhan, H.; Tang, Z. Forchheimer flow to a well-considering time-dependent critical radius. Hydrol. Earth Syst. Sci. 2014, 18, 2437–2448. [Google Scholar] [CrossRef]
- Li, Y.; Li, X.; Teng, S.; Xu, D. Effect of the non-darcy flow boundary in low permeability reservoirs. Environ. Prog. Sustain. Energy 2015, 34, 1822–1831. [Google Scholar] [CrossRef]
- Huyakorn, P.; Dudgeon, C.R. Investigation of two-regime well flow. J. Hydrauli. Div. 1976, 102, 1149–1165. [Google Scholar]
- Basak, P. Analytical solutions for two-regime well flow problems. J. Hydrol. 1978, 38, 147–159. [Google Scholar] [CrossRef]
- Mackie, C. Determination of nonlinear formation losses in pumping wells. In Proceedings of the International Conference on Groundwater and Man, Sydney, Australia, 5–9 December 1983; Volume 1, pp. 199–209. [Google Scholar]
- Wen, Z.; Huang, G.; Zhan, H.; Li, J. Two-region non-darcian flow toward a well in a confined aquifer. Adv. Water Resour. 2008, 31, 818–827. [Google Scholar] [CrossRef]
- Wenhao, S.; Tianhong, Y.; Honglei, L. Non-darcy flow model and numerical simulation for water-inrush in fractured rock mass. Chin. J. Rock Mech. Eng. 2016, 35, 446–455. [Google Scholar] [CrossRef]
- Ma, D.; Zhou, Z.; Wu, J.; Li, Q.; Bai, H. Grain size distribution effect on the hydraulic properties of disintegrated coal mixtures. Energies 2017, 10, 612. [Google Scholar] [CrossRef]
- Macdonald, I.; El-Sayed, M.; Mow, K.; Dullien, F. Flow through porous media-the Ergun equation revisited. Ind. Eng. Chem. Fundam. 1979, 18, 199–208. [Google Scholar] [CrossRef]
- Burcharth, H.F.; Andersen, O.H. On the one-dimensional steady and unsteady porous flow equations. Coast. Eng. 1995, 24, 233–257. [Google Scholar] [CrossRef]
- Allen, K.G.; von Backstroem, T.W.; Kroeger, D.G. Packed bed pressure drop dependence on particle shape, size distribution, packing arrangement and roughness. Powder Technol. 2013, 246, 590–600. [Google Scholar] [CrossRef]
- Carman, P.C. Fluid flow through granular beds. Trans. Inst. Chem. Eng. 1937, 15, 150–166. [Google Scholar] [CrossRef]
- Ergun, S. Fluid flow through packed columns. Chem. Eng. Prog. 1952, 48, 89–94. [Google Scholar]
- Ward, J. Turbulent flow in porous media. J. Hydraul. Div. 1964, 90, 1–12. [Google Scholar]
- Irmay, S. Theoretical models of flow through porous media. In Proceedings of the International Symposium on Transport of Water in Porous Media, Paris, France, 1964; Volume 29, pp. 37–43. [Google Scholar]
- Kovacs, G. Seepage Hydraulics; Elsevier Scientific Publishing Company: Amsterdam, The Netherlands, 1981; ISBN 0-444-99755-5. [Google Scholar]
- Fand, R.M.; Thinakaran, R. The influence of the wall on flow through pipes packed with spheres. J. Fluids Eng. 1990, 112, 84–88. [Google Scholar] [CrossRef]
- Kadlec, R.H.; Wallace, S. Treatment Wetlands, 2nd ed.; CRC Press: Boca Raton, FL, USA, 2008; pp. 43–44. ISBN 978-1-56670-526-4. [Google Scholar]
- Sidiropoulou, M.G.; Moutsopoulos, K.N.; Tsihrintzis, V.A. Determination of forchheimer equation coefficients a and b. Hydrol. Process. 2007, 21, 534–554. [Google Scholar] [CrossRef]
- Hayes, R.E.; Afacan, A.; Boulanger, B. An equation-of-motion for an incompressible newtonian fluid in a packed-bed. Transp. Porous Media 1995, 18, 185–198. [Google Scholar] [CrossRef]
- Dias, R.P.; Fernandes, C.S.; Teixeira, J.A.; Mota, M.; Yelshin, A. Permeability analysis in bisized porous media: Wall effect between particles of different size. J. Hydrol. 2008, 349, 470–474. [Google Scholar] [CrossRef] [Green Version]
- Tian, F.-Y.; Huang, L.-F.; Fan, L.-W.; Qian, H.-L.; Yu, Z.-T. Wall effects on the pressure drop in packed beds of irregularly shaped sintered ore particles. Powder Technol. 2016, 301, 1284–1293. [Google Scholar] [CrossRef]
- Soni, J.; Islam, N.; Basak, P. An experimental evaluation of non-darcian flow in porous media. J. Hydrol. 1978, 38, 231–241. [Google Scholar] [CrossRef]
- Huang, K.; Wan, J.W.; Chen, C.X.; He, L.Q.; Mei, W.B.; Zhang, M.Y. Experimental investigation on water flow in cubic arrays of spheres. J. Hydrol. 2013, 492, 61–68. [Google Scholar] [CrossRef]
- Sedghi-Asl, M.; Rahimi, H.; Salehi, R. Non-darcy flow of water through a packed column test. Transp. Porous Media 2014, 101, 215–227. [Google Scholar] [CrossRef]
- Benenati, R.F.; Brosilow, C.B. Void fraction distribution in beds of spheres. Am. Inst. Chem. Eng. 1962, 8, 359–361. [Google Scholar] [CrossRef]
- Beavers, G.S.; Sparrow, E.M.; Rodenz, D.E. Influence of bed size on the flow characteristics and porosity of randomly packed beds of spheres. J. Appl. Mech. 1973, 40, 655–660. [Google Scholar] [CrossRef]
- Li, Z.; Wan, J.; Huang, K.; Chang, W.; He, Y. Effects of particle diameter on flow characteristics in sand columns. Int. J. Heat Mass Transf. 2017, 104, 533–536. [Google Scholar] [CrossRef]
- Ma, D.; Bai, H.; Chen, Z.; Pu, H. Effect of particle mixture on seepage properties of crushed mudstones. Transp. Porous Media 2015, 108, 257–277. [Google Scholar] [CrossRef]
- Roblee, L.; Baird, R.; Tierney, J. Radial porosity variations in packed beds. AIChE J. 1958, 4, 460–464. [Google Scholar] [CrossRef]
- Basak, P. Non-darcy flow and its implications to seepage problems. J. Irrig. Drain. Div. 1977, 103, 459–473. [Google Scholar]
- Macini, P.; Mesini, E.; Viola, R. Laboratory measurements of non-darcy flow coefficients in natural and artificial unconsolidated porous media. J. Pet. Sci. Eng. 2011, 77, 365–374. [Google Scholar] [CrossRef]
- Zeng, Z.W.; Grigg, R. A criterion for non-darcy flow in porous media. Transp. Porous Media 2006, 63, 57–69. [Google Scholar] [CrossRef]
- Bear, J. Dynamics of Fluids in Porous Media; American Elsevier Pub. Co., Inc.: San Diego, CA, USA, 1972; pp. 125–127. [Google Scholar]
- Venkataraman, P.; Rao, P.R.M. Darcian, transitional, and turbulent flow through porous media. J. Hydraul. Eng. 1998, 124, 840–846. [Google Scholar] [CrossRef]
- Legrand, J. Revisited analysis of pressure drop in flow through crushed rocks. J. Hydraul. Eng. 2002, 128, 1027–1031. [Google Scholar] [CrossRef]
- Chen, Z.; Qian, J.-Z.; Luo, S.-H.; Zhan, H.-B. Experimental study of friction factor for groundwater flow in a single rough fracture. J. Hydrodyn. 2009, 21, 820–825. [Google Scholar] [CrossRef]
- Fand, R.M.; Kim, B.Y.K.; Lam, A.C.C.; Phan, R.T. Resistance to the flow of fluids through simple and complex porous media whose matrices are composed of randomly packed spheres. J. Fluids Eng 1987, 109, 268–273. [Google Scholar] [CrossRef]
- Kececioglu, I.; Jiang, Y. Flow through porous media of packed spheres saturated with water. J. Fluids Eng. 1994, 116, 164–170. [Google Scholar] [CrossRef]
- Dukhan, N.; Minjeur, C.A., II. A two-permeability approach for assessing flow properties in metal foam. J. Porous Mater. 2011, 18, 417–424. [Google Scholar] [CrossRef]
- Bagci, O.; Dukhan, N.; Ozdemir, M. Flow regimes in packed beds of spheres from pre-darcy to turbulent. Transp. Porous Media 2014, 104, 501–520. [Google Scholar] [CrossRef]
- Kundu, P.; Kumar, V.; Mishra, I.M. Experimental and numerical investigation of fluid flow hydrodynamics in porous media: Characterization of pre-darcy, darcy and non-darcy flow regimes. Powder Technol. 2016, 303, 278–291. [Google Scholar] [CrossRef]
- Zhu, T.; Ye, W. Origin of knudsen forces on heated microbeams. Phys. Rev. E 2010, 82, 036308. [Google Scholar] [CrossRef] [PubMed]
- Zhu, T.; Ye, W. Theoretical and numerical studies of noncontinuum gas-phase heat conduction in micro/nano devices. Numer. Heat Trans. Part B 2010, 57, 203–226. [Google Scholar] [CrossRef]
- Wang, S.; Feng, Q.; Han, X. A hybrid analytical/numerical model for the characterization of preferential flow path with non-darcy flow. PLoS ONE 2013, 8. [Google Scholar] [CrossRef] [PubMed]
- Fourar, M.; Radilla, G.; Lenormand, R.; Moyne, C. On the non-linear behavior of a laminar single-phase flow through two and three-dimensional porous media. Adv. Water Resour. 2004, 27, 669–677. [Google Scholar] [CrossRef]
- Skjetne, E.; Auriault, J.L. High-velocity laminar and turbulent flow in porous media. Transp. Porous Media 1999, 36, 131–147. [Google Scholar] [CrossRef]
- Tzelepis, V.; Moutsopoulos, K.N.; Papaspyros, J.N.E.; Tsihrintzis, V.A. Experimental investigation of flow behavior in smooth and rough artificial fractures. J. Hydrol. 2015, 521, 108–118. [Google Scholar] [CrossRef]
- Lage, J. The fundamental theory of flow through permeable niedia from darcy to turbulence. In Transport Phenomena in Porous Media; Elsevier Science: Amsterdam, The Netherlands, 1998; p. 1. [Google Scholar]
- Cherubini, C.; Giasi, C.I.; Pastore, N. Bench scale laboratory tests to analyze non-linear flow in fractured media. Hydrol. Earth Syst. Sci. 2012, 16, 2511–2522. [Google Scholar] [CrossRef]
- Sedghi-Asl, M.; Rahimi, H. Adoption of manning's equation to 1d non-darcy flow problems. J. Hydraul. Res. 2011, 49, 814–817. [Google Scholar] [CrossRef]
- Chaudhary, K.; Cardenas, M.B.; Deng, W.; Bennett, P.C. The role of eddies inside pores in the transition from darcy to forchheimer flows. Geophys. Res. Lett. 2011, 38. [Google Scholar] [CrossRef]
- Tsihrintzis, V.A.; Madiedo, E.E. Hydraulic resistance determination in marsh wetlands. Water Resour. Manag. 2000, 14, 285–309. [Google Scholar] [CrossRef]
- Brackbill, T.P.; Kandlikar, S.G. Application of lubrication theory and study of roughness pitch during laminar, transition, and low reynolds number turbulent flow at microscale. Heat Trans. Eng. 2010, 31, 635–645. [Google Scholar] [CrossRef]
- Falkovich, G.; Sreenivasan, K.R. Lessons from hydrodynamic turbulence. Phys. Today 2006, 59, 43. [Google Scholar] [CrossRef]
- Ruth, D.; Ma, H. On the derivation of the forchheimer equation by means of the averaging theorem. Transp. Porous Media 1992, 7, 255–264. [Google Scholar] [CrossRef]
- Irmay, S. On the theoretical derivation of darcy and forchheimer formulas. Eos Trans. Am. Geophys. Union 1958, 39, 702–707. [Google Scholar] [CrossRef]
- Chen, Z.X.; Lyons, S.L.; Qin, G. Derivation of the forchheimer law via homogenization. Trans. Porous Media 2001, 44, 325–335. [Google Scholar] [CrossRef]
- Bordier, C.; Zimmer, D. Drainage equations and non-darcian modelling in coarse porous media or geosynthetic materials. J. Hydrol. 2000, 228, 174–187. [Google Scholar] [CrossRef]
- Moutsopoulos, K.N.; Papaspyros, I.N.E.; Tsihrintzis, V.A. Experimental investigation of inertial flow processes in porous media. J. Hydrol. 2009, 374, 242–254. [Google Scholar] [CrossRef]
- Yamada, H.; Nakamura, F.; Watanabe, Y.; Murakami, M.; Nogami, T. Measuring hydraulic permeability in a streambed using the packer test. Hydrol. Process. 2005, 19, 2507–2524. [Google Scholar] [CrossRef]
Figure 1.
Schematic of the experimental setup.
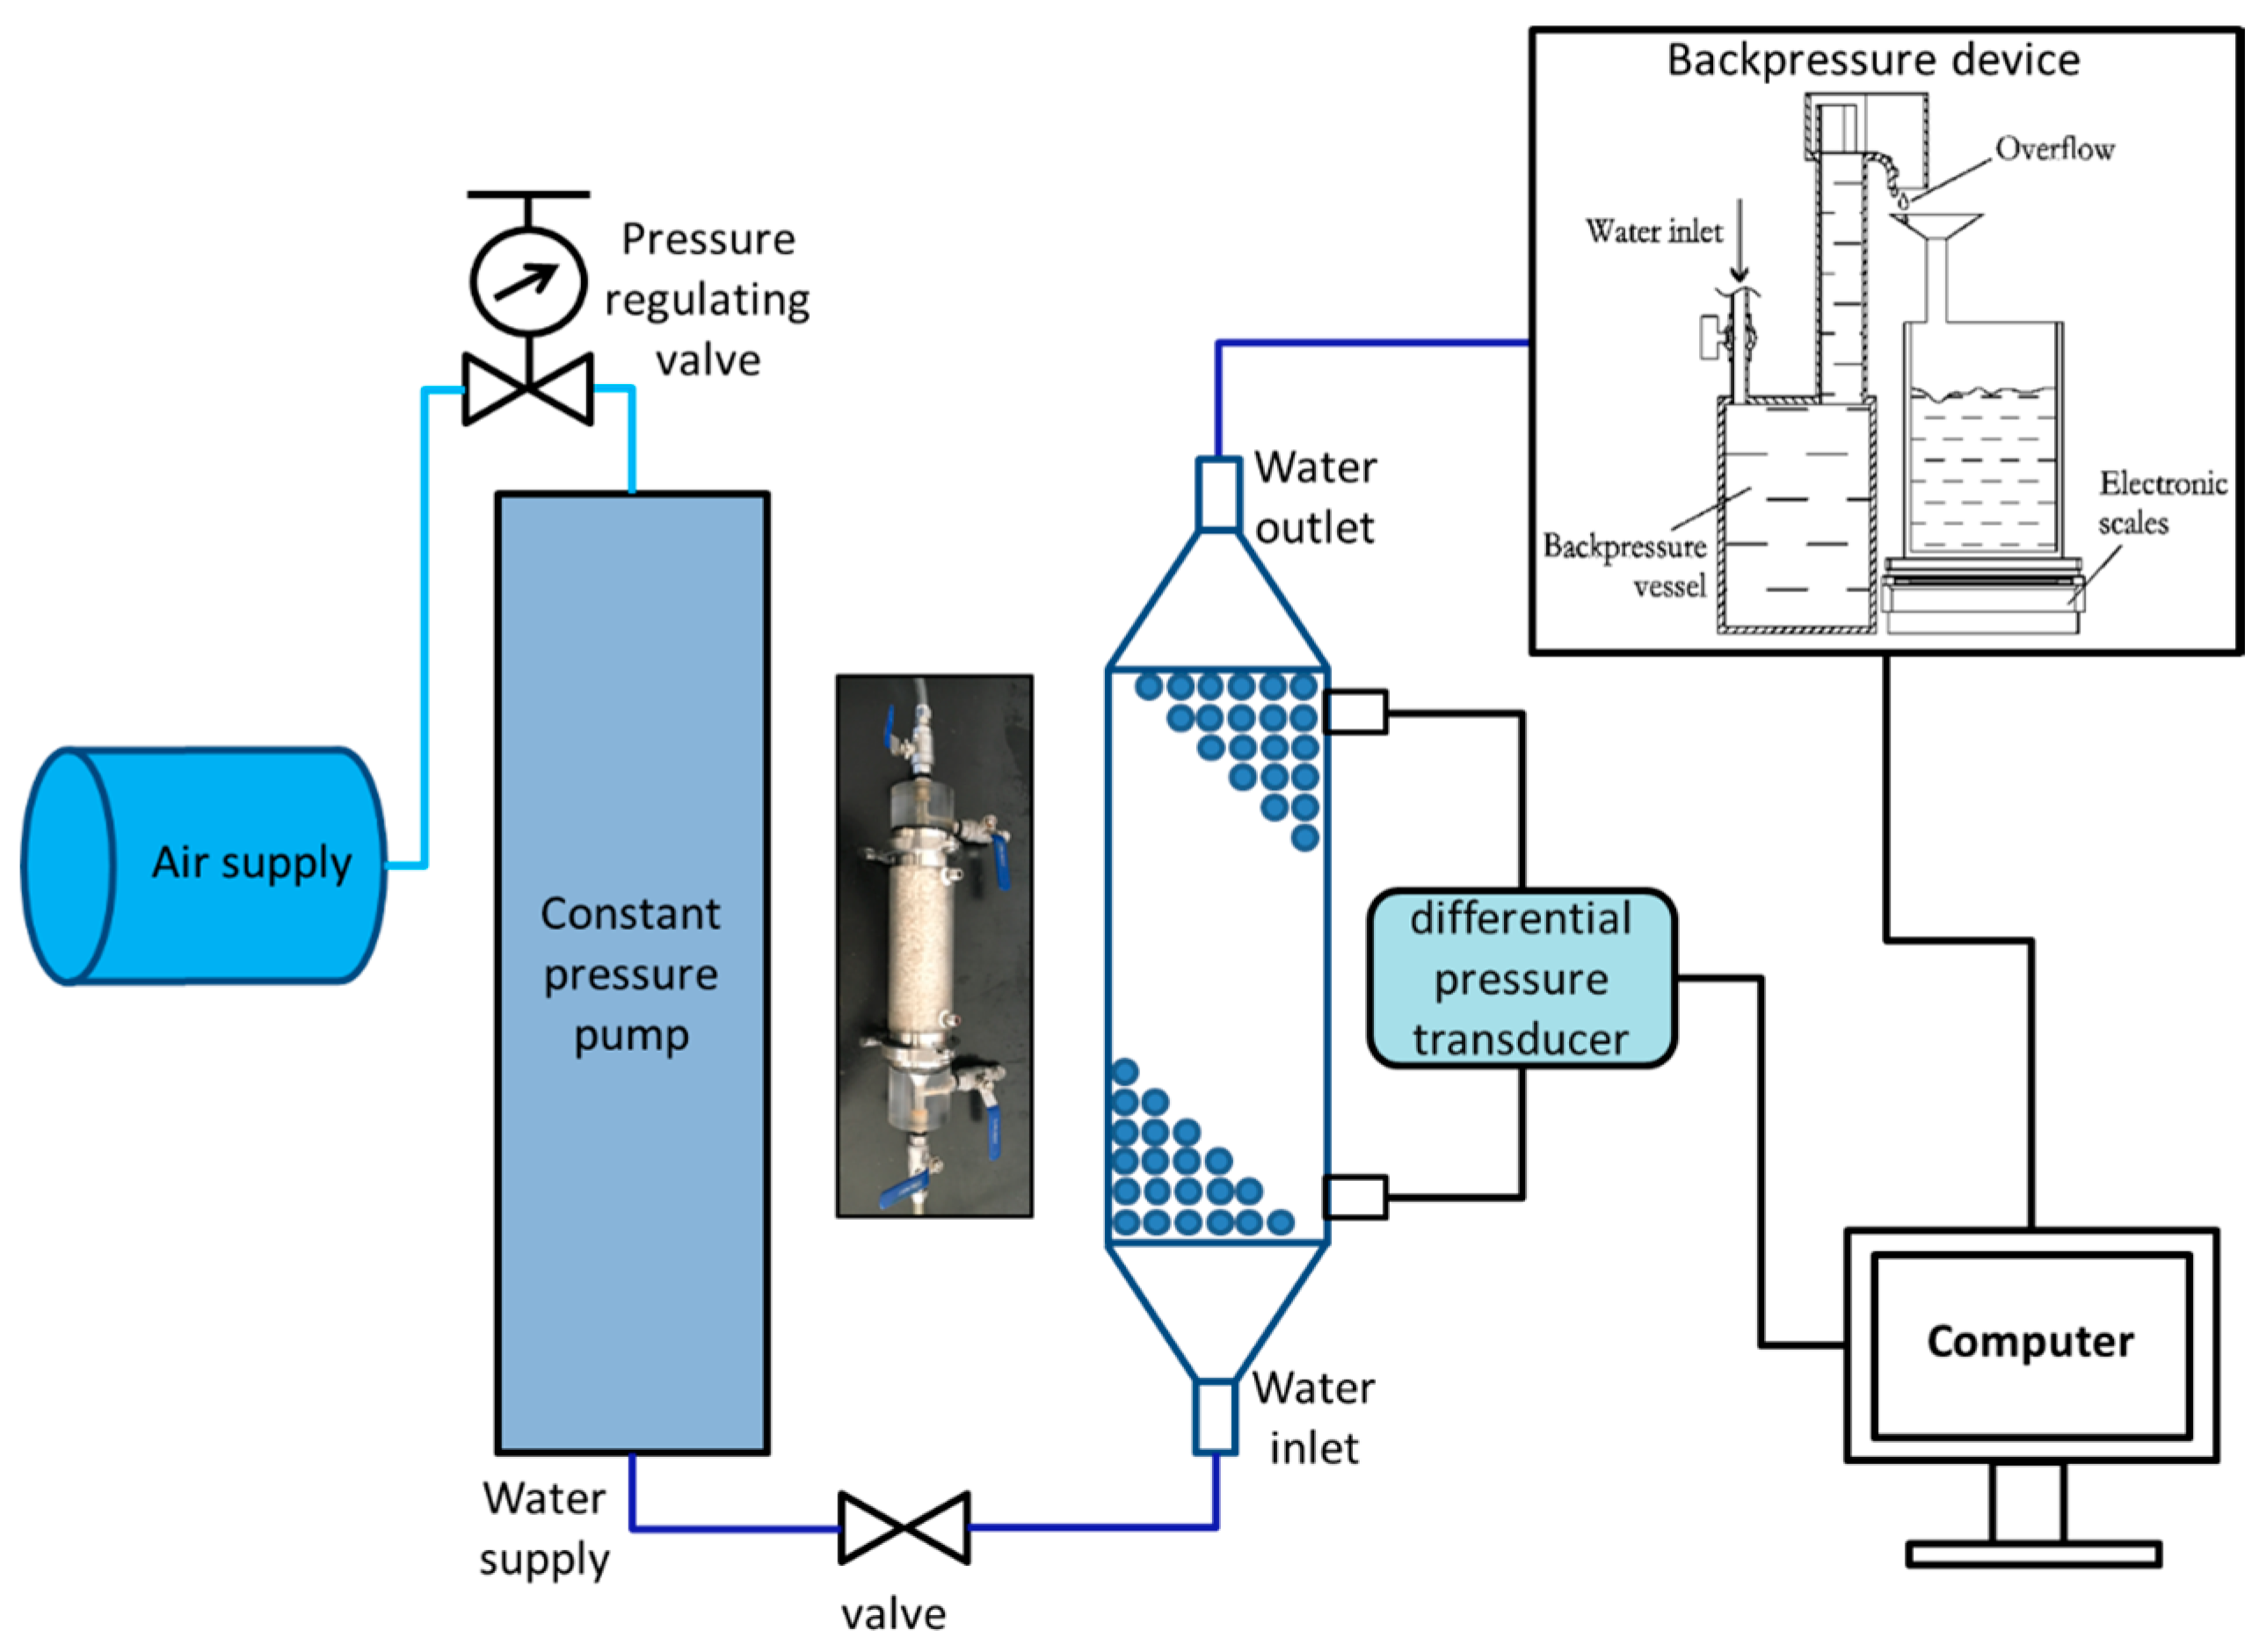
Figure 2.
Accessories and tools: (a) Mallet, (b) Cone-shape joints and (c) porous plate.

Figure 3.
Specimens (a) Wind-blown sand, (b) River sand and (c) Crushed quartz.
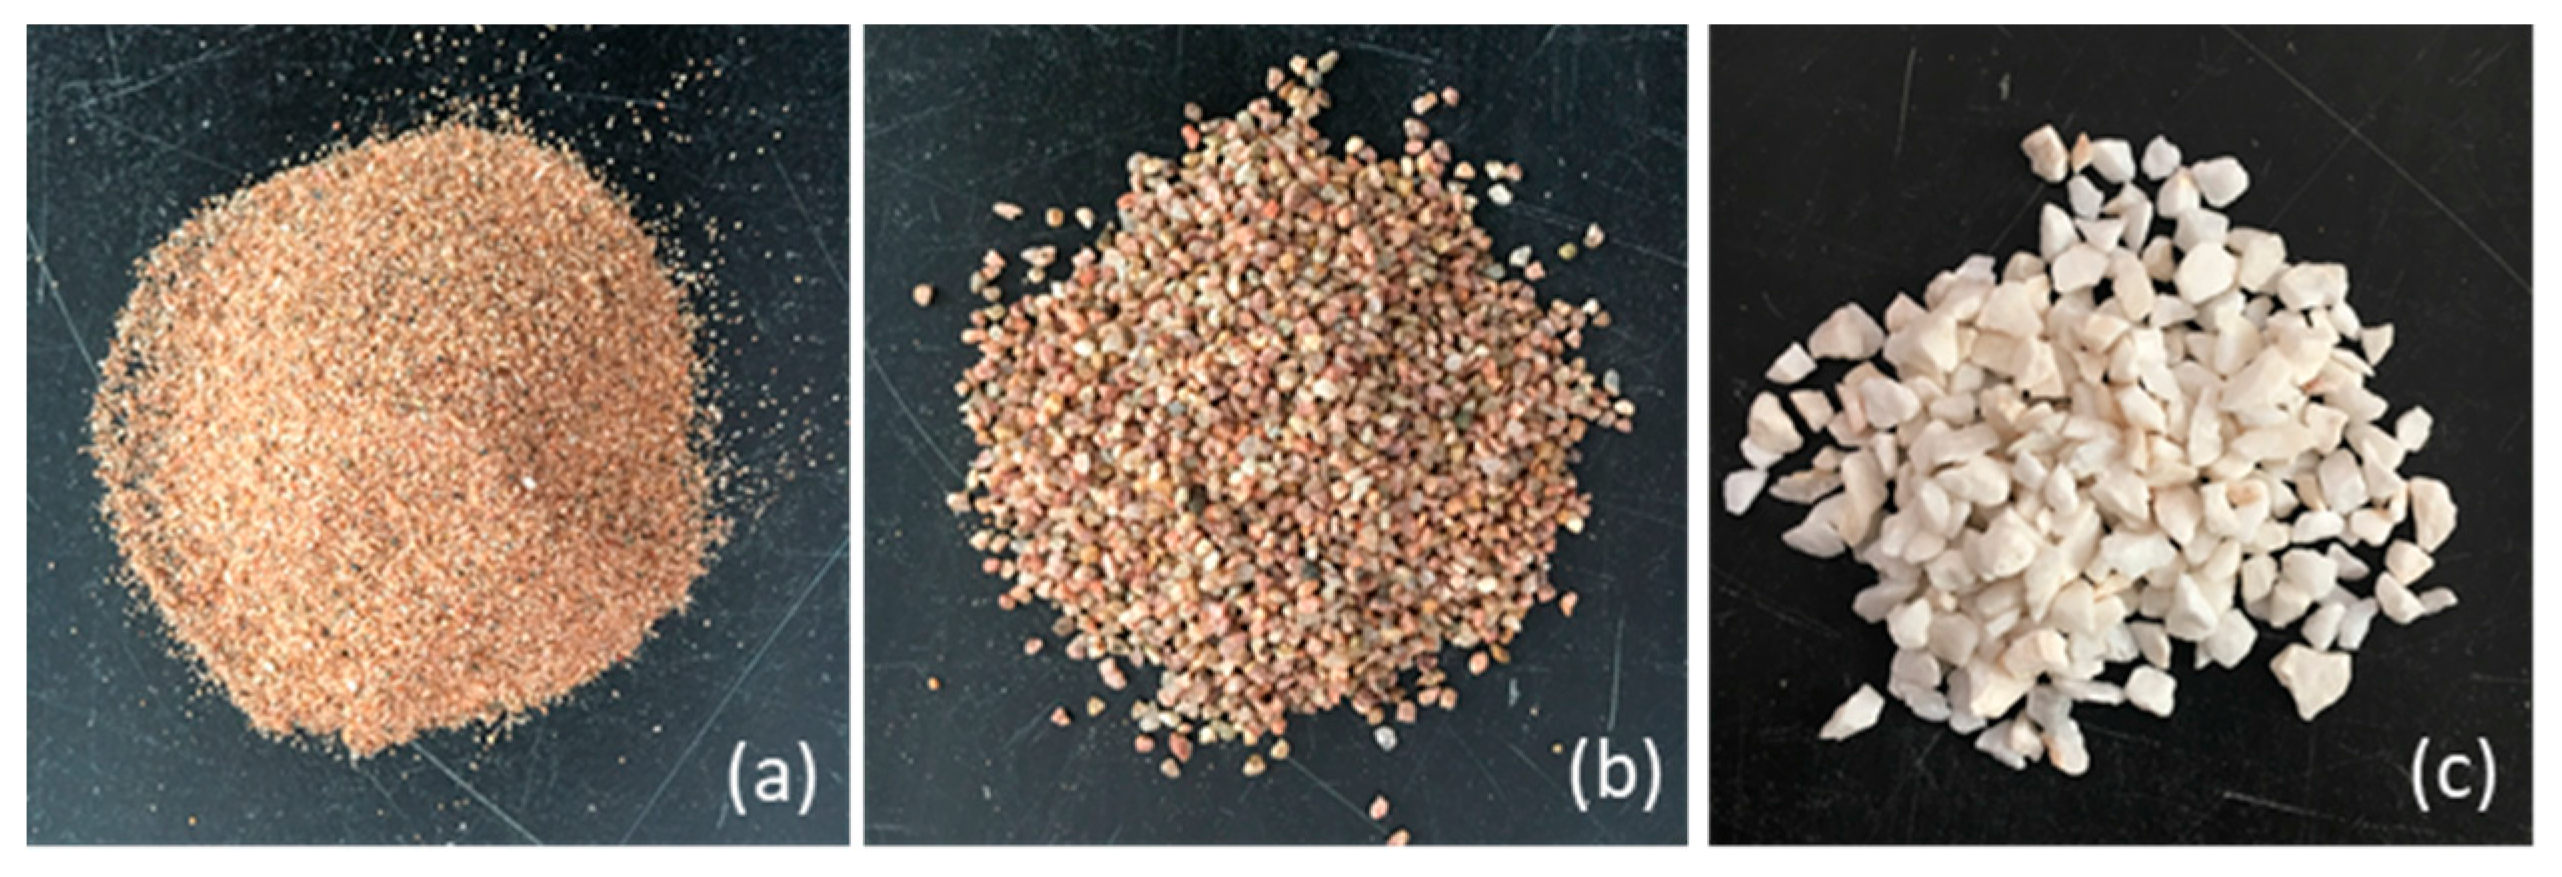
Figure 4.
Flow regime recognition based on curves of reduce pressure drop plotted against the superficial velocity: (a) 0–0.075 mm; (b) 0.075–0.15 mm; (c) 0.15–0.3 mm; (d) 0.3–0.6 mm; (e) 0.6–1.0 mm; (f) 1–2 mm; (g) 2–2.36 mm; (h) 2.36–4.75 mm; and (i) 4.75–9.5 mm.
Figure 4.
Flow regime recognition based on curves of reduce pressure drop plotted against the superficial velocity: (a) 0–0.075 mm; (b) 0.075–0.15 mm; (c) 0.15–0.3 mm; (d) 0.3–0.6 mm; (e) 0.6–1.0 mm; (f) 1–2 mm; (g) 2–2.36 mm; (h) 2.36–4.75 mm; and (i) 4.75–9.5 mm.
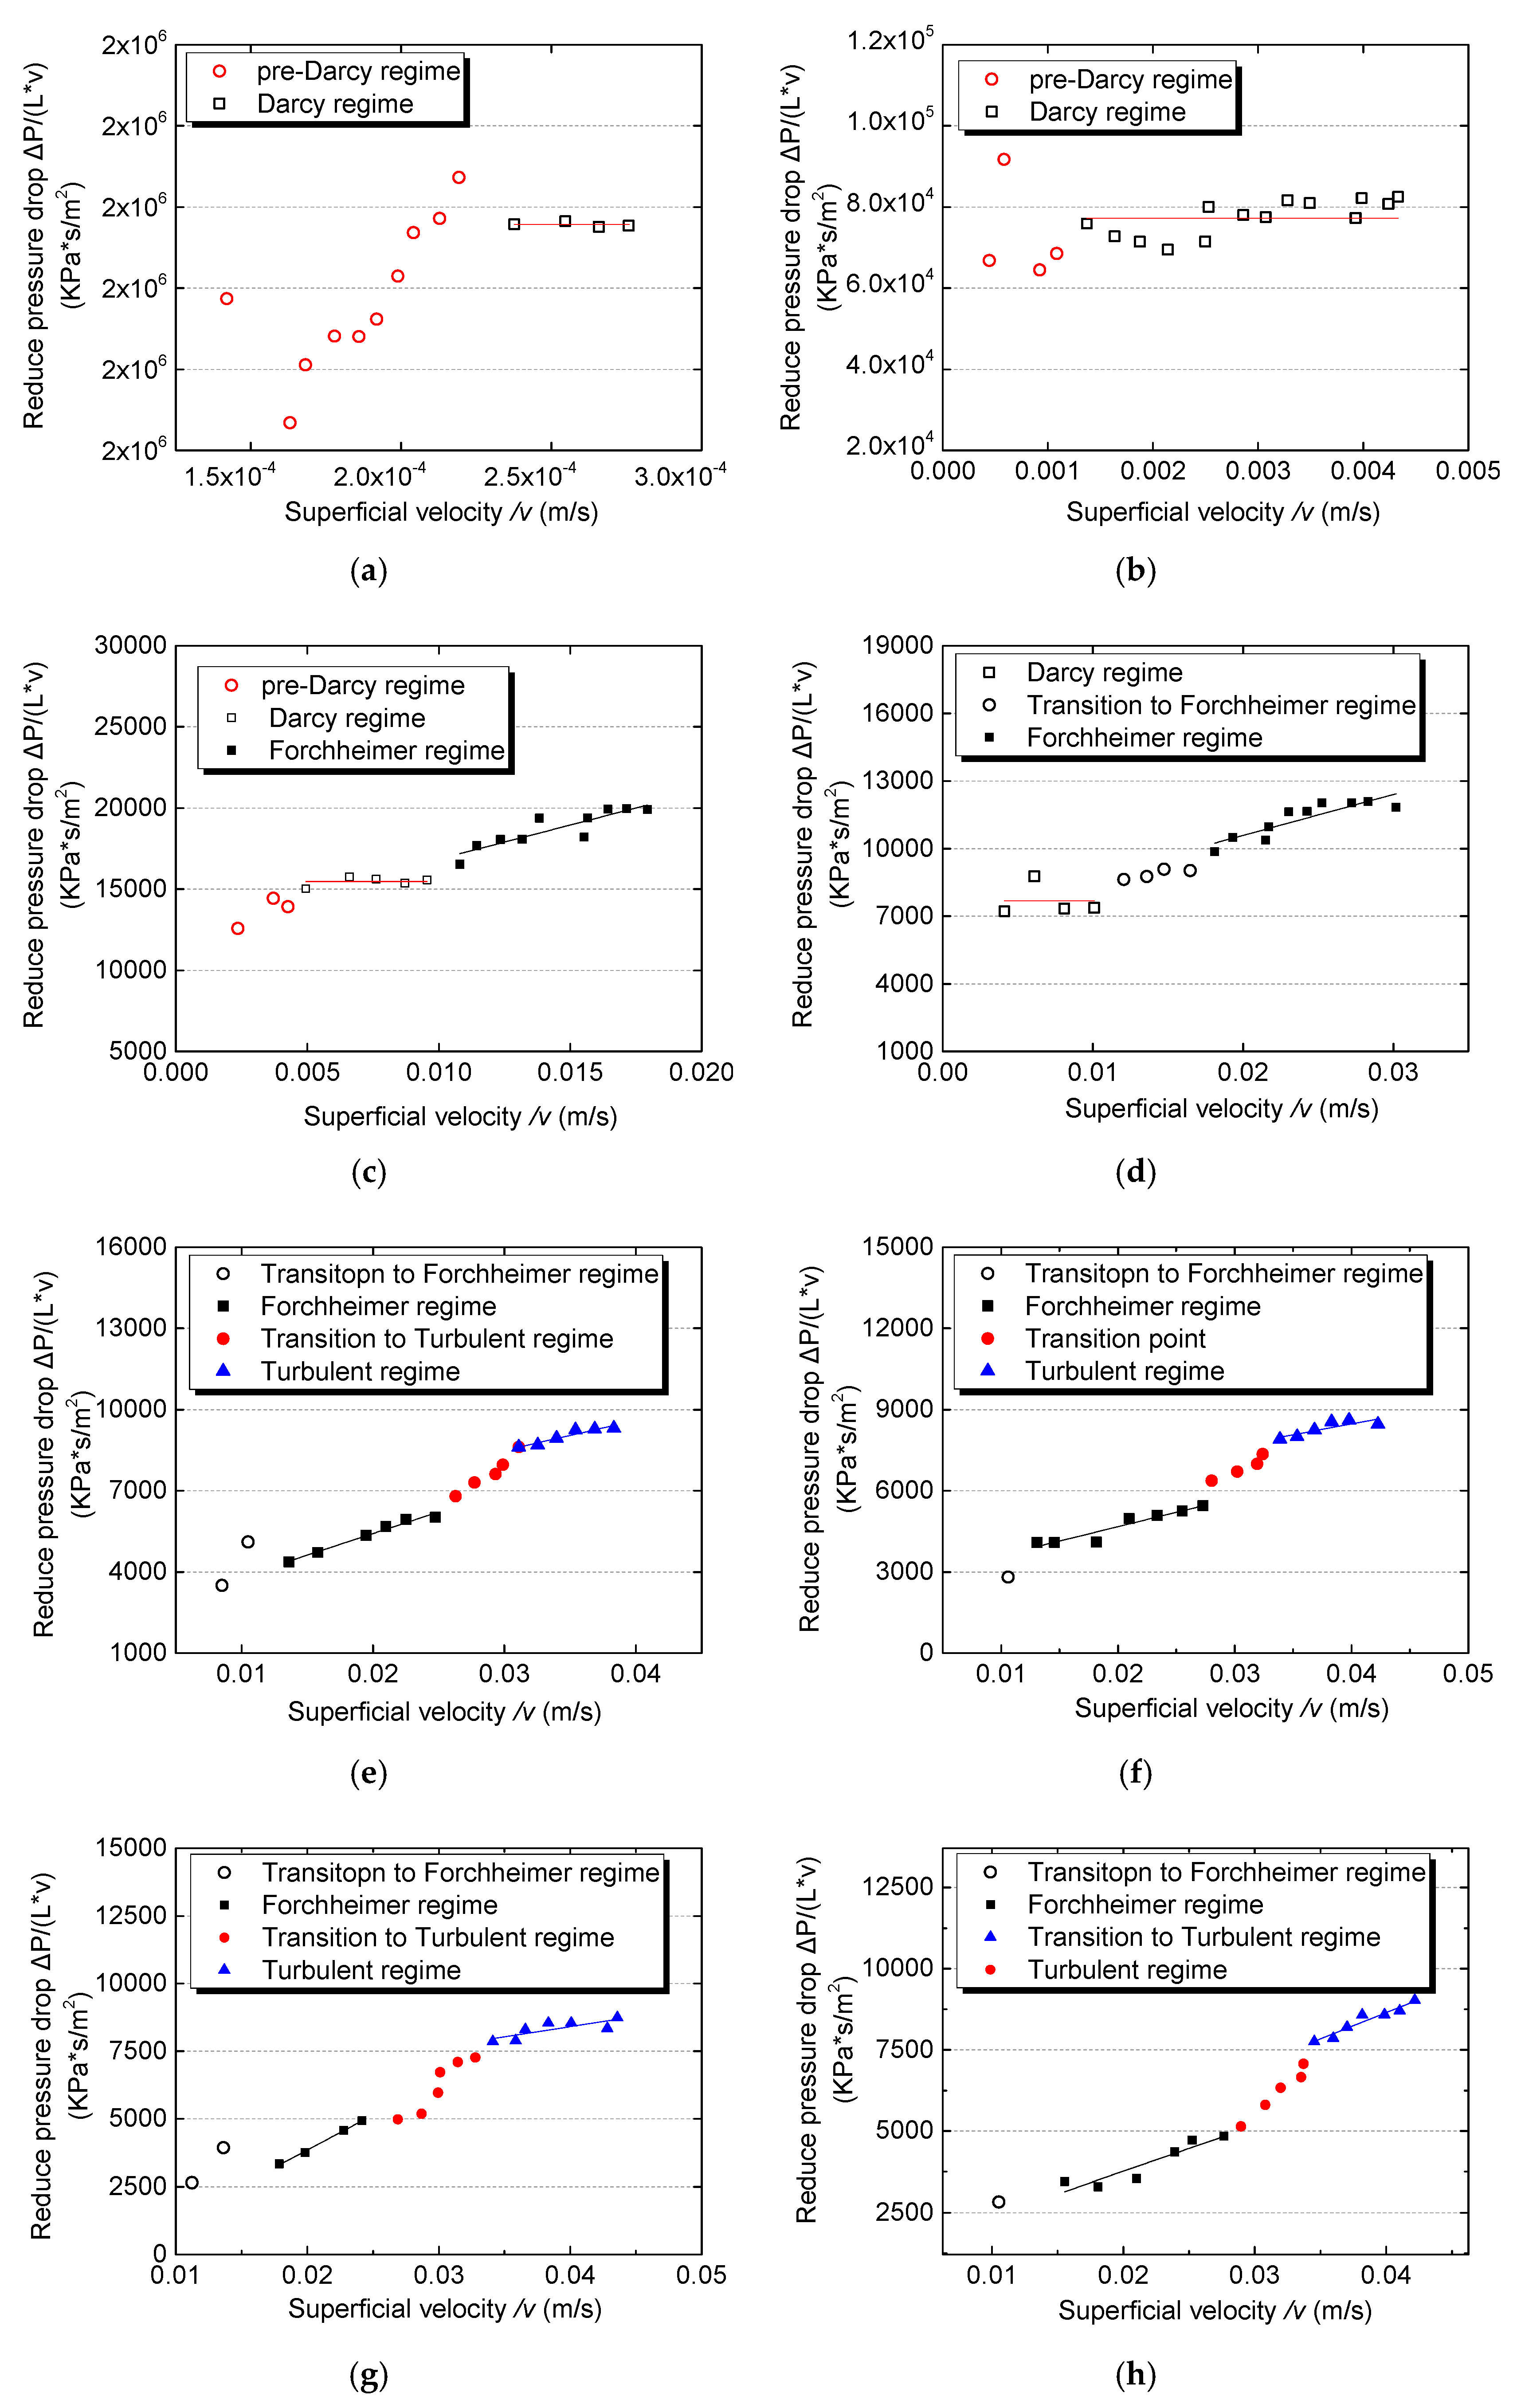

Figure 5.
Comparison of computed and experimental permeability k values.
Figure 6.
Comparison of computed and experimental inertia factor β values.

Figure 7.
Relationship between mean particle diameter square and permeability.

Figure 8.
Relationship between mean particle diameter reciprocal and inertial factor.

Figure 9.
Relationship between Reynolds number based on particle diameter and friction factor.
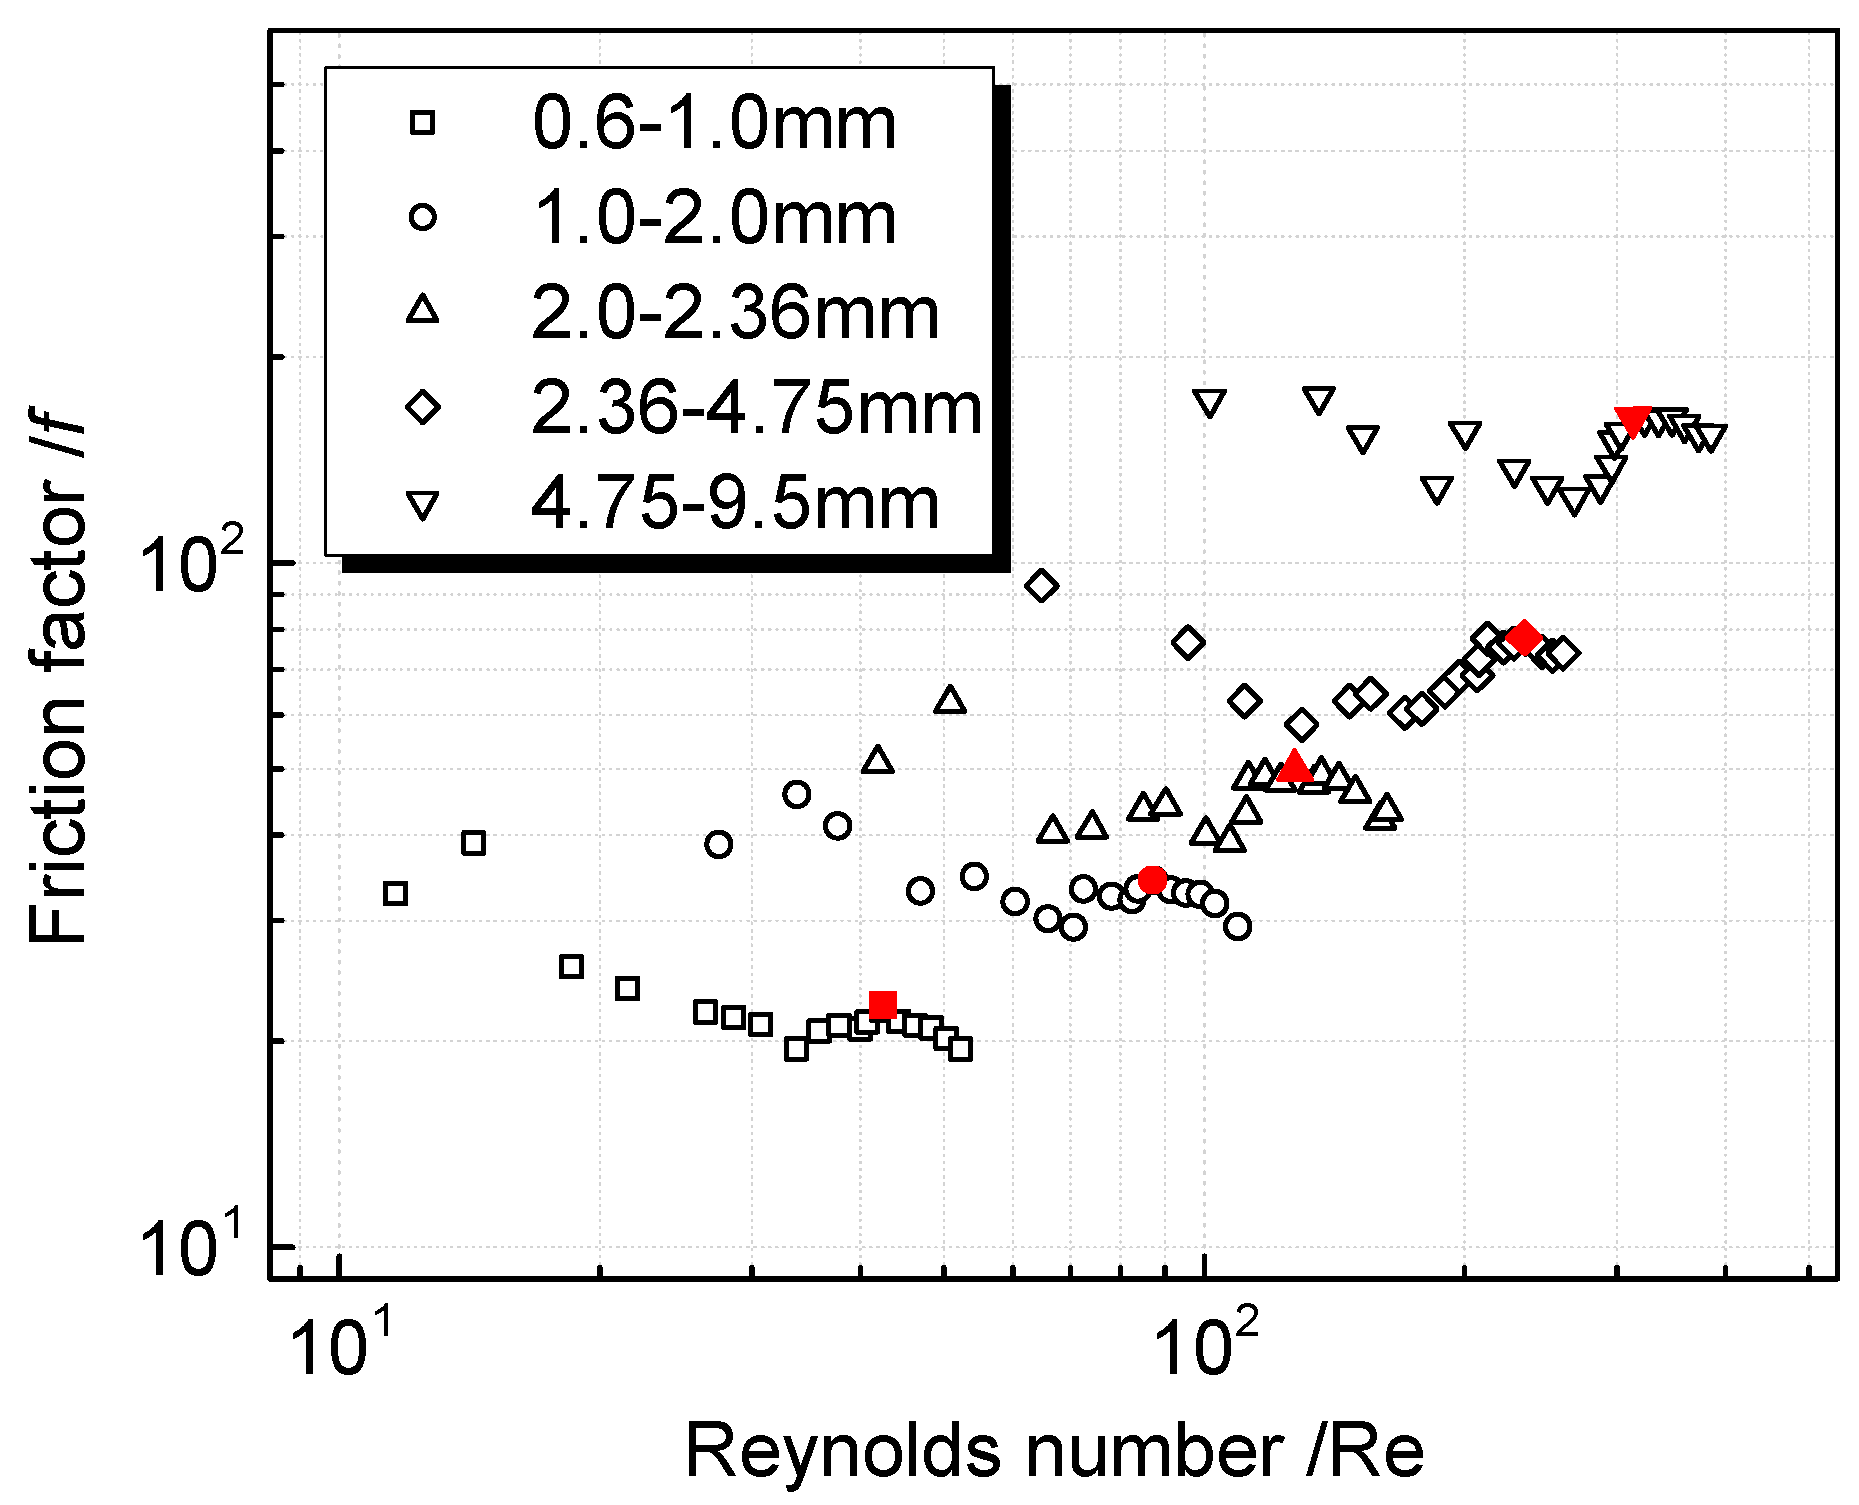
Figure 10.
Relationships between hydraulic gradient and superficial velocity: (a) 0–0.075 mm; (b) 0.075–0.15 mm; (c) 0.15–0.3 mm; (d) 0.3–0.6 mm; (e) 0.6–1.0 mm; (f) 1–2 mm; (g) 2–2.36 mm; (h) 2.36–4.75 mm; and (i) 4.75–9.5 mm.
Figure 10.
Relationships between hydraulic gradient and superficial velocity: (a) 0–0.075 mm; (b) 0.075–0.15 mm; (c) 0.15–0.3 mm; (d) 0.3–0.6 mm; (e) 0.6–1.0 mm; (f) 1–2 mm; (g) 2–2.36 mm; (h) 2.36–4.75 mm; and (i) 4.75–9.5 mm.
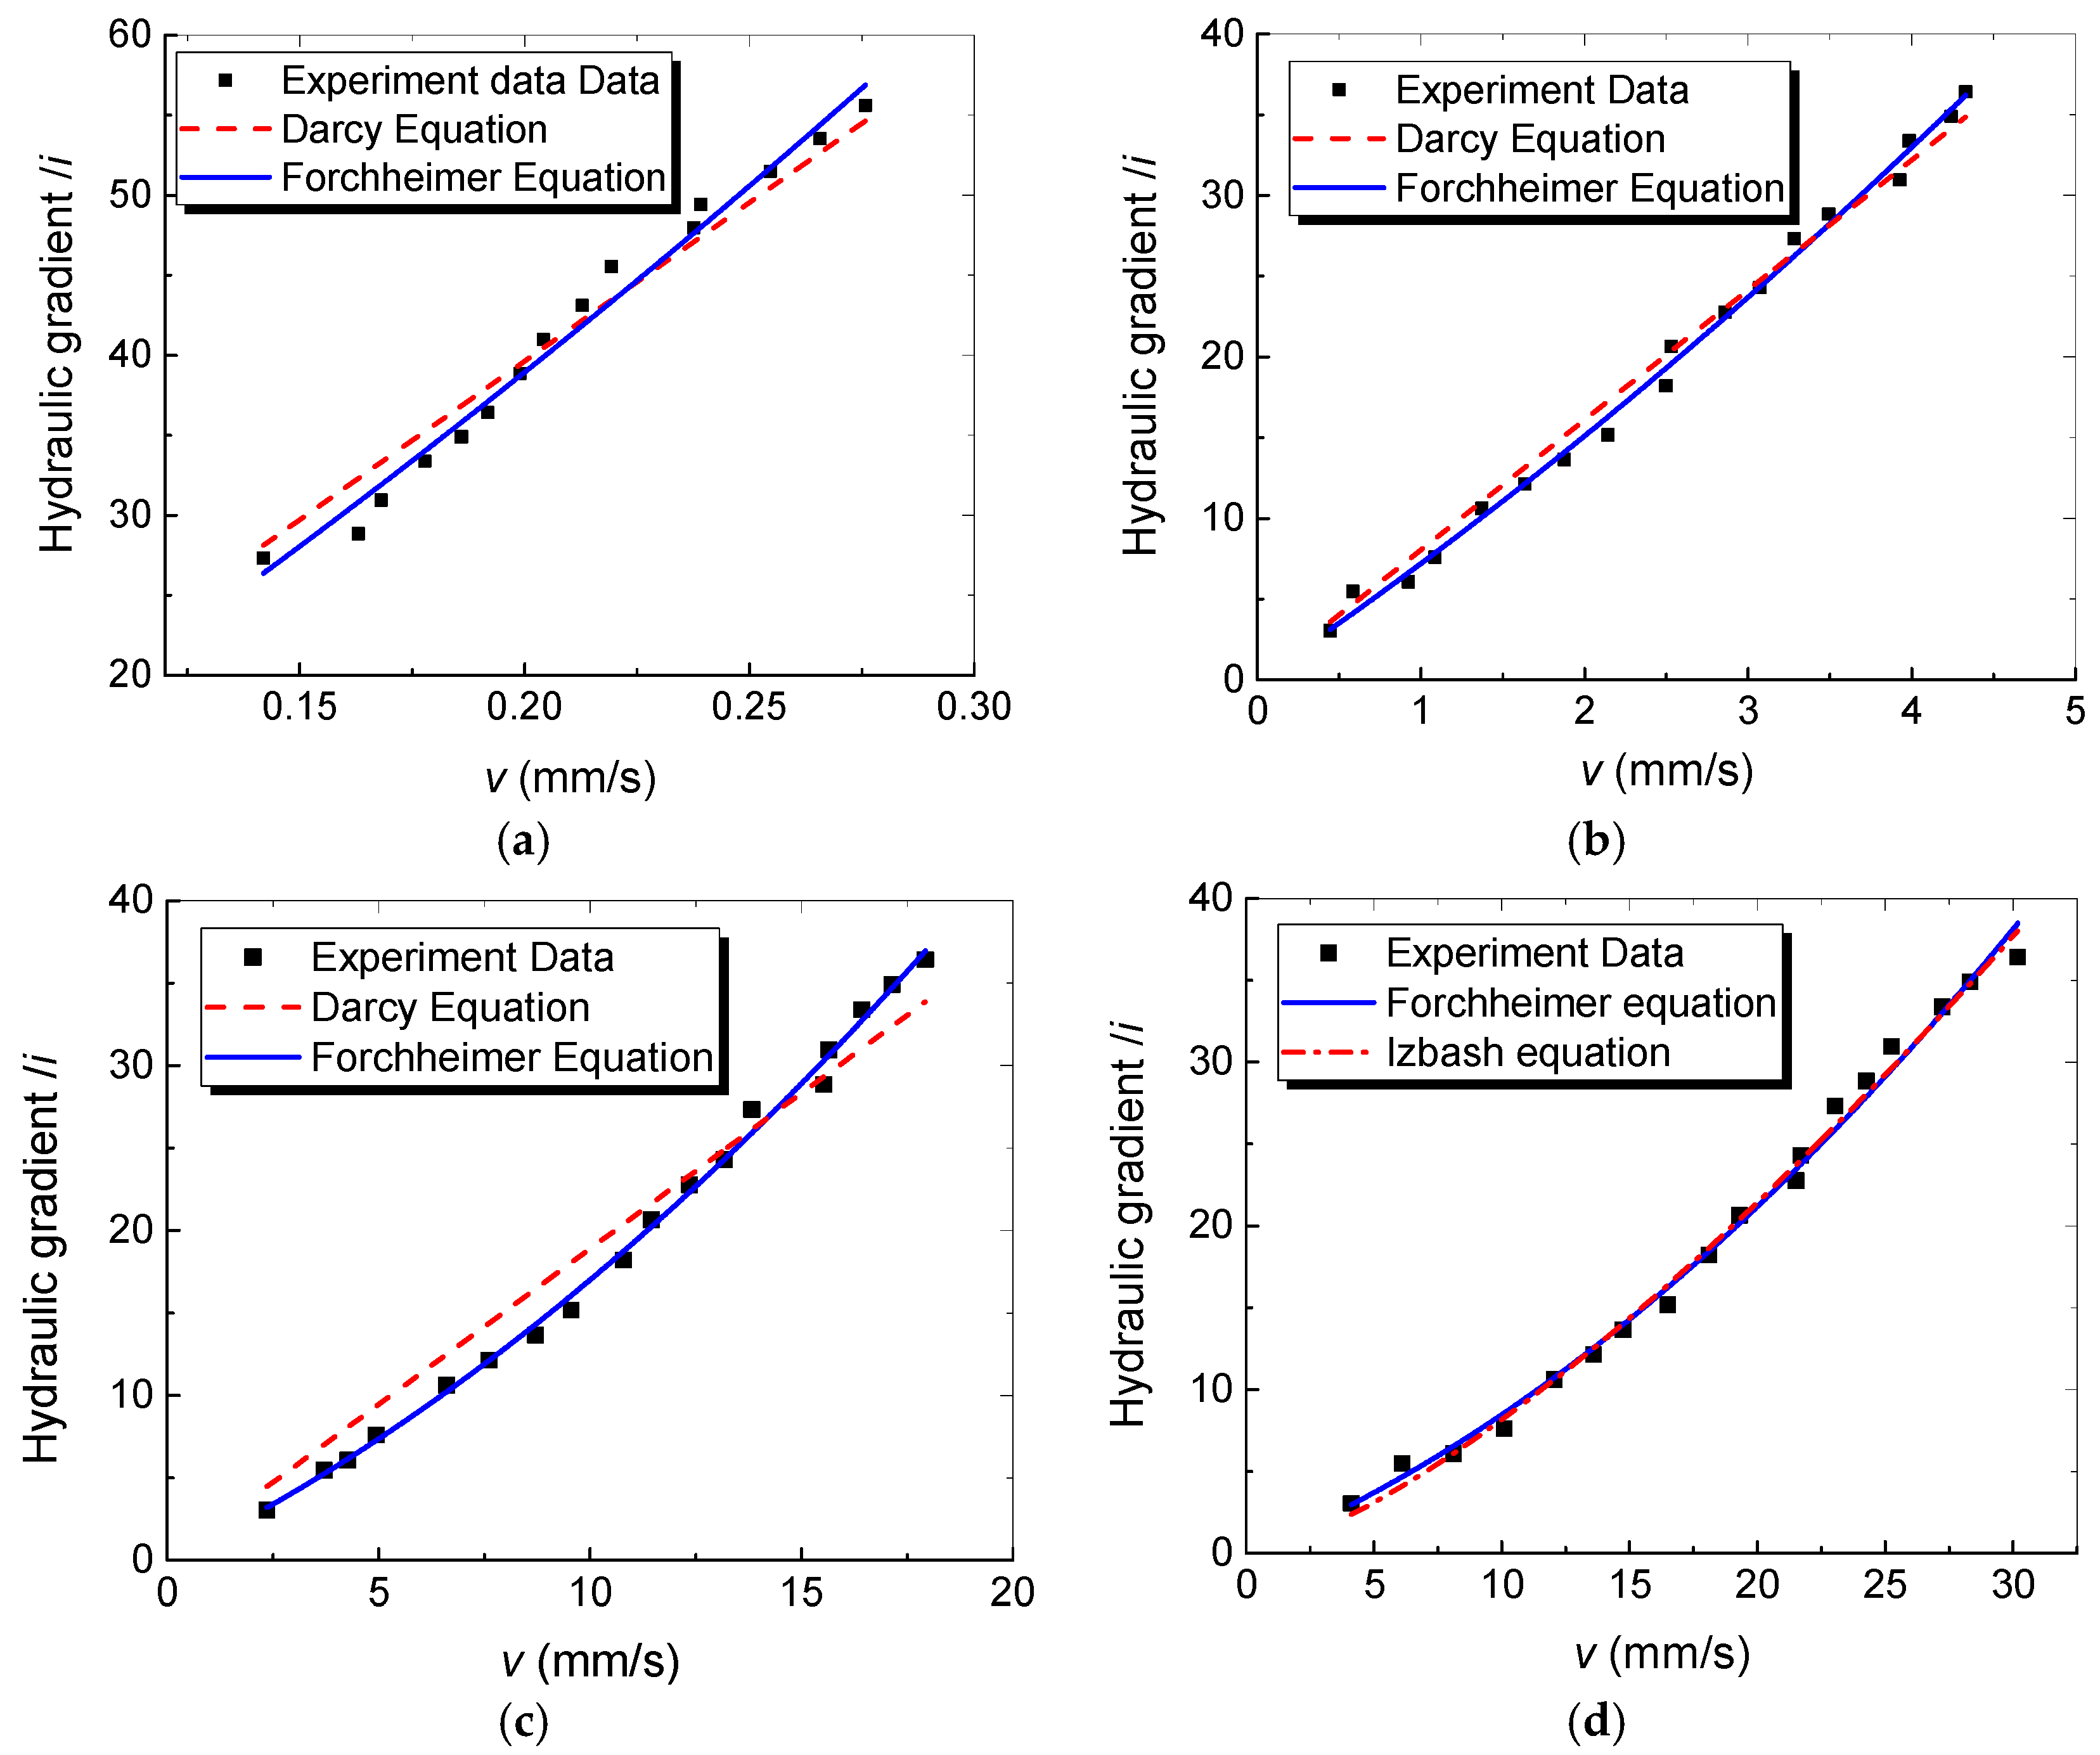

Figure 11.
Division of flow fields based on critical superficial velocity versus particle diameter.
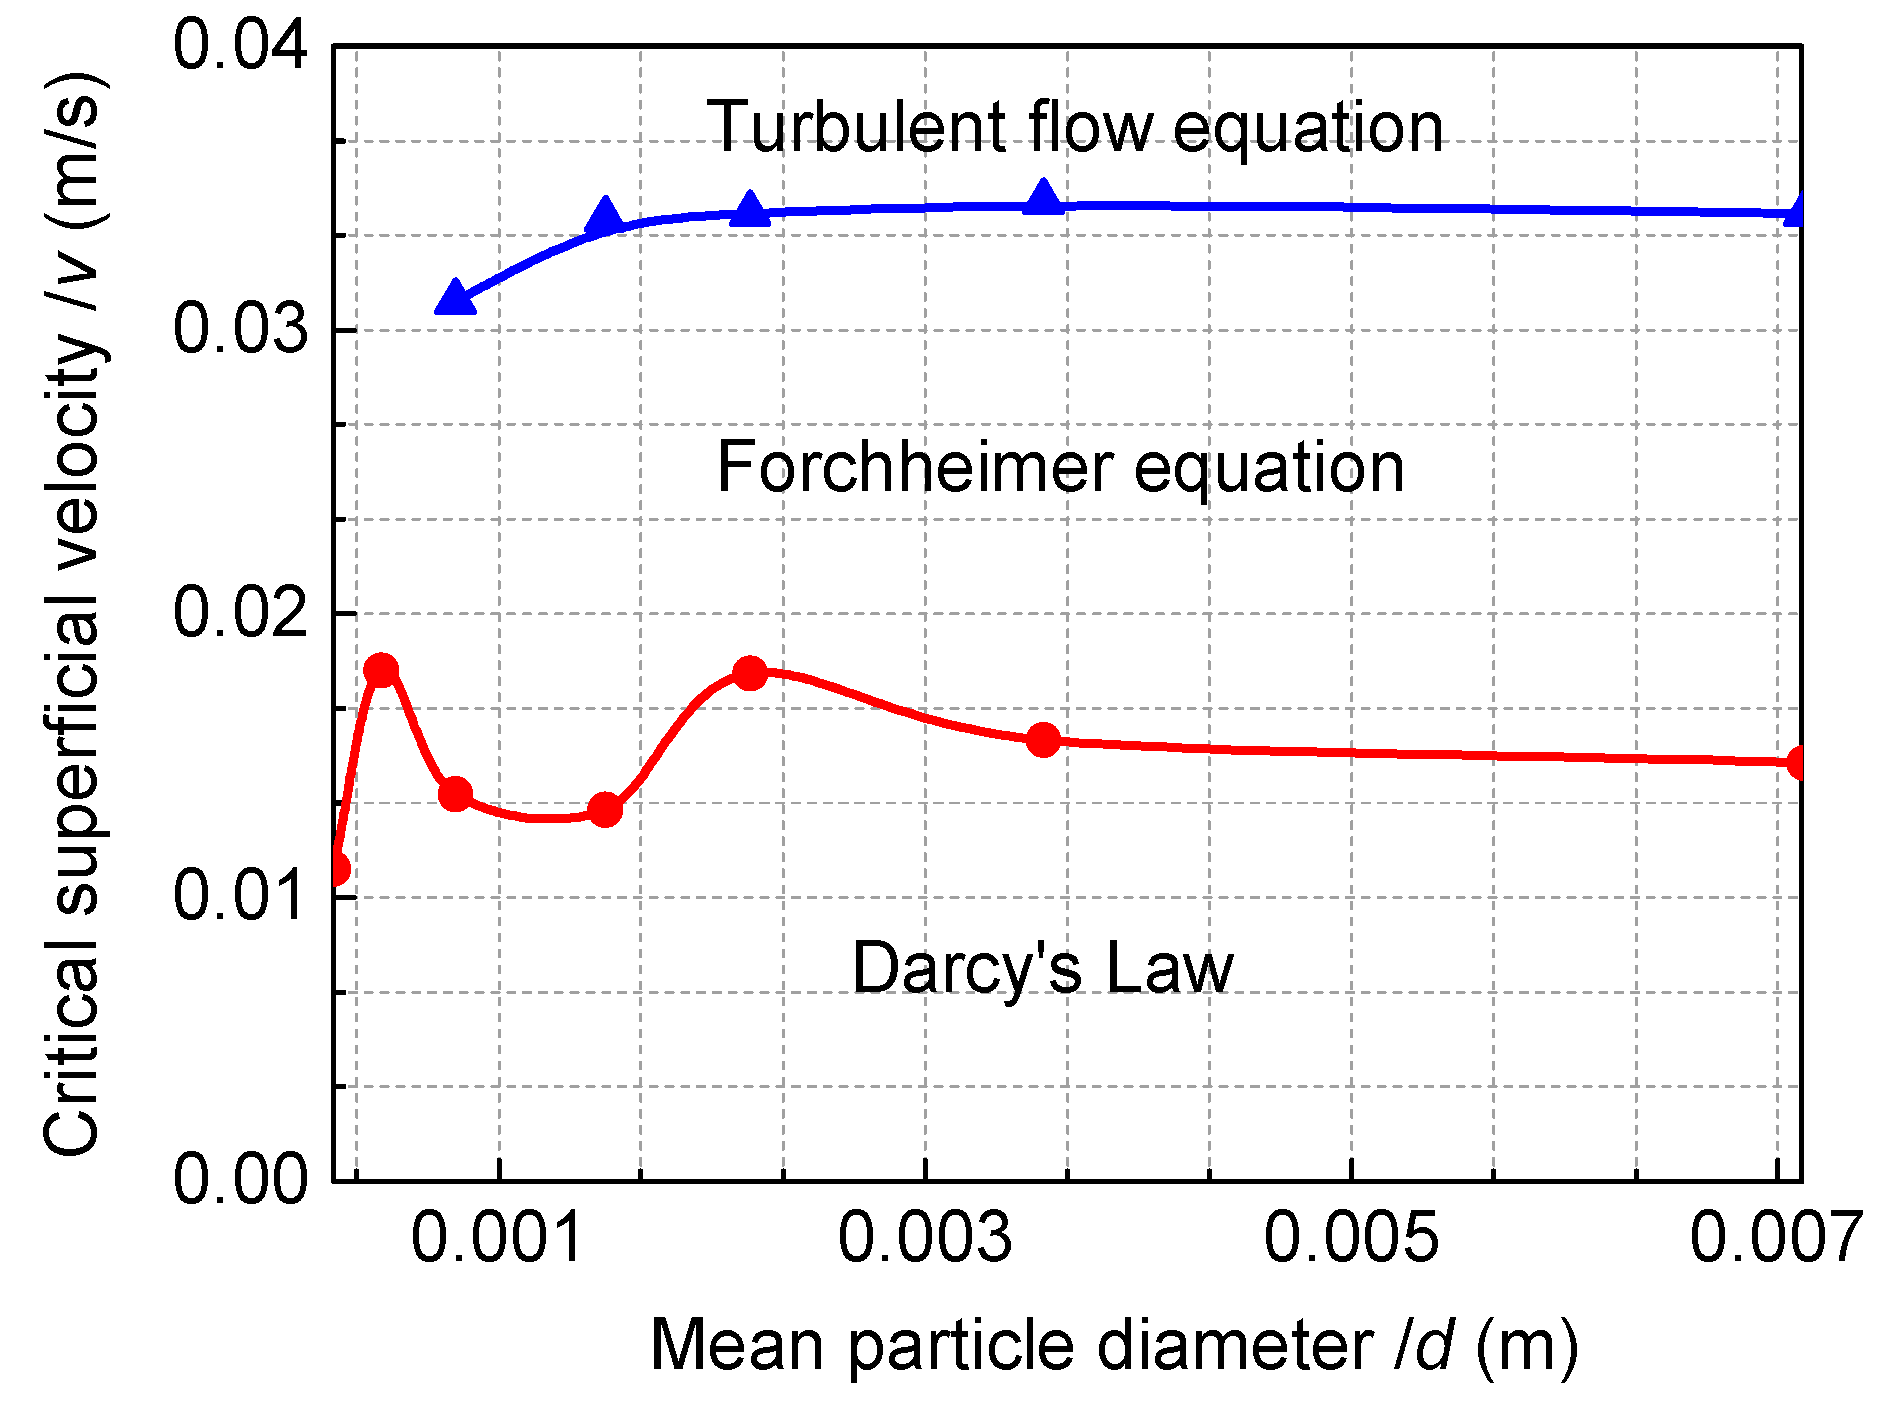
Figure 12.
Division of flow fields based on critical pressure drop against particle diameter.

Table 1.
Material properties.
| Material | Particle Packed Column | Particle Diameter Range (d/mm) | Mean Particle Diameter (mm) | Density (kg/m3) | Fractional Void Volume of Packing Column (%) |
|---|---|---|---|---|---|
| Wind-blown sand | a | 0–0.075 | 0.0375 | 2620 | 35.19 |
| b | 0.075–0.15 | 0.1125 | 2620 | 35.33 | |
| c | 0.15–0.3 | 0.225 | 2620 | 35.56 | |
| d | 0.3–0.6 | 0.45 | 2620 | 35.94 | |
| River sand | e | 0.6–1.0 | 0.8 | 2650 | 44.78 |
| f | 1.0–2.0 | 1.5 | 2650 | 44.28 | |
| g | 2.0–2.36 | 2.18 | 2650 | 44.58 | |
| Crushed quartz | h | 2.36–4.75 | 3.555 | 2820 | 45.06 |
| i | 4.75–9.5 | 7.125 | 2820 | 44.63 |
Table 2.
Onset of Darcy/Forchheimer/turbulent flow experimental data points.
| Particle Packed Column | Onset of Darcy Flow | Onset of Forchheimer Flow | Onset of Turbulent Flow | ||||||||||||
|---|---|---|---|---|---|---|---|---|---|---|---|---|---|---|---|
| Pressure Drop/ΔP (MPa) | Superficial Velocity/v (m/s) | Reynolds Number/Re | Forchheimer Number/Fo | Friction Factor/f | Pressure Drop/ΔP (MPa) | Superficial Velocity/v (m/s) | Reynolds Number/Re | Forchheimer Number/Fo | Friction Factor/f | Pressure Drop/ΔP (MPa) | Superficial Velocity/v (m/s) | Reynolds Number/Re | Forchheimer Number/Fo | Friction Factor/f | |
| a | 0.0814 | 2.39 × 10⁻⁴ | 0.019 | 0 | 196,653.2 | - | - | - | - | - | - | - | - | - | |
| b | 0.0175 | 0.00137 | 0.33 | 0.092 | 387.89 | - | - | - | - | - | - | - | - | - | |
| c | 0.0125 | 0.00495 | 2.39 | 0.18 | 43.22 | 0.03 | 0.011 | 5.22 | 0.39 | 21.78 | - | - | - | - | |
| d | - | - | - | - | - | 0.03 | 0.018 | 17.31 | 0.41 | 15.83 | - | - | - | - | |
| e | - | - | - | - | - | 0.01 | 0.0136 | 18.58 | 0.38 | 19.50 | 0.045 | 0.0310 | 42.39 | 0.87 | 22.23 |
| f | - | - | - | - | - | 0.009 | 0.0131 | 33.86 | 0.42 | 29.36 | 0.045 | 0.0339 | 87.59 | 1.09 | 34.33 |
| g | - | - | - | - | - | 0.01 | 0.0179 | 66.73 | 0.58 | 44.19 | 0.045 | 0.0341 | 127.32 | 1.10 | 49.87 |
| h | - | - | - | - | - | 0.009 | 0.0155 | 95.72 | 0.61 | 60.41 | 0.045 | 0.0345 | 212.64 | 1.36 | 77.54 |
| i | - | - | - | - | - | 0.009 | 0.0147 | 179.68 | 0.92 | 124.57 | 0.045 | 0.0341 | 322.55 | 2.13 | 163.12 |
Table 3.
Formulas for the estimation of permeability and inertial factor.
| Permeability k (m2) | Inertial Factory β (m−1) | |
|---|---|---|
| Ergun (1952) | ||
| Ward (1964) | ||
| Irmay (1964) | ||
| Kovács (1981) | ||
| Fand and Thinakaram (1990) | ||
| Kadlec and Knight (1996) |
Table 4.
Fitting result of discount effect for permeability and additive effect for inertia factor.
| Data Source | Medium Character | m | n |
|---|---|---|---|
| Huang et al. (2013) | Cubic arrays of smooth sphere | 1 | 1 |
| Sedghi-Asl et al. (2014) | Random arrays rounded aggregates | 0.631 | 1.02 |
| Our research | Random arrays sand and crushed stone | 0.076 | 2.49 |
Table 5.
Fitting results with the experimental data.
| Sample Number | Darcy’s Law i = Kv (Equation (5)) | Forchheimer Equation i = Av + Bv2 (Equation (6)) | Power law i = λvm (Equation (7)) | |||
|---|---|---|---|---|---|---|
| a | i = 198.152v | R2 = 0.999 | i = 164.182v+152.506v2 | R2 = 0.983 | — | — |
| b | i = 8.05v | R2 = 0.998 | i = 6.86v+0.346v2 | R2 = 0.995 | — | — |
| c | i = 1.889v | R2 = 0.993 | i = 1.246v+0.045v2 | R2 = 0.996 | — | — |
| d | — | — | i = 0.5694v+0.0247v2 | R2 = 0.988 | i = 0.27v1.462 | R2 = 0.987 |
| e | — | — | i = 0.0966v+0.0236v2 | R2 = 0.993 | i = 0.040v1.884 | R2 = 0.992 |
| f | — | — | i = 0.0703v+0.0204v2 | R2 = 0.991 | i = 0.0321v1.899 | R2 = 0.991 |
| g | — | — | i = 0.0182v+0.0210v2 | R2 = 0.980 | i = 0.0253v1.955 | R2 = 0.980 |
| h | — | — | i = 1 × 10⁻⁵v+0.0216v2 | R2 = 0.980 | i = 0.0214v2 | R2 = 0.981 |
| i | — | — | i = 1 × 10⁻⁵v+0.0222v2 | R2 = 0.977 | i = 0.0221v2 | R2 = 0.978 |
© 2017 by the authors. Licensee MDPI, Basel, Switzerland. This article is an open access article distributed under the terms and conditions of the Creative Commons Attribution (CC BY) license (http://creativecommons.org/licenses/by/4.0/).
Share and Cite
MDPI and ACS Style
Yang, X.; Yang, T.; Xu, Z.; Yang, B. Experimental Investigation of Flow Domain Division in Beds Packed with Different Sized Particles. Energies 2017, 10, 1401. https://doi.org/10.3390/en10091401
AMA Style
Yang X, Yang T, Xu Z, Yang B. Experimental Investigation of Flow Domain Division in Beds Packed with Different Sized Particles. Energies. 2017; 10(9):1401. https://doi.org/10.3390/en10091401
Chicago/Turabian StyleYang, Xin, Tianhong Yang, Zenghe Xu, and Bin Yang. 2017. "Experimental Investigation of Flow Domain Division in Beds Packed with Different Sized Particles" Energies 10, no. 9: 1401. https://doi.org/10.3390/en10091401
Note that from the first issue of 2016, this journal uses article numbers instead of page numbers. See further details here.